the Creative Commons Attribution 4.0 License.
the Creative Commons Attribution 4.0 License.
 | 27 Jun 2024
Future reduction of cold extremes over East Asia due to thermodynamic and dynamic warming
Donghuan Li
Tianjun Zhou
Youcun Qi
Liwei Zou
Wenxia Zhang
Xiaolong Chen
Cold extremes have large impacts on human society. Understanding the physical processes dominating the changes in cold extremes is crucial for a reliable projection of future climate change. The observed cold extremes have decreased during the last several decades, and this trend will continue under future global warming. Here, we quantitatively identify the contributions of dynamic (changes in large-scale atmospheric circulation) and thermodynamic (rising temperatures resulting from global warming) effects to East Asian cold extremes in the past several decades and in a future warm climate by using two sets of large-ensemble simulations of climate models. We show that the dynamic component accounts for over 80 % of the cold-month (coldest 5 % boreal winter months) surface air temperature (SAT) anomaly over the past 5 decades. However, in a future warm climate, the thermodynamic change is the main contributor to the decreases in the intensity and occurrence probability of East Asian cold extremes, while the dynamic change is also contributive. The intensity of East Asian cold extremes will decrease by around 5 °C at the end of the 21st century, in which the thermodynamic (dynamic) change contributes approximately 75 % (25 %). The present-day (1986–2005) East Asian cold extremes will almost never occur after around 2035, and this will happen 10 years later due solely to thermodynamic change. The upward trend of a positive Arctic Oscillation-like sea level pressure pattern dominates the changes in the dynamic component. The finding provides a useful reference for policymakers in climate change adaptation activities.
- Article
(9162 KB) - Full-text XML
- BibTeX
- EndNote


Extreme events are widely concerning because of their high destructive power and great social impacts. Cold extremes have great impacts on agriculture, transportation, and people's health, and can even cripple power supplies and lead to rolling blackouts (Steponkus, 1979; Andreescu and Frost, 1998; Sheridan and Allen, 2015; Thornton et al., 2016). The global mean surface air temperature (SAT) has been increasing in the past century due to the increase in anthropogenic greenhouse gas concentration in the atmosphere (Jones et al., 2008; IPCC, 2021). While warm extremes continue to attract considerable attention from the scientific community and ordinary people (e.g. Alexander et al., 2006; Rahimzadeh et al., 2009; Donat and Alexander, 2012; Sun et al., 2014; Ma et al., 2017b), the cold extremes have also gained wide attention (e.g. Overland et al., 2011; Mori et al., 2014; Li et al., 2015; McCusker et al., 2016; Sun et al., 2016; Trenary et al., 2016; Ma et al., 2018; Qian et al., 2018) due to the mid-latitude cold extremes that happened in recent years.
A strong cold surge related to the negative phase of the Arctic Oscillation (AO) and intensified Siberian High attacked northern China during 6–8 January 2021 (Wang et al., 2021). The temperatures reached or broke the records in more than 50 cities and counties. Beijing experienced the third coldest day since 1951 on 7 January, with a daily minimum temperature of −19.6 °C. (Wang et al., 2021; Zhou et al., 2022). The regional mean temperature in Northern China during 6–8 January 2021 was about 9 °C lower than the average for the same period between the years 2001 and 2020. North America evidenced a widespread cold extreme in February 2021, which was caused by the distorted and weakened polar vortex (Lee, 2021; Lu et al., 2021). The temperatures were 15 to 25 °C lower than normal in large areas and caused huge impacts on the energy supplies and transportation (Zhou et al., 2022). Cold extremes have occurred from time to time under global warming in recent years. Will it continue to occur while global warming continues in the future?
The model simulations indicate that the anthropogenic influences have reduced the occurrence probability of cold extremes over eastern China with intensity stronger than the record-breaking cold extreme (since modern meteorological observations started in 1960) on 21–25 January 2016 (Qian et al., 2018). The wintertime East Asian SAT is projected to increase significantly as a response to future global warming (IPCC, 2021). Cold months defined based on the 20th century will be rarer under future global warming (Räisänen and Ylhäisi, 2011), and the future warming will continuously reduce the intensity and occurrence probability of the cold extreme events (annual minimum daily minimum temperature) over East Asia (Kharin et al., 2013, 2018).
Previous studies demonstrated that the SAT is influenced by both the dynamic (changes in large-scale atmospheric circulation) and thermodynamic effects (Thompson et al., 2009; Cattiaux et al., 2010; Wallace et al., 2012; Smoliak et al., 2015; Deser et al., 2016). The dynamic effect, for example, the Arctic amplification, which reduces the pole-to-Equator temperature gradient, can further modify the atmospheric circulation. There is a positive AO-like SLP (sea level pressure) change pattern under global warming (Fyfe et al., 1999; Yamaguchi and Noda, 2006; Kitoh, 2017) and the East Asian winter monsoon will be weakened in the warmer future conditions according to the multi-model simulations of the CMIP3 and CMIP5 models (Jiang and Tian, 2013; Xu et al., 2016). However, there is a lack of quantitative research on the contributions of the dynamic and thermodynamic effects to the future changes of the East Asian cold extremes if the global mean SAT continues to increase.
The “dynamic adjustment” approach (Wallace et al., 2012; Smoliak et al., 2015; Deser et al., 2016) has been proposed to divide the SAT anomaly into dynamic component (solely associated with circulation changes) and thermodynamic component (associated with thermodynamic processes). The dynamic adjustment of the Northern Hemisphere SAT field based on SLP can be used to investigate both the short-term climate fluctuations and long-term trends of SAT (Smoliak et al., 2015). Deser et al. (2016) indicates that the internal circulation trends account for over 30 % of the North American wintertime warming trend in the past 50 years. The variability of circulation plays a critical role in the evolution of the East Asian winter temperature trends during 1961–2018, and the internally induced dynamic component offsets the forced warming by over 70 % in northern East Asia over the time period of 1979–2018 (Gong et al., 2019, 2021). The dynamic adjustment approach has also been used to investigate the wintertime precipitation changes and summertime SAT changes over East Asia (e.g. Guo et al., 2019; Hu et al., 2019). However, these studies mainly focus on the mean temperature and mean precipitation changes in the past several decades, very few studies have quantified the contributions of the dynamic and thermodynamic effects to the future changes of the East Asian cold extremes associated with global warming.
By using two sets of grand ensemble simulations combined with observational data and reanalysis data, we aim to answer the following questions. (1) What are the relative contributions of the dynamic and thermodynamic effects to the East Asian cold extremes in the past several decades? (2) How will the intensity and occurrence probability of East Asian cold extremes change in the warmer future and what are the quantitative contributions of the dynamic and thermodynamic effects to the changes of East Asian cold extremes in the warmer future? (3) How will the circulation change in the warmer future and how will this change affect cold extremes in East Asia?
2.1 Model data
The 100-member Grand Ensemble generated by the Max Planck Institute Earth System Model version 1.1 (MPI-GE; Maher et al., 2019) with a horizontal resolution of 1.8° × 1.8° and the 40-member Community Earth System Model Large Ensemble (CESM-LE; Kay et al., 2015) with a horizontal resolution of 1° × 1° are applied in this study to investigate the contributions of dynamic and thermodynamic components to the East Asian cold extremes in recent decades and the future warm climate. The historical simulations integrated from 1850 to 2005 in the MPI-GE and from 1920 to 2005 in the CESM-LE were driven by the observed forcings. The Representative Concentration Pathway 8.5 (RCP8.5) scenario simulations were performed from 2006 to 2099 in the MPI-GE and from 2006 to 2100 in the CESM-LE. In addition, the 2000-year MPI pre-industrial (PiCTL) simulation and 1800-year CESM PiCTL simulation are also used in this study. For more detailed information on the MPI-GE and the CESM-LE, please refer to Maher et al. (2019) and Kay et al. (2015), respectively.
2.2 Observation data
The following datasets are used in this study: (1) monthly mean SAT from the Climatic Research Unit (CRU) version 4 with a horizontal resolution of 0.5° × 0.5° (Harris et al., 2014). (2) Monthly mean three-dimensional circulation fields derived from the 20th Century Reanalysis (20CR) version 2 with a horizontal resolution of 2° × 2° (Compo et al., 2011). The time period for these two datasets used in this study is from 1920 to 2012.
2.3 Dynamic adjustment approach
The dynamic adjustment method presented by Deser et al. (2016) is based on the constructed circulation analogue using SLP. This method empirically divides SAT variability into a dynamic component (associated with atmospheric circulation changes) and a thermodynamic component (the residual part). The dynamic adjustment method is summarized below; please refer to Deser et al. (2016) for more details.
2.3.1 Application to the MPI-GE and CESM-LE
For a given “target” month and year (e.g. December 1990) in each ensemble member, we rank the 2000 (1800) December SLP fields in the PiCTL simulation by their similarity with the target SLP pattern according to Euclidean distance. From the 150 SLP fields with the smallest Euclidean distances, we randomly subsample 100 SLP fields to construct the best estimation of the target SLP pattern by linear combination. The same set of linear coefficients is applied to the accompanying SAT fields to obtain the associated linear combination of SAT. We repeat the subsampling procedure 100 times and average the 100 linear combinations to derive the dynamically induced SAT field in the target month. Deser et al. (2016) illustrate the importance of this iterative random selection process and the reason for the repeated subsampling procedure is to take into account the uncertainty related to internal thermodynamic variability and to ensure the robustness of the results. We use the domain 15–90° N, 30–180° E for the SLP analogues. The sensitivity to the precise region used is small (figures not shown; e.g. within ±5° latitude and ±10° longitude). To test whether 150 selected SLP fields are sufficient to estimate the target SLP, a sensitivity analysis is conducted on the sample size of the selected closest fields. The findings suggest that there is no significant difference when the number of selected fields exceeds 100.
The multi-member mean of the dynamic component is regarded as the forced dynamic component and the internal dynamic component is obtained by subtracting the forced part from the total dynamic component for each ensemble member. Thermodynamic components are obtained as residuals (total minus dynamic) for both forced and internal components.
2.3.2 Application to the observation
There is no PiCTL simulation in the observation. Therefore, before computing the dynamic component of SAT, the quadratic trend of the SAT during 1920–2012 is first subtracted to obtain SAT series without anthropogenic forcing. Similar to the application to the model ensembles, for each month and year in the observation, 40 SLP fields subsampled from 60 closest SLP fields are first selected (excluding the target month). Following this, the dynamic adjustment procedure described in Sect. 2.3.1 is applied to derive the dynamically induced SAT fields in the observation.
Different from model simulations, there is only one member in the observation, and we cannot separate the forced and internal parts by calculating the ensemble mean or subtracting the ensemble mean. To obtain the internal dynamic contribution to the observed SAT anomaly, a separate dynamic adjustment based on the internal component of the observed SLP anomalies is performed. It is worth noting that the internal component of the observed SLP anomalies is obtained by subtracting the model ensemble-mean SLP anomaly from the observed SLP anomaly at each time step.
After we get the internal dynamic component of SAT anomaly, the forced dynamic component is calculated by subtracting the internal dynamic component from the total dynamic component. Thermodynamic components are obtained as residuals (total minus dynamic) for both forced and internal components.
2.4 Baseline period and the study region
The baseline period of 1986–2005 boreal winter is referred to as the historical (present-day) climatology to investigate the SAT anomalies and contributions of dynamic and thermodynamic effects to future changes of East Asian cold extremes. The certain region (the black box in Fig. 2) from 20 to 55° N and from 105 to 130° E is regarded as East Asia in this study.
2.5 The definitions of cold extreme and cold month
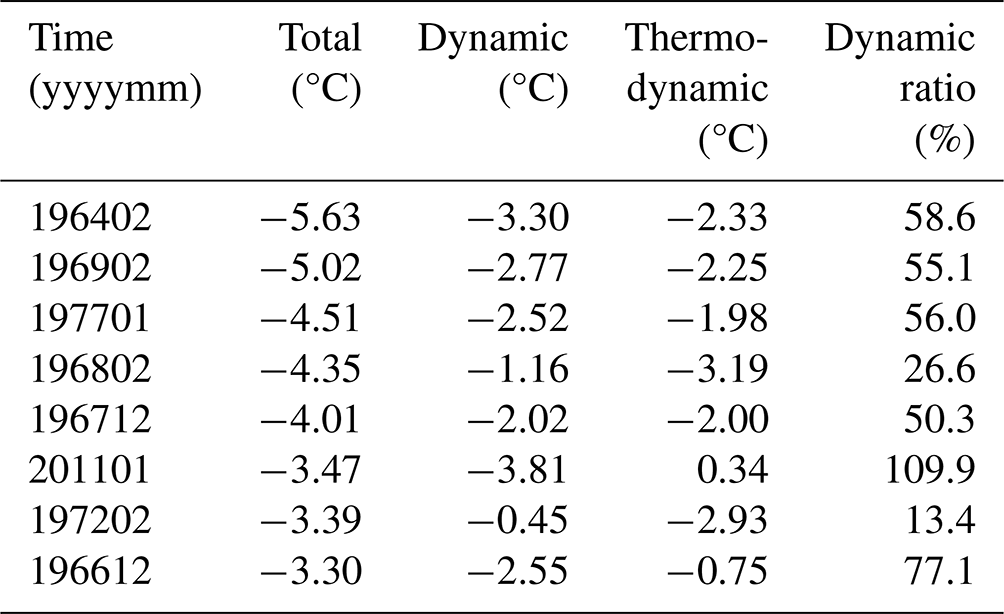
The definition of East Asian cold extreme is as follows: in the models, the regional averaged monthly SAT anomaly of East Asia is firstly calculated. For a specific period, cold extremes are defined as the months in which the regional mean SAT is lower than the statistical fifth percentile of the climatological monthly SAT series during DJF in this time period. A month when a cold extreme happens is defined as a cold month. Similarly, the cold months in the observation are the 8 coldest months (5 % of 150 winter months) during the 1962–2011 boreal winter (Table 1).
Table 1The list of observed cold months in period of 1962–2011 boreal winter.
All the anomalies shown in this study are calculated relative to the climatological values of the 1986–2005 boreal winter unless mentioned otherwise. Student's t test is applied to indicate the 5 % significance level.
2.6 The intensity and occurrence probability ratio of cold extreme
The intensity of a cold extreme is the SAT deviation relative to the present-day boreal winter SAT climatology.
The occurrence probability ratio of the present-day cold extremes is calculated as follows (Ma et al., 2017a):
where PR is the occurrence probability ratio. The value of P0 is 5 %, and P1 is the probability of monthly SAT lower than the present-day cold extreme threshold in other time periods. For example, if the value of P1 is 2 % during a future period, then the value of PR is 0.4. For the calculation of the occurrence probability ratio, we pull all the members together rather than calculate it for each member.
3.1 Dynamic and thermodynamic processes to East Asian cold extremes in recent decades
The observed winter temperature in East Asia shows obvious variability during the 1962–2011 boreal winter (Fig. 1a). According to the correlation coefficients calculated between each component of the SAT anomaly and the original SAT anomaly, the SAT variability is mainly caused by the dynamically induced internal component (Fig. 1b–g). The fluctuations of forced dynamic and thermodynamic components are much smaller than those of internal dynamic and thermodynamic ones (Fig. 1c, d, f and g). Internal variability is the main cause of cold extremes over East Asia in the past 5 decades (Fig. 1).
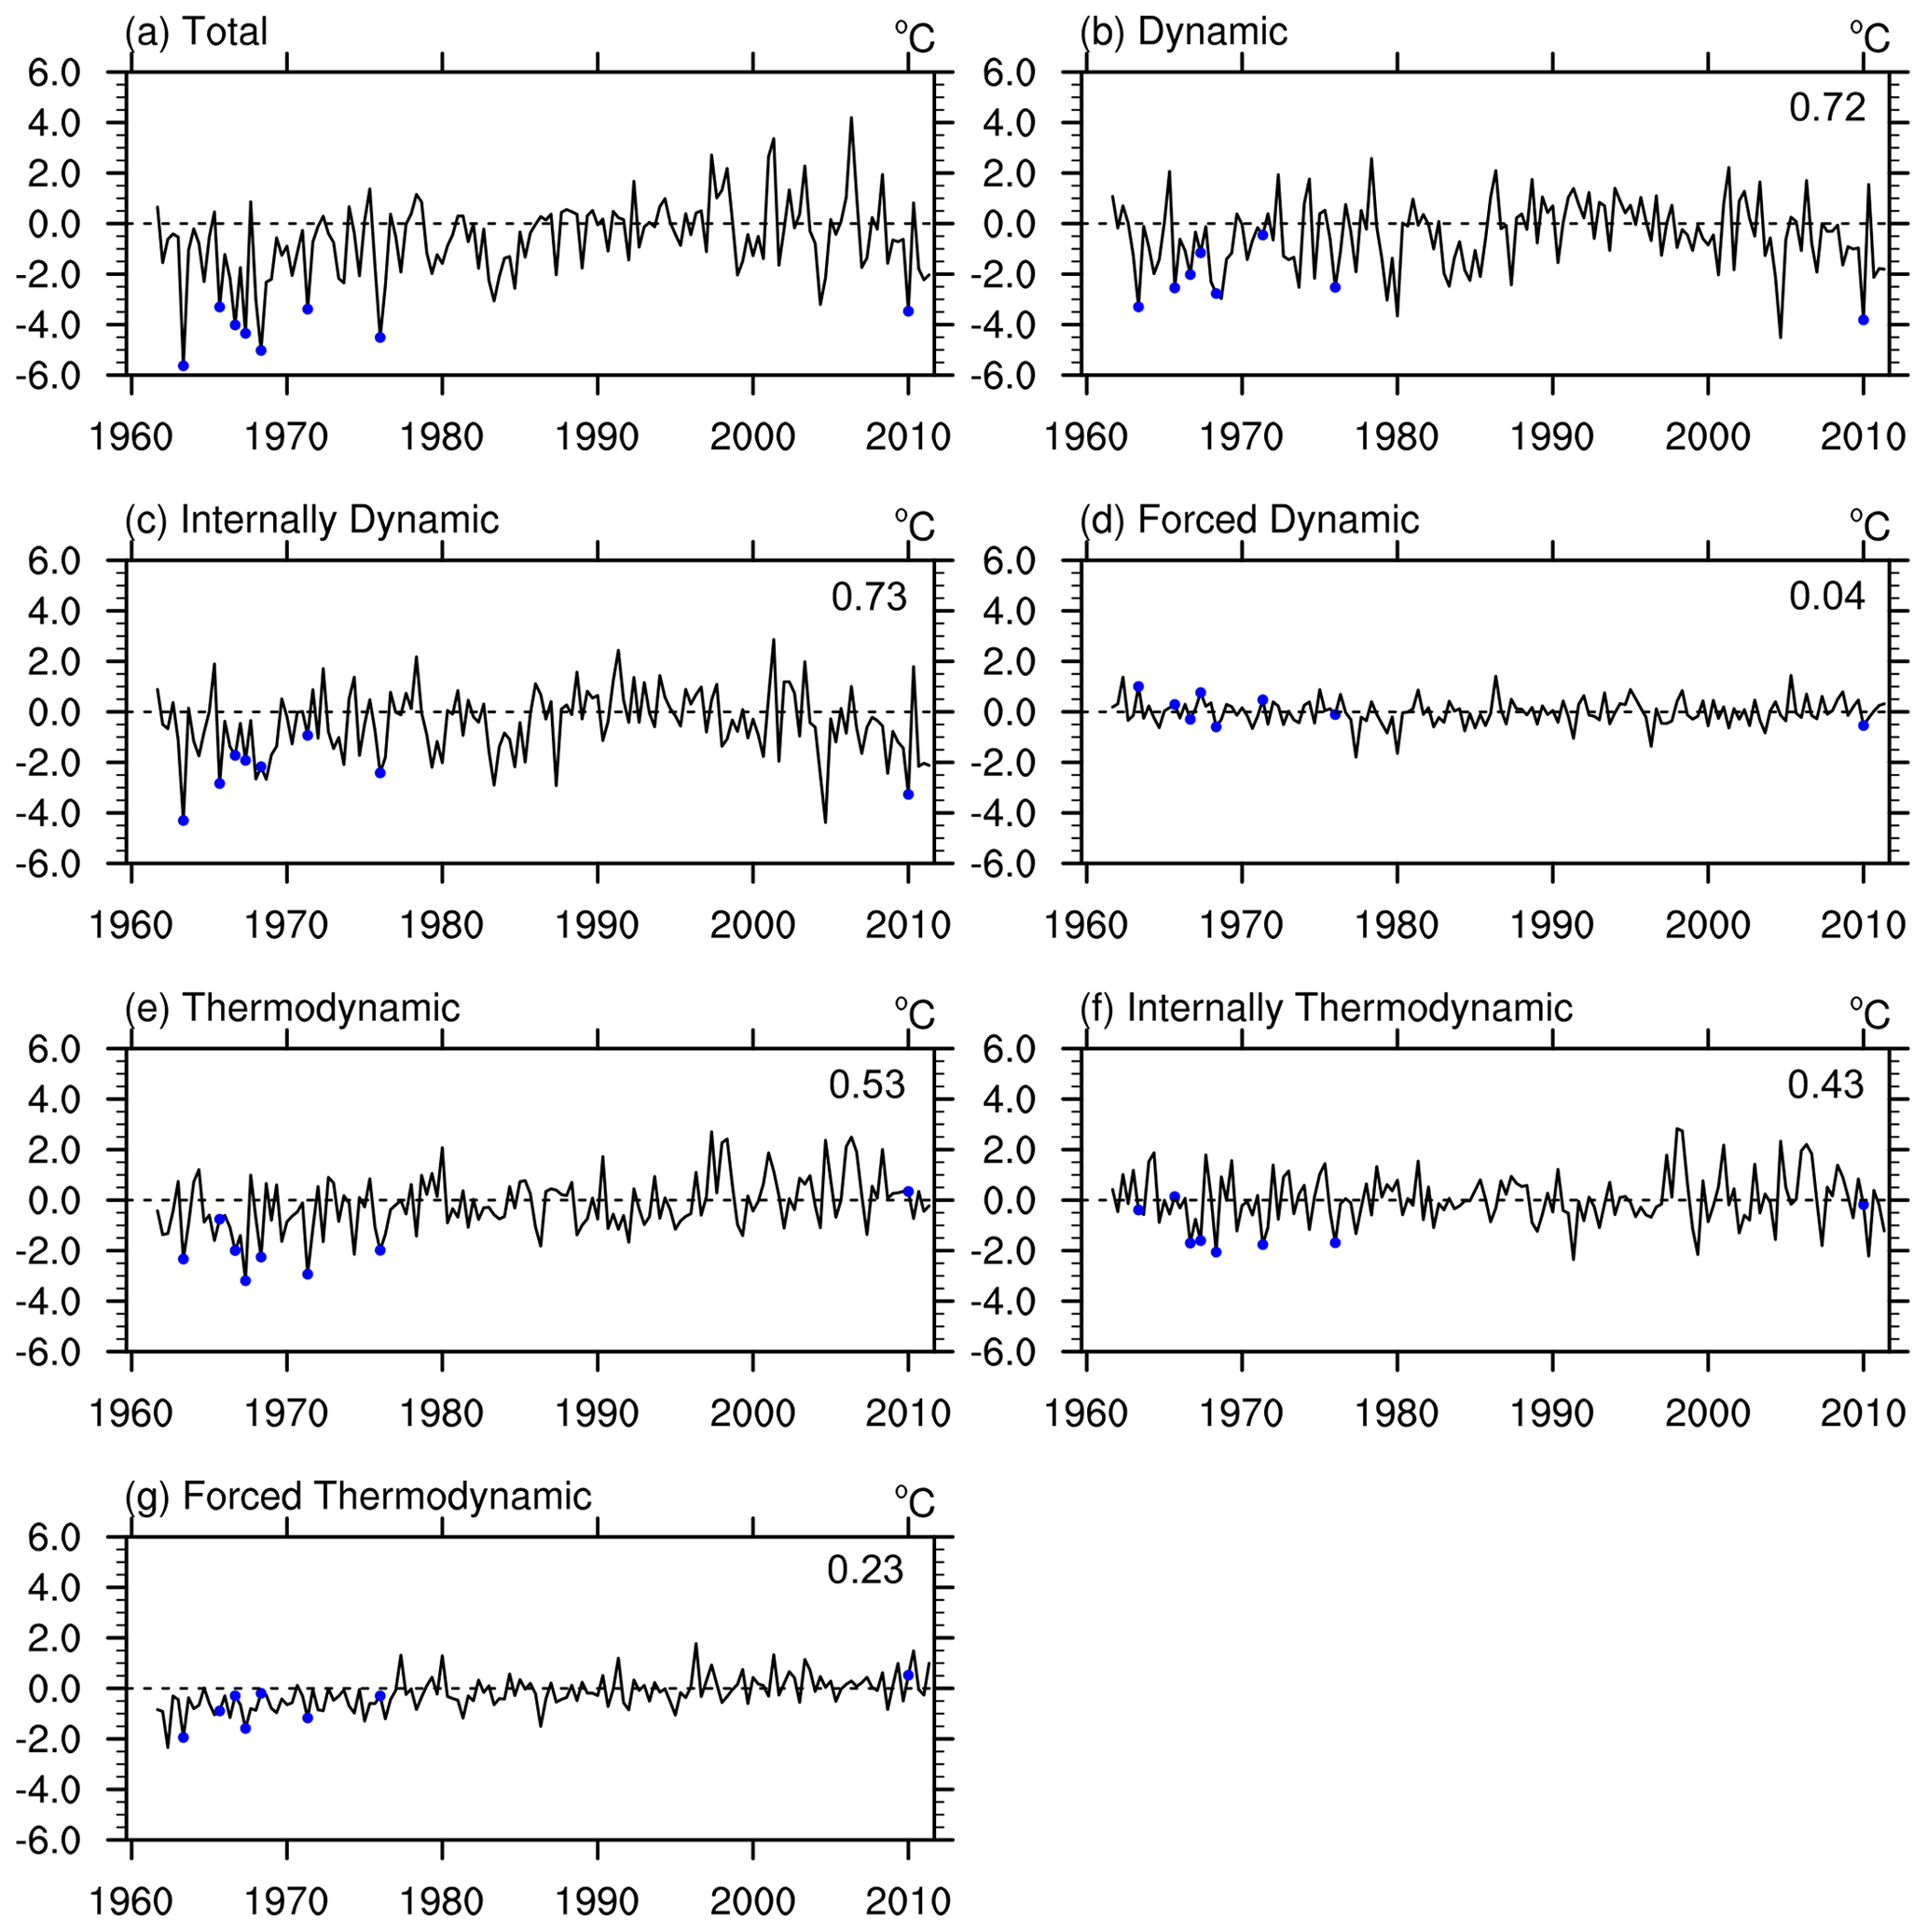
Figure 1Time series decomposition of winter monthly surface air temperature (SAT) anomalies averaged over East Asia (20–55° N and from 105–130° E) from the observation into internal, forced, dynamic, and thermodynamic components: (a) total, (b) dynamic, (c) internally dynamic, (d) forced dynamic, and (e) thermodynamic components. The blue dots represent the cold months in the period of 1962–2011 boreal winter. The numbers in the upper right corner of panels (b) to (g) represent the correlation coefficient between each component of SAT anomaly and the original SAT anomaly shown in panel (a).
The decomposition of the observed East Asian cold-month SAT anomalies during the 1962–2011 boreal winter is shown in Fig. 2a–c. The SAT is significantly lower than the present-day winter SAT climatology (more than 3 °C) across the East Asian landmass (Fig. 2a). The decomposition of the SAT anomaly indicates that the cold extremes in recent decades are mainly caused by the dynamic component (Fig. 2b and c). The dynamic component accounts for approximately 55 % of the total East Asian cold-month SAT anomaly during the 1962–2011 boreal winter. Compared to cold extremes in the 1960s and 1970s, the percentage contribution of dynamic components to the cold extreme in January 2011 is higher (Table 1). The East Asian regional mean SAT anomaly in January 2011 is −3.47 °C, in which the dynamic component is −3.81 °C, accounting for up to 110 % of the total SAT anomaly (Table 1). It is worth noting that these cold extremes are mainly caused by the internally generated components, and the forced dynamic component has shown little trend in the past 5 decades and has little contribution to the observed cold extremes (Fig. 1c and d).
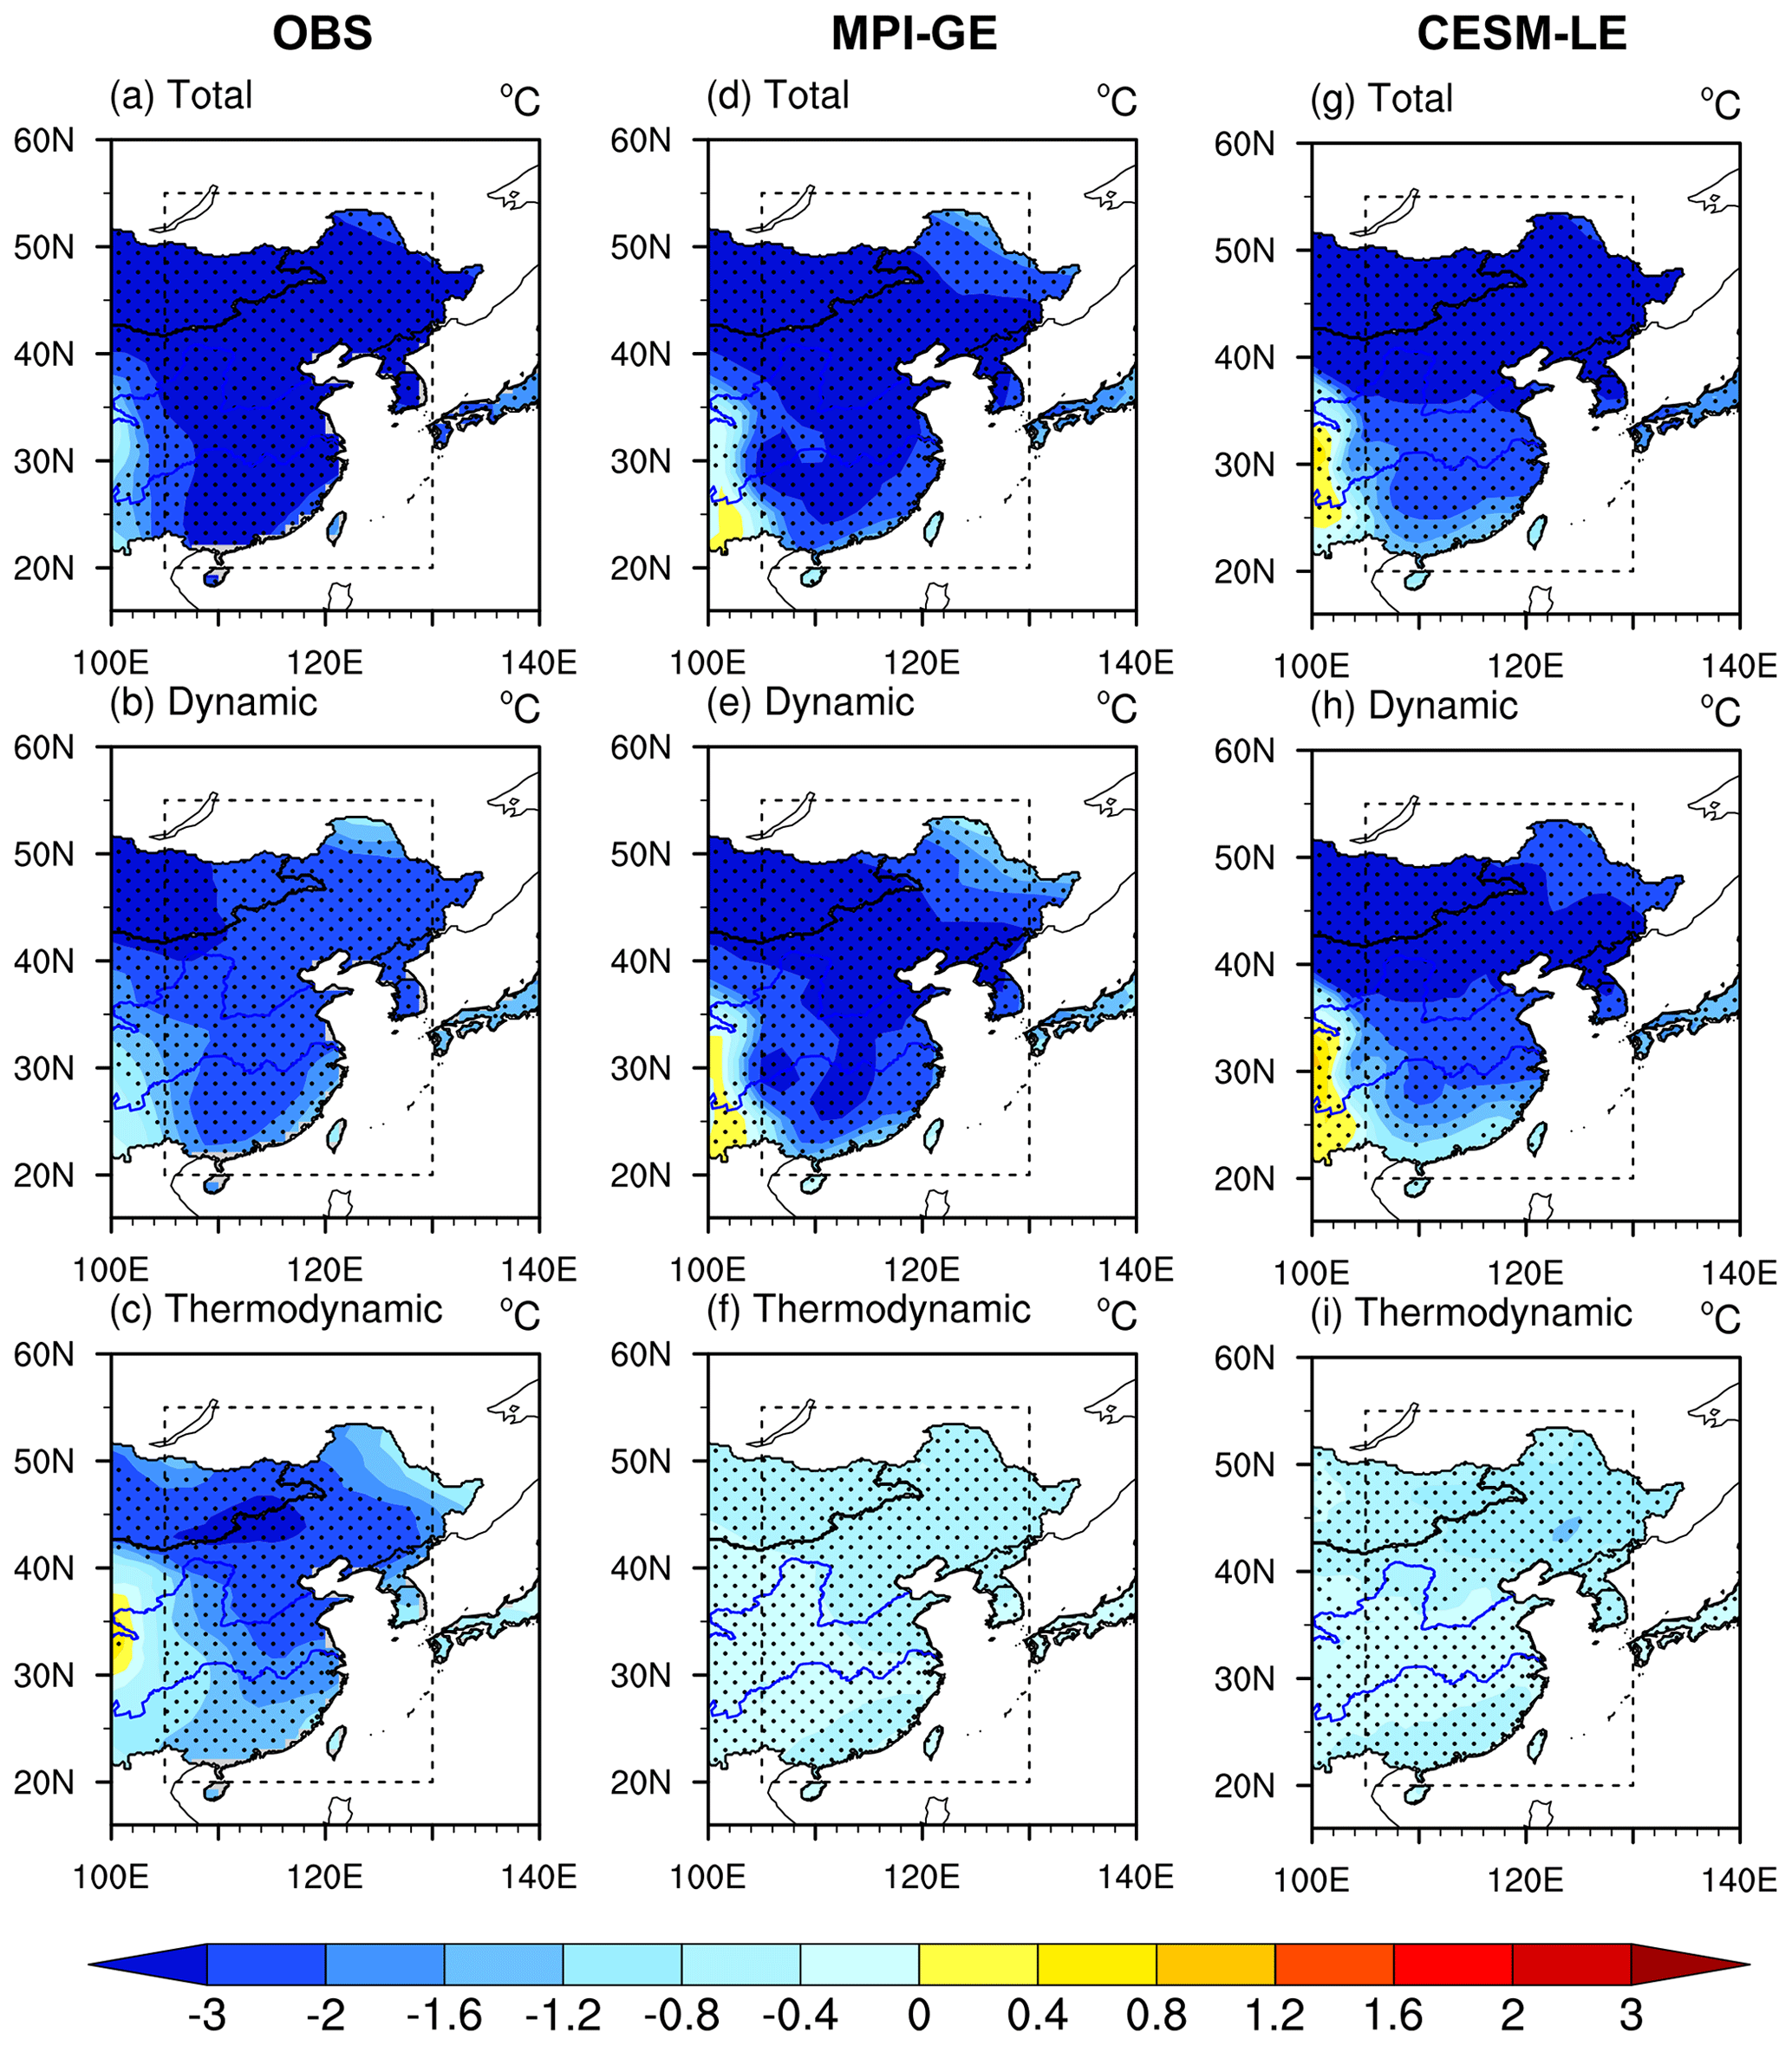
Figure 2The composites of the cold-month SAT anomaly (relative to the 1986–2005 boreal winter climatology) in the observation during the period of 1962–2011 boreal winter: (a) total, (b) dynamically induced, and (c) thermodynamically induced. Panels (d)–(f) and (g)–(i) correspond to panels (a)–(c) but for the results in the MPI-GE and the CESM-LE, respectively. The dotted areas are statistically significant at the 5 % level according to Student's t test. The cold months are defined as months in which SAT is lower than the statistical fifth percentile of all the monthly SAT samples during 1962–2011 boreal winter.
The two sets of large-ensemble model simulations can generally capture the spatial distributions of total SAT anomaly and the dynamic component of cold extremes during 1962–2011 boreal winter (Fig. 2d, e, g and h), with pattern correlation coefficients higher than 0.7 in both model ensembles. However, the thermodynamic component is much weaker in the model simulations than in the observation, especially in the northern parts of East Asia (Fig. 2f and i). The dynamic component is the main contributor to the cold extremes, accounting for up to 85 % and 82 % of the total East Asian cold-month SAT anomaly during the 1962–2011 boreal winter in the MPI-GE and the CESM-LE, respectively. Compared with the observation, the contribution of the dynamic component to the cold extremes is larger in the two model ensembles (Fig. 2). One possible reason is that there are only eight cold extreme samples in the observation, and the relative contributions of dynamic and thermodynamic components cannot be fully reflected by these samples. Another possible reason may be the uncertainty of local thermodynamic processes (Röthlisberger and Papritz, 2023).
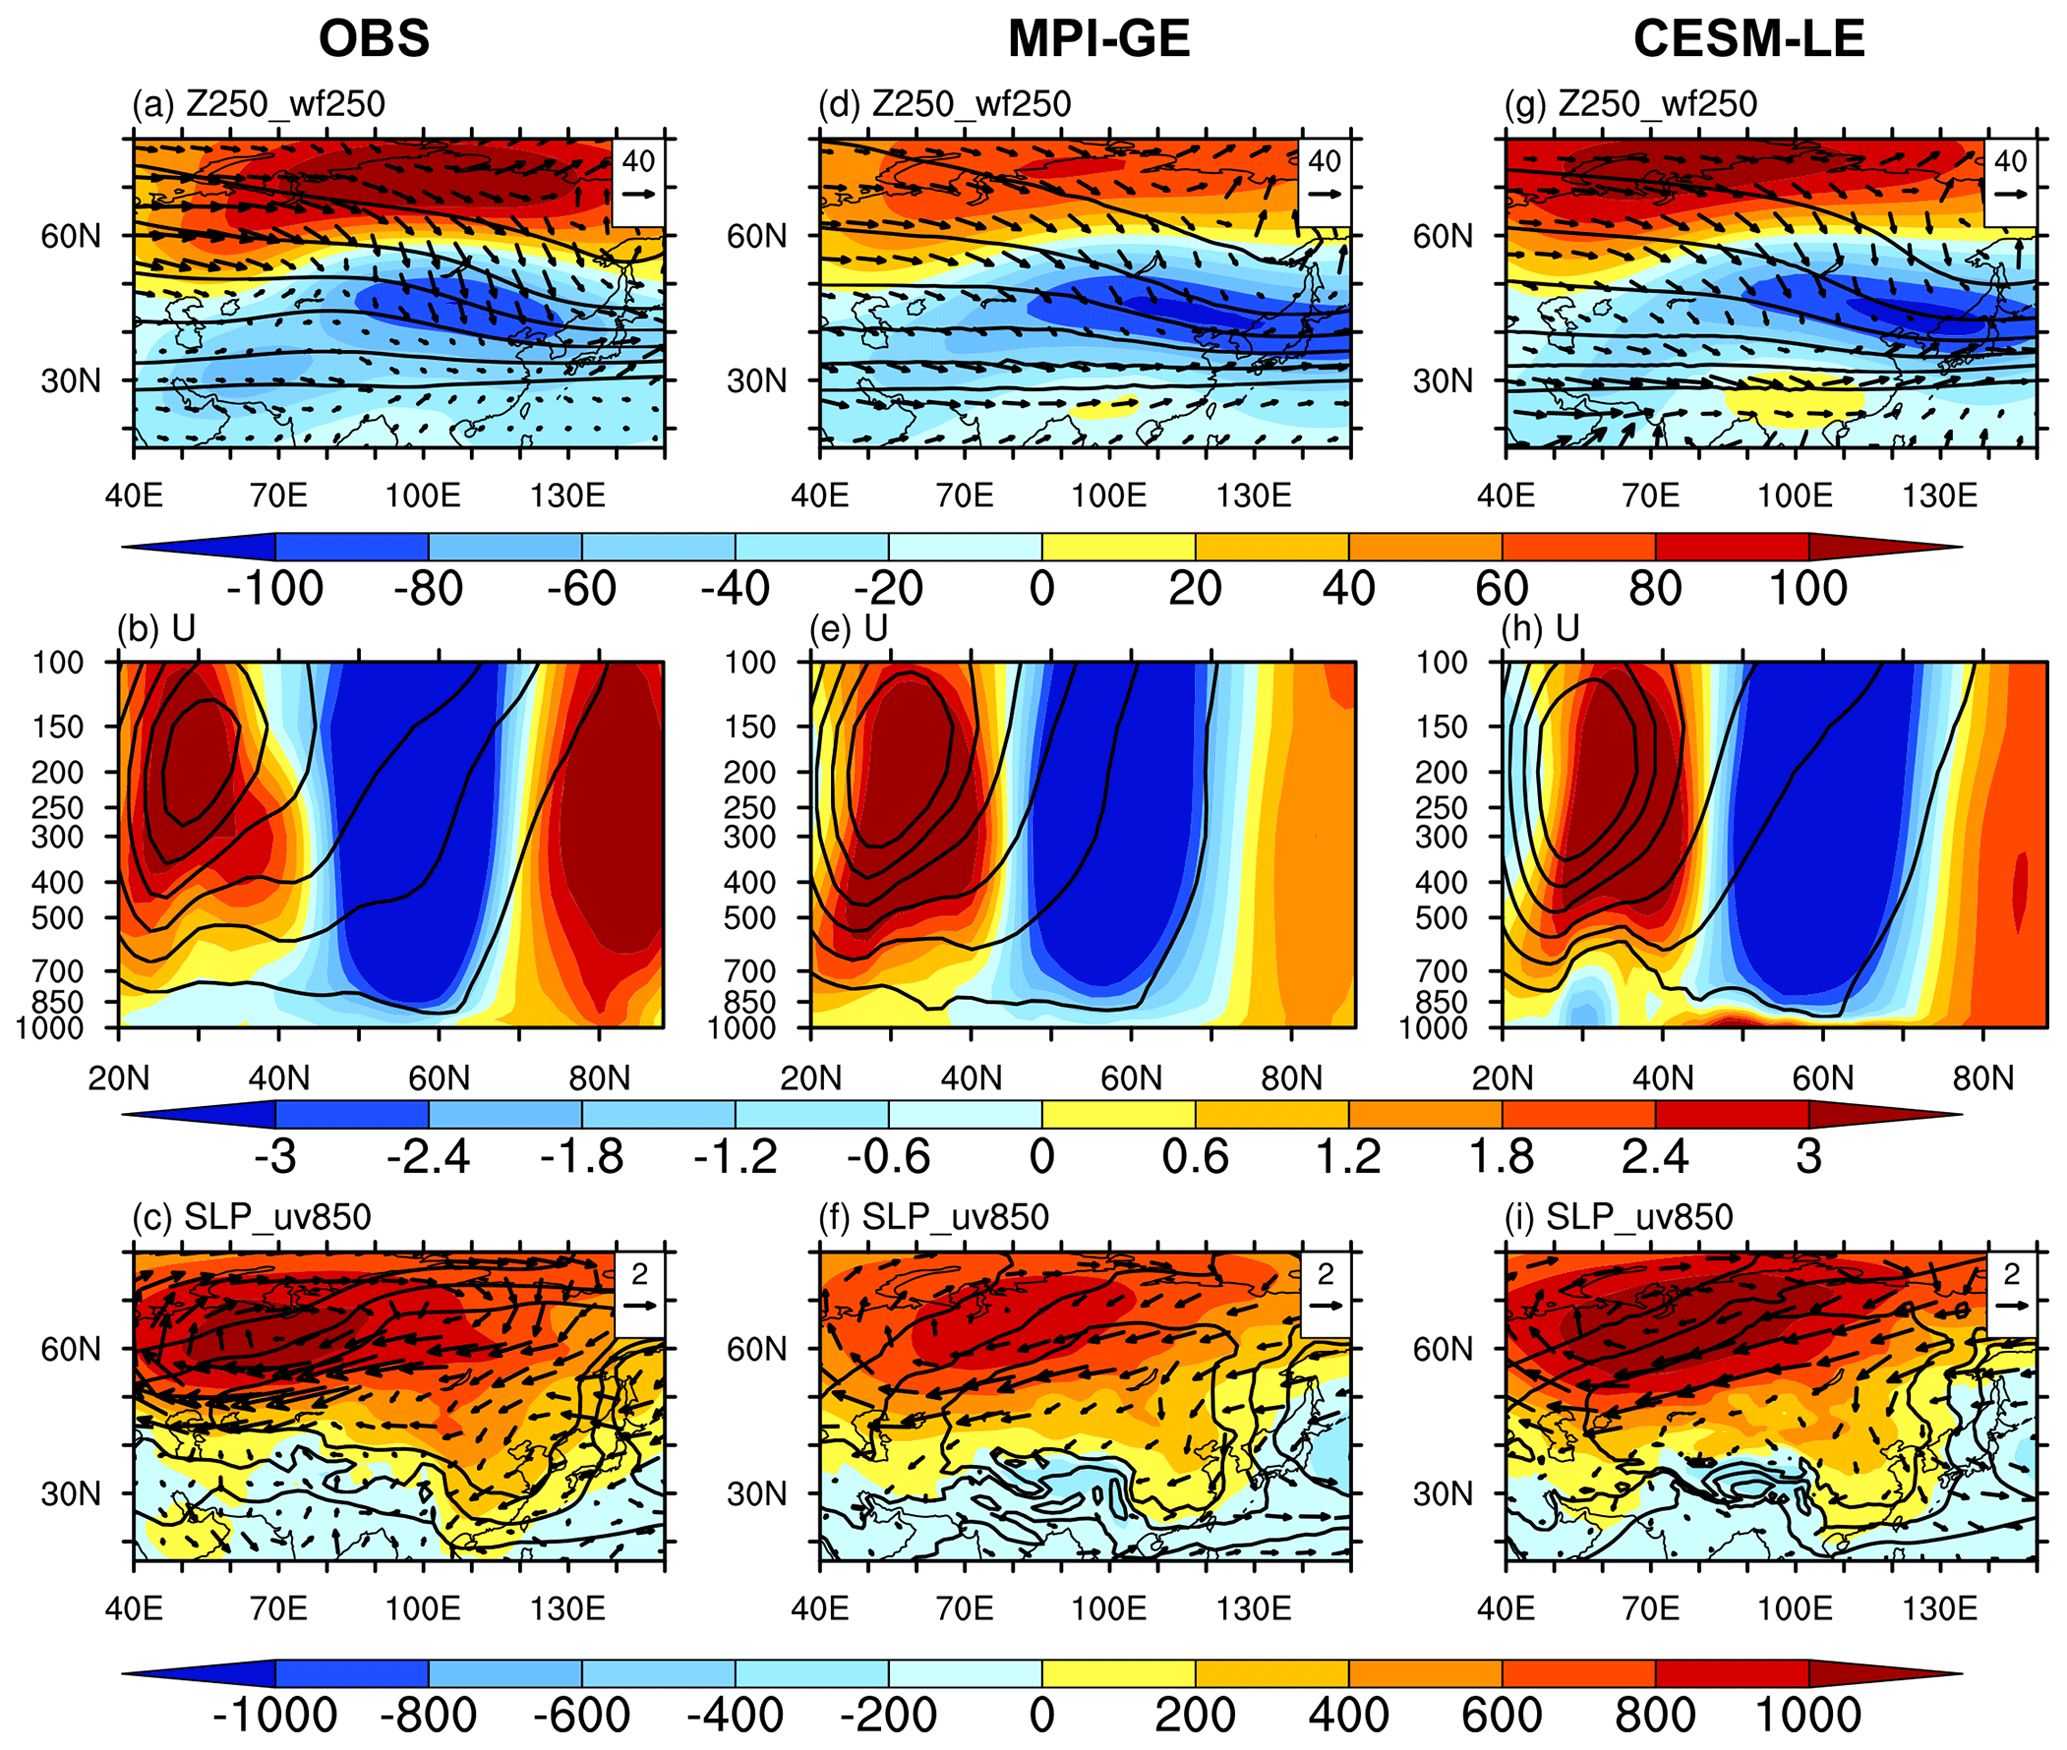
Figure 3Observed composite circulation anomalies (relative to the 1986–2005 boreal winter climatology) for East Asian cold extremes during the period of 1962–2011 boreal winter: (a) geopotential height (shading; unit: m) and horizontal components of the wave activity flux (m2 s−2) at 250 hPa. (b) Zonal mean zonal wind over the vertical cross section (zonally averaged over 70–120° E; unit: m s−1;). (c) Sea level pressure (shading; unit: Pa) and horizontal wind at 850 hPa (m s−1). The contours in panels (a)–(c) represent the 1986–2005 boreal winter climatology of geopotential height at 250 hPa, zonal mean zonal wind over the vertical cross section, and sea level pressure, respectively. Panels (d)–(f) and (g)–(i) correspond to panels (a)–(c) but for the results in the MPI-GE and the CESM-LE, respectively.
The results shown above indicate that the observed cold extremes in the past decades are mainly caused by the internal variability of atmospheric circulations. The cold extremes are often associated with strong East Asian winter monsoon flows, which are often accompanied by the blocking in the Urals and the intensified Siberian High (Francis and Vavrus, 2012; Ma et al., 2018). The composite circulation anomalies in the cold months during the 1962–2011 boreal winter are further investigated (Fig. 3). A ridge–trough pattern is seen over the Eurasian continent in the upper troposphere, and there is southeastward propagation of wave activity flux (Fig. 3a). The westerlies are weakened in the whole troposphere around 45–75° N, and there is an enhanced meandering flow pattern (Fig. 3b; Walsh, 2014; Simmonds, 2015; Ma et al., 2018). The weakened westerlies may favour the blocking events, which have a strong relationship with the cold extremes over East Asia (Luo et al., 2017). The surface Siberian High is intensified, and low-level northerly winds lead cold Arctic air to spread southward to East Asia (Fig. 3c).
This typical type of circulation anomaly in cold months mentioned above is also well captured in the MPI-GE and the CESM-LE (Fig. 3d–f). Namely, there is a ridge–trough pattern in the upper troposphere over the Eurasian continent and the surface Siberian High is enhanced. The westerlies are weakened in the whole troposphere and the cold air from the Arctic regions causes cold extremes over East Asia.
3.2 Dynamic and thermodynamic contributions to the projected changes in East Asian cold extremes
In the observations, the dynamic component is the main contributor to the East Asian cold extremes in the past 5 decades. The human-induced global warming had little effect on the changes in dynamically induced SAT anomalies during 1962–2011 (Fig. 1). How will the dynamic and thermodynamic effects contribute to the future changes in cold extremes over East Asia?
We first examine the changes in the intensity of East Asian cold extremes (Fig. 4a and c). The SAT anomaly will continuously increase along with global warming under the RCP8.5 scenario. Compared with the present day, the East Asian regional mean cold-month SAT will increase by approximately 4.7 °C at the end of the 21st century according to the best estimation of MPI-GE (Fig. 4a). The large centre is located in northeastern China over 6 °C (Fig. 5a). The dynamic and thermodynamic components will also continually increase under the RCP8.5 scenario. It is worth noting that the dynamic component explains a larger part of the total SAT anomaly in cold months before approximately 2040. Thereafter, the thermodynamic component is the main driver in both model ensembles (Fig. 4a and c). The increases in the dynamic and thermodynamic components are approximately 1.3 and 3.4 °C at the end of the 21st century, respectively, in the MPI-GE (Fig. 4a). Therefore, the contribution of the increase in dynamic component to the total SAT increase is 27 %. The dynamic and thermodynamic components also increase faster in northern parts of East Asia than in other regions (Fig. 5b and c). The faster increase in the thermodynamic component in northern East Asia may be caused by the snow–albedo feedback (Fischer et al., 2011), while the reason for the faster increase in dynamic component in this region is that the influence of East Asian Winter Monsoon on northern East Asia is more evident than on other subregions (He et al., 2017). The results in the CESM-LE are generally consistent with those in the MPI-GE. The East Asian regional mean SAT anomalies in cold months will increase by approximately 5.2 °C at the end of the 21st century (Fig. 4c). The corresponding increases in the dynamic and thermodynamic components are 1.3 and 3.9 °C, respectively. Statistically, the contribution of the increase in dynamic component to the total SAT increase is about 25 %. From the perspective of spatial distribution, total SAT and its dynamic and thermodynamic components show similar changing patterns in the two sets of large-ensemble model simulations, with large increases occurring in northern parts of East Asia (Fig. 5). However, there are some local differences between the two models. Compared with MPI-GE, the end of the 21st century increase in cold-month regional mean SAT is approximately 0.5 °C higher in CESM-LE, primarily due to the thermodynamic component. The larger increase in thermodynamic component in northeastern and southeastern China in CESM-LE than in MPI-GE may be attributed to differences in thermal feedback processes, such as the snow–albedo feedback and land surface fluxes (Seneviratne et al., 2010; Fischer et al., 2011; Röthlisberger and Papritz, 2023).
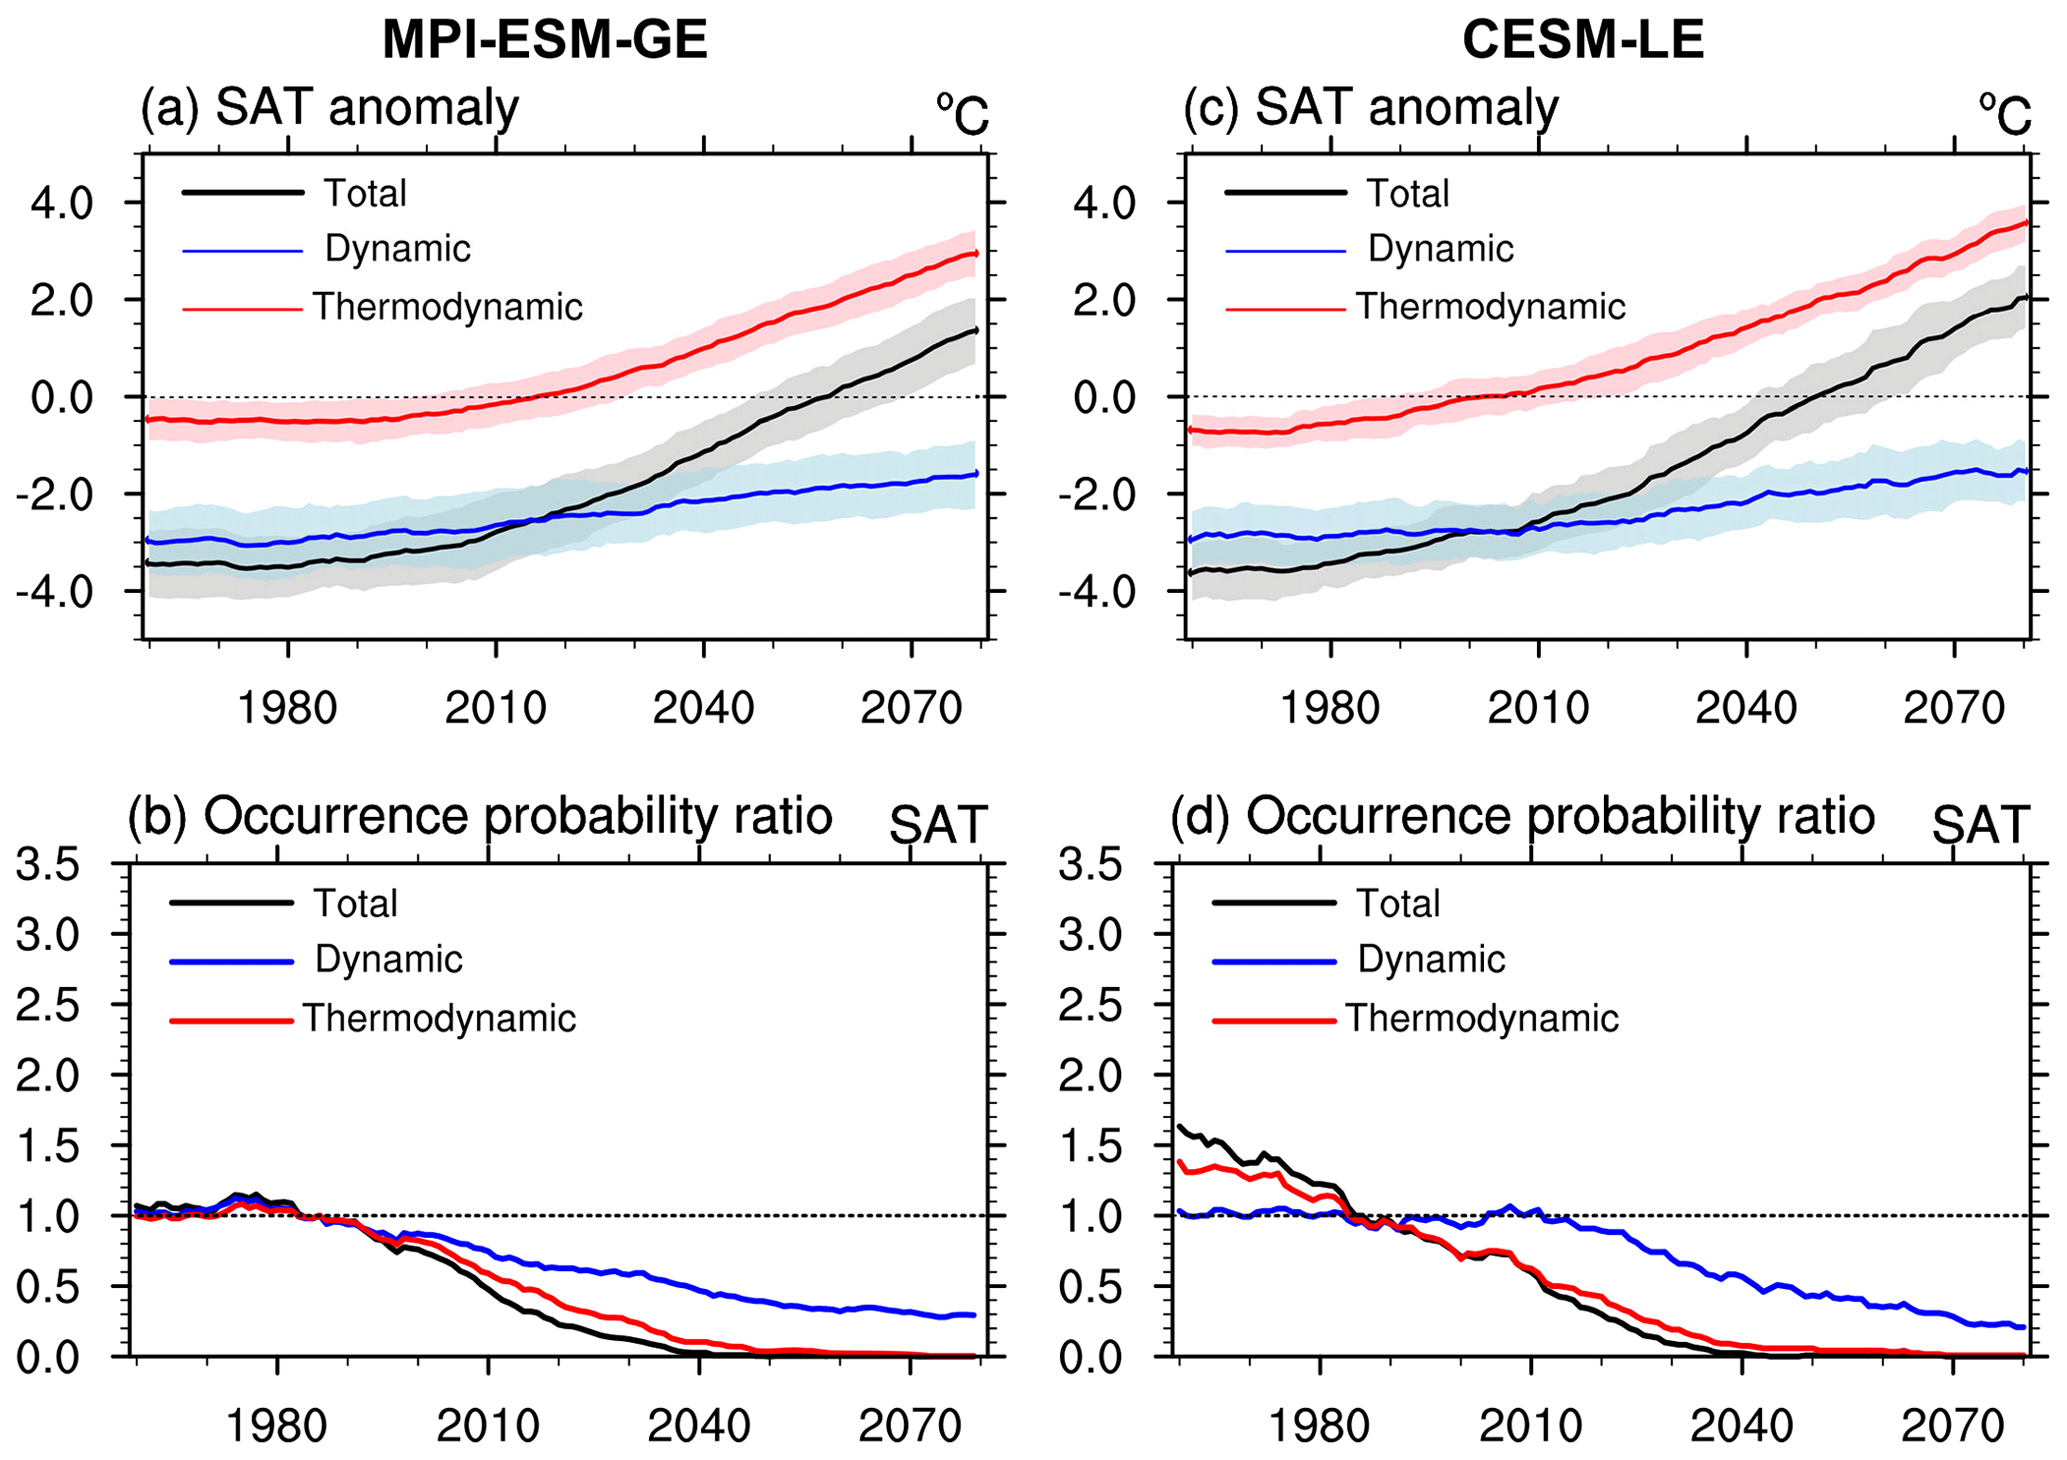
Figure 4(a) Time series of the 20-year running average cold-month SAT anomaly (black) and its dynamically induced (blue) and thermodynamically induced (red) components over East Asia relative to the 1986–2005 boreal winter climatology in the MPI-GE. The shading shows the range of 2 standard deviations among the model members. (b) Time series of the occurrence probability ratio of the present-day East Asian cold extremes in the MPI-GE: both dynamic and thermodynamic components change (black), only dynamic component changes (blue), and only thermodynamic component changes (red). Panels (c) and (d) correspond to panels (a) and (b) but for the results in the CESM-LE. Cold months are defined as the months in which the regional mean SAT is lower than the statistical fifth percentile of the climatological monthly SAT series during DJF in a certain time slice.
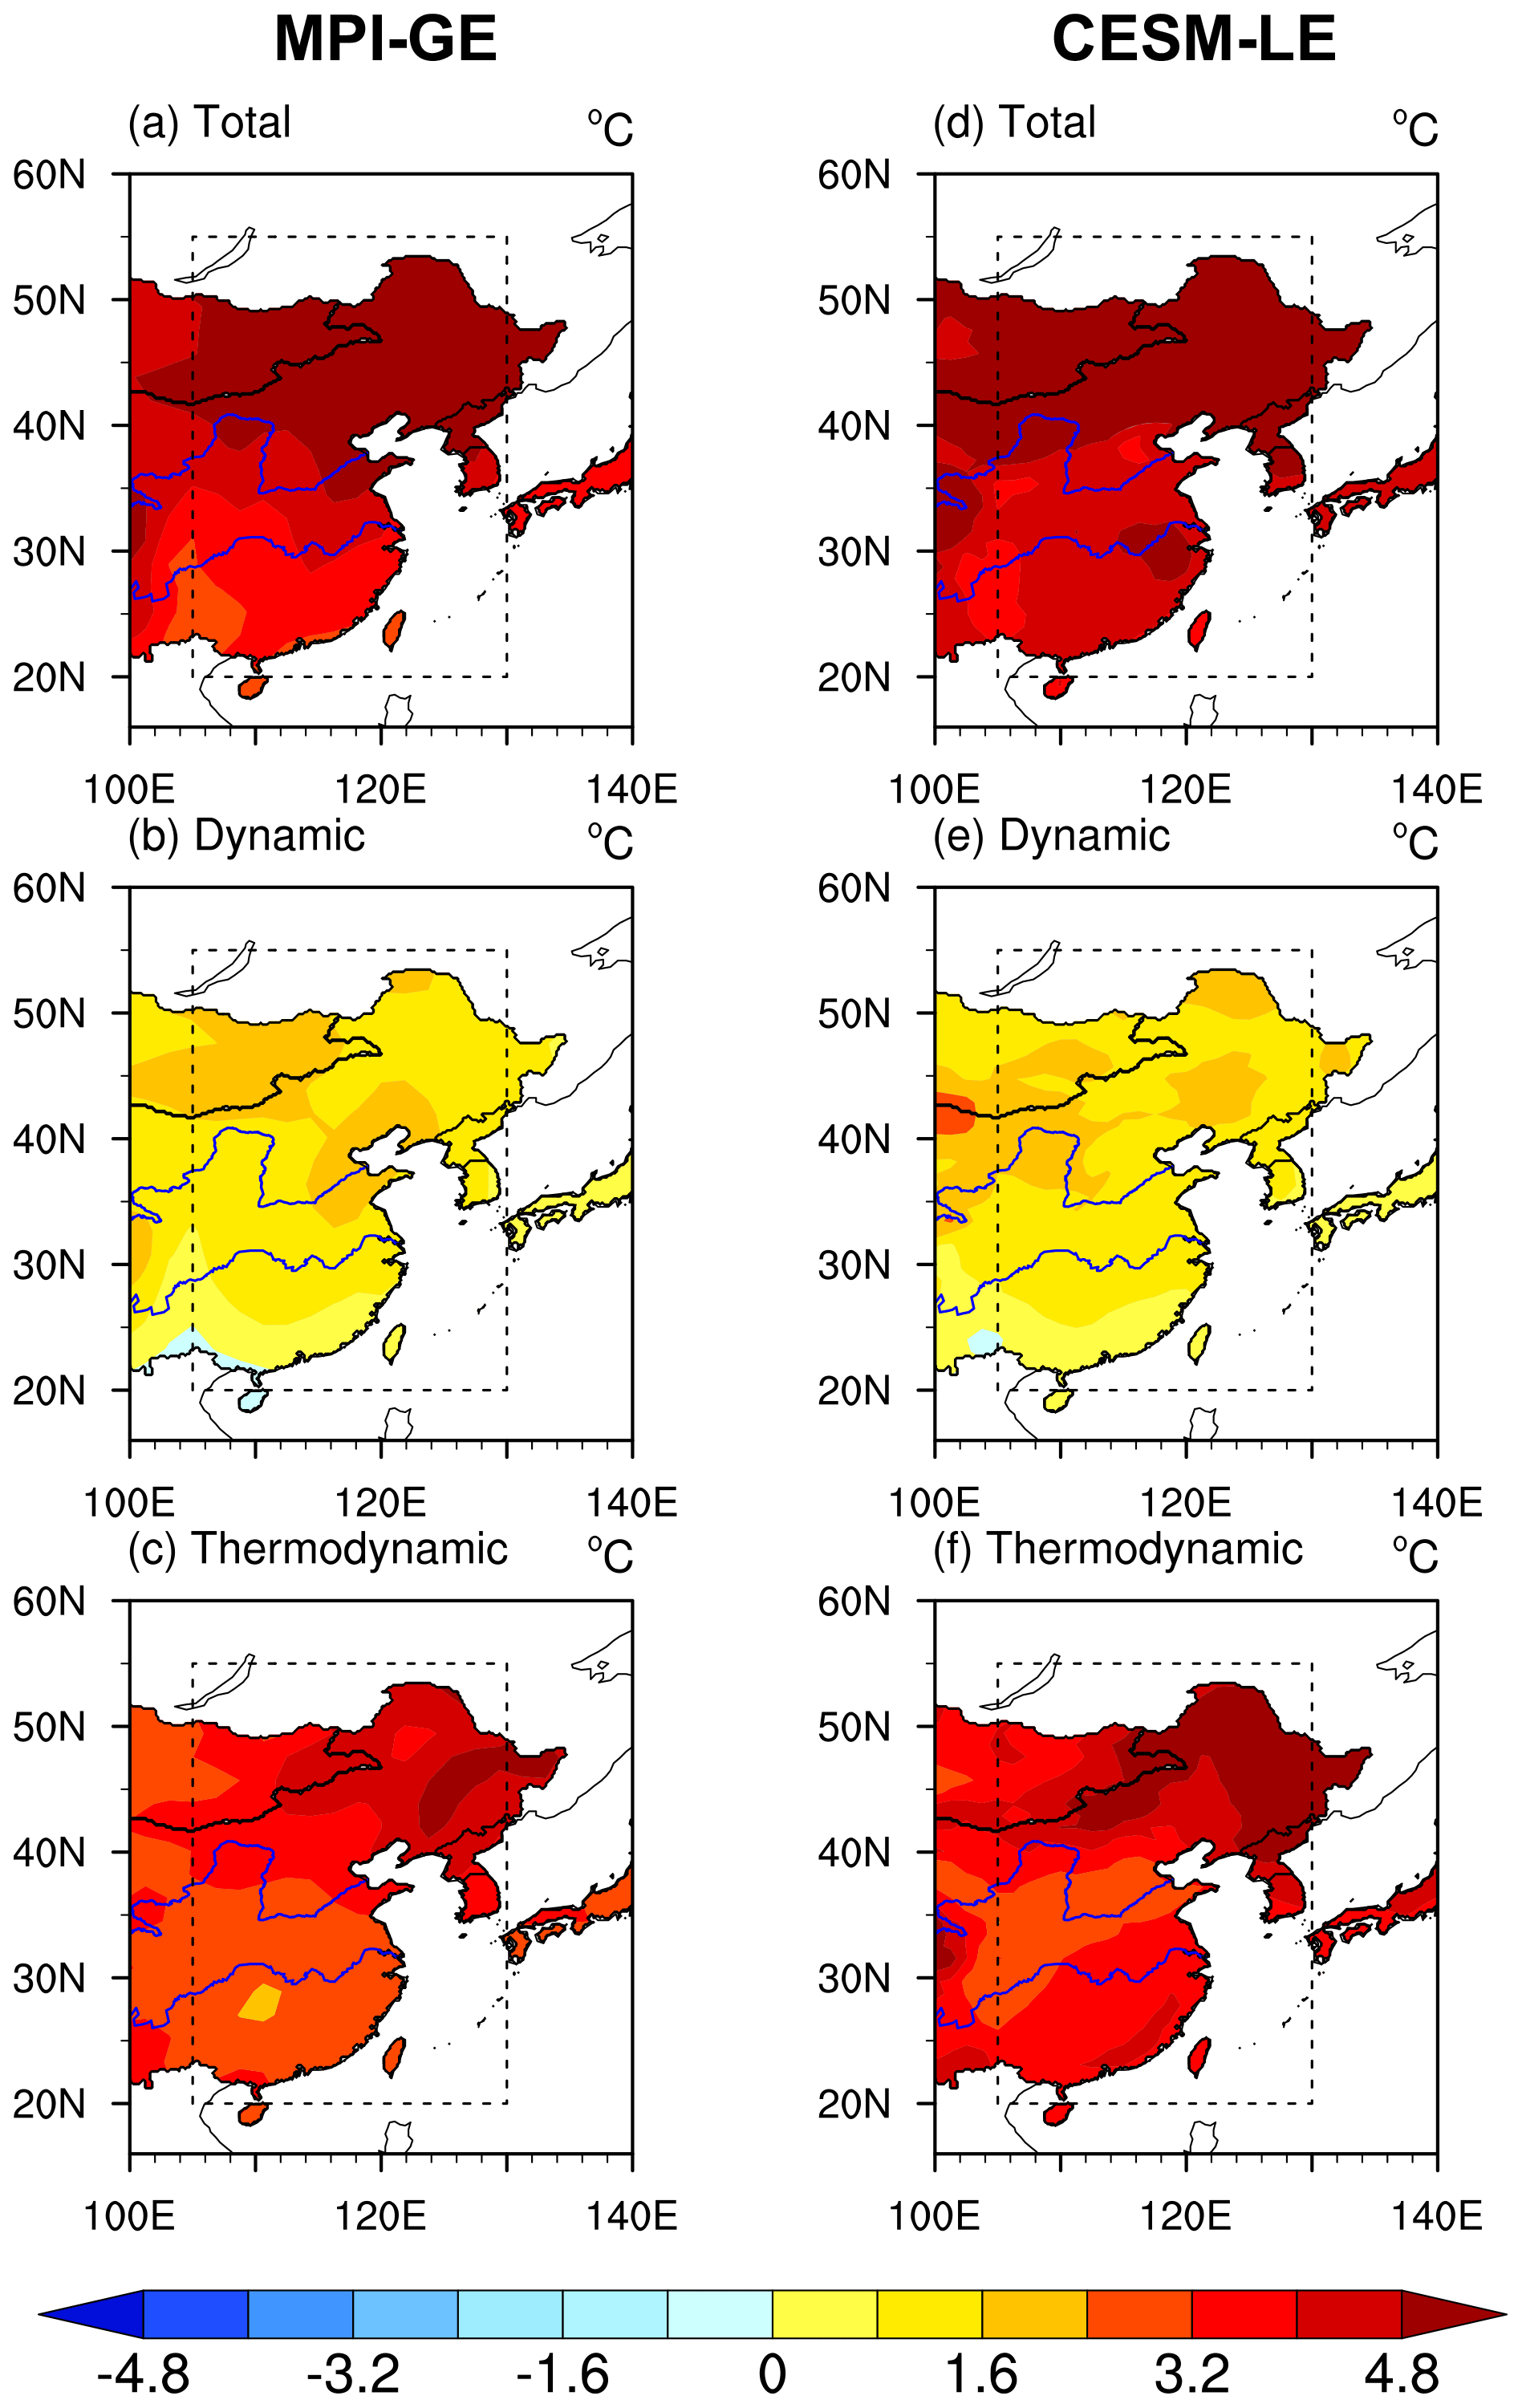
Figure 5Changes in East Asian cold-month SAT in the MPI-GE in 2079–2098 boreal winter relative to 1986–2005 boreal winter: (a) total, (b) dynamic component, and (c) thermodynamic component. Panels (d)–(f) correspond to panels (a)–(c) but for the results in the CESM-LE.
We extend the analysis from the changes in the intensity of cold extremes to the changes in the occurrence probability ratio of the present-day cold extremes in the future warm climate (Fig. 4b). The 20-year running occurrence probability ratio of the present-day cold extremes will rapidly decrease under the RCP8.5 scenario in both sets of the large-ensemble model simulations. In the MPI-GE, the occurrence probability ratio of the present-day cold extremes will decrease to 0.05 in the period from 2036 to 2055 (Fig. 4b), which means the present-day cold extremes will almost never occur after 2036. We isolate the dynamic and thermodynamic contributions to the changes in the occurrence probability ratio of the present-day cold extremes. If we hold the dynamic component constant at the present-day level and allow the thermodynamic component to evolve according to the model projection, the year when the occurrence probability ratio of the present-day cold extremes will decrease to 0.05 is approximately 10 years later than the time mentioned above (Fig. 4b). Correspondingly, if we hold the thermodynamic component constant at the present-day level and allow the dynamic component to evolve according to the model projection, the occurrence probability ratio of the present-day cold extremes will decrease to about 0.3 at the end of the 21st century. From the perspective of spatial distribution, the occurrence probability ratio of the present-day cold extremes will be decreased to 0.05 before 2040 in parts of southeastern China, northeastern China, and the Korean Peninsula (Fig. 6a). The results in the CESM-LE are generally consistent with those in the MPI-GE (Figs. 4d and 6b). The occurrence probability ratio of the present-day cold extremes will decrease to 0.05 in 2035–2054 (Fig. 4d), and the occurrence probability ratio also decreases faster in southeastern China, parts of northeastern China, and the southern Korean Peninsula (Fig. 6b). Different from the MPI-GE, the occurrence probability ratio of the present-day cold extremes will decrease to 0.05 after 2060 in parts of northern China in the CESM-LE (Fig. 6b).
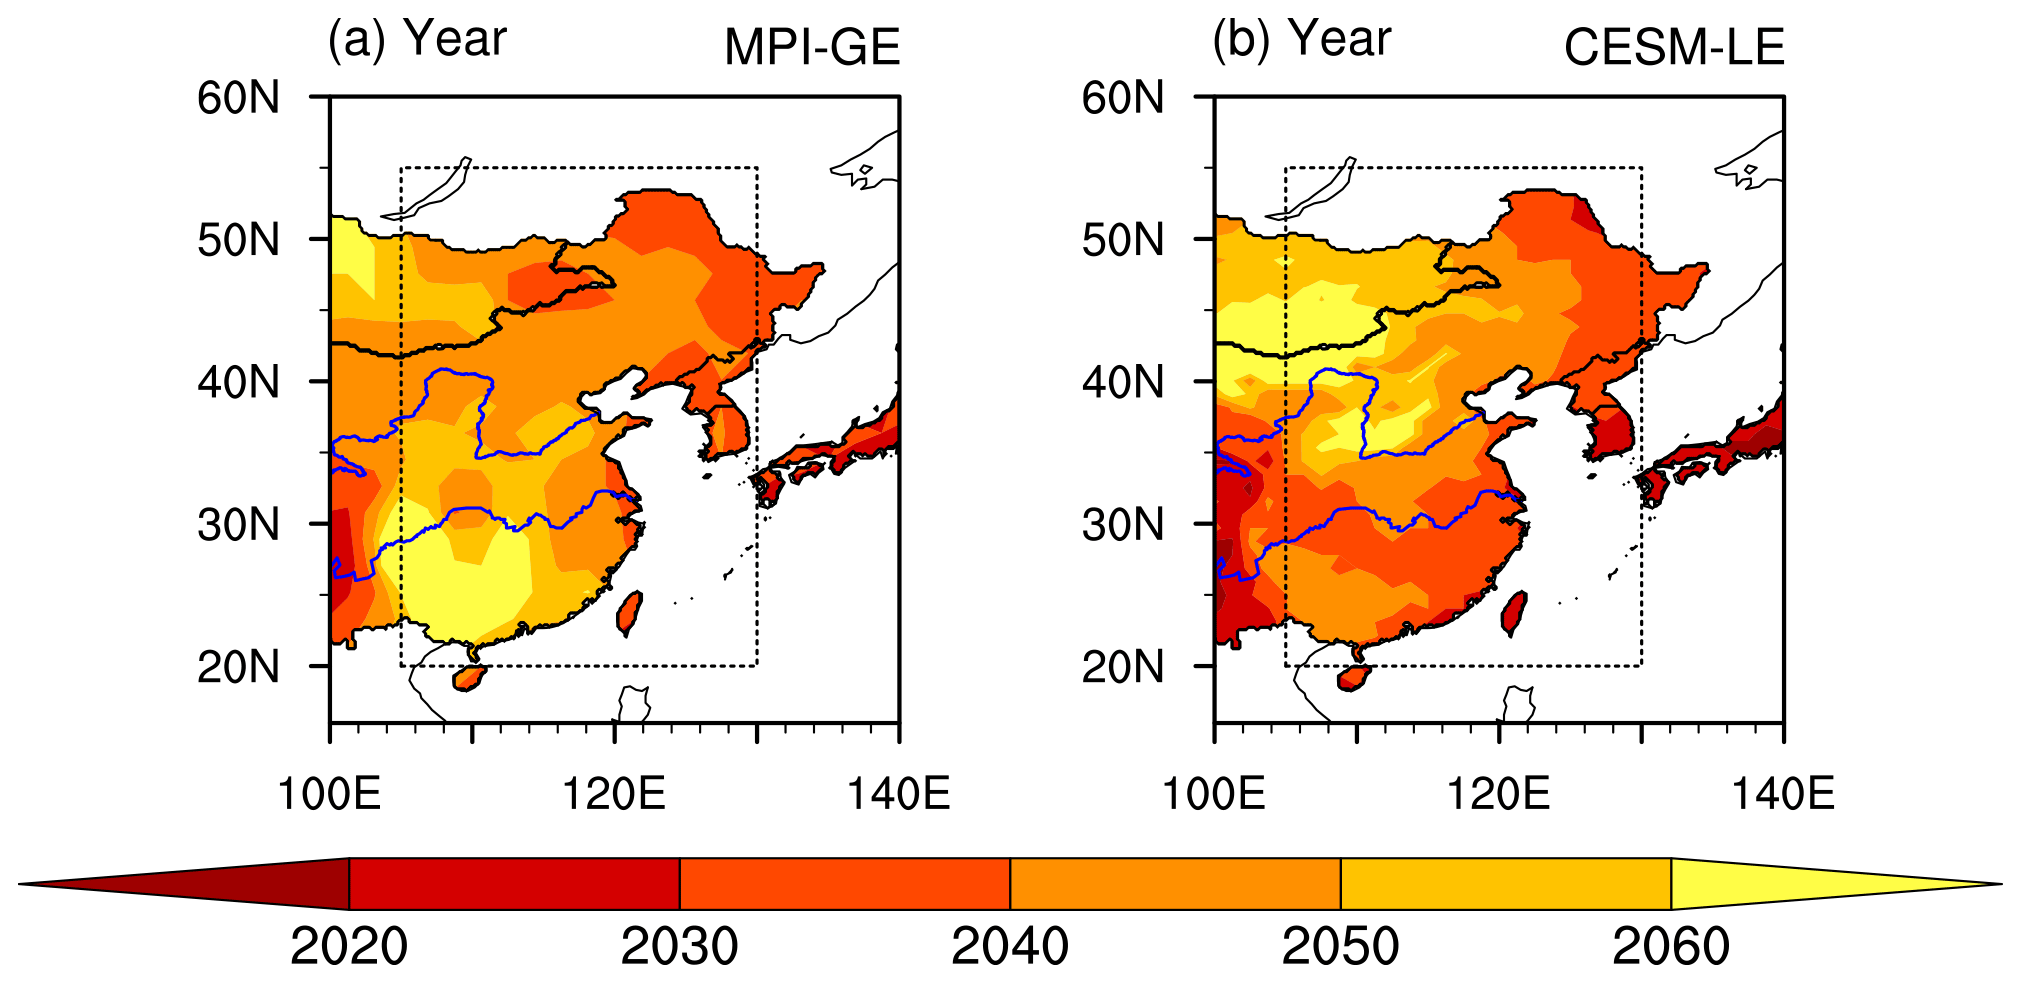
Figure 6The year when the occurrence probability ratio of the present-day (1986–2005 boreal winter) East Asian cold extremes decreases to 0.05 in (a) the MPI-GE and (b) the CESM-LE.
The thermodynamic component dominates the future decrease in the intensity and occurrence probability of East Asian cold extremes, while the dynamic component is also contributive. Dynamic change accounts for approximately one-quarter of the total change in the intensity of cold extremes by the end of the 21st century. We further examine the changes in SLP anomalies associated with East Asian cold extremes (Figs. 7 and 8).
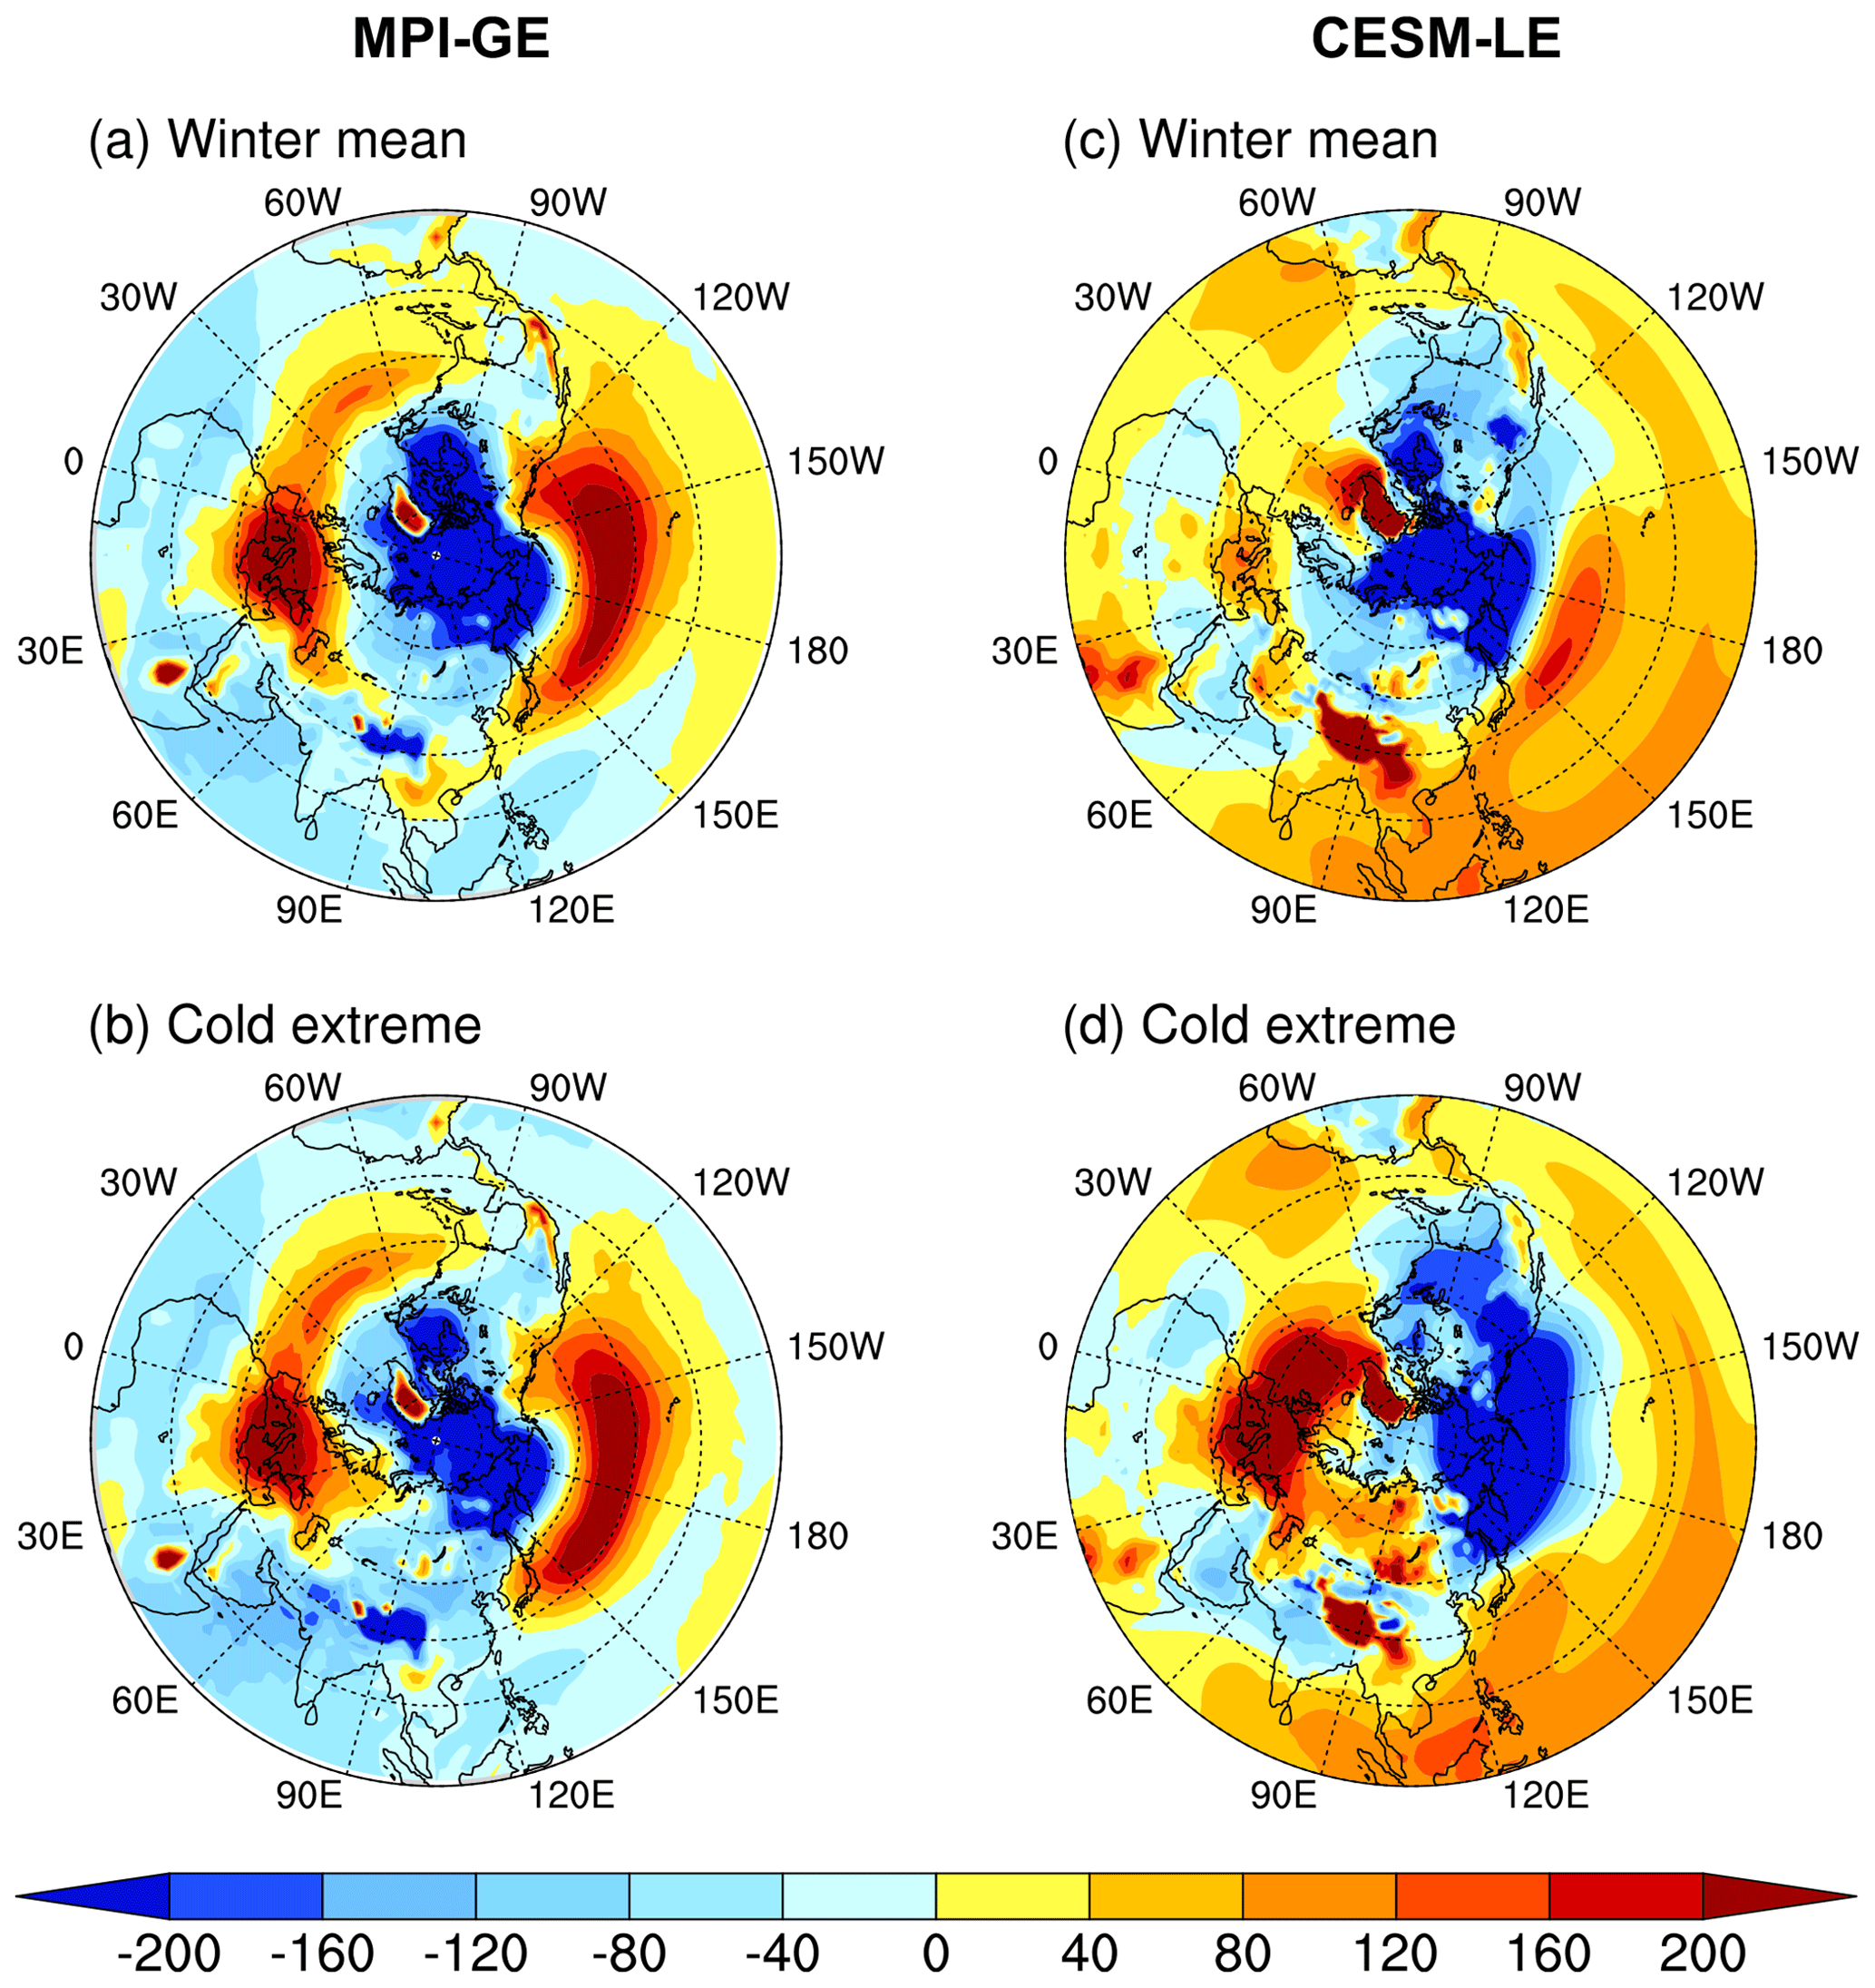
Figure 7Changes in SLP for (a) total winter months and (b) cold months in 2079–2098 boreal winter relative to 1986–2005 boreal winter in the MPI-GE. Panels (c) and (d) correspond to panels (a) and (b) but for the results in the CESM-LE.
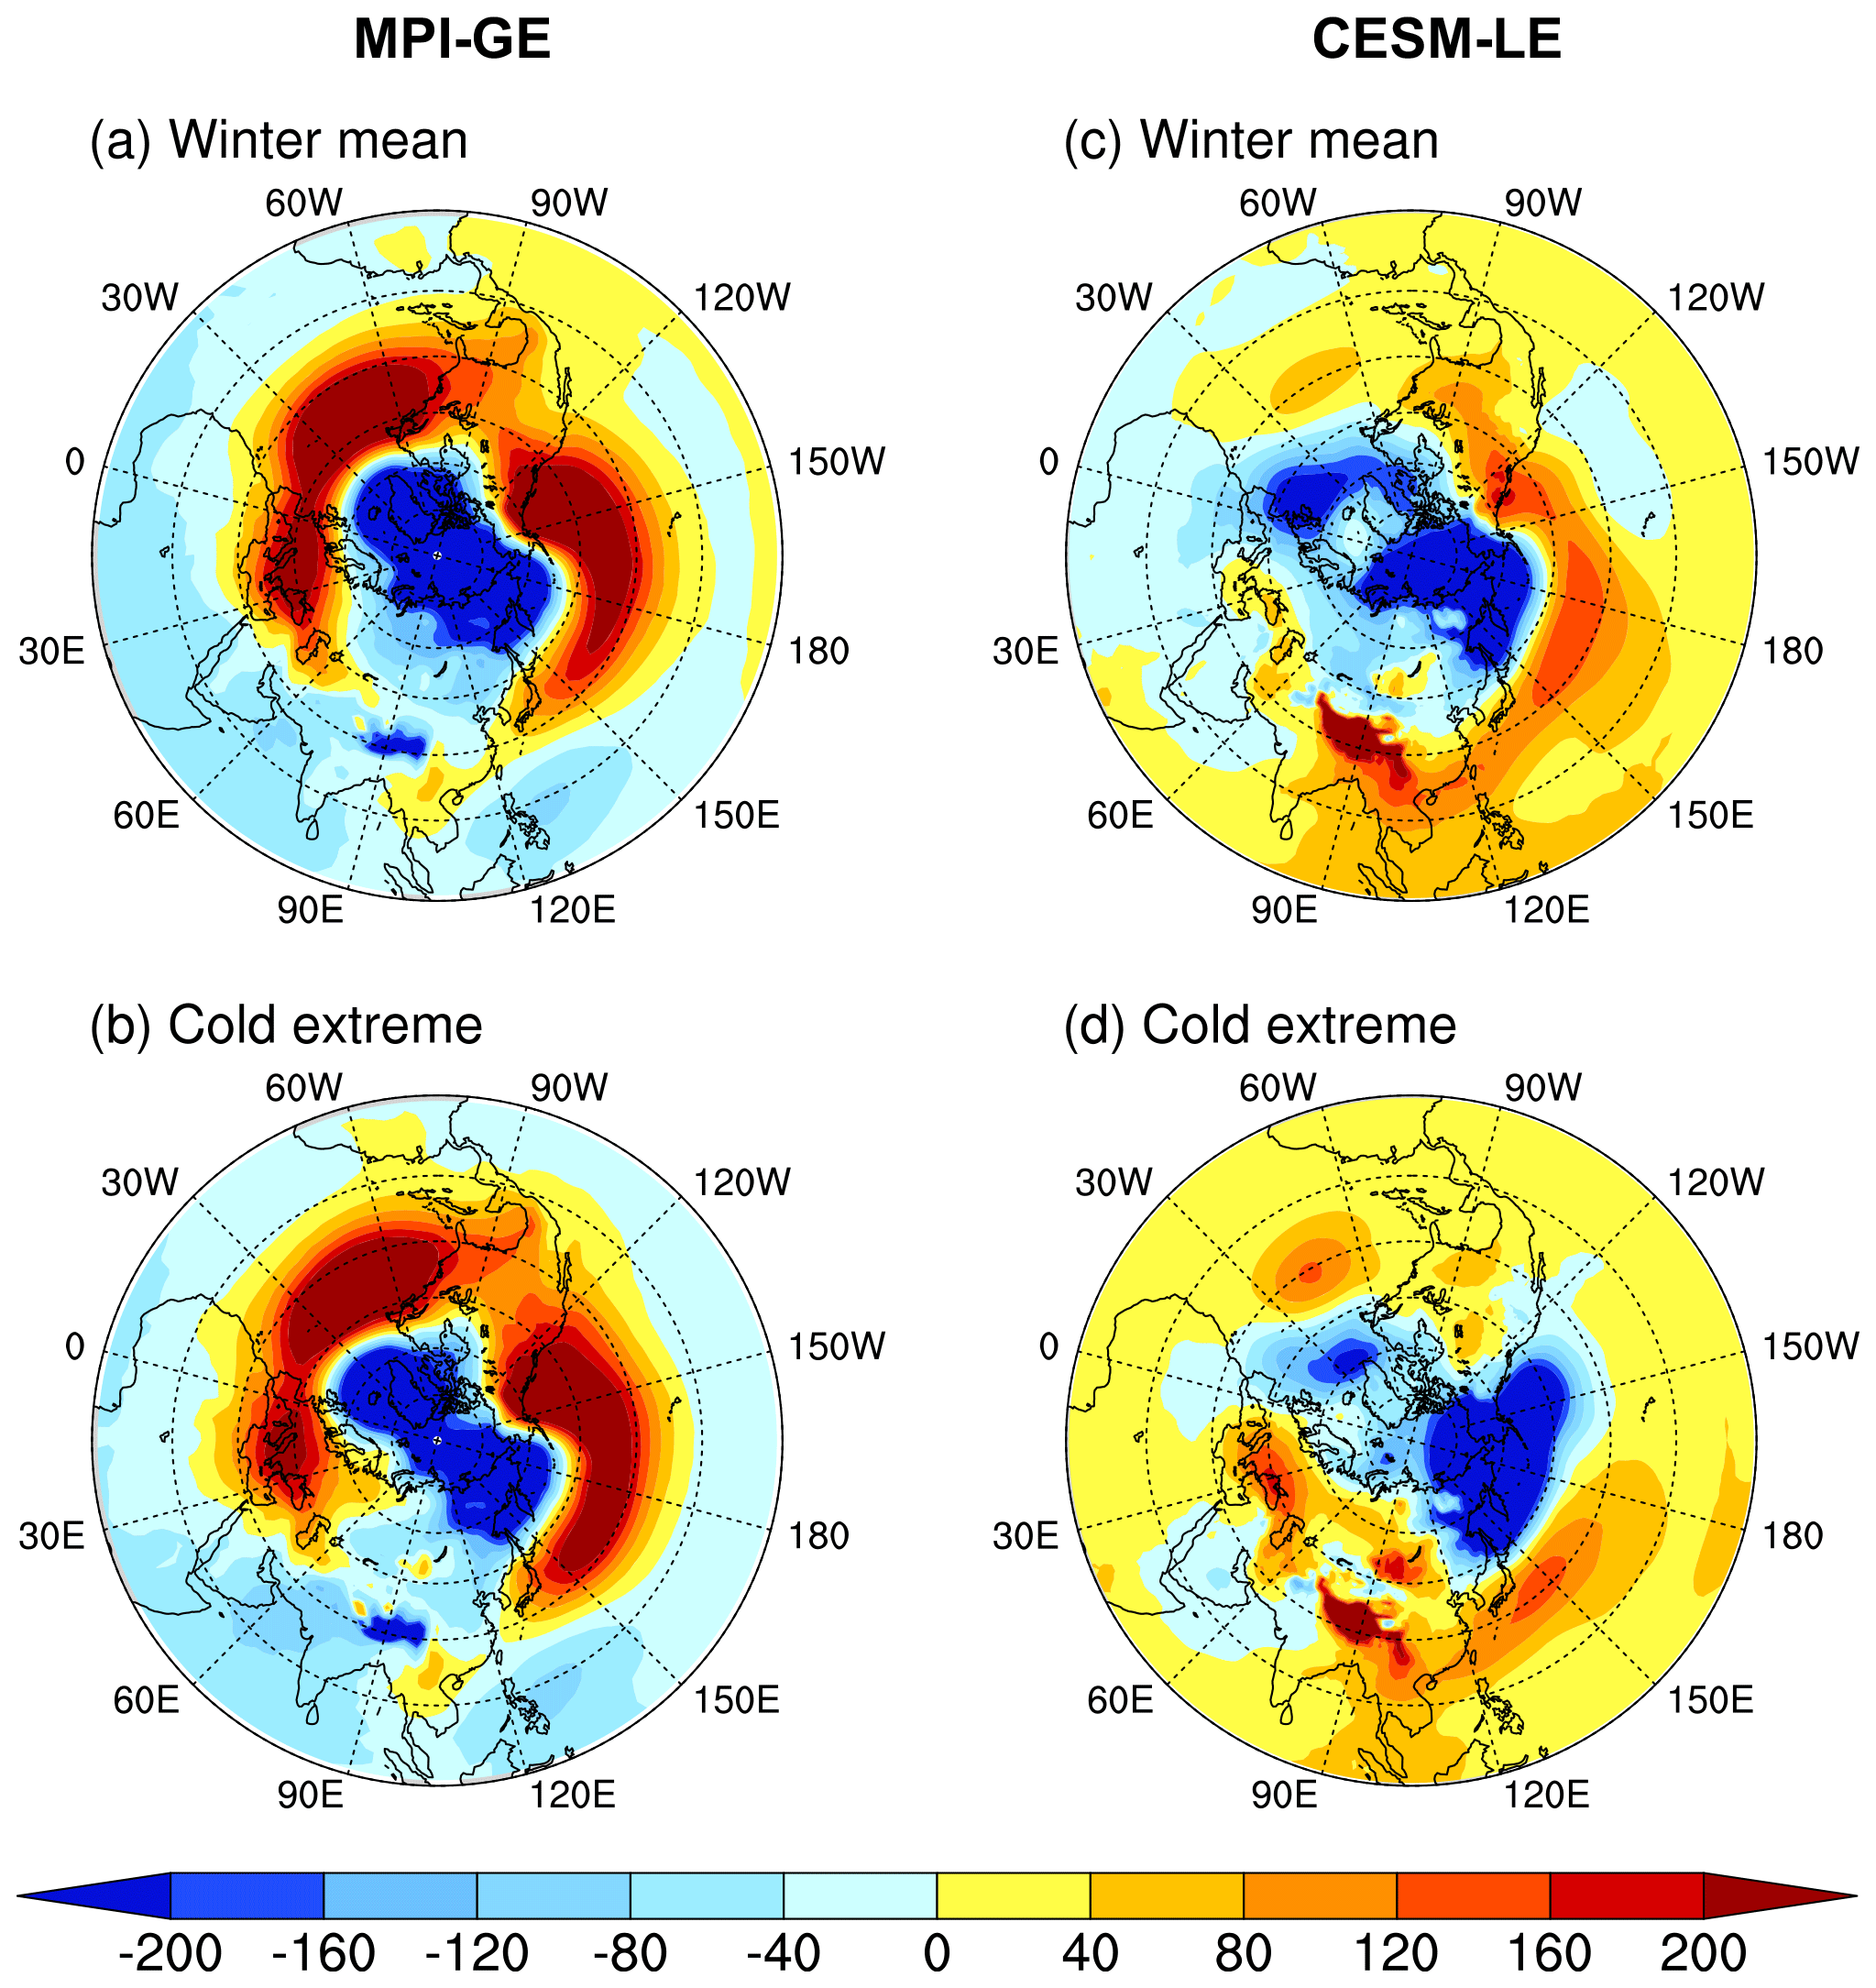
Figure 8Changes in the dynamic component of SLP for (a) total winter months and (b) cold months in 2079–2098 boreal winter relative to 1986–2005 boreal winter in the MPI-GE. Panels (c) and (d) correspond to panels (a) and (b), but for the results in the CESM-LE.
Similar to the previous studies (Fyfe et al., 1999; Cai et al., 2017; Kitoh, 2017), the projected changes in SLP exhibit a positive AO-like pattern, especially in MPI-GE (Fig. 7). The pattern correlation coefficients between the SLP changing patterns and the positive phase of AO in MPI-GE and CESM-LE are approximately 0.7 and 0.4, respectively (Fig. 7a and c). The winter-mean SLP will be reduced in the Arctic regions and enhanced in the mid-latitude regions. The AO shows a highly positive correlation with the winter SAT anomaly over East Asia, especially the northern part, and the positive phase of AO is favourable for warm winter over East Asia (Gong et al., 2019; Wang et al., 2019). The SLP changing patterns in cold months (Fig. 7b and d) are similar to those in winter mean (Fig. 7a and c), and this is possibly the reason for the positive contribution of dynamic effects to the increase in SAT anomaly in cold months. We also construct the changes in the dynamic component of SLP (Fig. 8). Changes in the dynamic component of SLP also corroborate that the circulation changes are not favourable for the occurrence of East Asian cold extremes. There are some differences in the SLP changing patterns between the two model ensembles, particularly during cold extremes over the Eurasian region. This could be one of the possible reasons for the differences in local dynamic changes in the two model ensembles.
4.1 Summary
Based on the dynamic adjustment approach, we utilized two sets of large-ensemble model simulations in the MPI-GE and CESM-LE to investigate the contributions of the background warming (thermodynamic effect) and circulation changes (dynamic effect) to the East Asian cold extremes. The contributions of the two components to the East Asian cold extremes are quantitatively evaluated in the recent decades and under future warming. The main conclusions are summarized as follows.
-
The observed cold extremes in the past decades are mainly caused by the internal variability of atmospheric circulations. Compared to cold extremes in the 1960s and 1970s, the percentage contribution of dynamic component to the cold extreme in recent years is higher. Both MPI-GE and the CESM-LE are consistent in revealing the typical circulation anomalies associated with the East Asian cold extremes. Compared with the observation, the contribution of the dynamic component to the cold extremes is more evident in the two model ensembles, and the dynamic component accounts for more than 80 % of the total cold-month SAT anomalies in the past 5 decades.
-
In the future warm climate, the decreases in the intensity and occurrence probability of East Asian cold extremes are dominated by thermodynamic component, while the dynamic component is also contributive. According to MPI-GE and CESM-LE, compared with the present day, the mean intensity of the East Asian cold extremes will decrease by approximately 5 °C at the end of the 21st century under the RCP8.5 scenario, and the dynamic component contributes to a quarter of this decrease. The occurrence probability ratio of the present-day cold extremes will almost never occur after around 2035, and if we hold the dynamic component constant at the present-day level, this will happen approximately 10 years later.
-
Positive AO-like sea level pressure pattern upward trend is projected in both of the model ensembles, which is unfavourable to the occurrence of East Asian cold extremes. There are a few differences between the two ensemble projections, particularly in the Eurasian region during cold extremes, and this could be one of the possible reasons for the local differences of dynamic components in the two model ensembles.
4.2 Discussion
Substantial efforts have been devoted so far to understanding the response of climate extremes to global warming (e.g. Alexander et al., 2006; Sanderson et al., 2017; Zhang et al., 2018; AghaKouchak et al., 2020; Li et al., 2021), as well as their physical mechanisms (Cattiaux et al., 2010; Peings and Magnusdottir, 2014; Westra et al., 2014; Boschat et al., 2015; Horton et al., 2015; Qian et al., 2018). In particular, the thermodynamic processes (i.e. direct results of global warming) of changes in climate extremes have been well demonstrated. However, it remains ambiguous regarding how the dynamic processes will change under global warming, which is an important source of projection uncertainty for climate extremes (Shepherd, 2014; Norris et al., 2019). Hence, it is of vital importance to understand the dynamic changes of climate extremes, in order to improve the reliability of extreme climate projections.
In this study, we used two sets of large-ensemble simulation data and a dynamic adjust method to investigate the future change of cold extremes in East Asia, with a focus on understanding the thermodynamic and dynamic processes. Our results consistently show that the thermodynamic process is the dominant factor of future changes in East Asian cold extreme, with the contribution of dynamic process accounting for approximately one-quarter of the total change. In addition, the change in the dynamic component is attributed to the upward trend of a positive AO-like sea level pressure pattern, and this has been supported by previous studies (Fyfe et al., 1999; Cai et al., 2017; Kitoh, 2017).
AO is the main circulation mode in the non-tropical regions of the Northern Hemisphere in winter (Thompson and Wallace, 1998) and has a significant impact on the winter climate in East Asia (Gong et al., 2001). However, it is worth noting that future winter temperature changes in East Asia may also be impacted by other large-scale circulation factors (Zhou et al., 2007; Cheung et al., 2012; He and Wang, 2013). The quantitative impacts of potential future changes of different circulation factors on cold extremes in East Asia remain unclear and require further investigation in future research.
The MPI-GE experiment products can be downloaded from https://esgf-data.dkrz.de/search/mpi-ge/ (Maher et al., 2019). The specific experiments or variables can be selected through the navigation bar on the left-hand side. The monthly sea level pressure (psl), surface air temperature (tas), three-dimensional wind field (ua, va, wap), and geopotential height (zg) from the piControl, historical, and rcp85 experiments are used in this work.
The CESM-LE experiment products can be downloaded from https://www.earthsystemgrid.org/dataset/ucar.cgd.ccsm4.cesmLE.html (Kay et al., 2015).
TZ designed the study. DL performed the data analysis, produced the figures, and wrote the manuscript draft. YQ and CL collected the datasets. LZ, WZ, and XC contributed to the analysis methods. All the authors contributed to the discussion, writing, and editing of the manuscript.
The contact author has declared that none of the authors has any competing interests.
Publisher's note: Copernicus Publications remains neutral with regard to jurisdictional claims made in the text, published maps, institutional affiliations, or any other geographical representation in this paper. While Copernicus Publications makes every effort to include appropriate place names, the final responsibility lies with the authors.
This research has been supported by the National Natural Science Foundation of China (grant nos. 42105031 and 41988101) and the German Research Foundation (DFG, Clusters of Excellence CLICCS (EXC2037), University of Hamburg).
This paper was edited by Kevin Grise and reviewed by three anonymous referees.
AghaKouchak, A., Chiang, F., Huning, L. S., Love, C. A., Mallakpour, I., Mazdiyasni, O., Moftakhari, H., Papalexiou, S. M., Ragno, E., and Sadegh, M.: Climate extremes and compound hazards in a warming world, Ann. Rev. Earth Planet. Sci., 48, 519–548, https://doi.org/10.1146/annurev-earth-071719-055228, 2020.
Alexander, L. V., Zhang, X., Peterson, T. C., Caesar, J., Gleason, B., Klein Tank, A. M. G., Haylock, M., Collins, D., Trewin, B., Rahimzadeh, F., Tagipour, A., Rupa Kumar, K., Revadekar, J., Griffiths, G., Vincent, L., Stephenson, D. B., Burn, J., Aguilar, E., Brunet, M., Taylor, M., New, M., Zhai, P., Rusticucci, M., and Vazquez-Aguirre, J. L.: Global observed changes in daily climate extremes of temperature and precipitation, J. Geophys. Res.-Atmos., 111, D05109, https://doi.org/10.1029/2005JD006290, 2006.
Andreescu, M. P. and Frost, D. B.: Weather and traffic accidents in Montreal, Canada, Clim. Res., 9, 225–230, https://doi.org/10.3354/cr009225, 1998.
Boschat, G., Pezza, A., Simmonds, I., Perkins, S., Cowan, T., and Purich, A.: Large scale and sub-regional connections in the lead up to summer heat wave and extreme rainfall events in eastern Australia, Clim. Dynam., 44, 1823–1840, https://doi.org/10.1007/s00382-014-2214-5, 2015.
Cai, W., Li, K., Liao, H., Wang, H., and Wu, L.: Weather conditions conducive to Beijing severe haze more frequent under climate change, Nat. Clim. Change, 7, 257–262, https://doi.org/10.1038/nclimate3249, 2017.
Cattiaux, J., Vautard, R., Cassou, C., Yiou, P., Masson-Delmotte, V., and Codron, F.: Winter 2010 in Europe: A cold extreme in a warming climate, Geophys. Res. Lett., 37, D05109, https://doi.org/10.1029/2010GL044613, 2010.
Cheung, H. N., Zhou, W., Mok, H. Y., and Wu, M. C.:. Relationship between Ural– Siberian blocking and the East Asian winter monsoon in relation to the Arctic Oscillation and the El Niño–Southern Oscillation, J. Climate, 25, 4242–4257, https://doi.org/10.1175/JCLI-D-11-00225.1, 2012.
Compo, G. P., Whitaker, J. S., Sardeshmukh, P. D., Matsui, N., Allan, R. J., Yin, X., Gleason, B. E., Vose, R. S., Rutledge, G., Bessemoulin, P., Brönnimann, S., Brunet, M., Crouthamel, R. I., Grant, A. N., Groisman, P. Y., Jones, P. D., Kruk, M. C., Kruger, A. C., Marshall, G. J., Maugeri, M., Mok, H. Y., Nordli, Ø., Ross, T. F., Trigo, R. M., Wang, X. L., Woodruff, S. D., and Worley, S. J.: The twentieth century reanalysis project, Q. J. Roy. Meteor. Soc., 137, 1–28, https://doi.org/10.1002/qj.776, 2011.
Deser, C., Terray, L., and Phillips, A. S.: Forced and internal components of winter air temperature trends over North America during the past 50 years: Mechanisms and implications, J. Climate, 29, 2237–2258, https://doi.org/10.1175/JCLI-D-15-0304.1, 2016.
Donat, M. G. and Alexander, L. V.: The shifting probability distribution of global daytime and night-time temperatures, Geophys. Res. Lett., 39, L14707, https://doi.org/10.1029/2012GL052459, 2012.
Fischer, E. M., Lawrence, D. M., and Sanderson, B. M.: Quantifying uncertainties in projections of extremes – A perturbed land surface parameter experiment, Clim. Dynam., 37, 1381–1398, https://doi.org/10.1007/s00382-010-0915-y, 2011.
Francis, J. A. and Vavrus, S. J.: Evidence linking Arctic amplification to extreme weather in mid-latitudes, Geophys. Res. Lett., 39, L06801, https://doi.org/10.1029/2012GL051000, 2012.
Fyfe, J. C., Boer, G. J., and Flato, G. M.: The Arctic and Antarctic Oscillations and their projected changes under global warming, Geophys. Res. Lett., 26, 1601–1604, https://doi.org/10.1029/1999GL900317, 1999.
Gong, D. Y., Wang, S. W., and Zhu, J. H.: East Asian winter monsoon and Arctic oscillation, Geophys. Res. Lett., 28, 2073–2076, https://doi.org/10.1029/2000GL012311, 2001.
Gong, H., Wang, L., Chen, W., and Wu, R.: Attribution of the East Asian winter temperature trends during 1979–2018: Role of external forcing and internal variability, Geophys. Res. Lett., 46, 10874–10881, https://doi.org/10.1029/2019GL084154, 2019.
Gong, H., Wang, L., Chen, W., and Wu, R.: Evolution of the East Asian winter land temperature trends during 1961–2018: role of internal variability and external forcing, Environ. Res. Lett., 16, 024015, https://doi.org/10.1088/1748-9326/abd586, 2021.
Guo, R., Deser, C., Terray, L., and Lehner, F.: Human influence on winter precipitation trends (1921–2015) over North America and Eurasia revealed by dynamical adjustment, Geophys. Res. Lett., 46, 3426–3434, https://doi.org/10.1029/2018GL081316, 2019.
Harris, I. P. D. J., Jones, P. D., Osborn, T. J., and Lister, D. H.: Updated high- resolution grids of monthly climatic observations – the CRU TS3.10 Dataset, Int. J. Climatol., 34, 623–642, https://doi.org/10.1002/joc.3711, 2014.
He, S. and Wang, H.: Oscillating relationship between the East Asian winter monsoon and ENSO, J. Climate, 26, 9819–9838, https://doi.org/10.1175/JCLI-D-13-00174.1, 2013.
He, S., Gao, Y., Li, F., Wang, H., and He, Y.: Impact of Arctic Oscillation on the East Asian climate: A review, Earth-Sci. Rev., 164, 48–62, https://doi.org/10.1016/j.earscirev.2016.10.014, 2017.
Horton, D. E., Johnson, N. C., Singh, D., Swain, D. L., Rajaratnam, B., and Diffenbaugh, N. S.: Contribution of changes in atmospheric circulation patterns to extreme temperature trends, Nature, 522, 465–469, https://doi.org/10.1038/nature14550, 2015.
Hu, K., Huang, G., and Xie, S. P.: Assessing the internal variability in multi- decadal trends of summer surface air temperature over East Asia with a large ensemble of GCM simulations, Clim. Dynam., 52, 6229–6242, https://doi.org/10.1007/s00382-018-4503-x, 2019.
IPCC: Climate Change 2021, The Physical Science Basis, Contribution of Working Group I to the Sixth Assessment Report of the Intergovernmental Panel on Climate Change, edited by: Masson-Delmotte, V., Zhai, P., Pirani, A., Connors, S. L., Péan, C., Berger, S., Caud, N., Chen, Y., Goldfarb, L., Gomis, M. I., Huang, M., Leitzell, K., Lonnoy, E., Matthews, J. B. R., Maycock, T. K., Waterfield, T., Yelekçi, O., Yu, R., and Zhou, B., Cambridge University Press, Cambridge, United Kingdom and New York, NY, USA, 2391 pp., https://doi.org/10.1017/9781009157896, 2021.
Jiang, D. and Tian, Z.: East Asian monsoon change for the 21st century: Results of CMIP3 and CMIP5 models, Chin. Sci. Bull., 58, 1427–1435, https://doi.org/10.1007/s11434-012-5533-0, 2013.
Jones, G. S., Stott, P. A., and Christidis, N.: Human contribution to rapidly increasing frequency of very warm Northern Hemisphere summers, J. Geophys. Res.-Atmos., 113, D02109, https://doi.org/10.1029/2007JD008914, 2008.
Kay, J. E., Deser, C., Phillips, A., Mai, A., Hannay, C., Strand, G., Arblaster, J. M., Bates, S. C., Danabasoglu, G., Edwards, J., Holland, M., Kushner, P., Lamarque, J. F., Lawrence, D., Lindsay, K., Middleton, A., Munoz, E., Neale, R., Oleson, K., Polvani, L., and Vertenstein, M.: The community earth system model (CESM) large ensemble project: A community resource for studying climate change in the presence of internal climate variability, B. Am. Meteorol. Soc., 96, 1333–1349, https://doi.org/10.1175/BAMS-D-13-00255.1, 2015 (data available at: https://www.earthsystemgrid.org/dataset/ucar.cgd.ccsm4.cesmLE.html, last access: 13 June 2024).
Kharin, V. V., Zwiers, F. W., Zhang, X., and Wehner, M.: Changes in temperature and precipitation extremes in the CMIP5 ensemble, Climatic Change, 119, 345–357, https://doi.org/10.1007/s10584-013-0705-8, 2013.
Kharin, V. V., Flato, G. M., Zhang, X., Gillett, N. P., Zwiers, F., and Anderson, K. J.: Risks from Climate Extremes Change Differently from 1.5 °C to 2.0 °C Depending on Rarity, Earths Future, 6, 704–715, https://doi.org/10.1002/2018EF000813, 2018.
Kitoh, A.: The Asian Monsoon and its Future Change in Climate Models: A Review, J. Meteor. Soc. Jpn., 95, 7–33, https://doi.org/10.2151/jmsj.2017-002, 2017.
Lee, S. H.: The January 2021 sudden stratospheric warming, Weather, 76, 135–136, https://doi.org/10.1002/wea.3966, 2021.
Li, C., Stevens, B., and Marotzke, J.: Eurasian winter cooling in the warming hiatus of 1998–2012, Geophys. Res. Lett., 42, 8131–8139, https://doi.org/10.1002/2015GL065327, 2015.
Li, C., Zwiers, F., Zhang, X., Li, G., Sun, Y., and Wehner, M.: Changes in annual extremes of daily temperature and precipitation in CMIP6 models, J. Climate, 34, 3441–3460, https://doi.org/10.1175/JCLI-D-19-1013.1, 2021.
Lu, Q., Rao, J., Liang, Z., Guo, D., Luo, J., Liu, S., Wang, C., and Wang, T.: The sudden stratospheric warming in January 2021, Environ. Res. Lett., 16, 084029, https://doi.org/10.1088/1748-9326/ac12f4, 2021.
Luo, D., Yao, Y., Dai, A., Simmonds, I., and Zhong, L: Increased quasi stationarity and persistence of winter Ural blocking and Eurasian extreme cold events in response to Arctic warming. Part II: A theoretical explanation, J. Climate, 30, 3569–3587, https://doi.org/10.1175/JCLI-D-16-0262.1, 2017.
Ma, S., Zhou, T., Angélil, O., and Shiogama, H.: Increased chances of drought in southeastern periphery of the Tibetan Plateau induced by anthropogenic warming, J. Climate, 30, 6543–6560, https://doi.org/10.1175/JCLI-D-16-0636.1, 2017a.
Ma, S., Zhou, T., Stone, D. A., Angélil, O., and Shiogama, H.: Attribution of the July–August 2013 heat event in central and eastern China to anthropogenic greenhouse gas emissions, Environ. Res. Lett., 12, 054020, https://doi.org/10.1088/1748-9326/aa69d2, 2017b.
Ma, S., Zhu, C., Liu, B., Zhou, T., Ding, Y., and Orsolini, Y. J.: Polarized response of East Asian winter temperature extremes in the era of Arctic warming, J. Climate, 31, 5543–5557, https://doi.org/10.1175/JCLI-D-17-0463.1, 2018.
Maher, N., Milinski, S., Suarez-Gutierrez, L., Botzet, M., Dobrynin, M., Kornblueh, L., Kröger, J., Takano, Y., Ghosh, R., Hedemann, C., Li, C., Li, H., Manzini, E., Notz, D., Putrasahan, D., Boysen, L., Claussen, M., Ilyina, T., Olonscheck, D., Raddatz, T., Stevens, B., and Marotzke, J.: The Max Planck Institute Grand Ensemble: enablingthe exploration of climate system variability, J. Adv. Model. Earth Syst., 11, 2050–2069, https://doi.org/10.1029/2019MS001639, 2019 (data available at: https://esgf-data.dkrz.de/search/mpi-ge/, last access: 13 June 2024).
McCusker, K. E., Fyfe, J. C., and Sigmond, M.: Twenty-five winters of unexpected Eurasian cooling unlikely due to Arctic sea-ice loss, Nat. Geosci., 9, 838–842, https://doi.org/10.1038/ngeo2820, 2016.
Mori, M., Watanabe, M., Shiogama, H., Inoue, J., and Kimoto, M.: Robust Arctic sea-ice influence on the frequent Eurasian cold winters in past decades, Nat. Geosci., 7, 869–873, https://doi.org/10.1038/ngeo2277, 2014.
Norris, J., Chen, G., and Neelin, J. D.: Thermodynamic versus dynamic controls on extreme precipitation in a warming climate from the Community Earth System Model Large Ensemble, J. Climate, 32, 1025–1045, https://doi.org/10.1175/jcli-d-18-0302.1, 2019.
Overland, J. E., Wood, K. R., and Wang, M.: Warm Arctic – cold continents: climate impacts of the newly open Arctic Sea, Polar Res., 30, 15787, https://doi.org/10.3402/polar.v30i0.15787, 2011.
Peings, Y. and Magnusdottir, G.: Response of the wintertime Northern Hemisphere atmospheric circulation to current and projected Arctic sea ice decline: A numerical study with CAM5, J. Climate, 27, 244–264, https://doi.org/10.1175/JCLI-D-13-00272.1, 2014.
Qian, C., Wang, J., Dong, S., Yin, H., Burke, C., Ciavarella, A., Dong B., Freychet, N., Lott, F. C., and Tett, S. F. B.: Human Influence on the Record-breaking Cold Event in January of 2016 in Eastern China, in: Explaining Extreme Events of 2016 from a Climate Perspective, B. Am. Meteorol. Soc., 99, S118–S122, https://doi.org/10.1175/BAMS-D-17-0095.1, 2018.
Rahimzadeh, F., Asgari, A., and Fattahi, E.: Variability of extreme temperature and precipitation in Iran during recent decades, Int. J. Climatol., 29, 329–343, https://doi.org/10.1002/joc.1739, 2009.
Räisänen, J. and Ylhäisi, J. S.: Cold months in a warming climate, Geophys. Res. Lett., 38, L22704, https://doi.org/10.1029/2011GL049758, 2011.
Röthlisberger, M. and Papritz, L.: A Global Quantification of the Physical Processes Leading to Near-Surface Cold Extremes, Geophys. Res. Lett., 50, e2022GL101670, https://doi.org/10.1029/2022GL101670, 2023.
Sanderson, B. M., Xu, Y., Tebaldi, C., Wehner, M., O'Neill, B., Jahn, A., Pendergrass, A. G., Lehner, F., Strand, W. G., Lin, L., Knutti, R., and Lamarque, J. F.: Community climate simulations to assess avoided impacts in 1.5 and 2 °C futures, Earth Syst. Dynam., 8, 827–847, https://doi.org/10.5194/esd-8-827-2017, 2017.
Seneviratne, S. I., Corti, T., Davin, E. L., Hirschi, M., Jaeger, E. B., Lehner, I., Orlowsky, B., and Teuling, A. J.: Investigating soil moisture–climate interactions in a changing climate: A review, Earth-Sci. Rev., 99, 125–161, https://doi.org/10.1016/j.earscirev.2010.02.004, 2010.
Shepherd, T. G.: Atmospheric circulation as a source of uncertainty in climate change projections, Nat. Geosci., 7, 703–708, https://doi.org/10.1038/ngeo2253, 2014.
Sheridan, S. C. and Allen, M. J.: Changes in the frequency and intensity of extreme temperature events and human health concerns, Curr. Clim. Change Rep., 1, 155–162, https://doi.org/10.1007/s40641-015-0017-3, 2015.
Simmonds, I.: Comparing and contrasting the behaviour of Arctic and Antarctic sea ice over the 35 year period 1979–2013, Ann. Glaciol., 56, 18–28, 2015.
Smoliak, B. V., Wallace, J. M., Lin, P., and Fu, Q.: Dynamical adjustment of the Northern Hemisphere surface air temperature field: Methodology and application to observations, J. Climate, 28, 1613–1629, https://doi.org/10.1175/JCLI-D-14-00111.1, 2015.
Steponkus, P. L.: Cold hardiness and freezing injury of agronomic crops, Adv. Agron., 30, 51–98, https://doi.org/10.1016/S0065-2113(08)60703-8, 1979.
Sun, L., Perlwitz, J., and Hoerling, M.: What caused the recent “Warm Arctic, Cold Continents” trend pattern in winter temperatures?, Geophys. Res. Lett., 43, 5345–5352, https://doi.org/10.1002/2016GL069024, 2016.
Sun, Y., Zhang, X., Zwiers, F. W., Song, L., Wan, H., Hu, T., Yin, H., and Ren, G.: Rapid increase in the risk of extreme summer heat in Eastern China, Nat. Clim. Change, 4, 1082–1085, https://doi.org/10.1038/nclimate2410, 2014.
Thompson, D. W. and Wallace, J. M.: The Arctic Oscillation signature in the wintertime geopotential height and temperature fields, Geophys. Res. Lett., 25, 1297–1300, https://doi.org/10.1029/98GL00950, 1998.
Thompson, D. W., Wallace, J. M., Jones, P. D., and Kennedy, J. J.: Identifying signatures of natural climate variability in time series of global-mean surface temperature: Methodology and insights, J. Climate, 22, 6120–6141, https://doi.org/10.1175/2009JCLI3089.1, 2009.
Thornton, H. E., Hoskins, B. J., and Scaife, A. A.: The role of temperature in the variability and extremes of electricity and gas demand in Great Britain, Environ. Res. Lett., 11, 114015, https://doi.org/10.1088/1748-9326/11/11/114015, 2016.
Trenary, L., DelSole, T., Tippett, M. K., and Doty B.: Extreme Eastern US Winter of 2015 Not Symptomatic of Climate Change, in: Explaining Extreme Events of 2016 from a Climate Perspective, B. Am. Meteorol. Soc., 97, S31–S35, https://doi.org/10.1175/BAMS-D-16-0156.1, 2016.
Wallace, J. M., Fu, Q., Smoliak, B. V., Lin, P., and Johanson, C. M.: Simulated versus observed patterns of warming over the extratropical Northern Hemisphere continents during the cold season, P. Natl Acad. Sci. USA, 109, 14337–14342, https://doi.org/10.1073/pnas.1204875109, 2012.
Walsh, J. E.: Intensified warming of the Arctic: Causes and impacts on middle latitudes, Global Planet. Change, 117, 52–63, https://doi.org/10.1016/j.gloplacha.2014.03.003, 2014.
Wang, C., Yao, Y., Wang, H., Sun, X., and Zheng, J.: The 2020 summer floods and 2020/21 winter extreme cold surges in China and the 2020 typhoon season in the western North Pacific, Adv. Atmos. Sci., 38, 896–904, https://doi.org/10.1007/s00376-021-1094-y, 2021.
Wang, L., Deng, A., and Huang, R.: Wintertime internal climate variability over Eurasia in the CESM large ensemble, Clim. Dynam., 52, 6735–6748, https://doi.org/10.1007/s00382-018-4542-3, 2019.
Westra, S., Fowler, H. J., Evans, J. P., Alexander, L. V., Berg, P., Johnson, F., Kendon, E. J., Lenderink, G., and Roberts, N. M.: Future changes to the intensity and frequency of short- duration extreme rainfall, Rev. Geophys., 52, 522–555, https://doi.org/10.1002/2014RG000464, 2014.
Xu, M., Xu, H., and Ma, J.: Responses of the East Asian winter monsoon to global warming in CMIP5 models, Int. J. Climatol., 36, 2139–2155, https://doi.org/10.1002/joc.4480, 2016.
Yamaguchi, K. and Noda, A.: Global warming patterns over the North Pacific: ENSO versus AO, J. Meteor. Soc. Jpn., 84, 221–241, https://doi.org/10.2151/jmsj.84.221, 2006.
Zhang, W., Zhou, T., Zou, L., Zhang, L., and Chen, X.: Reduced exposure to extreme precipitation from 0.5 °C less warming in global land monsoon regions, Nat. Commun., 9, 3153, https://doi.org/10.1038/s41467-018-05633-3, 2018.
Zhou, T., Zhang, W., Zhang, L., Clark, R., Qian, C., Zhang, Q., Qiu, H., Jiang, J., and Zhang, X.: 2021: A Year of Unprecedented Climate Extremes in Eastern Asia, North America, and Europe. Adv. Atmos. Sci., 39, 1598–1607, https://doi.org/10.1007/s00376-022-2063-9, 2022.
Zhou, W., Li, C., and Wang, X.: Possible connection between Pacific oceanic interdecadal pathway and East Asian winter monsoon, Geophys. Res. Lett., 34, L01701, https://doi.org/10.1029/2006GL027809, 2007.