the Creative Commons Attribution 4.0 License.
the Creative Commons Attribution 4.0 License.
 | 18 Jun 2024
Technical note: Determining chemical composition of atmospheric single particles by a standard-free mass calibration algorithm
Yechun Ruan
Yuanlong Huang
Xujian Chen
Antai Zhang
Jianhuai Ye
Guomao Zheng
Baohua Cai
Yaling Zeng
Yixiang Wang
Chunbo Xing
Yujie Zhang
Tzung-May Fu
Huizhong Shen
Chen Wang
The chemical composition of individual particles can be revealed by single-particle mass spectrometers (SPMSs). With higher accuracy in the ratio of mass to charge (), more detailed chemical information could be obtained. In SPMSs, the conventional standard-based calibration methods (internal/external) are constrained by the inhomogeneity of ionization lasers and the finite focusing ability of the inlet system, etc.; therefore, the mass accuracy is restricted. In this study, we obtained the detailed and reliable chemical composition of single particles utilizing a standard-free mass calibration algorithm. In the algorithm, the characteristic distributions of hundreds of ions were concluded and collected in a database denoted as prototype. Each single-particle mass spectrum was initially calibrated by a function with specific coefficients. The range of coefficients was constrained by the magnitude of mass deviation to a finite vector space. To find the optimal coefficient vector, the conformity of each initially calibrated spectrum to the prototype dataset was assessed. The optimum calibrated spectrum was obtained with maximum conformity. For more than 98 % ambient particles, a 20-fold improvement in mass accuracy, from ∼ 10 000 ppm (integer) to ∼ 500 ppm (two decimal places), was achieved. The improved mass accuracy validated the determination of adjacent ions with a difference ∼ 0.05 Th. Furthermore, atmospheric particulate trace elements that were poorly studied before are specified. The obtained detailed single-particle-level chemical information could help explain the source apportionment, reaction mechanism, and mixing state of atmospheric particles.
- Article
(2074 KB) - Full-text XML
-
Supplement
(5719 KB) - BibTeX
- EndNote


Chemical composition analysis of individual particles is crucial in studying the mechanism of atmospheric multiphase reactions, single-particle mixing states, and aerosol source apportionment (Pratt et al., 2009; Wang et al., 2019; Hatch et al., 2011; Gard et al., 1998; Kirpes et al., 2019; Zhai et al., 2023). Single-particle mass spectrometers (SPMSs) enable the in situ mass spectra generation of individual particles (Prather et al., 1994; Gard et al., 1997; Lu et al., 2022; Pratt and Prather, 2012; Su et al., 2004; Spencer and Prather, 2006; Schade et al., 2019; Zawadowicz et al., 2015; Li et al., 2023). To reveal the chemical composition from single-particle mass spectra, the accurate determination of ions is essential. While the resolving ability of SPMS has been improved by the delayed extraction technique (Li et al., 2018), discerning ions according to the single-particle mass spectra is still limited due to the lack of proper calibration methods (Chudinov et al., 2019; Zhu et al., 2020). Thus, the ratio of mass to charge () in single-particle mass spectra was of low accuracy and was conventionally rounded to the nearest integers (∼ 10 000 ppm). The obtained integral mass spectra were frequently used in previous studies (Anders et al., 2023; McNamara et al., 2020; Zhang et al., 2016, 2020; Lian et al., 2021; Ault et al., 2010; Xiao et al., 2018; Wang et al., 2019).
Mass calibration transforms the biased mass spectrum into the corresponding accurate mass spectrum (Montaudo et al., 1994). The transformation can be described using mathematical functions (Kozhinov et al., 2013; Kolářová et al., 2017; Lou et al., 2010). For instance, the calibration functions in the time-of-flight mass spectrometer (TOF-MS, mass analyzer used in the SPMS) could be described by polynomial functions (Li et al., 2011; Romson and Emmer, 2021; Green et al., 2006). For mass calibration, the coefficients in the calibration functions are the uncertainties requiring determination (Montaudo et al., 1994). The coefficients are typically determined using internal or external mass calibration methods, where standard chemicals (calibrants) are conventionally measured alongside the analyte as references, either collectively or separately (O'Connor and Costello, 2000; Boskamp et al., 2020; Gobom et al., 2002). Calibrants are used to specify the exact of the measured reference peaks (usually at least two), thereby determining the calibration coefficients before operating the raw spectrum with the calibration function. The internal calibration method is not feasible in the SPMS, and may alter the particle composition caused by the addition of calibrants (O'Connor and Costello, 2000). Meanwhile, the application of external mass calibration to SPMS is primarily limited by various uncertainties, including but not limited to the focusing capability of the aerosol inlet system and the inhomogeneity of the ionization laser (Sect. S1, Fig. S1 in the Supplement) (Dienes, 2003; Wenzel and Prather, 2004); hence, coefficients in the calibration function should be specifically determined for each particle (Chudinov et al., 2019; Zhu et al., 2020, p. 22; Chen et al., 2020; Clemen et al., 2020). Generally, neither internal nor external calibration methods are practical in the SPMS; thus, it is necessary to establish calibration methods that are standard-free.
Previous studies attempted to avoid the addition of standard chemicals for calibrating the SPMS spectra by assuming the exact of certain peaks in the raw spectrum (Chudinov et al., 2019; Zhu et al., 2020). For instance, if a peak was observed between 23.50 and 24.49 Th in the raw spectrum, it was empirically assumed to be Mg+ (23.98 Th), without considering other possibilities such as C(24.00 Th) within the same range. Logically, the exact could only be obtained after the mass calibration, implying that the rationality of the assumption could not be proven during the calibration process. Additionally, chemicals in the assumptions were used to serve as calibrants, although standard chemicals were not physically added. Therefore, the calibration approach in previous studies was empirical and could be subject to unreliability (Chudinov et al., 2019; Zhu et al., 2020).
Here, we present a calibration algorithm that eliminates the need for internal, external, or assumed calibrants for single-particle mass spectra. We first developed a calibration theory in which the traits possessed by accurate mass spectra were concluded. A value function was established to quantitatively assess the quality of calibration. Calibration was successfully applied to more than 98 % of the total 12 million SPMS spectra of ambient aerosols with an average mass resolution of 2000, and the bilateral mass deviation range was limited to ∼ 0.05 Th on average. With the improved mass accuracy (∼ 500 ppm), the detailed chemical composition of single particles was revealed. The improved understanding of particle composition was also proven by increased spectra entropy from an information theory perspective.
2.1 Field sampling and data acquisition
A sampling campaign was conducted at Southern University of Science and Technology (SUSTech) located in urban Shenzhen, China (22.604° N, 114.006° E, 100 m above sea level), from 2 to 30 April 2021. TOF spectra of 12 371 204 individual particles were continuously collected using an SPMS (HP-SPAMS, Hexin Instrument Co., Ltd.) with detailed instrumental information provided in Sect. S1 (Zhai et al., 2023). Briefly, aerosols are focused using an aerodynamic focus lens (AFL) to form a particle beam. Particles in the beam are then sequentially ionized by laser desorption/ionization (LDI) technique. The resulting ions fly under the force of the accelerating potential in a TOF-MS. Time-of-flight data are obtained by calculating raw with predetermined parameters of the TOF-MS, e.g., length of flight path and voltage of the accelerating potential. In our HP-SPAMS, the delayed extraction technique is implemented, which improves the mass resolution from 500 to 2000. The improved resolution provided the foundation for achieving ∼ 500 ppm mass accuracy by calibration. Peaks in the obtained TOF spectra (in profile form) were automatically extracted using a built-in software provided by the instrument manufacturer. The resulting centroid spectra were converted to raw mass spectra utilizing a quadratic function (Eq. S2 in Sect. S1).
2.2 Development of the calibration algorithm
Calibration functions are used to describe the relationship between (the raw mass) and (the calibrated mass) in MS (Kozhinov et al., 2013; O'Connor and Costello, 2000; Kaiser et al., 2005). The coefficients to be determined could be collectively listed and are referred to as a coefficient vector θ (Eq. 1); therefore, each dimension of θ is a specific coefficient in the calibration function. The and are vectors with variable lengths according to the number of peaks in each spectrum. Sr and Sc are the spectra, which include peak intensity information (peak height, peak area, or relative peak area) corresponding to and .
The only uncertainty in Eq. (1) is θ, which means mass spectra can be calibrated if θ is determined, such that the mass calibration process is in principle determining θ. Since the range of mass deviation is finite, the vector space of all possible θ is also constrained. Therefore, if we obtained the mass deviation range through a large dataset, we could accordingly find the variation range of each dimension of θ.
An initially calibrated spectrum is created by substituting θ into Eq. (1). Among all θ in θ space, there exists only one optimal θ, denoted θopt, that yields the accurate spectrum. An indicator is required to determine whether a specific θ is optimal. In our algorithm, the indicator is a value function. The value function assesses the quality of calibration by analyzing the traits that the calibrated spectrum possesses, and could potentially guide the search for the θopt. Traits are characteristics that distinguish accurate spectra from inaccurate ones. The value function is defined in Eqs. (2) and (3), where wi represents the weight assigned to each trait and is the number of involved in the specific trait, n represents the total number of traits, St is the initially calibrated spectrum, Ti is the ith trait in a database named prototype, and match is a function for determining the presence of Ti in each spectrum. The method for the selection of traits is provided in detail in Sect. S2. A searching range of comparable to the resolution is used in match. Generally, there exist three types of traits, and examples of the traits are given in Table 1 for atmospheric aerosol research. All the traits are collected in a database named prototype, and the congruence of each trait in the prototype should be tested with St, as shown in Eq. (3). Specifically, in the traits typed “isotopic distribution (fraction) of ions”, both the isotopic ratios and the exact serve as conditions for trait matching in our calibration.
Table 1Three types of traits in the prototype database for calibration.
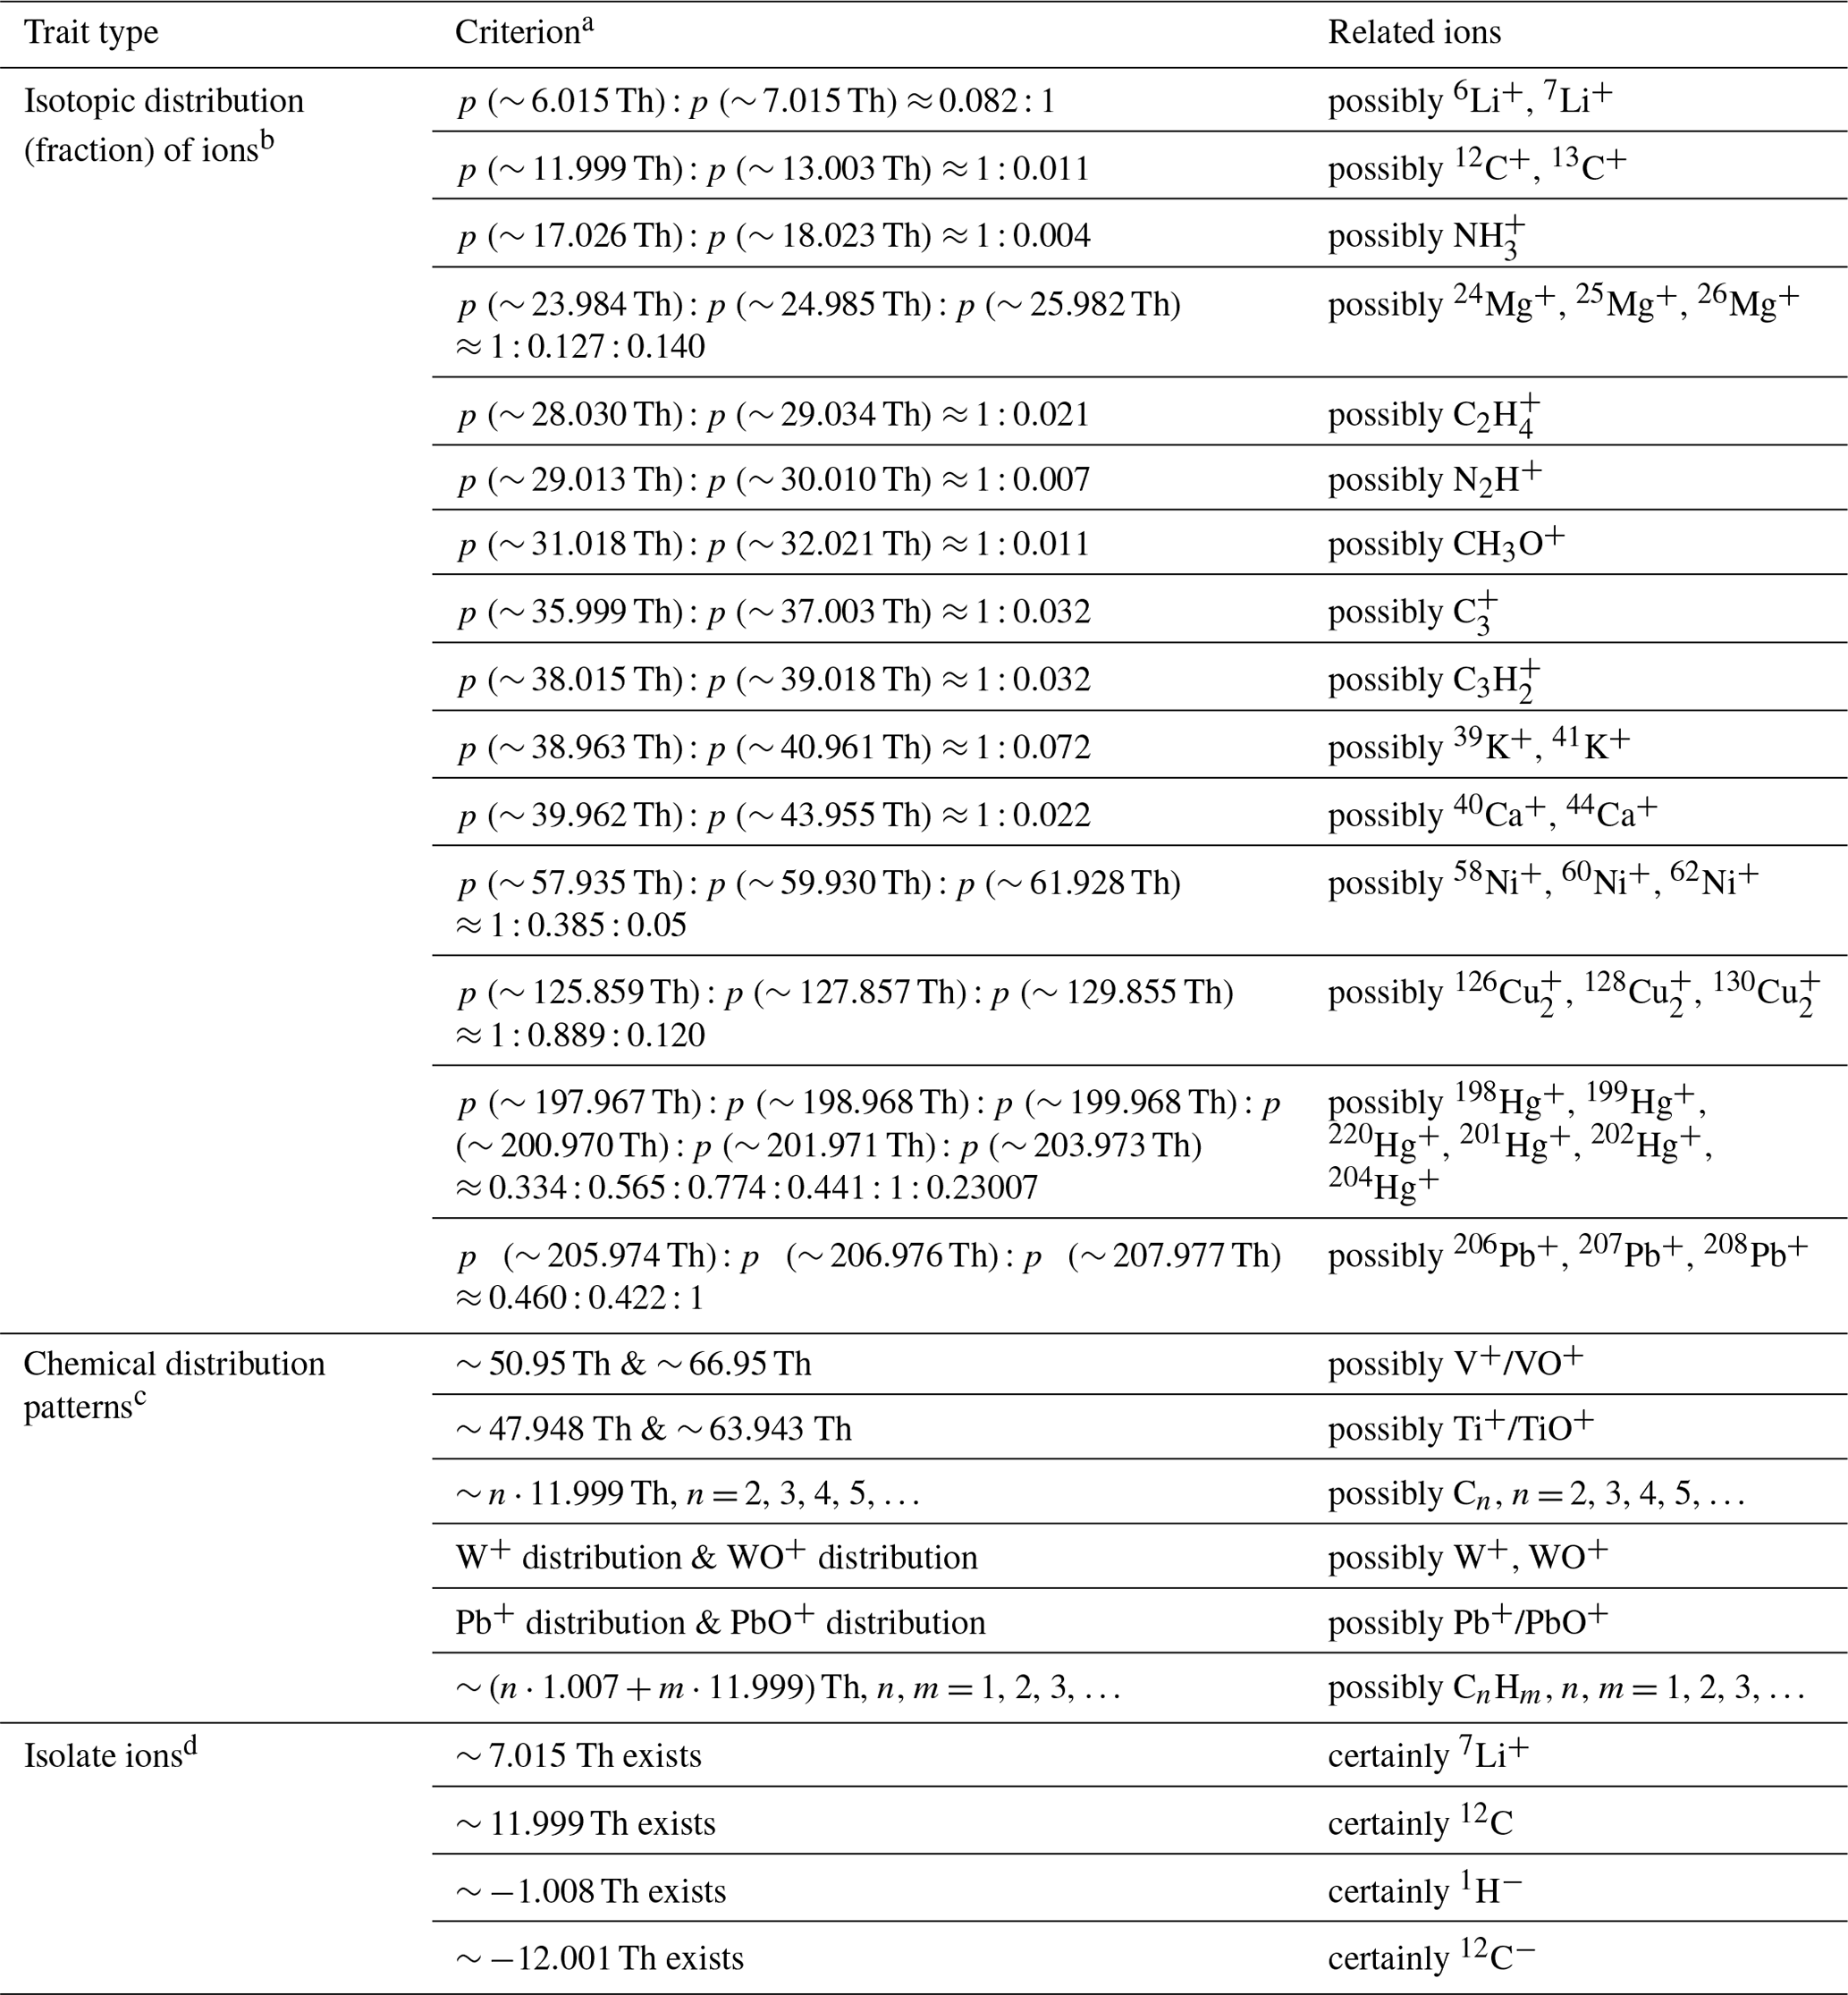
a The peak area at specific is denoted . b Once the isotopic pattern is matched, the criterion of trait corresponding to it can be satisfied. However, the behavior of the initially calibrated spectrum on the entire prototype database should be checked using the value function before determining if a trait is truly positive. Thus, a weight was assigned to each trait for quantification of the matching process. In addition, isotopic fraction may vary in different aerosol particles of different sources, such that an error range (5 % in our calibration) was considered in practice. c The listed pairs of species may or may not coexist in a spectrum, with the weight assigned to each trait corresponding to the number of ions involved. d Isolate ions are far from adjacent ions ( Th) with no other ions confusing their determination.
As the value function is defined, the quality of an initial calibration is quantifiable because the optimal calibration attempt generates the maximum value. If none of the θ allows for a spectrum possessing a value > 0, the spectrum cannot be calibrated until the prototype is expanded to include additional traits. However, how the value is distributed in the θ space is unknown, which means an advanced optimization algorithm is not currently suitable for optimizing θ. Thus, obtaining θopt requires a thorough search in the entire θ space. Therefore, every possible θ in θ space should be traversed and tested to generate a St (Fig. 1). In our iterative search for θopt in θ space, the step size of iteration is set to be sufficiently small (at least comparable to the resolving ability of the MS) to ensure thorough exploration of the θ space for reaching the global optimum. In other words, the step size ensures the calibration converges toward the optimal solution and was determined by the resolution of the mass spectrometer used.
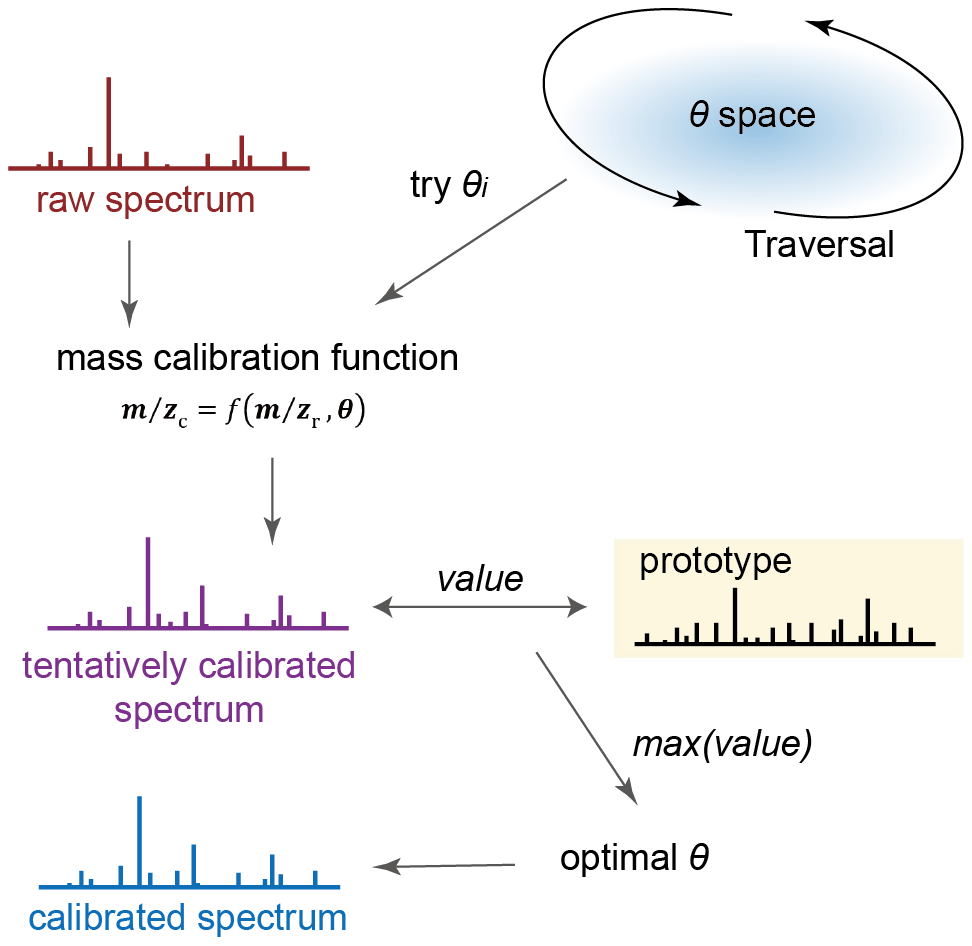
Figure 1Simplified procedure of the calibration algorithm. Raw spectrum is calibrated using mass deviation function with candidate coefficient pairs θi to generate initially calibrated spectra. A value is calculated using a value function based on a prototype dataset. A calibrated spectrum is obtained when the value is maximal.
2.3 Initialization and localization of the algorithm
The calibration function for TOF-MS is polynomial (Eq. 4) (Chudinov et al., 2019; Zhu et al., 2020; Gobom et al., 2002), where aj is the coefficient to be determined and v refers to the order of approximation.
The coefficients of Eq. (4) are restricted within a specific range, partially because of the constrained initial position deviation of particles and the size of the laser spot (Sect. S1, Fig. S1). Nevertheless, the actual deviation range of the measured could be obtained by analyzing the deviation of ions that have no adjacent ions interfering within the deviation range in the average spectrum. For instance, 12C+ was selected as such an ion. With the maximum mass deviation, we constrained the variation range of each dimension in θ in the calibration function and, therefore, constrained the coefficient space.
The calibration algorithm was implemented using MATLAB (ver. 2022b), and a data processing and calibration software named SSSDA ver. 1.0 was developed (accessible at https://github.com/s129136908794904/SSSDA-ver.1.0, last access: 28 April 2024). For the current resolution of the SPMS, a linear function is sufficient for calibration (let v=1) (Chudinov et al., 2019; Zhu et al., 2020; Gobom et al., 2002). A prototype was specifically tailored for ambient atmospheric aerosol research and includes a large number of chemical species and distribution patterns commonly found in ambient aerosols (Table 1, Sect. S2) (Seinfeld and Pandis, 2016; Zhang et al., 2020, 2016; Chen et al., 2020; Hatch et al., 2011; X. Zhang et al., 2019; Zhai et al., 2023; Anders et al., 2023; Pratt et al., 2009; Pratt and Prather, 2012; McNamara et al., 2020). More than 1000 traits are used in this study for calibration, not limited to the examples in Table 1. The step size for iteration ensures the variation of 0.025 Th at Th, corresponding to the resolving ability of the SPMS used in this study. An empirical function (Eq. S1 in the Supplement) was employed to describe the relationship between and the resolution of SPMS (Du et al., 2024). Out of the total dataset of 12 371 204 mass spectra, 12 195 009 were successfully calibrated.
2.4 Efficiency, universality, and validity of the algorithm
The algorithm exhibits linear complexity regarding the number of spectra (Fig. 1, Sect. S3) as the interference between the calibration of different spectra was absent. The linear complexity theoretically makes the algorithm efficient in large datasets. From another perspective, the complexity of calibrating individual particles is O(nlogn) related to the number of peaks in each spectrum (Sect. S3), which ensures that the algorithm is efficient in calibrating individual spectra. Furthermore, parallel computing is suitable for implementing the algorithm because there is no interference in the spontaneous calibration of different mass spectra. We performed the calibration of 12 million mass spectra on a private computer with 12th Gen Intel (R) Core (TM) i9-12900K CPU. Exceptionally high time efficiency is observed with only ∼ 12 h consumed.
The calibration failure rate was less than 2 % of the total spectra (value = 0), primarily due to the absence of corresponding traits in the prototype database for calibration. The high success rate (>98 %) reflects the universality of the algorithm. In addition, since a searching range of is used for matching traits (Sect. S3), relationships between and may deviate from the calibration function. In our calibration, the correlation between and values was quantified by the absolute value of the correlation coefficient . All the spectra possess approximating 1 (Fig. S2), indicating high accordance with the calibration function (Zhu et al., 2020).
3.1 Determination of isotopic ions in single particles
The determination of ions becomes accurate after calibration since the calibrated spectra demonstrate a noticeable improvement in mass accuracy (Fig. S3, Table S3). To evaluate the enhancement in mass accuracy, the mass deviations of several isotopic ions has been examined (Fig. 2). Based on the calibrated spectra, multiple markers were employed in searching for each isotopic ion to ensure accuracy. For instance, the presence of both Pb+ and PbO+ signals were required to ensure the inclusion of Pb+ in the spectrum. The raw spectra exhibit deviations larger than 1.5 Th at ∼ 208 Th, indicating challenges in achieving integer-level identification of ions. Instead, the calibrated spectra exhibit a variation less than ±0.05 Th (500 ppm) around the same position, enabling the accurate identification of ions such as Pb isotopes (Figs. 2e, 3a).
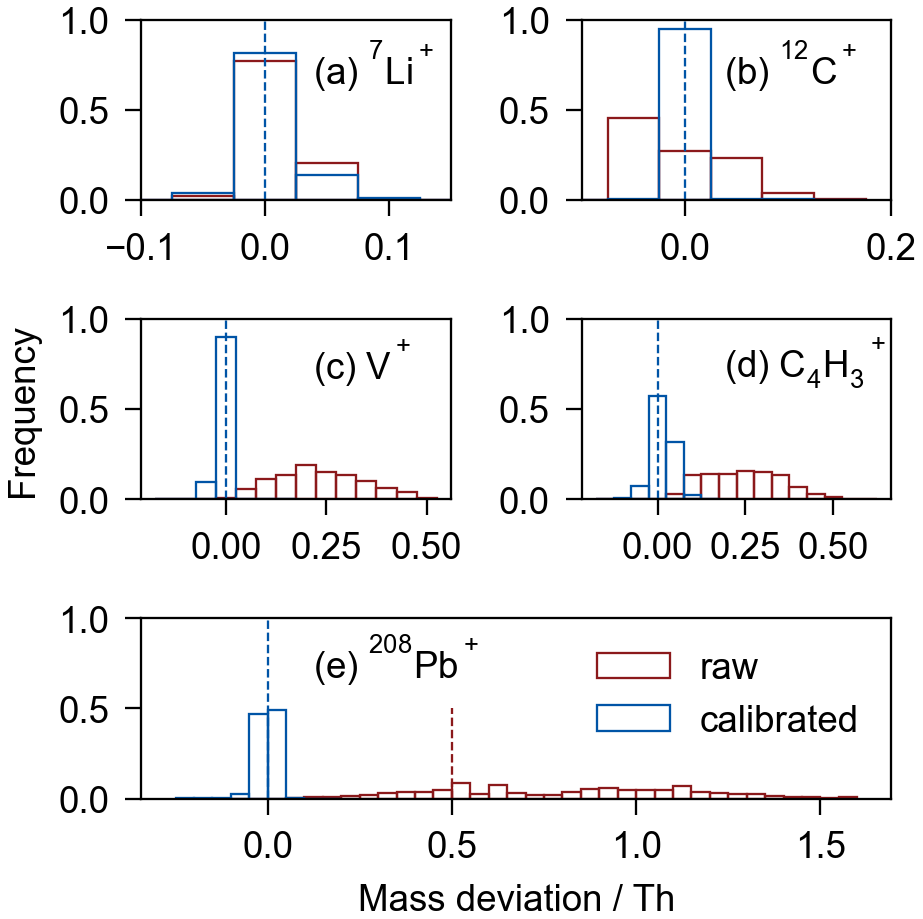
Figure 2Mass deviation distribution for the raw (in red) and calibrated (in blue) spectra of five selected ions. The dashed blue line indicates the location of the exact mass. (a) Signals of Li+ (42 858 Li+-containing spectra) exhibit mass deviation mostly less than 0.025 Th in both raw and calibrated spectra. (b) Most 12C+ signals (7 739 415 spectra out of 8 168 248 spectra) exhibit mass deviations larger than 0.025 Th in the raw spectra; meanwhile, they are 100 % calibrated within 0.025 Th deviation. (c–d) More than 95 % of V+ (50.95 Th, 296 259 spectra in total) and C4H (51.00 Th, 105 477 spectra in total) signals exhibit mass deviations larger than 0.025 Th in raw spectra. Nevertheless, most deviations in the calibrated spectra are less than 0.025 Th. (e) Most of the 208Pb+ signals (127 138 spectra in total) exhibit mass deviation larger than 0.5 Th (out of the dashed red line) in raw spectra. Overall, ∼ 100 % of the signals in the calibrated spectra are controlled within ∼ 0.05 Th deviation interval.
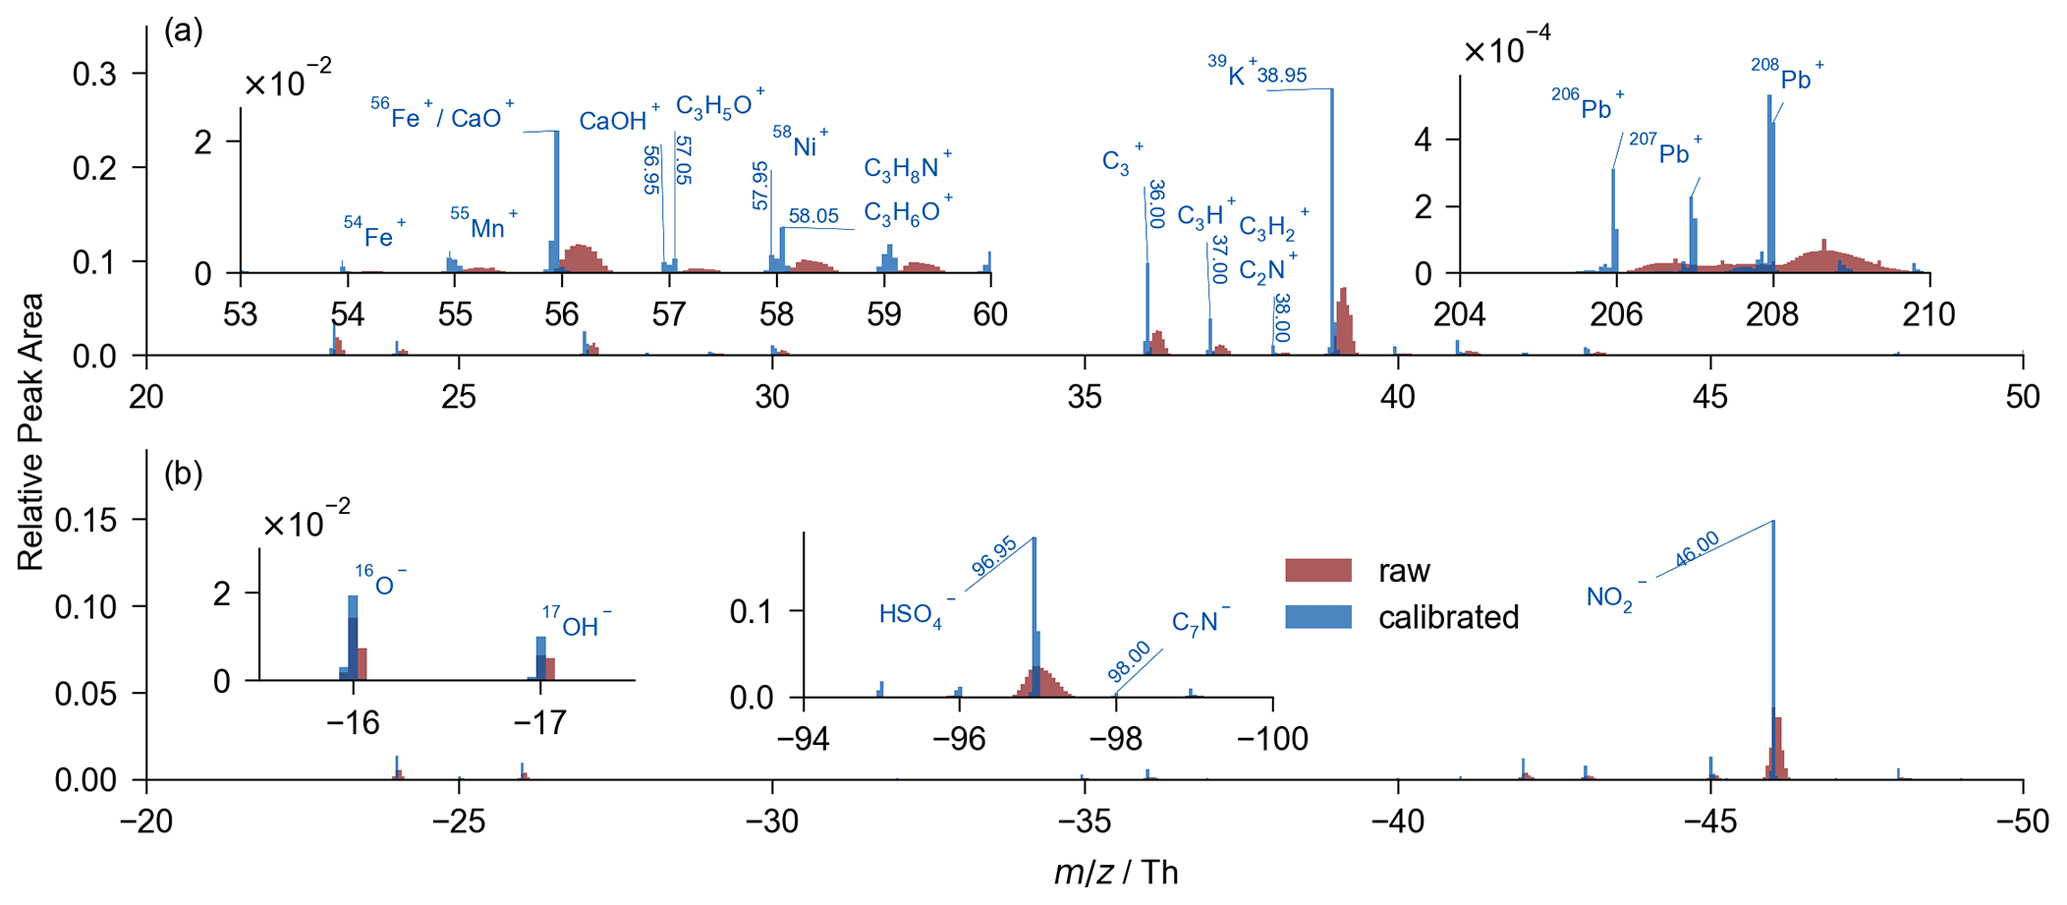
Figure 3Averaged spectrum of 12 million raw (in red) and calibrated (in blue) spectra. Several intervals of are examined for detailed spectrum comparison. (a) The positive spectrum. (b) The negative spectrum. The summation of relative peak area is 1 in each positive or negative spectrum.
In the averaged spectrum of all the 12 million individually calibrated spectra, there is a substantial reduction in mass deviation (Fig. 3). The identification of ions, such as 206Pb, 207Pb, 208Pb, 55Mn+ (54.95 Th), and C7N− (−98.00 Th), is reliable due to the reduced mass deviation. For studies involving numerous mass spectra, accurate mass value is crucial for data analysis such as searching with marker ions or clustering with similarity algorithms. In addition, a substantial increase in the average signal intensity was demonstrated in the calibrated spectrum due to the contraction of the mass deviation range in the averaged spectrum. Therefore, the ions with low signal intensity can be examined in the averaged spectrum with our algorithm. During the sampling campaign, particles containing trace elements (44 407 Ti-containing, 124 293 Ga-containing, 144 385 Rb-containing, 153 Zr-containing, 4715 Mo-containing, 12 014 Ag-containing, 351 Cd-containing, 4775 Sn-containing, 5905 Sb-containing, 3613 Ba-containing, 1176 W-containing, and 493 Hg-containing particles) were successfully identified with a precision of ∼ 500 ppm (Fig. 4), although their presence is difficult to detect in the raw spectra and has therefore been little studied in the literature. Generally, the analysis of the trace-element-containing particles is enabled after the calibration. In addition, the isotopic distributions and the accurate values in Fig. 4 jointly imply the validity of our calibration.
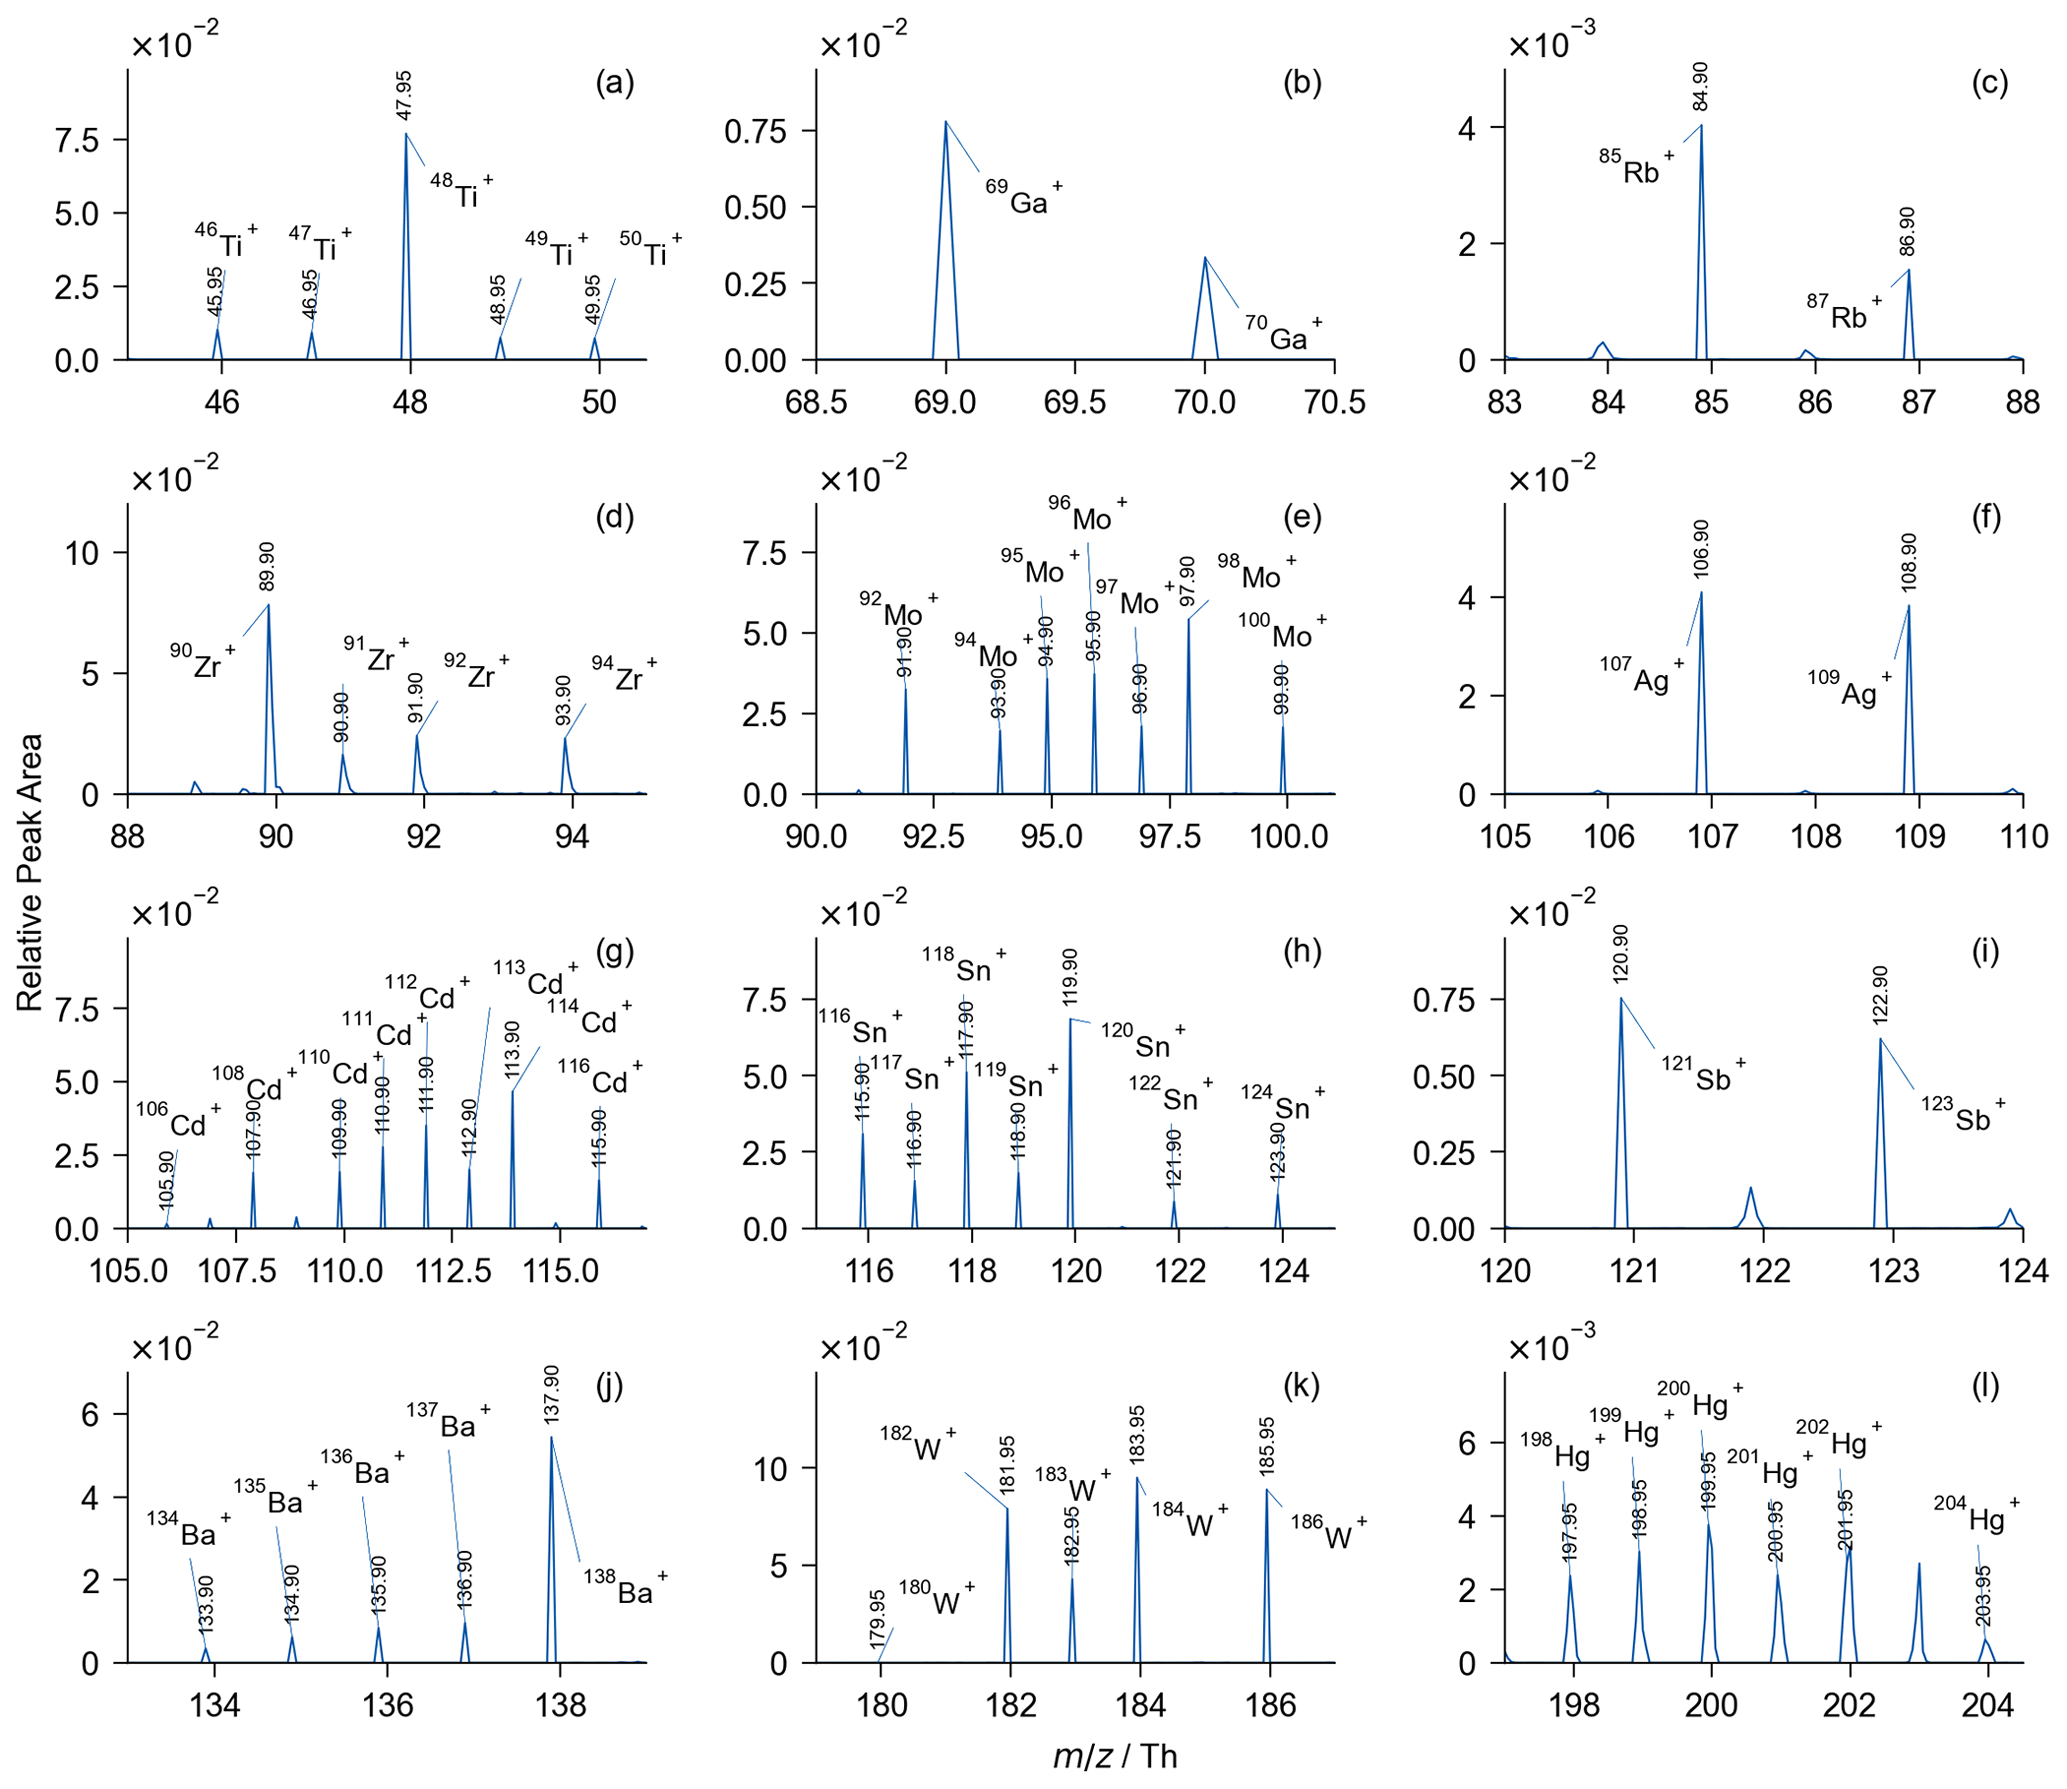
Figure 4Local averaged spectra of (a) 44 407 Ti-containing, (b) 124,293 Ga-containing, (c) 144 385 Rb-containing, (d) 153 Zr-containing, (e) 4715 Mo-containing, (f) 12 014 Ag-containing, (g) 351 Cd-containing, (h) 4775 Sn-containing, (i) 5905 Sb-containing, (j) 3613 Ba-containing, (k) 1176 W-containing, and (l) 493 Hg-containing particles. Particles are grouped using isotopic distribution as markers. Each group of isotopes is identified with a range of fluctuation of less than 15 %.
3.2 Determination of ions with close value
Close ions refer to ions with <0.5 Th difference in exact between each other. As shown in Fig. 3, the calibrated peak locations of adjacent ions, such as 58Ni+ (57.95 Th), and C3H6O+/C3H8N+ (58.05 Th), become precise and therefore could be determined. Specifically, two pairs of close ions in particles were examined in detail, and the search for these peaks in the spectra was conducted for individual particles.
The first pair is CaOH+ (56.95 Th)/C3H5O+ (57.05 Th). We isolated 910 483 Ca+-containing particles from our dataset of 12 million spectra. In these particles, we mainly focused on the co-existence of CaOH+ and C3H5O+ in each spectrum. The searching criterion was 56.95 Th & 57.05 Th coexist in the individual spectrum, and we obtained 5601 such spectra (Fig. 5a). The averaged mass spectrum of Ca+-containing particles that contain only CaOH+ or C3H5O+ was also provided (Fig. S4). In general, particles that contain both CaOH+ and C3H5O+ have characteristic signals of CaOH+-containing and C3H5O+-containing particles. It should be noted that the co-existence of CaOH+ and C3H5O+ is rare in the Ca+-containing particles (Table S4). Further, the co-existence of CaOH+ and C3H5O+ proved that adjacent peaks could be accurately determined using our calibration algorithm, which means the information content of each spectrum is improved by our algorithm.
The second pair is V+ (50.95 Th) and C4H (51.00 Th). V+ is a typical marker of ship-emitted particles (X. Zhang et al., 2019; Y. Zhang et al., 2019; Wang et al., 2019). Previously, the presence of C4H often muddled the identification of V+ signals because the mass difference (∼ 0.05 Th) is much less than the integer-level accuracy of the SPMS. Therefore, distinguishing V+ and C4H in spectra is crucial in shipping aerosol research. By employing our standard-free calibration algorithm, the achieved high mass accuracy ensures the determination of V+ and C4H. For instance, we randomly chose 10 V+-containing and 10 C4H-containing particles, with single-particle mass spectra (raw and calibrated) provided (Fig. S5). Further, we randomly chose 500 V+-containing and 500 C4H-containing particles to illustrate the calibration process. The peaks, both raw and calibrated, at ∼ 51 Th in these particles are illustrated in Fig. 5e, indicating that the corresponding species (V+ or C4H of these peaks can easily be determined after our calibration (Fig. 5e, Sect. S4). Consequently, two distinct groups of mass spectra were isolated from our database of 12 million single-particle mass spectra, each containing 296 259 and 105 477 mass spectra with signals at 50.95 Th (V+) or 51.00 Th (C4H), respectively. The co-presence of V+ and C4H signal in a single particle is theoretically permitted, though such a scenario was not observed in our database. In the mass spectrum of V+-containing particles, the signal of vanadium oxide ion (VO+, 66.95 Th), which is also a marker for shipping emissions, is present (Fig. 5b). Other ions of typical shipping emissions such as Al+ (27.00 Th), K+ (38.95 Th), Ca+ (39.95 Th), Fe+ (55.95 Th), and 58Ni+ (57.95 Th) were also detected (X. Zhang et al., 2019). For the C4H-containing group, signals of CmH that correspond to organic aerosols could be observed (Fig. 5c). Further, the fraction of the 66.95 Th peak presence in V+ and C4H particles is 0.84 and 0.15, separately. The mass spectra of V+-containing and C4H-containing particles that contain a 66.95 Th signal also have substantial differences in terms of both averaged peak area and the peak-area ratio of ∼ 51 Th peaks to 66.95 Th peaks (Fig. S6). We also observed a peak at 68.95 Th that coexist with 66.95 Th in the 66.95 Th & C4H-containing spectrum. Since the theoretical isotopic distribution of ClO or ClS+ is 66.95 Th : 68.95 Th = 1 : 0.32, we observed a similar ratio as 66.95 Th : 68.95 Th = 1 : 0.25 (Fig. S6). In addition, in the corresponding negative spectrum, we could observe S− and Cl− isotopes. The theoretical distribution of Cl− isotopes is −34.95 Th : −36.95 Th = 1 : 0.32, and we observed a close ratio 1 : 0.28. For these reasons, it is likely that 66.95 Th peaks in the C4H-containing particles correspond to ions other than VO+, such as ClO or ClS+, whose is also in the range of 66.925–66.975 Th. Additionally, the time series of the two particle groups demonstrates distinct temporal behavior (Fig. 5d), in which the correlation coefficient between the two groups is ∼ 0.15. The results confirmed our differentiation of previously confusing V+-containing and C4H-containing particles. Moreover, the determination of adjacent ions also validates our calibration algorithm.
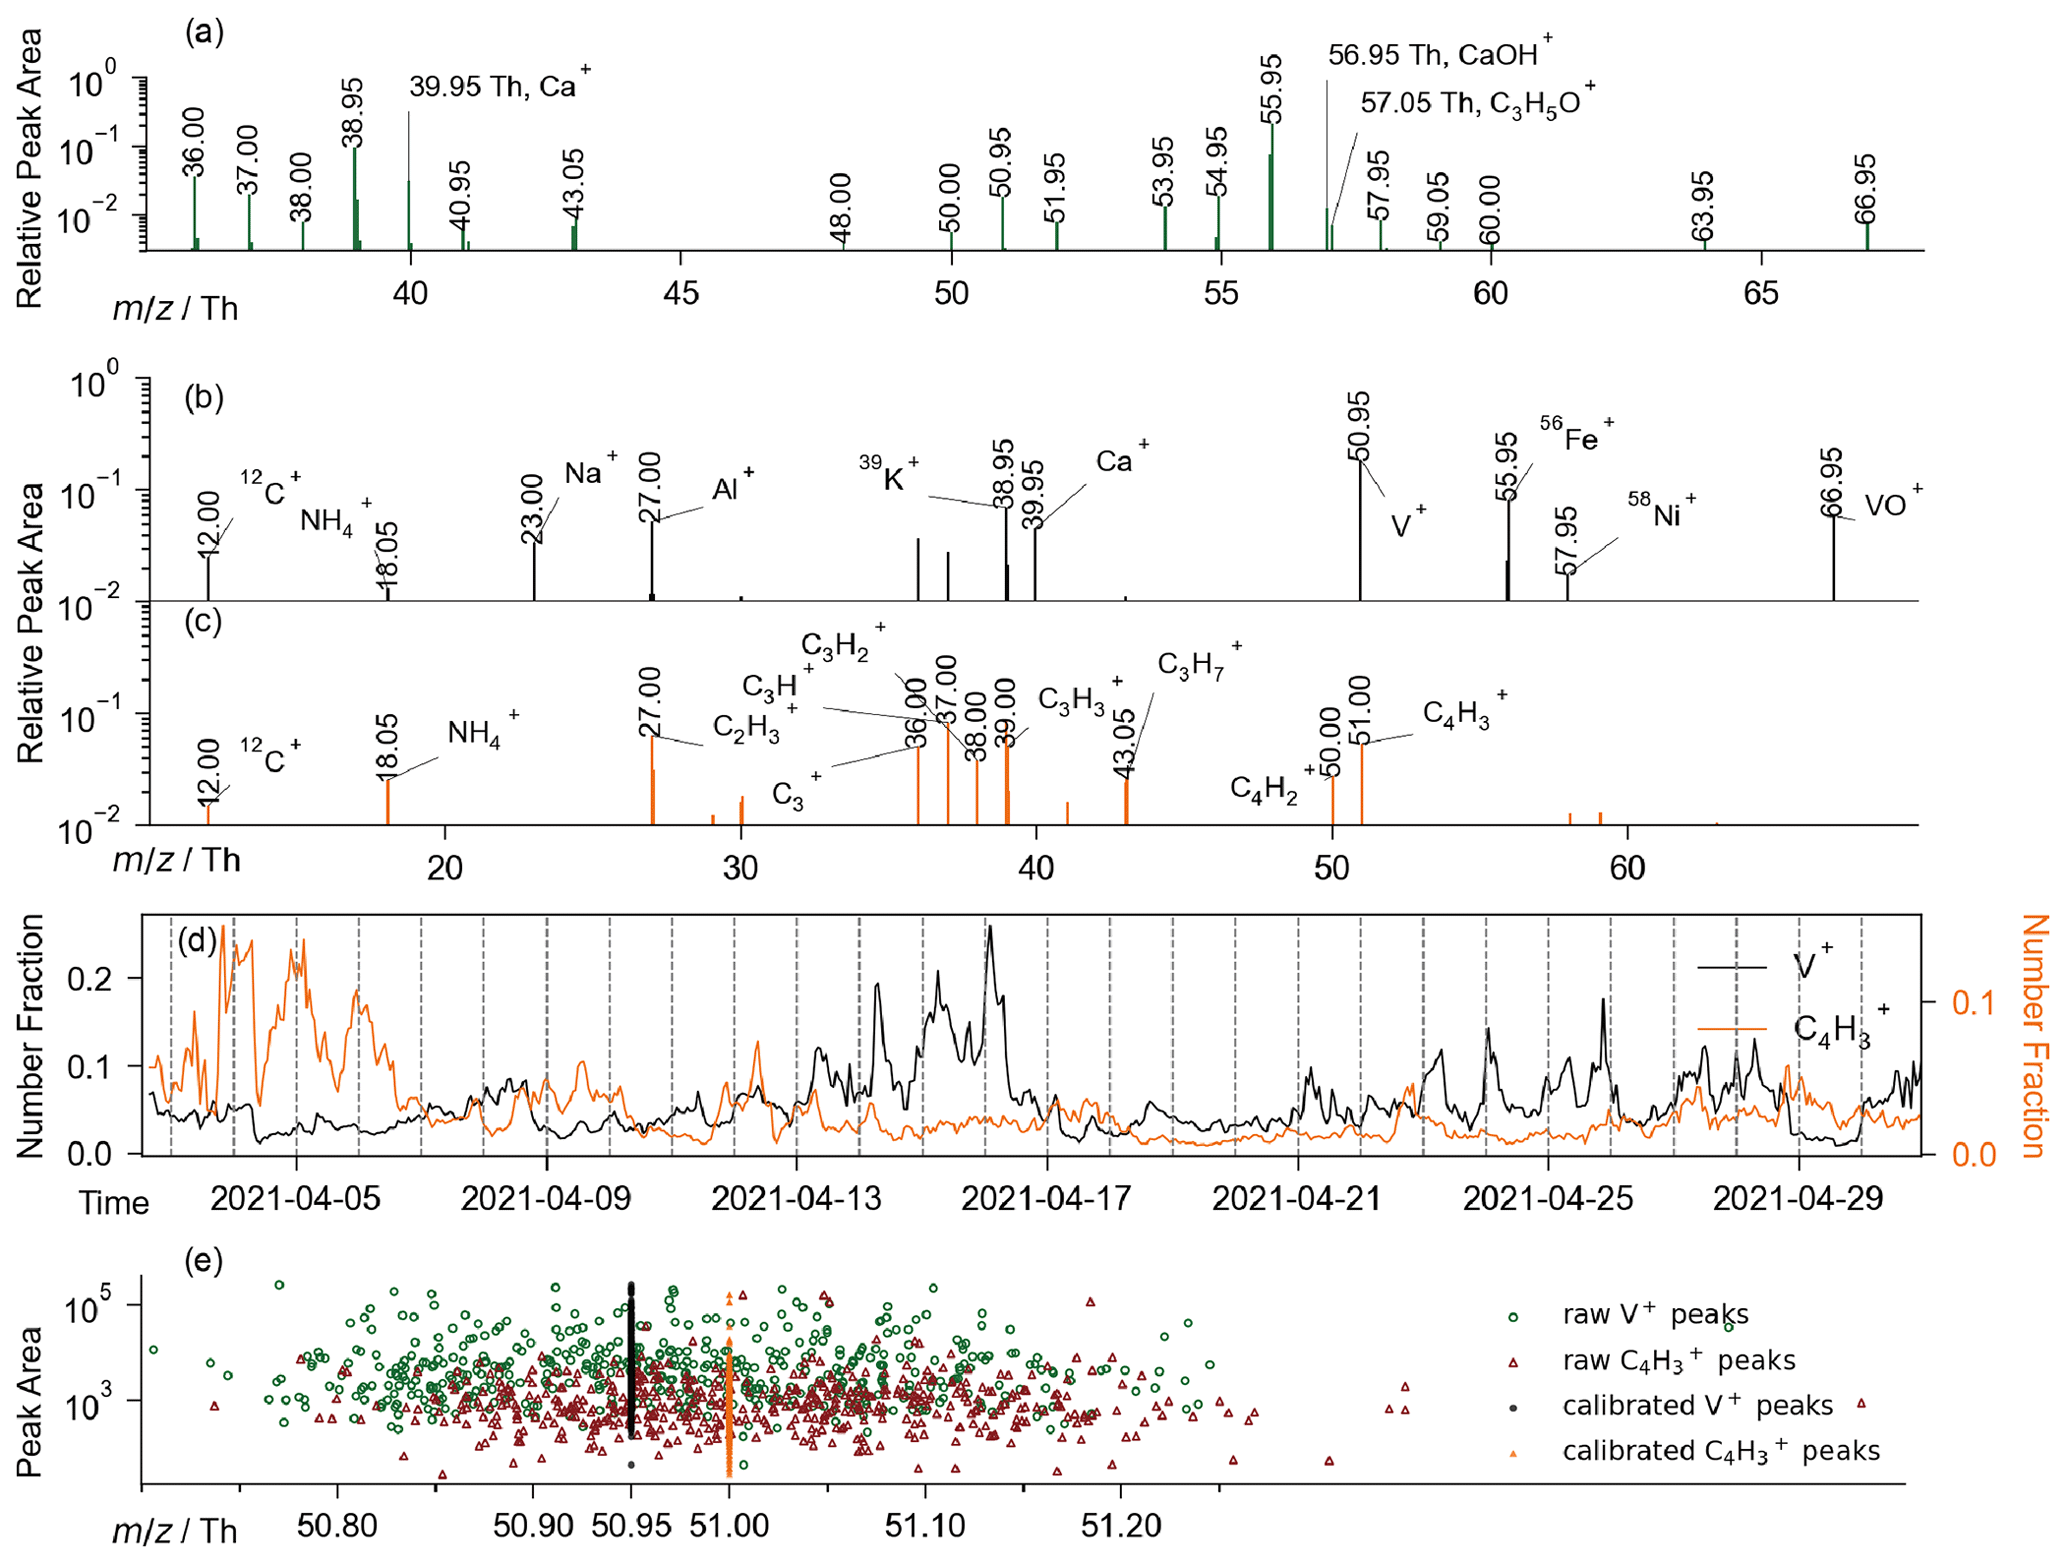
Figure 5(a) Averaged spectrum (locally illustrated) of 5601 spectra that simultaneously contain CaOH+ and C3H5O+. Averaged positive spectrum of (b) V+-containing (in gray) and (c) C4H-containing (in orange) particles were obtained by averaging millions of particles of the two particle groups separately. (d) Time series of V+-containing and C4H-containing particles in number fraction. (e) Raw and calibrated peaks around 51 Th of 1000 randomly chosen V+-containing or C4H-containing particles.
3.3 Improved understanding of single-particle composition
Generally, small peaks in mass spectra could emerge if the mass resolution is increased. However, these peaks are not utilizable without calibration. For instance, the coexistence of CaOH+/C3H5O+ is only determinable with mass accuracy up to ∼ 500 ppm. Therefore, raw is usually rounded to its nearest integer if mass accuracy is limited. The rounded constitutes the integral spectrum, denoted as Si, and has been frequently used in studies involving SPMS (Anders et al., 2023; McNamara et al., 2020; Zhang et al., 2016, 2020; Lian et al., 2021; Ault et al., 2010; Xiao et al., 2018; Wang et al., 2019). Although the rounding is convenient for data processing, peaks within the same integer are merged, resulting in the elimination of adjacent peaks.
Principally, mass spectra are information made up of peaks. According to information theory, the information content in any mass spectrum can be quantified by Shannon entropy (Shannon, 1948). Our algorithm achieves calibration of adjacent , thereby preserving critical peak information. Here, we compared the information content between the calibrated spectrum Sc and its corresponding integral spectrum Si from an information theory perspective. The amount of information in each spectrum was quantified using Shannon entropy (Eq. 5, E(S) is the Shannon entropy of a spectrum S, Ik is the relative area of the kth peak in S, and q represents the total number of peaks in the spectrum).
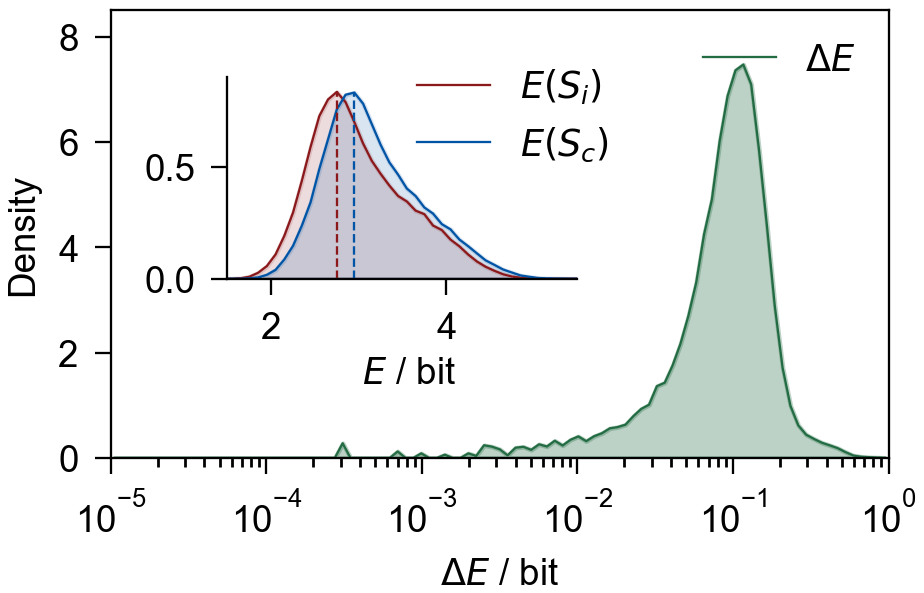
Figure 6Increment of Shannon entropy () of individual spectra. The embedding graph shows the distribution of E(Sc) and E(Si). The shaded area represents the distribution density.
An obvious increment of E could be observed in Fig. 6, indicating an increment of information content in the Sc compared to the Si. The peak value of E shifted by ∼ 0.15 bit on average; regardless, E is dominantly influenced by major peaks such as K+, nitrate, and sulfate. In general, our calibration algorithm increased the understanding of single-particle mass spectra, which could be used to determine the chemical composition of individual atmospheric particles.
The understanding of single-particle compositions of aerosols is improved by our standard-free mass calibration algorithm. The algorithm efficiently improves the mass accuracy of SPMS spectra from ∼ 10 000 ppm (integer) to ∼ 500 ppm (2 decimal places). The improved mass accuracy enables determining ions in mass spectra within ±0.025 Th deviation, facilitating detailed investigations of chemical composition at single-particle level. Furthermore, the determination of ions from adjacent ion pairs such as CaOH+ (56.95 Th) C3H5O+ (57.05 Th) and V+ (50.95 Th) C4H (51.00 Th), which requires a resolution of ∼ 1000 for their separation and an accuracy of ∼ 500 ppm for their determination, is achieved by our algorithm. Particles containing V+ or C4H, two confused ions in previous studies tracing ship emissions, are successfully differentiated from each other. In addition, the algorithm enables the analysis of trace species at single-particle level, i.e., Ga, Rb, Zr, Mo, Ag, Cd, Sn, Sb, Ba, W, and Hg isotopes.
Since the detailed information about single particles is revealed at a 500 ppm accuracy level, many more atmospheric species could be determined and involved in the source apportionment of aerosols, the study of chemical reaction mechanisms, and the analysis of single-particle mixing states. Furthermore, the calibration function may appear in different forms for other research interests, depending on the mass analyzer (Orbitrap, TOF, etc.) used in the mass spectrometer. Nevertheless, the prototype could be tailored specifically and the algorithm could be implemented in various mass spectrometers. Generally, our standard-free calibration algorithm opens new possibilities for accurate measurement in atmospheric research.
The full data can be made available on request. SSSDA ver. 1.0 is accessible on GitHub (https://github.com/s129136908794904/SSSDA-ver.1.0; Shi et al., 2023). A portion of the prototype was released for testing.
The single-particle mass spectrometer used in this study (Sect. S1, Fig. S1). Detailed description of traits in the prototype (Sect. S2). Simplified pseudocode of the algorithm (Sect. S3). Details about determining the chemical species at ∼ 51 Th (Sect. S4). Model fitness of the calibration (Fig. S2). An example of a calibrated single-particle spectrum and the corresponding raw spectrum (Fig. S3). Averaged mass spectra of Ca+-containing, Ca+ & CaOH+(only)-containing, Ca+ & C3H5O+ (only)-containing, and Ca+ & CaOH+ & C3H5O+-containing particles (Fig. S4). Examples of calibrated and raw single-particle mass spectra of V+-containing particles and C4H-containing particles (Fig. S5). Averaged mass spectra of V+-containing and C4H-containing particles and that contain 66.95 Th signal (Fig. S6). Accuracy and resolution required for separating easily confused ions typically encountered in aerosol research (Table S3). The presence of ions in Ca+-containing particles (Table S4). The supplement related to this article is available online at: https://doi.org/10.5194/acp-24-7001-2024-supplement.
SS developed and implemented the algorithm. SS, JZ, and XY designed the study. YR, YH, XC, AZ, JY, GZ, and BC provided advice on the data analysis process. SS, JZ, and XY prepared the article with comments from all co-authors.
The contact author has declared that none of the authors has any competing interests.
Publisher's note: Copernicus Publications remains neutral with regard to jurisdictional claims made in the text, published maps, institutional affiliations, or any other geographical representation in this paper. While Copernicus Publications makes every effort to include appropriate place names, the final responsibility lies with the authors.
This work was supported by the National Natural Science Foundation of China (grant nos. 41827804, 42305108), Guangdong Basic and Applied Basic Research Foundation (grant no. 2023A1515011037), Shenzhen Science and Technology Program (grant nos. KQTD20210811090048025, RCBS20221008093123058), Key-Area Research and Development Plan of Guangdong Province (grant no. 2020B1111360001), Guangdong Provincial Observation and Research Station for Coastal Atmosphere and Climate of the Greater Bay Area (grant no. 2021B1212050024), and Shenzhen Key Laboratory of Precision Measurement and Early Warning Technology for Urban Environmental Health Risks (grant no. ZDSYS20220606100604008).
This paper was edited by Dantong Liu and reviewed by three anonymous referees.
Anders, L., Schade, J., Rosewig, E. I., Kröger-Badge, T., Irsig, R., Jeong, S., Bendl, J., Saraji-Bozorgzad, M. R., Huang, J.-H., Zhang, F.-Y., Wang, C. C., Adam, T., Sklorz, M., Etzien, U., Buchholz, B., Czech, H., Streibel, T., Passig, J., and Zimmermann, R.: Detection of ship emissions from distillate fuel operation via single-particle profiling of polycyclic aromatic hydrocarbons, Environ. Sci.: Atmos., 3, 1134–1144, https://doi.org/10.1039/D3EA00056G, 2023.
Ault, A. P., Gaston, C. J., Wang, Y., Dominguez, G., Thiemens, M. H., and Prather, K. A.: Characterization of the Single Particle Mixing State of Individual Ship Plume Events Measured at the Port of Los Angeles, Environ. Sci. Technol., 44, 1954–1961, https://doi.org/10.1021/es902985h, 2010.
Boskamp, T., Lachmund, D., Casadonte, R., Hauberg-Lotte, L., Kobarg, J. H., Kriegsmann, J., and Maass, P.: Using the Chemical Noise Background in MALDI Mass Spectrometry Imaging for Mass Alignment and Calibration, Anal. Chem., 92, 1301–1308, https://doi.org/10.1021/acs.analchem.9b04473, 2020.
Chen, Y., Kozlovskiy, V., Du, X., Lv, J., Nikiforov, S., Yu, J., Kolosov, A., Gao, W., Zhou, Z., Huang, Z., and Li, L.: Increase of the particle hit rate in a laser single-particle mass spectrometer by pulse delayed extraction technology, Atmos. Meas. Tech., 13, 941–949, https://doi.org/10.5194/amt-13-941-2020, 2020.
Chudinov, A., Li, L., Zhou, Z., Huang, Z., Gao, W., Yu, J., Nikiforov, S., Pikhtelev, A., Bukharina, A., and Kozlovskiy, V.: Improvement of peaks identification and dynamic range for bi-polar Single Particle Mass Spectrometer, Int. J. Mass Spectrom., 436, 7–17, https://doi.org/10.1016/j.ijms.2018.11.013, 2019.
Clemen, H.-C., Schneider, J., Klimach, T., Helleis, F., Köllner, F., Hünig, A., Rubach, F., Mertes, S., Wex, H., Stratmann, F., Welti, A., Kohl, R., Frank, F., and Borrmann, S.: Optimizing the detection, ablation, and ion extraction efficiency of a single-particle laser ablation mass spectrometer for application in environments with low aerosol particle concentrations, Atmos. Meas. Tech., 13, 5923–5953, https://doi.org/10.5194/amt-13-5923-2020, 2020.
Dienes, T.: Development, characterization, and refinement of a transportable aerosol time-of-flight mass spectrometer, University of California, Riverside, ISBN 978-0-496-48209-2, 2003.
Du, X., Xie, Q., Huang, Q., Li, X., Yang, J., Hou, Z., Wang, J., Li, X., Zhou, Z., Huang, Z., Gao, W., and Li, L.: Development and characterization of a high-performance single-particle aerosol mass spectrometer (HP-SPAMS), Atmos. Meas. Tech., 17, 1037–1050, https://doi.org/10.5194/amt-17-1037-2024, 2024.
Gard, E., Mayer, J. E., Morrical, B. D., Dienes, T., Fergenson, D. P., and Prather, K. A.: Real-Time Analysis of Individual Atmospheric Aerosol Particles: Design and Performance of a Portable ATOFMS, Anal. Chem., 69, 4083–4091, https://doi.org/10.1021/ac970540n, 1997.
Gard, E. E., Kleeman, M. J., Gross, D. S., Hughes, L. S., Allen, J. O., Morrical, B. D., Fergenson, D. P., Dienes, T., Gälli, M. E., Johnson, R. J., Cass, G. R., and Prather, K. A.: Direct Observation of Heterogeneous Chemistry in the Atmosphere, Science, 279, 1184–1187, https://doi.org/10.1126/science.279.5354.1184, 1998.
Gobom, J., Mueller, M., Egelhofer, V., Theiss, D., Lehrach, H., and Nordhoff, E.: A Calibration Method That Simplifies and Improves Accurate Determination of Peptide Molecular Masses by MALDI-TOF MS, Anal. Chem., 74, 3915–3923, https://doi.org/10.1021/ac011203o, 2002.
Green, F. M., Gilmore, I. S., and Seah, M. P.: TOF-SIMS: Accurate mass scale calibration, J. Am. Soc. Mass Spectrom., 17, 514–523, https://doi.org/10.1016/j.jasms.2005.12.005, 2006.
Hatch, L. E., Creamean, J. M., Ault, A. P., Surratt, J. D., Chan, M. N., Seinfeld, J. H., Edgerton, E. S., Su, Y., and Prather, K. A.: Measurements of Isoprene-Derived Organosulfates in Ambient Aerosols by Aerosol Time-of-Flight Mass Spectrometry – Part 2: Temporal Variability and Formation Mechanisms, Environ. Sci. Technol., 45, 8648–8655, https://doi.org/10.1021/es2011836, 2011.
Kaiser, N. K., Anderson, G. A., and Bruce, J. E.: Improved mass accuracy for tandem mass spectrometry, J. Am. Soc. Mass Spectrom., 16, 463–470, https://doi.org/10.1016/j.jasms.2004.12.005, 2005.
Kirpes, R. M., Bonanno, D., May, N. W., Fraund, M., Barget, A. J., Moffet, R. C., Ault, A. P., and Pratt, K. A.: Wintertime Arctic Sea Spray Aerosol Composition Controlled by Sea Ice Lead Microbiology, ACS Cent. Sci., 5, 1760–1767, https://doi.org/10.1021/acscentsci.9b00541, 2019.
Kolářová, L., Prokeš, L., Kučera, L., Hampl, A., Peňa-Méndez, E., Vaňhara, P., and Havel, J.: Clusters of Monoisotopic Elements for Calibration in (TOF) Mass Spectrometry, J. Am. Soc. Mass Spectrom., 28, 419–427, https://doi.org/10.1007/s13361-016-1567-x, 2017.
Kozhinov, A. N., Zhurov, K. O., and Tsybin, Y. O.: Iterative Method for Mass Spectra Recalibration via Empirical Estimation of the Mass Calibration Function for Fourier Transform Mass Spectrometry-Based Petroleomics, Anal. Chem., 85, 6437–6445, https://doi.org/10.1021/ac400972y, 2013.
Li, L., Huang, Z., Dong, J., Li, M., Gao, W., Nian, H., Fu, Z., Zhang, G., Bi, X., Cheng, P., and Zhou, Z.: Real time bipolar time-of-flight mass spectrometer for analyzing single aerosol particles, Int. J. Mass Spectrom., 303, 118–124, https://doi.org/10.1016/j.ijms.2011.01.017, 2011.
Li, L., Liu, L., Xu, L., Li, M., Li, X., Gao, W., Huang, Z., and Cheng, P.: Improvement in the Mass Resolution of Single Particle Mass Spectrometry Using Delayed Ion Extraction, J. Am. Soc. Mass Spectrom., 29, 2105–2109, https://doi.org/10.1007/s13361-018-2037-4, 2018.
Li, L., Wexler, A. S., Li, X., Hu, L., and Jiang, G.: In Situ Characterization of Bioaerosols at the Single-Particle Level Using Single-Particle Mass Spectrometry: A Promising Tool for Defending Human Health against Bioaerosol Transmission, Anal. Chem., 95, 10839–10843, https://doi.org/10.1021/acs.analchem.2c05324, 2023.
Lian, X., Zhang, G., Yang, Y., Lin, Q., Fu, Y., Jiang, F., Peng, L., Hu, X., Chen, D., Wang, X., Peng, P., Sheng, G., and Bi, X.: Evidence for the Formation of Imidazole from Carbonyls and Reduced Nitrogen Species at the Individual Particle Level in the Ambient Atmosphere, Environ. Sci. Tech. Let., 8, 9–15, https://doi.org/10.1021/acs.estlett.0c00722, 2021.
Lou, X., Van Dongen, J. L. J., and Meijer, E. W.: Generation of CsI cluster ions for mass calibration in matrix-assisted laser desorption/ionization mass spectrometry, J. Am. Soc. Mass Spectrom., 21, 1223–1226, https://doi.org/10.1016/j.jasms.2010.02.029, 2010.
Lu, H. L., Su, Z. M., Li, L., and Li, X.: Airborne Microbial Aerosol Detection by Combining Single Particle Mass Spectrometry and a Fluorescent Aerosol Particle Sizer, Anal. Chem., 94, 17861–17867, https://doi.org/10.1021/acs.analchem.2c03636, 2022.
McNamara, S. M., Kolesar, K. R., Wang, S., Kirpes, R. M., May, N. W., Gunsch, M. J., Cook, R. D., Fuentes, J. D., Hornbrook, R. S., Apel, E. C., China, S., Laskin, A., and Pratt, K. A.: Observation of Road Salt Aerosol Driving Inland Wintertime Atmospheric Chlorine Chemistry, ACS Cent. Sci., 6, 684–694, https://doi.org/10.1021/acscentsci.9b00994, 2020.
Montaudo, G., Montaudo, M. S., Puglisi, C., and Samperi, F.: Determination of Absolute Mass Values in MALDI-TOF of Polymeric Materials by a Method of Self-Calibration of the Spectra, Anal. Chem., 66, 4366–4369, https://doi.org/10.1021/ac00095a038, 1994.
O'Connor, P. B. and Costello, C. E.: Internal Calibration on Adjacent Samples (InCAS) with Fourier Transform Mass Spectrometry, Anal. Chem., 72, 5881–5885, https://doi.org/10.1021/ac000770t, 2000.
Prather, K. A., Nordmeyer, T., and Salt, K.: Real-time characterization of individual aerosol particles using time-of-flight mass spectrometry, Anal. Chem., 66, 1403–1407, https://doi.org/10.1021/ac00081a007, 1994.
Pratt, K. A. and Prather, K. A.: Mass spectrometry of atmospheric aerosols – Recent developments and applications. Part II: On-line mass spectrometry techniques, Mass Spectrom. Rev., 31, 17–48, https://doi.org/10.1002/mas.20330, 2012.
Pratt, K. A., DeMott, P. J., French, J. R., Wang, Z., Westphal, D. L., Heymsfield, A. J., Twohy, C. H., Prenni, A. J., and Prather, K. A.: In situ detection of biological particles in cloud ice-crystals, Nat. Geosci., 2, 398–401, https://doi.org/10.1038/ngeo521, 2009.
Romson, J. and Emmer, Å.: Mass calibration options for accurate electrospray ionization mass spectrometry, Int. J. Mass Spectrom., 467, 116619, https://doi.org/10.1016/j.ijms.2021.116619, 2021.
Schade, J., Passig, J., Irsig, R., Ehlert, S., Sklorz, M., Adam, T., Li, C., Rudich, Y., and Zimmermann, R.: Spatially Shaped Laser Pulses for the Simultaneous Detection of Polycyclic Aromatic Hydrocarbons as well as Positive and Negative Inorganic Ions in Single Particle Mass Spectrometry, Anal. Chem., 91, 10282–10288, https://doi.org/10.1021/acs.analchem.9b02477, 2019.
Seinfeld, J. H. and Pandis, S. N.: Atmospheric chemistry and physics: from air pollution to climate change, 3rd Edn., John Wiley & Sons, Hoboken, New Jersey, ISBN 978-1-119-22117-3, 2016.
Shannon, C. E.: A Mathematical Theory of Communication, Bell Syst. Tech. J., 27, 379–423, https://doi.org/10.1002/j.1538-7305.1948.tb01338.x, 1948.
Shi, S., Zhai, J., and Yang, X.: The SSSDA ver.1.0-alpha, GitHub [software], https://github.com/s129136908794904/SSSDA-ver.1.0 (last access: 17 June 2024), 2023.
Spencer, M. T. and Prather, K. A.: Using ATOFMS to Determine OC/EC Mass Fractions in Particles, Aerosol Sci. Tech., 40, 585–594, https://doi.org/10.1080/02786820600729138, 2006.
Su, Y., Sipin, M. F., Furutani, H., and Prather, K. A.: Development and Characterization of an Aerosol Time-of-Flight Mass Spectrometer with Increased Detection Efficiency, Anal. Chem., 76, 712–719, https://doi.org/10.1021/ac034797z, 2004.
Wang, X., Shen, Y., Lin, Y., Pan, J., Zhang, Y., Louie, P. K. K., Li, M., and Fu, Q.: Atmospheric pollution from ships and its impact on local air quality at a port site in Shanghai, Atmos. Chem. Phys., 19, 6315–6330, https://doi.org/10.5194/acp-19-6315-2019, 2019.
Wenzel, R. J. and Prather, K. A.: Improvements in ion signal reproducibility obtained using a homogeneous laser beam for on-line laser desorption/ionization of single particles, Rapid Commun. Mass Sp., 18, 1525–1533, https://doi.org/10.1002/rcm.1509, 2004.
Xiao, Q., Li, M., Liu, H., Fu, M., Deng, F., Lv, Z., Man, H., Jin, X., Liu, S., and He, K.: Characteristics of marine shipping emissions at berth: profiles for particulate matter and volatile organic compounds, Atmos. Chem. Phys., 18, 9527–9545, https://doi.org/10.5194/acp-18-9527-2018, 2018.
Zawadowicz, M. A., Abdelmonem, A., Mohr, C., Saathoff, H., Froyd, K. D., Murphy, D. M., Leisner, T., and Cziczo, D. J.: Single-Particle Time-of-Flight Mass Spectrometry Utilizing a Femtosecond Desorption and Ionization Laser, Anal. Chem., 87, 12221–12229, https://doi.org/10.1021/acs.analchem.5b03158, 2015.
Zhai, J., Yu, G., Zhang, J., Shi, S., Yuan, Y., Jiang, S., Xing, C., Cai, B., Zeng, Y., Wang, Y., Zhang, A., Zhang, Y., Fu, T.-M., Zhu, L., Shen, H., Ye, J., Wang, C., Tao, S., Li, M., Zhang, Y., and Yang, X.: Impact of Ship Emissions on Air Quality in the Greater Bay Area in China under the Latest Global Marine Fuel Regulation, Environ. Sci. Technol., 57, 12341–12350, https://doi.org/10.1021/acs.est.3c03950, 2023.
Zhang, G., Bi, X., Qiu, N., Han, B., Lin, Q., Peng, L., Chen, D., Wang, X., Peng, P., Sheng, G., and Zhou, Z.: The real part of the refractive indices and effective densities for chemically segregated ambient aerosols in Guangzhou measured by a single-particle aerosol mass spectrometer, Atmos. Chem. Phys., 16, 2631–2640, https://doi.org/10.5194/acp-16-2631-2016, 2016.
Zhang, G., Lian, X., Fu, Y., Lin, Q., Li, L., Song, W., Wang, Z., Tang, M., Chen, D., Bi, X., Wang, X., and Sheng, G.: High secondary formation of nitrogen-containing organics (NOCs) and its possible link to oxidized organics and ammonium, Atmos. Chem. Phys., 20, 1469–1481, https://doi.org/10.5194/acp-20-1469-2020, 2020.
Zhang, X., Zhang, Y., Liu, Y., Zhao, J., Zhou, Y., Wang, X., Yang, X., Zou, Z., Zhang, C., Fu, Q., Xu, J., Gao, W., Li, N., and Chen, J.: Changes in the SO2 Level and PM2.5 Components in Shanghai Driven by Implementing the Ship Emission Control Policy, Environ. Sci. Technol., 53, 11580–11587, https://doi.org/10.1021/acs.est.9b03315, 2019.
Zhang, Y., Deng, F., Man, H., Fu, M., Lv, Z., Xiao, Q., Jin, X., Liu, S., He, K., and Liu, H.: Compliance and port air quality features with respect to ship fuel switching regulation: a field observation campaign, SEISO-Bohai, Atmos. Chem. Phys., 19, 4899–4916, https://doi.org/10.5194/acp-19-4899-2019, 2019.
Zhu, S., Li, L., Wang, S., Li, M., Liu, Y., Lu, X., Chen, H., Wang, L., Chen, J., Zhou, Z., Yang, X., and Wang, X.: Development of an automatic linear calibration method for high-resolution single-particle mass spectrometry: improved chemical species identification for atmospheric aerosols, Atmos. Meas. Tech., 13, 4111–4121, https://doi.org/10.5194/amt-13-4111-2020, 2020.