the Creative Commons Attribution 4.0 License.
the Creative Commons Attribution 4.0 License.
 | 17 Jan 2024
Development of an integrated model framework for multi-air-pollutant exposure assessments in high-density cities
Zhiyuan Li
Kin-Fai Ho
Harry Fung Lee
Exposure models for some criteria of air pollutants have been intensively developed in past research; multi-air-pollutant exposure models, especially for particulate chemical species, have been however overlooked in Asia. Lack of an integrated model framework to calculate multi-air-pollutant exposure has hindered the combined exposure assessment and the corresponding health assessment. This work applied the land-use regression (LUR) approach to develop an integrated model framework to estimate 2017 annual-average exposure of multiple air pollutants in a typical high-rise and high-density Asian city (Hong Kong, China) including four criteria of gaseous air pollutants (particulate matter with an aerodynamic diameter equal to or less than 10 µm (PM10) and 2.5 µm (PM2.5), nitrogen dioxide (NO2), and ozone (O3)), as well as four major PM10 chemical species. Our integrated multi-air-pollutant exposure model framework is capable of explaining 91 %–97 % of the variability of measured gaseous air pollutant concentration, with the leave-one-out cross-validation R2 values ranging from 0.73 to 0.93. Using the model framework, the spatial distribution of the concentration of various air pollutants at a spatial resolution of 500 m was generated. The LUR model-derived spatial distribution maps revealed weak-to-moderate spatial correlations between the PM10 chemical species and the criteria of air pollutants, which may help to distinguish their independent chronic health effects. In addition, further improvements in the development of air pollution exposure models are discussed. This study proposed an integrated model framework for estimating multi-air-pollutant exposure in high-density and high-rise urban areas, serving an important tool for multi-air-pollutant exposure assessment in epidemiological studies.
- Article
(8203 KB) - Full-text XML
-
Supplement
(2022 KB) - BibTeX
- EndNote


Ambient air pollution has been identified as one of the most important health risk factors, contributing to premature deaths and disabilities worldwide (Bowe et al., 2018; Burnett et al., 2018; HEI, 2019; Yim et al., 2019, 2022). In 2017, air pollution was ranked fifth among all-mortality risk factors globally, accounting for nearly 5 million premature deaths (HEI, 2019). Ambient PM2.5 (particles of aerodynamic diameter less than or equal to 2.5 µm) was associated with 2.9 million premature deaths, and ozone (O3) accounted for approximately 0.5 million premature deaths in 2017 (HEI, 2019). Numerous previous epidemiological studies have documented good evidence of the positive association between air pollution exposure and various types of health-effect endpoints, such as stroke, heart diseases, asthma, and lung cancer (Crouse et al., 2015; Fan et al., 2018; Renzi et al., 2019; Wang et al., 2017; Xue et al., 2021). For example, Renzi et al. (2019) estimated that there were increases of 0.8 %, 0.9 %, and 1.4 % in non-accidental, cardiovascular, and respiratory mortality, respectively, for every 1 µg m−3 increase in annual-average PM10 (particles of aerodynamic diameter less than or equal to 10 µm) concentration in the Latium region of Italy during 2006–2012.
Polluted air mass contains a complex mixture of toxic particles and various gas-phase pollutants. Health effects from air pollution are consequences from combined exposure to air pollution mixtures (Coker et al., 2016; Levy et al., 2014; Stafoggia et al., 2017; J. Wang et al., 2022; Xue et al., 2021; Yim et al., 2022). For instance, J. Wang et al. (2022) found that PM10 and O3 dominated the health effects of air pollution mixtures on obstructive sleep apnea, a common sleep-related breathing disorder, in a cross-sectional study in Beijing, China. Up until now, most epidemiological studies targeting air pollution and various health endpoints have typically focused on estimating the adverse health effects associated with exposure to a single air pollutant (or pollutant category) mainly due to the difficulties of conducting a multi-air-pollutant exposure assessment (Dominici et al., 2010; Y. Wang et al., 2022). In recent years, the scientific community has been moving toward a multi-air-pollutant concept to quantify the health hazards of air pollution mixtures as a whole (H. Chen et al., 2020; Dominici et al., 2010; Mauderly et al., 2010; Vedal and Kaufman, 2011; Xue et al., 2021; Yim et al., 2022). To achieve this target, we need to work on multi-air-pollutant exposure assessment to support the corresponding health-related studies (Billionnet et al., 2012; Mauderly et al., 2010).
In order to assess health effects of air pollution mixture, an integrated model framework is urgently needed to estimate exposure to multiple air pollutants. However, available exposure assessment studies have typically focused on one or several criteria of air pollutants, mainly traffic-related air pollutants including PM2.5 and NO2 (Cai et al., 2020; Cordioli et al., 2017; Hoek et al., 2008; Jin et al., 2019; Luminati et al., 2021; Ross et al., 2007; Xu et al., 2019). For example, Jin et al. (2019) estimated annual-average exposure to PM2.5 and NO2 in Lanzhou, China, with R2 values of 0.77 and 0.71, respectively. In addition, Luminati et al. (2021) developed a NO2 exposure model in Sao Paulo, Brazil, using the land-use regression (LUR) approach. It should be noted that chemical species of ambient particles have their significance in addition to independent toxicity and health risks (Li et al., 2022; Rappazzo et al., 2021; Requia et al., 2019; Y. Wang et al., 2022). Apart from the criteria of gaseous air pollutants, the chemical species of ambient particles should also be studied (Li et al., 2022; Rappazzo et al., 2021; Requia et al., 2019; Y. Wang et al., 2022). To the best of our knowledge, none of these previous studies has comprehensively evaluated the spatial heterogeneity among a large set of air pollutants (e.g., particulates and their chemical species and gaseous pollutants) (Cai et al., 2020; Hoek et al., 2008; Li et al., 2021). Thus, it is essential to explore the establishment of an integrated multi-air-pollutant model framework to support epidemiological studies to isolate the health effects of multiple air pollutants.
The major objective of this study was to develop an integrated model framework for multi-air-pollutant exposure assessments in high-density and high-rise cities. The case of Hong Kong was illustrated to estimate annual-average exposure to major chemical species of ambient PM10 as well as ambient PM10, PM2.5, NO2, and O3. Materials and methods, including the development and application of an integrated multi-air-pollutant model framework in Hong Kong, are described in Sect. 2. Section 3 presents the established multi-air-pollutant models and the spatial distribution maps of targeted air pollutants derived from the established models. The discussion and implications are provided in Sect. 4.
We developed an integrated model framework for establishing multi-air-pollutant exposure models with two major modules of particulate matter (PM module) and gaseous pollutants (GAS module) (Fig. 1). The PM and GAS modules were separated because the measurement and LUR modeling of PM species and gaseous pollutants are largely different in terms of measurement techniques, the number of required measurement sites, selected predictor variables, etc. The integrated model framework handles the input datasets required for the PM and GAS modules and develops the LUR model for each air pollutant independently. The LUR models and the corresponding spatial distribution maps within each module can be used to further validate the LUR models and the corresponding spatial distribution maps under the same or another module (Li et al., 2021). For instance, in high-density cities, the spatial distribution of O3 typically shows a generally opposite spatial variability compared with traffic-related air pollutants, e.g., NOx because of NOx titration. The established LUR models of the PM and GAS modules were used for assessing exposure to different air pollutants in epidemiological studies. In the present study, the PM module includes the LUR models for different sizes of PM and its chemical components, whereas the GAS module includes the LUR models for two typical gaseous pollutants of NO2 and O3. The included air pollutants can vary depending on the data availability when the proposed integrated model framework is applied for other cities in future studies.
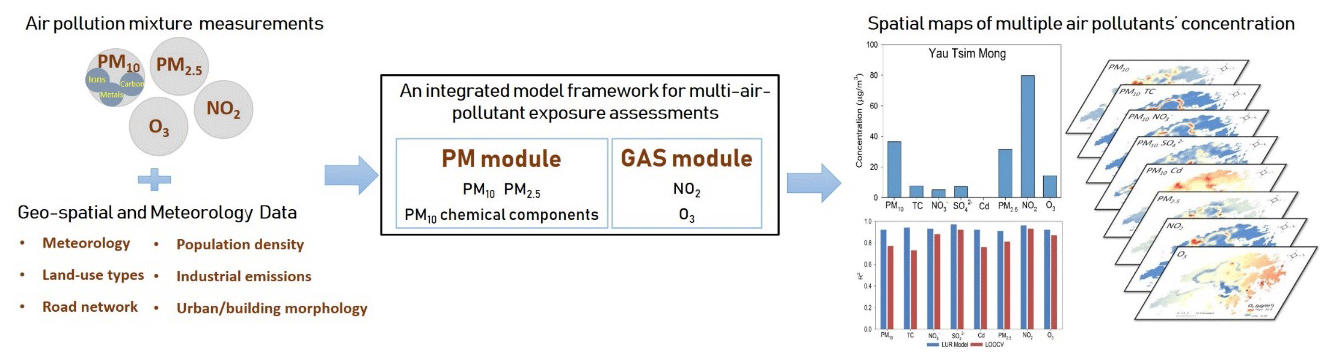
Figure 1An integrated model framework for multi-air-pollutant exposure assessments in high-density cities. It mainly includes two components of particulate matter (PM module) and gaseous pollutants (GAS module). PM module consists of the measurement and LUR modeling of PM2.5, PM10, and PM10 major chemical components (e.g., ions, metals, and carbon), while GAS module involves the measurement and LUR modeling of NO2 and O3.
2.1 Study area
Hong Kong (latitude 22∘08′ N to 22∘35′ N, longitude 113∘49′ E to 114∘31′ E) is a mountainous high-density and high-rise city situated on the southeast coast of the Pearl River Delta (PRD) region, China (Yim et al., 2009). Hong Kong has a total land area of about 1100 km2, of which 24 % is built-up area. It has a population of over 7 million, and the population density of 6690 people per square kilometer is among the highest in the world (Li et al., 2018). Hong Kong is characterized by cool and dry winters with an average temperature of 19 ∘C, and hot and humid summers with afternoon temperatures often above 31 ∘C and night temperatures around 26 ∘C (HKO, 2020). Hong Kong is typically influenced by the transboundary air pollution issue, when polluted air masses are transported from the PRD region and beyond to the region in winter (Lee et al., 2017; Li et al., 2020; Yim, 2020). The traffic density in Hong Kong is among the highest in the world, with 839 882 registered vehicles on 2100 km of road in 2017 (HKTD, 2020). Therefore, traffic emissions from different types of vehicles are another important source of air pollution in Hong Kong (Li et al., 2022).
2.2 Air pollution monitoring data
The Hong Kong air quality monitoring network provides a suitable demonstration because the locations of air quality monitoring stations (AQMSs) were chosen with reference to international guidelines and with practical consideration for the localized city characteristics (Fig. S1 in the Supplement). The environmental characteristics of the AQMSs are summarized in Table S1 in the Supplement. The daily average concentration data of PM10, PM2.5, NO2, and O3, measured at 16 AQMSs, operated by the Hong Kong Environmental Protection Department (HKEPD), were collected from 1 January to 31 December 2017 (https://cd.epic.epd.gov.hk/EPICDI/air/station/, last access: September 2023). These AQMSs are generally diverse and representative, ranging from rural stations under a limited influence of anthropogenic emissions to traffic stations near the major roads in Hong Kong. PM10 and PM2.5 were measured continuously by automatic monitors, while the Opsis AR 500 system and the T-API 400 system were used to measure NO2 and O3 concentration, respectively (HKEPD, 2018). The details for the list of equipment for measurement of air pollutant concentration as well as the quality control and assurance procedures are documented in HKEPD (2018). All of the air pollutant concentration data had at least 345 daily values, which represented a relatively complete set of data. Due to data availability, the 2017 annual-average concentration of these air pollutants was estimated for development of the LUR models using collected daily air pollutant concentration data. In addition, the annual-average concentration of four major PM10 chemical species, including total carbon (TC), nitrate (NO), sulfate (SO), and cadmium (Cd), at 10 AQMSs was collected from the air quality reports of the HKEPD (https://www.aqhi.gov.hk/en/download/air-quality-reportse469.html?showall=&start=1, last access: September 2023) for development of the LUR models.
2.3 Potential predictor variables
All of the potential predictor variables with their corresponding buffer sizes and data sources are summarized in Table S2 and Fig. S2. Meteorological variables (i.e., wind speed, wind direction, relative humidity, and temperature) were collected from nearby weather stations operated by the Hong Kong Observatory (https://www.hko.gov.hk/en/index.html, last access: September 2023). In addition, five categories of geospatial predictor variables including land use, road networks with traffic volume information, population density data, topography, and urban/building morphology were collected from various databases (Table S2). The ArcGIS software, version 10.6 (ESRI Inc., Redlands, CA, USA), was used to process these datasets. The land-use type was classified into 10 main categories and 27 subcategories. The 10 main categories of land use were residential, commercial, industrial, institutional/open space, transportation, other urban or built-up land, agriculture, woodland/shrubland/grassland/wetland, barren land, and water bodies (https://www.pland.gov.hk/pland_en/info_serv/open_data/landu/index.html, last access: September 2023). The traffic volume data for different vehicle types were provided by the Hong Kong Transport Department (https://data.gov.hk/en-data/dataset/hk-td-tis_15-road-network-v2, last access: September 2023). Seven vehicle types, private cars, non-franchised buses, light goods vehicles, franchised buses, medium and heavy goods vehicles, taxis, and public light buses, were counted. Values of these geospatial variables with buffer sizes of 50, 100, 300, 500, 700, 1000, 2000, 3000, 4000, and 5000 m around the AQMSs were estimated as the potential predictor variables using an ArcGIS buffer analysis. The geolocations (longitude and latitude) were also adopted because they can reveal a north–south or west–east variability gradient of air pollutant concentrations that cannot be captured by the selected predictor variables in the model (Huang et al., 2017). The geographical coordinate information for each station was obtained from the HKEPD.
2.4 Development of multi-air-pollutant exposure models
The LUR approach was based on the principle that air pollutant concentration at a given location depends on the environmental features (e.g., land-use types, traffic volume, meteorological conditions) of the surrounding area (Text S1 in the Supplement) (Li et al., 2022; Lu et al., 2020; Meng et al., 2015; Naughton et al., 2018; Wu et al., 2017). The supervised forward linear regression method was utilized to conduct the LUR modeling of multiple air pollutants (Eeftens et al., 2012, 2016; Huang et al., 2017; Jin et al., 2019; Liu et al., 2016; Saha et al., 2020). The method computed the direction of effect for a predictor variable to reflect the effect of the predictor variable on air pollutant concentration. It should be noted that the direction of effect can be positive or negative. Hence, the method first judged the direction of effect for each type of predictor variable based on the currently known relationship between the predictor variable and the corresponding air pollutant. As a secondary pollutant, O3 is involved in many complex chemical reactions, and the expected directions of its effects were not as clear as that of other air pollutants (Li et al., 2022; Wolf et al., 2017), and O3 has to be thus considered carefully in the process. Using the full dataset, we ranked all the predictor variables based on their adjusted explained variance (adjusted R2) with air pollutant concentration. The predictor variable with the highest adjusted R2 was selected to be included in the model when the direction of effect was consistent with our judgment. We then evaluated which of the remaining predictor variables further improved the adjusted R2 of the LUR model and selected the one giving the largest gain in the adjusted R2 of the model and with the expected direction of effect. Subsequent predictor variables were not selected when they changed the direction of effect of one of the previously included predictor variables. This process proceeded until there were no more predictor variables with the expected direction of effect, which added at least 1 % to the adjusted R2 of the previous LUR model. Finally, the predictor variables with a P value above 0.10 were removed from the LUR model. If the variance inflation factor (VIF), which measured the severity of multicollinearity in the regression analysis, was higher than 5.0, the predictor variable with the highest VIF was removed, and the model was then re-established (Gulliver et al., 2018; Hsu et al., 2018; Jones et al., 2020; Ma et al., 2019; Zhang et al., 2015). Due to this procedure, the included predictor variables may obscure the potential influence of others.
The spatial autocorrelation (Moran's I) tool measured spatial autocorrelation using both feature locations and feature values simultaneously. Meanwhile, z score and P values were calculated to evaluate the significance of Moran's I value. z score values are standard deviations, whereas the Moran's I index is bounded by −1.0 and 1.0. When the z score or P value indicates statistical significance, a positive Moran's I index value indicates tendency towards clustering, whereas a negative Moran's I index value indicates tendency towards dispersion (Cordioli et al., 2017; Luminati et al., 2021). Moran's I index and the corresponding z score and P value on concentration residuals of the final LUR models were quantified using the ArcGIS software to evaluate their spatial autocorrelation. Leave-one-out cross-validation (LOOCV) was used to evaluate the predictive ability of the established LUR model to a new dataset (Ma et al., 2019; Wu et al., 2017). In brief, each station was withheld from the model sequentially, whereas the remaining stations were used to establish the model. The concentration at the withheld station was estimated using the established model in each iteration. The procedure was repeated until all the stations have been predicted once (Eeftens et al., 2016; Ji et al., 2019; Wolf et al., 2017). We validated the model performance using training and LOOCV R2 values calculated based on the linear regression between measured and predicted concentration of the omitted stations. The statistical analysis was performed using the R statistical software, version 3.5.2 for Windows (R Foundation for Statistical Computing, Vienna, Austria).
2.5 Spatial mapping of studied air pollutants
The spatial distribution maps of predicted annual-average concentration of PM10 and its chemical species, PM2.5, NO2, and O3 were generated by our final LUR models, following the typical procedures of previous studies (Cai et al., 2020; Huang et al., 2017; Xu et al., 2019). A spatial resolution of 500 m was adopted here due to the spatial resolution of most predictor variables being several hundred meters. The study area of Hong Kong was divided into grids at the spatial resolution of 500 m, and the air pollutant concentration at the centroid of each grid was estimated. Finally, the pollution distribution maps were generated using the predicted concentration values (Henderson et al., 2007). The LUR model estimated concentration of the studied air pollutants in the 18 districts of Hong Kong, which was summarized and compared.
3.1 Air pollutant measurements
The measurements at the AQMSs show that the annual-average PM10 and PM2.5 concentration varied over 30.9–45.7 and 18.4–31.2 µg m−3, respectively (Fig. S3), which was higher than the air quality guideline (AQG) for PM10 (15.0 µg m−3) and PM2.5 (5.0 µg m−3) proposed by the World Health Organization (WHO) (WHO, 2021). PM10 TC, PM10 NO, PM10 SO, and PM10 Cd had annual-average concentration of 4511–9019, 2920–4642, 6713–7525, and 0.58–0.72 ng m−3, respectively. The annual-average NO2 concentration was from 9.70 to 197.0 µg m−3, which were generally higher than the WHO NO2 AQG of 10 µg m−3 (WHO, 2021). The annual-average O3 concentration ranged from 17.8 to 73.9 µg m−3 in Hong Kong (Fig. S3).
3.2 Multi-air-pollutant exposure models
The established annual-average LUR models for ambient PM10, PM2.5, NO2, O3, and four major PM10 chemical species are shown in Table S3. The training R2 values ranged between 0.91 and 0.97, whereas the LOOCV R2 values ranged between 0.73 and 0.93. The results proved that the established LUR models overall achieved relatively good predictive accuracy (Table S3, Figs. 2, S4, S5, S6, and S7). The prediction error fractions of the LUR models ranged from −5.9 % to 7.0 %, −6.1 % to 14 %, −4.5 % to 7.3 %, −1.1 % to 1.2 %, −2.3 % to 3.8 %, −8.1 % to 8.6 %, −24 % to 25 %, and −13 % to 27 %, respectively, for PM10, PM10 TC, PM10 NO, PM10 SO, PM10 Cd, PM2.5, NO2, and O3 (Fig. 2). There were two to five predictor variables included in the final models. The number of predictor variables was typically within the range of the number of predictor variables in previous studies (Cai et al., 2020; Henderson et al., 2007; Li et al., 2022; Meng et al., 2016; Miri et al., 2019). The selection of these predictor variables was driven by the emission sources of the air pollutants, the dispersion and transport conditions, and the influence of transboundary air pollution in Hong Kong. The selected predictor variables included traffic emission-related variables, different land-use types (e.g., the industrial land), population density, urban morphology (e.g., the canyon height), and geographical locations (Table S3).
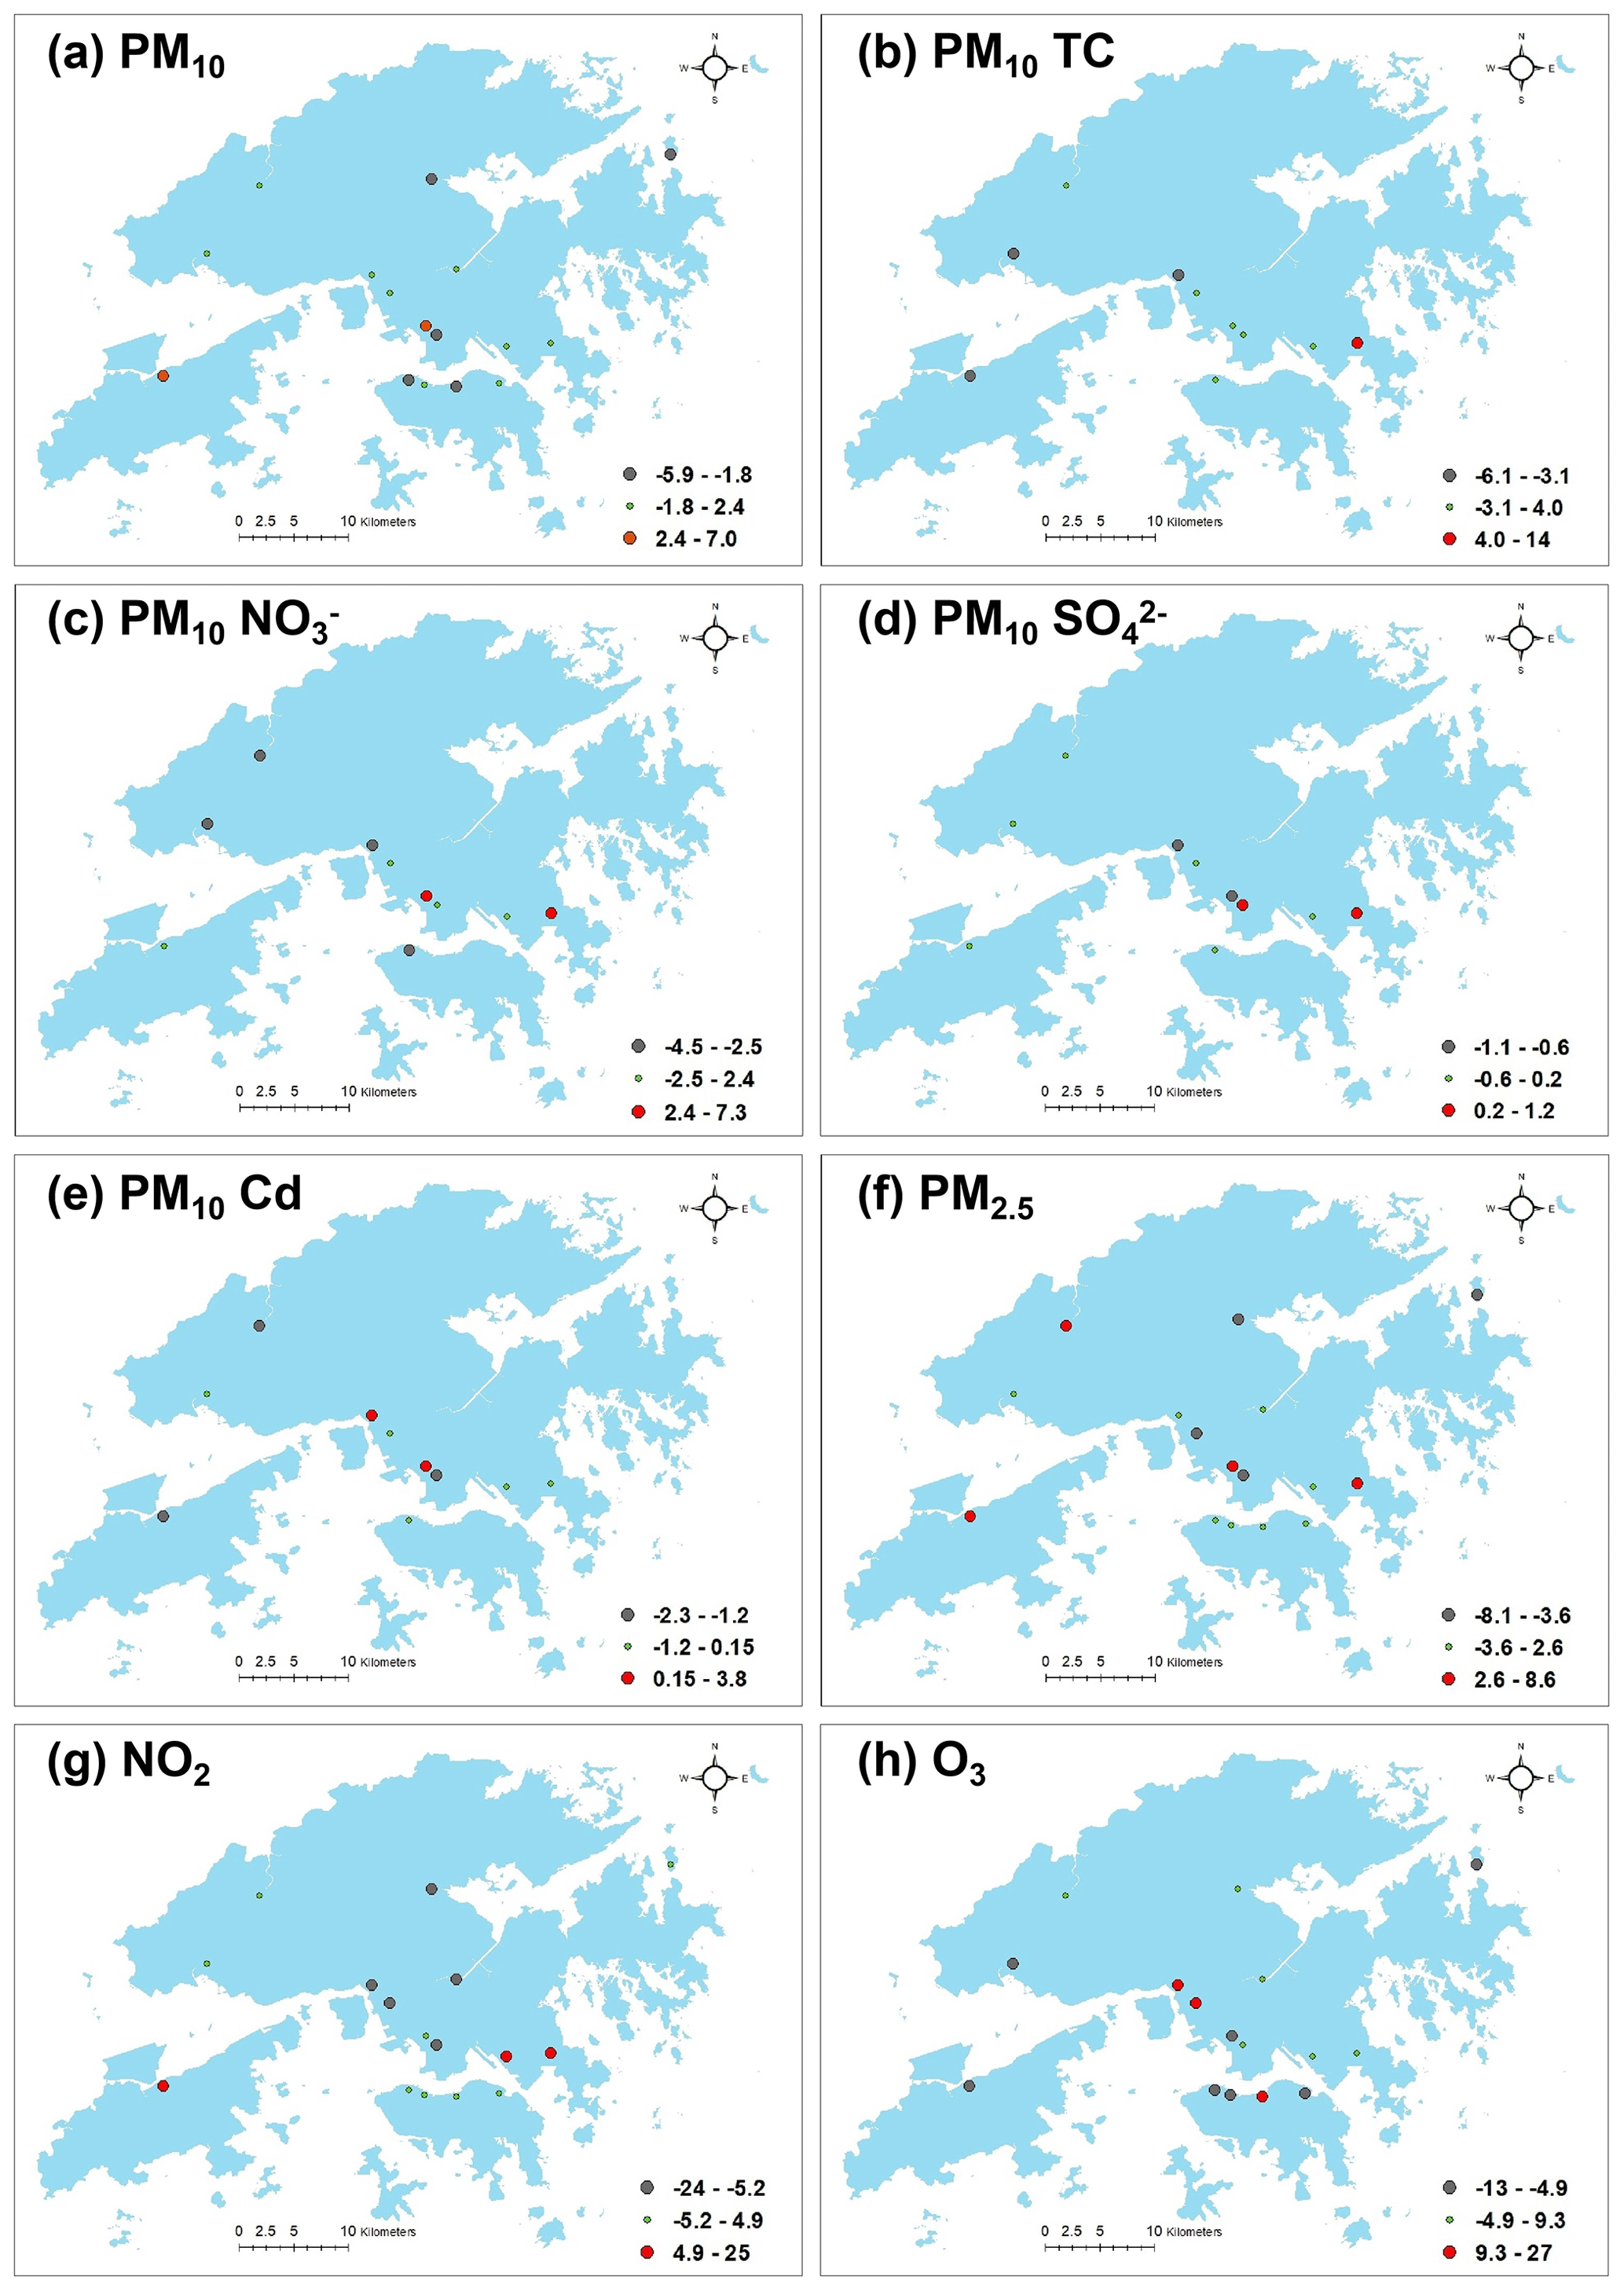
Figure 2The distribution of prediction error fractions (%) of the established LUR models. The prediction error fraction is defined as [(predicted concentration − observed concentration)observed concentration].
Five predictor variables were entered into the PM10 LUR model, including the number of private cars with a buffer size of 100 m, the area of buildings within a 100 m buffer, the area of residential land with a buffer size of 100 m, the area of industrial land within a 3000 m buffer, and the area of urban green space with a buffer size of 4000 m. Among these predictor variables, only the urban green space had a negative direction of effect. The R2 and LOOCV R2 values were 0.92 and 0.77, respectively, representing remarkable PM10 concentration prediction (Table S3). Residual spatial autocorrelation analysis of the PM10 LUR model is shown in Fig. S8. The z score was 0.399, which means that the model residuals were not spatially correlated, confirming that the PM10 LUR model was reasonably established.
For the LUR models of PM10 chemical species, two to three predictor variables were selected finally. As expected, the traffic-related predictor variables and urban/building morphology-related parameters dominated the variability of the four chemical species. This was because the PM10 chemical species in the city were mainly influenced by vehicular emissions and urban form patterns (Hsu et al., 2018; Li et al., 2022). For example, the Cd LUR model included the area of transportation land with a buffer size of 2000 m, latitude, and the average canyon height within a 300 m buffer. The R2 ranged from 0.92 to 0.97, whereas the LOOCV R2 values ranged between 0.73 and 0.92, suggesting relatively high predictive accuracy (Table S3). The assumption of spatial error independence was confirmed with z score values of −0.249, 0.453, −0.504, and −0.843 for PM10 TC, PM10 NO, PM10 SO, and PM10 Cd, respectively (Fig. S8).
The PM2.5 LUR model included five predictor variables, namely the number of light-duty vehicles with a buffer size of 500 m, the area of urban green space within a 4000 m buffer, the area of residential land with a buffer size of 300 m, the area of buildings within a 50 m buffer, and the maximum building height with a buffer size of 100 m. Four of these variables were the same as those in the PM10 LUR model, even though the buffer sizes varied. The R2, LOOCV R2, and z score values all confirmed that the PM2.5 LUR model was reasonably established with acceptable statistical performance (Table S3 and Fig. S8).
The predictor variables included in the NO2 LUR model were the number of total vehicles within a 500 m buffer, the number of people with a buffer size of 100 m, and the area of industrial land within a 1000 m buffer. These predictor variables all had a positive effect on NO2 concentration, as evidenced by the positive regression slope values. The R2 and LOOCV R2 values were 0.96 and 0.93, respectively, indicating the relatively good prediction performance of the model (Table S3). The model residuals were spatially independent, with a z score value of 0.935 (Fig. S8).
The predictor variables included in the O3 LUR model were the number of total vehicles with a buffer size of 700 m, longitude, and the area of urban green space within a 300 m buffer. The predictor variable of vehicles had a negative effect on O3 concentration. This negative effect reflected the titration of O3 in urban areas with high quantities of NO and NO2 emitted by traffic (Han et al., 2023). Longitude had a positive effect on O3 concentration, suggesting the influence of regional transported air masses. A LUR study in Nanjing, China also included longitude in the final O3 model (Huang et al., 2017). Urban green space had a positive effect on O3 concentration, which was probably due to biogenic volatile organic compounds as the precursors of ozone formation (Ma et al., 2021; Ren et al., 2017). The R2 and LOOCV R2 values were 0.92 and 0.87, respectively, showing the relatively high predictive accuracy of the model (Table S3). The z score (1.186) of the residual spatial autocorrelation analysis indicates that the O3 LUR model was well explained by the included predictor variables, with spatially independent model residuals (Fig. S8).
3.3 Spatial distribution maps
The spatial distribution maps of multiple air pollutants derived from established LUR models are shown in Fig. 3, whereas Table S4 shows the statistical description of the estimated air pollutant concentration. The PM10, PM2.5, and NO2 LUR models included several predictor variables representing vehicular emissions, e.g., the number of medium and heavy-duty vehicles with a buffer size of 500 m (Table S3). Thus, the concentration of PM10, PM2.5, and NO2 was largely affected by the traffic emissions in Hong Kong, with higher concentration estimated along the road network. In addition, the relatively higher concentration of PM10, PM2.5, and NO2 was estimated in areas with high population density (e.g., the northern part of Hong Kong Island, the Kowloon City district, and the Yau Tsim Mong district). PM10 and PM2.5 had moderate positive corrections with NO2, with Pearson correlation coefficient (PCC) values of 0.570 and 0.696, respectively (Table 1). Consistent with Li et al. (2022), the LUR model-derived concentration of PM10 TC, PM10 NO, and PM10 SO was relatively higher at developed urban areas and along major roads. In contrast to this, the spatial distribution of PM10 Cd showed a north–south gradient, with relatively higher concentration in the northern part and relatively lower concentration in the southern part. These PM10 chemical species only had weak-to-moderate positive correlations with PM10 mass, with PCC values ranging from 0.189 to 0.589 (Table 1). For O3, there was an increasing trend from west to east, suggesting the influence of transboundary pollution on the spatial distribution pattern. In addition, O3 concentration was largely affected by traffic emissions, with lower concentration estimated along major roads compared with other areas. Due to nitric oxide titration (Han et al., 2023), O3 concentration was generally negatively correlated by various degree with PM10, PM10 chemical species, PM2.5, and NO2 (Table 1).
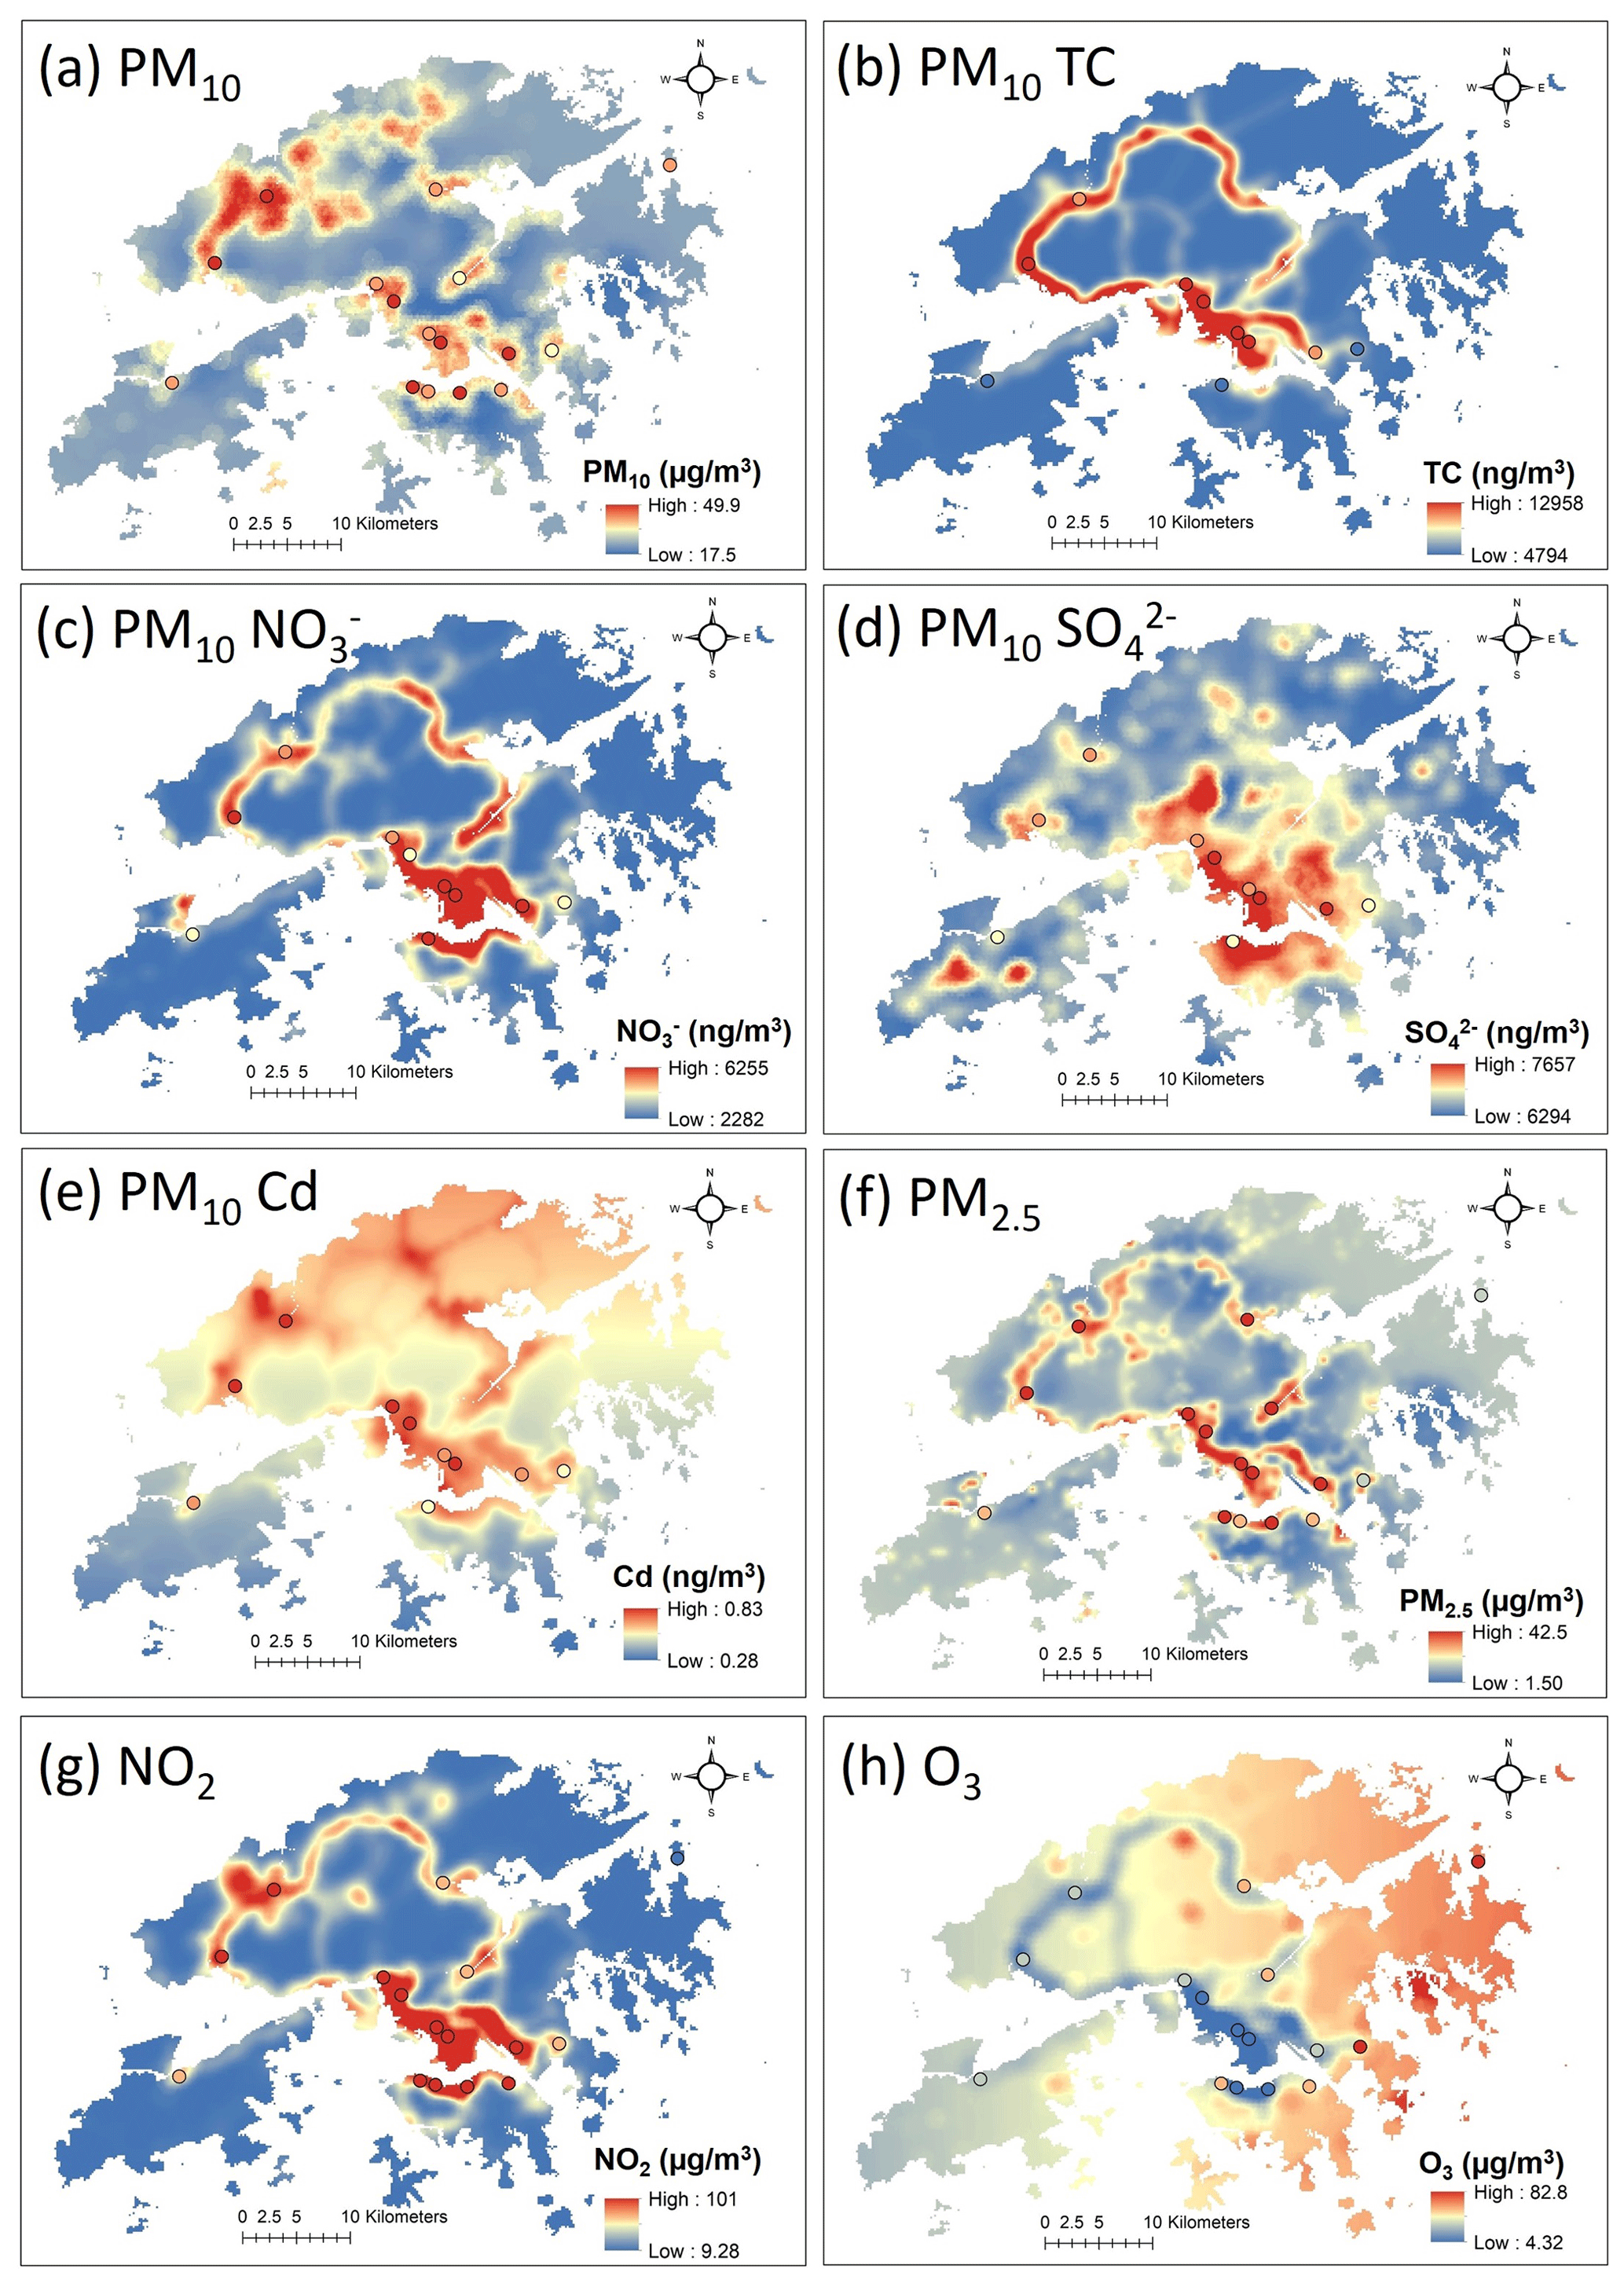
Figure 3LUR model-derived spatial distribution maps of annual-average ambient PM10, PM10 TC, PM10 NO, PM10 SO, PM10 Cd, PM2.5, NO2, and O3 concentration in Hong Kong. The colored circles represent observations at AQMSs.
Table 1Pearson correlation coefficients (PCCs) among the LUR estimated concentration of ambient PM10, PM10 TC, PM10 NO, PM10 SO, PM10 Cd, PM2.5, NO2, and O3 in Hong Kong.
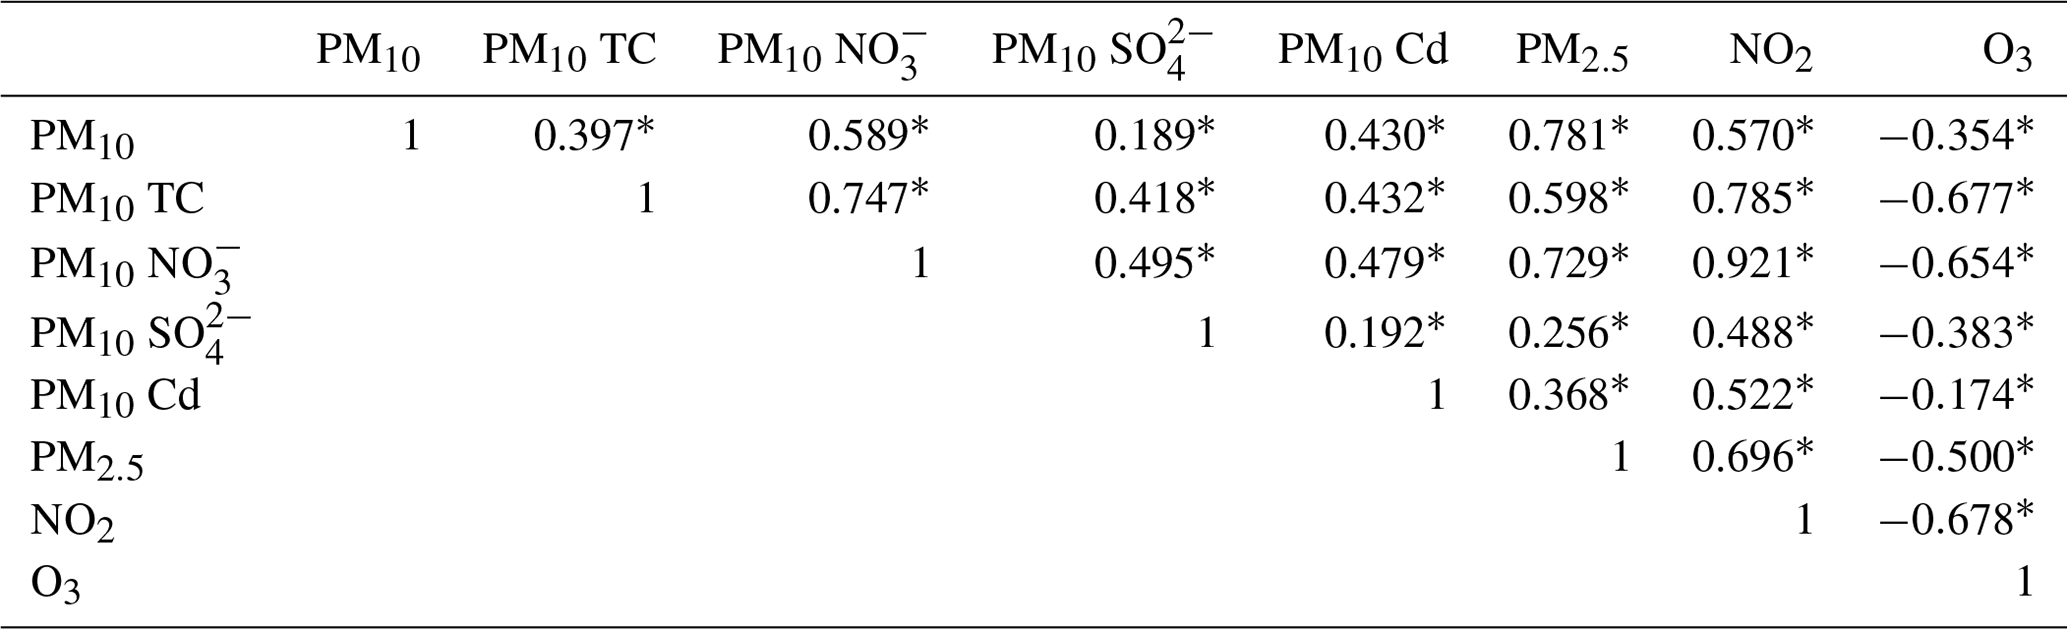
* Correlation is significant at the 0.01 level (two tailed).
The spatial patterns of the studied air pollutants varied largely among the districts (Table S5 and Fig. S9). As shown by the three example districts in Fig. 4, the Yuen Long district had relatively high concentration of PM10, PM10 species, and PM2.5, and moderate concentration of NO2 and O3. For the Yau Tsim Mong district, the PM10, PM10 species, PM2.5, and NO2 concentration was relatively high, whereas the O3 concentration was relatively low. In contrast to this, the Sai Kung district had quite high concentration of O3 but relatively low concentration of other studied air pollutants.
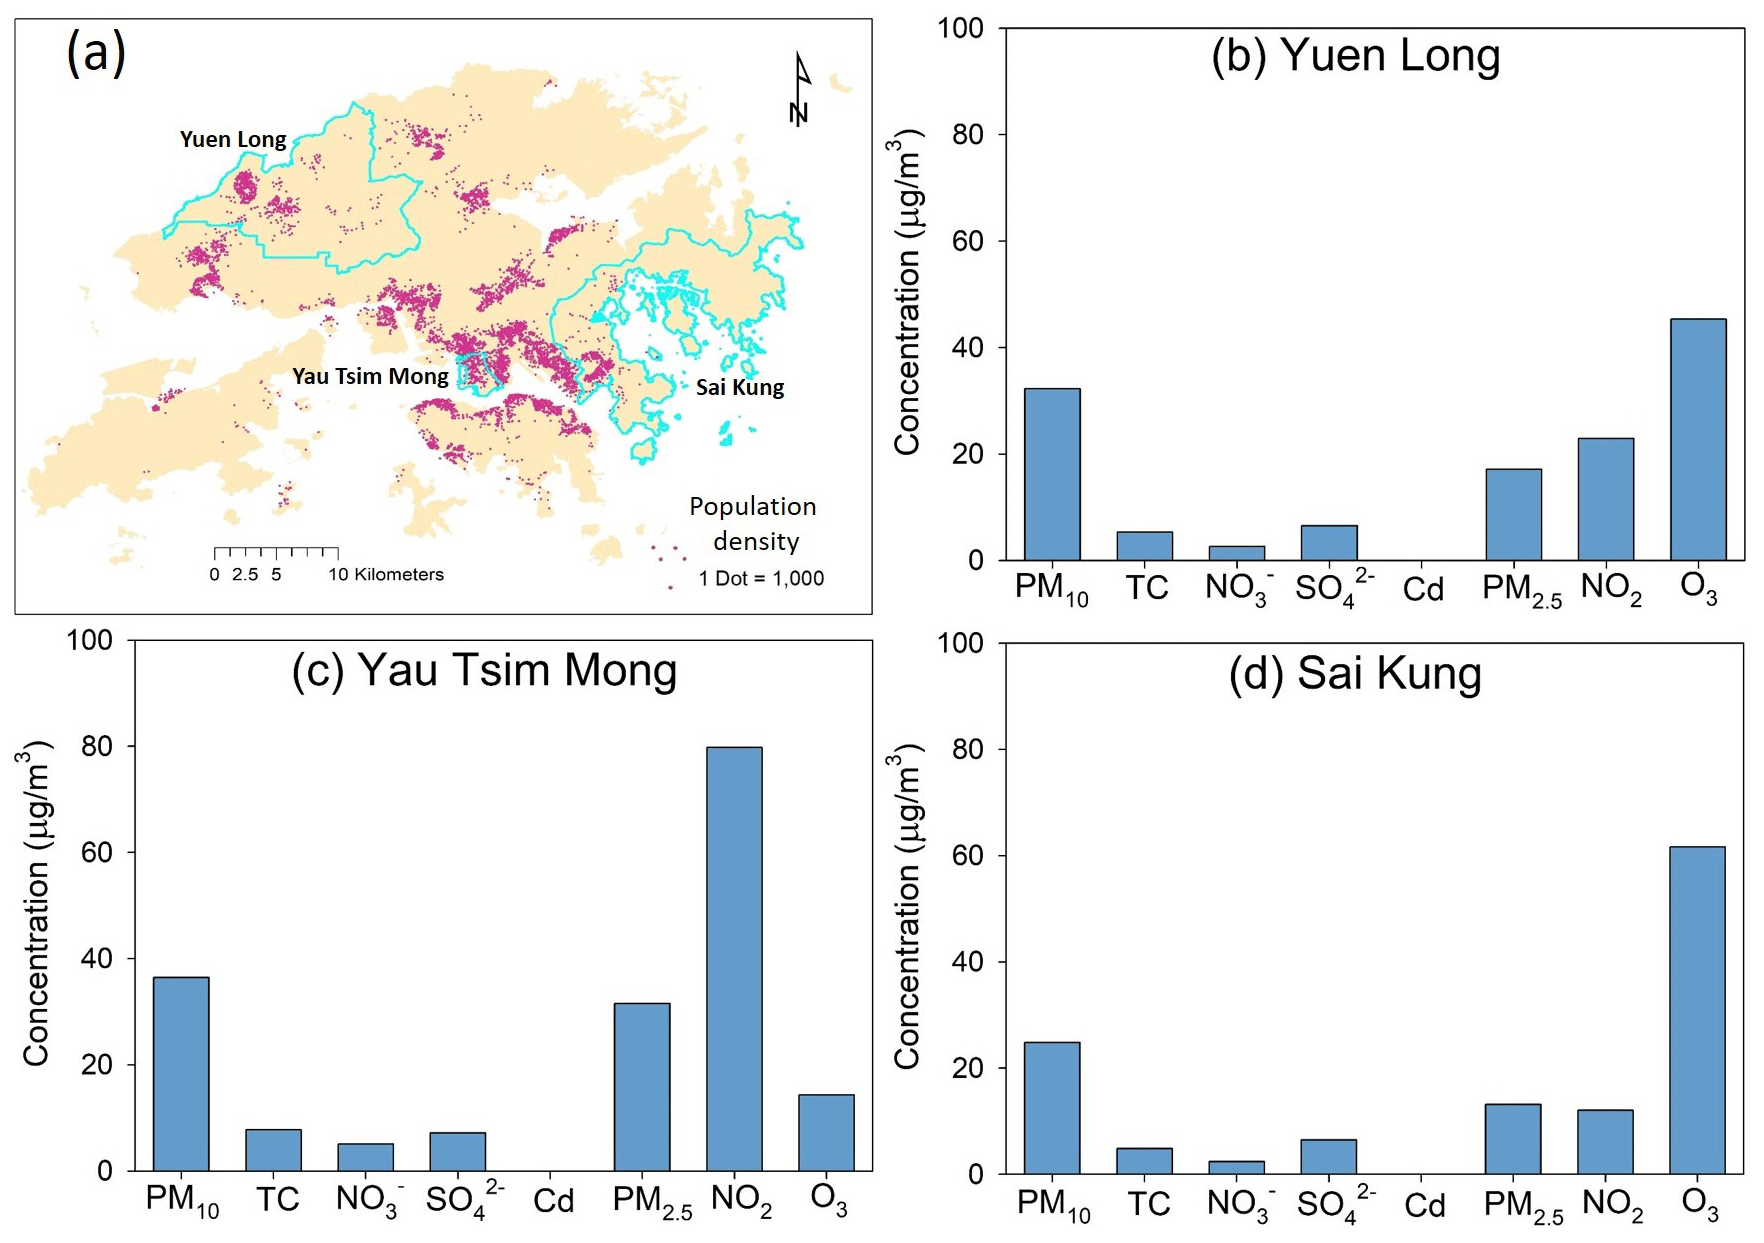
Figure 4The average LUR estimated ambient PM10, PM10 TC, PM10 NO, PM10 SO, PM10 Cd, PM2.5, NO2, and O3 concentration in three representative districts in Hong Kong. (a) The distribution of Yuen Long, Yau Tsim Mong, and Sai Kung districts in Hong Kong with the population density shown. (b) Yuen Long (a district more influenced by the transboundary pollution). (c) Yau Tsim Mong (a high-density district more influenced by vehicular emissions). (d) Sai Kung (a rural district).
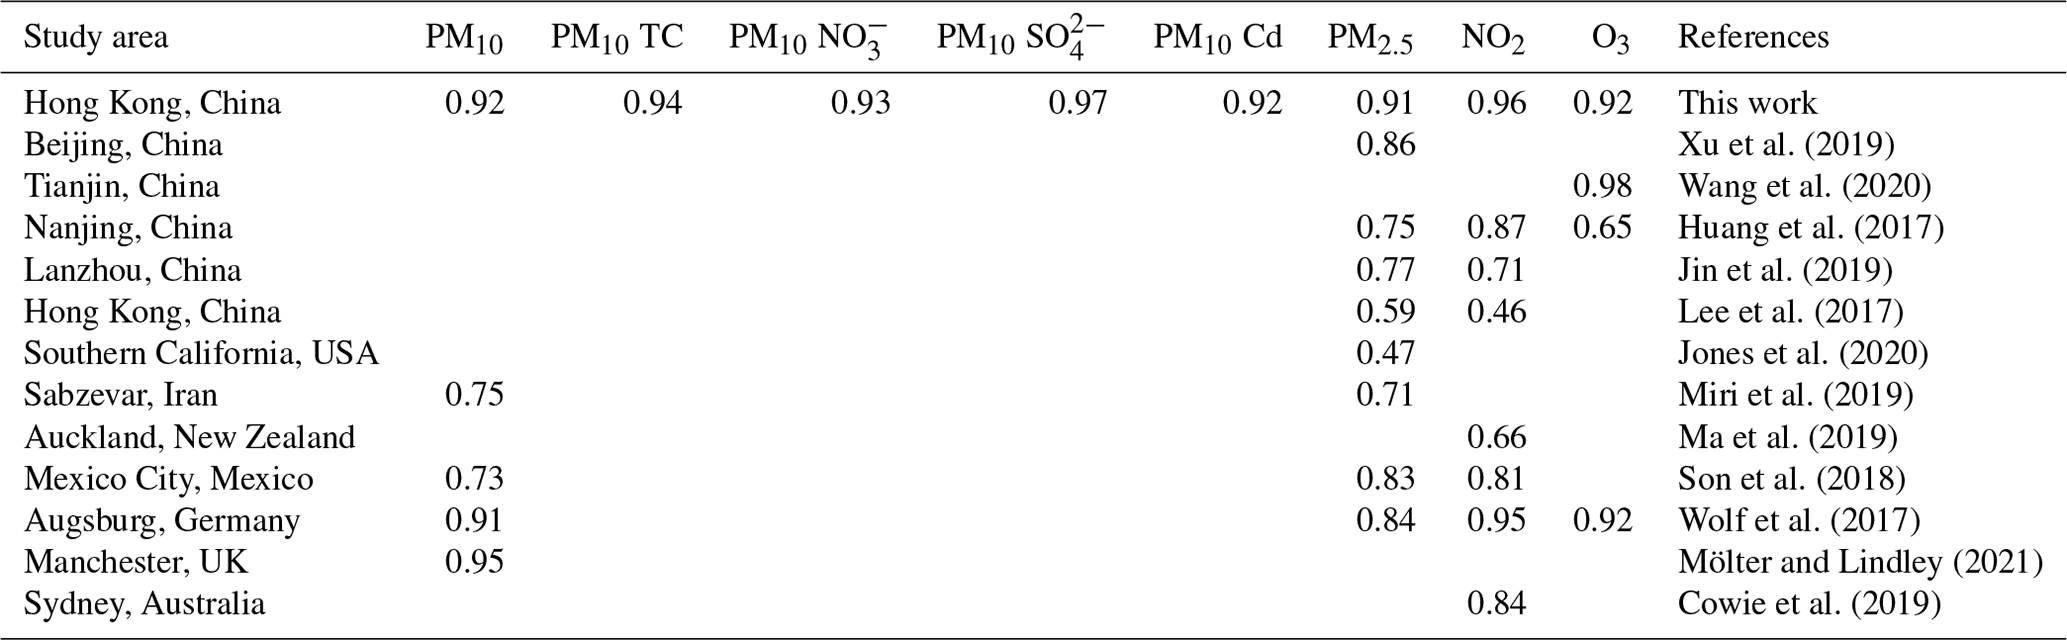
High-density cities usually have spare air quality monitoring stations. This discrepancy clearly highlighted the need to develop LUR models for the spatial mapping of air pollution in high-density cities. This work developed an integrated model framework for assessing multi-air-pollutant exposure in a high-density city based on the air quality data collected at the sparse monitoring stations. Following the proposed integrated model framework, we established multi-air-pollutant exposure models for four major PM10 chemical species as well as four criteria of gaseous air pollutants in Hong Kong using the LUR model approach (Table S3). Similar to other LUR model studies, one limitation of this study is typically the limited number of monitoring stations. It should be noted that the adequacy of monitoring should not be determined by number of stations alone. This study performed detailed evaluations to examine the adequacy of number of stations. In the GAS module, the established NO2 and O3 exposure models had R2 values of 0.96 and 0.92, respectively, which were similar with previous studies. In the PM module, our PM10 and PM2.5 exposure models achieved remarkable predictive accuracy, comparable with or higher than those of traditional LUR studies (Tables 2 and S3; Text S2). Following our previous study, Li et al. (2021), in the PM module, we established LUR exposure models of PM10 TC, PM10 NO, PM10 SO, and PM10 Cd, with model R2 values higher than 0.92 (Table S3). The detailed evaluation results prove that our models had promising performance and are capable of reflecting the air quality characteristics of the city. Therefore, our models are considered sufficient for the scope of this study. Certainty, it is strongly recommended to carry out a further study using different modeling methods (e.g., machine learning) when more data are collected from a larger number of monitoring stations and at a finer temporal resolution.
Table 2A comparison of this study with previous LUR studies. Example LUR studies focusing on at least one of the criteria of air pollutants published in recent years are included.
This research work aimed to contribute to the research area of exposure assessment through providing new opportunities to distinguish the independent associations between combined exposure to multiple air pollutants (i.e., PM10, PM10 TC, PM10 NO, PM10 SO, PM10 Cd, PM2.5, NO2, and O3) and chronic health effects. For example, the finding of weak-to-moderate spatial correlation between PM10 and its chemical species may enable epidemiological studies to separate the chronic health effects of PM10 chemical species from the total mass. In addition, the spatial variation in air pollution, together with the geospatial locations of the subjects, can be used for hotspot identification in air quality management and exposure assessment in epidemiological studies (Crouse et al., 2015; Jones et al., 2020; Li et al., 2021). The major explanation for the spatial differences in concentration of multiple air pollutants was the differences in their emission sources (Cai et al., 2020; Jin et al., 2019; Levy et al., 2014; Wu et al., 2017). For instance, PM2.5 and NO2 are more linked to traffic and industrial emissions in developed urban areas, while relatively high O3 concentration in rural areas is formed through complex chemical reactions between biogenic volatile organic compounds and nitrogen oxides (Table S3 and Fig. 3). The results highlight the importance of the synergistic control of multiple air pollutants and emission sources (Saha et al., 2020; Yim et al., 2019). For instance, the Hong Kong government has made tremendous efforts to reduce vehicular emissions over the past 2 decades that have successfully reduced traffic-related air pollutants like PM2.5 and NO2. However, as revealed by the present study and previous studies (HKEPD, 2022; Zeng et al., 2022), O3 pollution has become an emerging issue, especially in rural areas of Hong Kong. The relationship between the control of vehicular emissions and O3 pollution is complex (Song et al., 2023; Zeng et al., 2022). In Hong Kong, NOx reductions from the control of vehicular emissions may lead to an increase in the levels of oxidants and then cause net O3 production. It is suggested that the control of volatile organic compounds should be implemented to better mitigate O3 pollution in Hong Kong (Zeng et al., 2022). This highlights the importance of simulating multiple air pollutants together during exposure assessments. In addition, more research should be conducted to understand the complex and varying interaction of emission sources, pollutant sensitivity to its precursors, and air quality in a city in order to formulate more effective and specific air quality management policies.
The development and applicability of exposure models depend on the focus of the air pollution epidemiological studies, which focus on long-term, short-term, or even acute exposure. Annual and long-term LUR exposure models have been widely adopted to provide long-term exposure estimates for health studies (Chen et al., 2021; Wang et al., 2020). Meanwhile, considering the requirement for high spatial-resolution and short-term acute exposure assessment, it is recommended that more studies should be conducted to establish high spatiotemporal-resolution exposure models when detailed measurement data are available. Indeed, several recent studies have explored the possibility of estimating high spatiotemporal-resolution air pollution exposure models using the spatiotemporal statistical modeling approach (Lu et al., 2020; Masiol et al., 2018). In addition, in future studies, a multi-dimensional and multi-air-pollutant exposure modeling approach is recommended, for instance, by combining spatiotemporal statistical modeling with atmospheric chemistry knowledge and with the particulate chemical species and their toxicity and volatile organic compounds being modeled (Brokamp et al., 2017; J. Chen et al., 2020; Lu et al., 2020). In addition, the vertical distribution of air pollutants should also be measured and modeled to be combined with spatiotemporal exposure models to reveal the vertical variability of population exposure to air pollution (Eeftens et al., 2019; Ho et al., 2015; Jin et al., 2019). Moreover, most previous air pollution exposure assessment studies and the current work have focused on ambient air quality, but it is strongly recommended that more research efforts be made toward developing prediction models of air pollutant concentration in indoor environments (e.g., residential households) for more accurate exposure estimates (Tang et al., 2018).
In the present study, we developed an integrated model framework for accurate multi-air-pollutant exposure assessments in high-density and high-rise cities. Following the proposed integrated model framework, with the air pollutant concentration data from a routine monitoring network, annual-average multi-air-pollutant exposure models for ambient PM10, major PM10 chemical species, PM2.5, NO2, and O3 were developed with relatively high predictive performance in Hong Kong, a typical high-rise and high-density Asian city. The estimated air pollution maps (500 × 500 m resolution) of these air pollutant mixtures could be used to support a unique combined exposure assessment in health studies.
We anticipate that the proposed integrated model framework can be easily extended to establish multi-air-pollutant exposure models in other cities. Apart from the LUR approach, other spatiotemporal statistical modeling methods, such as various machine learning algorithms, should be applied when a larger dataset is available. Particularly, the development of high spatiotemporal exposure models should be explored when a high temporal-resolution air pollutant measurement dataset is collected. Furthermore, the associations of combined exposure to multiple air pollutants with health endpoints should be analyzed to provide new insights into the health-oriented air pollution control.
The model data presented in this article are available from the authors upon request (yimsteve@gmail.com).
The supplement related to this article is available online at: https://doi.org/10.5194/acp-24-649-2024-supplement.
ZL and SHLY designed the study. ZL performed all the data analysis with support from SHLY. ZL wrote the paper with contributions from all co-authors.
The contact author has declared that none of the authors has any competing interests.
Publisher’s note: Copernicus Publications remains neutral with regard to jurisdictional claims made in the text, published maps, institutional affiliations, or any other geographical representation in this paper. While Copernicus Publications makes every effort to include appropriate place names, the final responsibility lies with the authors.
This article is part of the special issue “Air quality research at street level – Part II (ACP/GMD inter-journal SI)”. It is not associated with a conference.
We would like to thank the Hong Kong Environmental Protection Department and the Hong Kong Observatory for providing air quality and meteorological data, respectively.
This work is funded by the Vice-Chancellor's Discretionary Fund of The Chinese University of Hong Kong (grant no. 4930744), the Dr. Stanley Ho Medical Development Foundation (grant no. 8305509), and the project from the ENvironmental SUstainability and REsilience (ENSURE) partnership between the CUHK and UoE. Zhiyuan Li was supported by the “100-top-talents Program” Start-up Grant of Sun Yat-sen University (grant no. 220204).
This paper was edited by Jason West and reviewed by two anonymous referees.
Billionnet, C., Sherrill, D., and Annesi-Maesano, I.: Estimating the health effects of exposure to multi-pollutant mixture, Ann. Epidemiol., 22, 126–141, 2012.
Bowe, B., Xie, Y., Li, T., Yan, Y., Xian, H., and Al-Aly, Z.: The 2016 global and national burden of diabetes mellitus attributable to PM2.5 air pollution, Lancet Planet. Health, 2, e301–e312, 2018.
Brokamp, C., Jandarov, R., Rao, M. B., LeMasters, G., and Ryan, P.: Exposure assessment models for elemental components of particulate matter in an urban environment: A comparison of regression and random forest approaches, Atmos. Environ., 151, 1–11, 2017.
Burnett, R., Chen, H., Szyszkowicz, M., Fann, N., Hubbell, B., Pope, C. A., Apte, J. S., Brauer, M., Cohen, A., Weichenthal, S., and Coggins, J.: Global estimates of mortality associated with long-term exposure to outdoor fine particulate matter, P. Natl. Acad. Sci. USA, 115, 9592–9597, 2018.
Cai, J., Ge, Y., Li, H., Yang, C., Liu, C., Meng, X., Wang, W., Niu, C., Kan, L., Schikowski, T., and Yan, B.: Application of land use regression to assess exposure and identify potential sources in PM2.5, BC, NO2 concentrations, Atmos. Environ., 223, 117267, https://doi.org/10.1016/j.atmosenv.2020.117267, 2020.
Chen, H., Zhang, Z., van Donkelaar, A., Bai, L., Martin, R. V., Lavigne, E., Kwong, J. C., and Burnett, R. T.: Understanding the joint impacts of fine particulate matter concentration and composition on the incidence and mortality of cardiovascular disease: A component-adjusted approach, Environ. Sci. Technol., 54, 4388–4399, 2020.
Chen, J., de Hoogh, K., Gulliver, J., Hoffmann, B., Hertel, O., Ketzel, M., Weinmayr, G., Bauwelinck, M., van Donkelaar, A., Hvidtfeldt, U. A., and Atkinson, R.: Development of Europe-wide models for particle elemental composition using supervised linear regression and random forest, Environ. Sci. Technol., 54, 15698–15709, 2020.
Chen, J., Rodopoulou, S., de Hoogh, K., Strak, M., Andersen, Z. J., Atkinson, R., Bauwelinck, M., Bellander, T., Brandt, J., Cesaroni, G., and Concin, H.: Long-term exposure to fine particle elemental components and natural and cause-specific mortality – A pooled analysis of eight European cohorts within the ELAPSE project, Environ. Health Persp., 129, 047009, https://doi.org/10.1289/EHP8368, 2021.
Coker, E., Liverani, S., Ghosh, J. K., Jerrett, M., Beckerman, B., Li, A., Ritz, B., and Molitor, J.: Multi-pollutant exposure profiles associated with term low birth weight in Los Angeles County, Environ. Int., 91, 1–13, 2016.
Cordioli, M., Pironi, C., De Munari, E., Marmiroli, N., Lauriola, P., and Ranzi, A.: Combining land use regression models and fixed site monitoring to reconstruct spatiotemporal variability of NO2 concentrations over a wide geographical area, Sci. Total Environ., 574, 1075–1084, 2017.
Cowie, C. T., Garden, F., Jegasothy, E., Knibbs, L. D., Hanigan, I., Morley, D., Hansell, A., Hoek, G., and Marks, G. B.: Comparison of model estimates from an intra-city land use regression model with a national satellite-LUR and a regional Bayesian Maximum Entropy model, in estimating NO2 for a birth cohort in Sydney, Australia, Environ. Res., 174, 24–34, https://doi.org/10.1016/j.envres.2019.03.068, 2019.
Crouse, D. L., Peters, P. A., Hystad, P., Brook, J. R., van Donkelaar, A., Martin, R. V., Villeneuve, P. J., Jerrett, M., Goldberg, M. S., Pope III, C. A., and Brauer, M.: Ambient PM2.5, O3, and NO2 exposures and associations with mortality over 16 years of follow-up in the Canadian Census Health and Environment Cohort (CanCHEC), Environ. Health Persp., 123, 1180–1186, 2015.
Dominici, F., Peng, R. D., Barr, C. D., and Bell, M. L.: Protecting human health from air pollution: shifting from a single-pollutant to a multi-pollutant approach, Epidemiol., 21, 187–194, 2010.
Eeftens, M., Beelen, R., de Hoogh, K., Bellander, T., Cesaroni, G., Cirach, M., Declercq, C., Dėdelė, A., Dons, E., de Nazelle, A., and Dimakopoulou, K.: Development of land use regression models for PM2.5, PM2.5 absorbance, PM10 and PMcoarse in 20 European study areas; results of the ESCAPE project, Environ. Sci. Technol., 46, 11195–11205, 2012.
Eeftens, M., Meier, R., Schindler, C., Aguilera, I., Phuleria, H., Ineichen, A., Davey, M., Ducret-Stich, R., Keidel, D., Probst-Hensch, N., and Künzli, N.: Development of land use regression models for nitrogen dioxide, ultrafine particles, lung deposited surface area, and four other markers of particulate matter pollution in the Swiss SAPALDIA regions, Environ. Health, 15, 53, https://doi.org/10.1186/s12940-016-0137-9, 2016.
Eeftens, M., Odabasi, D., Flückiger, B., Davey, M., Ineichen, A., Feigenwinter, C., and Tsai, M. Y.: Modelling the vertical gradient of nitrogen dioxide in an urban area, Sci. Total Environ., 650, 452–458, 2019.
Fan, Z., Pun, V. C., Chen, X. C., Hong, Q., Tian, L., Ho, S. S. H., Lee, S. C., Tse, L. A., and Ho, K. F.: Personal exposure to fine particles (PM2.5) and respiratory inflammation of common residents in Hong Kong, Environ. Res., 164, 24–31, 2018.
Gulliver, J., Morley, D., Dunster, C., McCrea, A., van Nunen, E., Tsai, M. Y., Probst-Hensch, N., Eeftens, M., Imboden, M., Ducret-Stich, R., and Naccarati, A.: Land use regression models for the oxidative potential of fine particles (PM2.5) in five European areas, Environ. Res., 160, 247–255, 2018.
Han, H., Zhang, L., Liu, Z., Yue, X., Shu, L., Wang, X., and Zhang, Y.: Narrowing Differences in Urban and Nonurban Surface Ozone in the Northern Hemisphere Over 1990–2020, Environ. Sci. Tech. Let., 10, 410–417, https://doi.org/10.1021/acs.estlett.3c00105, 2023.
HEI (Health Effects Institute): State of Global Air 2019. Special Report. Boston, MA, USA, https://www.stateofglobalair.org/sites/default/files/soga_2019_report.pdf (last access: February 2022), 2019.
Henderson, S. B., Beckerman, B., Jerrett, M., and Brauer, M.: Application of land use regression to estimate long-term concentrations of traffic-related nitrogen oxides and fine particulate matter, Environ. Sci. Technol., 41, 2422–2428, 2007.
HKEPD (Hong Kong Environmental Protection Department): Air quality in Hong Kong 2017, https://www.aqhi.gov.hk/api_history/english/report/files/AQR2017e_final.pdf (last access: February 2022), 2018.
HKEPD (Hong Kong Environmental Protection Department): Air quality in Hong Kong 2021, https://www.aqhi.gov.hk/api_history/english/report/files/AQR2021e_final.pdf (last access: August 2023), 2022.
HKO (Hong Kong Observatory): Climate of Hong Kong, http://www.hko.gov.hk/en/cis/climahk.htm# (last access: February 2022), 2020.
HKTD (Hong Kong Transport Department): Registered and licensing of vehicles by class of vehicles, https://www.td.gov.hk/en/transport_in_hong_kong/transport_figures/vehicle_registration_and_licensing/index.html (last access: February 2022), 2020.
Ho, C. C., Chan, C. C., Cho, C. W., Lin, H. I., Lee, J. H., and Wu, C. F.: Land use regression modeling with vertical distribution measurements for fine particulate matter and elements in an urban area, Atmos. Environ., 104, 256–263, 2015.
Hoek, G., Beelen, R., De Hoogh, K., Vienneau, D., Gulliver, J., Fischer, P., and Briggs, D.: A review of land-use regression models to assess spatial variation of outdoor air pollution, Atmos. Environ., 42, 7561–7578, 2008.
Hsu, C. Y., Wu, C. D., Hsiao, Y. P., Chen, Y. C., Chen, M. J., and Lung, S. C. C.: Developing land-use regression models to estimate PM2.5-bound compound concentrations, Remote Sens., 10, 1971, https://doi.org/10.3390/rs10121971, 2018.
Huang, L., Zhang, C., and Bi, J.: Development of land use regression models for PM2.5, SO2, NO2 and O3 in Nanjing, China, Environ. Res., 158, 542–552, 2017.
Ji, W., Wang, Y., and Zhuang, D.: Spatial distribution differences in PM2.5 concentration between heating and non-heating seasons in Beijing, China, Environ. Pollut., 248, 574–583, 2019.
Jin, L., Berman, J. D., Warren, J. L., Levy, J. I., Thurston, G., Zhang, Y., Xu, X., Wang, S., Zhang, Y., and Bell, M. L.: A land use regression model of nitrogen dioxide and fine particulate matter in a complex urban core in Lanzhou, China, Environ. Res., 177, 108597, https://doi.org/10.1016/j.envres.2019.108597, 2019.
Jones, R. R., Hoek, G., Fisher, J. A., Hasheminassab, S., Wang, D., Ward, M. H., Sioutas, C., Vermeulen, R., and Silverman, D. T.: Land use regression models for ultrafine particles, fine particles, and black carbon in southern California, Sci. Total Environ., 699, 134234, https://doi.org/10.1016/j.scitotenv.2019.134234, 2020.
Lee, M., Brauer, M., Wong, P., Tang, R., Tsui, T. H., Choi, C., Cheng, W., Lai, P. C., Tian, L., Thach, T. Q., and Allen, R.: Land use regression modelling of air pollution in high density high rise cities: A case study in Hong Kong, Sci Total Environ., 592, 306–315, 2017.
Levy, I., Mihele, C., Lu, G., Narayan, J., and Brook, J. R.: Evaluating multipollutant exposure and urban air quality: pollutant interrelationships, neighborhood variability, and nitrogen dioxide as a proxy pollutant, Environ. Health Persp., 122, 65–72, https://doi.org/10.1289/ehp.1306518, 2014.
Li, Z., Fung, J. C., and Lau, A. K.: High spatiotemporal characterization of on-road PM2.5 concentrations in high-density urban areas using mobile monitoring, Build. Environ., 143, 196–205, 2018.
Li, Z., Yim, S. H. L., and Ho, K. F.: High temporal resolution prediction of street-level PM2.5 and NOx concentrations using machine learning approach, J. Clean. Prod., 268, 121975, https://doi.org/10.1016/j.jclepro.2020.121975, 2020.
Li, Z., Ho, K.-F., Chuang, H.-C., and Yim, S. H. L.: Development and intercity transferability of land-use regression models for predicting ambient PM10, PM2.5, NO2 and O3 concentrations in northern Taiwan, Atmos. Chem. Phys., 21, 5063–5078, https://doi.org/10.5194/acp-21-5063-2021, 2021.
Li, Z., Ho, K. F., Dong, G., Lee, H. F., and Yim, S. H. L.: A novel approach for assessing the spatiotemporal trend of health risk from ambient particulate matter components: Case of Hong Kong, Environ. Res., 204, 111866, https://doi.org/10.1016/j.envres.2021.111866, 2022.
Liu, C., Henderson, B. H., Wang, D., Yang, X., and Peng, Z. R.: A land use regression application into assessing spatial variation of intra-urban fine particulate matter (PM2.5) and nitrogen dioxide (NO2) concentrations in City of Shanghai, China, Sci. Total Environ., 565, 607–615, 2016.
Lu, M., Soenario, I., Helbich, M., Schmitz, O., Hoek, G., van der Molen, M., and Karssenberg, D.: Land use regression models revealing spatiotemporal co-variation in NO2, NO, and O3 in the Netherlands, Atmos. Environ., 223, 117238, https://doi.org/10.1016/j.atmosenv.2019.117238, 2020.
Luminati, O., de Campos, B. L. D. A., Flückiger, B., Brentani, A., Röösli, M., Fink, G., and de Hoogh, K.: Land use regression modelling of NO2 in Sao Paulo, Brazil, Environ. Pollut., 289, 117832, https://doi.org/10.1016/j.envpol.2021.117832, 2021.
Ma, M., Gao, Y., Ding, A., Su, H., Liao, H., Wang, S., Wang, X., Zhao, B., Zhang, S., Fu, P., and Guenther, A. B.: Development and Assessment of a High-Resolution Biogenic Emission Inventory from Urban Green Spaces in China, Environ. Sci. Technol., 56, 175–184, 2021.
Ma, X., Longley, I., Gao, J., Kachhara, A., and Salmond, J.: A site-optimised multi-scale GIS based land use regression model for simulating local scale patterns in air pollution, Sci. Total Environ., 685, 134–149, 2019.
Masiol, M., Zíková, N., Chalupa, D. C., Rich, D. Q., Ferro, A. R., and Hopke, P. K.: Hourly land-use regression models based on low-cost PM monitor data, Environ. Res., 167, 7–14, 2018.
Mauderly, J. L., Burnett, R. T., Castillejos, M., Özkaynak, H., Samet, J. M., Stieb, D. M., Vedal, S., and Wyzga, R. E.: Is the air pollution health research community prepared to support a multipollutant air quality management framework?, Inhal. Toxicol., 22, 1–19, 2010.
Meng, X., Chen, L., Cai, J., Zou, B., Wu, C. F., Fu, Q., Zhang, Y., Liu, Y., and Kan, H.: A land use regression model for estimating the NO2 concentration in Shanghai, China, Environ. Res., 137, 308–315, 2015.
Meng, X., Fu, Q., Ma, Z., Chen, L., Zou, B., Zhang, Y., Xue, W., Wang, J., Wang, D., Kan, H., and Liu, Y.: Estimating ground-level PM10 in a Chinese city by combining satellite data, meteorological information and a land use regression model, Environ. Pollut., 208, 177–184, 2016.
Miri, M., Ghassoun, Y., Dovlatabadi, A., Ebrahimnejad, A., and Löwner, M. O.: Estimate annual and seasonal PM1, PM2.5 and PM10 concentrations using land use regression model, Ecotox. Environ. Safe, 174, 137–145, 2019.
Mölter, A. and Lindley, S.: Developing land use regression models for environmental science research using the XLUR tool – More than a one-trick pony, Environ. Model. Softw., 143, 105108, https://doi.org/10.1016/j.envsoft.2021.105108, 2021.
Naughton, O., Donnelly, A., Nolan, P., Pilla, F., Misstear, B. D., and Broderick, B.: A land use regression model for explaining spatial variation in air pollution levels using a wind sector based approach, Sci. Total Environ., 630, 1324–1334, 2018.
Rappazzo, K. M., Baxter, L., Sacks, J. D., Alman, B. L., Peterson, G. C. L., Hubbell, B., and Neas, L.: Exploration of PM mass, source, and component-related factors that might explain heterogeneity in daily PM2.5-mortality associations across the United States, Atmos. Environ., 262, 118650, https://doi.org/10.1016/j.atmosenv.2021.118650, 2021.
Ren, Y., Qu, Z., Du, Y., Xu, R., Ma, D., Yang, G., Shi, Y., Fan, X., Tani, A., Guo, P., and Ge, Y.: Air quality and health effects of biogenic volatile organic compounds emissions from urban green spaces and the mitigation strategies, Environ. Pollut., 230, 849–861, 2017.
Renzi, M., Forastiere, F., Schwartz, J., Davoli, M., Michelozzi, P., and Stafoggia, M.: Long-Term PM10 Exposure and Cause-Specific Mortality in the Latium Region (Italy): A Difference-in-Differences Approach, Environ. Health Persp., 127, 067004, https://doi.org/10.1289/EHP3759, 2019.
Requia, W. J., Coull, B. A., and Koutrakis, P.: Evaluation of predictive capabilities of ordinary geostatistical interpolation, hybrid interpolation, and machine learning methods for estimating PM2.5 constituents over space, Environ. Res., 175, 421–433, 2019.
Ross, Z., Jerrett, M., Ito, K., Tempalski, B., and Thurston, G. D.: A land use regression for predicting fine particulate matter concentrations in the New York City region, Atmos. Environ., 41, 2255–2269, 2007.
Saha, P. K., Sengupta, S., Adams, P., Robinson, A. L., and Presto, A. A.: Spatial correlation of ultrafine particle number and fine particle mass at urban scales: implications for health assessment, Environ. Sci. Technol., 54, 9295–9304, 2020.
Son, Y., Osornio-Vargas, Á.R., O'Neill, M.S., Hystad, P., Texcalac-Sangrador, J.L., Ohman-Strickland, P., Meng, Q., and Schwander, S.: Land use regression models to assess air pollution exposure in Mexico City using finer spatial and temporal input parameters, Sci. Total Environ., 639, 40–48, https://doi.org/10.1016/j.scitotenv.2018.05.144, 2018.
Song, M., Zhao, X., Liu, P., Mu, J., He, G., Zhang, C., Tong, S., Xue, C., Zhao, X., Ge, M., and Mu, Y.: Atmospheric NOx oxidation as major sources for nitrous acid (HONO), Clim. Atmos. Sci., 6, 30, https://doi.org/10.1038/s41612-023-00357-8, 2023.
Stafoggia, M., Breitner, S., Hampel, R., and Basagaña, X.: Statistical approaches to address multi-pollutant mixtures and multiple exposures: the state of the science, Curr. Environ. Health Rep., 4, 481–490, 2017.
Tang, R., Tian, L., Thach, T. Q., Tsui, T. H., Brauer, M., Lee, M., Allen, R., Yuchi, W., Lai, P. C., Wong, P., and Barratt, B.: Integrating travel behavior with land use regression to estimate dynamic air pollution exposure in Hong Kong, Environ. Int., 113, 100–108, 2018.
Vedal, S. and Kaufman, J. D.: What does multi-pollutant air pollution research mean?, Am. J. Resp. Crit. Care, 183, 4–6, 2011.
Wang, C., Cai, J., Chen, R., Shi, J., Yang, C., Li, H., Lin, Z., Meng, X., Liu, C., Niu, Y., and Xia, Y.: Personal exposure to fine particulate matter, lung function and serum club cell secretory protein (Clara), Environ. Pollut., 225, 450–455, 2017.
Wang, J., Cohan, D. S., and Xu, H.: Spatiotemporal ozone pollution LUR models: Suitable statistical algorithms and time scales for a megacity scale, Atmos. Environ., 237, 117671, https://doi.org/10.1016/j.atmosenv.2020.117671, 2020.
Wang, J., Wang, W., Zhang, W., Wang, J., Huang, Y., Hu, Z., Chen, Y., Guo, X., Deng, F., and Zhang, L.: Co-exposure to multiple air pollutants and sleep disordered breathing in patients with or without obstructive sleep apneas: A cross-sectional study, Environ. Res., 212, 113155, https://doi.org/10.1016/j.envres.2022.113155, 2022.
Wang, Y., Xiao, S., Zhang, Y., Chang, H., Martin, R. V., Van Donkelaar, A., Gaskins, A., Liu, Y., Liu, P., and Shi, L.: Long-term exposure to PM2.5 major components and mortality in the southeastern United States, Environ. Int., 158, 106969, https://doi.org/10.1016/j.envint.2021.106969, 2022.
WHO (World Health Organization): WHO global air quality guidelines: particulate matter (PM2.5 and PM10), ozone, nitrogen dioxide, sulfur dioxide and carbon monoxide, https://apps.who.int/iris/handle/10665/345329 (last access: February 2022), 2021.
Wolf, K., Cyrys, J., Harciníková, T., Gu, J., Kusch, T., Hampel, R., Schneider, A., and Peters, A.: Land use regression modeling of ultrafine particles, ozone, nitrogen oxides and markers of particulate matter pollution in Augsburg, Germany, Sci. Total Environ., 579, 1531–1540, 2017.
Wu, H., Reis, S., Lin, C., and Heal, M. R.: Effect of monitoring network design on land use regression models for estimating residential NO2 concentration, Atmos. Environ., 149, 24–33, 2017.
Xu, M., Sbihi, H., Pan, X., and Brauer, M.: Local variation of PM2.5 and NO2 concentrations within metropolitan Beijing, Atmos. Environ., 200, 254–263, 2019.
Xue, T., Zheng, Y., Li, X., Liu, J., Zhang, Q., and Zhu, T.: A component-specific exposure–mortality model for ambient PM2.5 in China: findings from nationwide epidemiology based on outputs from a chemical transport model, Faraday Discuss., 226, 551–568, 2021.
Yim, S. H., Fung, J. C. H., Lau, A. K. H., and Kot, S. C.: Air ventilation impacts of the “wall effect” resulting from the alignment of high-rise buildings, Atmos. Environ., 43, 4982–4994, 2009.
Yim, S. H., Huang, T., Ho, J. M., Lam, A. S., Yau, S. T., Yuen, T. W., Dong, G. H., Tsoi, K. K., and Sung, J. J.: Rise and fall of lung cancers in relation to tobacco smoking and air pollution: A global trend analysis from 1990 to 2012, Atmos. Environ., 269, 118835, https://doi.org/10.1016/j.atmosenv.2021.118835, 2022.
Yim, S. H. L.: Development of a 3D real-time atmospheric monitoring system (3DREAMS) using Doppler LiDARs and applications for long-term analysis and hot-and-polluted episodes, Remote Sens., 12, 1036, https://doi.org/10.3390/rs12061036, 2020.
Yim, S. H. L., Wang, M., Gu, Y., Yang, Y., Dong, G., and Li, Q.: Effect of urbanization on ozone and resultant health effects in the Pearl River Delta region of China, J. Geophys. Res.-Atmos., 124, 11568–11579, 2019.
Zeng, L., Yang, J., Guo, H., and Lyu, X.: Impact of NOx reduction on long-term surface ozone pollution in roadside and suburban Hong Kong: Field measurements and model simulations, Chemosphere, 302, 134816, https://doi.org/10.1016/j.chemosphere.2022.134816, 2022.
Zhang, J. J., Sun, L., Barrett, O., Bertazzon, S., Underwood, F. E., and Johnson, M.: Development of land-use regression models for metals associated with airborne particulate matter in a North American city, Atmos. Environ., 106, 165–177, 2015.