the Creative Commons Attribution 4.0 License.
the Creative Commons Attribution 4.0 License.
 | 22 May 2024
The characteristics of cloud macro-parameters caused by the seeder–feeder process inside clouds measured by millimeter-wave cloud radar in Xi'an, China
Huige Di
Yun Yuan
The seeding effect of upper clouds on lower clouds affects the evolution of clouds, especially the seeding from upper ice clouds on lower stratiform clouds or convective clouds, which can stimulate the precipitation of lower clouds and even produce extreme precipitation. When seeders of the seeding cloud enter the feeding cloud, the interaction between cloud particles results in the change in macro- and micro-parameters of the feeding cloud. Based on the observation data of a ground-based Ka-band millimeter-wave cloud radar (MMCR) and microwave radiometer (MWR) in spring and autumn from 2021 to 2022, the seeder–feeder phenomenon among double-layer clouds in Xi'an, China, is studied. The study on 11 cases of seeder–feeder processes shows that the processes can be divided into three types by defining the height difference (HD) between the seeding cloud base and the feeding cloud top and the effective seeding depth (ESD). Through analysis of the reflectivity factor (Z) and the radial velocity (Vr) of cloud particles detected by the MMCR and on the retrieved cloud dynamics parameters (vertical velocity of airflow, Va, and terminal velocity of cloud particles, Vf), it is shown that the reflectivity factor and particle terminal velocity in the cloud are significantly enhanced during the seeder–feeder period for the three types of processes. But the enhancement magnitudes of the three seeder–feeder processes are different. The results also show that the impact of seeding on the feeding cloud is limited. The lower the height and thinner the thickness of the HD, the lower the height and thicker the thickness of the ESD. On the contrary, the higher the height and the thicker the thickness of the HD, the higher the height and the thinner the thickness of the ESD.
- Article
(10285 KB) - Full-text XML
- BibTeX
- EndNote


Natural ice crystals in upper clouds can be the source of seeders for lower clouds (Korolev et al., 1999; Heymsfield et al., 2013; Myagkov et al., 2016; Cheng et al., 2020; Wang et al., 2023). This seeder–feeder process is able to promote the development of the lower clouds even to stimulate extreme precipitation (Choularton et al., 1986; Locatelli al., 1983; Robichaud et al., 1988; Fernández-González et al., 2015; Ramelli et al., 2021). The seeder–feeder process is a phenomenon whereby ice crystals as the seeder from the upper clouds fall into the lower clouds or the lower-lying part of the same clouds, which is liquid, ice or mixed phase (Hall et al., 1976; Korolev et al., 2003; Geerts et al., 2015; Lowenthal et al., 2019). When ice crystals meet lower cloud droplets in the ice phase or in a supercooled-water state, they grow by riming or vapor deposition via the Wegener–Bergeron–Findeisen process vapor (Bergeron, 1935; He et al., 2022). Therefore, it is important to understand the seeder–feeder process, and doing so can be helpful to improve the representation of cloud processes in weather and climate models, to improve weather forecasts of precipitation, and ultimately to reduce uncertainty in climate simulations (Hong et al., 2012; Proske et al., 2021). The seeder–feeder process has been studied through observations and simulations in operations of artificial precipitation enhancement, and distinct changes in both cloud and precipitation properties have been found (French et al., 2018; Ramelli et al., 2021; Dong et al., 2021).
Historically, Braham (1967) noted the natural phenomenon of ice crystals from the upper cirrus clouds acting as seeders for ice formation in warmer clouds below. It was found that not only cirrus but also altocumulus and altostratus, which contain ice crystals, may act as the seeding clouds. In the 1980s in China, Hong et al. (2012) established a cloud model that simulated the formation of stratiform clouds. In the model, the seeder–feeder process was emphasized. Subsequently, this cloud seeding process through sedimenting ice crystals has been observed in a multitude of remote sensing and aircraft campaigns. Seifert et al. (2014) and He et al. (2022) estimated the occurrence frequency of natural cloud seeding through analyzing their lidar datasets. Furthermore, a regional occurrence frequency of the seeder–feeder process in the Arctic was estimated by Vassel et al. (2019). They pointed out that the seeder–feeder process usually happened within multi-layer clouds, which was observed by radiosonde and radar in Svalbard. Using the DARDAR satellite products and sublimation calculations, Proske et al. (2021) also studied the occurrence frequency of cloud seeding in Switzerland and found the high occurrence frequency of seeding situations with the survival of the ice crystals. The microphysical parameters of the seeder–feeder process appearing within mixed-phase clouds have been investigated using ground-based remote sensing instruments (Ramelli et al., 2021). However, there is still a lack of the specific characteristics, such as the height difference between the seeding cloud base and the feeding cloud top (HD) and the effective seeding depth (ESD), to represent the feature of the seeder–feeder process. In the meantime, the characteristics of air vertical motion particle terminal velocity inside clouds during the seeder–feeder process are still poorly understood.
The nature of the seeder–feeder process within clouds is not well documented in the literature (Hill et al., 2007; Purdy et al., 2005; He et al., 2022). The main reason for this is that the effects of the seeder–feeder process are not easy to measure because several cloud layers need to be able to be monitored simultaneously with high vertical and temporal resolution. The active instrument of the Ka-band millimeter-wave cloud radar (MMCR), a useful tool for cloud observations, can detect multiple cloud layers directly, which allows measurement of the seeder–feeder process (Ramelli et al., 2021; Proske et al., 2021). The Doppler spectra recorded by the MMCR can be used to retrieve the vertical airflow velocity and the terminal velocity of cloud particles and to obtain information on particle types (Luke et al., 2013; Shupe et al., 2008; Kollias et al., 2002, 2011). However, such direct observations of ice crystal formation and evolution in the seeder–feeder process are limited (French et al., 2018).
In this study, the seeder–feeder process happening between bilayer stratiform clouds in Xi'an is investigated using the observation data from the MMCR, a microwave radiometer (MWR) and a radiosonde from January 2021 to December 2022. In this paper, following the above review of the study status of the seeder–feeder process, the instruments used and methods associated with datasets are introduced briefly. Then through a case style, analysis of the seeder–feeder process measured by the MMCR is carried out to expose the evolution mechanism of seeding and feeding clouds. The main results and conclusions will be represented by statistics with 2 years of data.
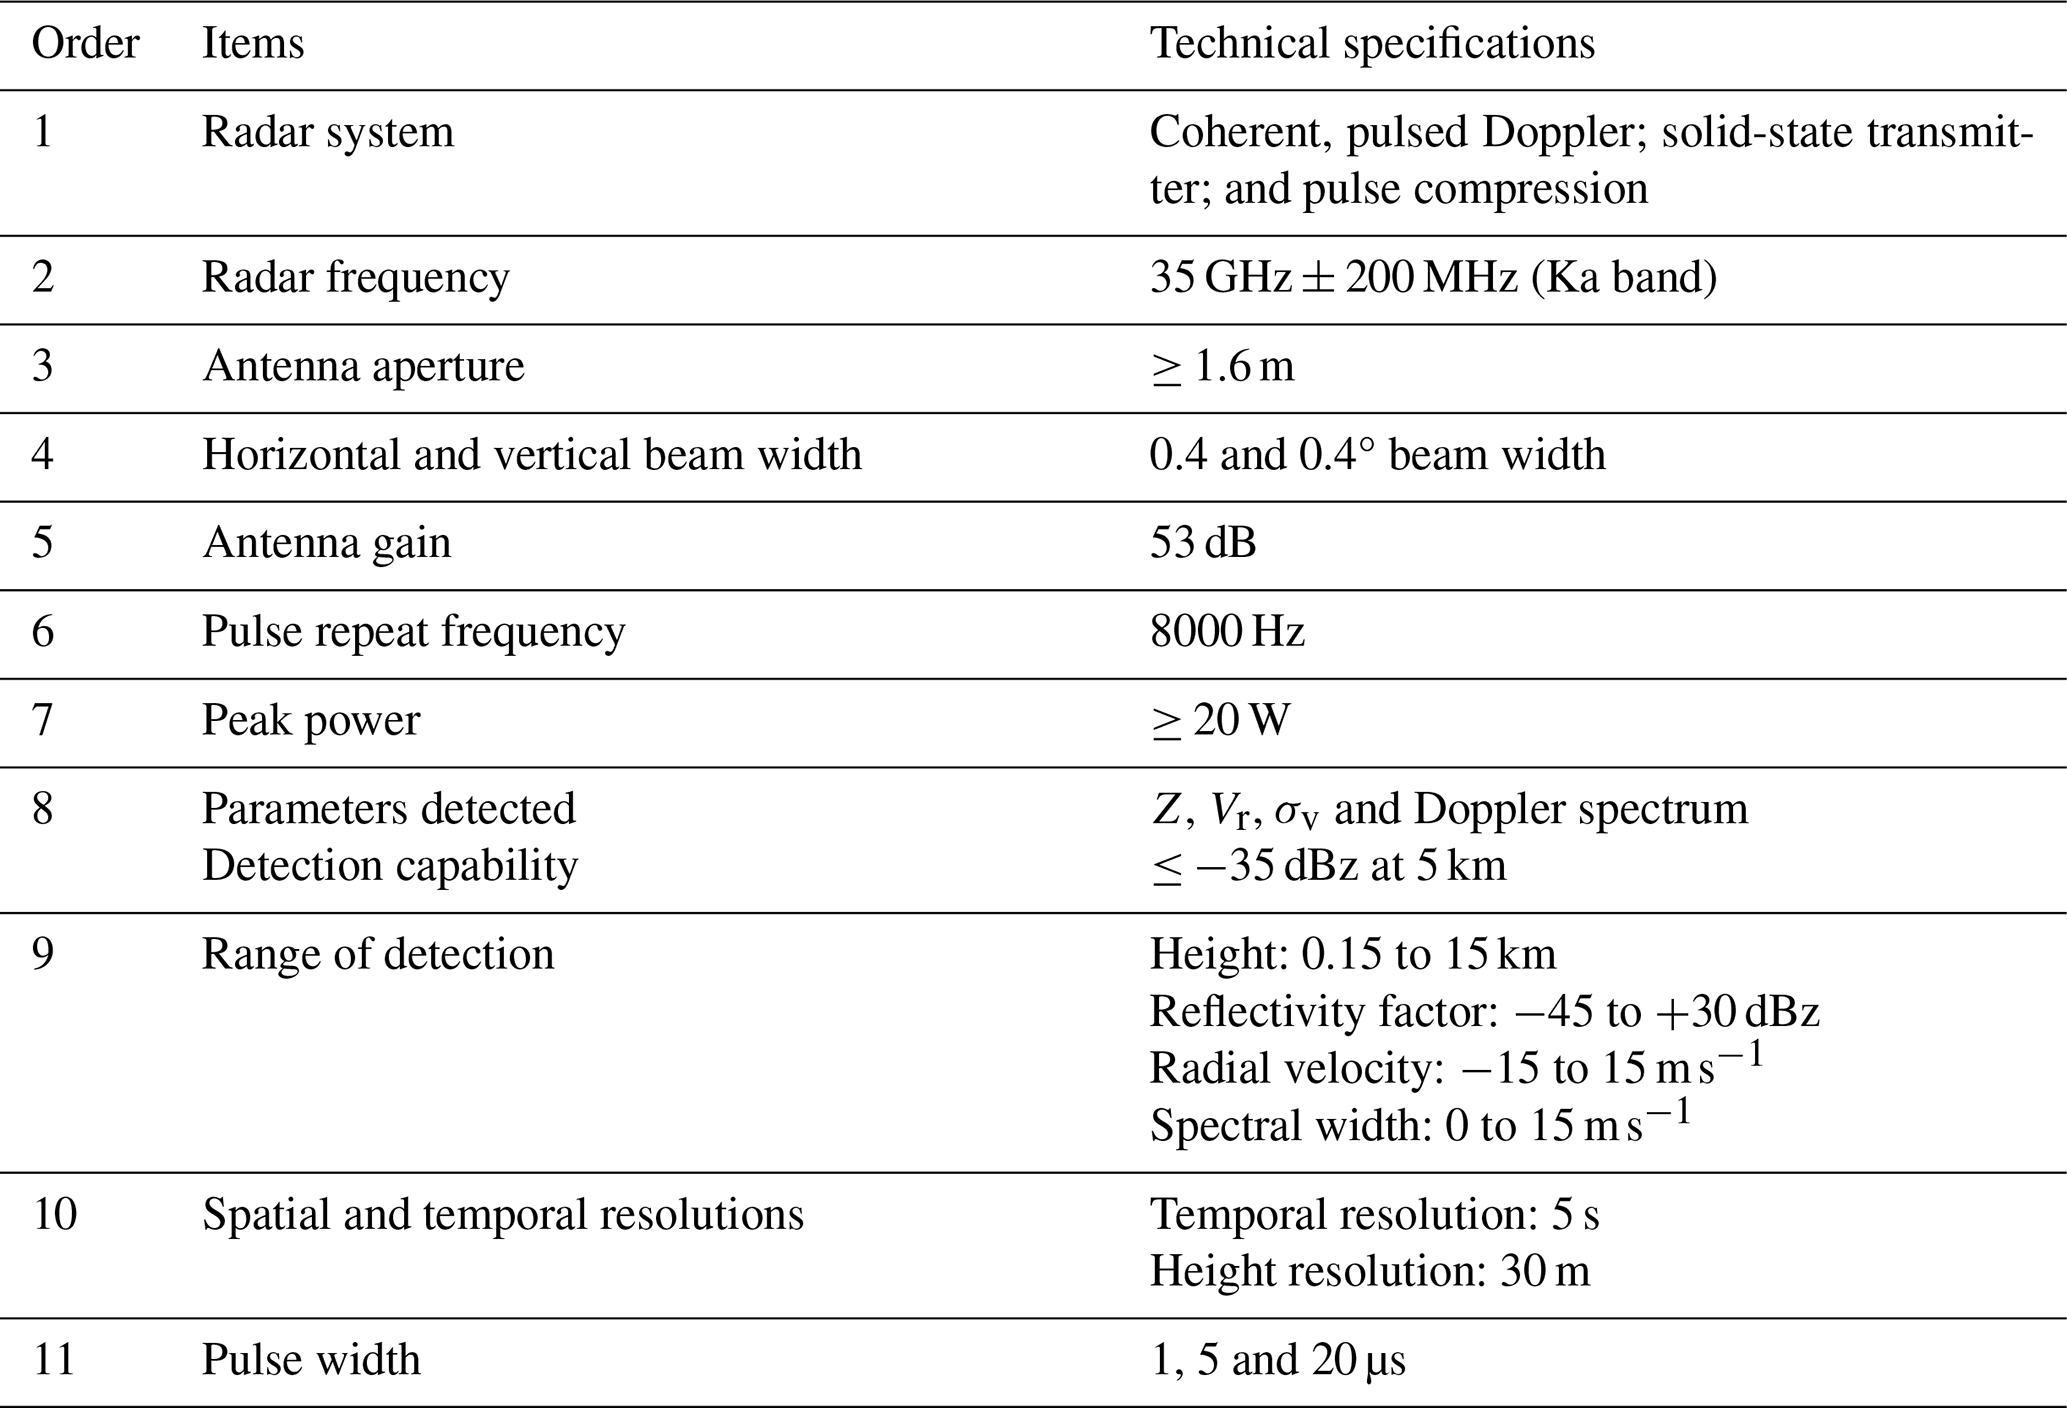
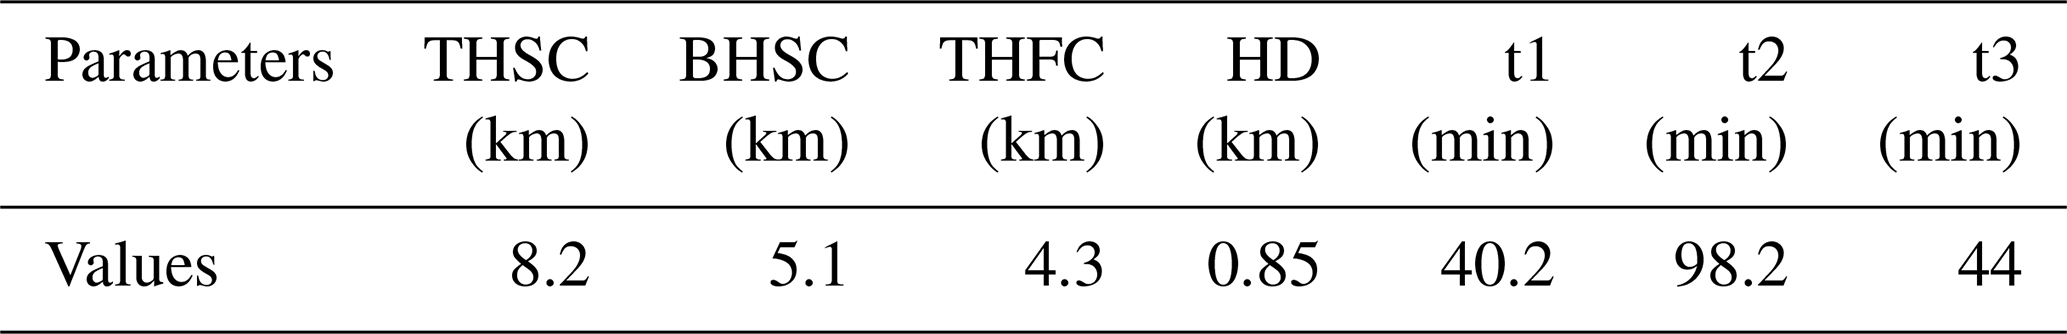
The instruments used in this study are the MMCR, MWR, radiosonde, and raindrop spectrometer (RDS). The MMCR is a Doppler vertically pointing cloud profile radar with a solid-state transmitter. The main parameters of the MMCR are shown in Table 1. The MMCR can observe the reflectivity factor (Z), radial velocity (Vr), spectral width (σv) and Doppler spectrum. These parameters can be used to retrieve cloud dynamic parameters, such as cloud particle terminal velocity and vertical airflow velocity inside the cloud (Liu et al., 2019; Di et al., 2022). Because of the advantages of the solid-state transmitter, the MMCR is small in size, long-lived and good in terms of reliability, so it provides reliable observation data for this study. Due to the MMCR having a certain penetrating ability in clouds, it can detect the structure variation in a multi-layer cloud system, so the phenomenon of the seeder–feeder process in a multi-layer cloud system can be measured, which is an important reason for us to choose this instrument in this study.
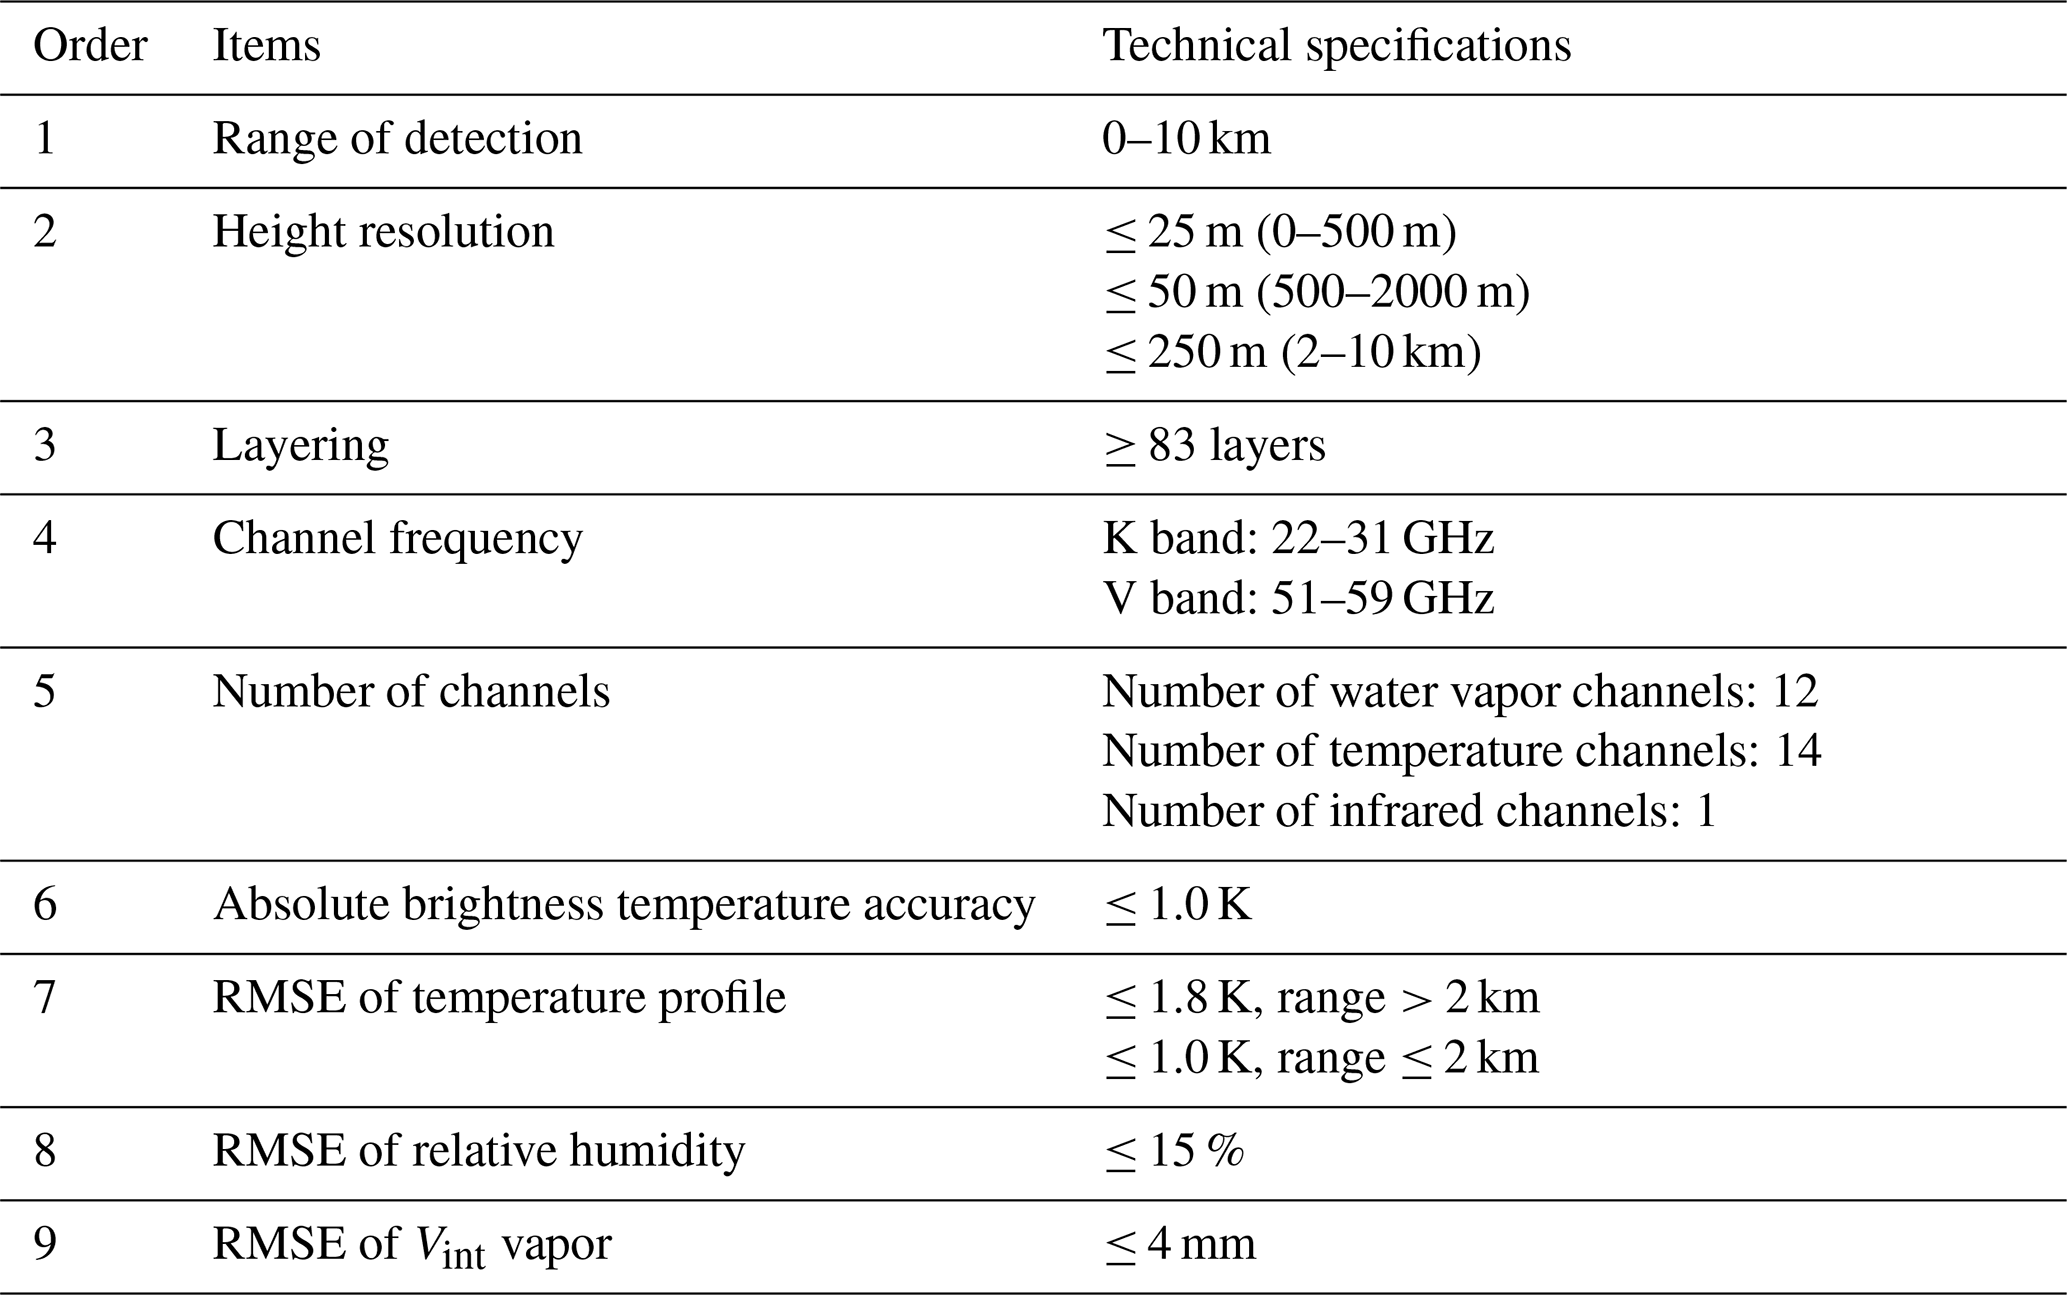
The MWR includes 21 water vapor channels (distributed in the K band, that is, 22–31 GHz), 14 air temperature channels (distributed in the V band, that is, 51–59 GHz) and 1 infrared channel. The observation data of the MWR can be used to retrieve the profiles of atmospheric temperature (T, K) and relative humidity (RH, %), integrated water vapor content (Vint, mm) and integrated liquid water content (Lqint, mm). Below the height of 2 km, the root mean square error (RMSE) of temperature measurement is less than 1 K, and it is less than 1.8 K above 2 km height. The RMSE of relative humidity is less than 15 %, and the RMSE of Vint is less than 4 mm. Table 2 lists the major technical parameters of the MWR.
The above instruments are placed at the Jinghe National Meteorological Station (34°26′ N, 108°58′ E; Fig. 1) in Xi'an, Shaanxi Province, China, which is located near the north bank of the Wei River in the Guanzhong Basin (between 33°42′–34°45′ N, 107°40′–109°49′ E; about 400 m above sea level) in the middle of the Yellow River basin. The Qin Mountains on the south side of the Wei River often block the cold air moving southward in winter and spring and produce stable stratiform clouds in the Guanzhong Plain, which provides a natural experimental site to study the seeder–feeder phenomenon in bilayer stratiform clouds. The distance between the MMCR and MWR is less than 5 m, and the distance between other instruments is less than 50 m. The Jinghe National Meteorological Station is also the national meteorological sounding station. Sounding balloons are launched every day at 07:15 and 19:15 CST (China standard time, also known as Beijing time – BJT) to detect atmospheric temperature, relative humidity, wind speed and wind direction from the ground to an altitude of 30 km in the station (Görsdorf et al., 2015; Vassel et al., 2019; Yuan et al., 2022a). The collaborative detection of the above instruments provides effective data support for investigating the seeder–feeder process in clouds in this study.
As the MMCR adopts vertical upward mode observation, its echo signal will not be affected by ground clutter, which reduces errors in the terrain clutter in observation data. However, due to the influence of aerosol and insects in the lower atmosphere, there will be non-cloud signals in the bottom echo signal of the MMCR. The non-cloud echo signals in the low-level atmosphere have the characteristics of a small reflectivity factor, low radial velocity and large spectral width. To further eliminate interfering wave information, we obtain the data quality control threshold by counting the characteristic changes in planktonic echoes in the boundary layer under cloud-free conditions (Yuan et al., 2022b). The Doppler spectrum from the MMCR includes the information of the cloud particle size and the air vertical motion. The Doppler spectrum is also affected by radar beam width, wind shear and atmospheric turbulence. Therefore, radiosonde data combined with the MMCR hardware parameters are used to correct the broadening of the Doppler spectra and improve the accuracy of the retrieved vertical velocity of airflow (Va) and the particle terminal velocity (Vf) in clouds (Shupe et al., 2008, 2005; Kollias et al., 2001, 2002).
To calculate the vertical velocity of the airflow in the cloud more accurately, the cloud phase state needs to be judged. The terminal velocity of cloud particles varies due to the influence of the phase state, which in turn affects the magnitude of vertical airflow velocity. Cloud-particle-phase identification adopts the cluster analysis method (Shupe, 2007). The specific process takes the cloud reflectivity factor, particle radial velocity and spectral width measured by the MMCR and atmospheric temperature measured by the MWR as input parameters for cloud-phase identification. Through unsupervised learning (Yuan et al., 2022c), cloud particles of different phase states in the cloud are identified, such as warm clouds, mixed phase (ice-dominated phase or water-dominated phase), ice, snow, supercooled water, drizzle, rain and graupel particles.
In the identified ice particle region and mixed-phase region of stratiform clouds, the turbulence inside the cloud is very small and can be ignored, and the left endpoint of the Doppler spectrum represents the information of the smallest particle detected by the radar. If the particle size is small enough to ignore its terminal velocity, the left endpoint of the Doppler spectra can be used to retrieve vertical airflow velocity, that is, the small-particle tracer method (Shupe et al., 2008). In this study, the echo intensity of −21 dBZ is used as the threshold for the radar detection volume containing small particles. When the echo intensity is less than −21 dBZ, it can be assumed that the particle size is small enough to be used as the tracer particle to retrieve vertical airflow velocity. Meanwhile, if the spectral width is less than 0.4 m s−1, it is assumed that the turbulence is small and can be ignored. In the identified supercooled-water region, the peak position of the liquid cloud particle is used to obtain the vertical velocity of airflow (Wei et al., 2019). When it drizzles, the Doppler spectra of the MMCR usually show the bimodal distribution, and the vertical velocity of the airflow in the cloud can be obtained by the bimodal position of the liquid cloud particles (Wei et al., 2019; Luke et al., 2013). The radial velocity is the combination of the particle terminal velocity and the air vertical motion. Therefore, the cloud particle terminal velocity can be obtained by subtracting the vertical airflow velocity from the radial velocity. The terminal velocity of cloud particles and the vertical velocity of airflow are important parameters in analyzing the seeder–feeder process. Based on the observation data of the MMCR from 2021 to 2022 (a total of 10 363 h), the seeder–feeder process of the bilayer cloud system (ice phase in upper cloud and mixed-phase cloud in lower cloud) is analyzed below.
To conveniently and clearly analyze the seeder–feeder process of bilayer clouds in Xi'an and find how the upper seeding clouds seed the lower feeding clouds, we have chosen observation data from the MMCR and MWR in winter and spring, as most of the clouds in these seasons are stable stratiform clouds. The first step is to define the relevant parameters to describe the characteristics of the bilayer clouds, such as the top height of the seeding cloud (THSC), the base height of the seeding cloud (BHSC) and the top height of the feeding cloud (THFC). The height difference (HD) between the BHSC and THFC is also defined. The HD can directly display one of the geometric features of the bilayer clouds. The heights of cloud top and base are determined from radar echo signals. Before determining the two heights, the clutter mixed in the signals observed by the MMCR was filtered out. The sensitivity threshold of the radar used in this study is −40 dBZ, which is sufficient for accurately observing the positions of the cloud base and cloud top (Yuan et al., 2022a).
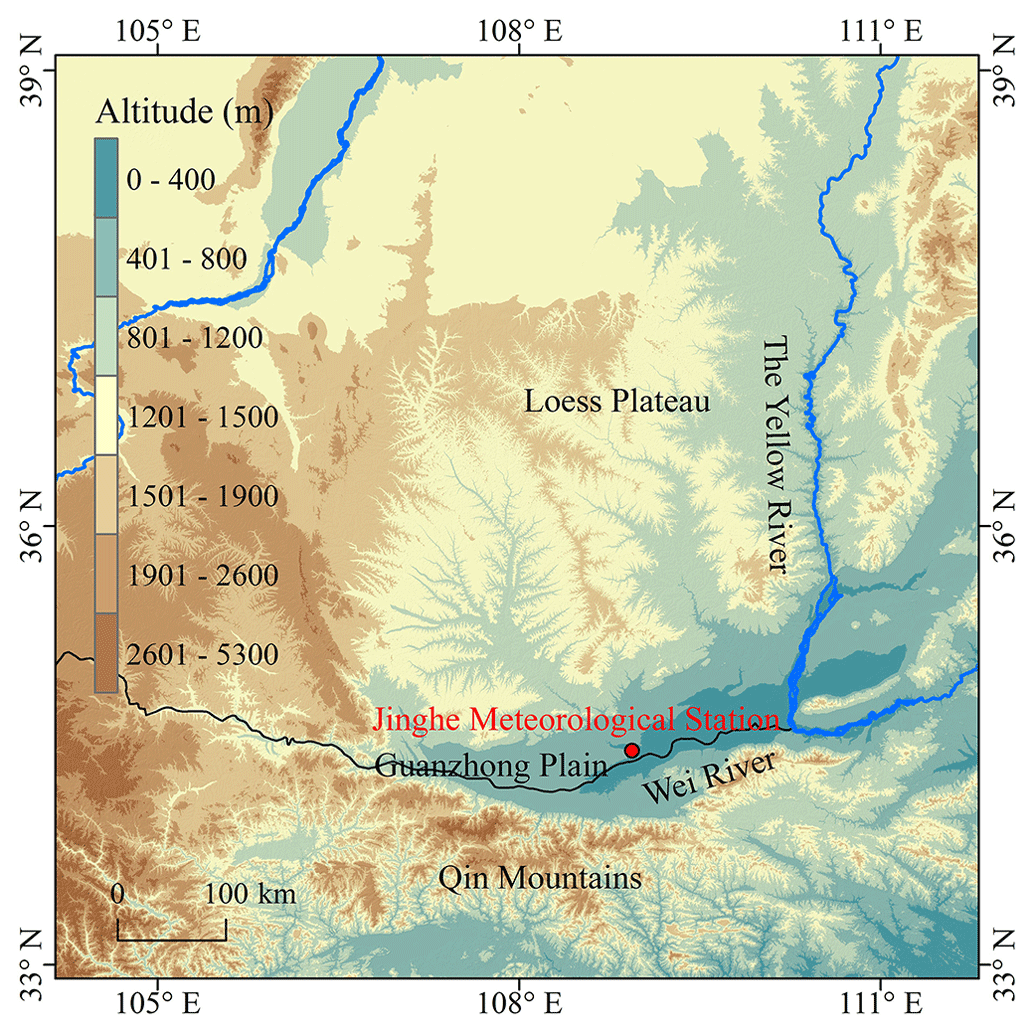
Figure 1Geographical coverage around observation site (33–39° N, 104°10′–111°40′ E). The red dot indicates the location of the Jinghe National Meteorological Station in Xi'an (33°42′–34°45′ N, 107°40′–109°49′ E).
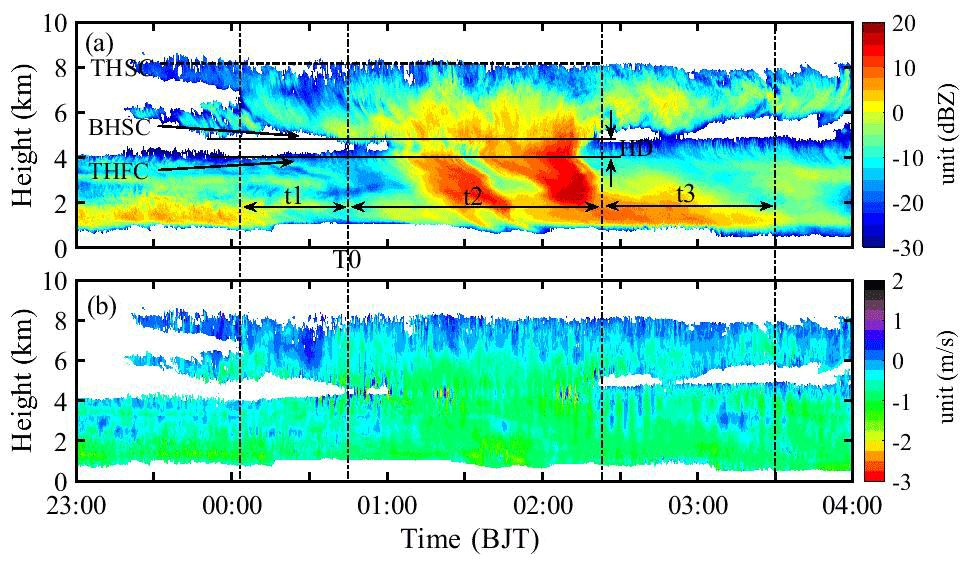
Figure 2The variations with time for profiles of both the cloud reflectivity factor (a) and the radial velocity (b) detected by the MMCR from 23:00 CST on 5 February 2022 to 04:00 CST on 6 February 2022 (positive values according to the color bar represent ascending motion and negative values represent sinking motion). The THSC and BHSC are the cloud top height and cloud base height of the seeding cloud, the THFC is the cloud top height of the feeding cloud, and the HD is the height difference between the BHSC and THFC. T0 is the moment when the seeding cloud began to seed, t1 is the stable time period before the seeding cloud began to seed, t2 is the length of time from the beginning to end of the seeding and t3 is the period after the end of the seeding but when the reflectivity factor in the feeding cloud is still developing.
Table 3Values of the defined parameters for the seeder–feeder process shown by Fig. 2.
A period of stable time from the moment when the stable double-layer cloud appears until the start of seeding is denoted as t1, the moment when the seeding cloud begins to seed is marked as T0, the length of the time period of the seeding is denoted as t2 and the period after the end of the seeding but with the lower part of the feeding cloud still showing development changes in the reflectivity factor is labeled as t3 (which is called the duration of the seeding effect). Usually, the cloud base or cloud top is not flat enough. However, as our study focuses on stable stratiform clouds, the cloud top and cloud base observed in these cases are relatively flat. The THSC is the average height of the seed cloud top during the observation period, the BHSC is the average height of the seeder cloud base during the t1 period and the THFC is the average height of the feeder cloud top during the t1 period.
Figure 2 shows the cloud reflectivity factor and radial velocity detected by the MMCR from 23:00 CST on 5 February 2022 to 04:00 CST on 6 February 2022. The reflectivity factor (in Fig. 2a) clearly shows the seeder–feeder process. During the period from 00:40 to 02:20 CST, cloud particles of the upper cloud fell into the top of the lower cloud. This is confirmed by the cloud particle radial velocity (in Fig. 2b), which shows that the cloud particles during the period were all sinking, and the sinking velocity was about −1 m s−1. The above-defined parameters are marked in Fig. 2a. This figure also shows that the bilayer clouds are stable during this period, with the THSC at 8 km, BHSC at 5.5 km, THFC at 4.2 km and HD at 0.85 km. The seeding process lasted for about 98.2 min (t2), and the feeding cloud development duration reached more than 2 h 30 min. Before the seeder–feeder process of the bilayer clouds, only 40 min (t1) was considered to cover the earlier state of the clouds. Table 3 records detailed information on these parameters.
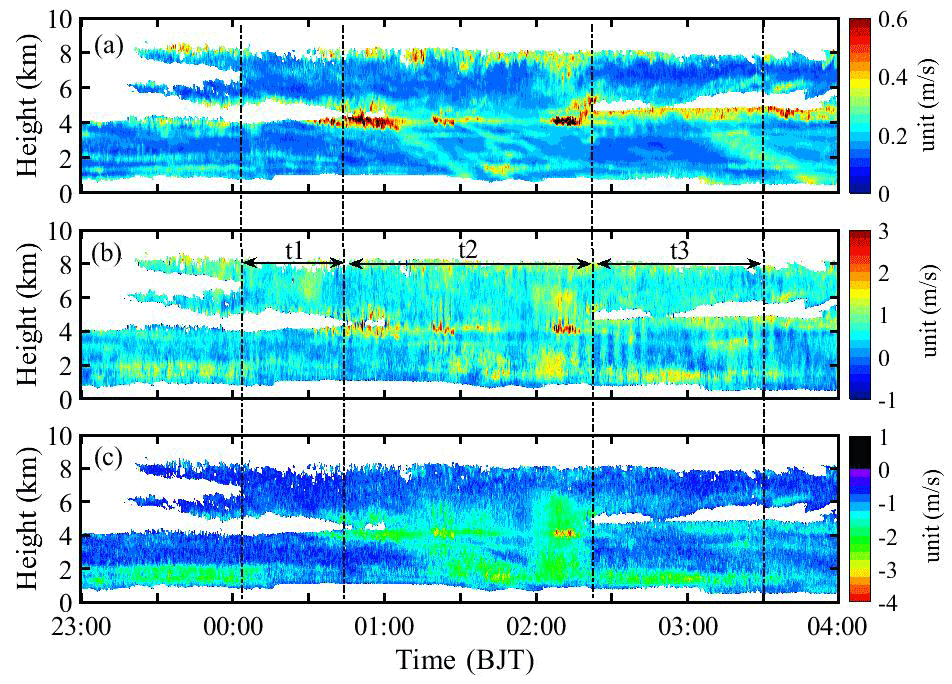
Figure 3The spectral width of cloud particles (a), the vertical velocity of the airflow (b) and the terminal velocity of cloud particles (c) based on the retrieval from the MMCR (positive values represent ascending motion, and negative values represent sinking motion).
In order to reveal the variation characteristics of the cloud system during this seeder–feeder process, the spectral width of cloud particles, the vertical airflow velocity and the terminal velocity of cloud particles are first calculated from the signals of the Doppler spectra detected by the MMCR (in Fig. 3, positive values indicate being away from radar and negative values indicate pointing to the ground). Figure 3a shows that the spectral width was small, indicating that the cloud particle radial velocity detected by the MMCR was relatively stable, which also indicates that the airflow inside bilayer clouds was stable. The maximum value of the spectral width was approximately 0.6 m s−1, which was mainly located at the top of the seeding and feeding clouds (especially at the beginning of the feeding cloud) and at the lower part between the seeding and the feeding clouds during the seeding period (that is, the top of the feeding clouds). In addition, the feeding clouds showed changes in the t3 period after seeding; that is, the feeding cloud top height rose slightly (in Fig. 2a) and the spectral width increased at the cloud top region, which indicated that the radial velocity at this region changed greatly during the t3 period. This is probably because of latent heat release by the phase transition in the seeding clouds during the seeder–feeder process, which is fed back in the dynamic process and then increases the vertical velocity of the airflow inside the cloud. This position in Fig. 3b indeed indicates that the vertical velocity of the airflow was relatively large (0.5–2 m s−1). Figure 3b shows that weak upward movement (0.5–2 m s−1) prevails in the seeding and the feeding clouds, which is consistent with the dynamic structure characteristics of stable stratiform clouds (Hou et al., 2010; Wang et al., 2022) in winter and spring in Xi'an. The maximum vertical velocity of airflow was located at the junction of upper and lower clouds, the top and base of seeding cloud, and the top of feeding clouds in the t3 period. During the seeding period, there was a large upward air movement (up to 1.5 m s−1) in the middle and lower regions of the feeding clouds. There was rarely large-scale and prolonged upward and downward air movement in the seeding and feeding clouds, but alternating upward and downward movement occurred.
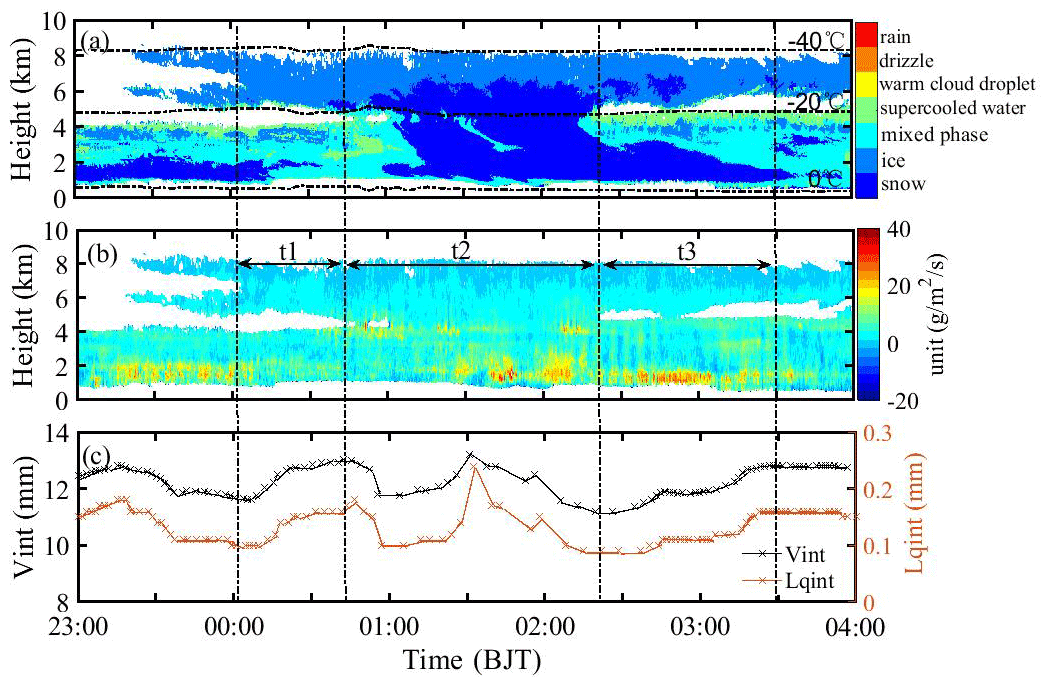
Figure 4The variations in cloud phase (a), water vapor flux (b), and integrated water vapor content (Vint, shown by the black line) and integrated liquid water content (Lqint, shown by the orange line) (c) with time from the MMCR and MWR.
Figure 3c clearly shows the terminal velocity of cloud particles, which was in the range of −1 to −4 m s−1 during the seeding process (the negative values represent the downward movement in Fig. 3c), but most of the velocity values were less than 2.5 m s−1. During this seeding process, 00:45–01:50 CST and 02:00–02:20 CST were two significant seeding periods, and the maximum terminal velocity of cloud particles was about 4 m s−1 in the last period, which indicates a large cloud particle size. According to the cloud phase in Fig. 4, the particles were snowflakes in the cloud seeding and feeding areas. The particle size is related to the shape of snowflakes and the terminal velocity, so it is difficult to accurately quantify particle size. The relations of snow particles and diameter were studied in Tao et al. (2020). Based on the relationship between particle velocity and diameter, it can be inferred that the diameters of the snow particles in the clouds were distributed between 1 and 6 mm and most of them were below 3 mm. In the areas unaffected by the seeding (except for the bottom area of the lower clouds during the period of 23:00–00:10 CST), the particle terminal velocity was small, less than 1.5 m s−1. This all indicates that the seeding had a significant enhancing effect on the particle diameter of the feeding clouds.
According to Table 3, the HD between seeding and feeding clouds was 0.85 km. If the sinking speed of cloud particles was at −1 m s−1 (in Fig. 2b), it took about 14 min for cloud particles to fall from the seeding cloud base to the feeding cloud top. In addition, Figs. 2 and 3 show that the seeding ends at 02:20 CST, but Fig. 3c shows that after this time, cloud particles still sink (sinking velocity was approximately −0.5 m s−1 at 02:45 CST) onto the feeding cloud top. It is likely that the MMCR is limited in its sensitivity to detect smaller particles and cannot clearly show the reflectively factor of them. The above results indicate that the sinking-motion region of the cloud particle can be used to identify the seeding cloud effectively. Anyway, the above gives an important conclusion; i.e., after seeding, the feeding cloud top rose slightly, which may have been the result of latent heat release. The sinking-motion region of particles can directly characterize the seeding process.
Using the observation data of the MMCR and MWR, the cloud phase state, the water vapor structure, and the total amount of liquid water and water vapor in the column can be retrieved. Figure 4a shows that seeding clouds consisted of ice and snow, and seeding was caused by sinking ice particles. Before seeding, the particles in the feeding cloud were basically in the mixed phase, there was a thin layer of supercooled water in the middle and upper part of the cloud, and snow particles appeared at the base of the cloud for a short time after 00:10 CST. Before seeding, the larger downward radial velocity (in Fig. 2b) was detected in the lower part of the seeding cloud, which indicates that the cloud process transformed from ice to snow with large particle diameters. Snowflakes, as seeders, fell into the mixed-phase cloud containing supercooled water, so the Wegener–Bergeron–Findeisen effect or accretion occurred. That process caused the supercooled water in the mixed-phase cloud to rapidly transform into ice. Because it takes time for particles to fall, the seeding continued to the middle and lower parts of the feeding clouds, and snow was maintained for a long time (throughout the entire t3 period). In the top region of the unaffected feeding cloud, the cloud phase remained as supercooled water, which is consistent with Shupe's (2007) observation results. The temperature of the supercooled-water layer was approximately −20 °C, while that of the seeding cloud top was close to −40 °C. From Fig. 4, it can be seen that the instantaneous water vapor flux of the seeding clouds was smaller than that of the feeding clouds, and the bottom layer of the feeding clouds had instantaneous water vapor flux greater than 20 , indicating that the lower layer of the atmosphere had high humidity during the seeder–feeder process in the bilayer stratiform clouds.
The temporal variation in the column water vapor and column liquid water given by the MWR (in Fig. 4c) showed that both rapidly increased from t1 before seeding to the beginning of seeding and rapidly decreased after seeding. Before the second intense seeding, the column water vapor and column liquid water content increased rapidly and then decreased with the end of seeding. This process can be understood as follows: when the ice-phase particles from the seeding cloud entered the supercooled water of the feeding cloud top, the Wegener–Bergeron–Findeisen effect or accretion was triggered and the liquid particles were rapidly transformed into ice-phase particles, which led to the reduction in liquid water content in the column. The above results illustrate that the seeders from the seeding clouds caused change in the cloud phase state in the feeding clouds, thus reducing the water vapor and liquid water in the column. The rapid increase in water vapor and liquid water in the column before seeding was related to the change in the atmospheric environment at that time, which still needs to be studied in detail.
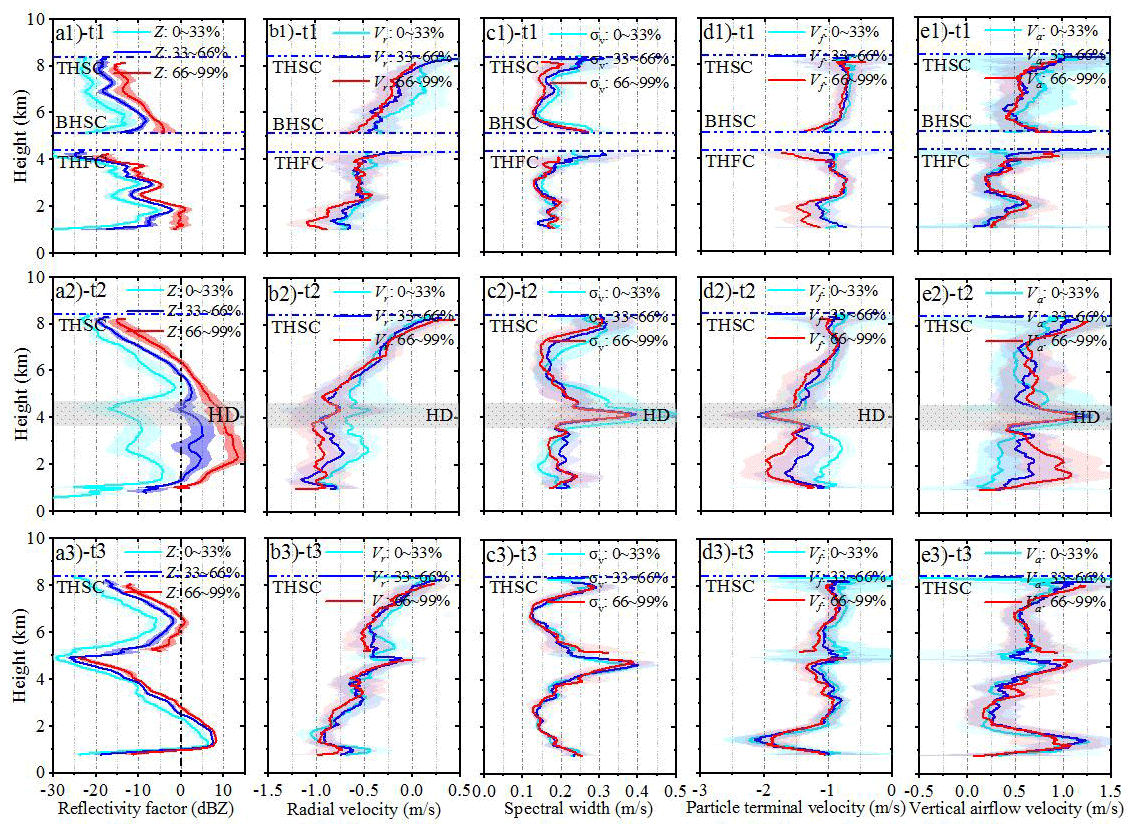
Figure 5The mean profiles of the reflectivity factor (a1–a3), radial velocity (b1–b3), spectral width (c1–c3), particle terminal velocity (d1–d3) and vertical velocity of the airflow (e1–e3) during the t1 (upper), t2 (middle) and t3 (bottom) periods, respectively. In the figure, the cyan line, blue line and red line represent the average of the first 33 %, the middle 33 % and the last 33 % of the sample, respectively The solid line represents the mean, and the shaded area of the corresponding color is the variance.
According to the radar formula, the echo signal intensity is proportional to the sixth square of the cloud particle diameter. A cloud particle with a larger diameter has a larger falling velocity under the action of gravity. To reveal the relationship between the particle diameter and echo signal in the seeder–feeder process, the statistical classification method of equal samples was adopted. All signal values (reflectivity factor, radial velocity, spectral width, particle terminal velocity, and vertical airflow velocity) were reordered according to their corresponding reflectivity factor from small to large and then compared in the equal sample. For example, the first 33 %, middle 33 % and last 33 % of the samples were arithmetically averaged to obtain the mean reflecting the weak, moderate and strong values, respectively. This has the advantage of avoiding the defect of large and small arithmetic averages canceling each other out. Following this principle, the reflectivity factors of t1, t2 and t3 were arranged in ascending order, and the corresponding parameters of cloud particles were also sorted with the order of the reflectivity factor. Then the arithmetic average was performed according to the first 33 %, middle 33 % and last 33 % of the samples. The average profiles representing weak echo, moderate echo and strong echo were obtained (in Fig. 5a1, a2 and a3), and the corresponding average profiles of the cloud particle parameter for the three intensity echoes were also obtained: the corresponding average profiles of radial velocity (in Fig. 5b1, b2 and b3), average profiles of spectral width (in Fig. 5c1, c2 and c3), average profiles of particle terminal velocity (in Fig. 5d1, d2 and d3) and average profiles of vertical airflow velocity (in Fig. 5e1, e2 and e3).
The upper panels of Fig. 5 show that there were obvious differences (in Fig. 5a1) between the profiles of the weak, moderate and strong reflectivity factor of the seeding clouds and feeding clouds before the seeding (in t1 period), but in general, the average profiles of the three kinds of echo intensity show that the reflectivity factor increased with the decrease in detection height, the values of the profiles were relatively small (all less than 0 dBZ) and the variance was also small. However, the profiles of the cloud particle radial velocity (in Fig. 5b1), spectral width (in Fig. 5c1), particle terminal velocity (in Fig. 5d1) and vertical airflow velocity (in Fig. 5e1) corresponding to the average profiles of the three intensity reflectivity factors basically coincided, and they did not show significant changes in these parameters caused by differences in reflectivity factors. This indicates that the cloud particle states (radial velocity, spectral width, particle terminal velocity and vertical velocity of airflow) of the seeding and feeding clouds in the t1 period were uniformly distributed at different intensity echoes; that is, the upper and lower cloud systems were stable before seeding and the cloud particle diameter was mainly small.
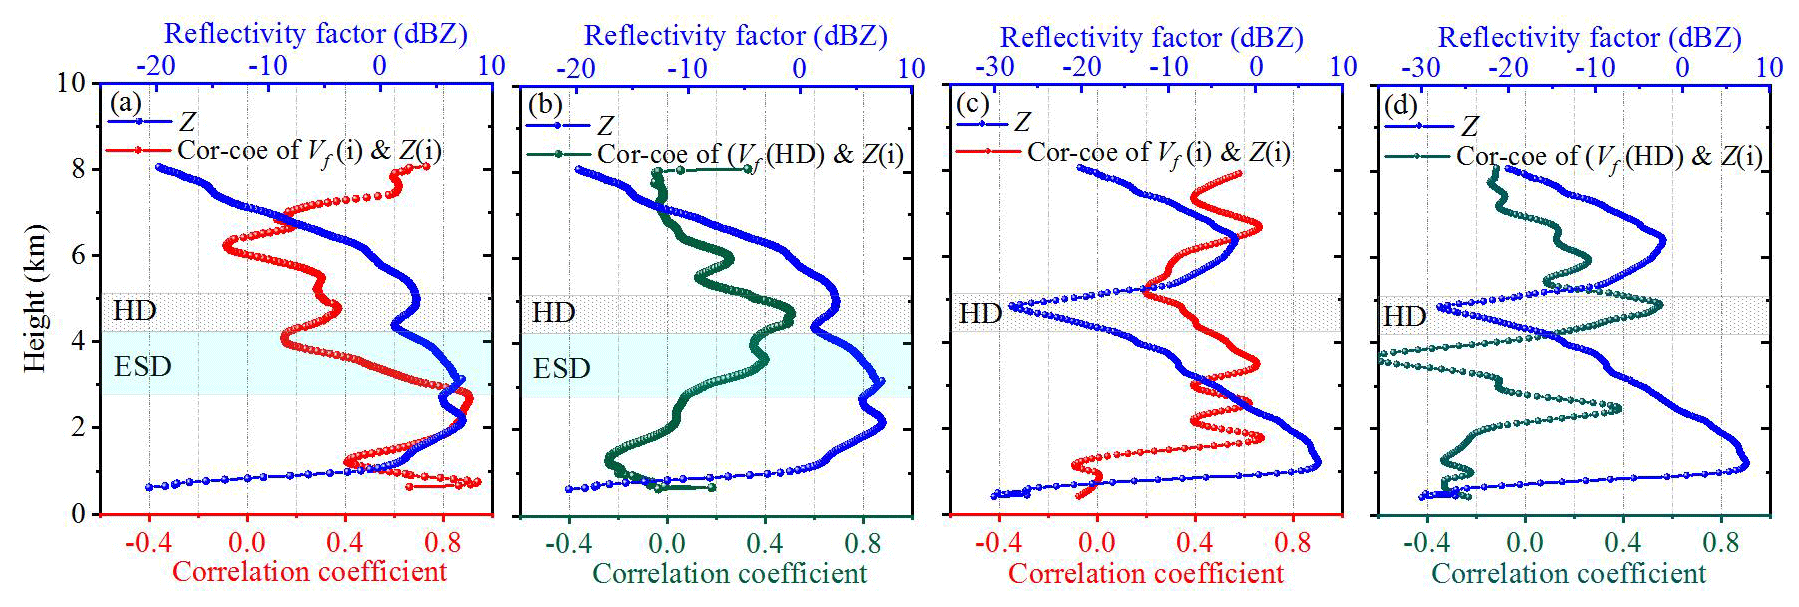
Figure 6(a) The autocorrelation coefficient profile between the cloud particle terminal velocity and reflectivity factor at each range gate from top to bottom in the bilayer cloud in the t2 period. (b) The non-autocorrelation coefficient profile between the average descending terminal velocity in the HD region and reflectivity factor at each range gate in the t2 period. (c) The autocorrelation coefficient profile and (d) the correlation coefficient profile in the t3 period.
The middle panel of Fig. 5 represents the average profiles of each parameter in the seeding period (t2). Figure 5a2 shows that the difference between the average profiles of the reflectivity factor for the three kinds of echo intensity was greater than that before seeding. In particular, the profiles of the moderate and strong reflectivity factor in the figure increased significantly, reaching the maximum of 15 dBZ, which indicates that the diameter distribution of cloud particles varied significantly during seeding in the bilayer cloud. Compared with before seeding, the reflectivity factor of the lower part of the seeding cloud (5.4–6.2 km) increased significantly, from the initial range of −20 to −5 dBZ to −10 to 10 dBZ. The absolute values of radial velocity (in Fig. 5b2) and the terminal velocity of cloud particles (in Fig. 5d2) increased significantly, reaching ∼ 0.8 m s−1 and ∼ 1.3 m s−1 before falling into the feeding clouds. These changes in seeding cloud particles produced the seeding effect. The spectral widths of feeding clouds p (Fig. 5c2) corresponding to the three intensity reflectivity factors did not coincide, which changed significantly with particle distribution or types. For the strong-reflectivity-factor profile, from the top of the seeding clouds to the lower part of the feeding clouds at the height of 2 km, the reflectivity factor increased rapidly with the decrease in the detection height. The corresponding radial velocity and particle terminal velocity increased (i.e., the descending velocity increased), reaching a maximum of 0.9 and 2 m s−1, respectively, and the vertical airflow velocity also increased, reaching a maximum of 1 m s−1. Those values indicate that the large particles in the seeding clouds had a great effect on the feeding clouds. For the weak-reflectivity-factor profile of bilayer clouds, the average reflectivity factor changes little compared with that before seeding, indicating that the seeding effect of small cloud droplets corresponding to such weak echoes was small. Figure 5 also shows that during the seeding period, the reflectivity factor of the middle and upper part of the feeding clouds increased significantly after the seeders were injected into the feeding clouds, especially in the case of strong and moderate intensity, indicating that the middle and upper part of the feeding cloud particle diameter became significantly larger, which was clearly an expression of the seeding effect.
With the end of seeding (bottom panels in Fig. 5), the reflectivity factor of the upper and middle part of the seeding clouds decreased significantly to less than ∼ 0 dBZ. The reflectivity factor of the lower part of the feeding clouds increased, reaching a maximum of ∼ 8 dBZ at the height of 1.5–2 km, which reveals that the seeding effect developed to the lower part of the feeding clouds. In general, the distributions of the profiles of the strong, moderate and weak reflectivity factor in feeding clouds were concentrated after seeding, indicating that the cloud particle diameter became more uniform, which was obviously different from the case before and during seeding. Therefore, the profiles of cloud particle radial velocity, spectral width, particle terminal velocity and vertical airflow velocity corresponding to the strong, moderate and weak reflectivity factor basically coincided, since the reflectivity factor, radial velocity, and particle terminal velocity reflect the particle diameter and since spectral width reflects the particle diameter distribution and particle kinds. After the end of seeding, the cloud particle diameter distribution and particle velocity of the bilayer cloud during the t3 period may have reached a relatively balanced and stable state through the complex microphysical and dynamic interactions during the t2 period. However, the reflectivity factor of the feeding clouds during the t3 period reached a maximum (−8 dBZ) in the lower layer (1–2 km) and the corresponding radial velocity and particle terminal velocity of cloud particles also reached a maximum (1 and ∼ 2 m s−1, respectively), indicating that the seeding effect continued at the lower part of the feeding clouds although seeding has ended at the top of the feeding clouds. The key takeaway from Fig. 5 is that the reflectivity factor (related to the cloud particle diameter) and the descending velocity of cloud particles increased within a certain depth of the feeding cloud during the seeding period. After the end of seeding, there was a seeding continuation period in the middle and lower part of the feeding clouds.
Table 4The characteristic parameters of the seeder–feeder processes of bilayer stratiform clouds from 2021 to 2022.
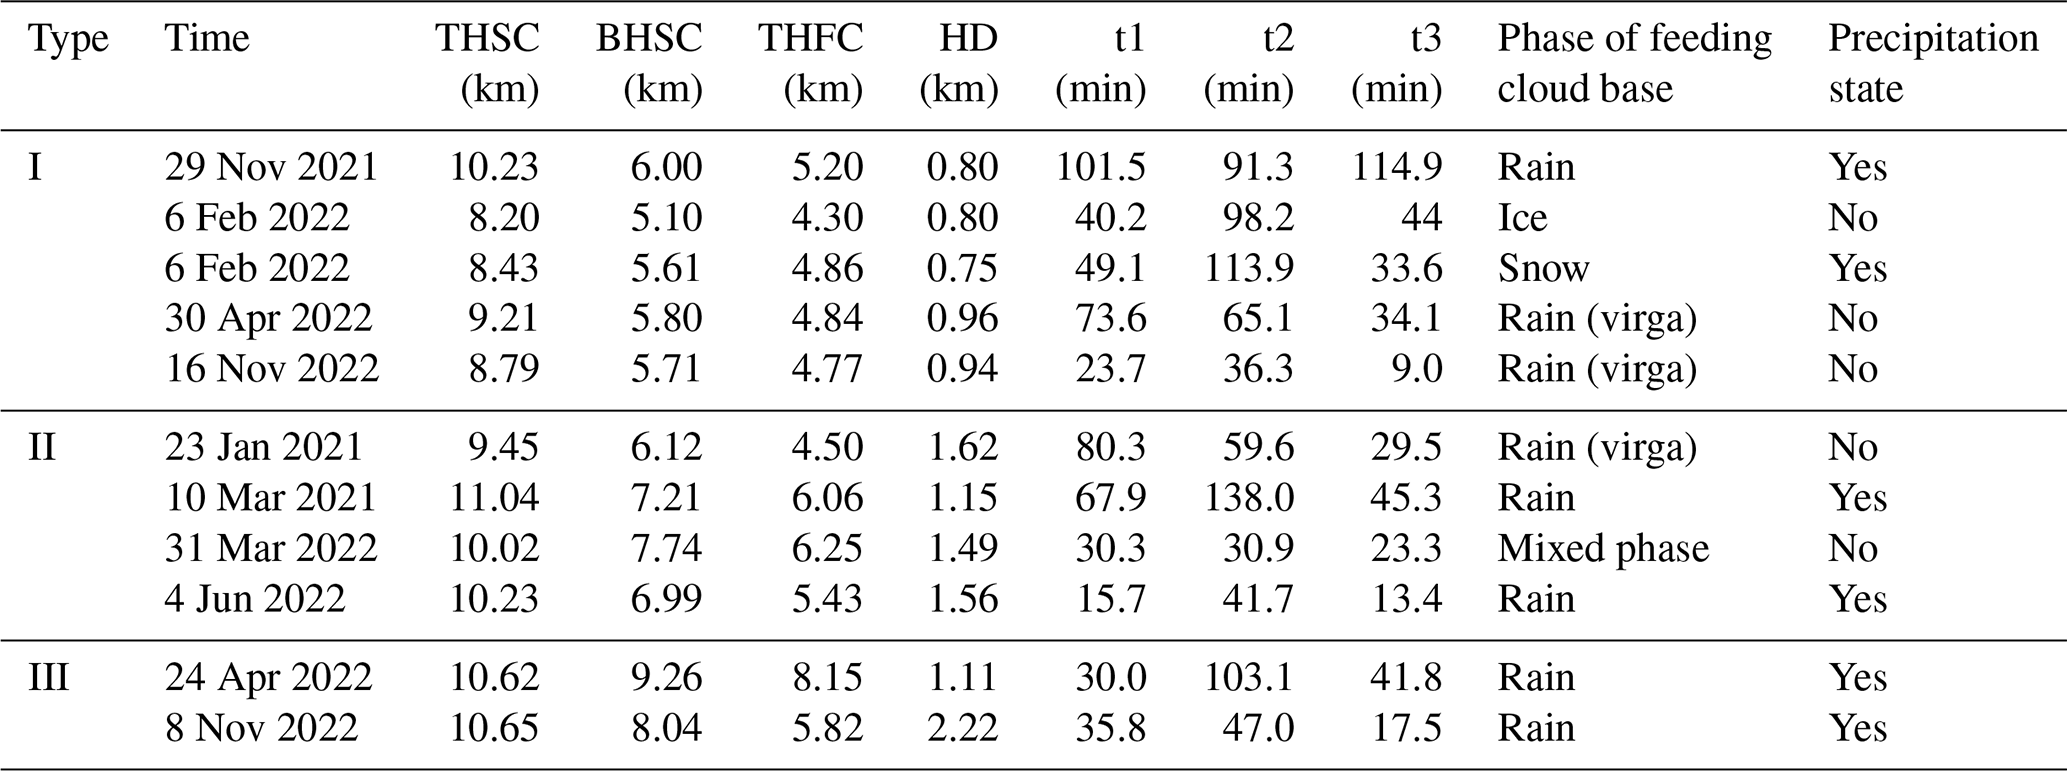
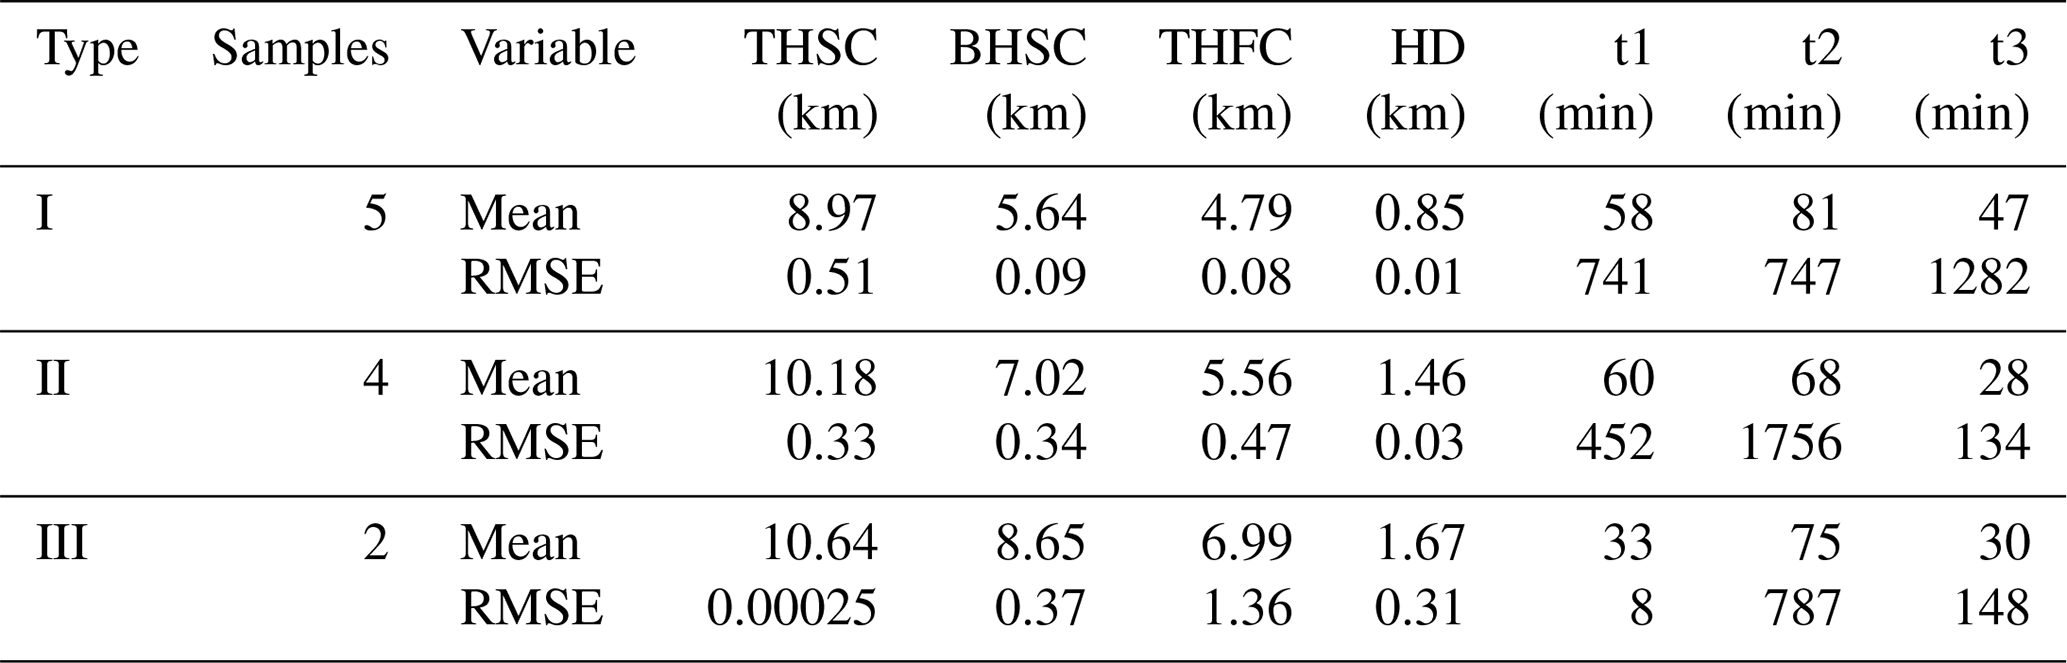
Table 5Statistical results of characteristic parameters of the three types of seeder–feeder processes.
To understand the effect of seeding clouds on feeding clouds, the correlation coefficient between the cloud particle terminal velocity and reflectivity factor was calculated statistically. Firstly, the correlation coefficient between the terminal velocity of cloud particles during the t2 and t3 periods and the corresponding reflectivity factor (called the autocorrelation coefficient because the terminal velocity of cloud particles has a certain relationship with the size of the cloud particles, while the reflectivity factor is proportional to the sixth power of the particle diameter) was calculated. Therefore, the cloud particle terminal velocity is not independent of the reflectivity factor. The obtained autocorrelation coefficient profile during the seeding period (t2) is shown in Fig. 6a, which indicates that as the detection height decreased from the middle of the seeding clouds (6 km) to the middle and lower part of the feeding clouds (2.5 km), the autocorrelation coefficient increased from 0 to 0.8; that is, the positive correlation between the cloud particle terminal velocity and the reflectivity factor increased continuously. The reflectivity factor also increased with the decrease in altitude (from −5 to 5 dBZ), illustrating that the reflectivity factor and terminal velocity of cloud particles increased with the decrease in height, from which may be inferred that the diameter of cloud particles also increased with the decrease in height. Their correlation coefficients increased, which indicates that the particle diameter was constantly increasing because of seeding. When the correlation coefficient started to decrease, it indicated that the particle diameter also started to decrease, and the influence of the seeding began to weaken or transfer to other positions. Therefore, the position with the highest correlation coefficient is defined as the final position in the feeding cloud affected by seeding. Therefore, the effective seeding depth (ESD) is defined as the height difference from the top height of the feeding clouds down to the height of the maximum correlation coefficient, which represents the influence of the seeders on the feeding clouds in the t2 period. In this case, the ESD was about 1.6 km. In the ESD region, the reflectivity factor increased with the decrease in the detection height, so the cloud particle diameter also increased rapidly with the decrease in height; the correlation in the middle and lower part of the ESD region is where the seeding effect was the most intense. In the upper part of the ESD region (i.e., the top of the feeding clouds), the reflectivity factor was slightly smaller (less than 3 dBZ) and the correlation coefficient was also smaller (less than 0.2), indicating that the upper cloud particle diameter of the feeding clouds was small, and the correlation between the terminal velocity of the cloud particle and the reflectivity factor was poor because the seeders had just entered the top of the feeding clouds and the seeding effect had just begun.
If the region between the upper and lower clouds, i.e., the HD region, is regarded as a whole layer, the correlation coefficient between the average terminal velocity of cloud particles in this layer and the reflectivity factors of the range gate in the seeding period (t2) (called the non-autocorrelation coefficient because the terminal velocity of cloud particles and the reflectivity factor in the non-HD region are relatively independent at this time) was calculated, and the non-autocorrelation coefficient profile in Fig. 6b was obtained. It shows that above the height of the HD region, the positive correlation between the average terminal velocity of cloud particles and the reflectivity factor of each layer of the seeding cloud increased as the height decreased, indicating that the terminal velocity of cloud particles in the HD region was mainly affected by the reflectivity factor of the lower layer of the seeding cloud. The larger the reflectivity factor of the lower layer of the seeding cloud, the larger the velocity of cloud particles in the HD region, which conforms to physical principles. As the height decreased to the base of the feeding cloud, the non-autocorrelation coefficient decreased from 0.4 to −0.2, indicating that the average terminal velocity of cloud particles in the HD region was only positively correlated with the reflectivity factor near the top of the feeding cloud; that is, cloud particles in the HD region only affect the clouds near the top of the feeding cloud but have little effect on the lower part of the feeding cloud. This shows that the reflectivity factor in the middle and lower part of the feeding cloud had little correlation with the terminal velocity of cloud particles in the HD region.
The autocorrelation coefficient profile in the t3 period is shown in Fig. 6c, which shows that as the height decreased from the middle of the HD region (∼ 5 km) to the upper part of the feeding clouds (∼ 3.1 km), the autocorrelation coefficient increased from 0.2 to 0.5, and the increase in the reflectivity factor and correlation coefficient was smaller than that of the t2 period at the same detection height, which indicates that the particle diameter continued to increase as the height decreased, while the impact of seeding on feeding clouds was limited due to insufficient seeding. The reflectivity factor reached its maximum within the detection height range of 1–2 km, although the correlation coefficient did not increase synchronously but oscillated and decreased, indicating that the increase in the reflectivity factor was caused not only by the increase in the particle diameter, but also by the increase in the particle number. As seen in Fig. 6d, there was no clear correlation relationship between the non-autocorrelation coefficients and the reflectivity factor in the t3 period.
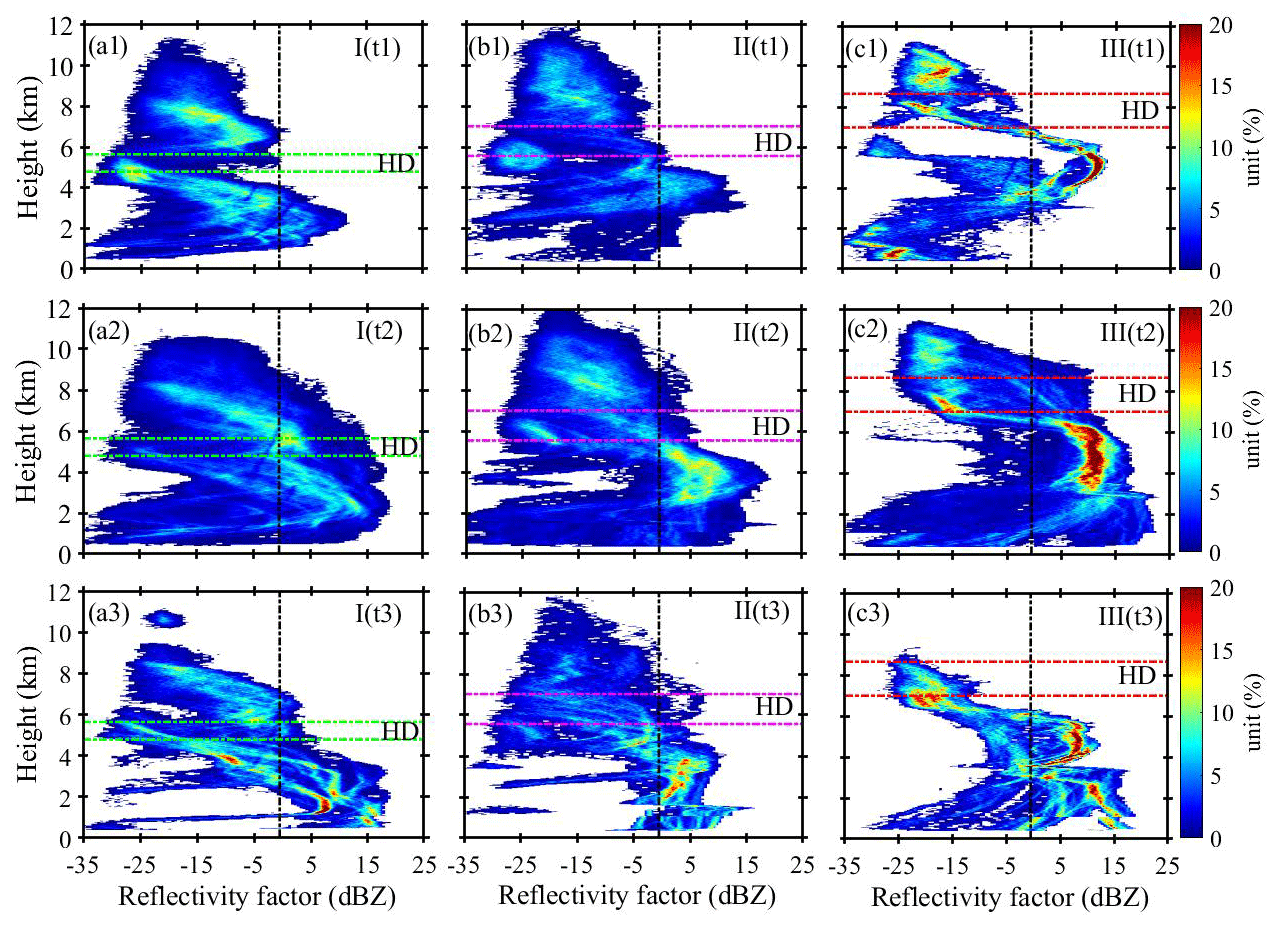
Figure 7The distributions of probability density with height of the reflectivity factor in the three types of seeder–feeder processes before (t1), during (t2) and after (t3) seeding. Type I (five cases) is in the left column (a1–a3), type II (four cases) is in the middle column (b1–b3), and type III (two cases) is in the right column (c1–c3). Note that the HD of type I is thin and low in height, the HD of type II is thick and slightly higher in height, and the HD of type III is thick and the highest in height.
In generally, the effect of seeding clouds on feeding clouds was mainly manifested in the middle and upper part of feeding clouds, that is, the seeding effect activities at the effective seeding depth. During the seeding period, the cloud particle diameter was small (low reflectivity factor) from the top of the feeding clouds upward to the 1 km height. From the top to bottom in the ESD region, the cloud particle diameter increased (the reflectivity factor increased), indicating that seeding mainly occurred at this depth. After the end of seeding, the continuous influence of the seeding process in the feeding clouds can be understood as the delay of seeding benefits and can also be understood as the seeding process inside the feeding clouds, that is, the seeding of the middle part of the feeding clouds to their lower part.
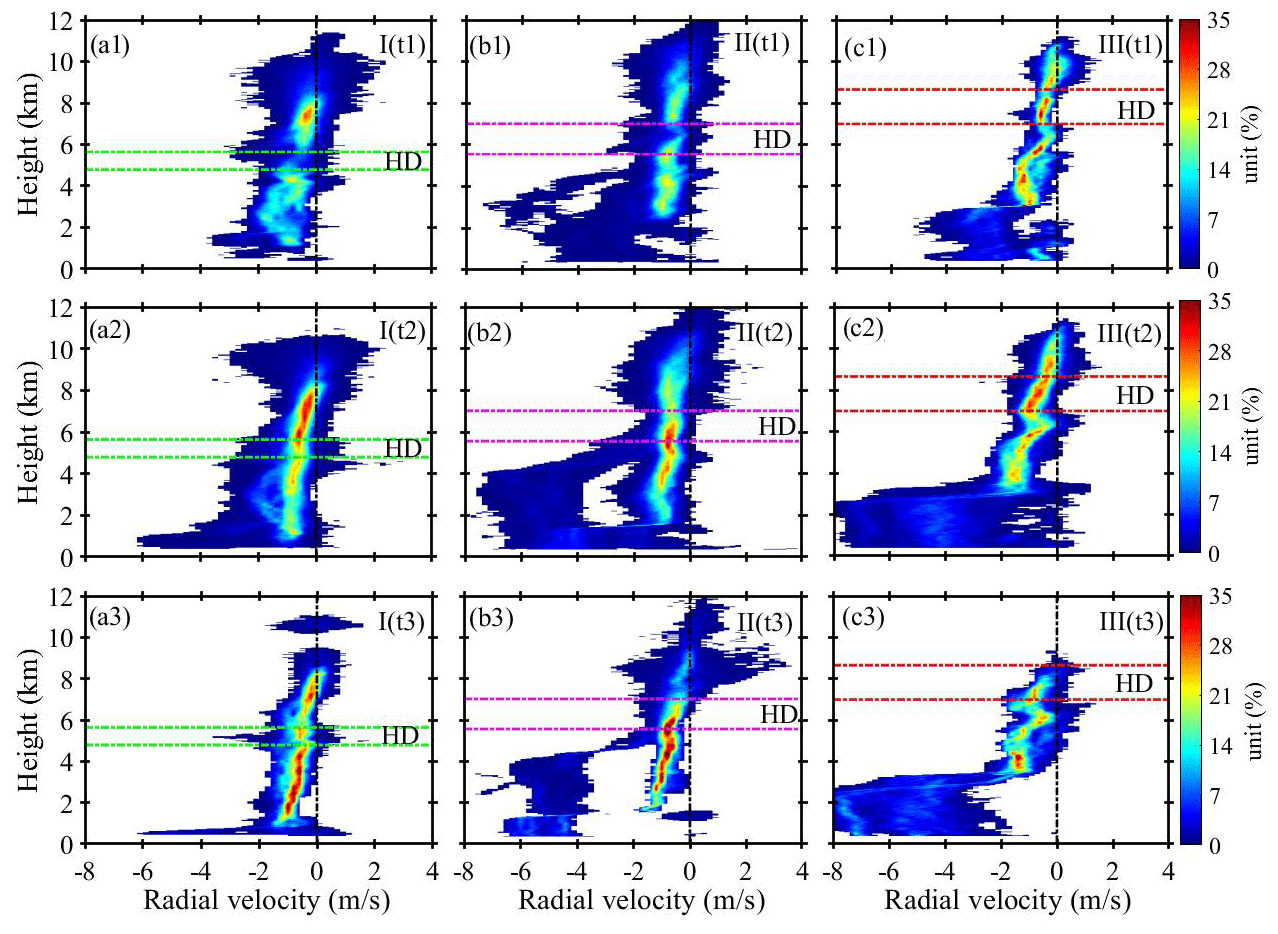
Figure 8The distributions of probability density with the height of the radial velocity in the three types of seeder–feeder processes before (t1), during (t2) and after (t3) seeding.
To reveal the characteristics of the seeder–feeder process of bilayer clouds over the Shaanxi–Guanzhong Plain, China, the observation results by the MMCR from winter to the next spring from 2021 to 2022 were analyzed,because a large range of compact and stable stratiform clouds often appear in the region during these seasons. During the observation period, the MMCR observed 11 cases of seeder–feeder processes of stratiform clouds. Table 4 lists the time of seeder–feeder processes, the THSC, the BHSC, the THFC, the HD, t1, t2, t3, the phase of the feeding cloud base and precipitation conditions on the ground. According to the precipitation records observed by the ground rain gauge, Table 4 shows that there are six cases with precipitation occurrences (one with snowfall) after the seeder–feeder process occurred. In four cases, the base height of feeding clouds dropped to about 560 m, and the radial velocity at the cloud base was in the range of −2 to −3 m s−1; these cloud particles were liquid, so virga (drizzle that does not fall to the ground) was likely at the base of the feeding clouds. The process on 31 March 2022, the reflectivity factor of the middle and lower part of the feeding clouds increased after seeding and the cloud particles mainly moved down. However, due to the high height of the cloud base (about 3.9 km), the retrieved cloud phase was mixed phase, and no precipitation was observed by the ground rain gauge.
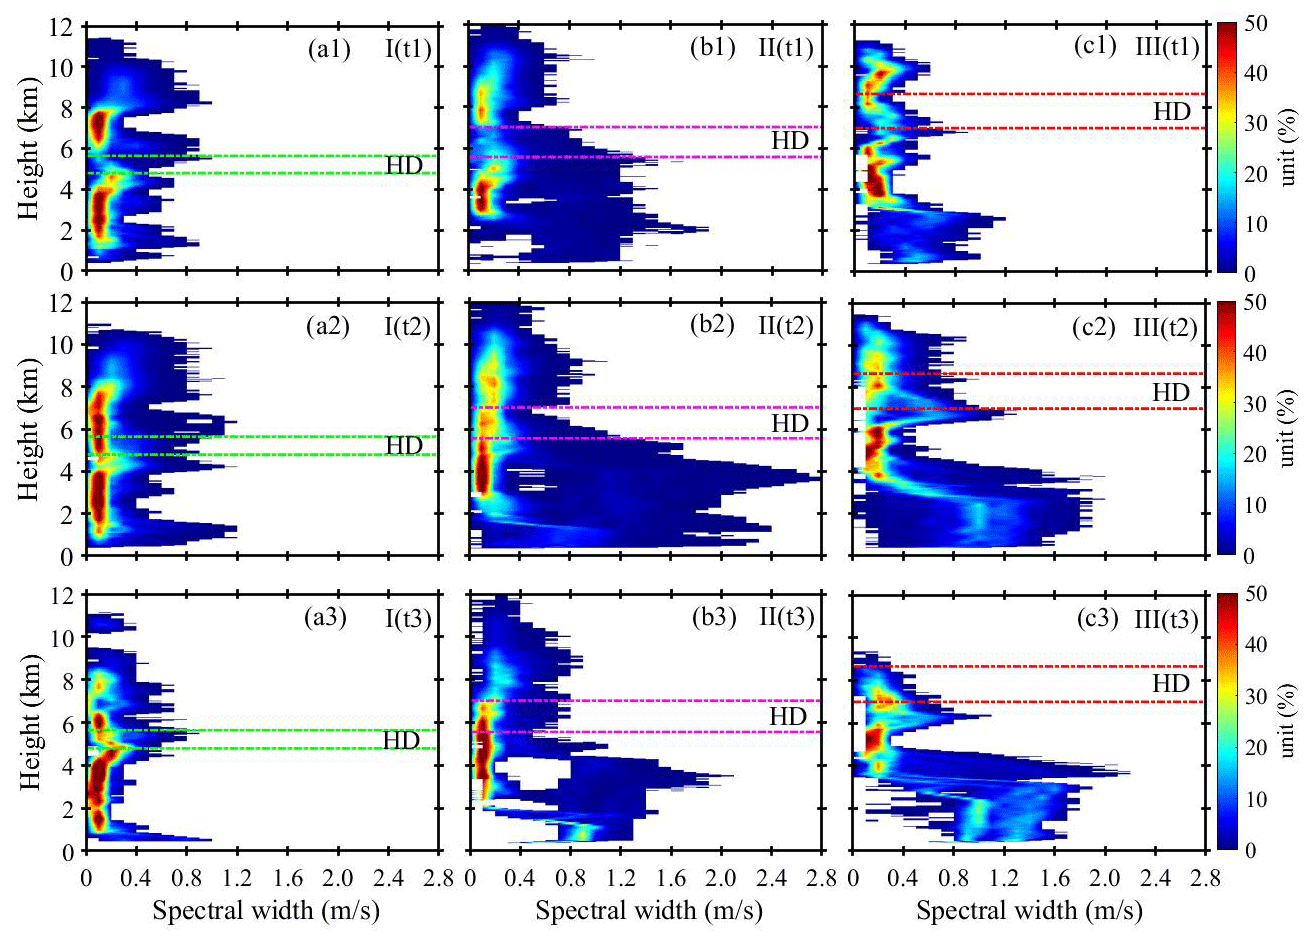
Figure 9The distribution of probability density with heights of the spectral width in the three types of seeder–feeder processes before (t1), during (t2) and after (t3) seeding.
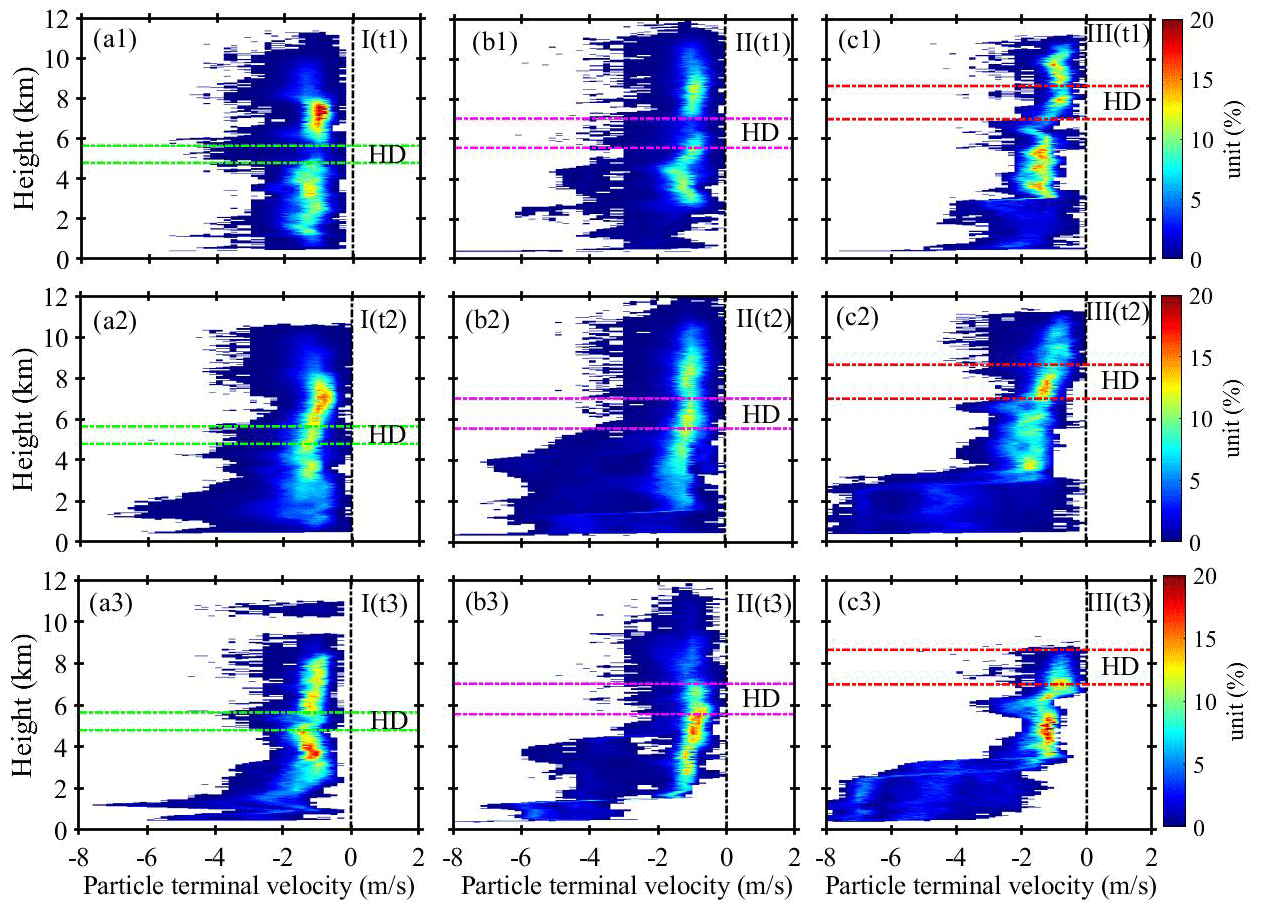
Figure 10The distribution of probability density with height of the particle terminal velocity in the three types of seeder–feeder processes before (t1), during (t2) and after (t3) seeding.
Based on the characteristic parameters of seeding and feeding clouds listed in Table 4, the seeder–feeder process can be generally divided into three types according to the THSC and HD. The seeding process of type I had a low seeding height (BHSC < 6 km) and a small HD (HD ≤ 1 km), type II had a higher seeding height (6 km ≤ BHSC < 8 km) and a larger HD (HD ≥ 1 km), and type III also had a higher seeding height (BHSC ≥ 8 km) and a larger HD (HD ≥ 1 km). Table 5 shows the characteristic parameter distributions of these three types of the seeder–feeder processes. The average thickness of the HD in type I was 0.85 km, the average length of seeding time t2 was 81 min and the average duration of seeding effect time t3 was 47 min (the longest among the three types of seeder–feeder processes). The average HD thickness of type III was the deepest (1.67 km), and the duration of seeding time t2 and seeding effect duration t3 were longer than those of type II.
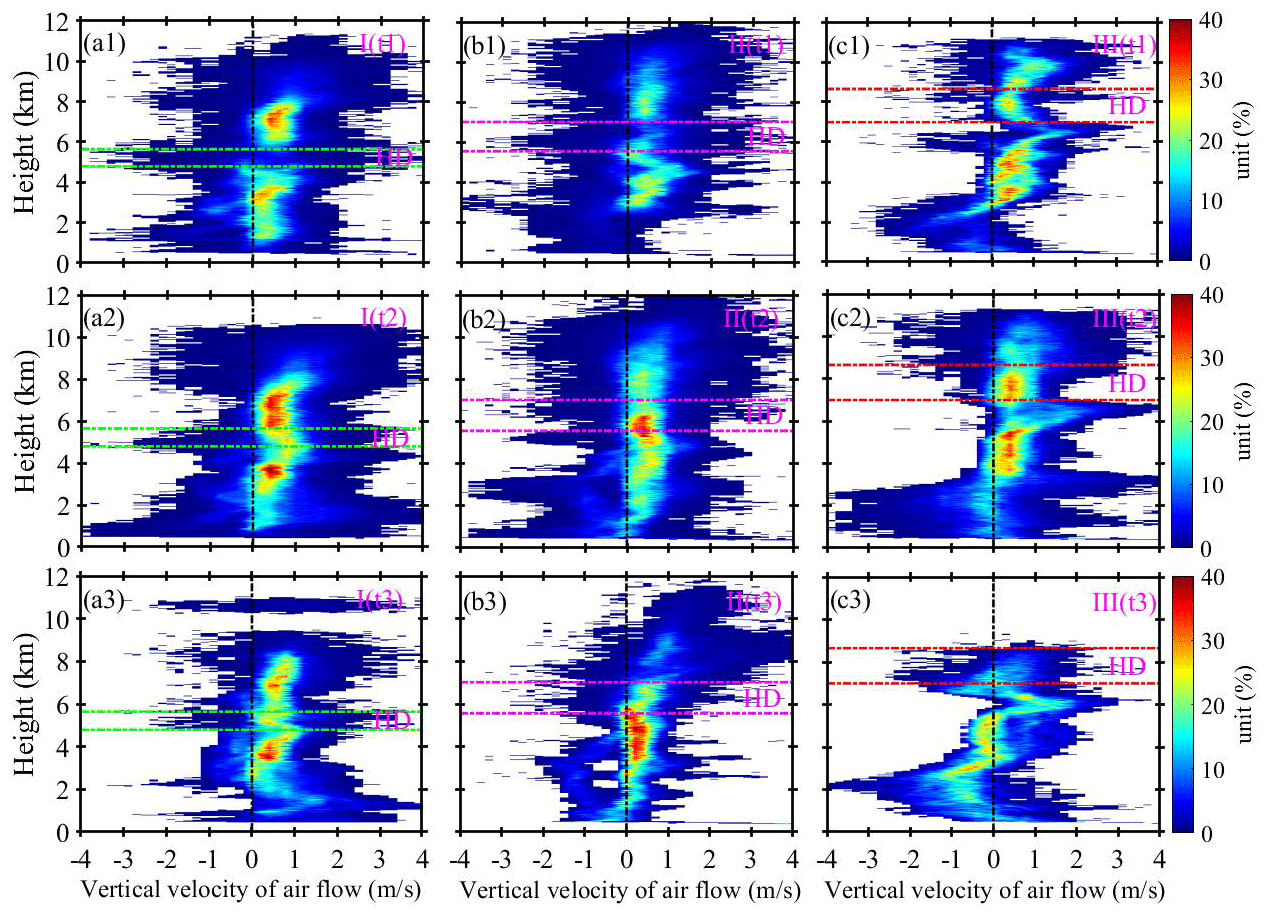
Figure 11The distribution of probability density with height of the vertical velocity of airflow in the three types of seeder–feeder processes before (t1), during (t2) and after (t3) seeding.
In order to expose the internal mechanism of the seeder–feeder process, the distributions of probability density with height (DPDHs) for the reflectivity factor, radial velocity, spectral width, particle terminal velocity and vertical velocity of airflow in these three seeder–feeder types were calculated and plotted. Figure 7a1, b1 and c1 show the differences in the distribution of the reflectivity factor with height in the three types before seeding. The differences in the HD and its height before seeding are clearly shown, and the reflectivity factor of feeding clouds before seeding was small. Figure 7a2, b2 and c2 clearly show that the reflectivity factor of both seeding and feeding clouds increased during the seeding period; in particular, the cloud base height of the feeding clouds decreased significantly, indicating that the development of feeding clouds caused by seeding is likely to cause precipitation. After seeding, the reflectivity factor of the seeding clouds weakened and their thickness thinned (and even disappeared in type III), but the lower part of feeding clouds continued to develop (in Fig. 7a3, b3 and c3), especially in type I. The above shows that when the HD was small and its height was low (type I), the seeding clouds had the greatest influence on the feeding clouds because, in this case, the distance between the seeding and the feeding clouds was short and the seeders were easily able to affect the feeding clouds.
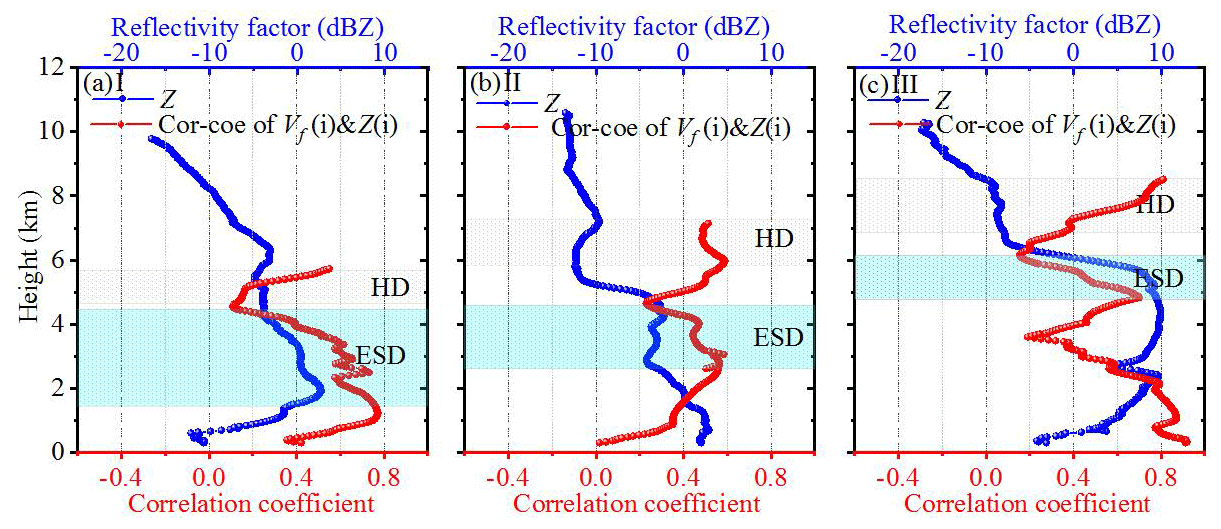
Figure 12Autocorrelation coefficient profiles (red line) between the cloud particle terminal velocity and reflectivity factor (blue line) during seeding (t2) for type I (a), type II (b) and type III (c).
The cloud particle radial velocity detected by the MMCR was the actual motion velocity of cloud particles in the clouds, which can be understood as the synthesis velocity of the vertical airflow velocity and the terminal velocity of cloud particles. The DPDHs of radial velocity are plotted in Fig. 8 and show a weak rising movement in the upper part of the seeding clouds before seeding in the three types, while the weak sinking movement appeared in the lower part. In the feeding clouds, a weak subsidence existed consistently and was slightly larger near the ground. In general, the radial velocity of most cloud particles in seeding and feeding clouds maintained a sinking motion, and the sinking motion increased with decreasing detection height. The radial velocity of cloud particles in seeding and feeding clouds remained the same as before seeding. However, after seeding, the sinking radial velocity of cloud particles decreased (and subsidence motion increased) in both the seeding and the feeding clouds of type I, the same as for types II and III. In the meantime, the seeding clouds disappeared in type III (consistent with Fig. 7c3). The most important feature is that the radial velocity of cloud particles increased with the decrease in height from before seeding to the seeding process and after seeding for the three types of seeder–feeder processes. After seeding, the radial velocity of cloud particles in the lower part of the feeding clouds increased significantly.
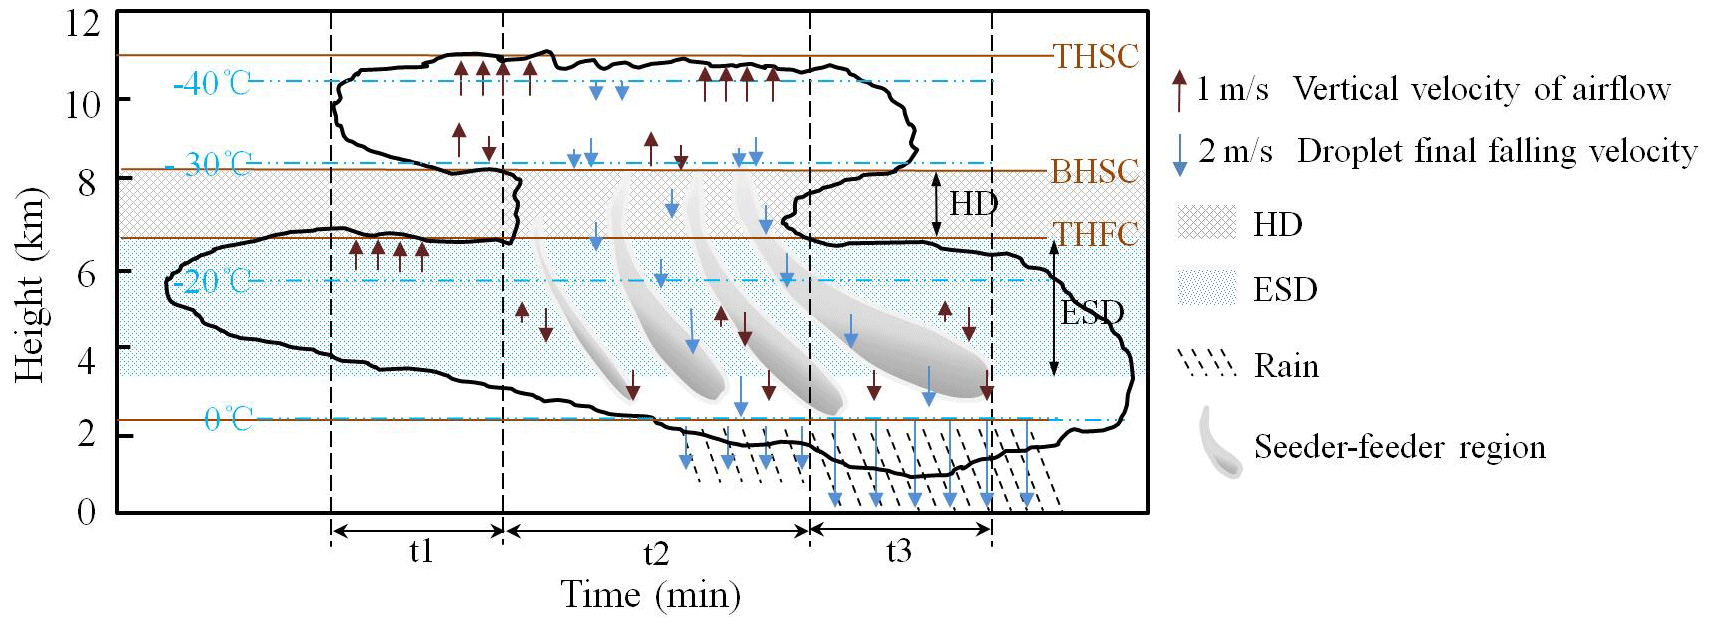
Figure 13Schematic diagram of the natural seeder–feeder process and related parameter distribution.
The spectral width detected by the MMCR reflects the distribution range of the cloud particle velocity. The larger value indicates the larger change in cloud particle velocity, while the smaller value indicates uniform cloud particle velocity. Figure 9 shows the DPDHs of spectral width in the three types of seeding and feeding clouds. The figure shows that the spectral width of most seeding and feeding clouds was less than 0.4 m s−1 and the distribution of particle spectral width in type I was the narrowest (most of them were less than 0.2 m s−1). Moreover, the spectral width did not change significantly before and during seeding (in Fig. 9a1 and a2), but it became significantly narrower after seeding (in Fig. 9a3), which indicates a relative uniformity of the velocity of cloud particles. That was consistent with the DPDHs of the radial velocity with height as shown in Fig. 8a3. The spectral width of types II and III was wider than that of type I. The maximum of the spectral width reached more than 1.6 m s−1, and the spectral width in the feeding clouds was wider than that in the seeding clouds; i.e., the velocity of cloud particles in the feeding clouds was significantly different. In the process of seeding, the spectral width of cloud particles for types II and III became significantly wider (in Fig. 9b2 and c2), which is evidence of the seeding effect resulting in a wide velocity distribution of cloud particles within the feeding clouds. After seeding, the spectral width in feeding clouds of type II and III remained relatively wide (in Fig. 9b3 and c3). In the HD area, the spectral width was wider in type II and III than in type I during seeding, which may portend a wider distribution of the cloud particle diameter in types II and III. While in the top of the feeding clouds, there was a small spectral width for the three types of seeder–feeder processes, which indicates the relative uniformity of the cloud particle velocity and the narrow distribution of the cloud particle diameter.
The terminal velocity of cloud particles is the result of subtracting the vertical airflow velocity from the radial velocity. As shown in Fig. 10, the DPDHs of the particle terminal velocity in the three types of seeding and feeding clouds varied. In general, the particle terminal velocity of the three types was primarily distributed in the range of −0.5 to −2 m s−1, and the distribution of the particle terminal velocity during the seeding process (t2) and after the seeding process (t3) was wider than that before the seeding (t1). In the seeding process, the particle terminal velocity distribution was the widest; the maximum velocities in type II and III were approximately −6 and −8 m s−1, respectively. The large particle terminal velocity was located at the lower part of the feeding clouds after the seeding for the three types, which was likely to be caused by the seeding effect increasing the cloud particle diameter in the feeding clouds. Then, under the action of gravity, the descending velocity of cloud particles increased and even rainfall occurred (type III). During the seeding period of the three types (in Fig. 10a2, b2 and c2), the particle terminal velocity increased slightly with the descending height from the HD to the top of the feeding clouds, indicating that the size of seeders in the HD region increased during the descending process and when they entered the upper part of the feeding clouds, which reflected the seeding effect of seeders. In the middle to lower part of the feeding clouds, the distribution of the particle terminal velocity was wide, which may be caused by the development of the feeding clouds itself. After the end of the seeding in the three types (in Fig. 10a3, b3 and c3), the particle terminal velocity increased in the middle and lower part of the feeding clouds, which can be understood as the delay of the seeding effect reaching the lower part of the feeding clouds during the seeding period.
The distribution of vertical velocity airflow in clouds is a reflection of the dynamic structure of clouds. The airflow in stratiform clouds is usually slow, and the diameter and concentration of cloud particles change little. Figure 11 shows the DPDHs of the vertical velocity of airflow in the three types of seeding and feeding clouds. It shows that updraft and downdraft existed simultaneously in the clouds. The vertical velocity of airflow in the upper part of the seeding clouds was slightly larger than that in the lower part, which transported water vapor needed for the growth of ice particles and increased the probability of collision between particles. The updraft velocity at the top of the feeding clouds was also slightly greater than that at the base. There were slight differences between the three types of seeder–feeder processes, among which types I and II were dominated by weak updrafts before, during and after seeding and the HD region was also dominated by weak updrafts; the updrafts were mainly distributed in the range of 0–1 m s−1 (probability density greater than 20 %). The probability density of strong or weak updraft (greater than 1 m s−1 or less than 0 m s−1) was less than 20 %. For type III, before and during seeding, the DPDHs for the vertical velocity of airflow was similar to that of types I and II, but after seeding, the large downdraft appeared in the HD region and the middle and lower part of the feeding clouds. Figure 10c3 also shows that the cloud particles in the lower part of the feeding clouds mainly moved down, and the reflectivity factor showed that precipitation appeared at the base of the feeding clouds.
To understand the relationship between the cloud particle variation and echo signal, the correlation coefficient between the cloud particle terminal velocity and corresponding reflectivity factor in the three types during seeder–feeder period (t2) was calculated and then averaged according to different categories. Based on the height corresponding to the average HD thickness of the three types of seeder–feeder processes, the correlation coefficient profiles and average reflectivity factor profiles of the corresponding categories were obtained as shown in Fig. 12. The ESD regions are indicated by cyan-shaded boxes; the height and thickness of the HD layer in the three types continuously increase from type I to type III, while the thickness of the ESD layer is in contrast. The ESD region in type I was the thickest, and it was the thinnest in type III, which leads to the conclusion that the HD height was high and the thickness of the ESD region was thin during seeding process. This process can be understood as follows: when the HD layer is high, the cloud particles are small (that is, light particles in weight), so their falling speed is also small (see Fig. 10b2) and the depth of their falling into the top layer of the feeding clouds is also shallow. On the contrary, when the cloud particles in the HD layer are larger (i.e., heavier), the height of the HD layer is lower, and these particles would fall into the deeper region of the feeding clouds, such as for type I.
Figure 12a shows more detail of the feeding clouds such as the reflectivity factor increasing with the decrease in the detection height and reaching a maximum value at 2 km, and the correlation coefficient also increases with the increased reflectivity factor. This indicates a close relationship between the reflectivity factor and the particle terminal velocity. In essence, when the particle terminal velocity was large, the cloud particles had a large mass and large size and the reflectivity factor had to be large. Figure 10a2 also shows that there was a certain proportion of cloud particles in the middle and lower part of the ESD region with the large sinking velocity. However, at the base of the feeding clouds, the reflectivity factor and the correlation coefficient decreased, indicating that there was basically no seeding effect at the base of feeding clouds during the t2 period. The reflectivity factor increased rapidly, but the correlation coefficient decreased rapidly at the top of feeding clouds in type II. It is estimated that because the seeders in the HD layer just fell into the top of the feeding clouds, the number of cloud particles increased at the top, but these particles did not have time to grow, so although the reflectivity factor increased, the correlation coefficient decreased rapidly. When the seeders drop to a certain depth in the feeding clouds, interaction between cloud particles, such as collision, occurs, so the correlation coefficient between the particle terminal velocity and reflectivity factor increases synchronously. Below the ESD region, the correlation coefficient decreased rapidly with the decrease in detection height, but the reflectivity factor continued to increase, which was probably caused by the large number of particles in the layer. In type III, as the seeders entered the ESD region, the reflectivity factor increased rapidly with the decrease in the detection height together with the correlation coefficient increasing rapidly to the maximum. In the detection height range of 5–3.5 km, the correlation coefficient decreased obviously with the decrease in height, but the reflectivity factor maintained a large value (about 10 dBZ), which indicates the high concentration of cloud particles at this detection height. In the lower part of the feeding clouds, the reflectivity factor decreased with the decrease in height, while the correlation coefficient increased, indicating that the particle terminal velocity at this height also decreased. It is likely that the cloud particles were so small that some of them evaporated, causing both the reflectivity factor and the particle terminal velocity to decrease simultaneously. In general, the depth the seeders fell into the feeding clouds was limited, and the lower the height and thinner the HD layer, the lower the height and thicker the thickness of the ESD region.
In this paper, the data of bilayer stratiform clouds in winter to the next spring detected by the MMCR were investigated, and the seeder–feeder process in the bilayer clouds was observed in Xi'an, China. By defining the key parameters of the seeding and feeding clouds, such as the HD between the bilayer cloud and the ESD of the feeding clouds, the calculation method of DPDH and the analysis method of the correlation coefficient profile between the cloud particle terminal velocity and the reflectivity factor were adopted. The results show that (1) during the 11 cases of the seeder–feeder process in the bilayer cloud, the seeding effect had a significant impact on the macro- and micro-parameters of the feeding clouds, which was mainly manifested in the seeding effect causing a significant increase in the reflectivity factor and the terminal velocity of cloud particles in the feeding clouds. Therefore, it was speculated that the seeding effect caused a significant increase in the particle diameter of the feeding clouds. (2) According to the distribution characteristics of the ESD region thickness and height, the seeder–feeder processes in bilayer clouds were divided into three types: type I had a thin HD layer with low height, and its ESD region was thick; type III had a thick HD layer with high height, and its ESD region was thin; and the values of both the HD and the ESD of type II were between types I and III. It can be inferred that the lower the height and thinner the thickness of the HD layer, the lower the height and thicker the thickness of the ESD region, and vice versa. (3) According to the analysis results of 11 cases, the related parameter distributions of the seeder–feeder process in bilayer clouds are shown in Fig. 13. They show that, during the evolution of bilayer clouds, the phenomenon of cloud particles from the lower part of the upper-layer clouds seeding the lower-layer clouds occurred against an appropriate weather background; that is, the distribution of airflow was unique with height and there was a relatively obvious updraft at the top of the seeding clouds. In the seeding layer (the HD layer and ESD region), the downdraft and cloud particles were larger, and when there was rainfall, the sinking motion at the base of the feeding clouds was stronger. Furthermore, there was a small down-flow region in the seeding and the feeding clouds but weak updraft in the bilayer cloud. The seeding process can last up to 2 h, but most seeding lasts for tens of minutes. Generally, the seeding occurs at −25 to −10 °C in clouds. The seeding effect influences the precipitation (rain or snow) intensity in the feeding clouds, which will be shown in the results of subsequent studies.
The data and codes related to this article are available upon request to the corresponding author.
Conceptualization: HD. Investigation: HD and YY. Methodology: HD and YY. Software: YY. Writing – original draft: HD and YY. Writing – review and editing: HD. Supervision: HD. Data collation: YY.
The contact author has declared that neither of the authors has any competing interests.
Publisher's note: Copernicus Publications remains neutral with regard to jurisdictional claims made in the text, published maps, institutional affiliations, or any other geographical representation in this paper. While Copernicus Publications makes every effort to include appropriate place names, the final responsibility lies with the authors.
We express our gratitude to the Xi'an Meteorology Bureau of Shaanxi Province, Xi'an, and Shehong Li, Shuicheng Bai and Mei Cao for providing relevant supporting data.
This research was supported by the National Natural Science Foundation of China, the Innovative Research Group Project of the National Natural Science Foundation of China (grant nos. 42130612, 41627807), and the PhD innovation fund projects of the Xi'an University of Technology (grant no. 310-252072106).
This paper was edited by Zhanqing Li and reviewed by three anonymous referees.
Bergeron, T.: On the physics of clouds and precipitation, Proc. 5th Assembly UGGI, Lisbon, Portugal, 1935, 156–180 pp., 1935.
Braham, R. R.: Cirrus Cloud Seeding as a Trigger for Storm Development, J. Atmos. Sci., 24, 311–312, https://doi.org/10.1175/1520-0469(1967)024<0311:CCSAAT>2.0.CO;2, 1967.
Cheng, C. and Yi, F.: Falling Mixed-Phase Ice Virga and their Liquid Parent Cloud Layers as Observed by Ground-Based Lidars, Remote Sens.-Basel, 12, 2094, https://doi.org/10.3390/rs12132094, 2020.
Choularton, T. W. and Perry, S. J.: A model of the orographic enhancement of snowfall by the seeder-feeder mechanism, Q. J. Roy. Meteor. Soc., 112, 335–345, https://doi.org/10.1002/qj.49711247204, 1986.
Di, H., Yuan, Y., Yan, Q., Xin, W., Li, S., Wang, J., Wang, Y., Zhang, L., and Hua, D.: Determination of atmospheric column condensate using active and passive remote sensing technology, Atmos. Meas. Tech., 15, 3555–3567, https://doi.org/10.5194/amt-15-3555-2022, 2022.
Dong, X., Zhao, C., Huang, Z., Mai, R., Lv, F., Xue, X., Zhang, X., Hou, S., Yang, Y., Yang, Y., and Sun, Y.: Increase of precipitation by cloud seeding observed from a case study in November 2020 over Shijiazhuang, China, Atmos. Res., 262, 105766, https://doi.org/10.1016/j.atmosres.2021.105766, 2021.
Fernández-González, S., Valero, F., Sánchez, J. L., Gascón, E., López, L., García-Ortega, E., and Merino, A.: Analysis of a seeder-feeder and freezing drizzle event, J. Geophys. Res.-Atmos., 120, 3984–3999, https://doi.org/10.1002/2014jd022916, 2015.
French, J. R., Friedrich, K., Tessendorf, S. A., Rauber, R. M., Geerts, B., Rasmussen, R. M., Xue, L., Kunkel, M. L., and Blestrud, D. R.: Precipitation formation from orographic cloud seeding, P. Natl. Acad. Sci. USA, 115, 1168–1173, https://doi.org/10.1073/pnas.1716995115, 2018.
Geerts, B., Pokharel, B., and Kristovich, D. A. R.: Blowing Snow as a Natural Glaciogenic Cloud Seeding Mechanism, Mon. Weather Rev, 143, 5017–5033, https://doi.org/10.1175/MWR-D-15-0241.1, 2015.
Görsdorf, U., Lehmann, V., Bauer-Pfundstein, M., Peters, G., Vavriv, D., Vinogradov, V., and Volkov, V.: A 35-GHz Polarimetric Doppler Radar for Long-Term Observations of Cloud Parameters—Description of System and Data Processing, J. Atmos. Ocean. Tech., 32, 675–690, https://doi.org/10.1175/jtech-d-14-00066.1, 2015.
Hall, W. D. and Pruppacher, H. R.: The Survival of Ice Particles Falling from Cirrus Clouds in Subsaturated Air, J. Atmos. Sci., 33, 1995–2006, https://doi.org/10.1175/1520-0469(1976)033<1995:tsoipf>2.0.co;2, 1976.
He, Y., Yi, F., Liu, F., Yin, Z., Yi, Y., Zhou, J., Yu, C., and Zhang, Y.: Natural seeder-feeder process originating from mixed-phase clouds observed with polarization lidar and radiosonde at a mid-latitude plain site, J. Geophys. Res.-Atmos., 127, e2021JD036094, https://doi.org/10.1029/2021JD036094, 2022.
Heymsfield, A. J., Schmitt, C., and Bansemer, A.: Ice Cloud Particle Size Distributions and Pressure-Dependent Terminal Velocities from In Situ Observations at Temperatures from 0° to −86°C, J. Atmos. Sci., 70, 4123–4154, https://doi.org/10.1175/jas-d-12-0124.1, 2013.
Hill, F. F., Browning, K. A., and Bader, M. J.: Radar and Raingauge Observations of Orographic Rain over South Wales, Q. J. Roy. Meteor. Soc., 107, 643–670, https://doi.org/10.1002/qj.49710745312, 2007.
Hong, Y.: Research Progress of Stratiform Cloud Structure and Precipitation Mechanism and Discussion on Artificial Precipitation Problems, Clim. Environ. Res., 17, 937–950, https://doi.org/10.3878/j.issn.1006-9585.2012.06.31, 2012.
Hou, T., Lei, H., and Hu, Z.: A comparative study of the microstructure and precipitation mechanisms for two stratiform clouds in China, Atmos. Res., 96, 447–460, https://doi.org/10.1016/j.atmosres.2010.02.004, 2010.
Kollias, P., Albrecht, B. A., Lhermitte, R., and Savtchenko, A.: Radar observations of updrafts, downdrafts, and turbulence in fair-weather cumuli, J. Atmos. Sci., 58, 1750–1766, https://doi.org/10.1175/1520-0469(2001)058%3C1750:ROOUDA%3E2.0.CO;2, 2001.
Kollias, P., Albrecht, B. A., and Marks, F.: Why Mie? Accurate observations of vertical air velocities and raindrops using a cloud radar, B. Am. Meteorol. Soc., 83, 1471–1483, https://doi.org/10.1175/bams-83-10-1471, 2002.
Kollias, P., Rémillard, J., Luke, E., and Szyrmer, W.: Cloud radar Doppler spectra in drizzling stratiform clouds: 1. Forward modeling and remote sensing applications, J. Geophys. Res., 116, D13201, https://doi.org/10.1029/2010JD015237, 2011.
Korolev, A. and Isaac, G.: Phase transformation of mixed-phase clouds, Q. J. Roy. Meteor. Soc., 129, 19–38, https://doi.org/10.1256/qj.01.203, 2003.
Korolev, A. V., Isaac, G. A., and Hallett, J.: Ice particle habits in Arctic clouds, Geophys. Res. Lett., 26, 1299–1302, https://doi.org/10.1029/1999GL900232, 1999.
Korolev, A. V., Isaac, G. A., Cober, S. G., Strapp, J. W., and Hallett, J.: Microphysical characterization of mixed-phase clouds, Q. J. Roy. Meteor. Soc., 129, 39–65, https://doi.org/10.1256/qj.01.204, 2003.
Liu, L., Ding, H., Dong, X., Cao, J., and Su, T.: Applications of QC and Merged Doppler Spectral Density Data from Ka-Band Cloud Radar to Microphysics Retrieval and Comparison with Airplane in Situ Observation, Remote. Sens.-Basel, 11, 1595, https://doi.org/10.3390/rs11131595, 2019.
Locatelli, J. D., Hobbs, P. V., and Biswas, K. R.: Precipitation from Stratocumulus Clouds Affected by Fallstreaks and Artificial Seeding, J. Clim. Appl. Meteorol., 22, 1393–1403, https://doi.org/10.1175/1520-0450(1983)022<1393:PFSCAB>2.0.CO;2, 1983.
Lowenthal, D. H., Hallar, A. G., David, R. O., McCubbin, I. B., Borys, R. D., and Mace, G. G.: Mixed-phase orographic cloud microphysics during StormVEx and IFRACS, Atmos. Chem. Phys., 19, 5387–5401, https://doi.org/10.5194/acp-19-5387-2019, 2019.
Luke, E. P. and Kollias, P.: Separating Cloud and Drizzle Radar Moments during Precipitation Onset Using Doppler Spectra, J. Atmos. Ocean. Tech., 30, 1656–1671, https://doi.org/10.1175/jtech-d-11-00195.1, 2013.
Myagkov, A., Seifert, P., Wandinger, U., Bühl, J., and Engelmann, R.: Relationship between temperature and apparent shape of pristine ice crystals derived from polarimetric cloud radar observations during the ACCEPT campaign, Atmos. Meas. Tech., 9, 3739–3754, https://doi.org/10.5194/amt-9-3739-2016, 2016.
Proske, U., Bessenbacher, V., Dedekind, Z., Lohmann, U., and Neubauer, D.: How frequent is natural cloud seeding from ice cloud layers (< −35 °C) over Switzerland?, Atmos. Chem. Phys., 21, 5195–5216, https://doi.org/10.5194/acp-21-5195-2021, 2021.
Purdy, J. C., Austin, G. L., Seed, A. W., and Cluckie, I. D.: Radar evidence of orographic enhancement due to the seeder feeder mechanism, Meteorol. Appl., 12, 199–206, https://doi.org/10.1017/S1350482705001672, 2005.
Ramelli, F., Henneberger, J., David, R. O., Lauber, A., Pasquier, J. T., Wieder, J., Bühl, J., Seifert, P., Engelmann, R., Hervo, M., and Lohmann, U.: Influence of low-level blocking and turbulence on the microphysics of a mixed-phase cloud in an inner-Alpine valley, Atmos. Chem. Phys., 21, 5151–5172, https://doi.org/10.5194/acp-21-5151-2021, 2021.
Robichaud, A. J. and Austin, G. L.: On the Modelling of Warm Orographic Rain by the Seeder-Feeder Mechanism, Q. J. Roy. Meteor. Soc., 114, 967–988, https://doi.org/10.1002/qj.49711448207, 1988.
Seifert, P., Ansmann, A., Mattis, I., Althausen, D., Tesche, M., Wandinger, Ulla., Muller, D., and Pérez, C.: Lidar-based profiling of the tropospheric cloud–ice distribution to study the seeder-feeder mechanism and the role of Saharan dust as ice nuclei, Proceedings of the 8th International Symposium on Tropospheric Profiling, ISBN 978-90-6960-233-2, S01–O04–1 4, https://www.researchgate.net/publication/228607204 (last access: 16 October 2022), 2014.
Shupe, M. D.: A ground-based multisensory cloud phase classifier, Geophys. Res. Lett., 34, L22809, https://doi.org/10.1029/2007GL031008, 2007.
Shupe, M. D., Uttal, T., and Matrosov, S. Y.: Arctic Cloud Microphysics Retrievals from Surface-Based Remote Sensors at SHEBA, J. Appl. Meteorol., 44, 1544–1562, https://doi.org/10.1175/jam2297.1, 2005.
Shupe, M. D., Kollias, P., Persson, P. O. G., and McFarquhar, G. M.: Vertical motions in Arctic mixed-phase stratiform clouds, J. Atmos. Sci., 65, 1304–1322, https://doi.org/10.1175/2007JAS2479.1, 2008.
Tao, R., Zhao, K., Huang, H., Wen, L., Chen, H.: Snow Particle Size Distribution From a 2-D Video Disdrometer and Radar Snowfall Estimation in East China, IEEE T. Geosci. Remote, 59, 196–207, https://doi.org/10.1109/TGRS.2020.2990920, 2020.
Vassel, M., Ickes, L., Maturilli, M., and Hoose, C.: Classification of Arctic multilayer clouds using radiosonde and radar data in Svalbard, Atmos. Chem. Phys., 19, 5111–5126, https://doi.org/10.5194/acp-19-5111-2019, 2019.
Wang, H., Zhang D., Wang, W., Wang, J., Li, Y., Wang, S.: Microphysical characteristics of stratiform precipitation with embedded convection based on multisource data, Chin. J. Atmos. Sci., 46, 886–902, https://doi.org/10.3878/j.issn.1006-9895.2107.21043, 2022 (in Chinese).
Wang, Y., Kong, R., Cai, M., Zhou, Y., Song, C., Liu, S., Li, Q., Chen, H., and Zhao, C.: High small ice concentration in stratiform clouds over Eastern China based on aircraft observations: Habit properties and potential roles of secondary ice production, Atmos. Res., 281, 106495, https://doi.org/10.1016/j.atmosres.2022.106495, 2023.
Wei, T., Xia, H., Hu, J., Wang, C., Shangguan, M., Wang, L., Jia, M., and Dou, X.: Simultaneous wind and rainfall detection by power spectrum analysis using a VAD scanning coherent Doppler lidar, Opt. Express, 27, 31235, https://doi.org/10.1364/OE.27.031235, 2019.
Yuan, Y., Di, H., Liu, Y., Cheng, D., Chen, N., Yan, Q., and Hua, D.: Confidence and Error Analyses of the Radiosonde and Ka-Wavelength Cloud Radar for Detecting the Cloud Vertical Structure, Remote. Sens.-Basel, 14, 4462, https://doi.org/10.3390/rs14184462, 2022a.
Yuan, Y., Di, H., Liu, Y., Yang, T., Li, Q., Yan, Q., Xin, W., Li, S., and Hua, D.: Detection and analysis of cloud boundary in Xi'an, China, employing 35 GHz cloud radar aided by 1064 nm lidar, Atmos. Meas. Tech., 15, 4989–5006, https://doi.org/10.5194/amt-15-4989-2022, 2022b.
Yuan, Y., Di, H., Wang, K., Bai, S., Yan, Q., Cao, M., Zhang, Y., Wang, Y., and Hua, D.: Fine recognition technology of cloud phase based on multidimensional data, Acta Opt. Sin, 42, 268–278, https://doi.org/10.3788/AOS202242.1228002, 2022c.