the Creative Commons Attribution 4.0 License.
the Creative Commons Attribution 4.0 License.
 | 23 Apr 2024
Simulated phase state and viscosity of secondary organic aerosols over China
Zhiqiang Zhang
Haiyan Ran
Junling An
Yu Qu
Weiqi Xu
Weiwei Hu
Hongbin Xie
Zifa Wang
Manabu Shiraiwa
Secondary organic aerosols (SOAs) can exist in liquid, semi-solid, or amorphous solid states. Chemical transport models (CTMs), however, usually assume that SOA particles are homogeneous and well-mixed liquids, with rapid establishment of gas–particle equilibrium for simulations of SOA formation and partitioning. Missing the information of SOA phase state and viscosity in CTMs impedes accurate representation of SOA formation and evolution, affecting the predictions of aerosol effects on air quality and climate. We have previously developed a parameterization to estimate the glass transition temperature (Tg) of an organic compound based on volatility and to predict viscosity of SOA. In this study, we apply this method to predict the phase state of SOA particles over China in summer of 2018 using the Weather Research and Forecasting model coupled with Chemistry (WRF-Chem). The simulated Tg of dry SOA (Tg,org) agrees well with the value estimated from ambient volatility measurements at an urban site in Beijing. For the spatial distributions of Tg,org, simulations show that at the surface the values of Tg,org range from ∼287 to 305 K, with higher values in northwestern China, where SOA particles have larger mass fractions of low-volatility compounds. Considering water uptake by SOA particles, the SOA viscosity shows a prominent geospatial gradient in which highly viscous or solid SOA particles are mainly predicted in northwestern China. The lowest and highest SOA viscosity values both occur over the Qinghai–Tibet Plateau, where the solid phase state is predicted over dry and high-altitude areas and the liquid phase state is predicted mainly in the south of the plateau with high relative humidity during the summer monsoon season. Sensitivity simulations show that, including the formation of extremely low-volatility organic compounds, the percent time that a SOA particle is in the liquid phase state decreases by up to 12 % in southeastern China during the simulated period. With an assumption that the organic and inorganic compounds are internally mixed in one phase, we show that the water absorbed by inorganic species can significantly lower the simulated viscosity over southeastern China. This indicates that constraining the uncertainties in simulated SOA volatility distributions and the mixing state of the organic and inorganic compounds would improve prediction of viscosity in multicomponent particles in southeastern China. We also calculate the characteristic mixing timescale of organic molecules in 200 m SOA particles to evaluate kinetic limitations in SOA partitioning. Calculations show that during the simulated period the percent time of the mixing timescale longer than 1 h is >70 % at the surface and at 500 hPa in most areas of northern China, indicating that kinetic partitioning considering the bulk diffusion in viscous particles may be required for more accurate prediction of SOA mass concentrations and size distributions over these areas.
- Article
(12423 KB) - Full-text XML
-
Supplement
(4387 KB) - BibTeX
- EndNote


Secondary organic aerosols (SOAs) are major components of atmospheric fine particles, impacting air quality, climate, and public health (Jimenez et al., 2009; Pöschl and Shiraiwa, 2015). The formation and evolution of SOA involve both chemical reactions and mass transport in the gas and particle phases (Ziemann and Atkinson, 2012). This complexity makes accurate representation of SOA evolution in chemical transport models (CTMs) challenging, leading to a large uncertainty in evaluating SOA impacts on air quality and climate (Kanakidou et al., 2005; Shrivastava et al., 2017).
Current CTMs usually assume that SOA particles are homogeneous and well-mixed liquids, with rapid establishment of gas–particle equilibrium applied in simulations of SOA formation and partitioning (Pankow, 1994; Donahue et al., 2006). It has been shown that SOA can exist in liquid (low dynamic viscosity η, η<102 Pa s), semi-solid (102 Pa s ≤ η ≤ 1012 Pa s), or solid (amorphous or glassy solid; η>1012 Pa s) states, depending on particle chemical composition and atmospheric conditions, such as ambient temperature (T) and relative humidity (RH) (Koop et al., 2011; Reid et al., 2018). Viscosities can be converted to bulk diffusion coefficients via the Stokes–Einstein equation (Einstein, 1905; Seinfeld and Pandis, 2016) or the fractional Stokes–Einstein equation (Price et al., 2016; Evoy et al., 2019, 2020). The phase state, viscosity, and bulk diffusivity of SOA are important in many aerosol processes. The semi-solid or solid phase state can prolong the equilibration timescales in the gas–particle partitioning, indicating a need to consider kinetic limitations in simulating the SOA partitioning into highly viscous particles (Shiraiwa and Seinfeld, 2012; Roldin et al., 2014; Zaveri et al., 2014; Li and Shiraiwa, 2019). The viscosity of SOA can impact the rates of heterogeneous and multiphase reactions (Marshall et al., 2018; Zhang et al., 2019a), photochemistry (Liu et al., 2018; Dalton and Nizkorodov, 2021; Baboomian et al., 2022), and the uptake of gaseous pollutants (e.g., O3, OH, N2O5, NO2, NH3, and SO2) and water vapor (Abbatt et al., 2012; Kuwata and Martin, 2012; Preston and Zuend, 2022), with implications for accurate predictions of atmospheric chemical composition (Reid et al., 2018). The SOA phase state also affects particle size distribution evolution (Shiraiwa et al., 2013; Zaveri et al., 2022) and ice nucleation pathways (Knopf and Alpert, 2023).
Accurate predictions of the viscosity need the information of molecular structures and functional groups (Song et al., 2016; Rothfuss and Petters, 2017; Gervasi et al., 2020; Galeazzo and Shiraiwa, 2022); however, molecular specificity is often unavailable in ambient measurements, leading to the prediction of the phase state of ambient SOA particles difficult. Currently there are only a few methods developed to predict the phase state of ambient SOA particles and successfully implemented in CTMs. Li, Shiraiwa, and coauthors first developed a parameterization predicting the glass transition temperature (Tg) based on the molar mass (M) and the atomic ratio for carbon–hydrogen (CH) and carbon–hydrogen–oxygen (CHO) compounds with their molar mass less than 450 g mol−1 (Shiraiwa et al., 2017). Tg characterizes the temperature at which a phase transition between amorphous solid and semi-solid states occurs (Koop et al., 2011). When the ambient T is higher than Tg, a SOA particle is in a semi-solid or liquid phase state; otherwise, it behaves as an amorphous solid. This parameterization has been successfully coupled into CTMs simulating the SOA phase state over the globe (Shiraiwa et al., 2017) or the US (Schmedding et al., 2020; Y. Li et al., 2021), showing that semi-solid and amorphous solid phase states frequently occurred over dry lands and in the upper troposphere. Further parameterizations were developed to predict Tg as a function of the saturation mass concentration (C0) and the ratio of organic compounds, or as a function of C0 solely, which indirectly included the effect of molecular structure on Tg estimations (Li et al., 2020). This parameterization can be used in the volatility basis set (VBS) framework (Donahue et al., 2006), which is widely adopted in CTMs simulating SOA formation (Lane et al., 2008a; Knote et al., 2015). Rasool et al. (2021) then coupled this new method (Li et al., 2020) into the Weather Research and Forecasting Model coupled to chemistry (WRF-Chem) (Grell et al., 2005; Fast et al., 2006), and the simulations showed that the viscosity of SOA particles could be reasonably predicted during the dry-to-wet transition season in the Amazon rainforest. Li et al. (2020) was also applied in the WRF-Chem simulating the effects of particle phase state on the multiphase chemistry of SOA formation in the Amazon rainforest (Shrivastava et al., 2022; Rasool et al., 2023). Instead of predicting Tg, Maclean et al. (2021) developed parameterizations for viscosity as a function of T and RH based on measured viscosity data of laboratory SOA and applied the viscosity parameterizations in CTMs to predict the mixing timescales of organic molecules and water molecules within SOA particles on a global scale (Maclean et al., 2017, 2021). It is needed to conduct more simulations to investigate the SOA phase state varied with locations and the time. Simulations of the SOA phase state in China on a regional scale have not been available.
Investigations in the particle phase state over China are currently focused on field observations and laboratory experiments. Bounce factor measurements showed that submicrometer particles can be semi-solid in clear days and liquid in hazy days in Beijing, China (Liu et al., 2017). The phase state of PM2.5 (particulate matter with an aerodynamic diameter ≤ 2.5 µm) was found to be mostly semi-solid to solid in winter Beijing based on the measurements using optical microscopy combined with the poke-and-flow technique (Song et al., 2022). The RH-dependent viscosity of the proxies of actual ambient particles in Beijing was also investigated based on dual optical tweezers (Tong et al., 2022). The phase state of submicrometer particles in Beijing was retrieved from a polarization lidar that has the potential to infer the vertical profiles of phase state (Tan et al., 2020). The phase state of traffic-related secondary aerosols in Beijing may have a distinguished diurnal variation (Meng et al., 2021). The biomass burning aerosols, collected near a farmland in the Yangtze River Delta, China, were found to exist in the non-solid phase state at relatively dry conditions (Liu et al., 2021).
These measurements indicate that the particle phase state over China is highly variable under different atmospheric conditions. It is important to know the spatial distributions and time variations of the SOA phase state and viscosity in multicomponent particles to better quantify the aerosol effects on air quality, which, however, has not been investigated over China with air quality models on a regional scale. Here we use the WRF-Chem-model-simulated SOA volatility distributions to estimate the glass transition temperature and viscosity of SOA particles over China based on the parameterizations developed in Li et al. (2020). We further calculate the diffusion coefficients and mixing timescales of organic molecules within SOA, which has implications in how to properly treat the SOA partitioning (instantaneous equilibrium vs. kinetic partitioning) in CTMs. As volatility and viscosity are closely related, we conduct a sensitivity calculation to evaluate the effects of the simulated SOA volatility distributions on viscosity estimations. We also conduct a sensitivity calculation to investigate how the water absorbed by inorganic components in PM2.5 affects viscosity estimations, which has implications in predicting the viscosity of internally mixed ambient particles.
2.1 WRF-Chem model configuration
We use the WRF-Chem model version 3.7.1 (Grell et al., 2005; Fast et al., 2006) and simulate the period from 20 May to 23 June 2018 with a spin-up period of 7 d (13–19 May). We set up two domains (Fig. S1 in the Supplement) with the horizontal resolutions of 81 and 27 km, respectively, and 18 vertical layers are applied from the surface up to 100 hPa. The meteorological initial and boundary conditions are from the National Centers for Environmental Prediction (NCEP) Global Forecast System (GFS) final (FNL) reanalysis data. The outputs of a global chemical transport model MOZART-4 (Emmons et al., 2010) provide initial and boundary conditions of chemical species over the outer domain (Fig. S1). Anthropogenic emissions are from the MIX 2010 inventory for Asia (Li et al., 2017) and the MEIC 2016 inventory for China (http://meicmodel.org.cn, last access: 1 June 2023; Zheng et al., 2018). Biogenic emissions are calculated from the Model of Emissions of Gases and Aerosols from Nature (MEGAN2.1) (Guenther et al., 2012).
The utilized physical and chemical schemes are given in Table S1 in the Supplement. We use the MOZART-4 mechanism (Emmons et al., 2010) for the gas-phase chemistry. The MOSAIC (Model for Simulating Aerosol Interactions and Chemistry) aerosol module (Zaveri et al., 2008) is applied for the aerosol chemistry, and we represent aerosol particles with four-size sections having dry diameters ranging from 0.039 to 10 µm (Knote et al., 2015). SOA formation is treated with the 1-D volatility basis set (VBS) approach (Donahue et al., 2006), which has been implemented into the MOSAIC aerosol module (Lane et al., 2008a; Ahmadov et al., 2012). Five volatility bins are considered (effective saturation mass concentrations C* of 10−4, 1, 10, 100, and 1000 µg m−3 at 298 K) in the official version 3.7.1 of the WRF-Chem model, with the enthalpy of vaporization (ΔHvap) values of 40, 131, 120, 109, and 98 kJ mol−1 used in each volatility bin (Knote et al., 2015). We follow Knote et al. (2015) with SOA mass yields adopted for four volatility bins (1, 10, 100, and 1000 µg m−3). Further gas-phase aging is simulated through OH oxidation of SOA vapors with a fixed rate of cm3 molec.−1 s−1, with products shifted down one volatility bin (Murphy and Pandis, 2009); e.g., the condensable vapors with C* of 1 µg m−3 react with OH, forming surrogate species in the lowest volatility bin (C* of 10−4 µg m−3). The partitioning of organic compounds between the gas and particle phases is simulated based on Pankow (1994), which is implemented in MOSAIC (Shrivastava et al., 2011). We apply glass transition temperature and viscosity calculations to WRF-Chem model output for traditional SOA formed from the oxidation of volatile organic compounds (VOCs) including alkanes, alkenes, aromatics, isoprene, and monoterpenes (Lane et al., 2008b).
2.2 Glass transition temperature and viscosity calculations
The glass transition temperature of SOA products in each volatility bin at dry conditions (Tg,i) is calculated as a function of the saturation mass concentration at 298 K (C0) using the parameterization (Eq. 1) developed in our previous study (Li et al., 2020). We assume ideal thermodynamic mixing where C0 is equal to C*, which is often applied in the VBS (Donahue et al., 2011).
The Tg of mixtures of dry SOA compounds (Tg,org) is calculated by the Gordon–Taylor equation (Gordon and Taylor, 1952), with the Gordon–Taylor constant (kGT) assumed to be 1 (Dette et al., 2014):
where ωi is the mass fraction of SOA products in each volatility bin simulated by the VBS module in WRF-Chem.
The particle phase state depends strongly on water content in particles, as water can act as a plasticizer to decrease viscosity (Mikhailov et al., 2009; Koop et al., 2011). The mass concentration of water absorbed by SOA particles under humid conditions is estimated using the effective hygroscopicity parameter (κ) (Petters and Kreidenweis, 2007) as
where aw is water activity calculated as and ρw is the density of water. mSOA is the simulated total mass concentrations of traditional SOA. The density of SOA particles (ρSOA) is assumed to be 1.5 g cm−3 (Knote et al., 2015). κ is assumed to be 0.1 based on previous studies (Gunthe et al., 2009; Duplissy et al., 2011; Wu et al., 2013) and consistent with the value used in our previous global SOA phase state simulations (Shiraiwa et al., 2017).
Tg of organic–water mixtures is also calculated by the Gordon–Taylor equation (Eq. 4) with kGT suggested to be 2.5 (Koop et al., 2011).
where ωorg is the mass fraction of the simulated SOA species in organic–water mixtures. The glass transition temperature of pure water (Tg,w) is 136 K (Kohl et al., 2005). Based on Tg(ωorg), viscosity can be calculated with the Vogel–Tammann–Fulcher (VTF) equation (Angell, 1991): , where η∞ is the viscosity at infinite temperature (10−5 Pa s; Angell, 1991). D is the fragility parameter, which is assumed to be 10 based on our previous study in DeRieux and Li et al. (2018). T0 is the Vogel temperature calculated as . We further calculate the bulk diffusion coefficient (Db) of organic molecules with a radius of 0.4 nm (Maclean et al., 2021) and water molecules in SOA particles based on predicted viscosity and the fractional Stokes–Einstein equation (Price et al., 2016; Evoy et al., 2019, 2020), which is detailed in the Supplement. The mixing timescales of molecules (τmix) within SOA particles is calculated as (Seinfeld and Pandis, 2016), where dp is the particle diameter. The dp is assumed to be 200 nm (Maclean et al., 2021) when we calculate τmix.
2.3 Sensitivity simulations
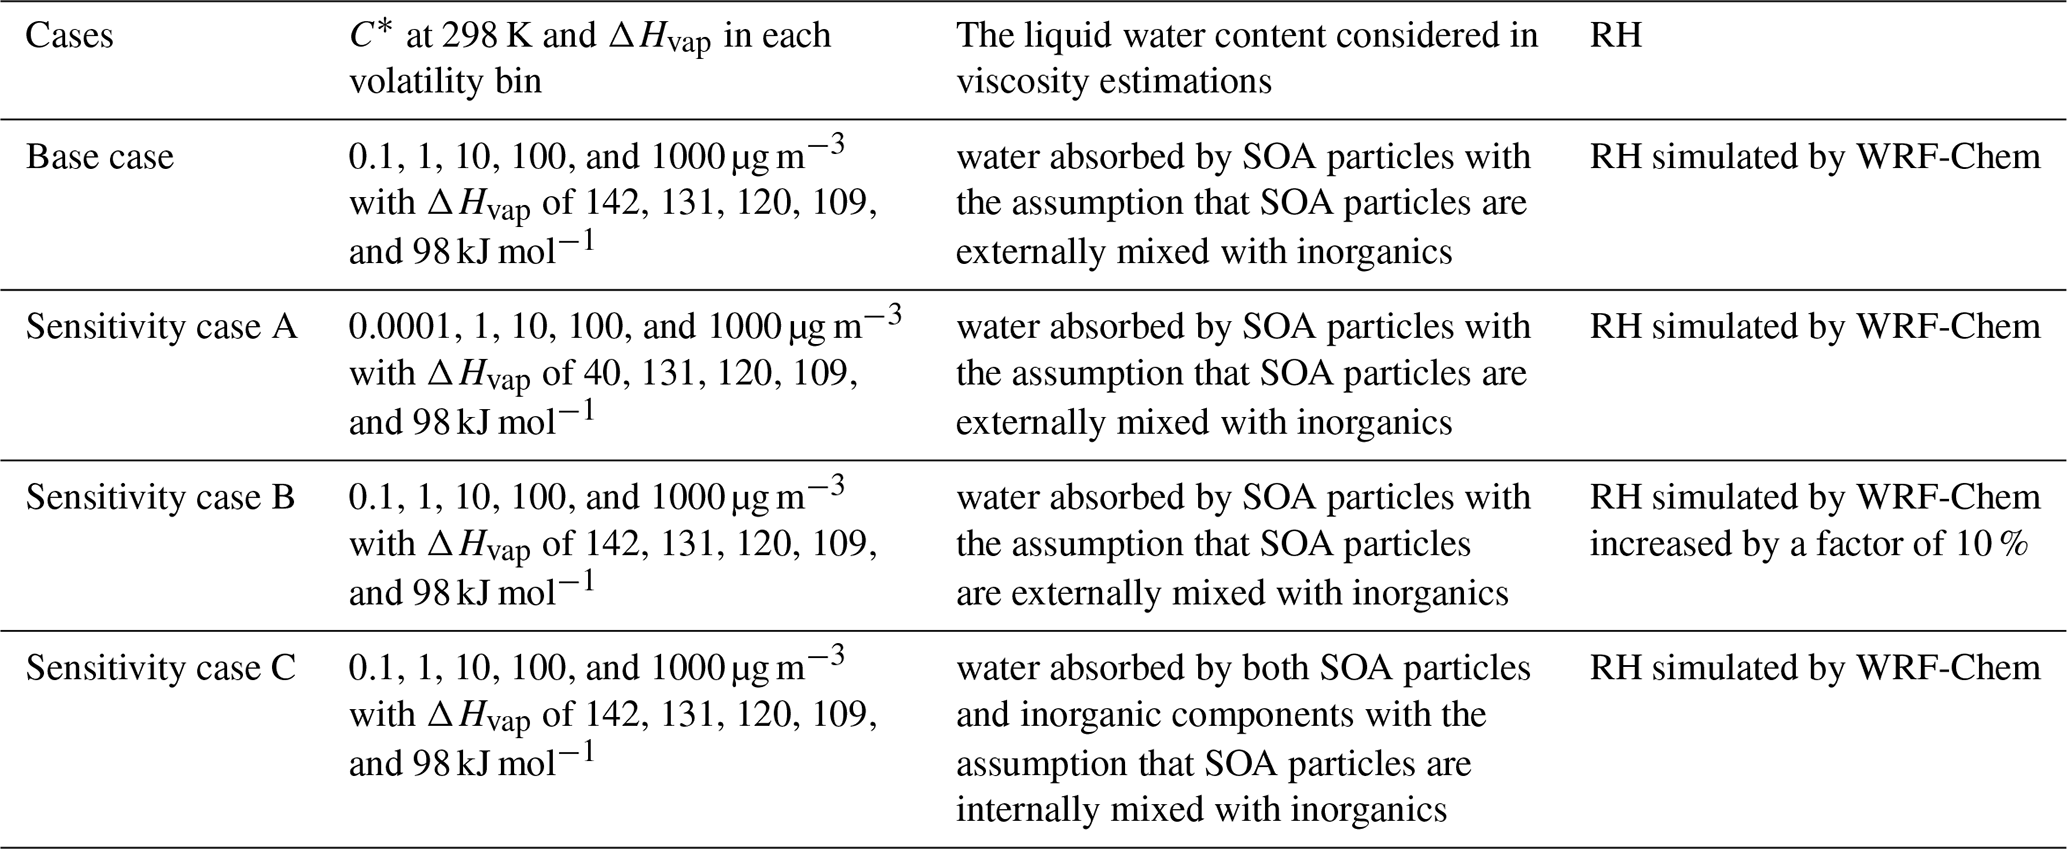
Table 1 lists all the performed simulations. In the base case, we update the C* in the lowest volatility bin from 10−4 µg m−3 in the official WRF-Chem v3.7.1 to 0.1 µg m−3 based on the ambient volatility observations (referring to Sect. 2.4 and Fig. 1), and we calculate the ΔHvap in the lowest volatility bin using the semi-empirical parameterization in Epstein et al. (2010), leading to a value of 142 kJ mol−1. To evaluate the effects of simulated SOA volatility distributions on phase state estimations, we conduct a simulation (sensitivity case A) following the default setting in the model assuming that the lowest C* is 10−4 µg m−3 at 298 K, with ΔHvap of 40 kJ mol−1 (Knote et al., 2015). A smaller ΔHvap indicates less dependence of volatility on temperature variations. In the sensitivity case B, we increase the simulated RH by a factor of 10 % as we find that the simulated RH values are smaller than the observations (Sect. 3.1). In the base case and sensitivity cases A and B, we predict Tg for SOA–water mixtures accounting for the SOA-influenced water uptake solely, assuming that SOA particles are externally mixed with inorganic compounds such as sulfate and nitrate. In the sensitivity case C, we assume that the organic and inorganic compounds are internally mixed in one phase and include the water absorbed by inorganic compounds in viscosity calculations. The water associated with inorganics is calculated by the MOSAIC module coupled in WRF-Chem.

Figure 1Comparison of the average volatility distributions of observed OOA and simulated SOA at the IAP site during 20 May–23 June 2018. The black bars represent the volatility distributions of observed OOA adopted from Xu et al. (2019). The blue bars represent the volatility distributions of SOA simulated by WRF-Chem, with five C* bins set to be 0.1, 1, 10, 100, and 1000 µg m−3 at 298 K in panel (a) and 0.0001, 1, 10, 100, and 1000 µg m−3 at 298 K in panel (b). The blue error bars represent the 1 standard deviation.
Table 1Sensitivity calculations for evaluating the effects of simulated SOA volatility distributions (sensitivity case A), RH (sensitivity case B), and the water absorbed by inorganic components (sensitivity case C) on viscosity estimations.
2.4 Observation
The observation data measured at an urban site in the Institute of Atmospheric Physics (IAP) of the Chinese Academy of Sciences (39°58′28′′ N, 116°22′16′′ E) in Beijing (Fig. S1) are used to compare with the simulation results of the WRF-Chem model. The aerosol volatility was measured from 20 May to 23 June 2018, using a thermodenuder coupled with an Aerodyne high-resolution aerosol mass spectrometer (Xu et al., 2019). The volatility distributions of oxygenated organic aerosols (OOAs) resolved from positive matrix factorization (PMF) were estimated using a dynamic mass transfer model (Riipinen et al., 2010). The volatility of OOA was found to be distributed in six logarithmically spaced C* bins including 0.001, 0.01, 0.1, 1, 10, and 100 µg m−3, based on the best fits between the measured and predicted thermograms using the methods in Karnezi et al. (2014). Chemical species including organics (Org), sulfate (SO), nitrate (NO), and ammonium (NH) in PM2.5 were measured using an Aerodyne time-of-flight aerosol chemical speciation monitor (Fröhlich et al., 2013) equipped with a capture vaporizer and PM2.5 lens, with the details described in Li et al. (2023). The OOA factor was identified with the PMF analysis. We obtain the mass concentrations of PM2.5 from the Olympic Center observation site (http://zx.bjmemc.com.cn, last access: 1 June 2023), which is ∼4 km from the IAP site (Fig. S1). Meteorological parameters including RH and T are from the Beijing meteorological tower at the IAP site.
3.1 Simulations in Beijing and the comparison with observations
The comprehensive model evaluations were conducted in our previous studies, showing that the WRF-Chem model reasonably captured the magnitudes and spatial distributions of concentrations of major air pollutants over China (Li et al., 2011, 2014, 2015; Qu et al., 2019; Zhang et al., 2022). Here we focus on the comparison of simulations and observations at the IAP site during 20 May–23 June 2018 when the observed volatility distributions are available (Xu et al., 2019).
Figure 1 shows the average volatility distributions of observed OOA and simulated SOA at the IAP site. The C* of OOA spans from 0.001 to 100 µg m−3, with an average value of 1.16 µg m−3. The semi-volatile organic compounds (SVOCs; µg m−3) and the low-volatility organic compounds (LVOCs; µg m−3) (Donahue et al., 2012) contribute 66.3 % and 33.7 % to OOA concentrations, respectively (Xu et al., 2019). The Tg,org estimated from the observed OOA volatility distributions is 286.7 K. Figure 1a shows the simulated volatility distributions of SOA with five C* bins set to be 0.1, 1, 10, 100, and 1000 µg m−3 at 298 K and ΔHvap of 142, 131, 120, 109, and 98 kJ mol−1 used in the five C* bins, respectively (base case in Table 1). In this base case simulation, the SOA consists of 64.5 % SVOCs and 35.3 % LVOCs, and most of the SVOC species are located in the C* bin of 1 µg m−3. The simulated SOA in Fig. 1a has an average C* of 0.64 µg m−3 and Tg,org of 291.5 K, close to the values estimated from the volatility distributions of OOA. Figure 1b shows the simulated volatility distributions of SOA with the lowest C* bin set to be 0.0001 µg m−3 at 298 K with ΔHvap of 40 kJ mol−1, following the default option in the official WRF-Chem model 3.7.1 (Knote et al., 2015). In this sensitivity simulation (case A in Table 1), the SOA consists of 40.4 % extremely low-volatility organic compounds (ELVOCs; µg m−3), which are not determined in the observed OOA, leading to a much lower average C* (0.03 µg m−3) and a higher Tg,org (309.0 K) compared to the observations. In the following we estimate the Tg,org and viscosity of SOA using the simulated volatility distributions in the base case with the lowest C* bin set as 0.1 µg m−3 at 298 K. The impacts of volatility distributions with the incorporation of ELVOCs (Fig. 1b) on viscosity estimations are evaluated in Sect. 3.3.
Figure 2 shows that the model relatively well reproduces the observed hourly variations of RH, T, mass concentrations of PM2.5, and its major inorganic components (Fig. 2a–f), with the index of agreement (IOA, defined in the Supplement) varying from ∼0.70 for inorganic components to a higher value of 0.93 for T (Table S2). The simulated values of RH are constantly lower than the observations, with the mean bias (MB) being −10.97 % (Table S2). The underestimation of RH observations was also found at other meteorological sites in the North China Plain in our previous studies (Qu et al., 2019; Zhang et al., 2022), which would affect the SOA viscosity estimations. The effects of RH on the viscosity estimations are evaluated in Sect. 3.3. Figure 2g shows that the model could generally reproduce the observed temporal variations of OOA concentrations but largely underestimates the observation peaks (MB = −5.88 µg m−3; the normalized mean bias NMB = −53.28 %, Table S2). Incorporation of the SOA formed from intermediate-volatility organic compounds (IVOCs) (Miao et al., 2021; Chang et al., 2022) would increase the simulated SOA concentrations, which is beyond the scope of this study and will be considered in our future work. The simulated SOA mean concentration is 5.15 µg −3. Although it is lower than the observed value of 11.03 µg m−3, this difference in the simulated and observed SOA concentrations would not affect the viscosity predictions significantly. The SOA viscosity has a much closer relation with the volatility rather than its mass loadings (Champion et al., 2019; Li et al., 2020). In our previous study we estimated Tg,org and viscosities at different organic aerosol (OA) mass loadings varied from 1 to 1000 µg m−3, showing that the simulated viscosities were very similar, particularly when RH was higher than 50 % (DeRieux et al., 2018).
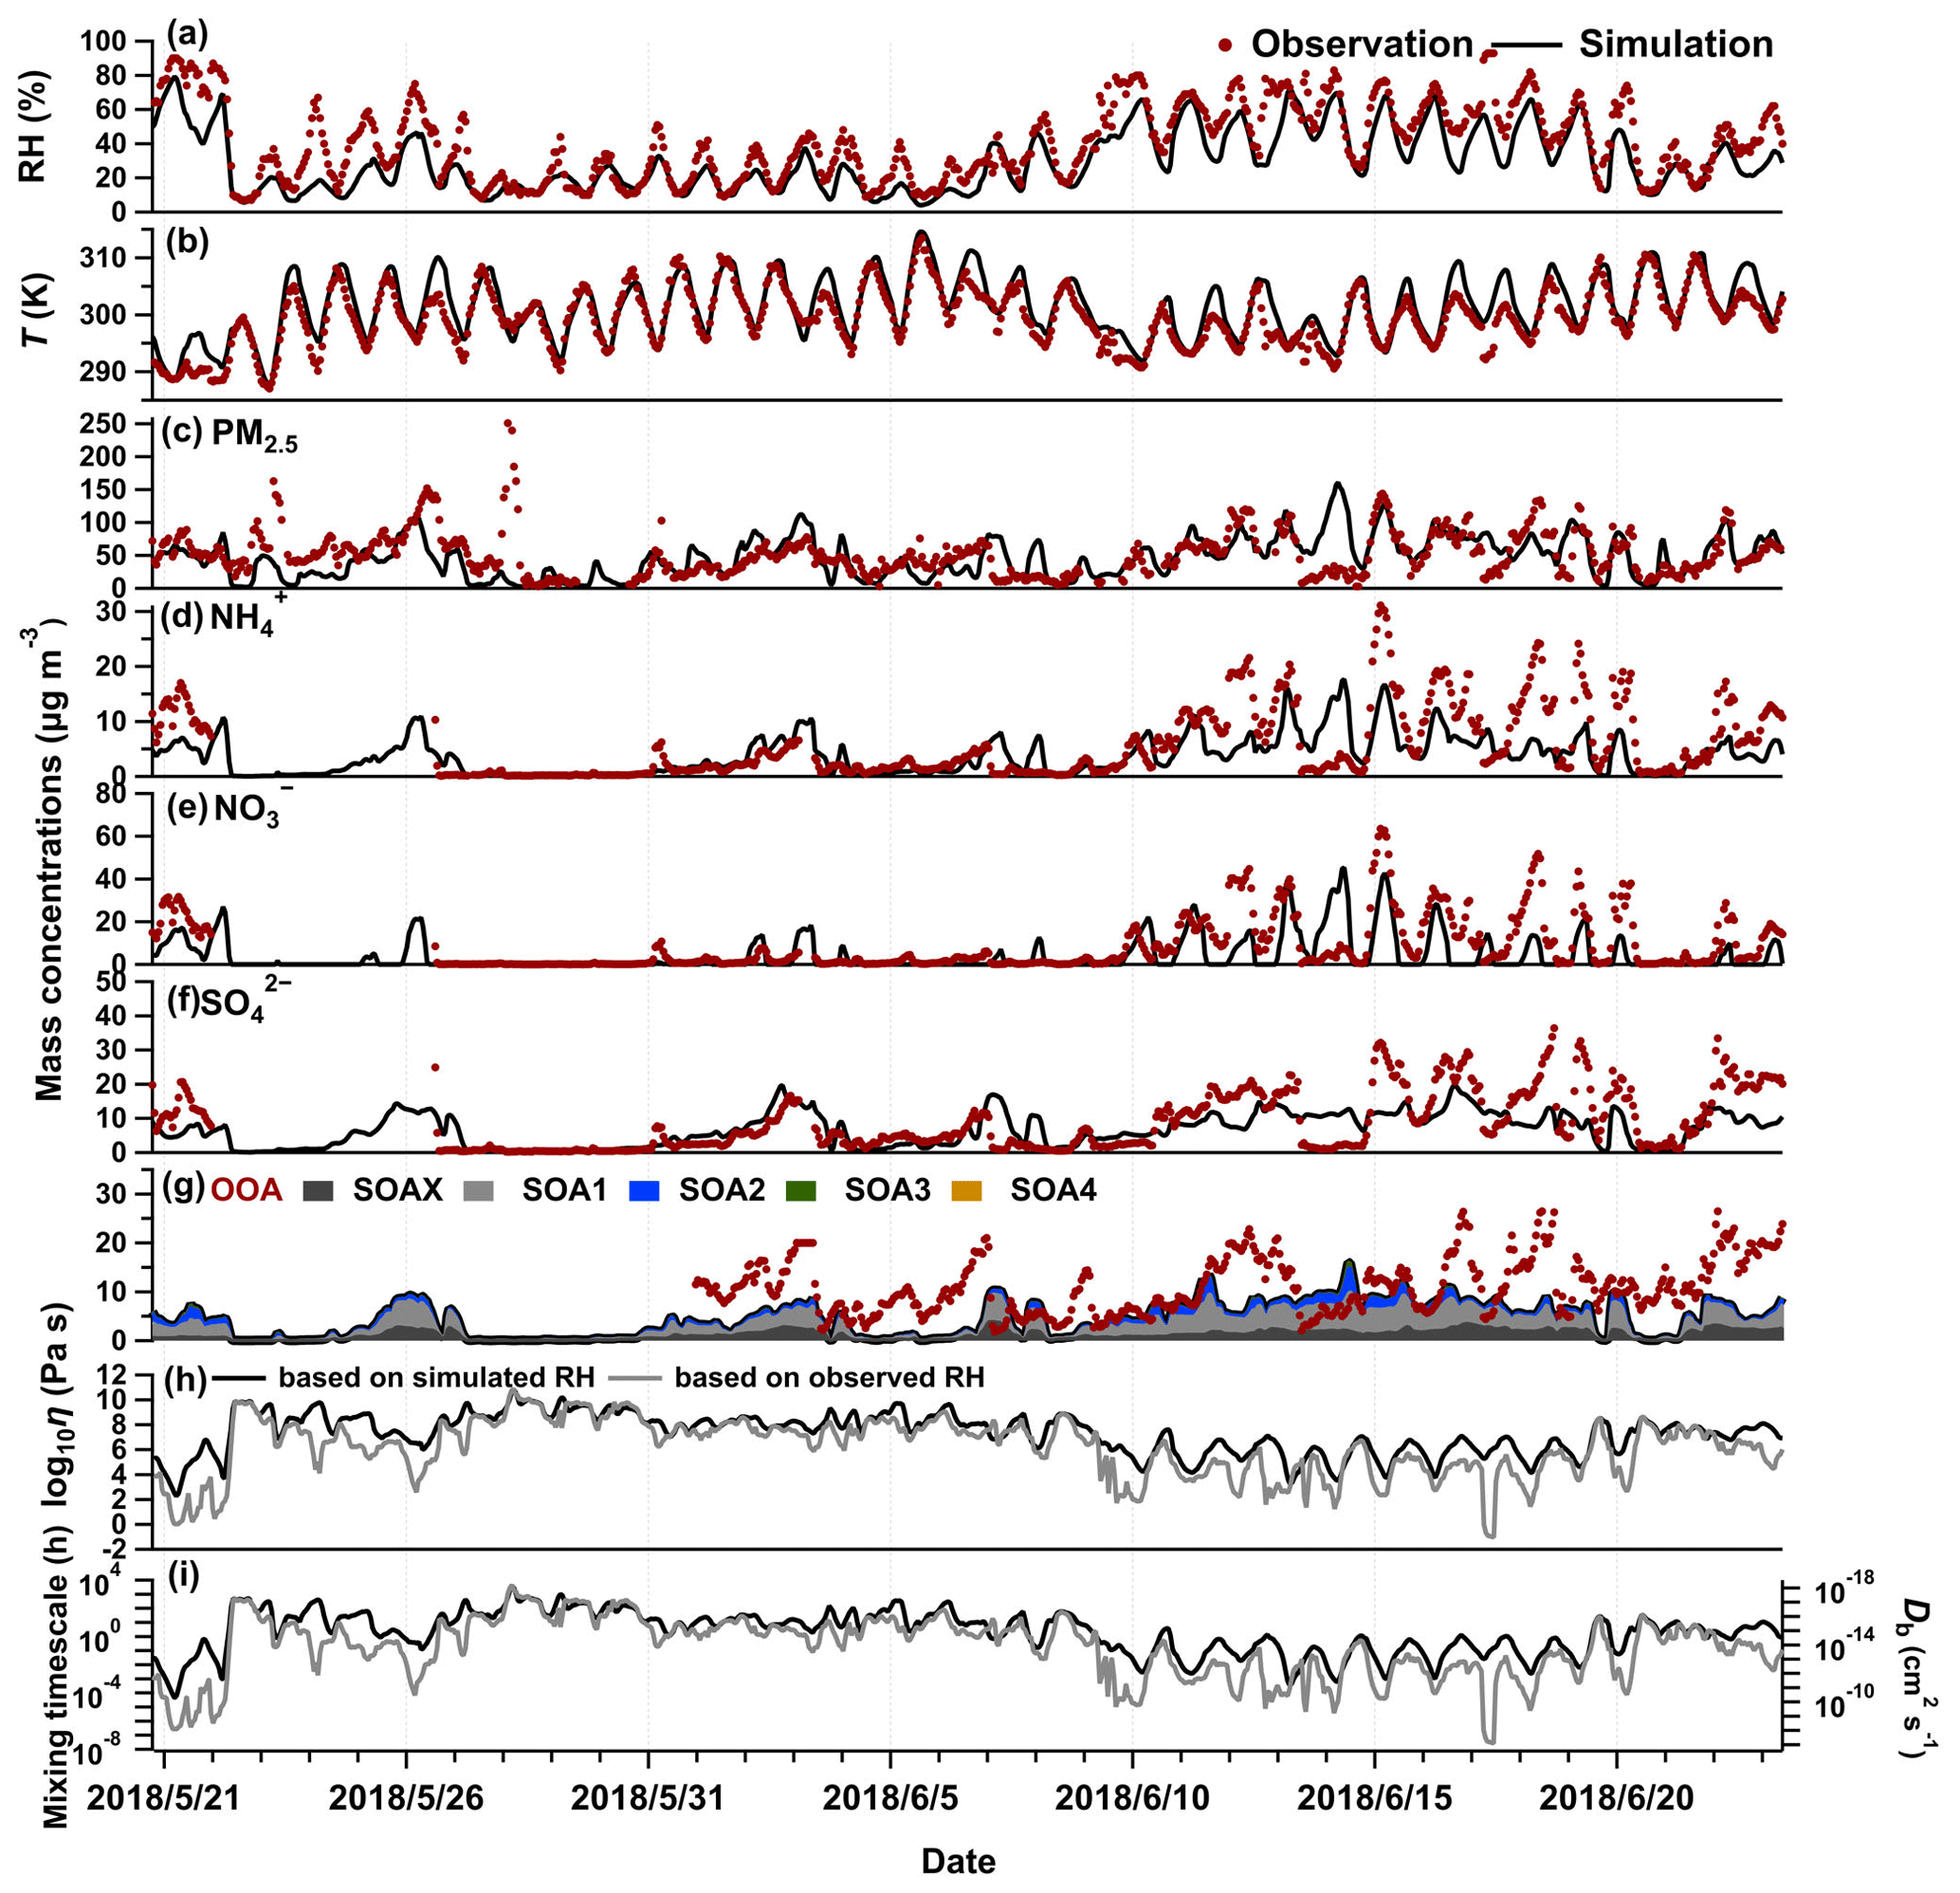
Figure 2Observations and simulations of temporal variations of (a) RH, (b) T, (c) PM2.5 concentrations, (d) NH concentrations, (e) NO concentrations, and (f) SO concentrations at the IAP site. (g) Observed OOA concentrations (red dots) and simulated SOA concentrations, with SOAX, SOA1, SOA2, SOA3, and SOA4 representing the SOA with C* of 0.1, 1, 10, 100, and 1000 µg m−3 at 298 K, respectively. (h) SOA viscosity and (i) bulk diffusion coefficients and mixing timescale of organic molecules within 200 nm SOA particles calculated using the RH simulated by the WRF-Chem model or the RH observed at the IAP site.
As the WRF-Chem model underestimates the observed RH at the IAP site, we calculate the SOA viscosity using the simulated and observed RH, respectively. Figure 2h shows that the viscosities calculated at the two conditions are similar at most times during the simulated period, ranging mainly from ∼102 to 1010 Pa s, with a median value of ∼107 Pa s, indicating that a semi-solid phase state frequently occurs. The underestimations of the observed RH by WRF-Chem mainly impact the phase state estimations at relatively high RH. For example, SOA particles occur as liquid when the observed RH is higher than ∼75 %; however, they remain in a semi-solid phase state at the simulated RH. The bulk diffusion coefficients (Db) of organic molecules range from 10−18 to 10−11 cm2 s−1 at the simulated RH (Fig. 2i), leading to the mixing timescales within 200 nm SOA particles being seconds to years, with 61 % of the time > 1 h (Fig. S2). We highlight the mixing timescale of 1 h as the time step adopted in CTMs is often ∼0.5–1 h (Maclean et al., 2021). Current CTMs usually assume that the gas–particle partitioning of SVOCs reaches equilibrium quickly within the time step (Pankow, 1994; Donahue et al., 2006). When the mixing timescales of organics within SOA particles are h, the instantaneous equilibrium is a reasonable assumption. However, when the mixing timescales of organics are longer than ∼1 h, non-equilibrium between the gas phase and the particle phase, i.e., the kinetic partitioning, may need to be considered in simulating the SOA formation in CTMs (Shiraiwa and Seinfeld, 2012; Zaveri et al., 2018; Li and Shiraiwa, 2019; He et al., 2021; Jathar et al., 2021; Maclean et al., 2021; Shiraiwa and Pöschl, 2021; Shrivastava et al., 2022).
The vertical profiles of SOA viscosity exhibit diurnal variations. Figure 3a shows the median diurnal and vertical profiles of predicted SOA viscosity at the IAP site. The SOA particles remain highly viscous (∼107–108 Pa s) at the surface, with a higher viscosity occurring from late afternoon to early evening, during which the RH is less than 20 %, which is lower than the rest time of the day (Fig. S3). The SOA particles become more viscous at higher altitudes than the surface and adopt the phase transition from a semi-solid phase to a solid phase at ∼4 km at the IAP site. The predicted altitude with the phase transition is ∼2 km higher than our previous global model prediction for the region of East China, which was an average of 5 years' simulations (Shiraiwa et al., 2017). Tan et al. (2020) inferred the phase state of submicrometer particles in Beijing from the surface to an altitude of ∼1 km using a polarization lidar and found that the particle phase state exhibits a vertical variation. Further observations of SOA viscosity at high altitudes are needed to better understand the viscosity vertical profiles and validate our predictions. Figure 3b shows that the mixing timescales for organic molecules within 200 nm SOA particles are approximately 1 h at the surface and longer than ∼10 h at altitudes higher than 1 km, indicating that kinetic limitations in the gas–particle partitioning may be required to accurately predict SOA mass concentrations in summer Beijing, particularly in the upper planetary boundary layer and the free troposphere.
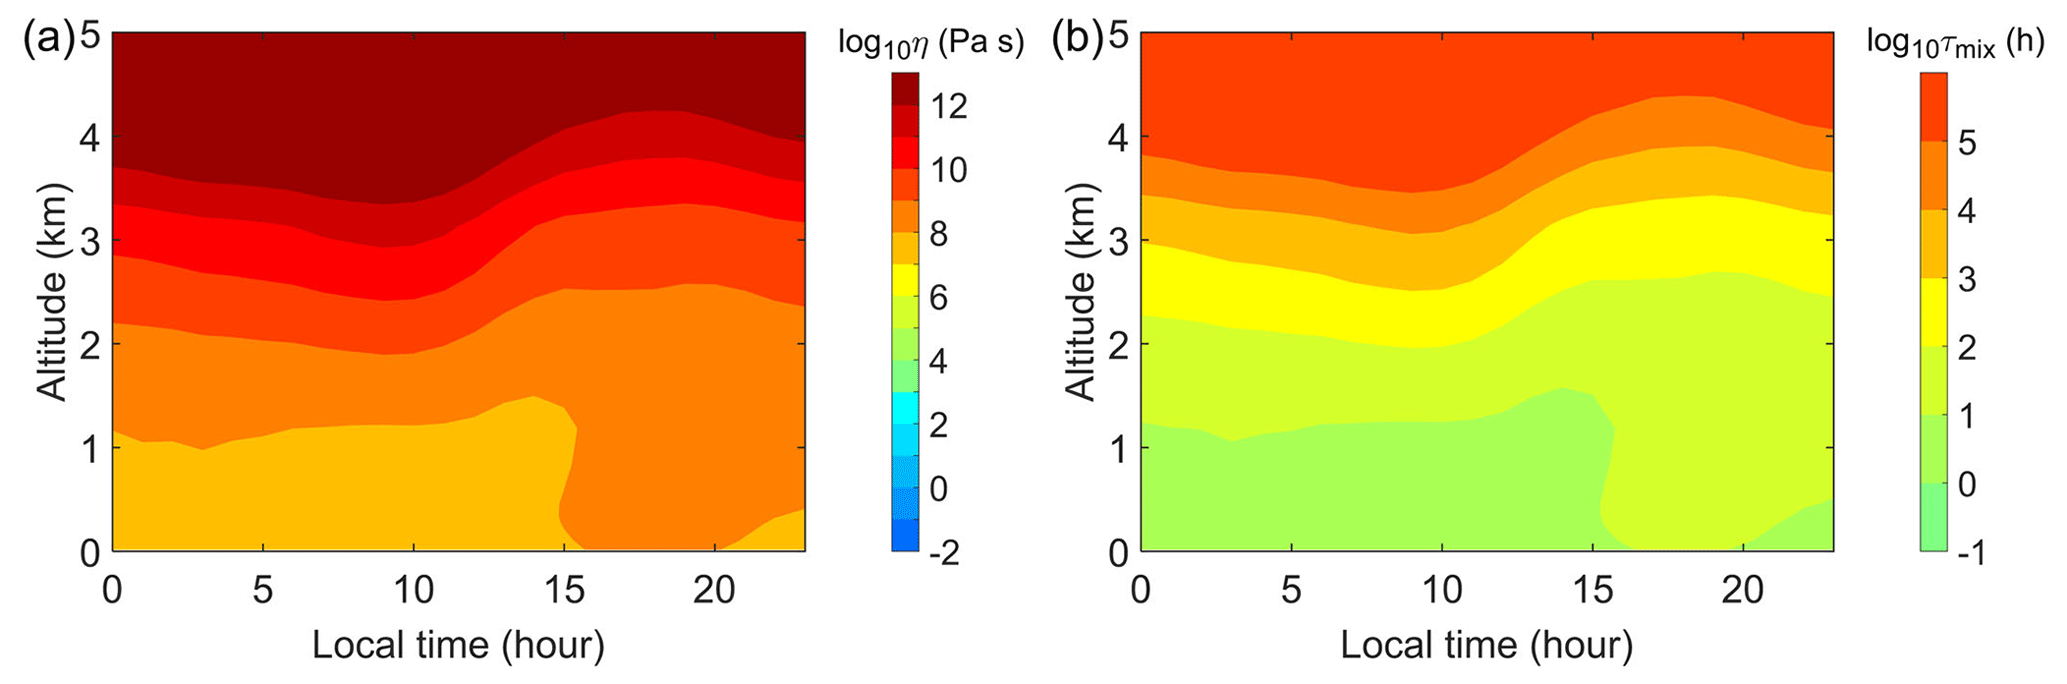
Figure 3Median diurnal and vertical profiles of estimated (a) SOA viscosity and (b) mixing timescales for organic molecules within 200 nm SOA particles at the IAP site during 20 May–23 June 2018. Note that altitude is approximate and estimated from WRF pressure layers.
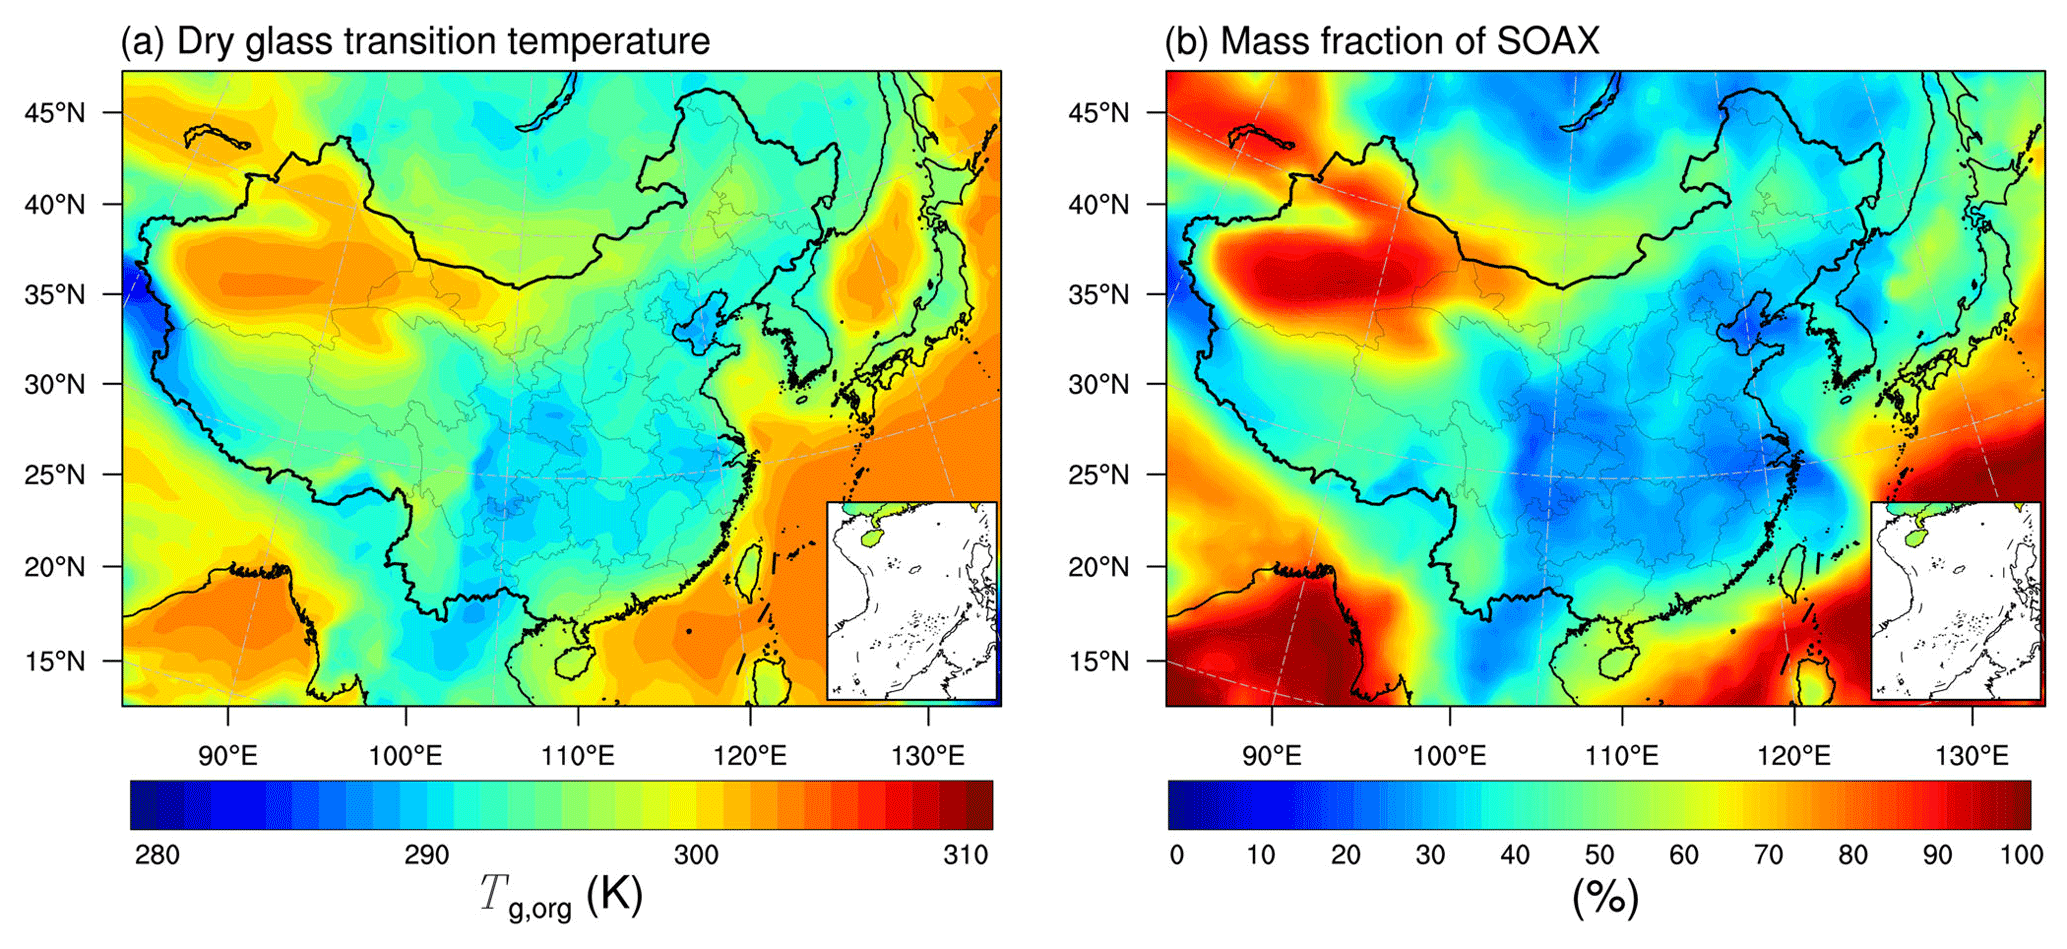
Figure 4The predicted median surface values of the (a) glass transition temperature of SOA particles at dry conditions and (b) mass fractions of SOAX ( µg m−3 at 298 K) during 20 May–23 June 2018 simulated in the base case (Table 1).
3.2 Simulated glass transition temperature and viscosity of SOA particles over China
The glass transition temperature of the dry organic phase (Tg,org) shows a geospatial gradient over China. Figure 4a shows the median surface values of Tg,org calculated in the base simulation (Table 1). Tg,org ranges from ∼287–305 K over most areas of China, with lower values occurring mainly over the southeast and higher values over the northwest. The Tg,org range simulated by the WRF-Chem model is consistent with our previous global simulations of Tg,org that varied from ∼285 to 310 K at the surface over China (Shiraiwa et al., 2017). The geospatial variation in Tg,org is related to the simulated SOA volatility distributions. Figure 4b shows the mass fractions of SOA species distributed in the lowest volatility bin (SOAX with µg m−3 at 298 K). The mass fractions of SOAX are mostly 20 %–35 % in southeastern China, indicating that the majority of the simulated SOA formed from VOCs is semi-volatile. In these areas, the simulated SOA mass concentrations are higher than the other locations of China (Fig. S4) (Li et al., 2022), which is favorable for more SVOCs partitioning into the particle phase, leading to relatively low values of Tg,org (Fig. 4a). LVOCs are more frequently contained in aged SOA particles in remote areas; e.g., some areas in northwestern China where the SOA mass concentrations are very low resulted in higher Tg,org values.
The relative humidity plays an important role in regulating SOA viscosity (Koop et al., 2011). Considering the water uptake by SOA particles in the phase state estimations, the predicted geospatial patterns in the viscosity (Fig. 5a) and RH (Fig. S4) are very similar to each other, particularly in southern and northeastern China. SOA particles are predicted to mainly be liquid or with a low viscosity (<104 Pa s) in the southeast. Figure 5b shows the frequency of the liquid phase state, which is calculated as the percent time that an organic aerosol particle is in the liquid phase state during the simulated period. The frequency of liquid particles varies from ∼30 % to 70 % in southeastern China. The lowest viscosity with the highest frequency of liquid particles occurs over the southern Tibetan Plateau where RH is very high (Fig. S4), which is contributed by summer monsoons and regional moisture recycling (Dong et al., 2016). The SOA particles in central and northeastern China are predicted to be semi-solid, with the viscosity varying from 105 to 108 Pa s (Fig. 5a). Highly viscous (η>108 Pa s) or solid SOA particles are mainly found in the northwest, particularly over the northern Tibetan Plateau where the ambient temperatures are lower than other areas of China (Fig. S4). The frequency of liquid SOA particles in most areas with a latitude higher than 30° N is less than 20 % (Fig. 5b).
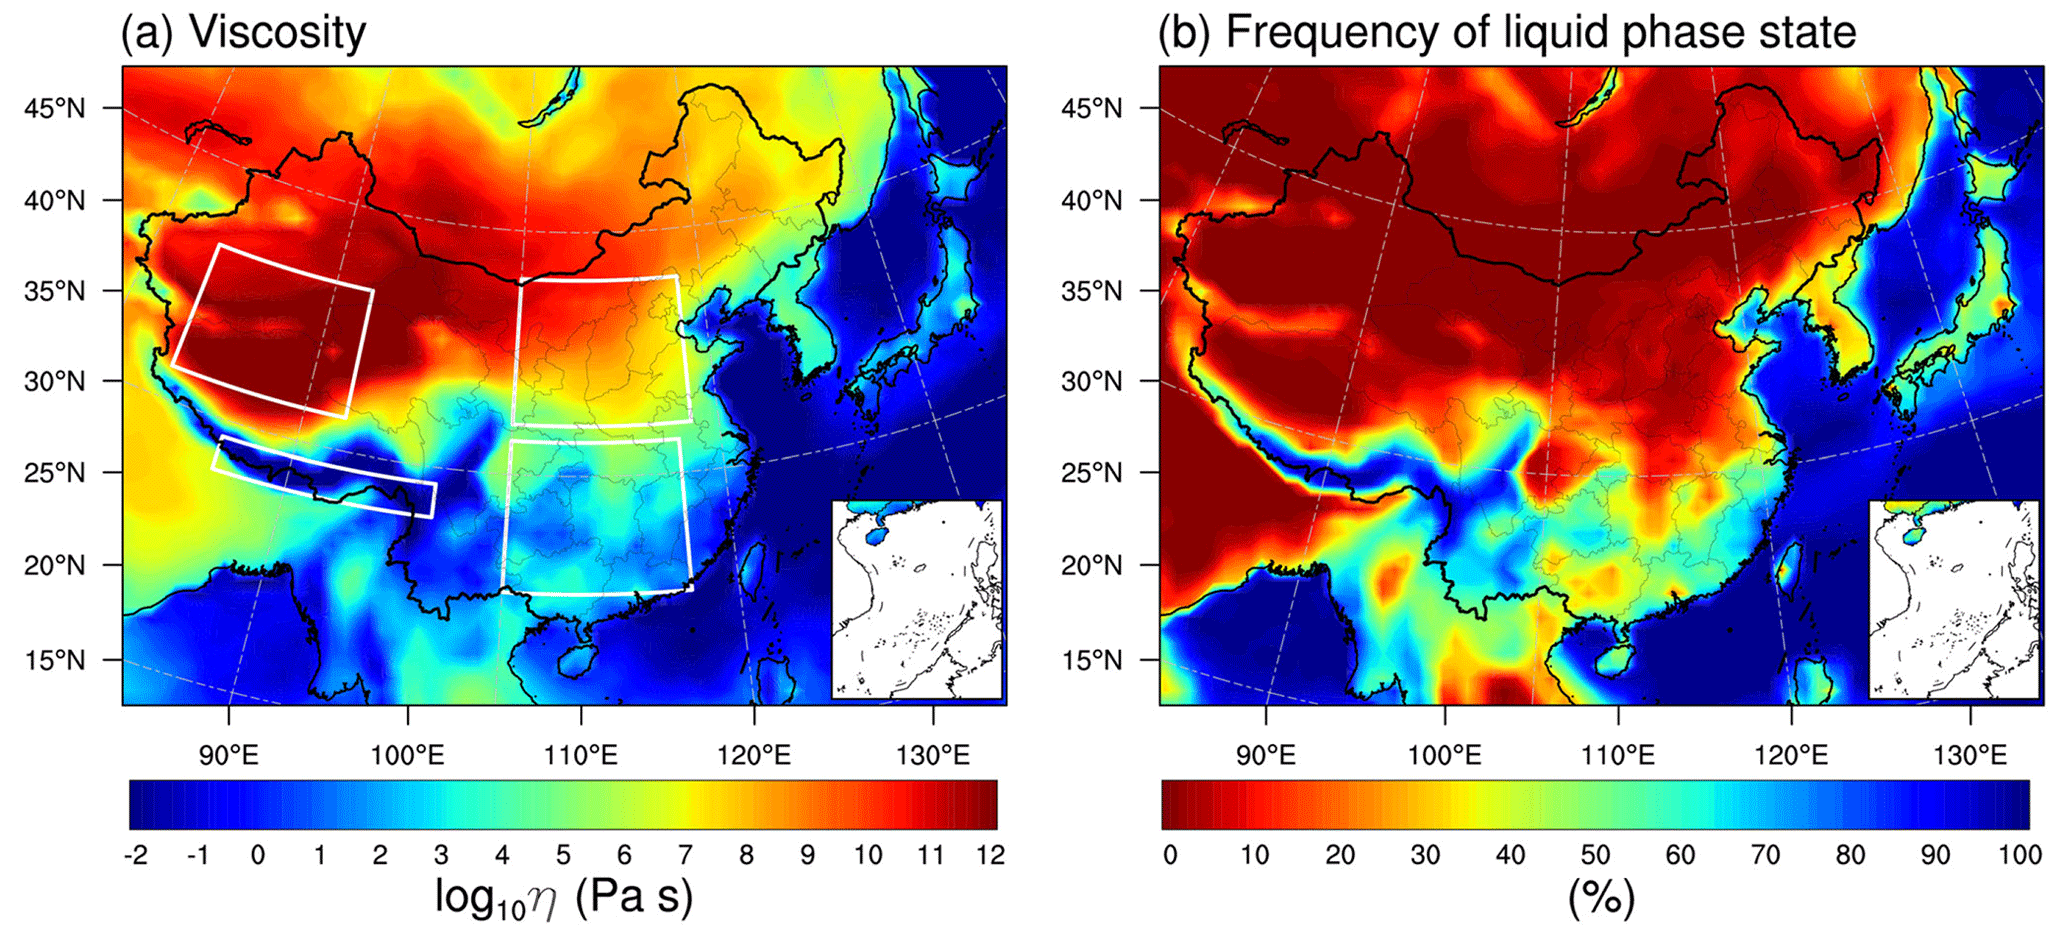
Figure 5WRF-Chem-predicted (a) median surface values of viscosity and (b) the percent time that an organic aerosol particle is in the liquid phase state during 20 May–23 June 2018. The white boxes in panel (a) specify the selected regions in northern China, southern China, the northern Qinghai–Tibet Plateau, and the southern Qinghai–Tibet Plateau.
The simulated geospatial pattern in SOA viscosity over China agrees with previous global simulations and ambient measurements. Our previous global simulations predicted a lower viscosity (η<103 Pa s) in SOA particles in southeastern China and a higher viscosity (η>108 Pa s) in northwestern China (Shiraiwa et al., 2017; Li et al., 2020), similar to the WRF-Chem simulations in this study. Interestingly, the occurrence of liquid particles over the southern Tibetan Plateau in summer simulated by the WRF-Chem was not found in our previous global predictions, which was an average of 5 years' simulations (Shiraiwa et al., 2017). The semi-solid phase state of SOA particles simulated in Beijing is consistent with both particle bounce measurements (Liu et al., 2017) and the PM2.5 phase state determined by the poke-and-flow technique (Song et al., 2022). The simulated viscosity of SOA particles is 0.15 Pa s in Shenzhen, a coastal urban city in southeastern China, which also agrees with the findings in the previous bounce measurements indicating that the submicron particles in Shenzhen are in the liquid state (Liu et al., 2019).
The phase state of SOA particles is affected by ambient conditions and the particle chemical composition (Koop et al., 2011). Figure 6 shows the median values of viscosity as a function of RH, T, and the mass fraction of low-volatility compound (SOAX with C* of 0.1 µg m−3 at 298 K) calculated for selected regions in northern China, southern China, the northern Qinghai–Tibet Plateau, and the southern Qinghai–Tibet Plateau as specified by white boxes in Fig. 5a. There is a strong inverse relationship between SOA viscosity and relative humidity, with high RH ( %) as the dominant factor determining the phase state of SOA particles. When RH is lower than ∼60 %, the predicted viscosity is affected by both RH and T. For example, the SOA particles occur mainly as solid over the northern Qinghai–Tibet Plateau while they occur as semi-solid over northern China within similar RH ranges (20% < RH < 60 %); the reason is that the ambient T over the northern Qinghai–Tibet Plateau is much lower (∼20 K lower) than over northern China (Fig. 6b). When RH is relatively low, the viscosity of SOA particles is also influenced by particle chemical composition; i.e., the SOA particles composed of high mass fractions of low-volatility compounds tend to have higher viscosity values (Fig. 6c). RH is the main factor driving the diurnal variations of SOA viscosity in our simulations. Figure S5 shows that SOA particles have higher viscosity in the daytime than the nighttime as RH in the daytime is lower than the nighttime (Fig. S6). Compared to northern China, southern China exhibits stronger diurnal variations in SOA viscosity, where SOA particles occur mainly as semi-solid in the daytime and liquid in the nighttime. Highly viscous or solid SOA particles are found in northern China during both daytime and nighttime (Fig. S5).
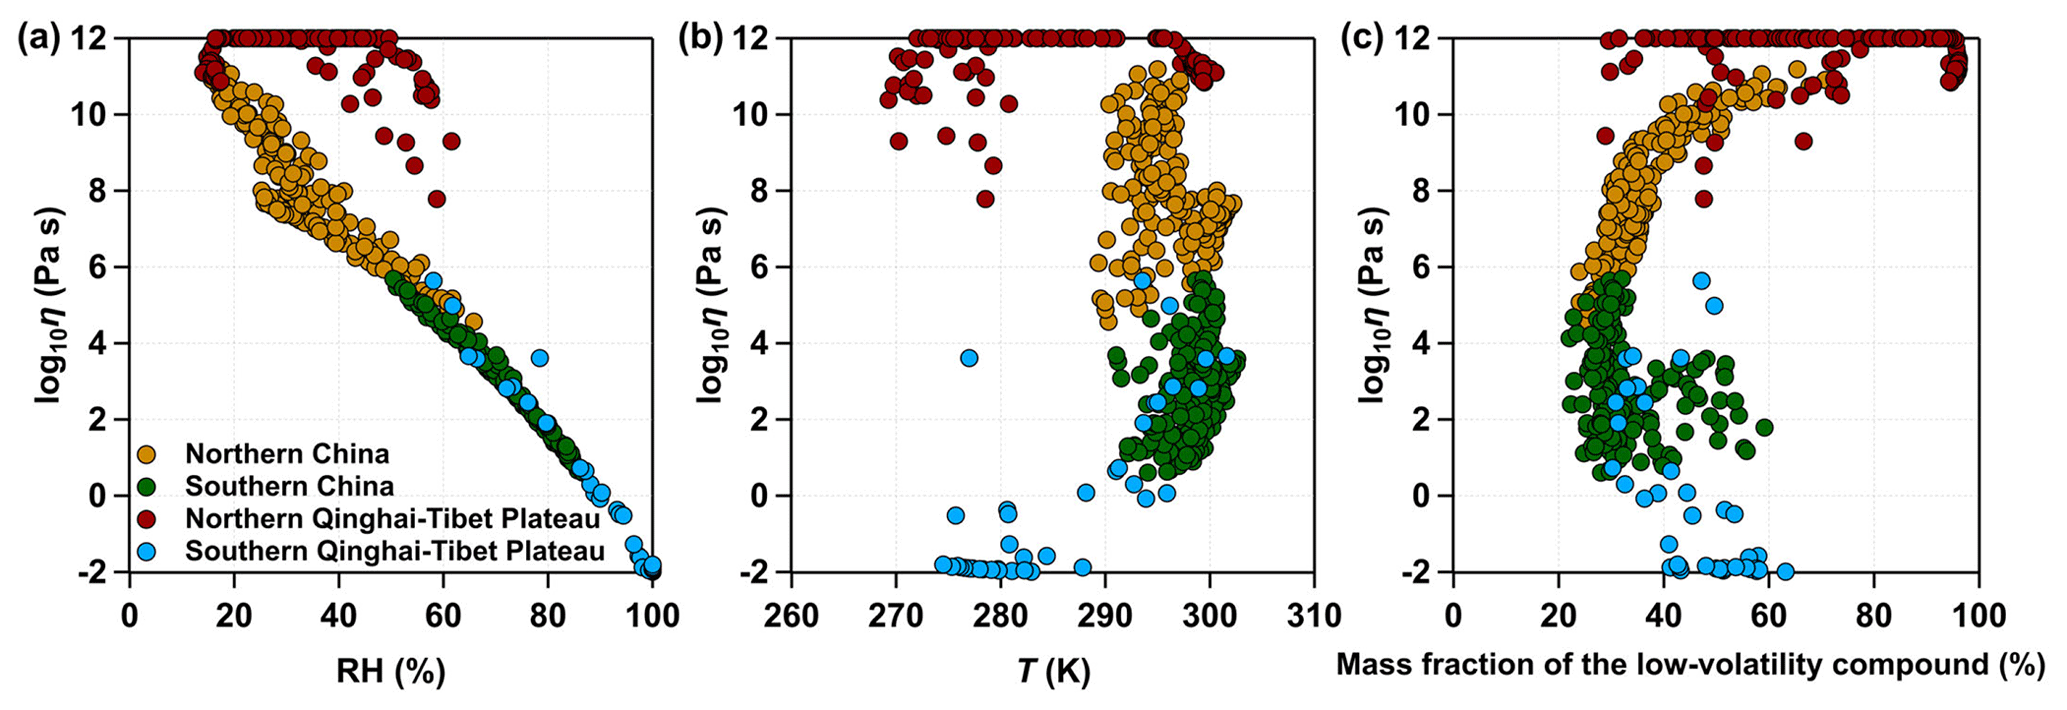
Figure 6The median values of viscosity as a function of (a) RH, (b) T, and (c) the mass fraction of SOAX ( µg m−3 at 298 K) calculated for selected regions in northern China, southern China, northern Qinghai–Tibet Plateau, and southern Qinghai–Tibet Plateau as specified by white boxes in Fig. 5a during 20 May–23 June 2018.

Figure 7WRF-Chem-predicted median surface values of the diffusion coefficients of (a) organic molecules and (c) water molecules in SOA particles. (b) The percent time that the mixing timescale of organic molecules in a 200 nm particle is less than 1 h during 20 May–23 June 2018. The white line indicates the Hu Huanyong Line (Hu, 1935).
The bulk diffusion coefficient is an important parameter determining the mass transport and mixing rates, which can be predicted by the particle viscosity through the fractional Stokes–Einstein relation (see the Method section and the Supplement). The Db of organic molecules is predicted to be cm2 s−1 in southern China. The highest value is cm2 s−1, occurring in liquid SOA particles in the southern Tibetan Plateau (Fig. 7a) because of the very low viscosity simulated over this region (Fig. 5a). The Db of organic molecules within semi-solid SOA particles is –10−10 cm2 s−1 in central and northeastern China and lower than cm2 s−1 in highly viscous and solid particles in most areas of northwestern China. Figure 7b shows the percent time that the mixing timescale of organic molecules in 200 nm particles is less than 1 h in the entire simulation period. The mixing timescale is found to be nearly always less than 1 h in the southeastern region of the Hu Huanyong Line. The Hu Huanyong Line, proposed by the Chinese geographer Huanyong Hu, divides China into two parts based on contrasting population densities (Hu, 1935), which was also found useful for characterizing the drought conditions, with the northwestern region much dryer than the southeastern region (Zeng et al., 2021). The mixing timescale of organic molecules in highly viscous or solid SOA particles in the northwest of the Hu Huanyong Line is often longer than 1 h (the frequency > 70 %), indicating that in these areas kinetic limitations of bulk diffusion should be considered in SOA partitioning. Compared to the diffusion coefficients of organic molecules, the Db of water molecules in SOA particles at the surface is several orders of magnitude larger, with the values higher than 10−10 cm2 s−1 in the southeast and as low as cm2 s−1 in northwestern China (Fig. 7c). The mixing timescales of water molecules in SOA particles with a diameter of 200 nm are of the order of milliseconds in the southeast and seconds in the northwest of China (Fig. S7), indicating that the activation of cloud condensation nuclei would not be inhibited, in agreement with our previous global simulations (Shiraiwa et al., 2017).

Figure 8WRF-Chem-predicted median values of (a) the glass transition temperature of SOA particles at dry conditions, (b) the percent time that an organic aerosol particle is in the liquid phase state, and (c) the percent time that the mixing timescale of organic molecules in a 200 nm particle is less than 1 h at 500 hPa during 20 May–23 June 2018.
Figure 8 shows the simulated Tg,org and the phase state of SOA particles, as well as the mixing timescale of organic molecules in SOA particles at 500 hPa. The Tg,org ranges from ∼285–295 K, which is lower than the Tg,org simulated at the surface (Fig. 8a). The reason is that the mass fractions of LVOCs (SOAX with C* of 0.1 µg m−3 at 298 K) at 500 hPa (Fig. S8) are smaller than the surface values (Fig. 4b). The low temperature at 500 hPa is favorable for SVOCs partitioned into the particle phase; thus, compared to the surface conditions, there are fewer semi-volatile vapors undergoing the further gas-phase aging forming SOAX species. The percent time that an organic aerosol particle is in the liquid phase state (the frequency of liquid SOA particles) at 500 hPa in southeastern China is 20 %–35 % (Fig. 8b), which is ∼20 % lower than the surface values (Fig. 5b). In northern China, the frequency of liquid SOA particles at 500 hPa is similar to the results at the surface, which is related to the RH spatial patterns (Fig. S9). The mixing timescale of organic molecules in 200 nm SOA particles is frequently longer than 1 h at 500 hPa, with the frequency > 70 % in northern China and ∼40 % in southeastern China (Fig. 8c). The τmix is relatively short (with the frequency of τmix≤1 h being ∼80 %) in some areas of southwestern China at 500 hPa, where relatively high RH could occur (Fig. S9) in the season of summer monsoon (Huang et al., 1998).
3.3 Sensitivity simulations
3.3.1 Impacts of volatility distributions on phase state estimations
The volatility and viscosity of organic aerosols are closely related (Rothfuss and Petters, 2017; Shiraiwa et al., 2017; Champion et al., 2019; Zhang et al., 2019b; Li et al., 2020). In this section we conduct sensitivity simulations (case A, Table 1) to evaluate how the simulated volatility distributions affect the phase state estimations. The lowest C* bin in the base case is 0.1 µg m−3 at 298 K, with ΔHvap of 142 kJ mol−1, which does not incorporate ELVOC species at room temperature. The sensitivity simulation (case A) adopts the default setting in the official WRF-Chem model v3.7.1, assuming that the lowest C* is 0.0001 µg m−3 at 298 K, with ΔHvap of 40 kJ mol−1 (Knote et al., 2015). Figure 9a shows that including these ELVOCs at 298 K with a relatively small ΔHvap mainly affects the Tg,org simulated over remote areas, e.g., northwestern China and the marine areas, where the simulated Tg,org is increased by 30–40 K. In other regions of China, the changes in Tg,org are less than 25 K. Although consideration of these ELVOCs could noticeably affect the simulated Tg,org at the surface in remote areas, i.e., northwestern China, it does not impact the predicted frequency of the occurrence of a liquid phase state (Fig. 9b), as in these dry areas the SOA particles are highly viscous. Including ELVOC formation at 298 K (ΔHvap of 40 kJ mol−1) mainly affects the phase state estimations in areas with a moderate humidity. For example, in some areas of southeastern China with ∼70 % RH, the SOA particles are predicted to be more viscous, with the frequency of a liquid phase state decreasing by up to 12 % (Fig. 9b). These results indicate that the SOA phase state estimations in the base and sensitivity case A are generally in agreement in the simulated episode in this study. Ambient measurements of organic aerosol volatility distributions are still sparse over China. A recent field study showed that the ELVOCs contributed more than half to the OA mass observed at a regional background site near the Bohai Sea (Feng et al., 2023), which resulted in an estimated viscosity much higher than our WRF-Chem simulations. More field volatility distribution measurements should be conducted over China to further evaluate the effects of ELVOCs and how to choose reasonable values of the enthalpy of vaporization that would affect phase state estimations.
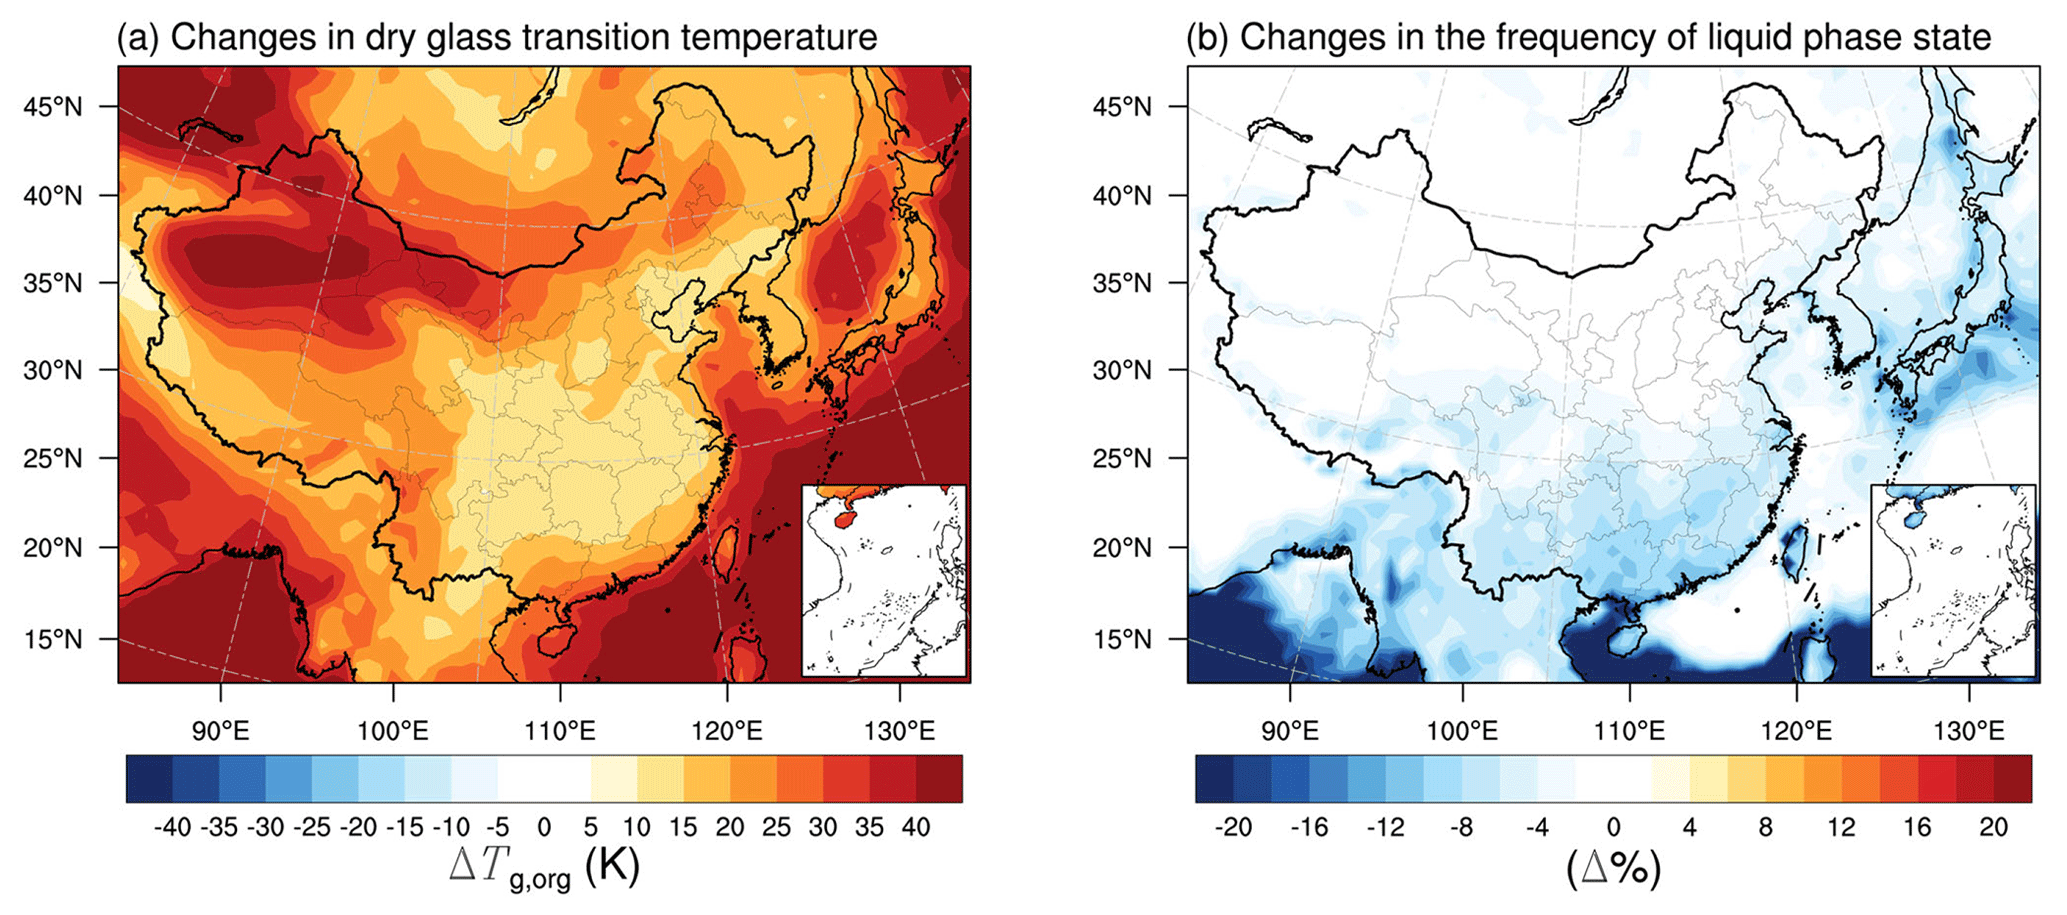
Figure 9Modeled median differences of (a) the glass transition temperature of SOA particles at dry conditions and (b) the percent time that an organic aerosol particle is in the liquid phase state between a sensitivity case with the lowest C* of 0.0001 µg m−3 at 298 K (ΔHvap of 40 kJ mol−1, case A in Table 1) and a base case with the lowest C* of 0.1 µg m−3 at 298 K (ΔHvap of 142 kJ mol−1, Table 1).
3.3.2 Impacts of RH and the water absorbed by inorganics on phase state estimations
RH is an important parameter affecting the phase state estimations. We perform a sensitivity calculation (case B, Table 1) with the simulated RH increased by a factor of 10 % to compensate for the fact that the current model underestimates the observed RH as shown in Fig. 2 and found in our previous simulations (Qu et al., 2019; Zhang et al., 2022). The increases in simulated RH lead to more occurrence (the liquid frequency increased by 10 %–20 %) of liquid SOA particles in southeastern China where the predicted RH mainly ranges from 70 % to 80 % (Fig. S4), with very limited effects in phase state predictions in relatively dry areas, e.g., northern China (Fig. 10a).

Figure 10(a) Impacts of RH on the percent time that an organic aerosol particle is in the liquid phase state: modeled median differences between a case with the WRF-Chem-simulated RH increased by a factor of 10 % (case B, Table 1) and a base case (Table 1) with the WRF-Chem-simulated RH. (b) Impacts of the water absorbed by inorganics on the percent time that an organic aerosol particle is in the liquid phase state: modeled median differences between a case considering the water absorbed by both SOA particles and inorganics (case C, Table 1) and a base case (Table 1) considering the water absorbed by SOA particles solely.
Besides RH, the mixing state of the organic and inorganic species in atmospheric particles also plays an important role in the phase state of ambient particles. The SOA components are assumed to be phase separated from inorganic compounds in particles in our base simulation, which is consistent with recent ambient observations showing that the phase separation with an organic-rich shell and an inorganic core was a frequent phenomenon in individual particles (diameters > 100 nm) collected over the North China Plain (W. Li et al., 2021). To assess the potential effects of inorganic compounds on the phase state of ambient particles, we perform a sensitivity calculation (case C, Table 1) assuming that the organic and inorganic compounds are internally mixed in one phase. In this case the water absorbed by inorganic species can lower the particle viscosity relative to the organic fraction alone. Figure 10b shows that the water associated with inorganic species can significantly lower the viscosity over most areas of China, with the liquid frequency increased by 15 %–45 % in the southeast and 5 %–15 % in some areas of the northeast. The effects over dry lands in northwestern China are relatively small. Previous studies showed that at such a mixing condition with one phase, on the one hand, it is expected that the inorganic salts that often have lower Tg compared to SOA compounds would further lower the particle viscosity (Dette and Koop, 2015). On the other hand, the presence of divalent inorganic ions could increase the viscosity of mixed organic–inorganic particles, enabling a humidity-dependent gel phase transition through cooperative ion–molecule interactions (Richards et al., 2020). For complex mixtures of primary OA, SOA, and inorganics, it was found that three distinct phases could occur (Huang et al., 2021). The impacts of the mixing state of organic and inorganic compounds on the phase state of multicomponent particles in ambient air warrant further investigations in future studies (Lilek and Zuend, 2022; Schervish and Shiraiwa, 2023).
We previously developed a new parameterization predicting the glass transition temperature of an organic compound as a function of its volatility (Li et al., 2020). Based on this new parameterization, we use the WRF-Chem model and simulate the Tg and viscosity of SOA particles over China in summer of 2018. This is the first time that spatial and temporal variations in the SOA phase state over China are investigated on a regional scale. The main conclusions are summarized below.
-
Simulations show that Tg values of dry SOA (Tg,org) range from ∼287 to 305 K over most areas of China at the surface, consistent with our previous simulated results based on a global transport model (Shiraiwa et al., 2017). The Tg,org is higher in northwestern China than southeastern China. This geospatial variation in Tg,org is related to the simulated SOA volatility distributions where SOA particles in northwestern China have relatively low volatilities.
-
Considering the water uptake by SOA particles, the SOA viscosity also shows a prominent geospatial gradient in which highly viscous or solid SOA particles are mainly found in northwestern China. The frequency of liquid SOA particles in most areas with a latitude higher than 30° N is less than 20 %. A very large spatial variation in the SOA phase state over the Qinghai–Tibet Plateau was found, and we recommend measurements in the ambient particle phase state to be conducted over this area, which is one of the regions most sensitive to climate change.
-
The average volatility (C*) and Tg,org of the simulated SOA agree well with the values estimated from ambient measurements of OOA volatilities at the IAP site in Beijing, where ELVOCs were not determined in the observed OOA (Xu et al., 2019). The sensitivity simulation considering the formation of ELVOCs shows that, compared to the base simulation, the frequency of a liquid phase state does not change in most areas of northern China. In some areas of southeastern China, the SOA particles become more viscous, with the percent time that a SOA particle is in the liquid phase state decreasing by up to 12 %. It needs more field volatility measurements to evaluate the effects of ELVOCs on OA phase state estimations over China.
-
Different from the base simulation where SOA components are assumed to be phase separated from inorganic compounds in particles, we conduct a sensitivity simulation assuming that the organic and inorganic compounds are internally mixed in one phase. We show that the water absorbed by inorganic species has a significant impact in lowering the simulated viscosity over southeastern China, with the liquid frequency increased by 15 %–45 %. Future work should consider the effects of the mixing state of organic and inorganic compounds on the prediction of the phase state of multicomponent particles in ambient air.
-
The mixing timescale of organic molecules in 200 nm SOA particles is calculated based on the simulated particle viscosity and the bulk diffusion coefficients of organic molecules. Calculations show that at the surface and at 500 hPa, the percent time of τmix longer than 1 h is % in the northwest of the Hu Huanyong Line. The implication of this result is that when the τmix values are greater than roughly 1 h, which is longer than the typical time step in CTMs, the instantaneous equilibrium partitioning usually assumed in SOA formation simulations is subject to be re-evaluated. We recommend testing the effects of kinetic partitioning considering the bulk diffusion in viscous particles on the prediction of SOA mass concentrations and size distributions over the areas with a long mixing timescale of organic molecules.
The simulation data in this study are available upon request from the corresponding author (liying-iap@mail.iap.ac.cn).
The supplement related to this article is available online at: https://doi.org/10.5194/acp-24-4809-2024-supplement.
YL and MS designed the research. ZZ, HR, and YQ performed the WRF-Chem modeling. ZZ, YL, and HR analyzed the simulation data. WZ, WX, WH, and YS provided observation data. YL and ZZ wrote the manuscript. ZZ, YL, and HR wrote the Supplement. All authors discussed the results and contributed to the article editing.
At least one of the (co-)authors is a member of the editorial board of Atmospheric Chemistry and Physics. The peer-review process was guided by an independent editor, and the authors also have no other competing interests to declare.
Publisher's note: Copernicus Publications remains neutral with regard to jurisdictional claims made in the text, published maps, institutional affiliations, or any other geographical representation in this paper. While Copernicus Publications makes every effort to include appropriate place names, the final responsibility lies with the authors. Regarding the maps used in this paper, please note that Figs. 4, 5, and 7–10 contain disputed territories.
The authors thank Qi Chen at Peking University and Bin Zhao at Tsinghua University for insightful suggestions on SOA volatility simulations in this work. Manabu Shiraiwa thanks the US National Science Foundation for funding (AGS-2246502).
This research has been supported by the National Natural Science Foundation of China (grant nos. 42075110 and 42330605) and the National Key Research and Development Program of China (grant no. 2023YFC3710100).
This paper was edited by Dantong Liu and reviewed by three anonymous referees.
Abbatt, J. P. D., Lee, A. K. Y., and Thornton, J. A.: Quantifying trace gas uptake to tropospheric aerosol: recent advances and remaining challenges, Chem. Soc. Rev., 41, 6555–6581, https://doi.org/10.1039/C2CS35052A, 2012.
Ahmadov, R., Mckeen, S. A., Robinson, A. L., Bahreini, R., Middlebrook, A. M., De Gouw, J. A., Meagher, J., Hsie, E. Y., Edgerton, E., Shaw, S., and Trainer, M.: A volatility basis set model for summertime secondary organic aerosols over the eastern United States in 2006, J. Geophys. Res.-Atmos., 117, D06301, https://doi.org/10.1029/2011JD016831, 2012.
Angell, C. A.: Relaxation in liquids, polymers and plastic crystals – strong/fragile patterns and problems, J. Non-Cryst. Solids, 131-133, 13-31, https://doi.org/10.1016/0022-3093(91)90266-9, 1991.
Baboomian, V. J., Crescenzo, G. V., Huang, Y., Mahrt, F., Shiraiwa, M., Bertram, A. K., and Nizkorodov, S. A.: Sunlight can convert atmospheric aerosols into a glassy solid state and modify their environmental impacts, P. Natl. Acad. Sci. USA, 119, e2208121119, https://doi.org/10.1073/pnas.2208121119, 2022.
Champion, W. M., Rothfuss, N. E., Petters, M. D., and Grieshop, A. P.: Volatility and viscosity are correlated in terpene secondary organic aerosol formed in a flow reactor, Environ. Sci. Technol. Lett., 6, 513–519, https://doi.org/10.1021/acs.estlett.9b00412, 2019.
Chang, X., Zhao, B., Zheng, H., Wang, S., Cai, S., Guo, F., Gui, P., Huang, G., Wu, D., Han, L., Xing, J., Man, H., Hu, R., Liang, C., Xu, Q., Qiu, X., Ding, D., Liu, K., Han, R., Robinson, A. L., and Donahue, N. M.: Full-volatility emission framework corrects missing and underestimated secondary organic aerosol sources, One Earth, 5, 403–412, https://doi.org/10.1016/j.oneear.2022.03.015, 2022.
Dalton, A. B. and Nizkorodov, S. A.: Photochemical degradation of 4-nitrocatechol and 2,4-dinitrophenol in a sugar-glass secondary organic aerosol surrogate, Environ. Sci. Technol., 55, 14586–14594, https://doi.org/10.1021/acs.est.1c04975, 2021.
DeRieux, W. S. W., Li, Y., Lin, P., Laskin, J., Laskin, A., Bertram, A. K., Nizkorodov, S. A., and Shiraiwa, M.: Predicting the glass transition temperature and viscosity of secondary organic material using molecular composition, Atmos. Chem. Phys., 18, 6331–6351, https://doi.org/10.5194/acp-18-6331-2018, 2018.
Dette, H. P. and Koop, T.: Glass formation processes in mixed inorganic/organic aerosol particles, J. Phys. Chem. A, 119, 4552–4561, https://doi.org/10.1021/jp5106967, 2015.
Dette, H. P., Qi, M., Schröder, D. C., Godt, A., and Koop, T.: Glass-forming properties of 3-methylbutane-1,2,3-tricarboxylic acid and its mixtures with water and pinonic acid, J. Phys. Chem. A, 118, 7024–7033, https://doi.org/10.1021/jp505910w, 2014.
Donahue, N., Robinson, A., Stanier, C., and Pandis, S.: Coupled partitioning, dilution, and chemical aging of semivolatile organics, Environ. Sci. Technol., 40, 2635-2643, https://doi.org/10.1021/es052297c, 2006.
Donahue, N. M., Epstein, S. A., Pandis, S. N., and Robinson, A. L.: A two-dimensional volatility basis set: 1. organic-aerosol mixing thermodynamics, Atmos. Chem. Phys., 11, 3303–3318, https://doi.org/10.5194/acp-11-3303-2011, 2011.
Donahue, N. M., Kroll, J. H., Pandis, S. N., and Robinson, A. L.: A two-dimensional volatility basis set – Part 2: Diagnostics of organic-aerosol evolution, Atmos. Chem. Phys., 12, 615–634, https://doi.org/10.5194/acp-12-615-2012, 2012.
Dong, W., Lin, Y., Wright, J. S., Ming, Y., Xie, Y., Wang, B., Luo, Y., Huang, W., Huang, J., Wang, L., Tian, L., Peng, Y., and Xu, F.: Summer rainfall over the southwestern Tibetan Plateau controlled by deep convection over the Indian subcontinent, Nat. Commun., 7, 10925, https://doi.org/10.1038/ncomms10925, 2016.
Duplissy, J., Decarlo, P. F., Dommen, J., Alfarra, M. R., Metzger, A., Barmpadimos, I., Prevot, A. S. H., Weingartner, E., Tritscher, T., Gysel, M., Aiken, A. C., Jimenez, J. L., Canagaratna, M. R., Worsnop, D. R., Collins, D. R., Tomlinson, J., and Baltensperger, U.: Relating hygroscopicity and composition of organic aerosol particulate matter, Atmos. Chem. Phys., 11, 1155–1165, https://doi.org/10.5194/acp-11-1155-2011, 2011.
Einstein, A.: Über die von der molekularkinetischen Theorie der Wärme geforderte Bewegung von in ruhenden Flüssigkeiten suspendierten Teilchen, Ann. Phys., 322, 549–560, https://doi.org/10.1002/andp.19053220806, 1905.
Emmons, L. K., Walters, S., Hess, P. G., Lamarque, J. F., Pfister, G. G., Fillmore, D., Granier, C., Guenther, A., Kinnison, D., Laepple, T., Orlando, J., Tie, X., Tyndall, G., Wiedinmyer, C., Baughcum, S. L., and Kloster, S.: Description and evaluation of the model for ozone and related chemical tracers, version 4 (MOZART-4), Geosci. Model Dev., 3, 43–67, https://doi.org/10.5194/gmd-3-43-2010, 2010.
Epstein, S. A., Riipinen, I., and Donahue, N. M.: A semiempirical correlation between enthalpy of vaporization and saturation concentration for organic aerosol, Environ. Sci. Technol., 44, 743–748, https://doi.org/10.1021/es902497z, 2010.
Evoy, E., Maclean, A. M., Rovelli, G., Li, Y., Tsimpidi, A. P., Karydis, V. A., Kamal, S., Lelieveld, J., Shiraiwa, M., Reid, J. P., and Bertram, A. K.: Predictions of diffusion rates of large organic molecules in secondary organic aerosols using the Stokes–Einstein and fractional Stokes–Einstein relations, Atmos. Chem. Phys., 19, 10073–10085, https://doi.org/10.5194/acp-19-10073-2019, 2019.
Evoy, E., Kamal, S., Patey, G. N., Martin, S. T., and Bertram, A. K.: Unified description of diffusion coefficients from small to large molecules in organic–water mixtures, J. Phys. Chem. A, 124, 2301–2308, https://doi.org/10.1021/acs.jpca.9b11271, 2020.
Fast, J. D., Gustafson Jr, W. I., Easter, R. C., Zaveri, R. A., Barnard, J. C., Chapman, E. G., Grell, G. A., and Peckham, S. E.: Evolution of ozone, particulates, and aerosol direct radiative forcing in the vicinity of Houston using a fully coupled meteorology-chemistry-aerosol model, J. Geophys. Res.-Atmos., 111, D21305, https://doi.org/10.1029/2005JD006721, 2006.
Feng, T., Wang, Y., Hu, W., Zhu, M., Song, W., Chen, W., Sang, Y., Fang, Z., Deng, W., Fang, H., Yu, X., Wu, C., Yuan, B., Huang, S., Shao, M., Huang, X., He, L., Lee, Y. R., Huey, L. G., Canonaco, F., Prevot, A. S. H., and Wang, X.: Impact of aging on the sources, volatility, and viscosity of organic aerosols in Chinese outflows, Atmos. Chem. Phys., 23, 611–636, https://doi.org/10.5194/acp-23-611-2023, 2023.
Fröhlich, R., Cubison, M. J., Slowik, J. G., Bukowiecki, N., Prévôt, A. S. H., Baltensperger, U., Schneider, J., Kimmel, J. R., Gonin, M., Rohner, U., Worsnop, D. R., and Jayne, J. T.: The ToF-ACSM: a portable aerosol chemical speciation monitor with TOFMS detection, Atmos. Meas. Tech., 6, 3225–3241, https://doi.org/10.5194/amt-6-3225-2013, 2013.
Galeazzo, T. and Shiraiwa, M.: Predicting glass transition temperature and melting point of organic compounds via machine learning and molecular embeddings, Environ. Sci.: Atmos., 2, 362–374, https://doi.org/10.1039/D1EA00090J, 2022.
Gervasi, N. R., Topping, D. O., and Zuend, A.: A predictive group-contribution model for the viscosity of aqueous organic aerosol, Atmos. Chem. Phys., 20, 2987–3008, https://doi.org/10.5194/acp-20-2987-2020, 2020.
Gordon, M. and Taylor, J. S.: Ideal copolymers and the second-order transitions of synthetic rubbers. i. non-crystalline copolymers, J. Appl. Chem., 2, 493–500, https://doi.org/10.1002/jctb.5010020901, 1952.
Grell, G. A., Peckham, S. E., Schmitz, R., Mckeen, S. A., Frost, G., Skamarock, W. C., and Eder, B.: Fully coupled “online” chemistry within the WRF model, Atmos. Environ., 39, 6957–6975, https://doi.org/10.1016/j.atmosenv.2005.04.027, 2005.
Guenther, A. B., Jiang, X., Heald, C. L., Sakulyanontvittaya, T., Duhl, T., Emmons, L. K., and Wang, X.: The Model of Emissions of Gases and Aerosols from Nature version 2.1 (MEGAN2.1): an extended and updated framework for modeling biogenic emissions, Geosci. Model Dev., 5, 1471–1492, https://doi.org/10.5194/gmd-5-1471-2012, 2012.
Gunthe, S. S., King, S. M., Rose, D., Chen, Q., Roldin, P., Farmer, D. K., Jimenez, J. L., Artaxo, P., Andreae, M. O., Martin, S. T., and Pöschl, U.: Cloud condensation nuclei in pristine tropical rainforest air of Amazonia: size-resolved measurements and modeling of atmospheric aerosol composition and CCN activity, Atmos. Chem. Phys., 9, 7551–7575, https://doi.org/10.5194/acp-9-7551-2009, 2009.
He, Y., Akherati, A., Nah, T., Ng, N. L., Garofalo, L. A., Farmer, D. K., Shiraiwa, M., Zaveri, R. A., Cappa, C. D., Pierce, J. R., and Jathar, S. H.: Particle size distribution dynamics can help constrain the phase state of secondary organic aerosol, Environ. Sci. Technol., 55, 1466–1476, https://doi.org/10.1021/acs.est.0c05796, 2021.
Hu, H.: The distribution of China's population, Acta Geogr. Sin., 2, 33–73, https://doi.org/10.11821/xb193502002, 1935.
Huang, R., Zhang, Z., Huang, G., and Ren, B.: Characteristics of the water vapor transport in east Asian monsoon region and its differences from that of south Asian monsoon region in summer, Chinese J. Atmos. Sci., 22, 368–379, https://doi.org/10.3878/j.issn.1006-9895.2003.19204, 1998.
Huang, Y., Mahrt, F., Xu, S., Shiraiwa, M., Zuend, A., and Bertram, A. K.: Coexistence of three liquid phases in individual atmospheric aerosol particles, P. Natl. Acad. Sci. USA, 118, e2102512118, https://doi.org/10.1073/pnas.2102512118, 2021.
Jathar, S. H., Cappa, C. D., He, Y., Pierce, J. R., Chuang, W., Bilsback, K. R., Seinfeld, J. H., Zaveri, R. A., and Shrivastava, M.: A computationally efficient model to represent the chemistry, thermodynamics, and microphysics of secondary organic aerosols (simpleSOM): model development and application to α-pinene SOA, Environ. Sci.: Atmos., 1, 372–394, https://doi.org/10.1039/D1EA00014D, 2021.
Jimenez, J. L., Canagaratna, M. R., Donahue, N. M., Prevot, A. S. H., Zhang, Q., Kroll, J. H., Decarlo, P. F., Allan, J. D., Coe, H., Ng, N. L., Aiken, A. C., Docherty, K. S., Ulbrich, I. M., Grieshop, A. P., Robinson, A. L., Duplissy, J., Smith, J. D., Wilson, K. R., Lanz, V. A., Hueglin, C., Sun, Y. L., Tian, J., Laaksonen, A., Raatikainen, T., Rautiainen, J., Vaattovaara, P., Ehn, M., Kulmala, M., Tomlinson, J. M., Collins, D. R., Cubison, M. J., Dunlea, J., Huffman, J. A., Onasch, T. B., Alfarra, M. R., Williams, P. I., Bower, K., Kondo, Y., Schneider, J., Drewnick, F., Borrmann, S., Weimer, S., Demerjian, K., Salcedo, D., Cottrell, L., Griffin, R., Takami, A., Miyoshi, T., Hatakeyama, S., Shimono, A., Sun, J. Y., Zhang, Y. M., Dzepina, K., Kimmel, J. R., Sueper, D., Jayne, J. T., Herndon, S. C., Trimborn, A. M., Williams, L. R., Wood, E. C., Middlebrook, A. M., Kolb, C. E., Baltensperger, U., and Worsnop, D. R.: Evolution of organic aerosols in the atmosphere, Science, 326, 1525, https://doi.org/10.1126/science.1180353, 2009.
Kanakidou, M., Seinfeld, J. H., Pandis, S. N., Barnes, I., Dentener, F. J., Facchini, M. C., Van Dingenen, R., Ervens, B., Nenes, A., Nielsen, C. J., Swietlicki, E., Putaud, J. P., Balkanski, Y., Fuzzi, S., Horth, J., Moortgat, G. K., Winterhalter, R., Myhre, C. E. L., Tsigaridis, K., Vignati, E., Stephanou, E. G., and Wilson, J.: Organic aerosol and global climate modelling: a review, Atmos. Chem. Phys., 5, 1053–1123, https://doi.org/10.5194/acp-5-1053-2005, 2005.
Karnezi, E., Riipinen, I., and Pandis, S. N.: Measuring the atmospheric organic aerosol volatility distribution: a theoretical analysis, Atmos. Meas. Tech., 7, 2953–2965, https://doi.org/10.5194/amt-7-2953-2014, 2014.
Knopf, D. A. and Alpert, P. A.: Atmospheric ice nucleation, Nat. Rev. Phys., 5, 203–217, https://doi.org/10.1038/s42254-023-00570-7, 2023.
Knote, C., Hodzic, A., and Jimenez, J. L.: The effect of dry and wet deposition of condensable vapors on secondary organic aerosols concentrations over the continental US, Atmos. Chem. Phys., 15, 1–18, https://doi.org/10.5194/acp-15-1-2015, 2015.
Kohl, I., Bachmann, L., Hallbrucker, A., Mayer, E., and Loerting, T.: Liquid-like relaxation in hyperquenched water at ≤140 K, Phys. Chem. Chem. Phys., 7, 3210–3220, https://doi.org/10.1039/B507651J, 2005.
Koop, T., Bookhold, J., Shiraiwa, M., and Pöschl, U.: Glass transition and phase state of organic compounds: dependency on molecular properties and implications for secondary organic aerosols in the atmosphere, Phys. Chem. Chem. Phys., 13, 19238–19255, https://doi.org/10.1039/C1CP22617G, 2011.
Kuwata, M. and Martin, S. T.: Phase of atmospheric secondary organic material affects its reactivity, P. Natl. Acad. Sci. USA, 109, 17354–17359, https://doi.org/10.1073/pnas.1209071109, 2012.
Lane, T. E., Donahue, N. M., and Pandis, S. N.: Effect of NOx on secondary organic aerosol concentrations, Environ. Sci. Technol., 42, 6022–6027, https://doi.org/10.1021/es703225a, 2008a.
Lane, T. E., Donahue, N. M., and Pandis, S. N.: Simulating secondary organic aerosol formation using the volatility basis-set approach in a chemical transport model, Atmos. Environ., 42, 7439–7451, https://doi.org/10.1016/j.atmosenv.2008.06.026, 2008b.
Li, J., Han, Z., Wu, J., Tao, J., Li, J., Sun, Y., Liang, L., Liang, M., and Wang, Q. G.: Secondary organic aerosol formation and source contributions over east China in summertime, Environ. Pollut., 306, 119383, https://doi.org/10.1016/j.envpol.2022.119383, 2022.
Li, M., Zhang, Q., Kurokawa, J. I., Woo, J. H., He, K., Lu, Z., Ohara, T., Song, Y., Streets, D. G., Carmichael, G. R., Cheng, Y., Hong, C., Huo, H., Jiang, X., Kang, S., Liu, F., Su, H., and Zheng, B.: MIX: a mosaic Asian anthropogenic emission inventory under the international collaboration framework of the MICS-Asia and HTAP, Atmos. Chem. Phys., 17, 935–963, https://doi.org/10.5194/acp-17-935-2017, 2017.
Li, W., Liu, L., Zhang, J., Xu, L., Wang, Y., Sun, Y., and Shi, Z.: Microscopic evidence for phase separation of organic species and inorganic salts in fine ambient aerosol particles, Environ. Sci. Technol., 55, 2234–2242, https://doi.org/10.1021/acs.est.0c02333, 2021.
Li, Y. and Shiraiwa, M.: Timescales of secondary organic aerosols to reach equilibrium at various temperatures and relative humidities, Atmos. Chem. Phys., 19, 5959–5971, https://doi.org/10.5194/acp-19-5959-2019, 2019.
Li, Y., An, J., Min, M., Zhang, W., Wang, F., and Xie, P.: Impacts of HONO sources on the air quality in Beijing, Tianjin and Hebei Province of China, Atmos. Environ., 45, 4735–4744, https://doi.org/10.1016/j.atmosenv.2011.04.086, 2011.
Li, Y., An, J., and Gultepe, I.: Effects of additional HONO sources on visibility over the North China Plain, Adv. Atmos. Sci., 31, 1221–1232, https://doi.org/10.1007/s00376-014-4019-1, 2014.
Li, Y., An, J., Kajino, M., Gultepe, I., Chen, Y., Song, T., and Xin, J.: Impacts of additional HONO sources on O3 and PM2.5 chemical coupling and control strategies in the Beijing–Tianjin–Hebei region of China, Tellus B, 67, 23930, https://doi.org/10.3402/tellusb.v67.23930, 2015.
Li, Y., Day, D. A., Stark, H., Jimenez, J. L., and Shiraiwa, M.: Predictions of the glass transition temperature and viscosity of organic aerosols from volatility distributions, Atmos. Chem. Phys., 20, 8103–8122, https://doi.org/10.5194/acp-20-8103-2020, 2020.
Li, Y., Carlton, A. G., and Shiraiwa, M.: Diurnal and seasonal variations in the phase state of secondary organic aerosol material over the contiguous US simulated in CMAQ, ACS Earth Space Chem., 5, 1971–1982, https://doi.org/10.1021/acsearthspacechem.1c00094, 2021.
Li, Z., Xu, W., Zhou, W., Lei, L., Sun, J., You, B., Wang, Z., and Sun, Y.: Insights into the compositional differences of PM1 and PM2.5 from aerosol mass spectrometer measurements in Beijing, China, Atmos. Environ., 301, 119709, https://doi.org/10.1016/j.atmosenv.2023.119709, 2023.
Lilek, J. and Zuend, A.: A predictive viscosity model for aqueous electrolytes and mixed organic–inorganic aerosol phases, Atmos. Chem. Phys., 22, 3203–3233, https://doi.org/10.5194/acp-22-3203-2022, 2022.
Liu, P., Li, Y. J., Wang, Y., Bateman, A. P., Zhang, Y., Gong, Z., Bertram, A. K., and Martin, S. T.: Highly viscous states affect the browning of atmospheric organic particulate matter, ACS Cent. Sci., 4, 207–215, https://doi.org/10.1021/acscentsci.7b00452, 2018.
Liu, Y., Wu, Z., Wang, Y., Xiao, Y., Gu, F., Zheng, J., Tan, T., Shang, D., Wu, Y., Zeng, L., Hu, M., Bateman, A. P., and Martin, S. T.: Submicrometer particles are in the liquid state during heavy haze episodes in the urban atmosphere of Beijing, China, Environ. Sci. Technol. Lett., 4, 427–432, https://doi.org/10.1021/acs.estlett.7b00352, 2017.
Liu, Y., Wu, Z., Huang, X., Shen, H., Bai, Y., Qiao, K., Meng, X., Hu, W., Tang, M., and He, L.: Aerosol phase state and its link to chemical composition and liquid water content in a subtropical coastal megacity, Environ. Sci. Technol., 53, 5027–5033, https://doi.org/10.1021/acs.est.9b01196, 2019.
Liu, Y., Meng, X., Wu, Z., Huang, D., Wang, H., Chen, J., Chen, J., Zong, T., Fang, X., Tan, T., Zhao, G., Chen, S., Zeng, L., Guo, S., Huang, X., He, L., Zeng, L., and Hu, M.: The particle phase state during the biomass burning events, Sci. Total Environ., 792, 148035, https://doi.org/10.1016/j.scitotenv.2021.148035, 2021.
Maclean, A. M., Butenhoff, C. L., Grayson, J. W., Barsanti, K., Jimenez, J. L., and Bertram, A. K.: Mixing times of organic molecules within secondary organic aerosol particles: a global planetary boundary layer perspective, Atmos. Chem. Phys., 17, 13037–13048, https://doi.org/10.5194/acp-17-13037-2017, 2017.
Maclean, A. M., Li, Y., Crescenzo, G. V., Smith, N. R., Karydis, V. A., Tsimpidi, A. P., Butenhoff, C. L., Faiola, C. L., Lelieveld, J., Nizkorodov, S. A., Shiraiwa, M., and Bertram, A. K.: Global distribution of the phase state and mixing times within secondary organic aerosol particles in the troposphere based on room-temperature viscosity measurements, ACS Earth Space Chem., 5, 3458–3473, https://doi.org/10.1021/acsearthspacechem.1c00296, 2021.
Marshall, F. H., Berkemeier, T., Shiraiwa, M., Nandy, L., Ohm, P. B., Dutcher, C. S., and Reid, J. P.: Influence of particle viscosity on mass transfer and heterogeneous ozonolysis kinetics in aqueous–sucrose–maleic acid aerosol, Phys. Chem. Chem. Phys., 20, 15560–15573, https://doi.org/10.1039/C8CP01666F, 2018.
Meng, X., Wu, Z., Guo, S., Wang, H., Liu, K., Zong, T., Liu, Y., Zhang, W., Zhang, Z., Chen, S., Zeng, L., Hallquist, M., Shuai, S., and Hu, M.: Humidity-dependent phase state of gasoline vehicle emission-related aerosols, Environ. Sci. Technol., 55, 832-841, https://doi.org/10.1021/acs.est.0c05478, 2021.
Miao, R., Chen, Q., Shrivastava, M., Chen, Y., Zhang, L., Hu, J., Zheng, Y., and Liao, K.: Process-based and observation-constrained SOA simulations in China: the role of semivolatile and intermediate-volatility organic compounds and OH levels, Atmos. Chem. Phys., 21, 16183–16201, https://doi.org/10.5194/acp-21-16183-2021, 2021.
Mikhailov, E., Vlasenko, S., Martin, S. T., Koop, T., and Pöschl, U.: Amorphous and crystalline aerosol particles interacting with water vapor: conceptual framework and experimental evidence for restructuring, phase transitions and kinetic limitations, Atmos. Chem. Phys., 9, 9491–9522, https://doi.org/10.5194/acp-9-9491-2009, 2009.
Murphy, B. N. and Pandis, S. N.: Simulating the formation of semivolatile primary and secondary organic aerosol in a regional chemical transport model, Environ. Sci. Technol., 43, 4722–4728, https://doi.org/10.1021/es803168a, 2009.
Pankow, J. F.: An absorption model of gas/particle partitioning of organic compounds in the atmosphere, Atmos. Environ., 28, 185–188, https://doi.org/10.1016/1352-2310(94)90093-0, 1994.
Petters, M. D. and Kreidenweis, S. M.: A single parameter representation of hygroscopic growth and cloud condensation nucleus activity, Atmos. Chem. Phys., 7, 1961–1971, https://doi.org/10.5194/acp-7-1961-2007, 2007.
Pöschl, U. and Shiraiwa, M.: Multiphase chemistry at the atmosphere–biosphere interface influencing climate and public health in the anthropocene, Chem. Rev., 115, 4440–4475, https://doi.org/10.1021/cr500487s, 2015.
Preston, T. C. and Zuend, A.: Equilibration times in viscous and viscoelastic aerosol particles, Environ. Sci.: Atmos., 2, 1376–1388, https://doi.org/10.1039/D2EA00065B, 2022.
Price, H. C., Mattsson, J., and Murray, B. J.: Sucrose diffusion in aqueous solution, Phys. Chem. Chem. Phys., 18, 19207–19216, https://doi.org/10.1039/C6CP03238A, 2016.
Qu, Y., Chen, Y., Liu, X., Zhang, J., Guo, Y., and An, J.: Seasonal effects of additional HONO sources and the heterogeneous reactions of N2O5 on nitrate in the North China Plain, Sci. Total Environ., 690, 97–107, https://doi.org/10.1016/j.scitotenv.2019.06.436, 2019.
Rasool, Q. Z., Shrivastava, M., Octaviani, M., Zhao, B., Gaudet, B., and Liu, Y.: Modeling volatility-based aerosol phase state predictions in the Amazon Rainforest, ACS Earth Space Chem., 5, 2910–2924, https://doi.org/10.1021/acsearthspacechem.1c00255, 2021.
Rasool, Q. Z., Shrivastava, M., Liu, Y., Gaudet, B., and Zhao, B.: Modeling the Impact of the Organic Aerosol Phase State on Multiphase OH Reactive Uptake Kinetics and the Resultant Heterogeneous Oxidation Timescale of Organic Aerosol in the Amazon Rainforest, ACS Earth Space Chem., 7, 1009–1024, https://doi.org/10.1021/acsearthspacechem.2c00366, 2023.
Reid, J. P., Bertram, A. K., Topping, D. O., Laskin, A., Martin, S. T., Petters, M. D., Pope, F. D., and Rovelli, G.: The viscosity of atmospherically relevant organic particles, Nat. Commun., 9, 956, https://doi.org/10.1038/s41467-018-03027-z, 2018.
Richards, D. S., Trobaugh, K. L., Hajek-Herrera, J., Price, C. L., Sheldon, C. S., Davies, J. F., and Davis, R. D.: Ion-molecule interactions enable unexpected phase transitions in organic-inorganic aerosol, Sci. Adv., 6, eabb5643, https://doi.org/10.1126/sciadv.abb5643, 2020.
Riipinen, I., Pierce, J. R., Donahue, N. M., and Pandis, S. N.: Equilibration time scales of organic aerosol inside thermodenuders: Evaporation kinetics versus thermodynamics, Atmos. Environ., 44, 597–607, https://doi.org/10.1016/j.atmosenv.2009.11.022, 2010.
Roldin, P., Eriksson, A. C., Nordin, E. Z., Hermansson, E., Mogensen, D., Rusanen, A., Boy, M., Swietlicki, E., Svenningsson, B., Zelenyuk, A., and Pagels, J.: Modelling non-equilibrium secondary organic aerosol formation and evaporation with the aerosol dynamics, gas- and particle-phase chemistry kinetic multilayer model ADCHAM, Atmos. Chem. Phys., 14, 7953–7993, https://doi.org/10.5194/acp-14-7953-2014, 2014.
Rothfuss, N. E. and Petters, M. D.: Influence of functional groups on the viscosity of organic aerosol, Environ. Sci. Technol., 51, 271–279, https://doi.org/10.1021/acs.est.6b04478, 2017.
Schervish, M. and Shiraiwa, M.: Impact of phase state and non-ideal mixing on equilibration timescales of secondary organic aerosol partitioning, Atmos. Chem. Phys., 23, 221–233, https://doi.org/10.5194/acp-23-221-2023, 2023.
Schmedding, R., Rasool, Q. Z., Zhang, Y., Pye, H. O. T., Zhang, H., Chen, Y., Surratt, J. D., Lopez-Hilfiker, F. D., Thornton, J. A., Goldstein, A. H., and Vizuete, W.: Predicting secondary organic aerosol phase state and viscosity and its effect on multiphase chemistry in a regional-scale air quality model, Atmos. Chem. Phys., 20, 8201–8225, https://doi.org/10.5194/acp-20-8201-2020, 2020.
Seinfeld, J. H. and Pandis, S. N.: Atmospheric chemistry and physics: from air pollution to climate change, John Wiley & Sons, ISBN 978-1-119-22117-3, 2016.
Shiraiwa, M. and Pöschl, U.: Mass accommodation and gas–particle partitioning in secondary organic aerosols: dependence on diffusivity, volatility, particle-phase reactions, and penetration depth, Atmos. Chem. Phys., 21, 1565–1580, https://doi.org/10.5194/acp-21-1565-2021, 2021.
Shiraiwa, M. and Seinfeld, J. H.: Equilibration timescale of atmospheric secondary organic aerosol partitioning, Geophys. Res. Lett., 39, L24801, https://doi.org/10.1029/2012GL054008, 2012.
Shiraiwa, M., Yee, L. D., Schilling, K. A., Loza, C. L., Craven, J. S., Zuend, A., Ziemann, P. J., and Seinfeld, J. H.: Size distribution dynamics reveal particle-phase chemistry in organic aerosol formation, P. Natl. Acad. Sci. USA, 110, 11746, https://doi.org/10.1073/pnas.1307501110, 2013.
Shiraiwa, M., Li, Y., Tsimpidi, A. P., Karydis, V. A., Berkemeier, T., Pandis, S. N., Lelieveld, J., Koop, T., and Pöschl, U.: Global distribution of particle phase state in atmospheric secondary organic aerosols, Nat. Commun., 8, 15002, https://doi.org/10.1038/ncomms15002, 2017.
Shrivastava, M., Fast, J., Easter, R., Gustafson Jr, W. I., Zaveri, R. A., Jimenez, J. L., Saide, P., and Hodzic, A.: Modeling organic aerosols in a megacity: comparison of simple and complex representations of the volatility basis set approach, Atmos. Chem. Phys., 11, 6639–6662, https://doi.org/10.5194/acp-11-6639-2011, 2011.
Shrivastava, M., Cappa, C. D., Fan, J., Goldstein, A. H., Guenther, A. B., Jimenez, J. L., Kuang, C., Laskin, A., Martin, S. T., Ng, N. L., Petaja, T., Pierce, J. R., Rasch, P. J., Roldin, P., Seinfeld, J. H., Shilling, J., Smith, J. N., Thornton, J. A., Volkamer, R., Wang, J., Worsnop, D. R., Zaveri, R. A., Zelenyuk, A., and Zhang, Q.: Recent advances in understanding secondary organic aerosol: implications for global climate forcing, Rev. Geophys., 55, 509–559, https://doi.org/10.1002/2016RG000540, 2017.
Shrivastava, M., Rasool, Q. Z., Zhao, B., Octaviani, M., Zaveri, R. A., Zelenyuk, A., Gaudet, B., Liu, Y., Shilling, J. E., Schneider, J., Schulz, C., Zöger, M., Martin, S. T., Ye, J., Guenther, A., Souza, R. F., Wendisch, M., and Pöschl, U.: Tight coupling of surface and in-plant biochemistry and convection governs key fine particulate components over the Amazon Rainforest, ACS Earth Space Chem., 6, 380–390, https://doi.org/10.1021/acsearthspacechem.1c00356, 2022.
Song, M., Jeong, R., Kim, D., Qiu, Y., Meng, X., Wu, Z., Zuend, A., Ha, Y., Kim, C., Kim, H., Gaikwad, S., Jang, K.-S., Lee, J. Y., and Ahn, J.: Comparison of phase states of PM2.5over megacities, Seoul and Beijing, and their implications on particle size distribution, Environ. Sci. Technol., 56, 17581–17590, https://doi.org/10.1021/acs.est.2c06377, 2022.
Song, Y. C., Haddrell, A. E., Bzdek, B. R., Reid, J. P., Bannan, T., Topping, D. O., Percival, C., and Cai, C.: Measurements and predictions of binary component aerosol particle viscosity, J. Phys. Chem. A, 120, 8123–8137, https://doi.org/10.1021/acs.jpca.6b07835, 2016.
Tan, W., Li, C., Liu, Y., Meng, X., Wu, Z., Kang, L., and Zhu, T.: Potential of polarization lidar to profile the urban aerosol phase state during haze episodes, Environ. Sci. Technol. Lett., 7, 54–59, https://doi.org/10.1021/acs.estlett.9b00695, 2020.
Tong, Y.-K., Liu, Y., Meng, X., Wang, J., Zhao, D., Wu, Z., and Ye, A.: Relative humidity-dependent viscosity of single quasi aerosol particle and possible implications for atmospheric aerosol chemistry, Phys. Chem. Chem. Phys., 24, 10514–10523, https://doi.org/10.1039/D2CP00740A, 2022.
Wu, Z. J., Poulain, L., Henning, S., Dieckmann, K., Birmili, W., Merkel, M., Van Pinxteren, D., Spindler, G., Müller, K., Stratmann, F., Herrmann, H., and Wiedensohler, A.: Relating particle hygroscopicity and CCN activity to chemical composition during the HCCT-2010 field campaign, Atmos. Chem. Phys., 13, 7983–7996, https://doi.org/10.5194/acp-13-7983-2013, 2013.
Xu, W., Xie, C., Karnezi, E., Zhang, Q., Wang, J., Pandis, S. N., Ge, X., Zhang, J., An, J., Wang, Q., Zhao, J., Du, W., Qiu, Y., Zhou, W., He, Y., Li, Y., Li, J., Fu, P., Wang, Z., Worsnop, D. R., and Sun, Y.: Summertime aerosol volatility measurements in Beijing, China, Atmos. Chem. Phys., 19, 10205–10216, https://doi.org/10.5194/acp-19-10205-2019, 2019.
Zaveri, R. A., Easter, R. C., Fast, J. D., and Peters, L. K.: Model for Simulating Aerosol Interactions and Chemistry (MOSAIC), J. Geophys. Res.-Atmos., 113, D13204, https://doi.org/10.1029/2007JD008782, 2008.
Zaveri, R. A., Easter, R. C., Shilling, J. E., and Seinfeld, J. H.: Modeling kinetic partitioning of secondary organic aerosol and size distribution dynamics: representing effects of volatility, phase state, and particle-phase reaction, Atmos. Chem. Phys., 14, 5153–5181, https://doi.org/10.5194/acp-14-5153-2014, 2014.
Zaveri, R. A., Shilling, J. E., Zelenyuk, A., Liu, J., Bell, D. M., D'ambro, E. L., Gaston, C. J., Thornton, J. A., Laskin, A., Lin, P., Wilson, J., Easter, R. C., Wang, J., Bertram, A. K., Martin, S. T., Seinfeld, J. H., and Worsnop, D. R.: Growth kinetics and size distribution dynamics of viscous secondary organic aerosol, Environ. Sci. Technol., 52, 1191–1199, https://doi.org/10.1021/acs.est.7b04623, 2018.
Zaveri, R. A., Wang, J., Fan, J., Zhang, Y., Shilling, J. E., Zelenyuk, A., Mei, F., Newsom, R., Pekour, M., Tomlinson, J., Comstock, J. M., Shrivastava, M., Fortner, E., Machado, L. a. T., Artaxo, P., and Martin, S. T.: Rapid growth of anthropogenic organic nanoparticles greatly alters cloud life cycle in the Amazon rainforest, Sci. Adv., 8, eabj0329, https://doi.org/10.1126/sciadv.abj0329, 2022.
Zeng, P., Sun, F., Liu, Y., Wang, Y., Li, G., and Che, Y.: Mapping future droughts under global warming across China: a combined multi-timescale meteorological drought index and SOM-Kmeans approach, Weather Clim. Extrem., 31, 100304, https://doi.org/10.1016/j.wace.2021.100304, 2021.
Zhang, J., Lian, C., Wang, W., Ge, M., Guo, Y., Ran, H., Zhang, Y., Zheng, F., Fan, X., Yan, C., Daellenbach, K. R., Liu, Y., Kulmala, M., and An, J.: Amplified role of potential HONO sources in O3 formation in North China Plain during autumn haze aggravating processes, Atmos. Chem. Phys., 22, 3275–3302, https://doi.org/10.5194/acp-22-3275-2022, 2022.
Zhang, Y., Chen, Y., Lei, Z., Olson, N. E., Riva, M., Koss, A. R., Zhang, Z., Gold, A., Jayne, J. T., Worsnop, D. R., Onasch, T. B., Kroll, J. H., Turpin, B. J., Ault, A. P., and Surratt, J. D.: Joint impacts of acidity and viscosity on the formation of secondary organic aerosol from isoprene epoxydiols (IEPOX) in phase separated particles, ACS Earth Space Chem., 3, 2646–2658, https://doi.org/10.1021/acsearthspacechem.9b00209, 2019a.
Zhang, Y., Nichman, L., Spencer, P., Jung, J. I., Lee, A., Heffernan, B. K., Gold, A., Zhang, Z., Chen, Y., Canagaratna, M. R., Jayne, J. T., Worsnop, D. R., Onasch, T. B., Surratt, J. D., Chandler, D., Davidovits, P., and Kolb, C. E.: The cooling rate- and volatility-dependent glass-forming properties of organic aerosols measured by broadband dielectric spectroscopy, Environ. Sci. Technol., 53, 12366—2378, https://doi.org/10.1021/acs.est.9b03317, 2019b.
Zheng, B., Tong, D., Li, M., Liu, F., Hong, C., Geng, G., Li, H., Li, X., Peng, L., Qi, J., Yan, L., Zhang, Y., Zhao, H., Zheng, Y., He, K., and Zhang, Q.: Trends in China's anthropogenic emissions since 2010 as the consequence of clean air actions, Atmos. Chem. Phys., 18, 14095–14111, https://doi.org/10.5194/acp-18-14095-2018, 2018.
Ziemann, P. J. and Atkinson, R.: Kinetics, products, and mechanisms of secondary organic aerosol formation, Chem. Soc. Rev., 41, 6582–6605, https://doi.org/10.1039/C2CS35122F, 2012.