the Creative Commons Attribution 4.0 License.
the Creative Commons Attribution 4.0 License.
 | 15 Apr 2024
Analysis of an intense O3 pollution episode on the Atlantic coast of the Iberian Peninsula using photochemical modeling: characterization of transport pathways and accumulation processes
Eduardo Torre-Pascual
Gotzon Gangoiti
Ana Rodríguez-García
Estibaliz Sáez de Cámara
Joana Ferreira
Carla Gama
María Carmen Gómez
Iñaki Zuazo
Jose Antonio García
Maite de Blas
A tropospheric O3 pollution episode over the Atlantic coast of the Iberian Peninsula during 2–6 August 2018 has been analyzed. The episode was characterized by a permanent wind shear throughout the entire period, making the observed ozone surface distribution especially difficult to explain. A new methodology is described to analyze upper-level atmospheric parameters, such as temperature, wind direction, wind speed, and O3 concentrations, added to the traditional use of surface parameters, using the Weather Research and Forecasting (WRF) and Comprehensive Air Quality Model with Extensions (CAMx) models as well as available surface and upper-air observations. Results indicate that the episode was characterized by a first phase of a sudden increase in O3 concentrations produced by fumigation and inter-regional transport processes within the Iberian Peninsula, followed by continental O3 transport from Europe to the Atlantic coast. An Atlantic front produced the dissipation of the episode, generating an “ozone front” accompanying the cold front passage across the region.
- Article
(17807 KB) - Full-text XML
-
Supplement
(2070 KB) - BibTeX
- EndNote


Southern European countries are heavily exposed to high tropospheric ozone (O3) concentrations, particularly those surrounding the Mediterranean Basin (ETC/ACM, 2018; European Environment Agency et al., 2018). Accumulation, transport, and recirculation processes behind these high concentrations have been extensively analyzed in the western Mediterranean Basin and eastern Iberia during the last 40 years (Millán et al., 1997; Gangoiti et al., 2001; Querol et al., 2016). The 2020 European air quality report indicated a decrease in O3 levels compared to previous years. However, levels remained notably high, with maximum concentrations observed in central Europe, certain Mediterranean countries, and Portugal – located on the Atlantic coast of the Iberian Peninsula (IP) (EEA, 2022). These high O3 concentrations are due to a combination of the northern midlatitude background concentrations (Cuevas et al., 2013; Rodrigues et al., 2021) and the local and regional production favored by the region's circulation weather patterns (Russo et al., 2016) and meteorological conditions, including temperature (Sá et al., 2015) and solar radiation (Silva and Pires, 2022). However, despite their importance, O3 episodes on the Atlantic coast of IP, specifically in northern Atlantic Iberia (NAI) and western Atlantic Iberia (WAI), have not been examined in detail. In this region, significant episodes of tropospheric O3 have occurred, with values exceeding the target value for the protection of human health defined by Directive 2008/50/EC (Silva and Pires, 2022). Moreover, considering the more stringent values of the World Health Organization (WHO) air quality guidelines (which are planned to be incorporated into the revised air quality directive by 2035), the situation becomes even more concerning.
In NAI, data from the summer flight campaigns of the European MECAPIP project (Millán et al., 1992, 1997) revealed long-range transport of photochemical pollutants from the English Channel into the Basque Country (BC) (Alonso et al., 2000). Pollutants are usually transported under the typical summer synoptic scenario, with the Azores High extending a ridge of high pressures over the Bay of Biscay and pushing northerly winds over NAI.
Gangoiti et al. (2002, 2006a) showed the importance of vertical layering and transport in the generation of intense O3 episodes in the BC under a different synoptic situation, with persistent northeasterly winds associated with blocking anticyclones over the British Isles. That work also documented the importation of pollutants into the BC from several European source regions during the build-up of episodes, including the Iberian Peninsula. Valdenebro et al. (2011) showed how O3 transport efficiency increased after the formation of accumulation layers of polluted air masses aloft, which can travel large distances within a stably stratified maritime boundary layer (MBL) or over the stable nocturnal surface boundary layer over land. The latter study demonstrated that transport from and to the Ebro and Douro valleys, both located in the IP, plays a main role in O3 episodes in the BC. Sáez de Cámara et al. (2018) documented the fact that O3 observations in background areas of the BC may have production and transport of local origin from surrounding areas during midday and a contribution from the arrival of polluted air masses in the afternoon during the accumulation and peak phases.
Past studies for WAI in Portugal showed typical temporal patterns with maximum mean monthly concentrations during spring and maximum hourly concentrations during summer (Pires et al., 2012). Concentrations are higher in inland and rural areas than in urban regions. However, O3 episodes, with concentrations above the thresholds defined for the protection of human health, also occur in urban regions. Several studies (Evtyugina et al., 2007; Monteiro et al., 2012, 2016) showed the importance of sea breeze circulation in the build-up of O3 episodes through the Portuguese coast, pointing to the importance of precursors emitted in coastal areas and O3 production along the transport towards inland areas. Hertig et al. (2020) showed that in Portugal the occurrence of O3 and heat wave events had the strongest relationship for eastern and northeastern inflow, highlighting the importance of the advection of O3 pollution from the continental parts of the Iberian Peninsula. In addition to the regular anthropogenic (e.g., traffic, industry, energy production) and biogenic (natural) sources, extraordinary events such as forest fires play an important role in the O3 episodes registered in Portugal (Adame et al., 2012).
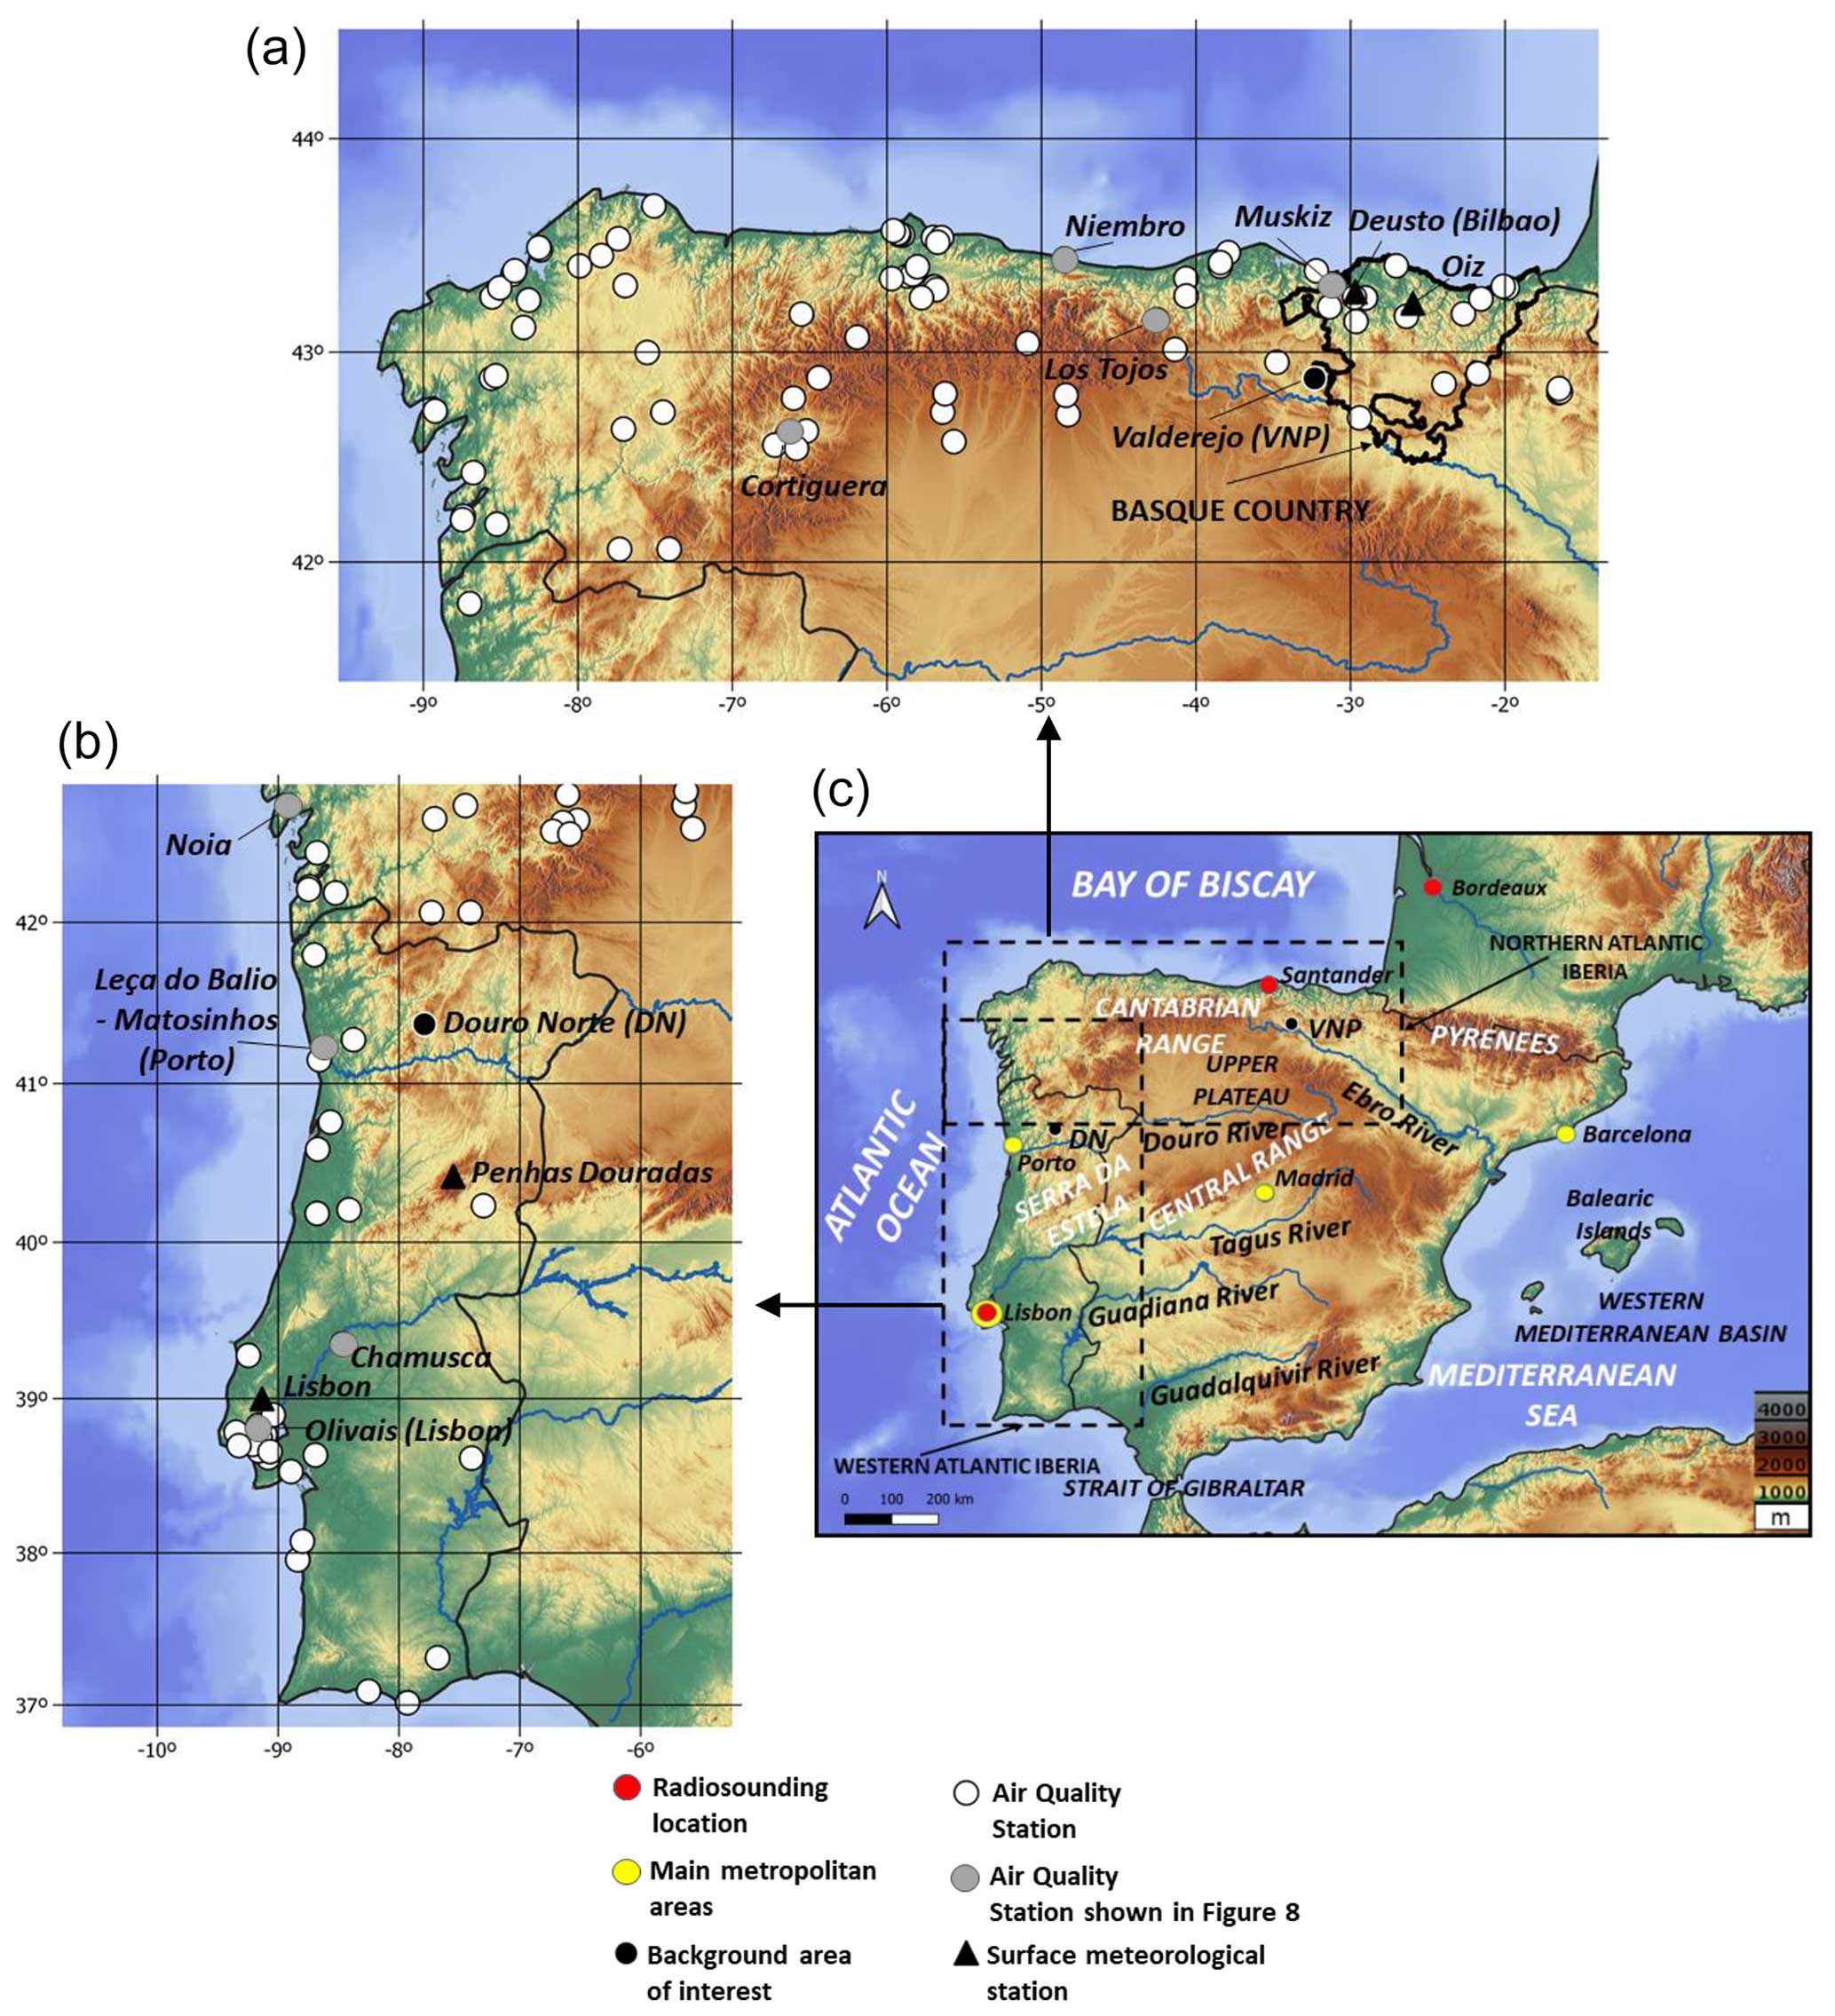
Figure 1Topographic map of the Iberian Peninsula (c): the territory delimited to the left towards the Atlantic Ocean is Portugal, to its right Spain, and to the north of the Pyrenees (France). (a) Northern Atlantic Iberia (NAI) and (b) western Atlantic Iberia (WAI).
In this article, for the first time and as far as the authors know, the tropospheric O3 problem is approached in an integral way for the Atlantic coast of IP. We have selected an O3 pollution episode lasting 5 d occurring from 2 to 6 August 2018 (see Sect. 3.3), which affected Spain and Portugal. This episode was characterized by a notable and simultaneous increase in O3 concentration levels across both the NAI and WAI regions during 2 August, high O3 concentrations during consecutive days until 6 August, and final dissipation on 7 August. We utilized the modeling system described in Sect. 2 to examine the local to inter-regional transport and accumulation of O3 within and between the two countries, as well as between these countries and the rest of Europe. Valdenebro et al. (2011) proposed the existence of a potential transport pathway for O3 and pollutants along the Atlantic axis of the Iberian Peninsula in NAI. This hypothesis, together with the fact that Spain and Portugal share three main air basins draining from central Iberia into the Atlantic, implies that the analysis should be carried out as a whole for the two regions: northern Atlantic Iberia (NAI) and western Atlantic Iberia (WAI), as shown in Fig. 1. We reveal how inter-regional transport of O3 is a key element in explaining the observed evolution of this episode.
1.1 Area description
The Iberian Peninsula, with Spain and Portugal, has a complex topography and numerous mountain ranges, with an average altitude among the highest in Europe. IP is surrounded by the Bay of Biscay to the north, the Mediterranean Sea to the east, the Mediterranean and Atlantic Ocean to the south where both meet through the Strait of Gibraltar, and by the Atlantic Ocean to the west (Fig. 1). It is separated from the European continent by the Pyrenees Mountain Range and a high central plateau largely occupies its surface. The rivers flowing into the sea produce numerous air basins and valleys that are decisive for studying atmospheric pollution due to their particular wind regimes.
To the north and parallel to the coast is the Cantabrian Range, with elevations of more than 2500 m a.s.l. (meters above sea level) in its central zone. This mountain range extends from west to east to the western end of the Pyrenees and separates the northern coast of the IP from the northern peninsular plateau. Basque Country is in the link between the northern coast of IP and the Pyrenees, with lower-altitude mountains, usually below 1500 m a.s.l. To the west of IP, in Portugal, there are two different areas: north of the Tagus River where mountainous areas also predominate and south with flatter landscapes and a few low mountains. Most of Portugal is below 400 m a.s.l., and the highest altitudes are in the Serra da Estrela, which forms a continuation of the Spanish Central System. Both countries share the valleys of the Douro, Tagus, and Guadiana rivers.
Over the last years, the highest O3 hourly averaged concentrations registered in NAI and WAI have been continuously measured in rural mountainous areas such as Valderejo Natural Park (VNP) station in the Basque Country (Spain) and Douro Norte (DN) station in Alvão Natural Park (Portugal). At both stations, O3 exceedances are numerous, and O3 levels are affected by primary pollutants (volatile organic compounds – VOCs; nitrogen oxides – NOx) emitted on their corresponding coastline that are transported inland due to the sea breeze circulation. Besides the contribution of local sources, the concentration profiles reflect the influence of atmospheric transport on a synoptic or regional scale (Evtyugina et al., 2009; Carvalho et al., 2010; Monteiro et al., 2012; Borrego et al., 2013, 2016; de Blas et al., 2019; Gómez et al., 2020). All these studies have analyzed various O3 episodes for specific regions of the Atlantic coast of IP. However, there is a lack of a common modeling and assessment methodology for the whole region. The mechanisms producing O3 episodes occurring simultaneously in the two subregions (NAI and WAI) of the Atlantic coast of IP are still in the process of being further documented.
1.2 Objectives
The main objective of this paper is to analyze a tropospheric O3 episode with a remarkable intensity over a large region, covering northern Atlantic Iberia (NAI) and western Atlantic Iberia (WAI), and to establish possible O3 inter-regional pathways between these regions and with the rest of the Iberian Peninsula and the European continent. For this purpose, we have established a methodology based on high-resolution meteorological and photochemical modeling to analyze the surface concentration and vertical distribution of O3. The presence of a permanent wind shear throughout the entire episode added special complexity and posed a challenge to the search for the origin of the observed O3 impact and the selection of the most appropriate reduction policies.
This paper is organized as follows: Sect. 2 describes the methodology employed, containing two subsections. Section 2.1. refers to the modeling system used and Sect. 2.2. the validation method. The results and discussion are presented in Sect. 3, divided into three subsections, analyzing the meteorology of the episode in Sect. 3.1, statistical evaluation in Sect. 3.2, and O3 concentrations in Sect. 3.3. Finally, in Sect. 4 we detail the conclusions of this study.
In recent years chemical transport models (CTMs) have been used to simulate and analyze short-duration pollution episodes in IP (Valverde et al., 2016; Escudero et al., 2019; Pay et al., 2019). The use of fine grids in models (with high horizontal spatial resolutions of 1–3 km) has given good results in environments with complex topography, where mesoscale processes become particularly relevant for the interpretation of the O3 production, accumulation, transport, and decay (Jiménez et al., 2006; Monteiro et al., 2012). High horizontal spatial resolution is also especially recommended when describing O3 variability in industrial and urban areas (Baldasano et al., 2011).
We have used a photochemical modeling system configuration, combining meteorological, emission, and photochemical simulations. Model execution (for initial and boundary conditions, among others) and validation require a variety of experimental data, all of them described throughout this section. Model results have been processed in order to analyze and represent vertical cross-sections of the atmosphere, and we have calculated integrated O3 concentrations from near-surface atmospheric levels up to 2500 m a.g.l. (meters above ground level), according to the atmospheric thickness above the surface at which O3 accumulates (Querol et al., 2018).
2.1 Simulations
2.1.1 Meteorology
The meteorological parameters required for air quality simulations were obtained using the Weather Research and Forecasting model (WRF) model version 3.9.1.1 (Skamarock et al., 2008) with a modeling period from 26 July to 9 August 2018. We defined three domains with different resolutions (Table 1) and Lambert conformal projection, as shown in Fig. 2, with the center of the coarser domain at 45° N and 2.5° W and with 50 and 35° N as true latitudes for the projection. The first grid (d01) extension covers a large part of the European continent and northern Africa with a 27 km horizontal resolution. This domain is intended to include large atmospheric circulations between the North Atlantic, the Mediterranean Sea, and northern Africa. It also includes important sources of atmospheric emissions located along the English Channel (United Kingdom, northern France, Belgium, and the Netherlands) and northern Africa (Gangoiti et al., 2006a). The second domain (d02), with a resolution of 9 km, incorporates the entire Iberian Peninsula, the south of France, and the coast of northern Africa. In this way, it can document the Atlantic fronts over the region, the summer anticyclones and associated mesoscale flows in the western Mediterranean Basin (Gangoiti et al., 2001, 2006b), and the flows developing in the Strait of Gibraltar (in't Veld et al., 2021; Massagué et al., 2021). We also included a third domain (d03), with a resolution of 3 km, covering the north of the Iberian Peninsula and the south of France, so that atmospheric flows developed over the Ebro and the Douro valleys could be represented with adequate detail. This third domain includes areas of special interest with O3 measuring reference stations for the analysis of inter-regional O3 transport (Navazo et al., 2008; de Blas et al., 2019; Gómez et al., 2020). We used 31 η layers covering up to approximately 15 500 m a.g.l. The vertical resolution near the boundary layer, at the surface, is greater than at higher levels, where the distance between layers increases (Table S1 in the Supplement).
Table 1Spatial characteristics of the domains used in WRF and CAMx.
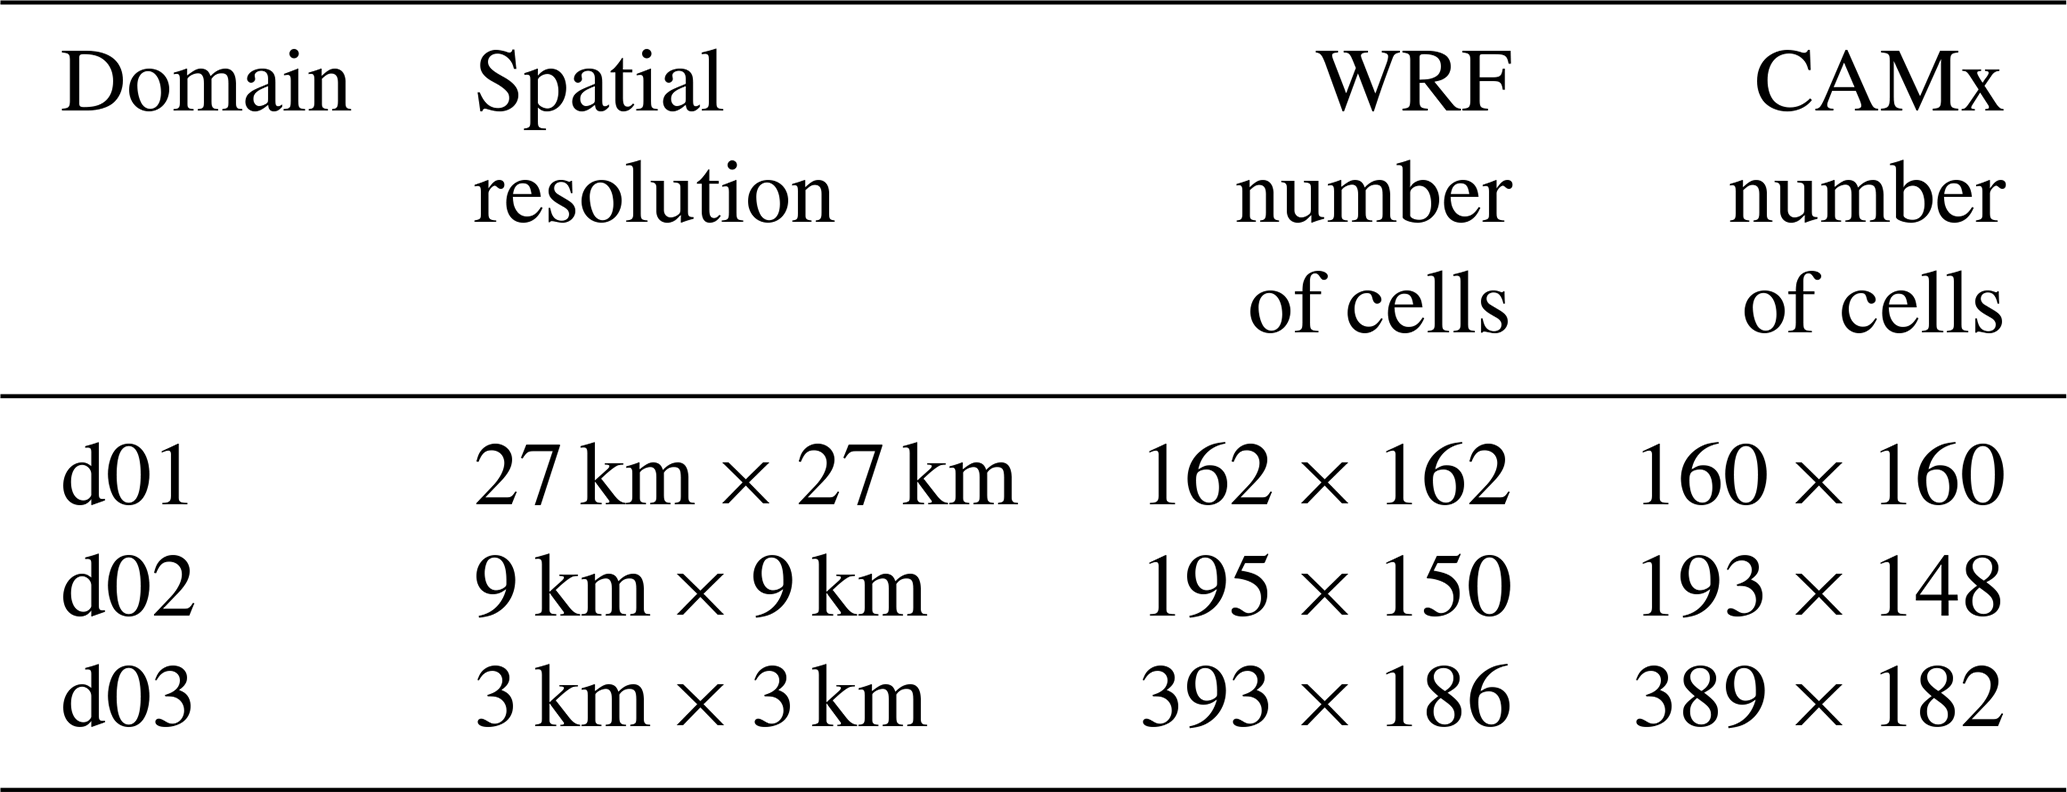
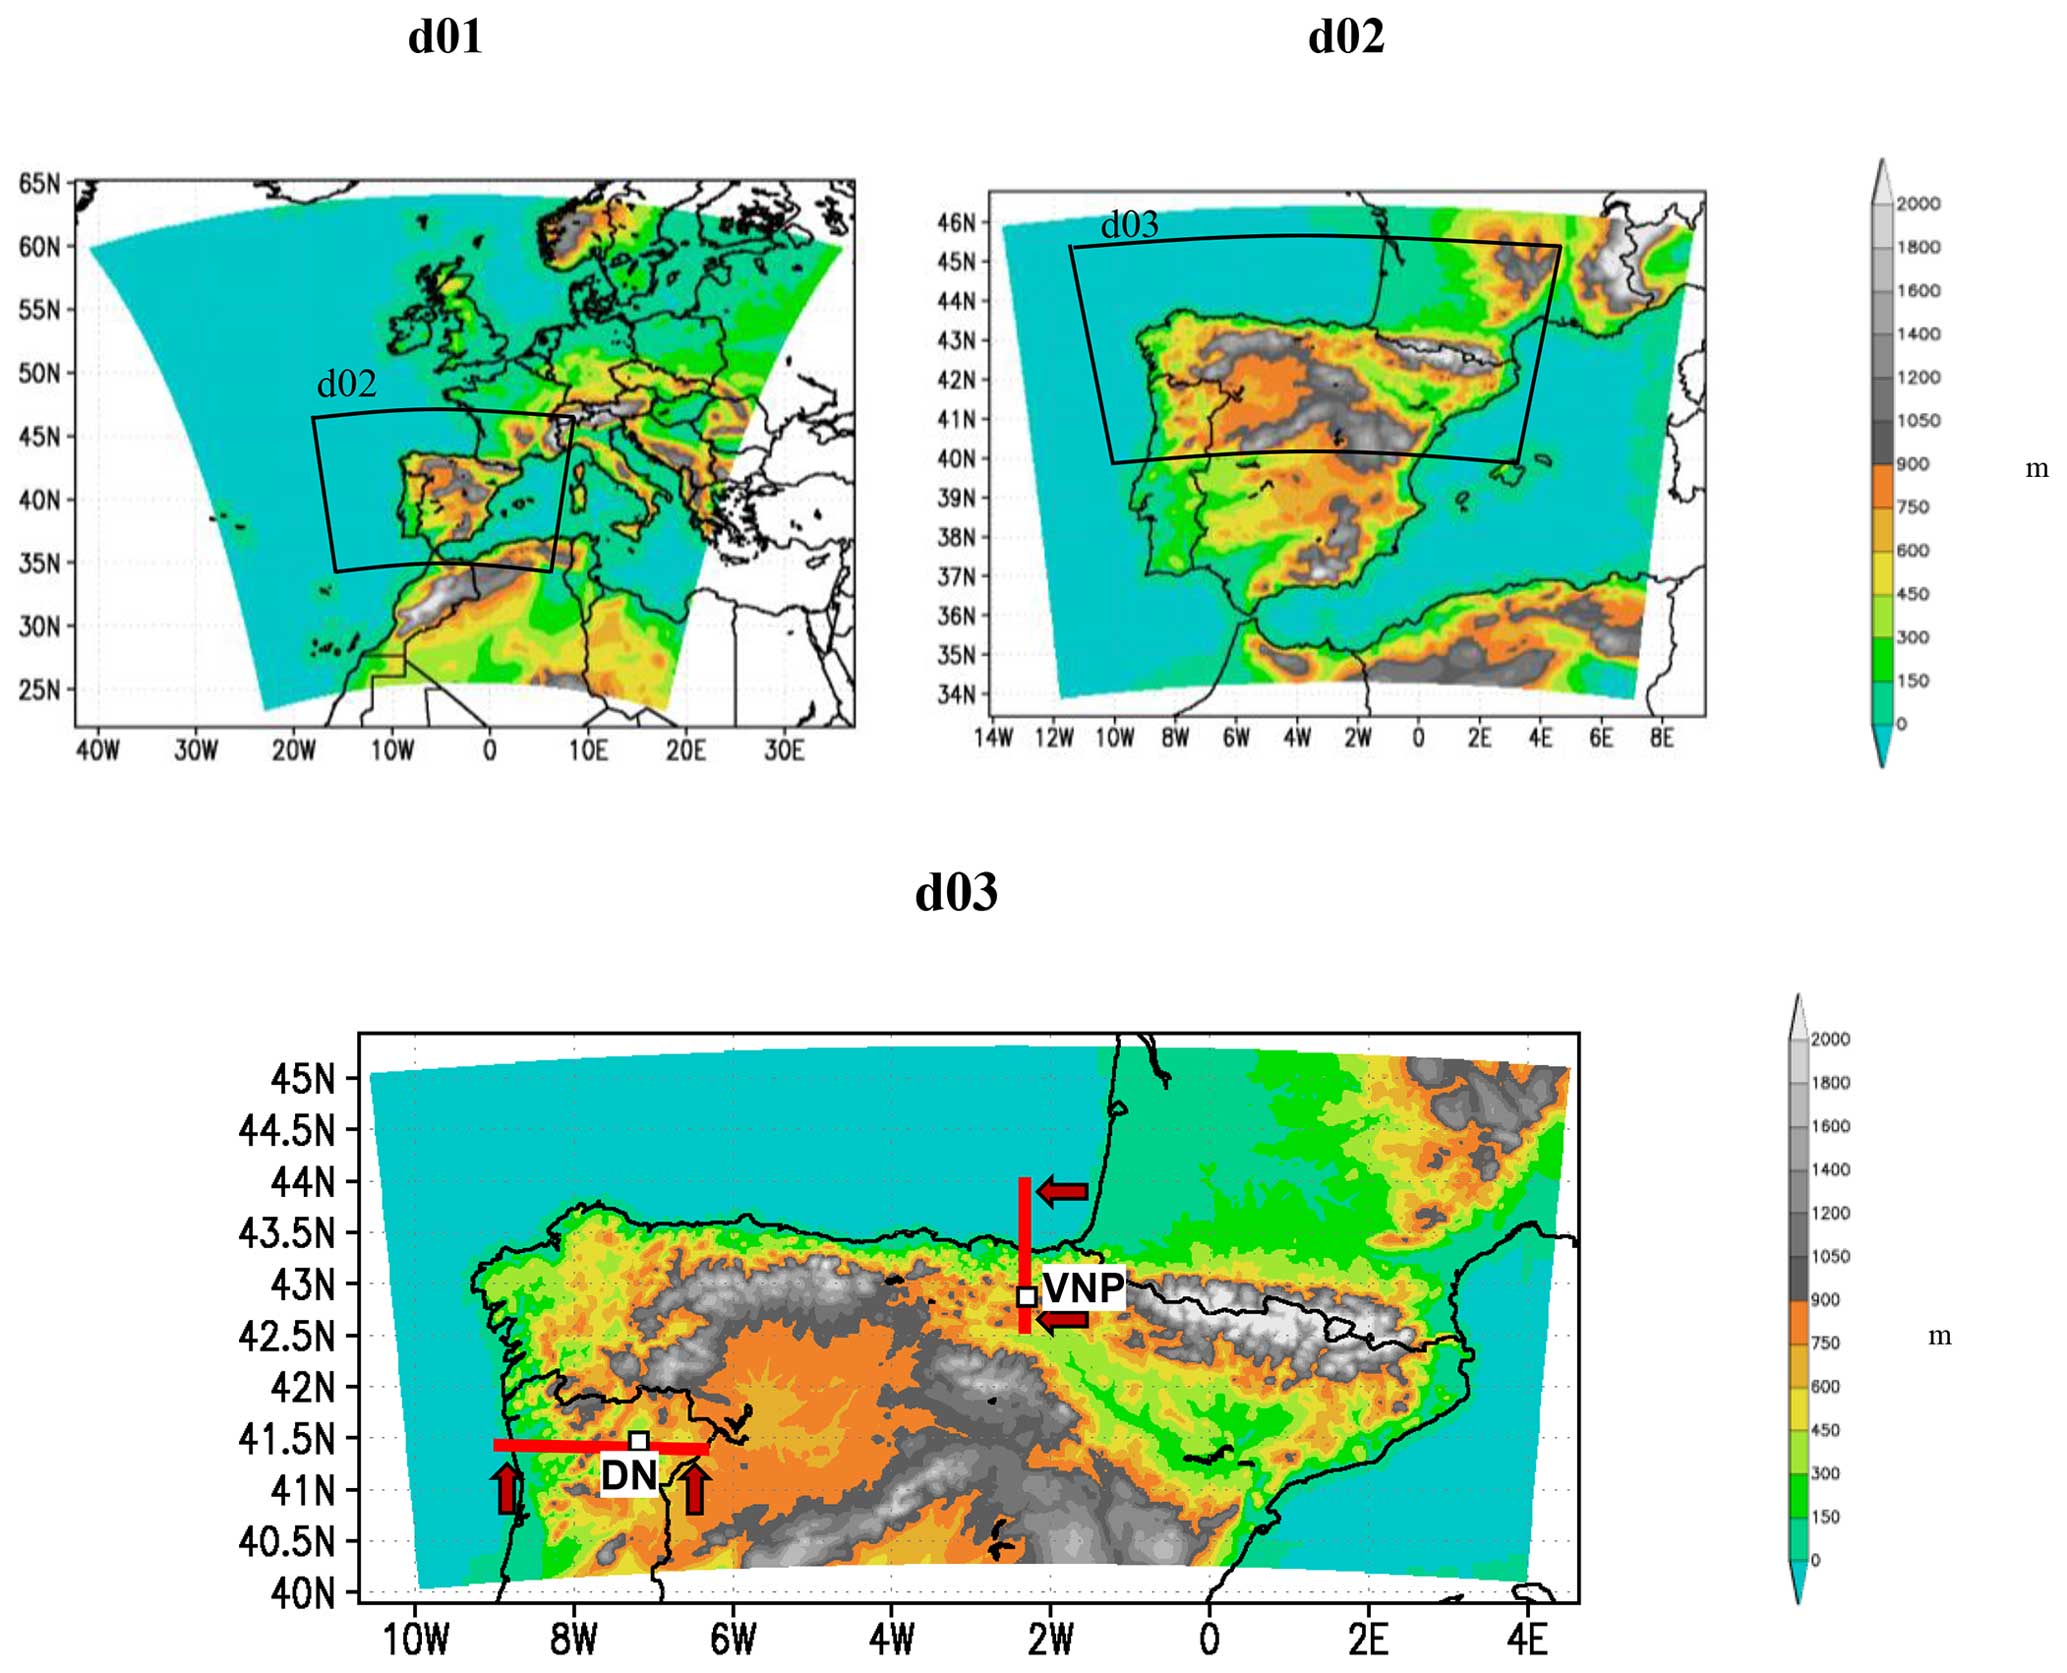
Figure 2Domains used for the meteorological and photochemical simulations on the topographic map: d01 (27 km) – Europe and North Africa, d02 (9 km) – Iberian Peninsula, d03 (3 km) – northern Iberian Peninsula. Red lines: location and extent of atmospheric vertical cross-sections analyzed in VNP and DN.
The physical parameterizations of the meteorological model are determinants when simulating air quality. In this study, we proposed a configuration already used by other studies in IP with satisfactory results (Borge et al., 2014; Escudero et al., 2019). Other studies, also carried out in IP (Pay et al., 2010; Borrego et al., 2013; Banks and Baldasano, 2016), have used similar parameterizations with changes in the configuration of the planetary boundary layer (PBL). The selected parameterization is shown in Table S2. It is mainly based on the configuration of Borge et al. (2008), modifying the longwave radiation scheme by the Rapid Radiative Transfer Model (RRTM) (Mlawer et al., 1997) as recommended by the WRF developers. Additionally, sea surface temperature (SST) supplied by NOAA has been used, specifically optimum interpolation SST (https://www.ncei.noaa.gov/products/optimum-interpolation-sst, last access: 28 March 2022), with a spatial resolution of 0.25° × 0.25° and a daily temporal resolution (Banzon et al., 2016).
Initial and boundary conditions were generated using 6 h reanalysis from the European Centre for Medium-Range Weather Forecasts (ECMWF), specifically ERA-Interim reanalysis global data (Berrisford et al., 2011) of 0.75° × 0.75° horizontal resolution. The vertical resolution is higher near the surface (every 25 hPa from 1000 to 700 hPa), decreasing for higher levels. We also used the same data for four-dimensional data assimilation (FDDA) above the PBL in the coarser domain (d01).
2.1.2 Photochemistry and dispersion
We used the Comprehensive Air Quality Model with Extensions (CAMx) version 6.50 (Ramboll Environment and Health, 2018). The domain and horizontal resolution selected for this air quality model were identical to those used for WRF model (see Table 1). We used 14 σ layers going up to approximately 4800 m a.g.l. with the first layer being approximately 20 m thick. Concentrations were calculated at the midpoint of each layer, so the modeled values of the first layer correspond to a height of approximately 10 m a.g.l., and the same applies to other layers. The different thicknesses of the layers and their correspondence with WRF layers are shown in Table S3.
The gas-phase mechanism CB6r4 was used in this work (Ramboll Environment and Health, 2018). For inorganic thermodynamics and gas–aerosol partitioning CAMx uses ISORROPIA (Nenes et al., 1998, 1999) and for dry deposition we chose the algorithm of Zhang et al. (2001, 2003). The O3 column data were obtained from the O3 Monitoring Instrument (OMI) of NASA's Total O3 Mapping Spectrometer (TOMS) satellite, which has a daily temporal resolution and a horizontal spatial resolution of 1° × 1° (available at https://acd-ext.gsfc.nasa.gov/anonftp/toms/omi/data/ozone/, last access: 28 March 2022). O3 column data were used in the tropospheric ultraviolet and visible (TUV) radiation and photolysis model used by CAMx: Dr. Madronich's preprocessor for CAMx calculates the photolysis rates for clear skies, and then CAMx internally adjusts these rates in the case of clouds or aerosols (NCAR, 2011). The initial and boundary conditions for the first domain (d01) were obtained from the global air quality model CESM2.1: CAM-Chem (Lamarque et al., 2012). We first ran the first domain (d01), and for the other two (d02 and d03) we used the BNDEXT CAMx preprocessing program to generate initial and boundary conditions extracted from d01. In the first simulation for d01, we extracted the following simulated pollutants' concentrations to generate d02's initial and boundary conditions: O3, NO, NO2, SO2, OH•, HO, H2O2 (hydrogen peroxide), CO, CH4, ethane, ethene, ethyne, propane, formaldehyde, isoprene, monoterpenes, benzene, toluene and other monoalkyl aromatics, xylene and other polyalkyl aromatics, HNO3, HONO (nitrous acid), PAN (peroxyacil nitrate), and NO.
The CAMx domain configuration was the same as that used in WRF (Fig. 2), as were type of projection, their central points, and reference latitudes. However, a slight reduction of dimensions was necessary for its correct usability in CAMx due to the way CAMx domains are configured and to the limitation imposed by some emission models such as the Model of Emissions of Gases and Aerosols from Nature (MEGAN). Also, for CAMx to properly solve the boundary conditions of the nested domains, some cells, denominated as buffer cells, were added at the outer edges around the perimeter of each domain.
CAMx incorporates the WRFCAMX preprocessor version 4.6, which transforms the WRF meteorological variable fields into the specific meteorological variables required by CAMx. We chose to run this program with the YSU scheme of the PBL (Hong et al., 2006) to be consistent with the PBL configuration used in WRF.
2.1.3 Emissions
We used the Model of Emissions of Gases and Aerosols from Nature (MEGAN) (Guenther et al., 2006, 2012), an empirical model of biogenic emissions most widely used by the scientific community for the calculation of VOCs from vegetation (Sindelarova et al., 2014). The new version (MEGAN 3.0) includes a processor for calculating emission factors (EFs) for different species for the first time, where the user may incorporate custom high-spatial-resolution EF databases from specific vegetation data. This processor contains a wide selection of EFs for more than 42 500 species types based on the available databases (Guenther, 2017).
MEGAN requires as input for the biogenic emissions estimation for the different domains used in the CAMx simulation a meteorological simulation, a leaf area index (LAI) spatial distribution, and EF spatial distributions. We incorporated meteorological data calculated by WRF into MEGAN 3.0 through the Meteorology–Chemistry Interface Processor (MCIP) tool (Otte and Pleim, 2010) using the preprocessors included in this new version of MEGAN to calculate EF, but we improved it by updating Spanish land use and vegetation map databases from the National Forest Inventory (Torre-Pascual et al., 2021). Of the existing global LAI products, we chose the one generated by the Moderate Resolution Imaging Spectroradiometer (or MODIS) instrument of NASA's Aqua and Terra satellites (Myneni et al., 2002; Yang et al., 2006). The wide use of this product is due to its high spatial resolution (1 km × 1 km), high temporal resolution (every 8 d), and frequent updating (Yuan et al., 2011). However, the instrument shows uncertainties due to cloudiness and seasonal snow cover, and current MODIS LAI products are spatially and temporally discontinuous and inconsistent (Zuazo et al., 2023). Thus, we used the 2010 reprocessed MODIS LAI by Yuan et al. (2011) instead of the one for 2018 because it was not available at the time of this study.
We used the Emission Database for Global Atmospheric Research (EDGAR) global anthropogenic emission inventory (Crippa et al., 2018) version 4.3.2, published in December 2017. EDGAR contains anthropogenic emissions from the European and African continents, which fit the extension of the main domain (d01) with a high spatial (0.1° × 0.1°) and temporal resolution (monthly averages for 2010) for the whole area. We selected the most relevant compounds for the analysis of tropospheric O3 pollution episodes, specifically CO, NH3, non-methane volatile organic compounds (NMVOCs), NOx, SO2, and CH4. Emissions due to aviation have been excluded, except for landings and take-offs, as they do not originate near the surface and can be expected to have little influence on surface and near-surface O3. We used the SPECIATE tool (U.S. EPA, 2016) to speciate NOx and NMVOC.
Emissions in EDGAR's inventory are classified according to their origin following the Convention on Long-Range Transboundary Air Pollution (CLRTAP) – Nomenclature for Reporting (NFR) sectors (Janssens-Maenhout et al., 2019). We performed the daily and hourly temporal distribution of emissions using the temporal distribution coefficients in the LOTOS-EUROS CTM (Denier van der Gon et al., 2011). LOTOS-EUROS temporal profiles were defined for SNAP (Selected Nomenclature for Sources of Air Pollution) sectors contemplated in the CORINAIR/EMEP methodology (EEA, 2016). Therefore, we regrouped the latter sectors based on the NFR-SNAP mapping table (https://www.ceip.at/fileadmin/inhalte/ceip/00_pdf_other/nfr09_snap_gnfr.pdf, last access: 20 March 2024). We used the Sparse Matrix Operator Kernel Emission (SMOKE) model (https://www.cmascenter.org/smoke/, last access: 20 March 2024) for spatial disaggregation and adaptation for the domains, temporal disaggregation, and pollutant speciation.
2.2 Validation
To validate the WRF–CAMx simulation, we combined the analysis of the modeling results with the assessment of meteorological reanalysis, in particular ERA5 reanalysis, meteorological observations, and O3 measured concentrations. This allowed us to verify the model's performance with experimental data, not only at the surface level but also at upper levels. For comparison with experimental data, we have preferentially taken the higher-spatial-resolution outputs of the simulations.
2.2.1 ERA5 hourly reanalysis
We have taken as a reference for validating the meteorological simulation the ERA5 reanalysis. ECMWF released a new, improved meteorological reanalysis, namely ERA5 (Hersbach et al., 2023, 2020), with a higher spatial resolution (0.25° × 0.25°) and higher temporal resolution (hourly) than ERA-Interim. Due to the difficulty in collecting meteorological observation data and the unreliability of some of the data found, we have decided to use ERA5 reanalysis as a main reference, in addition to the selection of four meteorological stations that we mention afterward, since it incorporates most of the official meteorological measurements made for this region. We have compared ERA5 surface temperature and winds (surface and 750 hPa) with the WRF simulation. With all this information, we have performed qualitative comparisons for a proper understanding of the episode. In addition, we have examined the visible channel images from the Meteosat satellite, available on NOAA's Global ISCCP B1 Browse System (Knapp, 2008), shown in Fig. S1, for evaluating cloudiness and the synoptic evolution during the episode.
2.2.2 Surface and upper-air meteorological observations
Among the meteorological observational data, we have compared radiosonde data from Lisbon, Santander, and Bordeaux (locations shown in Fig. 1) with the WRF simulation, allowing us to evaluate the atmospheric evolution at different altitudes throughout the episode. We gathered radiosonde data from the database of the University of Wyoming (http://weather.uwyo.edu/upperair/bufrraob.shtml, last access: 28 March 2022), as it has an extensive compilation of all radiosoundings conducted globally.
We compiled surface observation data from two stations of the Basque Meteorological Network (EUSKALMET), one of them located in Bilbao (Deusto) at sea level and another one in Oiz at 998 m a.s.l. (Fig. 1). For Portugal, we collected data from two stations from the Global Hourly–Integrated Surface Database (ISD) of the NCEI (https://www.ncei.noaa.gov/products/land-based-station/integrated-surface-database, last access: 28 March 2022), one in Lisbon at sea level and the other in Penhas Douradas at 1398 m a.s.l.
2.2.3 Surface O3 measurements
To analyze air quality in the IP study area, we used surface observation data of hourly O3 concentrations for Spain and Portugal. The database from Spain is available at the MITECO website (https://www.miteco.gob.es/es/calidad-y-evaluacion-ambiental/temas/atmosfera-y-calidad-del-aire/calidad-del-aire/evaluacion-datos/datos/Datos_oficiales_2018.aspx, last access: 28 March 2022), which groups all the data from the air quality networks of the autonomous communities, and for Portugal from its Air Quality Network (https://qualar.apambiente.pt/, last access: 1 May 2021) provided by the Agência Portuguesa do Ambiente. For the statistical analysis of the two regions analyzed in this paper, we have selected the stations in NAI from the Spanish database shown in Fig. 1 and for WAI all the stations from the Portuguese database.
2.2.4 Statistical evaluation of simulated O3 concentrations
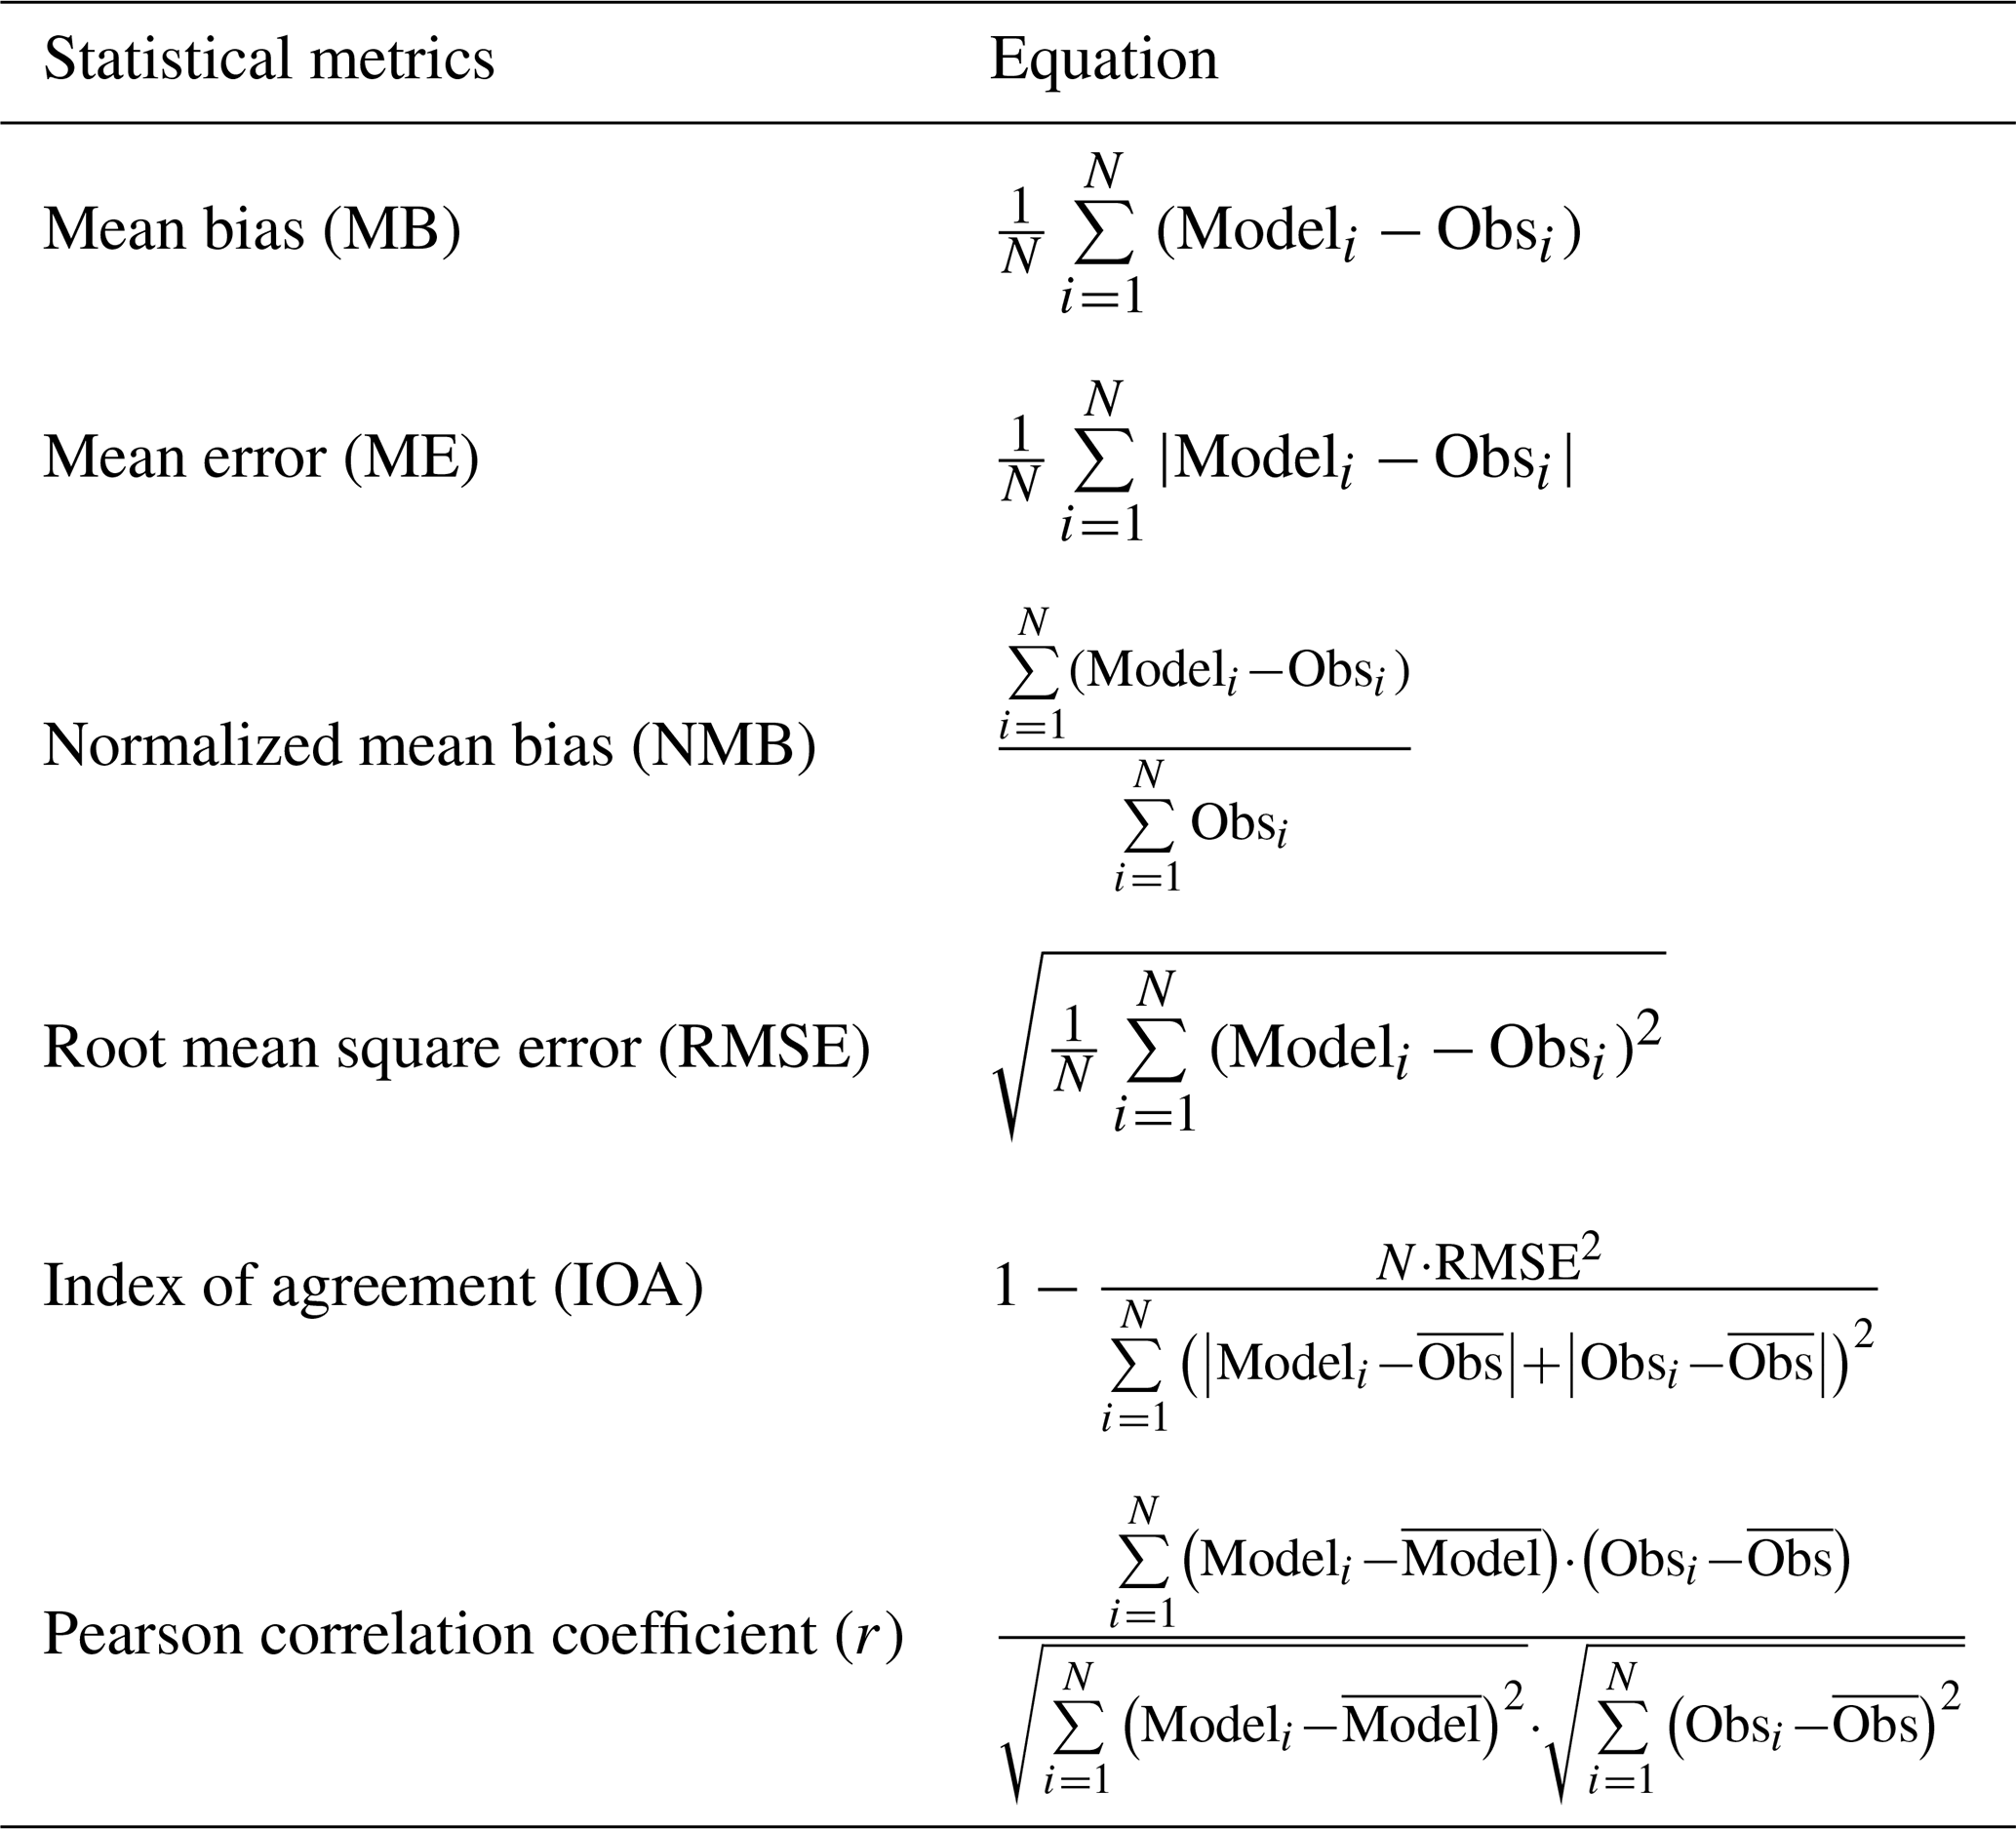
The uncertainty associated with the models is determined by comparing the experimental data (measurements) and the results of their simulations. Several studies have developed different methodologies and there is currently no standardized methodology for this purpose (Borrego et al., 2008). In recent years, the use of a series of statistical indicators has prevailed in the scientific references (Bessagnet et al., 2016; Oikonomakis et al., 2018). In this work, we have chosen to use a set of metrics commonly employed by the aforementioned studies described in Table 2. This has allowed us to compare the metrics used here with the work of other authors. We carried out this evaluation for the selected stations shown in Fig. 1 for NAI and WAI, also shown with their coordinates in Tables S4 and S5.
Table 2Statistical metrics used for the photochemical simulation.
First, we have evaluated the results of the meteorological model as they determine the performance of the photochemical model. Secondly, we have assessed the performance of the simulated O3 concentrations by CAMx with its statistical analysis, contrasting with observations. At the end of this section, we have analyzed the evolution of the episode from CAMx results and observations of O3 concentrations.
3.1 Meteorology
The 6-hourly NCEP Climate Forecast System Reanalysis (CFSR) historical archive in Wetterzentrale (http://www.wetterzentrale.de/, last access: 20 March 2024) and the ERA5 reanalysis are used to describe synoptic meteorology. Surface and upper-air meteorological observations from a set of stations (Sect. 2.2) are also discussed in this section in the context of the different scales of the meteorological processes working together during the episode and the eventual adequacy of the response of the WRF model to the observed meteorology.
3.1.1 Synoptic analysis and upper-level winds
Following the NOAA NCEP Climate Forecast System Reanalysis (CFSR) (Saha et al., 2014), the synoptic conditions during the O3 episode (2–6 August 2018) (Fig. 3) were characterized by a large upper-level ridge which extended from northern Africa to western Europe crossing the Iberian Peninsula and an associated large area of surface high pressures. The surface anticyclone covered the whole European Atlantic coast from Scandinavia to Iberia. This pressure distribution is compatible with east to northeasterly winds at surface levels following the coast along the European Atlantic and warm southerlies at upper levels over IP, which bring vertical stability and adequate conditions for O3 episodes (“accumulation periods”) in central Iberia (Querol et al., 2018). The easterly winds in the marine boundary layer of the northern coast of Spain and the sea breeze inland convergences are behind most of the O3 episodes in the Basque Country (Gangoiti et al., 2006a). These episodes, though less intense, even occurred during the COVID-19 lockdown period after a significant reduction of anthropogenic precursors (Gangoiti et al., 2021), and they were attributed to O3 importation across southern France and the Bay of Biscay.
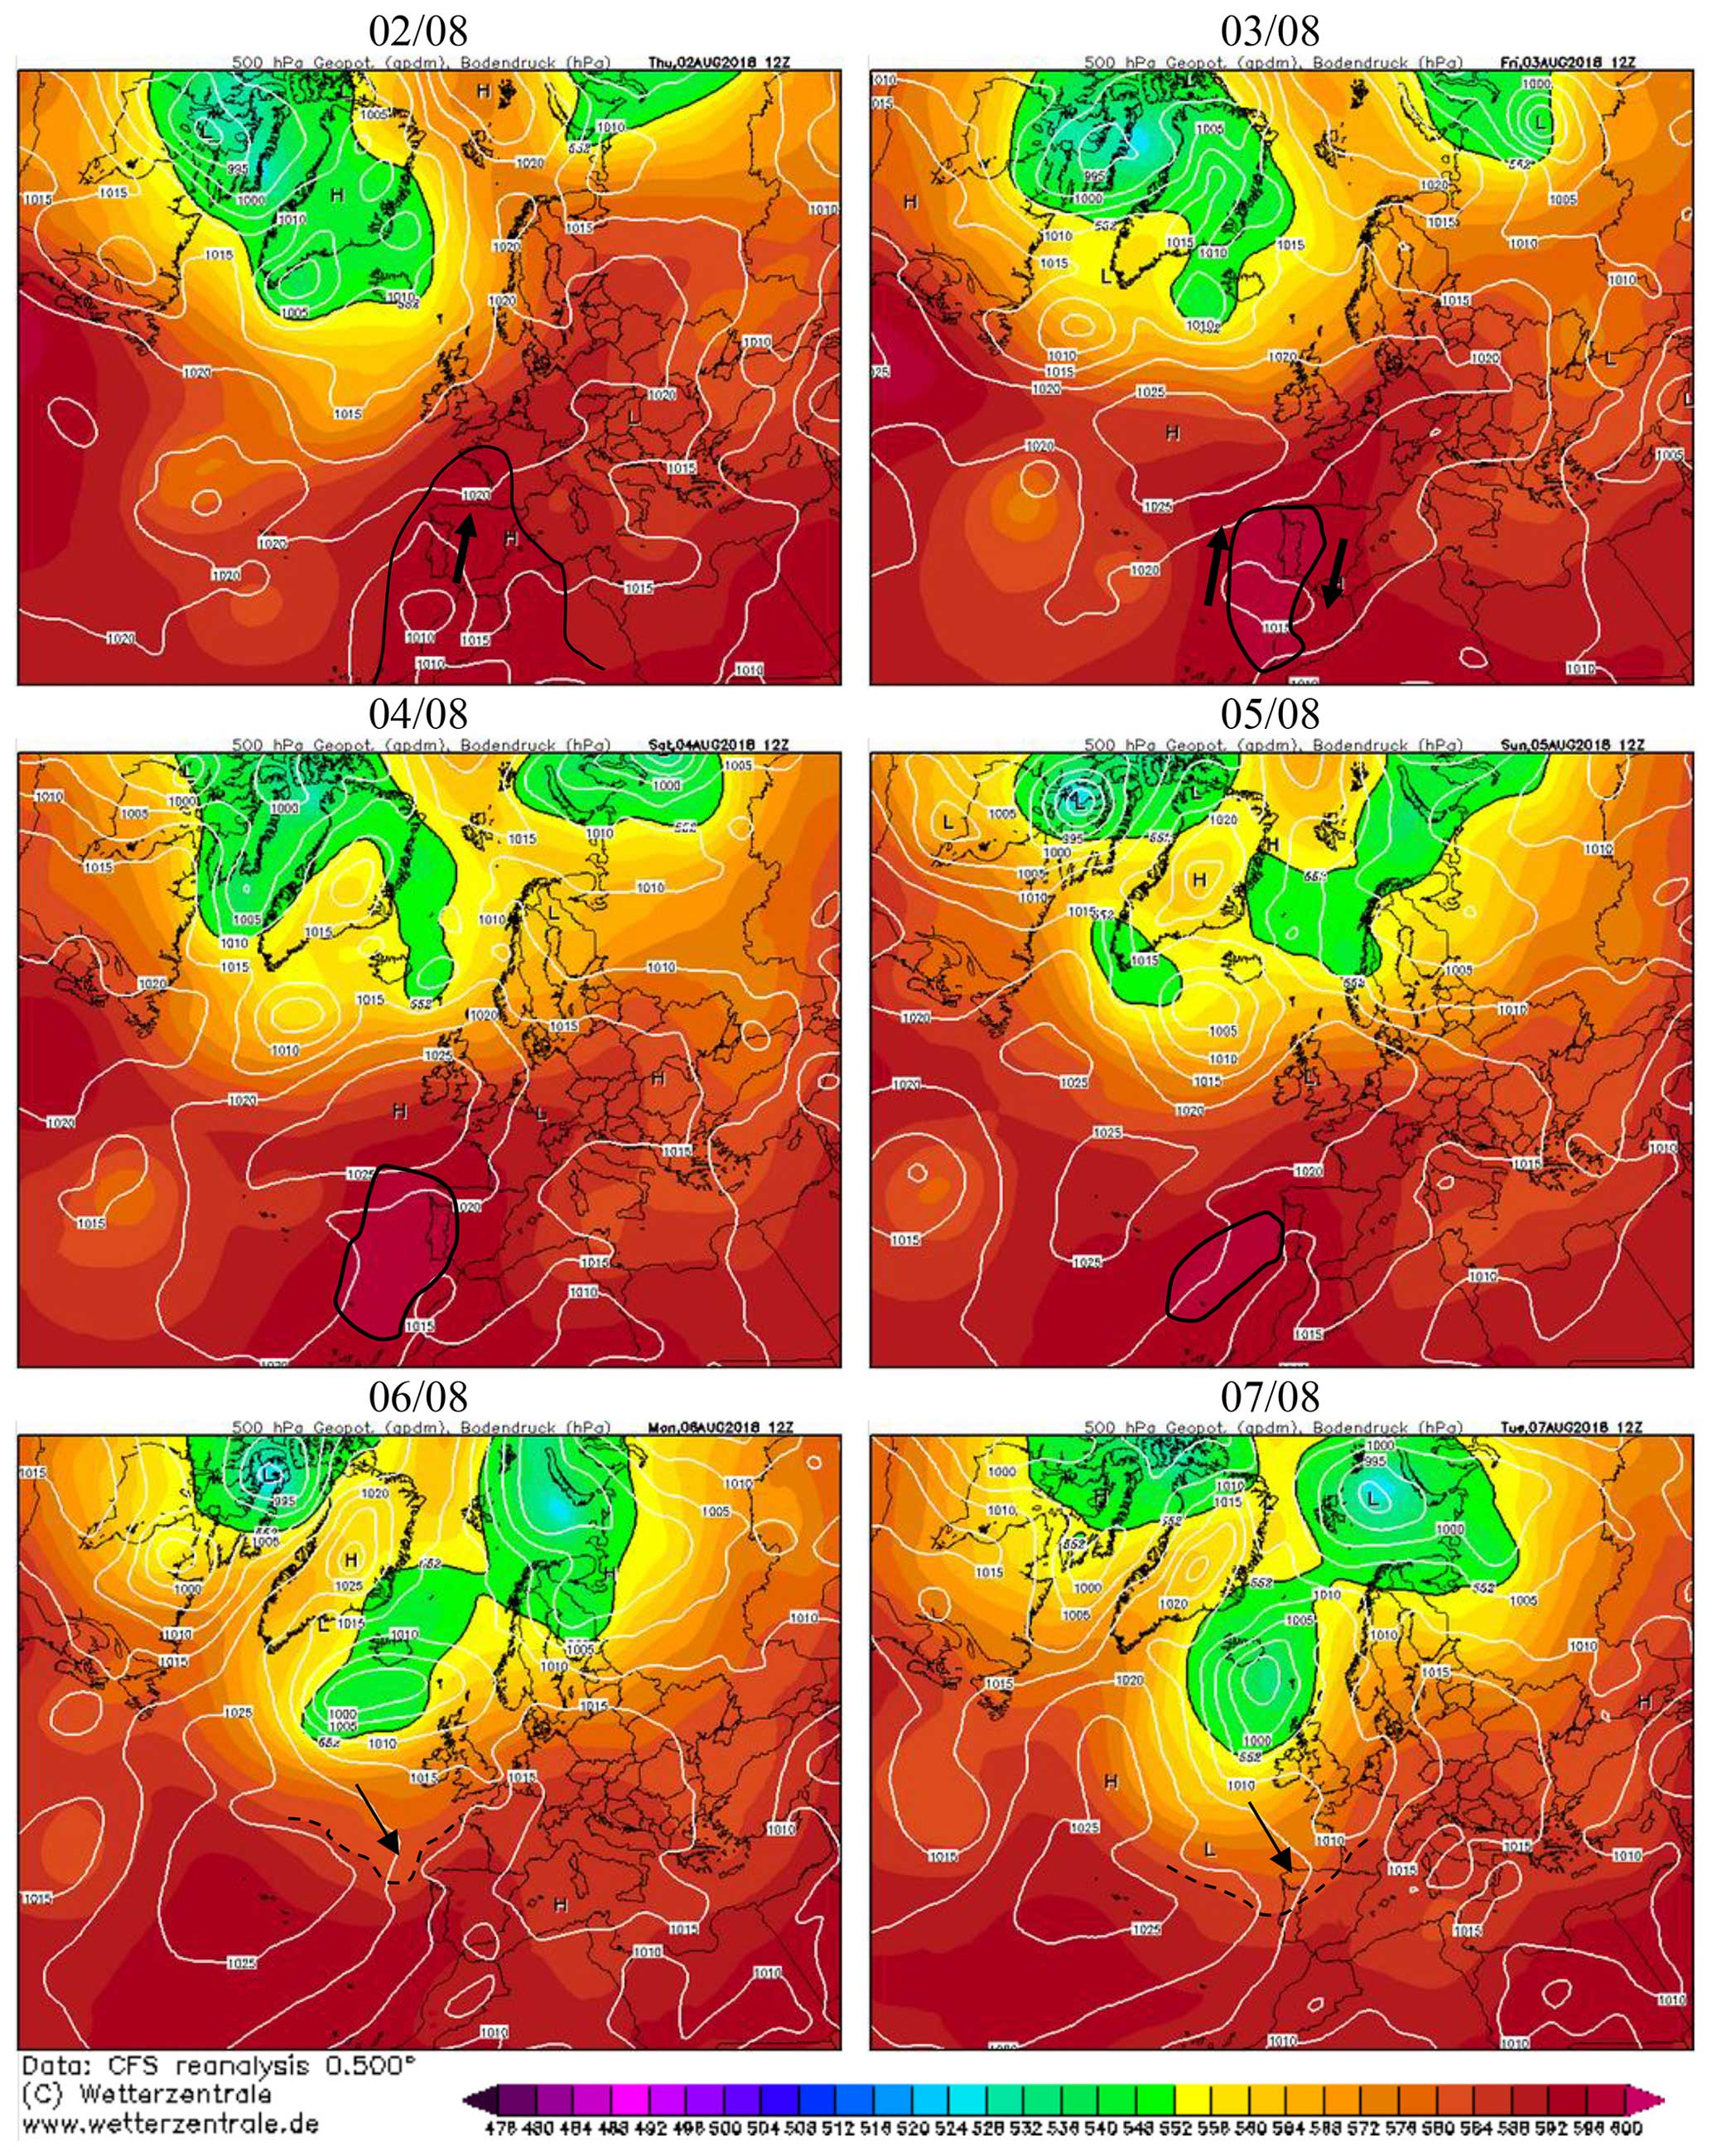
Figure 3Synoptic conditions during the O3 episode with geopotential height at 500 hPa (geopotential dm, shaded) and surface pressure (hPa, contours) during the period of the high-ozone episode (2–7 August). L and H mean “low-pressure center” and “high-pressure center”, respectively. Continuous black lines represent the warmer air mass over the IP and dashed black lines represent the Atlantic advection. Source: NCEP CFS reanalysis from http://www.wetterzentrale.de (last access: 20 March 2024).
The ERA5 reanalysis at the surface and upper levels shows a more detailed wind field distribution and time evolution during the initiation of the episode (Fig. S2). Easterly winds in the Bay of Biscay and the northerlies at the coast of Portugal (Fig. S2a.1 and b.1) in the marine boundary layer were decoupled from the relatively warm winds at upper levels (Fig. S2a.2 and b.2). That air mass circulated anticyclonically around IP, a fact that could hardly be inferred from the CFS reanalysis in Fig. 3, forcing moderate southerlies over WAI, weak westerlies over NAI, and almost calm conditions over the SW coast of France on 2 August (Fig. S2a.2). That meant a maximum wind directional shear of 180° in both WAI and NAI regions. This type of upper-air anticyclonic circulations seems to be a key component of the northern African middle-troposphere wind regime, which is behind the desert dust transport accumulation and redistribution in the region (Gangoiti et al., 2006b). From 3 August onwards, there was a change in the wind field at upper levels, registered by the ERA5 reanalysis: the warm air mass circulating at upper levels moved to the west, and the wind turned to the N over the eastern half of IP. That completely changed the atmospheric circulation at those levels, with the NAI being opened to the entry of air masses of European origin, while the circulation pattern remained from the south over a larger part of the coastal WAI and from the NE over southern Portugal (Fig. S2b.2). However, these changes were not observed at the surface level: at the Atlantic coast of IP, surface winds did not show significant changes from the previous day (Fig. S2b.1). The new wind configuration at surface and upper levels over WAI, which lasted for the rest of the O3 episode, was more similar to those described in Gangoiti et al. (2006a) and Valdenebro et al. (2011) for the northern coast.
The end of the episode started on 6 August with the development of an upper-level trough associated with a midlatitude depression to the south of Iceland (Fig. 3). The trough, marked with a black arrow in the figure, extended to NW Iberia and forced a surface (and upper level) cold air mass advection from the northwest with a frontal region (dashed line in Fig. 3), which crossed NAI and WAI during the following 24 h. The ERA5 wind and temperature data in Fig. S3 show the observed changes during the frontal passage: the west and northwesterly wind advection started on 6 August (Fig. S3a.1 and a.2) and moved to the west during the following day, with westerlies at the surface and intense southwesterlies at upper levels (Fig. S3b.1 and b.2). A similar wind field distribution has been estimated by the WRF simulation during the whole episode at both surface and upper levels, shown in Sect. 3.3, in the context of the simulated inter-regional O3 transport and distribution.
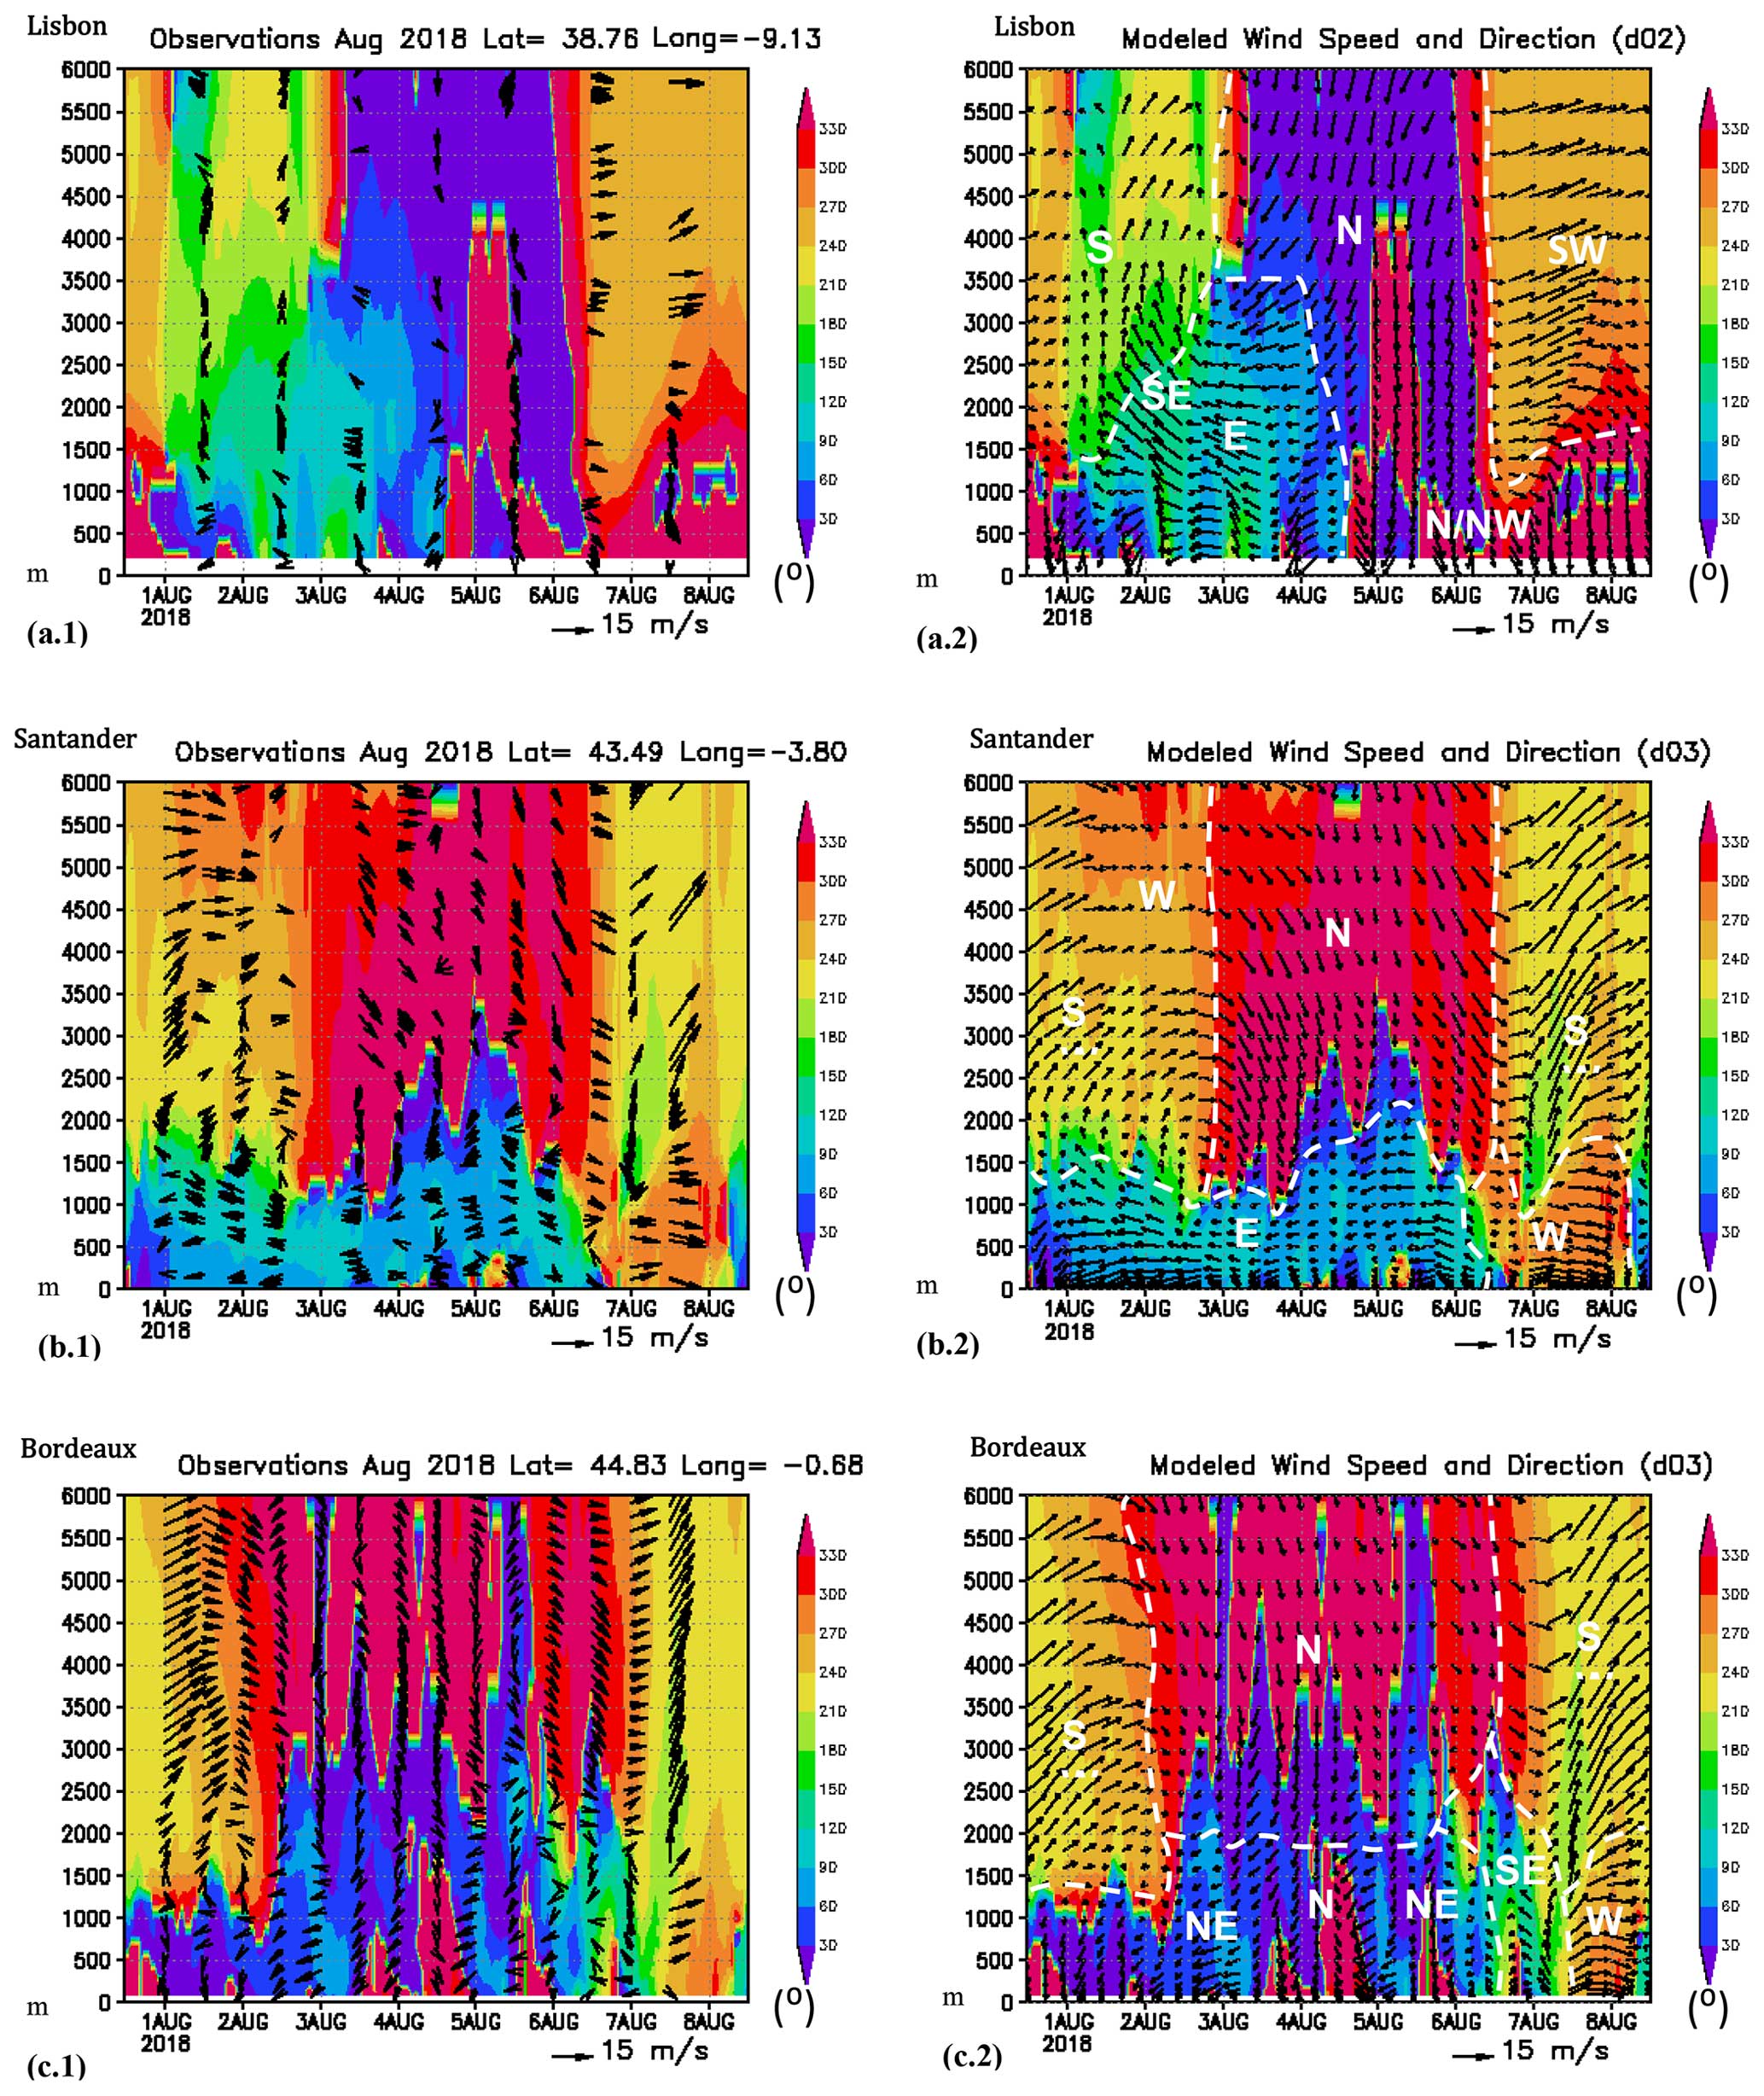
Figure 4Wind vectors measured in radiosonde (a.1–c.1) and WRF simulations (a.2–c.2) for the period 1–8 August 2018. The range of colors in all graphics represents the simulated wind direction. The size of the vectors represents wind speed.
Radiosonde wind data and WRF simulated vertical profiles at three sounding sites (Lisbon, Santander, and Bordeaux) of WAI and NAI are represented in Fig. 4 for the “extended” O3 episode (1–8 August 2018). Observations (left) and modeled vertical winds (right) agree and correspond to the surface and upper-air wind field reanalysis described above. During the initiation of the episode (1–2 August) southerly winds (SW at Santander and Bordeaux, SE in Lisbon) blew above 1500–2000 m a.s.l., decoupled from the easterlies at the surface (below 1000–1500 m a.s.l.). The following changes in the wind field at upper levels, registered by the reanalysis during the period 3–6 August, are represented by the northerlies above 1500–2000 m a.s.l. (Santander and Bordeaux) and the easterlies backing to the north (Lisbon), depicted in Fig. 4. These changes correspond to the westward displacement of the anticyclonic circulation at upper levels. The cold front passage at the end of the episode is represented in Fig. 4 by the surface northwesterlies backing to the SW with height, initiated during the afternoon of 6 August in Lisbon and Santander and on 7 August in Bordeaux.
3.1.2 Surface temperature and winds
Figures S4 and S5 show the sequence of temperatures and wind observations (red) as well as WRF simulations (blue) at the two selected surface meteorological stations in NAI during the extended O3 episode (1–8 August 2018). They document the meteorological conditions at a sea-level coastal station (Deusto) and at an elevated inland site (Mount Oiz). Deusto is located in the city of Bilbao, in a coastal valley with SE–NW orientation, draining directly into the sea along a 10 km long estuary. Thus, the land–sea breeze regime at this station is represented with successive channeled land (S and SE) and sea (N-NW) daily wind cycles (Fig. S4). We have observed a pronounced diurnal variability in observed wind speed compared with the model; this difference may affect the extent of the simulated emitted O3 precursors' dispersion with these wind cycles. The coastal convergence contrasts with the meteorological conditions at the inland station (Fig. S5), which was not affected by sea breeze regimes. The wind sequence in Mount Oiz is more similar to the upper-air observations at around 1000 m a.s.l. over the Santander sounding site (Fig. 4), located 100 km to the west on the northern coast. The simulations follow main temperature and wind shifts during the episode at both stations. Two main changes can be distinguished in Fig. S5.
-
During the first day of the episode, the southeasterly winds changed to the northeast, concurrent with the observed changes in the upper-level anticyclonic circulation described above and persisted during the rest of the O3 episode. The simultaneous documented convergence of the coastal sea breeze regimes shown in Fig. S4 (transporting local emissions) together with the E–W transport, in the marine boundary layer of O3 and precursors originated further away to the east was responsible for the observed O3 concentrations in the inland monitors during that period, as discussed in the next section.
-
During the last day of the episode (6 August), intense southwesterly prefrontals preceded the arrival of the cold front (NW in Fig. S5) at the end of the day in Mount Oiz. Those warm (30 °C) offshore prefrontals, registered at Mount Oiz at around 1000 m a.s.l., increased the temperature at the coastal stations (37 °C in Deusto at midday), when the upper-level southerlies were coupled with the surface winds at the lee of the coastal mountain ranges, as was the case during the foehn episode on the Basque coast. In correspondence with the coastal station records (Fig. S4), the sea breeze was able to develop against the offshore winds during the afternoon, while the prefrontal southwesterlies still kept blowing above the coastal sea breeze and on top of the inland mountain stations, such as Mount Oiz (Fig. S5).
Figures S6 and S7 show a similar sequence (as in Figs. S4 and S5) of temperatures and wind observations as well as simulations for two meteorological surface stations in WAI. Similar to the NAI site selection, they document the meteorological conditions at a sea-level coastal station (Lisbon) and at an elevated inland site (Penhas Douradas, 1398 m a.s.l.). The simulations also follow the main temperature and wind shifts during the period at both stations. The land–sea breeze regime in Lisbon was represented with successive land (E and NE) and sea (NW) daily wind cycles (Fig. S6). As for the case of the NAI stations, the sites showed a completely different behavior, mainly due to the observed decoupling between the upper- and lower-level flows. Sea breeze cycles were observed at the coastal station in Fig. S6, which persist during the whole episode. On the contrary, initial southeasterly winds in Penhas Douradas (Fig. S7), in agreement with the upper-level anticyclonic circulation, changed to the north and northwest, according to the observed synoptic changes (Fig. S2) and the vertical soundings in Lisbon (Fig. 4) between 1000 and 1500 m a.s.l. During the last day of the episode (6 August), a temperature decrease of 10–15 °C and intense and persistent northwesterly winds (without cycles) at both stations (Figs. S6 and S7) marked the cold front advection before midday, preceding the changes observed at the NAI stations.
3.2 Statistical evaluation of simulated O3 concentrations
We have calculated the statistical metrics shown in Table 2 for 116 O3 measurement stations for the period from 1 to 7 August 2018. All these stations meet the criterion of data availability of more than 95 % of hourly O3 concentrations. Of the total number of stations, 83 are located in Spain in NAI, and the remaining 33 are located in Portugal in WAI. The dispersion of the individual metrics is shown in Fig. S8. The median Pearson correlation coefficient (r) for all the stations was 0.66 and the median index of agreement (IOA) was 0.70. The CAMx model tends to overestimate O3 concentrations for this region, as shown by the box-and-whisker plots of the mean bias (MB): the interquartile values, from the 25th percentile to the 75th percentile, are all positive. The median mean bias (MB) is +14.0 µg m−3 and the median mean error (ME) is 24.0 µg m−3. The calculated statistical parameters are within the range of values found in similar studies.
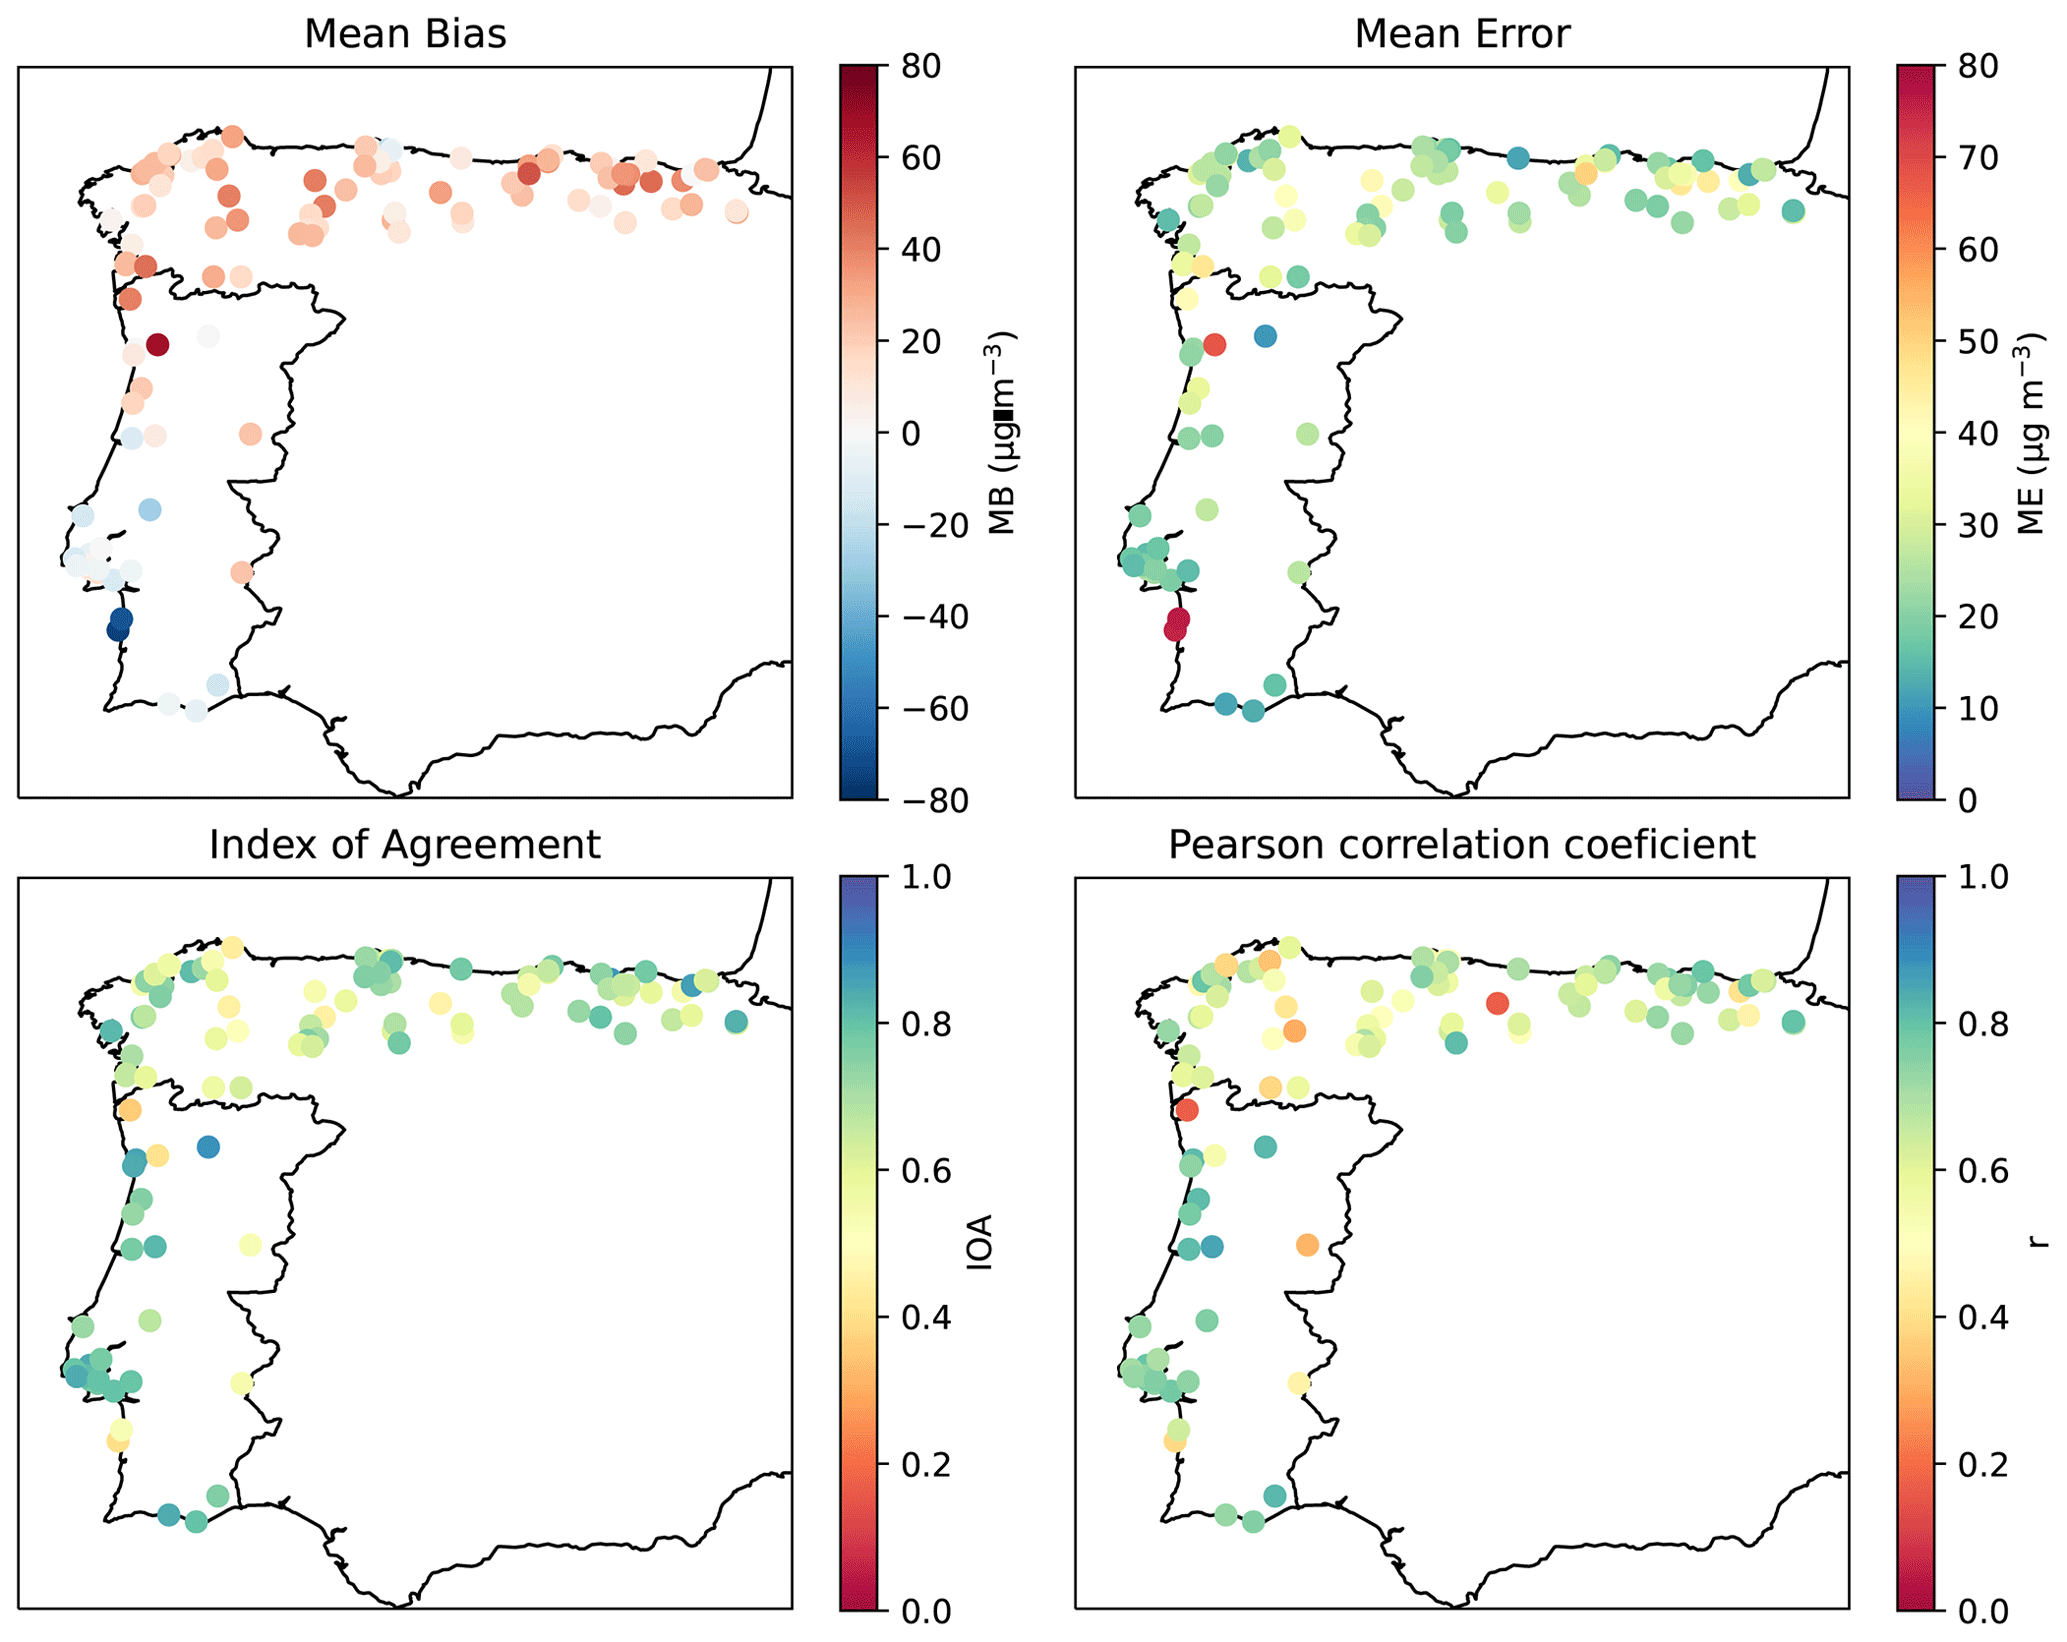
Figure 5Spatial distribution of the values of the mean bias (MB), mean error (ME), index of agreement (IOA), and Pearson correlation coefficient (r).
Statistical metrics calculated for each site are represented in Fig. 5 and shown in Tables S4 and S5. We have detected better model performance at WAI, where median r was 0.74 and IOA was 0.79 compared to 0.62 and 0.66, respectively, for the NAI stations. The same is true for the median MB values: −1.0 µg m−3 versus +20.0 µg m−3, with a median ME of 20.0 µg m−3 versus 26.0 µg m−3 at WAI and NAI, respectively. This statistical difference could be due to an over-representation of some areas due to the proximity of measurement stations in NAI and to the number of industrial stations that are exposed to industrial emission sources.
In WAI, three stations are highlighted as having a poor model performance: the urban background PT01044 (Paços de Ferreira, Porto) in the north and the suburban industrial PT04001 (Monte Chãos) and rural background PT04002 (Monte Velho) in the southwest of Portugal. Paços de Ferreira municipality stands out due to its furniture and textile industry. The largest positive mean bias error (+68 µg m−3) calculated for this area indicates that the model is strongly overestimating O3 concentrations, which may be due to unrealistic NOx emissions such as lack of local NO emissions in the model, affecting the modeled O3 concentrations through the underestimation of the NOx titration process. Although Monte Chãos and Monte Velho are both located near the Sines Industrial and Logistics Zone, the largest industrial area in Portugal, factors other than industrial emissions may be playing a crucial role in the modeling performance: a large forest fire took place in Monchique from 3 to 10 August 2018, burning around 27 000 ha of forest and agricultural land, emitting a huge quantity of pollutants and thus affecting air quality. On the contrary, the rural background PT01048 (Douro Norte), in the north, exhibits the best statistical metrics, with IOA = 0.88 and ME = 10 µg m−3.
In NAI, the rural background ES1599A (Pagoeta) and the urban background ES1747A (Rotxapea), both located at the eastern part of NAI, have the best performance, with IOA = 0.86 and 0.83, respectively. The overall behavior of the statistical data in this area exhibits a strong correlation, with high IOA and r values, albeit with a general overestimation of O3 levels. Stations in NAI might lack representativeness for background O3 measurements since many of them are located near industrial centers with high NOx emissions and there are few background stations that provide useful and reliable data to address O3 transport and accumulation processes.
For every hourly interval, we computed the average O3 concentrations of observed and simulated data across all 116 stations within the domain. This allowed us to determine the overall average O3 concentration across all sites in the domain (Fig. 6). While this process involved pairing data temporally, it did not differentiate spatial distribution. The graphical representation demonstrates that WRF–CAMx generally replicates the daily O3 patterns well and overestimates the lowest observed concentrations, particularly during nighttime in this specific episode. Our assessment reveals the model's ability to capture the initial sudden rise in O3 concentrations, both of which depict an increase of approximately +25–30 µg m−3 in maximum concentrations compared to the preceding day on 2 August. During the following days, maximum values persist consistently above 120 µg m−3. The decline observed on 7 August is also well replicated along with the dissipation of the episode. Despite nighttime discrepancies, our evaluation suggests that the model's application remains suitable for the objectives of our research.
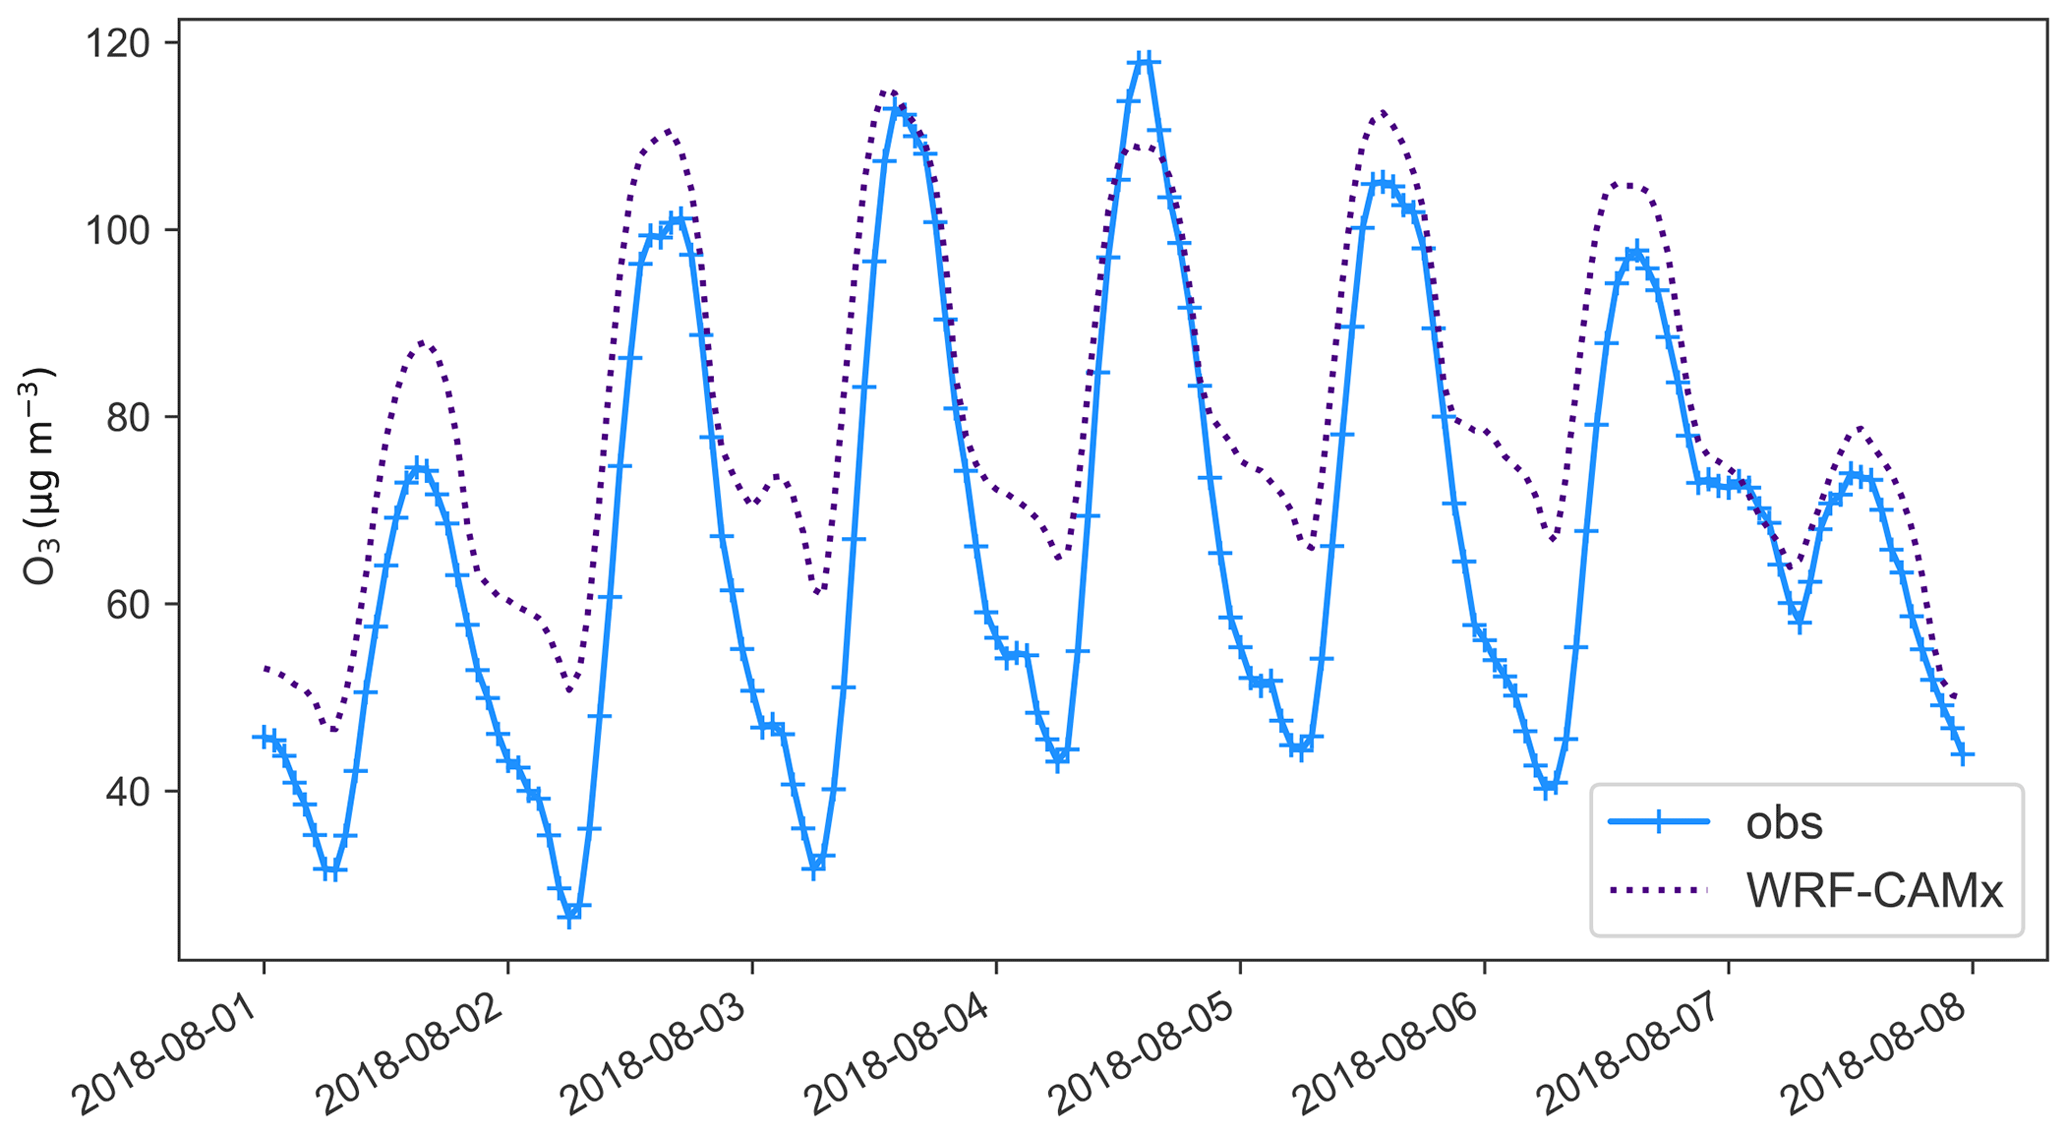
Figure 6Time series plot of modeled and observed O3 average concentrations at the 116 sites considered between 1 and 7 August 2018 (average concentrations considering pairing in time but not pairing in space).
3.3 O3 concentrations
This section presents an analysis of the observed and simulated O3 surface concentrations and their integrated concentrations up to 2500 m a.g.l. We have also analyzed two vertical cross-sections (red lines in Fig. 2) of the atmosphere in the areas of interest in Valderejo Natural Park (VNP) and Douro Norte (DN), which have shown some of the main O3 transport pathways in these inland areas where large exceedances occur.
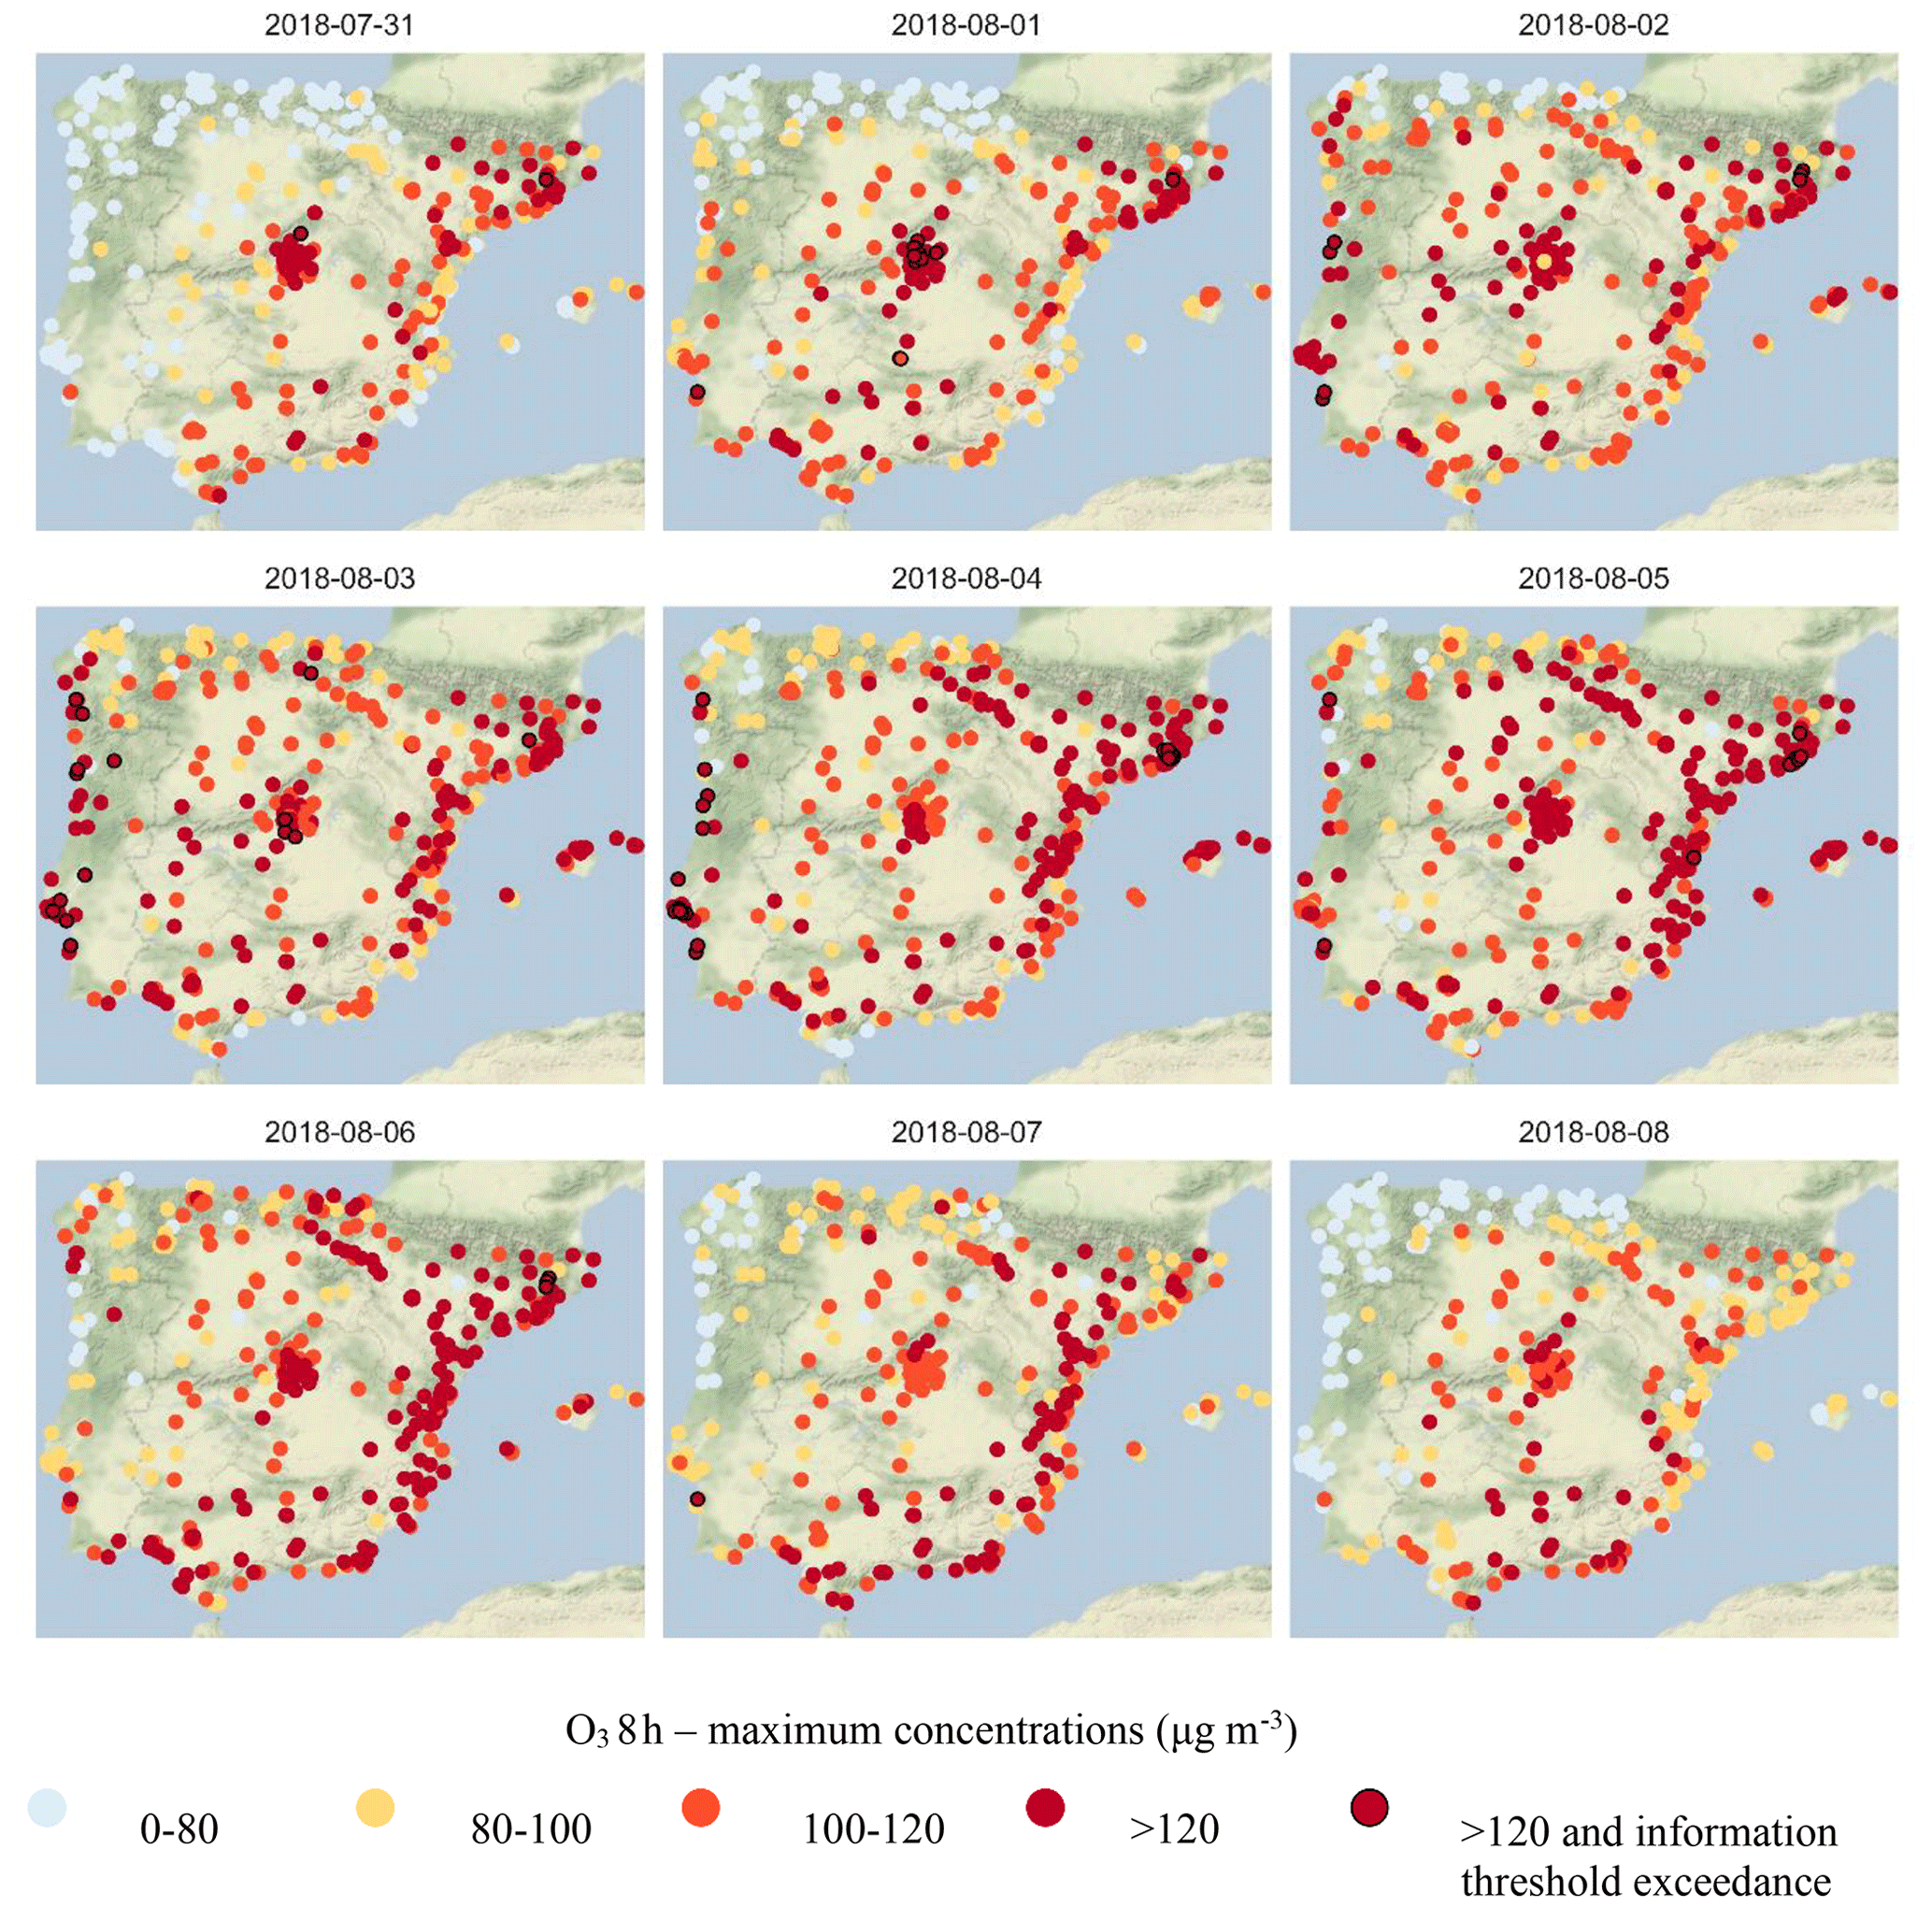
Figure 7Daily evolution of the spatial distribution of maximum 8 h O3 concentrations from 31 July to 8 August in 2018.
Table 3Number of air quality monitoring stations within Portugal and Spain as well as along the Atlantic coast of IP in which the European Directive O3 target value and information threshold were exceeded between 31 July and 8 August 2018.
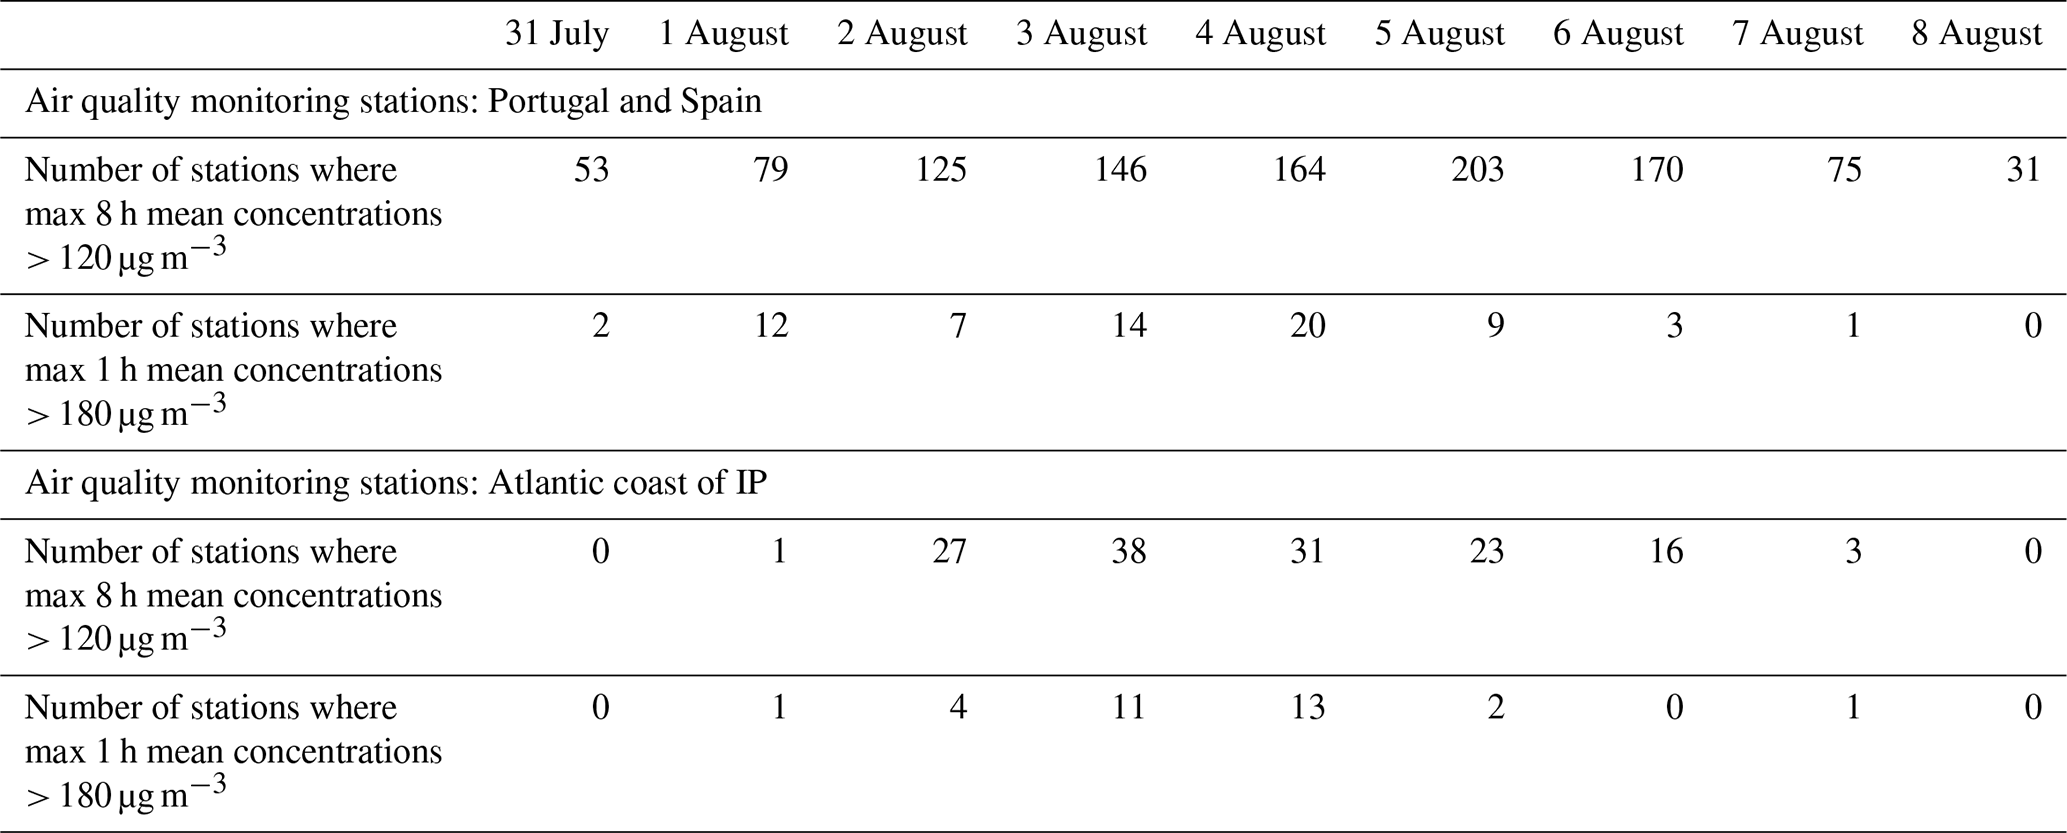
The evolution of the episode is shown in Fig. 7 and Table 3. From 31 July to 8 August in 2018, O3 concentration exceedances in the Iberian Peninsula were numerous (Fig. 7), with high concentrations every day in the Madrid and Barcelona metropolitan areas. The days with the highest number of measurement stations exceeding the European Directive target value and the information threshold occurred from 2 to 6 August, particularly on the Atlantic coast of IP (Table 3), where there was a notable increase in concentrations (Fig. 7).
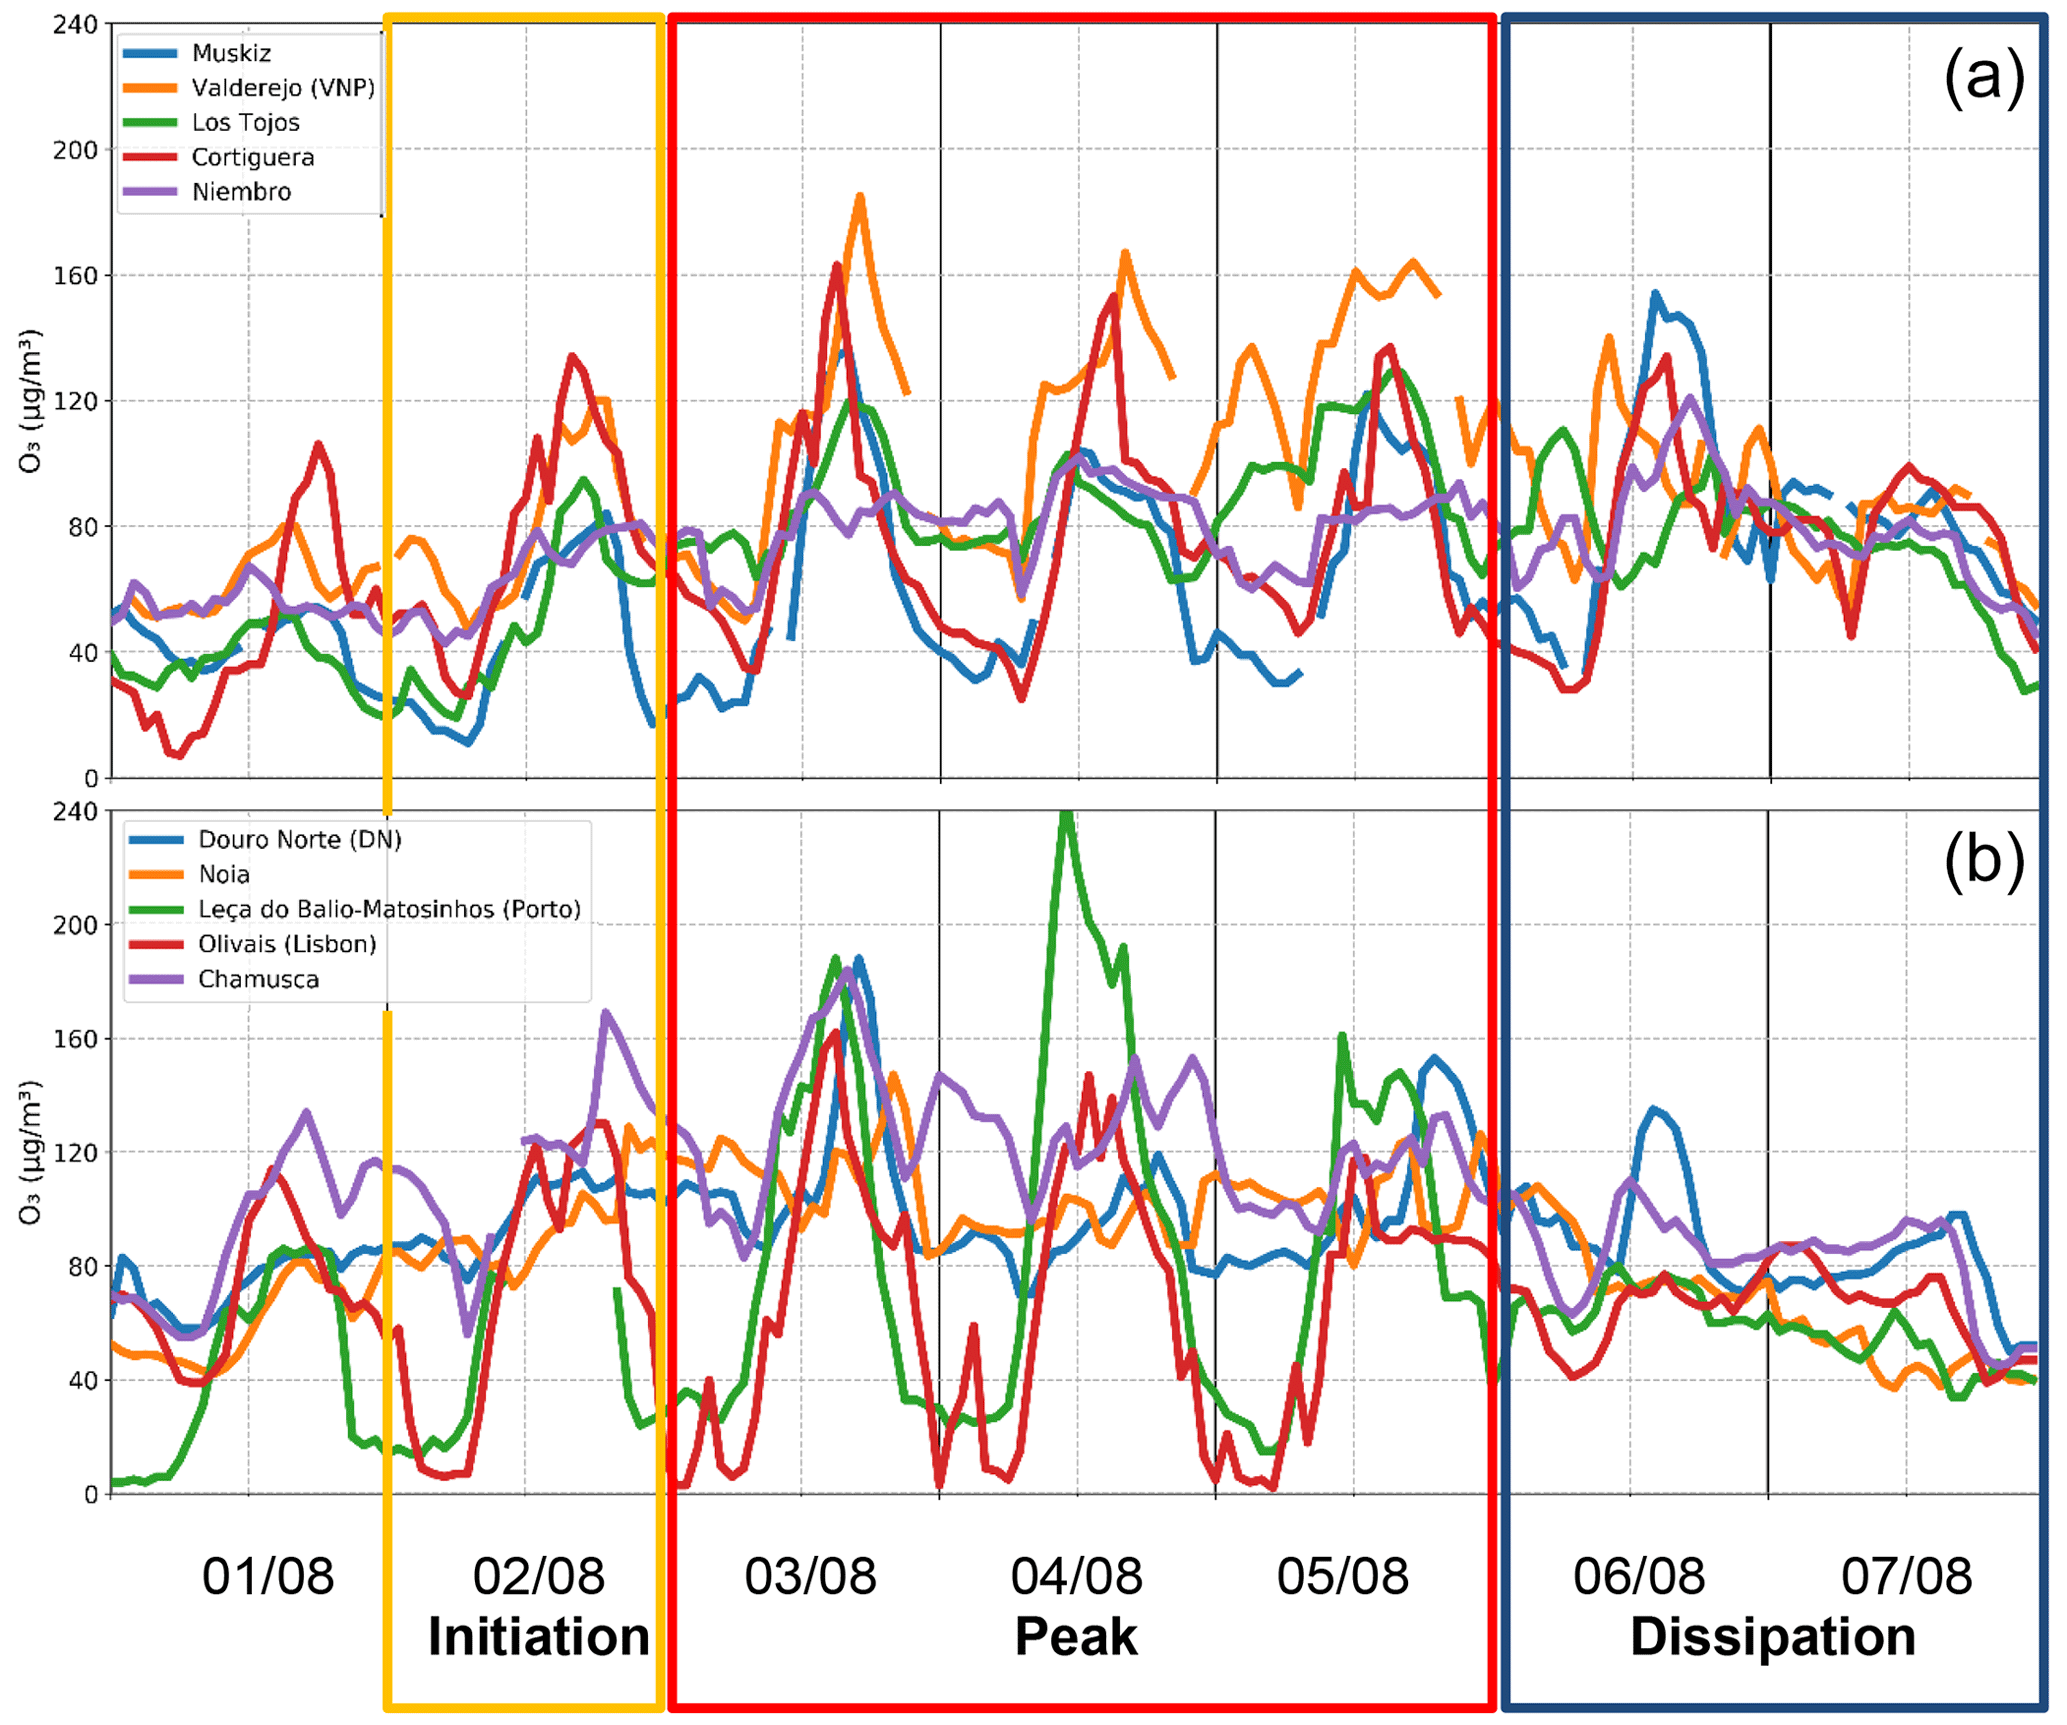
Figure 8Ozone hourly concentration time sequences for 1–7 August 2018 at a selection of stations along northern Atlantic Iberia (a) and western Atlantic Iberia (b).
The initiation phase of the episode on the Atlantic coast of IP began on 2 August. It was characterized by an O3 maximum hourly concentration increase of more than 40 µg m−3 in Portugal (see Chamusca and Noia stations in Fig. 8) and more than 30 µg m−3 in non-coastal areas of NAI (see Valderejo and Los Tojos stations in Fig. 8). That increase was due to a fumigation described in Sect. 3.3.1. On 3 August the highest number of exceedances of the European Directive occurred in NAI, marking the beginning of the peak phase: 38 stations exceeded the target value and 11 exceeded the information threshold (Table 3). During that second day, O3 concentrations increased again by more than 30 µg m−3 (Fig. 8), with notable increases in DN and VNP of more than 60 µg m−3, reaching maximum hourly concentrations of more than 180 µg m−3. These increases coincided with the beginning of inflows of European continental air masses into IP with northerly winds. Hourly concentrations above 120 µg m−3 were exceeded daily during this peak phase, extended until August 5.
On 6 August, the dissipation phase began in WAI, but not in NAI, particularly in its coastal areas due to the foehn effect described in Sect. 3.1.2. Finally, on 7 August, all concentrations dropped significantly due to the Atlantic advection. The detailed analysis of the phases with the simulated O3 concentrations is shown below.
3.3.1 Initiation
During 1 August, an accumulation of O3 of more than 135 ppm m−1 integrated up to 2500 m a.g.l. in the center of IP, northern coast of Portugal, western Mediterranean Basin, and NE of IP has been simulated (Fig. 9a.2). The winds at altitude, from E and SE, suggest the beginning of the transport of O3 and other pollutants from E to W of IP. At the surface, the highest concentrations were found in the simulation towards NW of Madrid and N of Barcelona due to the impact of emissions from these metropolitan areas, a pattern that is constantly repeated throughout the episode (Fig. 9a.1 and b.1). Concentrations in WAI began to rise, up to 95–105 µg m−3, while in NAI they remained low at 75–85 µg m−3, probably due to a lower photochemical production under cloudier skies (see Fig. S1).
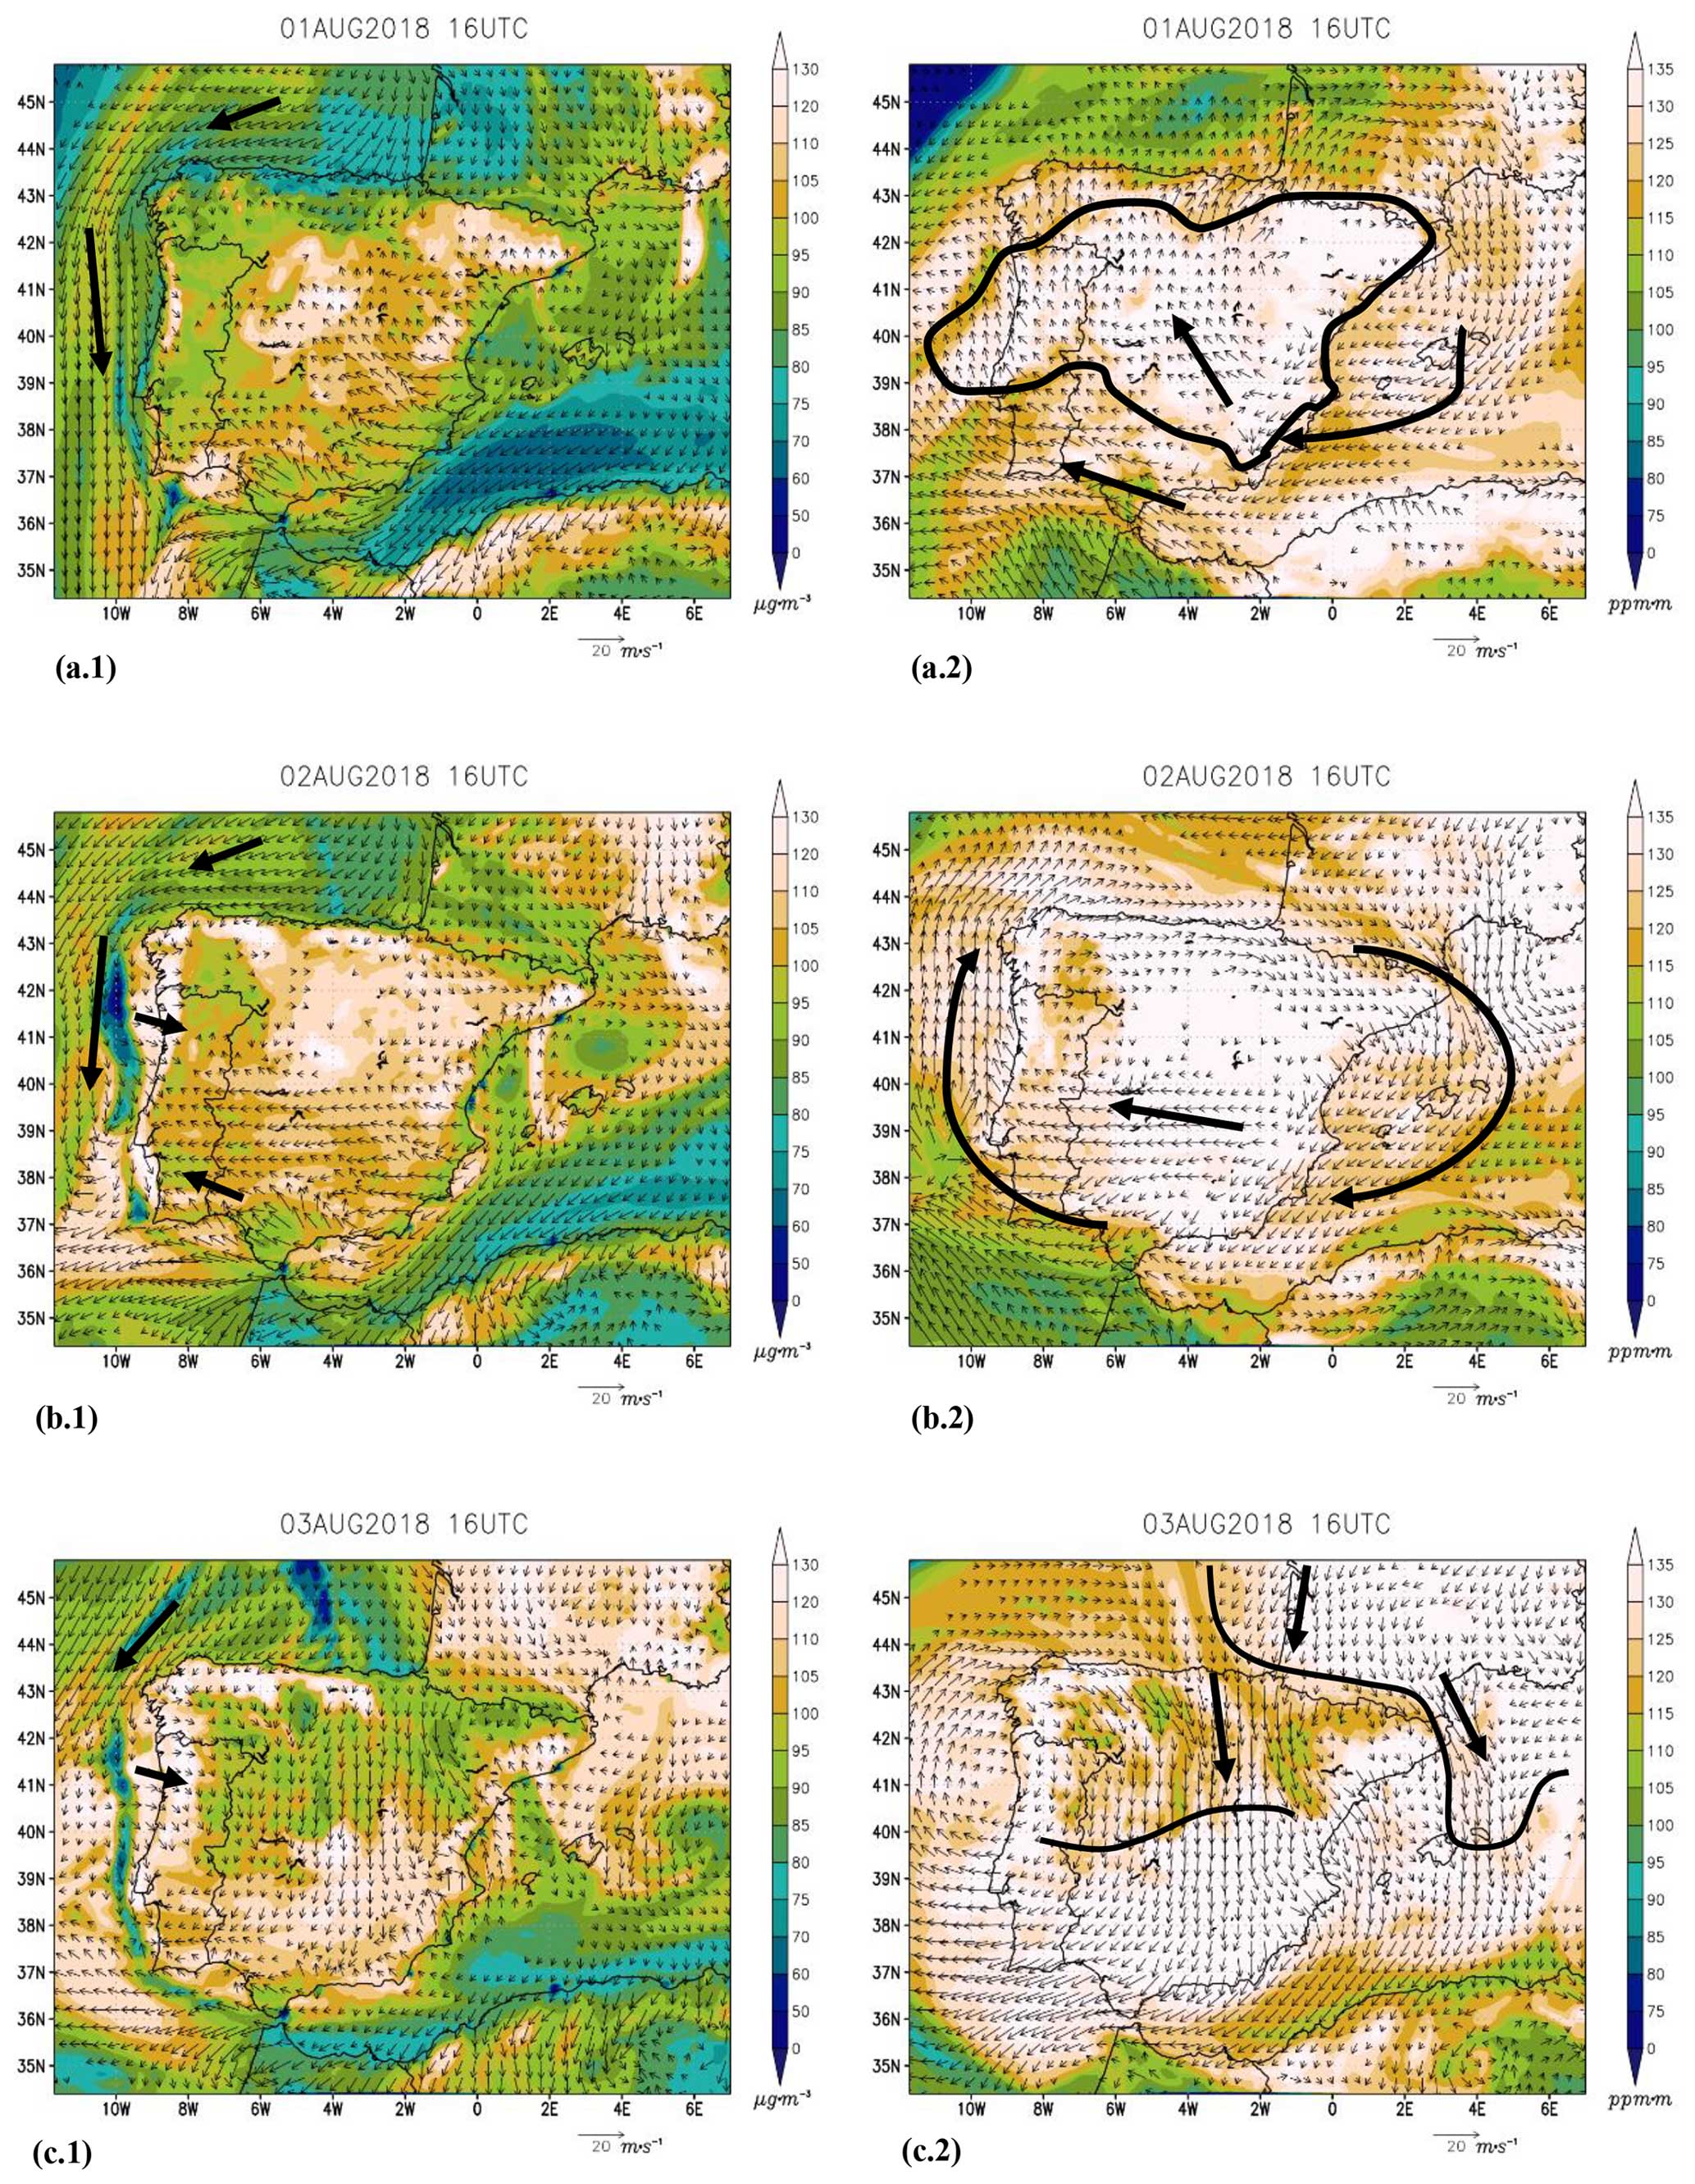
Figure 9Simulated O3 concentrations (color scale) and wind fields (vectors) by WRF–CAMx in d02 at 16:00 UTC on 1, 2, and 3 August 2018. Panels (a.1)–(c.1) show the ozone and wind concentration at the surface and panels (a.2)–(c.2) the integrated ozone concentration up to 2500 m a.g.l. and wind at 1250 m a.g.l. Winds lower than 2 m s−1 have been omitted.
On 2 August, the air recirculation in the upper layers (Fig. 9b.2), with completely clear skies and stagnant winds, caused an increase in surface O3 concentrations to values exceeding 130 µg m−3 compared to the approximately 100 µg m−3 from the previous day (Fig. 9b.1). That increase of more than 30 µg m−3 over surface-simulated concentrations and more than 40 µg m−3 over measured maximum concentrations in both NAI and WAI (Fig. 8), together with the displacement of the high-altitude O3-rich air masses towards NAI and WAI, supports the hypothesis of fumigation of pollutants as the main cause of the observed surface ozone increases during that day. We have analyzed vertical atmosphere cross-sections in VNP and DN to address this hypothesis.
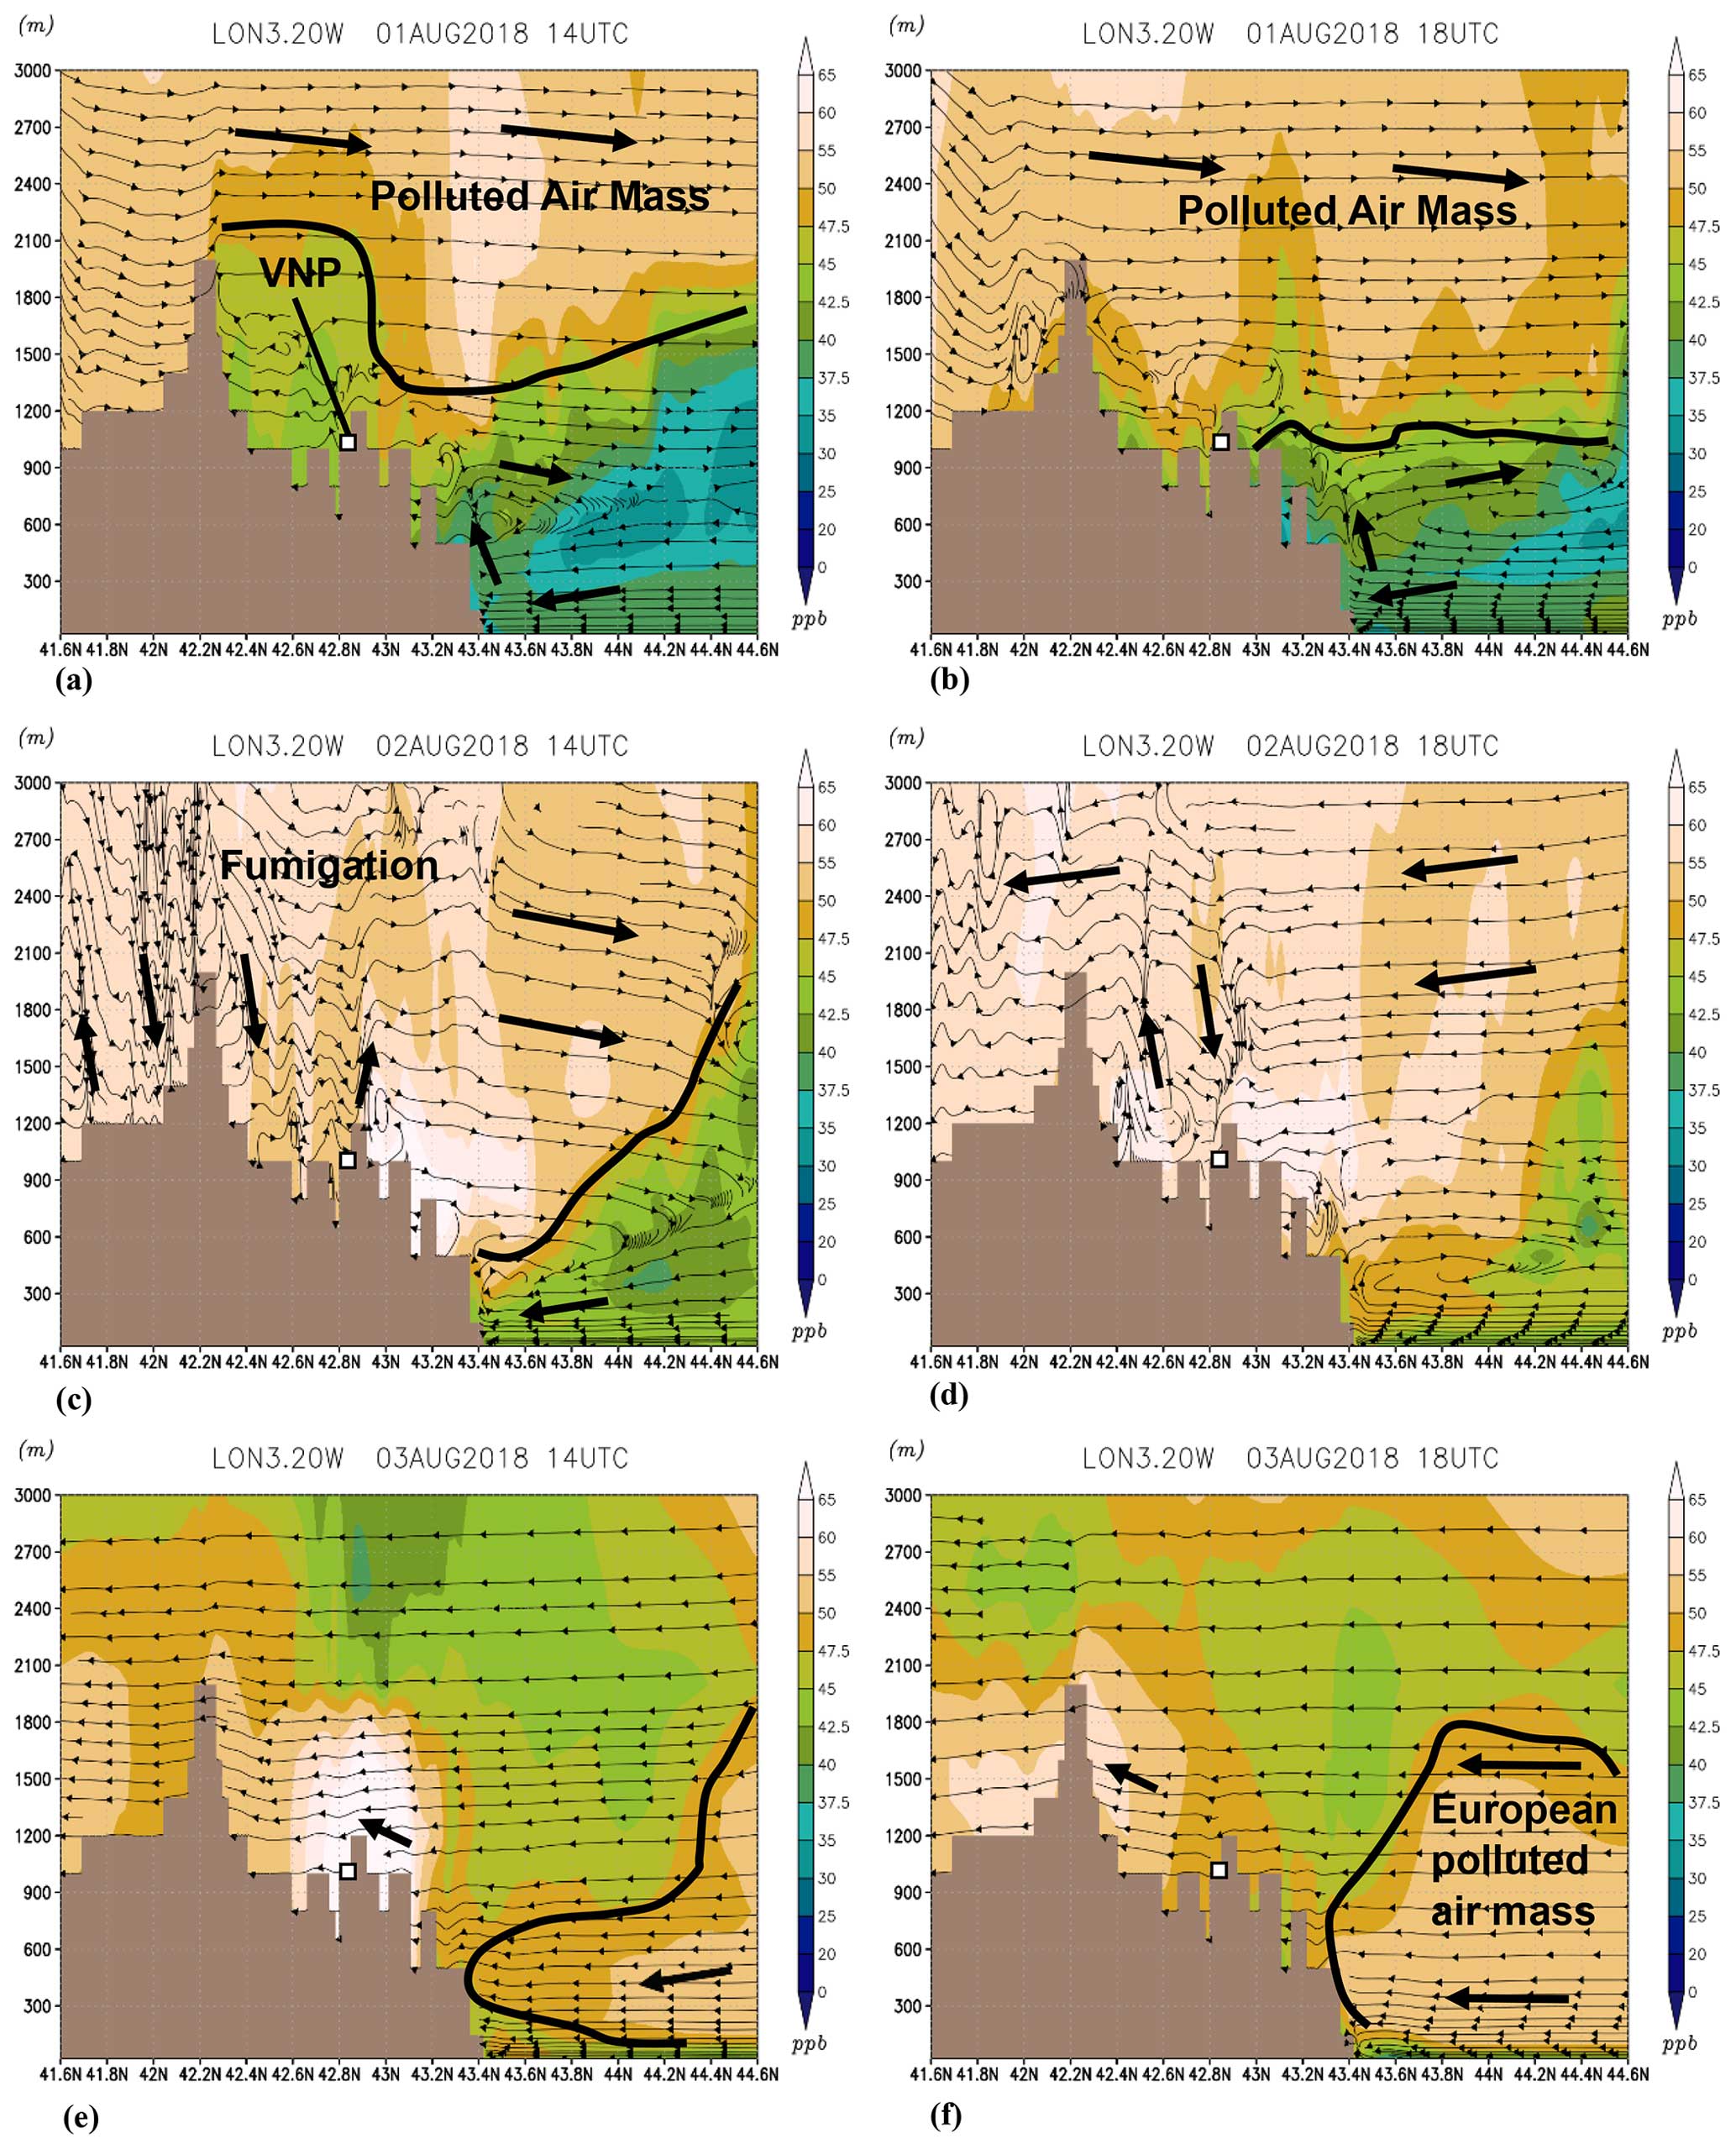
Figure 10Simulated vertical O3 concentrations (color scale) and projected wind fields (stream composed by projected u with w(×10)) by WRF–CAMx in d03 at 14:00 and 18:00 UTC on 1, 2, and 3 August 2018 for the VNP vertical cross-section. Concentrations are depicted in ppb as they are altitude-independent (1 ppb ≈ 2 µg m−3 at sea level).
In VNP, on 1 August, a highly polluted air mass was positioned above 1800 m a.s.l. as indicated by the simulated O3 concentrations (Fig. 10a and b). On 2 August, starting from 12:00 UTC, this high-altitude polluted air mass was mixed with surface air masses in the inland valleys. This led to simulated O3 concentrations exceeding 110 µg m−3 (55 ppb as shown in Fig. 10c). Winds at a horizontal projection above 500 m a.s.l. were from S, while below 500 m a.s.l. sea breezes from N prevailed near the coast, resulting in O3 concentrations not significantly high along the coastal areas (40 ppb). By the afternoon of 2 August (Fig. 10d), winds at a horizontal projection above 1000 m a.s.l. shifted to the N, causing the polluted air mass to recede towards the south of the IP. Consequently, the initial peak observed in Valderejo on day 2 (as depicted in Fig. 8) was a result of this fumigation process. From 3 August onwards (Fig. 10e and f), we observed the influx of O3-polluted air masses of European origin below 1500 m a.s.l. transported across the sea.
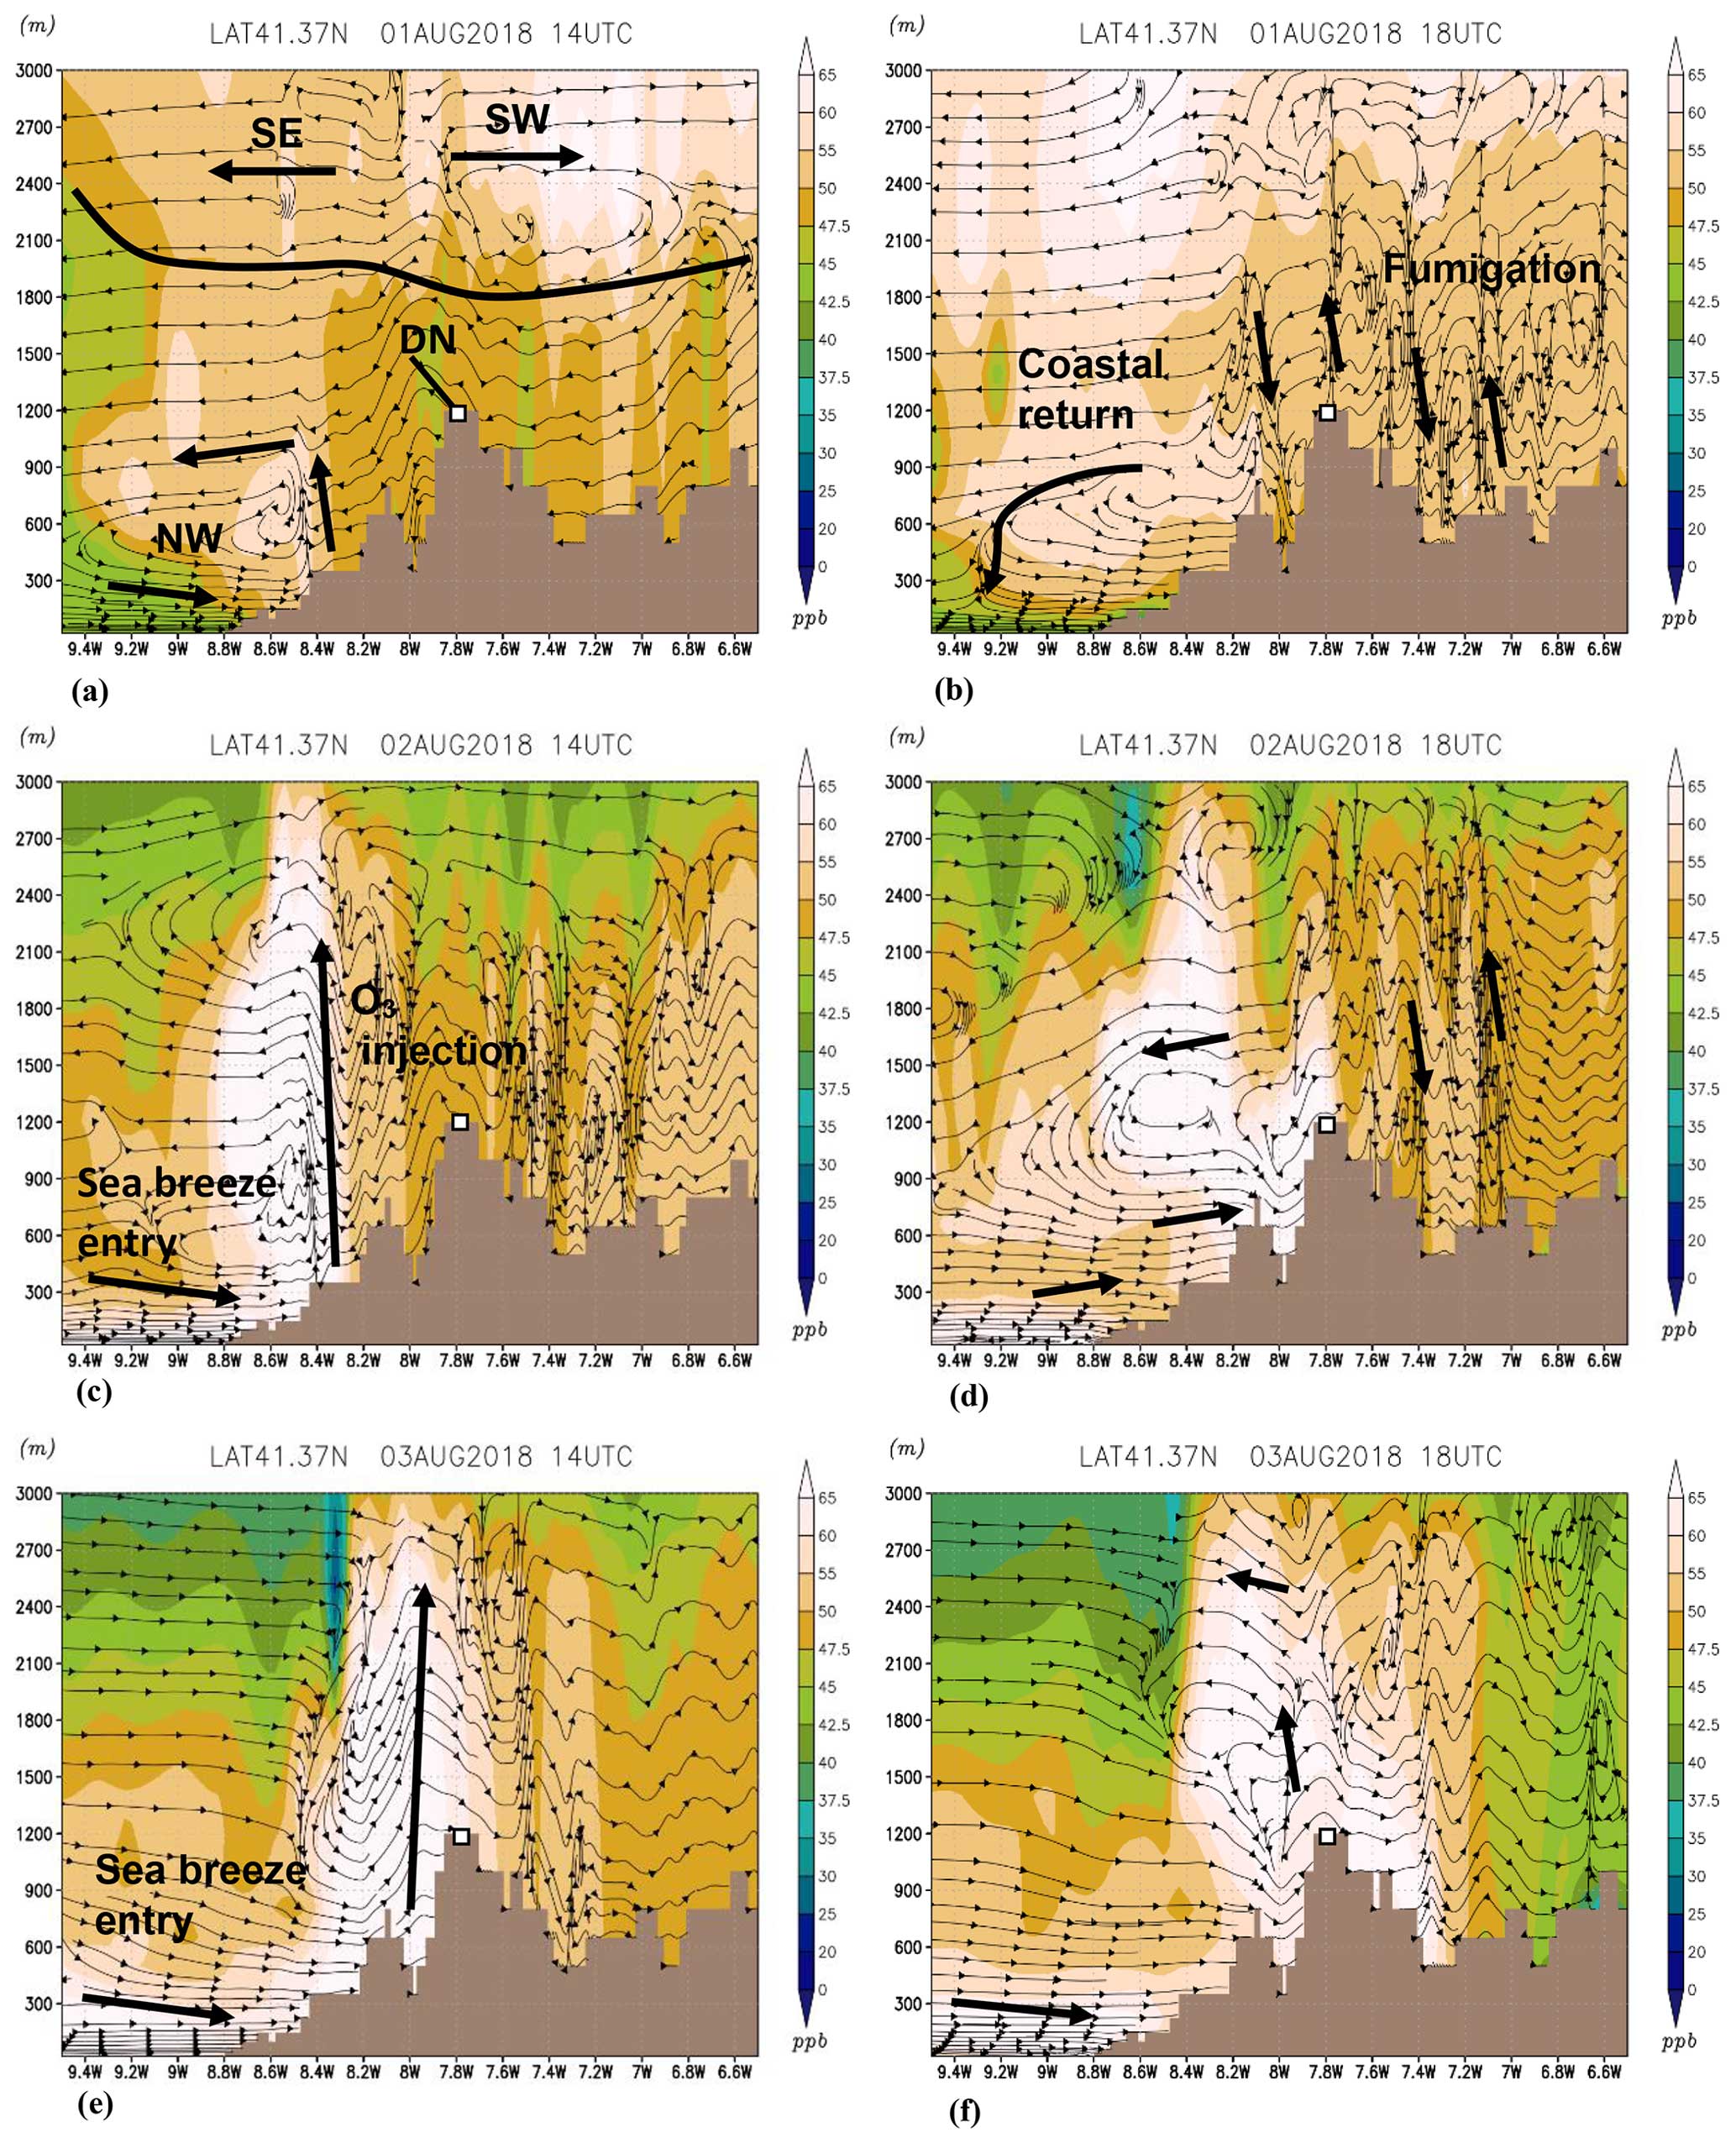
Figure 11Simulated vertical O3 concentrations (color scale) and projected wind fields (stream composed by projected v with w(×10)) by WRF–CAMx in d03 at 14:00 and 18:00 UTC on 1, 2, and 3 August 2018 for the DN vertical cross-section. Concentrations are depicted in part per billion (ppb) as they are altitude-independent (1 ppb ≈ 2 µg m−3 at sea level).
In DN, on 1 August, an upper-level polluted air mass entered at approximately 1800 m a.s.l. originating from the S-SW (Fig. 11a). While low O3 concentrations were observed over the sea surface, a slight increase in concentrations occurred along the coastline in the lower-atmospheric layers between 400 and 1000 m a.s.l. Inland valleys experienced high O3 concentrations due to the pollution carried at higher altitudes and mixed into the surface, propelled by convective movements during the afternoon (Fig. 11b). Return flows along the coast at 900 m a.s.l. during the afternoon (Fig. 11b) potentially carried some of this elevated O3 back to the sea surface, creating an O3 reservoir for subsequent days. This mechanism resembles processes described for Mediterranean regions (Millán et al., 2002), resulting in sea–land recirculations over several consecutive days, forming injections of ozone into upper layers that may return to the coast during the following days (Fig. 11c to f).
In addition to the fumigation process, surface winds during midday on 1 and 2 August were northerly over WAI and northeasterly over the Bay of Biscay. That could imply transport of pollutants from the French Atlantic coast towards WAI in the lower layers of the atmosphere (Fig. 9a.1, b.1, and c.1) as documented in Gangoiti et al. (2006a), although that transport was more evident from 3 August onwards.
Those two possible O3 transport pathways (fumigation and regional transport) would be responsible for the significant increase in O3 concentrations in WAI of up to 160 µg m−3 measured inland during the afternoon on 2 August (see Chamusca station in Fig. 8) with the onset of the sea breezes (Fig. 9a.1, b.1, and c.1). The plume generated on the coast was transported inland and injected through orographic chimneys to the existing recirculating air mass in upper layers, reaching up to 2400 m a.s.l.
3.3.2 Peak
During 3 August, the change in synoptic conditions led to the transport of the polluted air mass from N to S of the peninsula (Fig. 9c.2). At the same time, the SE winds from the previous day over the SW of IP dragged part of the polluted air mass toward the coast of Portugal, causing an accumulation of O3 over WAI (Fig. 9c.2). On the surface, as on 2 August, WRF–CAMx-simulated O3 concentrations were above 130 µg m−3 over NAI and WAI (Fig. 9b.1). The wind shift to N-NE at the end of 3 August caused the entry of new polluted air masses from France, both through the Bay of Biscay towards NAI and through the Gulf of Lion towards the Mediterranean Sea. That transport pathway corroborates one of the accumulation phase transport pathways proposed by Gangoiti et al. (2006a) and Valdenebro et al. (2011). In this episode, however, there was no previous gradual accumulation; it already started with an abrupt rise in O3 concentrations on the previous 2 d during the initiation.
Particularly in WAI, during 2 and 3 August there is a notable increase in the O3 simulated concentrations over the sea (Fig. 11c, d, e, and f). We have observed that during 3 August PM10 measured concentrations in western IP increased notably, up to 60 µg m−3. These high concentrations lasted until 5 August (not shown in this paper), and they were concurrent with lower O3 concentrations in upper layers (Fig. 11c, d, e and f), indicating a transport of mineral dust from the Sahara to the WAI. Fumigation processes on 2 August would have transported O3 from the upper layers to the surface, whereas on 3 August it would be dust instead of O3 (see the dust location on the satellite map in Fig. S1). Those fumigation processes could introduce O3 and PM into the sea–land recirculation cells, causing high measured concentrations of both pollutants simultaneously.
In the VNP, over NAI, an intrusion of polluted air through the Bay of Biscay from the north, of French origin, was observed, causing O3 concentrations of 100 µg m−3 (50 ppb) from the surface level to 1500 m a.s.l. (Fig. 10e and f). Additionally, we observed how local pollutants emitted on the coastline impacted the inland valleys, producing more than 160 µg m−3 of O3 (Fig. S9). Thus, a significant local contribution was added to the already existing regional transport of polluted air masses. In DN, over WAI, the pattern of inflow with the sea breeze and impact on inland areas was repeated as shown in Fig. S10, also documented in other studies (Evtyugina et al., 2007; Monteiro et al., 2012, 2016; Torre-Pascual et al., 2023).
During 4 and 5 August the simulated surface O3 concentrations again exceeded 130 µg m−3 on NAI and WAI (not shown). The transport of pollutants from France to NAI through the Gulf of Biscay and to the Mediterranean Sea through the Gulf of Lion continued during those days and cycles of sea breezes were repeated. In the case of the Douro Norte station, we observed the transport of polluted air masses from the coast into that area due to the sea breeze. A sudden rise in O3 hourly concentrations occurring on 3, 5, and 6 August was caused by the impacts of these air masses, but not with such intensity on 4 August (Fig. S10) because of a more southerly trajectory during that day of the polluted air mass (not shown). The approach of the cold front during 5 August caused prefrontal winds of W-SW component over IP that initiated the transport of all pollutants from the W to the E of IP.
3.3.3 Dissipation
The Atlantic air mass entered IP on 6 August, introducing cloudiness (Fig. S1) and producing a wind shift to W over WAI. That change introduced cleaner air to the west of the peninsula (Fig. 12). However, in NAI, O3-polluted air masses coming from the W and SW of Iberia were transported with the prefrontal winds, adding O3 to the one previously accumulated days before (Fig. 12a.1 and a.2). That situation caused high simulated O3 surface concentrations (> 130 µg m−3) and the highest observations over NAI (Figs. 7 and 8). The passage of the frontal system generated a simulated “ozone front” also confirmed by the measurements. The final entry of cleaner air from the Atlantic Ocean during 7 August significantly reduced O3 concentrations both at the surface and at altitude in the NW region of IP (Fig. 12b.1 and b.2). In the E of IP and the western Mediterranean Basin, higher concentrations were still found in the simulations, indicating a possible episode during the following days in that territory.
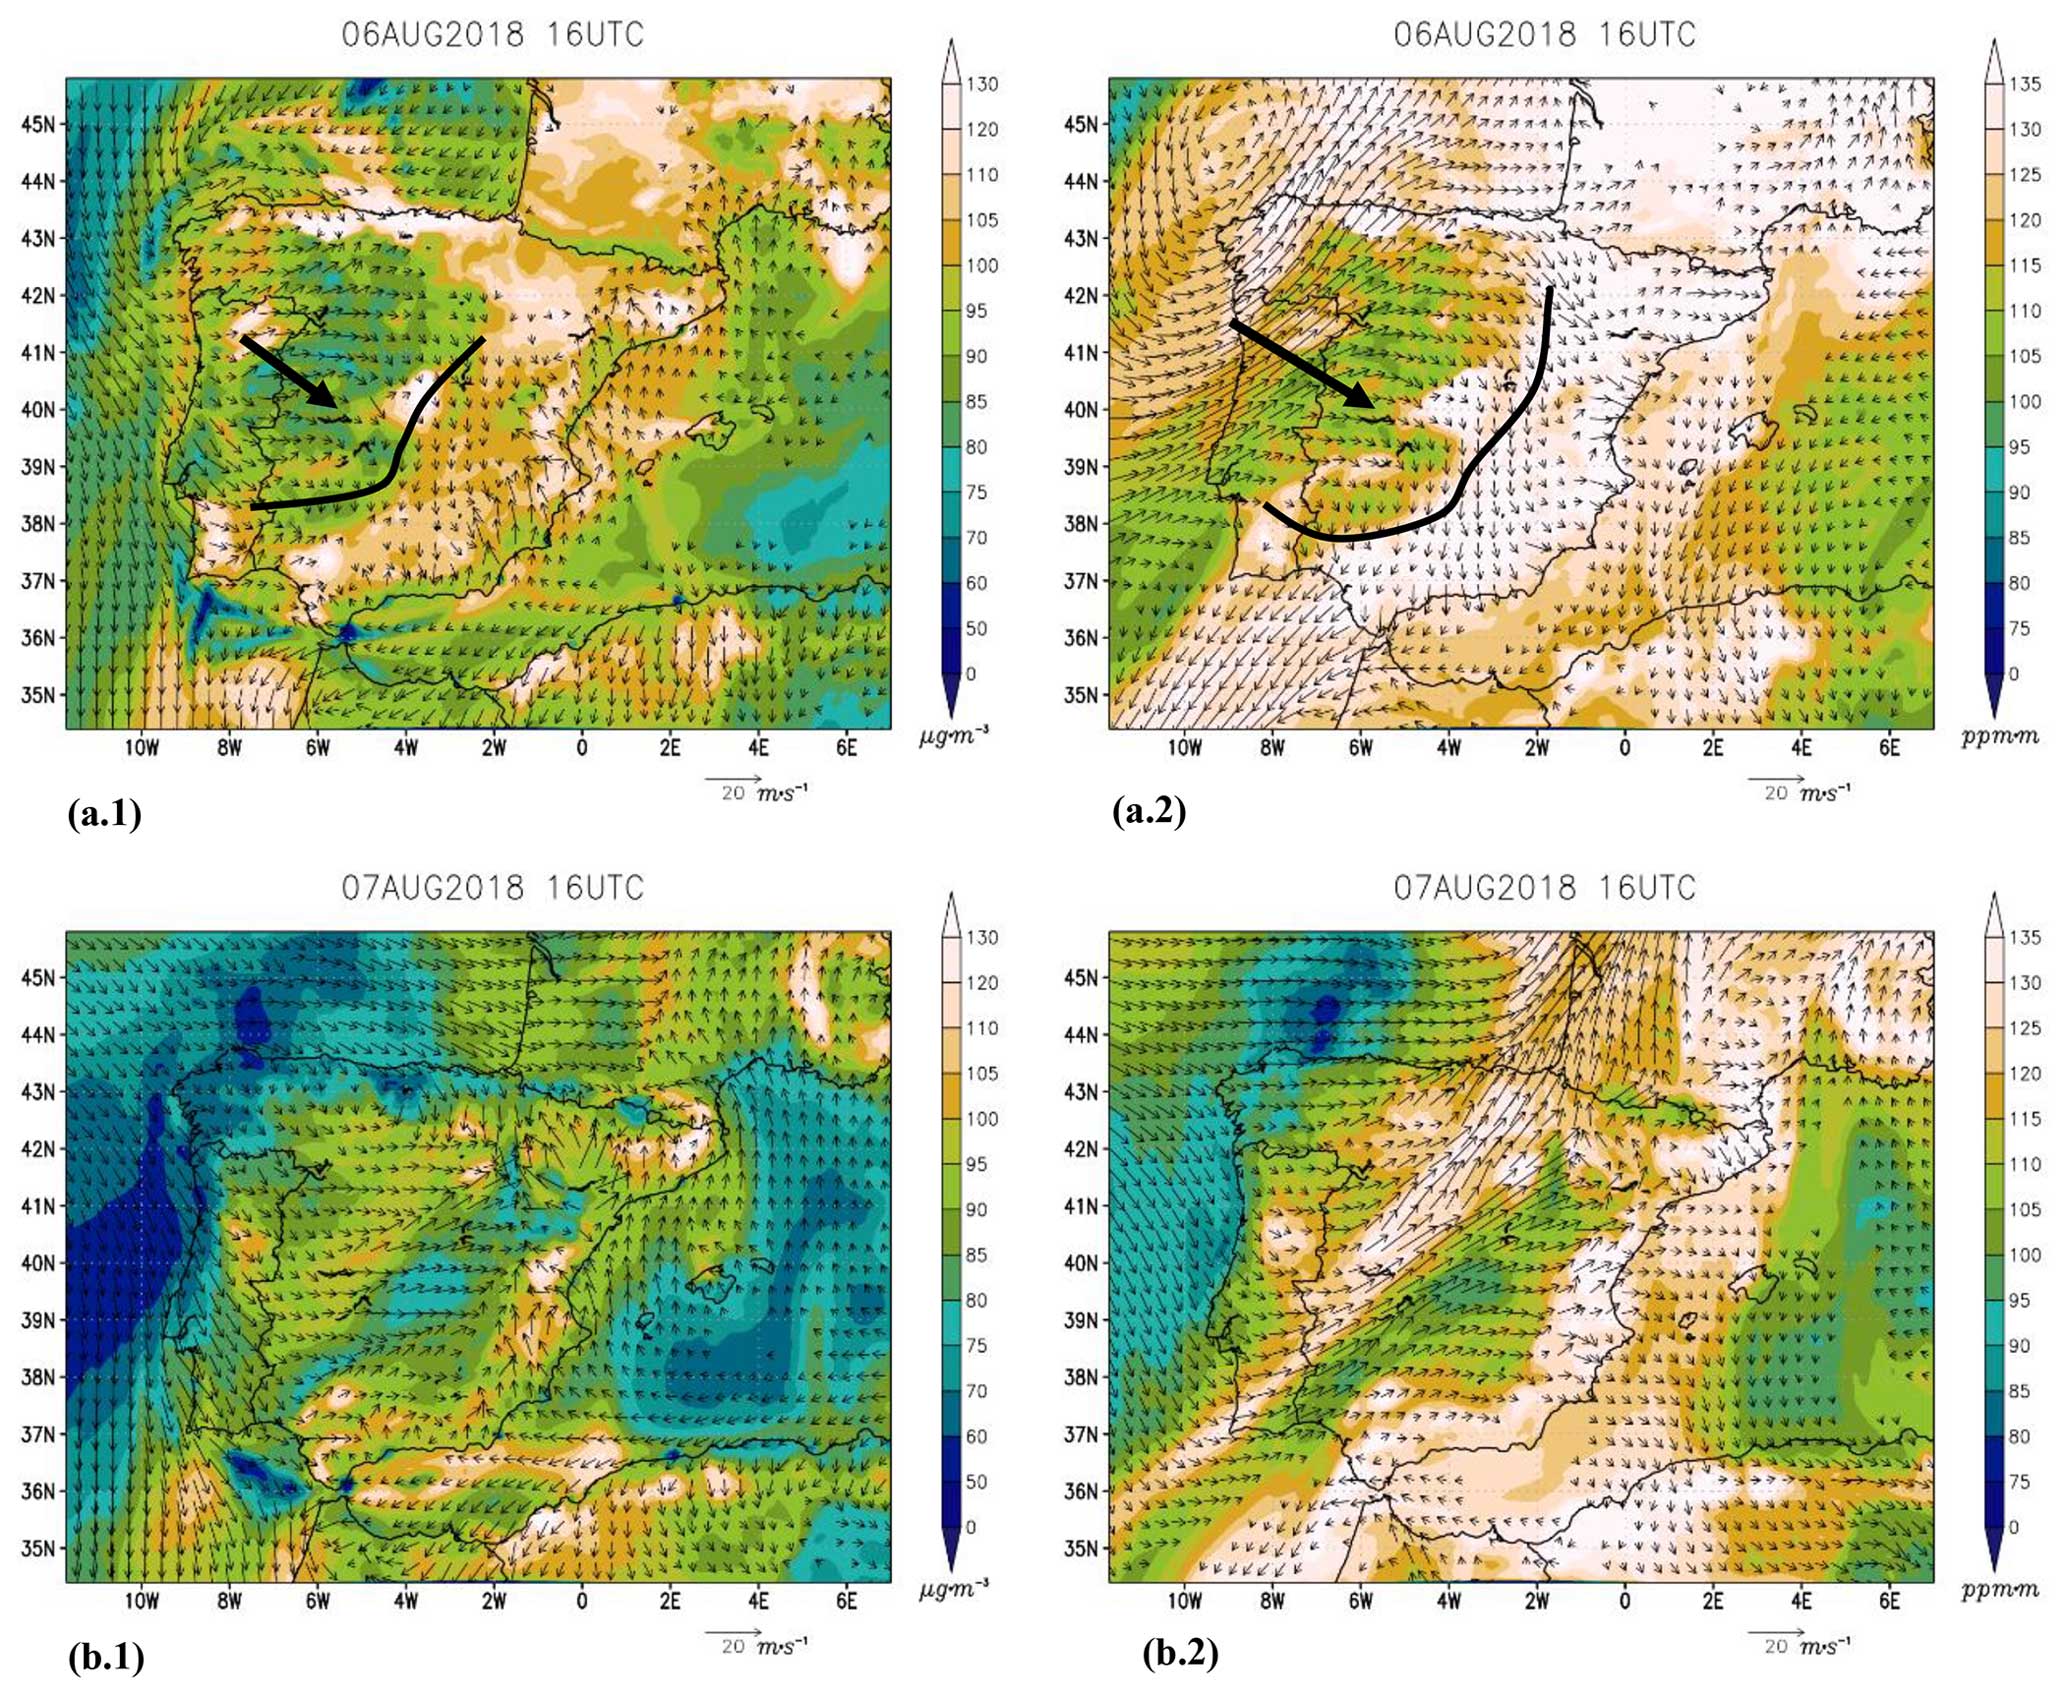
Figure 12Simulated O3 concentrations (color scale) and wind fields (vectors) by WRF–CAMx in d02 at 16:00 UTC on 6 and 7 August 2018. Panels (a.1)–(b.1) show the ozone and wind concentration at the surface and panels (a.2)–(b.2) the integrated ozone concentration up to 2500 m a.g.l. and wind at 1250 m a.g.l. Winds lower than 2 m s−1 have been omitted.
This paper analyzes a tropospheric O3 pollution episode that occurred on the Atlantic coast of IP, specifically over WAI and NAI, in Spain and Portugal during 2–6 August 2018. The episode was characterized by an almost simultaneous abrupt rise in O3 concentrations in both regions, which remained high throughout the entire episode, exceeding the target values and the information threshold of the EC/50/2008 EU Directive. Using the meteorological and photochemical WRF–CAMx modeling system, we have identified the transport mechanisms behind this type of episode, which is especially complex due to a meteorology characterized by a permanent wind shear throughout the entire period. Additionally, we have been able to characterize the possible sources of photochemical pollutants affecting these two areas.
The episode began with an accumulation of pollutants in the higher layers above 2000 m a.g.l. over IP due to a decoupling of high-altitude and surface air masses. The origin of that upper-level polluted air mass was probably the emission of pollutants during previous days in IP itself, which were then trapped below 2500 m a.s.l. due to the stability of the upper warmer air. Subsequently, upper air masses fumigated onto the surface through the different orographic chimneys along the Atlantic coast, producing the beginning of the episode. During the initiation of the episode, the simulation pointed out that the dominant process was likely to be fumigation, with a contribution of 30–40 µg m−3 of the observed O3 increase. Measured O3 maximum daily concentrations increased more than 40 µg m−3 from the previous day's highs and simulated O3 more than 30 µg m−3.
From 3 August onwards, the fumigated air masses were joined by other polluted air masses. According to the simulation, NAI received O3-polluted air masses imported from France, providing a minimum of 100 µg m−3 background O3 concentrations, while WAI received O3 from the N and center of IP, probably sharing the same minimum background contribution because of the continuity of those air masses. The most intense exceedances occurred in the sea-facing slopes of the main coastal ranges at Valderejo (Basque Country, Spain) and Douro Norte (Portugal) measurement stations. At these sites, there is an additional impact of local coastal emissions to the already existing high background concentrations (100 µg m−3). That local contribution, introducing “fresh” pollutants inland with the sea breezes, produced concentrations above 130 µg m−3 of O3 in the form of a peak in both measured and simulated concentrations, indicating a local contribution of at least 30 µg m−3 of O3 at both locations. Those concentrations, as well as the transport pathways observed through the simulations, showed that during the episode there were different contributions and inter-related transport processes: first, an O3 fumigation and inter-regional transport (within IP) during 2 August and then, from 3 August onwards, a continental European O3 transport and concurrent accumulation within coastal circulations. The dissipation of the episode occurred gradually from W to E due to an Atlantic advection, which introduced colder and cleaner air. After the front passed through, pollutants were carried from W to E, causing maximum hourly concentrations that were significant prior to the episode dissipation.
CAMx simulation conformed to the statistical parameters traditionally used with these models. We have introduced for the first time the analysis of winds at altitude and the calculation of integrated O3 concentrations for a deeper understanding of this episode. These newly proposed analyses are necessary to understand air pollution episodes in areas with complex topography where recirculatory processes can occur in both the upper and lower atmosphere. They allowed us to observe the medium- and long-range transports of polluted air masses, abstracting from local effects, and, in turn, whether the increases in O3 concentrations were due to air mass horizontal advections, fumigations, or a combination of both.
In view of the diversity of processes involved in this type of O3 episode, the authors of this article recommend extending the analysis of modeling studies to upper levels of the atmosphere, particularly in complex terrain applications and with complex meteorological situations such as this case. In order to improve predictions as well as control strategies, databases of observations should be expanded at the surface and upper levels of the atmosphere. WAI surface station measurements have proven to be representative for evaluating the episode and agree with the simulations. Meanwhile, in NAI, measurement stations might not be very representative to address this kind of episode due to their proximity to industrial sites. In upper levels of the atmosphere, O3 soundings and lidar, among other techniques for the characterization of the vertical ozone distribution, should be used to further analyze the transport pathways and accumulation processes addressed in this paper.
The code we have utilized is open-source and mainly consists of the mentioned WRF and CAMx models. For the graphical representations we have used the Grid Analysis and Display System (GrADS) available at http://cola.gmu.edu/grads/ (last access: 20 March 2024; Doty and Kinter, 1995). The WRF v3.9.1.1 source code is available at https://www2.mmm.ucar.edu/wrf/users/download/get_source.html (last access: 28 March 2022; Skamarock et al., 2008), and the CAMx v6.5 source code is available at https://www.camx.com/download/source/ (last access: 28 March 2022; Ramboll Environment and Health, 2018). Should there be a need for any of the intermediate processing programs, please contact the corresponding author.
The model graphical hourly output is archived on the Zenodo database (https://doi.org/10.5281/zenodo.10886332, Torre-Pascual, 2024).
The supplement related to this article is available online at: https://doi.org/10.5194/acp-24-4305-2024-supplement.
ETP: conceptualization, data curation, formal analysis, investigation, software, visualization, original draft preparation, review and editing. GG: conceptualization, data curation, formal analysis, investigation, software, visualization, original draft preparation, review and editing. ARG: conceptualization, data curation, formal analysis, investigation, software, visualization, original draft preparation, review and editing. ESdC: conceptualization, data curation, investigation, software, visualization, original draft preparation, review and editing. JF: conceptualization, data curation, investigation, visualization, original draft preparation, review and editing. CG: conceptualization, data curation, investigation, visualization, original draft preparation, review and editing. MCG: conceptualization, investigation, visualization, original draft preparation, review and editing. IZ: conceptualization, data curation, investigation, visualization, original draft preparation, review and editing. JAG: conceptualization, investigation, visualization, original draft preparation, review and editing. MdB: conceptualization, investigation, visualization, original draft preparation, review and editing.
The contact author has declared that none of the authors has any competing interests.
Publisher's note: Copernicus Publications remains neutral with regard to jurisdictional claims made in the text, published maps, institutional affiliations, or any other geographical representation in this paper. While Copernicus Publications makes every effort to include appropriate place names, the final responsibility lies with the authors.
The authors wish to thank the Department of Economic Development, Sustainability and the Environment of the Basque Government (CONV 22/16) and the University of the Basque Country UPV/EHU as the source of our main financial support: GIA consolidated Research Groups (GIU21/050) (https://www.ehu.eus/es/web/gia, last access: 20 March 2024). This is in addition to the Spanish Ministry of Universities and the European Union for the Margarita Salas grant (MARSA21/23) of Eduardo Torre-Pascual, funded by the European Union – Next Generation EU. These financing bodies have played an exclusively economic role in the study.
Thanks are also due for the financial support of the contract grants of Joana Ferreira (2020.00622.CEECIND) and Carla Gama (2021.00732.CEECIND), to CESAM (UIDP/50017/2020+, UIDB/50017/2020+, and LA/P/0094/2020), and to FCT/MCTES through national funds and the co-funding by the FEDER within the PT2020 Partnership Agreement and Compete 2020.
This research has received financial support from the University of the Basque Country (UPV/EHU) through grant GIU21/050, the Department of Economic Development, Sustainability and the Environment of the Basque Government through grant CONV22/16, and Eduardo Torre-Pascual's Margarita Salas grant (grant no. MARSA21/23). Funds were also received from FCT/MCTES through national funds to support CESAM (grant nos. UIDP/50017/2020+, UIDB/50017/2020+, and LA/P/0094/2020) and the contracts of Joana Ferreira (grant no. 2020.00622.CEECIND) and Carla Gama (grant no. 2021.00732.CEECIN).
This paper was edited by Rolf Müller and reviewed by three anonymous referees.
Adame, J. A., Hernández-Ceballos, M. A., Bolívar, J. P., and De la Morena, B.: Assessment of an air pollution event in the southwestern Iberian Peninsula, Atmos. Environ., 55, 245–256, https://doi.org/10.1016/j.atmosenv.2012.03.010, 2012.
Alonso, L., Gangoiti, G., Navazo, M., Millán, M. M., and Mantilla, E.: Transport of Tropospheric Ozone over the Bay of Biscay and the Eastern Cantabrian Coast of Spain, Journal of Applied Meteorology, 39, 475–486, https://doi.org/10.1175/1520-0450(2000)039<0475:TOTOOT>2.0.CO;2, 2000.
Baldasano, J., Pay, M., Jorba, O., Gassó, S., and Jimenez-Guerrero, P.: An annual assessment of air quality with the CALIOPE modeling system over Spain, Sci. Total Environ., 409, 2163–2178, https://doi.org/10.1016/j.scitotenv.2011.01.041, 2011.
Banks, R. F. and Baldasano, J. M.: Impact of WRF model PBL schemes on air quality simulations over Catalonia, Spain, Sci. Total Environ., 572, 98–113, https://doi.org/10.1016/j.scitotenv.2016.07.167, 2016.
Banzon, V., Smith, T. M., Chin, T. M., Liu, C., and Hankins, W.: A long-term record of blended satellite and in situ sea-surface temperature for climate monitoring, modeling and environmental studies, Earth Syst. Sci. Data, 8, 165–176, https://doi.org/10.5194/essd-8-165-2016, 2016.
Berrisford, P., Dee, D. P., Poli, P., Brugge, R., Fielding, M., Fuentes, M., Kållberg, P. W., Kobayashi, S., Uppala, S., and Simmons, A.: The ERA-Interim archive Version 2.0. Report, ERA Report Series, ECMWF, Shinfield Park, Reading, https://www.ecmwf.int/en/elibrary/73682-era-interim-archive-version-20 (last access: 20 March 2024), 2011.
Bessagnet, B., Pirovano, G., Mircea, M., Cuvelier, C., Aulinger, A., Calori, G., Ciarelli, G., Manders, A., Stern, R., Tsyro, S., García Vivanco, M., Thunis, P., Pay, M.-T., Colette, A., Couvidat, F., Meleux, F., Rouïl, L., Ung, A., Aksoyoglu, S., Baldasano, J. M., Bieser, J., Briganti, G., Cappelletti, A., D'Isidoro, M., Finardi, S., Kranenburg, R., Silibello, C., Carnevale, C., Aas, W., Dupont, J.-C., Fagerli, H., Gonzalez, L., Menut, L., Prévôt, A. S. H., Roberts, P., and White, L.: Presentation of the EURODELTA III intercomparison exercise – evaluation of the chemistry transport models' performance on criteria pollutants and joint analysis with meteorology, Atmos. Chem. Phys., 16, 12667–12701, https://doi.org/10.5194/acp-16-12667-2016, 2016.
Borge, R., Alexandrov, V., José del Vas, J., Lumbreras, J., and Rodríguez, E.: A comprehensive sensitivity analysis of the WRF model for air quality applications over the Iberian Peninsula, Atmos. Environ., 42, 8560–8574, https://doi.org/10.1016/j.atmosenv.2008.08.032, 2008.
Borge, R., Lumbreras, J., Pérez, J., de la Paz, D., Vedrenne, M., de Andrés, J. M., and Rodríguez, M. E.: Emission inventories and modeling requirements for the development of air quality plans. Application to Madrid (Spain), Sci. Total Environ., 466–467, 809–819, https://doi.org/10.1016/j.scitotenv.2013.07.093, 2014.
Borrego, C., Monteiro, A., Ferreira, J., Miranda, A. I., Costa, A. M., Carvalho, A. C., and Lopes, M.: Procedures for estimation of modelling uncertainty in air quality assessment, Environ. Int., 34, 613–620, https://doi.org/10.1016/j.envint.2007.12.005, 2008.
Borrego, C., Souto, J. A., Monteiro, A., Dios, M., Rodríguez, A., Ferreira, J., Saavedra, S., Casares, J. J., and Miranda, A. I.: The role of transboundary air pollution over Galicia and North Portugal area, Environ. Sci. Pollut. R., 20, 2924–2936, https://doi.org/10.1007/s11356-012-1201-9, 2013.
Borrego, C., Monteiro, A., Martins, H., Ferreira, J., Fernandes, A. P., Rafael, S., Miranda, A. I., Guevara, M., and Baldasano, J. M.: Air quality plan for ozone: An urgent need for North Portugal. Air Quality, Atmosphere & Health, 9, 447–460, https://doi.org/10.1007/s11869-015-0352-5, 2016.
Carvalho, A., Monteiro, A., Ribeiro, I., Tchepel, O., Miranda, A. I., Borrego, C., Saavedra, S., Souto, J. A., and Casares, J. J.: High ozone levels in the northeast of Portugal: Analysis and characterization, Atmos. Environ., 44, 1020–1031, https://doi.org/10.1016/j.atmosenv.2009.12.020, 2010.
Crippa, M., Guizzardi, D., Muntean, M., Schaaf, E., Dentener, F., van Aardenne, J. A., Monni, S., Doering, U., Olivier, J. G. J., Pagliari, V., and Janssens-Maenhout, G.: Gridded emissions of air pollutants for the period 1970–2012 within EDGAR v4.3.2, Earth Syst. Sci. Data, 10, 1987–2013, https://doi.org/10.5194/essd-10-1987-2018, 2018.
Cuevas, E., González, Y., Rodríguez, S., Guerra, J. C., Gómez-Peláez, A. J., Alonso-Pérez, S., Bustos, J., and Milford, C.: Assessment of atmospheric processes driving ozone variations in the subtropical North Atlantic free troposphere, Atmos. Chem. Phys., 13, 1973–1998, https://doi.org/10.5194/acp-13-1973-2013, 2013.
de Blas, M., Ibáñez, P., García, J. A., Gómez, M. C., Navazo, M., Alonso, L., Durana, N., Iza, J., Gangoiti, G., and Sáez de Cámara, E.: Summertime high resolution variability of atmospheric formaldehyde and non-methane volatile organic compounds in a rural background area, Sci. Total Environ., 647, 862–877, https://doi.org/10.1016/j.scitotenv.2018.07.411, 2019.
Denier van der Gon, H. A. C., Hendriks, C., Kuenen, J., Segers, A., and Visschedijk, A. J. H.: Description of current temporal emission patterns and sensitivity of predicted AQ for temporal emission patterns, EU FP7 MACC deliverable report D_D-EMIS_1.3, TNO, https://atmosphere.copernicus.eu/sites/default/files/2019-07/MACC_TNO_del_1_3_v2.pdf (last access: 20 March 2024), 2011.
Doty, B. E. and Kinter, III, J. L.: Geophysical Data Analysis and Visualization Using the Grid Analysis and Display System, National Aeronautics and Space Administration, Washington, DC (United States), https://ntrs.nasa.gov/citations/19960022591 (last access: 20 March 2024), 1995.
EEA (European Environment Agency): Human activity and emission inventories, Technical report No. 11. Guidance report on preliminary assessment under EC air quality directives, Chap. 4, European Environment Agency, https://www.eea.europa.eu/publications/TEC11a/page010.html (last access: 28 March 2022), 2016.
EEA (European Environment Agency): Europe's air quality status 2022, European Environment Agency, Briefing no. 04/2022, https://doi.org/10.2800/049755, 2022.
European Environment Agency, Guerreiro, C., Colette, A., Leeuw, F. et al.: Air quality in Europe – 2018 report, Publications Office, https://doi.org/10.2800/777411, 2018.
Escudero, M., Segers, A., Kranenburg, R., Querol, X., Alastuey, A., Borge, R., de la Paz, D., Gangoiti, G., and Schaap, M.: Analysis of summer O3 in the Madrid air basin with the LOTOS-EUROS chemical transport model, Atmos. Chem. Phys., 19, 14211–14232, https://doi.org/10.5194/acp-19-14211-2019, 2019.
ETC/ACM: Ozone in southern Europe – Assessment and effectiveness of measures, European Topic Centre on Air Pollution and Climate Change Mitigation, Technical Paper 2017/3, https://www.eionet.europa.eu/etcs/etc-atni/products/etc-atni-reports/etcacm_tp_2017_3_ozone_s-europe (last access: 28 March 2022), 2018.
Evtyugina, M. G., Pio, C., Nunes, T., Pinho, P. G., and Costa, C. S.: Photochemical ozone formation at Portugal West Coast under sea breeze conditions as assessed by master chemical mechanism model, Atmos. Environ., 41, 2171–2182, https://doi.org/10.1016/j.atmosenv.2006.10.059, 2007.
Evtyugina, M. G., Nunes, T., Alves, C., and Marques, M. C.: Photochemical pollution in a rural mountainous area in the northeast of Portugal, Atmos. Res., 92, 151–158, https://doi.org/10.1016/j.atmosres.2008.09.006, 2009.
Gangoiti, G., Millán, M. M., Salvador, R., and Mantilla, E.: Long-range transport and re-circulation of pollutants in the western Mediterranean during the project Regional Cycles of Air Pollution in the West-Central Mediterranean Area, Atmos. Environ., 35, 6267–6276, https://doi.org/10.1016/S1352-2310(01)00440-X, 2001.
Gangoiti, G., Alonso, L., Navazo, M., Albizuri, A., Pérez-Landa, G., Matabuena, M., Valdenebro, V., Maruri, M., García, J. A., and Millán, M. M.: Regional transport of pollutants over the Bay of Biscay: analysis of an ozone episode under a blocking anticyclone in west-central Europe, Atmos. Environ., 36, 1349–1361, https://doi.org/10.1016/S1352-2310(01)00536-2, 2002.
Gangoiti, G., Albizuri, A., Alonso, L., Navazo, M., Matabuena, M., Valdenebro, V., García, J. A., and Millán, M. M.: Sub-continental transport mechanisms and pathways during two ozone episodes in northern Spain, Atmos. Chem. Phys., 6, 1469–1484, https://doi.org/10.5194/acp-6-1469-2006, 2006a.
Gangoiti, G., Alonso, L., Navazo, M., García, J. A., and Millán, M. M.: North African soil dust and European pollution transport to America during the warm season: Hidden links shown by a passive tracer simulation, J. Geophys. Res.-Atmos., 111, D10109, https://doi.org/10.1029/2005JD005941, 2006b.
Gangoiti, G., de Blas, M., Gómez, M. C., Rodríguez-García, A., Torre-Pascual, E., García-Ruiz, E., Sáez de Cámara, E., Zuazo, I., García, J. A., and Valdenebro, V.: Impact of the COVID-19 Lockdown in a European Regional Monitoring Network (Spain): Are We Free from Pollution Episodes?, Int. J. Env. Res. Pub. He., 18, 11042, https://doi.org/10.3390/ijerph182111042, 2021.
Gómez, M. C., Durana, N., García, J. A., de Blas, M., Sáez de Cámara, E., García-Ruiz, E., Gangoiti, G., Torre-Pascual, E., and Iza, J.: Long-term measurement of biogenic volatile organic compounds in a rural background area: Contribution to ozone formation, Atmos. Environ., 224, 117315, https://doi.org/10.1016/j.atmosenv.2020.117315, 2020.
Guenther, A.: BVOC Emission modeling. MEGAN BVOC Emissions training course, 15–17 August, National University of Colombia, https://drive.google.com/file/d/0B53BwxgQlv_3TTJWbU1MQlFZOGs/view (last access: 20 March 2024), 2017.
Guenther, A., Karl, T., Harley, P., Wiedinmyer, C., Palmer, P. I., and Geron, C.: Estimates of global terrestrial isoprene emissions using MEGAN (Model of Emissions of Gases and Aerosols from Nature), Atmos. Chem. Phys., 6, 3181–3210, https://doi.org/10.5194/acp-6-3181-2006, 2006.
Guenther, A. B., Jiang, X., Heald, C. L., Sakulyanontvittaya, T., Duhl, T., Emmons, L. K., and Wang, X.: The Model of Emissions of Gases and Aerosols from Nature version 2.1 (MEGAN2.1): an extended and updated framework for modeling biogenic emissions, Geosci. Model Dev., 5, 1471–1492, https://doi.org/10.5194/gmd-5-1471-2012, 2012.
Hersbach, H., Bell, B., Berrisford, P., Hirahara, S., Horányi, A., Muñoz-Sabater, J., Nicolas, J., Peubey, C., Radu, R., Schepers, D., Simmons, A., Soci, C., Abdalla, S., Abellan, X., Balsamo, G., Bechtold, P., Biavati, G., Bidlot, J., Bonavita, M., De Chiara, G., Dahlgren, P., Dee, D., Diamantakis, M., Dragani, R., Flemming, J., Forbes, R., Fuentes, M., Geer, A., Haimberger, L., Healy, S., Hogan, R. J., Hólm, E., Janisková, M., Keeley, S., Laloyaux, P., Lopez, P., Lupu, C., Radnoti, G., de Rosnay, P., Rozum, I., Vamborg, F., Villaume, S., and Thépaut, J.-N.: The ERA5 global reanalysis. Q. J. Roy. Meteor. Soc., 146, 1999–2049, https://doi.org/10.1002/qj.3803, 2020.
Hersbach, H., Bell, B., Berrisford, P., Biavati, G., Horányi, A., Muñoz Sabater, J., Nicolas, J., Peubey, C., Radu, R., Rozum, I., Schepers, D., Simmons, A., Soci, C., Dee, D., and Thépaut, J.-N.: ERA5 hourly data on pressure levels from 1940 to present, Copernicus Climate Change Service (C3S) Climate Data Store (CDS) [data set], https://doi.org/10.24381/cds.bd0915c6, 2023.
Hertig, E., Russo, A., and Trigo, R. M.: Heat and Ozone Pollution Waves in Central and South Europe – Characteristics, Weather Types, and Association with Mortality, Atmosphere, 11, 12, https://doi.org/10.3390/atmos11121271, 2020.
Hong, S.-Y., Noh, Y., and Dudhia, J.: A New Vertical Diffusion Package with an Explicit Treatment of Entrainment Processes, Mon. Weather Rev., 134, 2318–2341, https://doi.org/10.1175/MWR3199.1, 2006.
in't Veld, M., Carnerero, C., Massagué, J., Alastuey, A., de la Rosa, J. D., Sánchez de la Campa, A. M., Escudero, M., Mantilla, E., Gangoiti, G., García-Pando, C. P., Olid, M., Moreta, J. R., Hernández, J. L., Santamaría, J., Millán, M., and Querol, X.: Understanding the local and remote source contributions to ambient O3 during a pollution episode using a combination of experimental approaches in the Guadalquivir valley, southern Spain, Sci. Total Environ., 777, 144579, https://doi.org/10.1016/j.scitotenv.2020.144579, 2021.
Janssens-Maenhout, G., Crippa, M., Guizzardi, D., Muntean, M., Schaaf, E., Dentener, F., Bergamaschi, P., Pagliari, V., Olivier, J. G. J., Peters, J. A. H. W., van Aardenne, J. A., Monni, S., Doering, U., Petrescu, A. M. R., Solazzo, E., and Oreggioni, G. D.: EDGAR v4.3.2 Global Atlas of the three major greenhouse gas emissions for the period 1970–2012, Earth Syst. Sci. Data, 11, 959–1002, https://doi.org/10.5194/essd-11-959-2019, 2019.
Jiménez, P., Lelieveld, J., and Baldasano, J. M.: Multiscale modeling of air pollutants dynamics in the northwestern Mediterranean basin during a typical summertime episode, J. Geophys. Res.-Atmos., 11, D18306, https://doi.org/10.1029/2005JD006516, 2006.
Knapp, K. R.: Scientific data stewardship of International Satellite Cloud Climatology Project B1 global geostationary observations, J. Appl. Remote Sens., 2, 023548, https://doi.org/10.1117/1.3043461, 2008.
Lamarque, J.-F., Emmons, L. K., Hess, P. G., Kinnison, D. E., Tilmes, S., Vitt, F., Heald, C. L., Holland, E. A., Lauritzen, P. H., Neu, J., Orlando, J. J., Rasch, P. J., and Tyndall, G. K.: CAM-chem: description and evaluation of interactive atmospheric chemistry in the Community Earth System Model, Geosci. Model Dev., 5, 369–411, https://doi.org/10.5194/gmd-5-369-2012, 2012.
Massagué, J., Contreras, J., Campos, A., Alastuey, A., and Querol, X.: 2005–2018 trends in ozone peak concentrations and spatial contributions in the Guadalquivir Valley, southern Spain, Atmos. Environ., 254, 118385, https://doi.org/10.1016/j.atmosenv.2021.118385, 2021.
Millán, M. M., Artíñano, B., Alonso, L., Castro, M., Patier, R., and Goberna, J.: Meso-meteorological cycles of air pollution in the iberian peninsula, (MECAPIP), Contract EV4V-0097-E, Air Pollution Research Report 44, (Eur No. 14834) CEC-DG XII/E-1, E.GUYOT SA, Rue de la Loi, 200, 1992.
Millán, M. M., Salvador, R., Mantilla, E., and Kallos, G.: Photooxidant dynamics in the Mediterranean basin in summer: Results from European research projects, J. Geophys. Res.-Atmos., 102, 8811–8823, https://doi.org/10.1029/96JD03610, 1997.
Millán, M. M., Sanz, M. J., Salvador, R., and Mantilla, E.: Atmospheric dynamics and ozone cycles related to nitrogen deposition in the western Mediterranea, Environ. Pollut., 118, 167–18, https://doi.org/10.1016/S0269-7491(01)00311-6, 2002.
Mlawer, E. J., Taubman, S. J., Brown, P. D., Iacono, M. J., and Clough, S. A.: Radiative transfer for inhomogeneous atmospheres: RRTM, a validated correlated-k model for the longwave, J. Geophys. Res.-Atmos., 102, 16663–16682, https://doi.org/10.1029/97JD00237, 1997.
Monteiro, A., Strunk, A., Carvalho, A., Tchepel, O., Miranda, A. I., Borrego, C., Saavedra, S., Rodríguez, A., Souto, J., Casares, J., Friese, E., and Elbern, H.: Investigating a high ozone episode in a rural mountain site, Environ. Pollut., 162, 176–189, https://doi.org/10.1016/j.envpol.2011.11.008, 2012.
Monteiro, A., Gama, C., Cândido, M., Ribeiro, I., Carvalho, D., and Lopes, M.: Investigating ozone high levels and the role of sea breeze on its transport, Atmos. Pollut. Res., 7, 339–347, https://doi.org/10.1016/j.apr.2015.10.013, 2016.
Myneni, R. B., Hoffman, S., Knyazikhin, Y., Privette, J. L., Glassy, J., Tian, Y., Wang, Y., Song, X., Zhang, Y., Smith, G. R., Lotsch, A., Friedl, M., Morisette, J. T., Votava, P., Nemani, R. R., and Running, S. W.: Global products of vegetation leaf area and fraction absorbed PAR from year one of MODIS data, Remote Sens. Environ., 83, 214–231, https://doi.org/10.1016/S0034-4257(02)00074-3, 2002.
Navazo, M., Durana, N., Alonso, L., Gómez, M. C., García, J. A., Ilardia, J. L., Gangoiti, G., and Iza, J.: High temporal resolution measurements of ozone precursors in a rural background station. A two-year study, Environ. Monit. Assess., 136, 53–68, https://doi.org/10.1007/s10661-007-9720-4, 2008.
NCAR: The National Center for Atmospheric Research, Tropospheric Ultraviolet and Visible (TUV) Radiation Model, Atmospheric Chemistry Observations & Modeling (ACOM), https://www2.acom.ucar.edu/modeling/tropospheric-ultraviolet-and-visible-tuv-radiation-model (last access: 28 March 2022), 2011.
Nenes, A., Pandis, S. N., and Pilinis, C.: ISORROPIA: A New Thermodynamic Equilibrium Model for Multiphase Multicomponent Inorganic Aerosols, Aquat. Geochem., 4, 123–152, https://doi.org/10.1023/A:1009604003981, 1998.
Nenes, A., Pilinis, C., and Pandis, S. N.: Continued Development and Testing of a New Thermodynamic Aerosol Module for Urban and Regional Air Quality Models, Atmos. Environ., 33, 1553–156, https://doi.org/10.1016/S1352-2310(98)00352-5, 1999.
Oikonomakis, E., Aksoyoglu, S., Ciarelli, G., Baltensperger, U., and Prévôt, A. S. H.: Low modeled ozone production suggests underestimation of precursor emissions (especially NOx) in Europe, Atmos. Chem. Phys., 18, 2175–2198, https://doi.org/10.5194/acp-18-2175-2018, 2018.
Otte, T. L. and Pleim, J. E.: The Meteorology-Chemistry Interface Processor (MCIP) for the CMAQ modeling system: updates through MCIPv3.4.1, Geosci. Model Dev., 3, 243–256, https://doi.org/10.5194/gmd-3-243-2010, 2010.
Pay, M. T., Piot, M., Jorba, O., Gassó, S., Gonçalves, M., Basart, S., Dabdub, D., Jiménez-Guerrero, P., and Baldasano, J. M.: A full year evaluation of the CALIOPE-EU air quality modeling system over Europe for 2004, Atmos. Environ., 44, 3322–3342, https://doi.org/10.1016/j.atmosenv.2010.05.040, 2010.
Pay, M. T., Gangoiti, G., Guevara, M., Napelenok, S., Querol, X., Jorba, O., and Pérez García-Pando, C.: Ozone source apportionment during peak summer events over southwestern Europe, Atmos. Chem. Phys., 19, 5467–5494, https://doi.org/10.5194/acp-19-5467-2019, 2019.
Pires, J. C. M., Alvim-Ferraz, M. C. M., and Martins, F. G.: Surface ozone behaviour at rural sites in Portugal, Atmos. Res., 104–105, 164–171, https://doi.org/10.1016/j.atmosres.2011.10.001, 2012.
Querol, X., Alastuey, A., Reche, C., Orio, A., Pallares, M., Reina, F., Dieguez, J. J., Mantilla, E., Escudero, M., Alonso, L., Gangoiti, G., and Millán, M.: On the origin of the highest ozone episodes in Spain, Sci. Total Environ., 572, 379–389, https://doi.org/10.1016/j.scitotenv.2016.07.193, 2016.
Querol, X., Alastuey, A., Gangoiti, G., Perez, N., Lee, H. K., Eun, H. R., Park, Y., Mantilla, E., Escudero, M., Titos, G., Alonso, L., Temime-Roussel, B., Marchand, N., Moreta, J. R., Revuelta, M. A., Salvador, P., Artíñano, B., García dos Santos, S., Anguas, M., Notario, A., Saiz-Lopez, A., Harrison, R. M., Millán, M., and Ahn, K.-H.: Phenomenology of summer ozone episodes over the Madrid Metropolitan Area, central Spain, Atmos. Chem. Phys., 18, 6511–6533, https://doi.org/10.5194/acp-18-6511-2018, 2018.
Ramboll Environment and Health: User's Guide: Comprehensive Air Quality Model with Extensions, Version 6.5, Novato, California, https://www.camx.com/Files/CAMxUsersGuide_v6.50.pdf (last access: 26 March 2024), 2018.
Rodrigues, V., Gama, C., Ascenso, A., Oliveira, K., Coelho, S., Monteiro, A., Hayes, E., and Lopes, M.: Assessing air pollution in European cities to support a citizen centered approach to air quality management, Sci. Total Environ., 799, 149311, https://doi.org/10.1016/j.scitotenv.2021.149311, 2021.
Russo, A., Gouveia, C., Levy, I., Dayan, U., Jerez, S., Mendes, M., and Trigo, R.: Coastal recirculation potential affecting air pollutants in Portugal: The role of circulation weather types, Atmos. Environ., 135, 9–19, https://doi.org/10.1016/j.atmosenv.2016.03.039, 2016.
Sá, E., Tchepel, O., Carvalho, A., and Borrego, C.: Meteorological driven changes on air quality over Portugal: A KZ filter application, Atmos. Pol. Res., 6, 979–989, https://doi.org/10.1016/j.apr.2015.05.003, 2015.
Sáez de Cámara, E., Gangoiti, G., Alonso, L., Valdenebro, V., Aksoyoglu, S., and Oikonomakis, E.: Ozone Source Apportionment to Quantify Local-to-Continental Source Contributions to Episodic Events in Northern Iberia, Air Pollution Modeling and its Application XXV, edited by: Mensink, C. and Kallos, G., Springer Cham, 361–365, https://doi.org/10.1007/978-3-319-57645-9_57, 2018.
Saha, S., Moorthi, S., Wu, X., Wang, J., Nadiga, S., Tripp, P., Behringer, D., Hou, Y.-T., Chuang, H., Iredell, M., Ek, M., Meng, J., Yang, R., Mendez, M. P., Dool, H. van den, Zhang, Q., Wang, W., Chen, M., and Becker, E.: The NCEP Climate Forecast System Version 2, J. Climate, 27, 2185–2208, https://doi.org/10.1175/JCLI-D-12-00823.1, 2014.
Silva, R. C. V. and Pires, J. C. M.: Surface Ozone Pollution: Trends, Meteorological Influences, and Chemical Precursors in Portugal, Sustainability, 14, 2383, https://doi.org/10.3390/su14042383, 2022.
Sindelarova, K., Granier, C., Bouarar, I., Guenther, A., Tilmes, S., Stavrakou, T., Müller, J.-F., Kuhn, U., Stefani, P., and Knorr, W.: Global data set of biogenic VOC emissions calculated by the MEGAN model over the last 30 years, Atmos. Chem. Phys., 14, 9317–9341, https://doi.org/10.5194/acp-14-9317-2014, 2014.
Skamarock, W. C., Klemp, J. B., Dudhia, J., Gill, D. O., Barker, D., Duda, M. G., Huang, X. Y., Wang, W., and Powers, J. G.: A Description of the Advanced Research WRF Version 3 (No. NCAR/TN-475+STR), University Corporation for Atmospheric Research, https://doi.org/10.5065/D68S4MVH, 2008.
Torre-Pascual, E.: Simulations of tropospheric O3 in the Atlantic coast of the Iberian Peninsula, Zenodo [data set], https://doi.org/10.5281/zenodo.10886332, 2024.
Torre-Pascual, E., Sáez de Cámara, E., Gangoiti, G., and Zuazo, I.: Biogenic VOC Emission Modeling for Spain: Adaptation of the National Forest Inventory as Input for MEGANv3, Air Pollution Modeling and its Application XXVII, edited by: Mensink, C. and Volker, M., Springer, 45–50, https://doi.org/10.1007/978-3-662-63760-9_7, 2021.
Torre-Pascual, E., Ferreira, J., Sáez de Cámara, E., Gama, C., and Gangoiti, G.: Ozone Episodes in Northern and Western Iberia: Understanding and Quantifying the Sources and Transport Mechanisms by Integrated Process Analysis, Air Pollution Modeling and its Application XXVIII, ITM 2021, edited by: Mensink, C. and Jorba, O., Springer Proceedings in Complexity, Springer, Cham, https://doi.org/10.1007/978-3-031-12786-1_21, 2023.
U.S. EPA: SPECIATE Version 4.5, Database Development Documentation, U.S. Environmental Protection Agency, EPA/600/R-16/294, https://www.epa.gov/sites/default/files/2016-09/documents/speciate_4.5.pdf (last access: 1 May 2021), 2016.
Valdenebro, V., Gangoiti, G., Albizuri, A., Alonso, L., Navazo, M., García, J. A., Iza, J., and Millán, M. M.: Build-up and decay of two ozone episodes through northern Iberia and southern France – An inter-regional transport analysis, Atmos. Environ., 45, 1595–1603, https://doi.org/10.1016/j.atmosenv.2010.12.031, 2011.
Valverde, V., Pay, M. T., and Baldasano, J. M.: Ozone attributed to Madrid and Barcelona on-road transport emissions: Characterization of plume dynamics over the Iberian Peninsula, Sci. Total Environ., 543, 670–682, https://doi.org/10.1016/j.scitotenv.2015.11.070, 2016.
Yang, W., Tan, B., Huang, D., Rautiainen, M., Shabanov, N. V., Wang, Y, Privette, J. L., Huemmrich, K. F., Fensholt, R., Sandholt, I., Weiss, M., Ahl, D. E., Gower, S. T., Nemani, R. R., Knyazikhin, Y., and Myneni, R. B.: MODIS leaf area index products: From validation to algorithm improvement, IEEE T. Geosci. Remote, 44, 1885–1898, https://doi.org/10.1109/TGRS.2006.871215, 2006.
Yuan, H., Dai, Y., Xiao, Z., Ji, D., and Shangguan, W.: Reprocessing the MODIS Leaf Area Index products for land surface and climate modelling, Remote Sens. Environ., 115, 1171–1187, https://doi.org/10.1016/j.rse.2011.01.001, 2011.
Zhang, L., Gong, S., Padro, J., and Barrie, L.: A size-segregated particle dry deposition scheme for an atmospheric aerosol module, Atmos. Environ., 35, 549–560, https://doi.org/10.1016/S1352-2310(00)00326-5, 2001.
Zhang, L., Brook, J. R., and Vet, R.: A revised parameterization for gaseous dry deposition in air-quality models, Atmos. Chem. Phys., 3, 2067–2082, https://doi.org/10.5194/acp-3-2067-2003, 2003.
Zuazo, I., Torre-Pascual, E., and García, J. A.: Evaluation of Satellite Vegetation Indices for BVOC Emission Modelling. Case Study: Basque Country, Air Pollution Modeling and its Application XXVIII, ITM 2021, edited by: Mensink, C. and Jorba, O., Springer Proceedings in Complexity, Springer, Cham, https://doi.org/10.1007/978-3-031-12786-1_41, 2023.