the Creative Commons Attribution 4.0 License.
the Creative Commons Attribution 4.0 License.
 | 03 Apr 2024
Simulation of ozone–vegetation coupling and feedback in China using multiple ozone damage schemes
Jiachen Cao
Mingrui Ma
As a phytotoxic pollutant, surface ozone (O3) not only affects plant physiology but also influences meteorological fields and air quality by altering leaf stomatal functions. Previous studies revealed strong feedbacks of O3–vegetation coupling in China but with large uncertainties due to the applications of varied O3 damage schemes and chemistry–vegetation models. In this study, we quantify the O3 vegetation damage and the consequent feedbacks to surface meteorology and air quality in China by coupling two O3 damage schemes (S2007 vs. L2013) into a fully coupled regional meteorology–chemistry model. With different schemes and damaging sensitivities, surface O3 is predicted to decrease summertime gross primary productivity by 5.5 %–21.4 % and transpiration by 5.4 %–23.2 % in China, in which the L2013 scheme yields 2.5–4 times of losses relative to the S2007 scheme. The damage to the photosynthesis of sunlit leaves is ∼ 2.6 times that of shaded leaves in the S2007 scheme but shows limited differences in the L2013 scheme. Though with large discrepancies in offline responses, the two schemes yield a similar magnitude of feedback to surface meteorology and O3 air quality. The O3-induced damage to transpiration increases national sensible heat by 3.2–6.0 W m−2 (8.9 % to 16.2 %), while reducing latent heat by 3.3–6.4 W m−2 (−5.6 % to −17.4 %), leading to a 0.2–0.51 °C increase in surface air temperature and a 2.2 %–3.9 % reduction in relative humidity. Meanwhile, surface O3 concentrations on average increase by 2.6–4.4 µg m−3, due to the inhibitions of stomatal uptake and the anomalous enhancement in isoprene emissions, the latter of which is attributed to the surface warming by O3–vegetation coupling. Our results highlight the importance of O3 control in China due to its adverse effects on ecosystem functions, global warming, and O3 pollution through O3–vegetation coupling.
- Article
(8920 KB) - Full-text XML
-
Supplement
(1604 KB) - BibTeX
- EndNote


Surface ozone (O3) is one of the most enduring air pollutants affecting air quality in China, with detrimental effects on human health and ecosystem functions (Monks et al., 2015). Long-term observations and numerical simulations have shown that O3 affects stomatal conductance (Li et al., 2017), accelerates vegetation aging (Feng et al., 2015), and reduces photosynthesis (Wittig et al., 2007). These negative effects altered carbon allocation (Yue and Unger, 2014; Lombardozzi et al., 2015) and inhibited plant growth (Li et al., 2016b), suppressing ecosystem carbon uptake (Ainsworth et al., 2012). Moreover, these effects have profound implications for global/regional climate and atmospheric environment. Given the significant ecological impacts, a systematic quantification of the O3 vegetation damage effect in China is of great importance for a better understanding of the side effects of O3 pollution on both regional carbon uptake and climate change.
At present, field experiments on O3-induced vegetation damage have been conducted in China but were mostly confined to individual monitoring sites. For instance, Su et al. (2017) conducted experiments on grassland in Inner Mongolia and found that elevated O3 concentrations resulted in a decrease of approximately 20 % in the photosynthetic rate of herbaceous plants. Meta-analysis of tropical, subtropical, and temperate tree species in China found that increased O3 concentrations reduced net photosynthesis and total biomass of Chinese woody plants by 28 % and 14 %, respectively (Li et al., 2017). However, most of these experiments were conducted using open-top chambers with artificially controlled O3 concentrations, rather than actual surface O3 concentrations, making it difficult to quantitatively estimate the impact of ambient O3 on vegetation productivity. Furthermore, the spatial coverage of field experiments is limited, which hinders the direct use of observational data for assessing O3 vegetation damage in different regions of China.
Alternatively, numerical models provide a more feasible approach to quantifying the O3-induced vegetation damage from the regional to global scales. Currently, there are three main parameterizations for the calculation of ozone vegetation damage. Felzer et al. (2004) established an empirical scheme based on the Accumulated Ozone exposure over a Threshold of 40 ppb (AOT40) within the framework of a terrestrial ecosystem model. They further estimated that O3 pollution in the United States led to a decrease in net primary productivity (NPP) by 2.6 % to 6.8 % during the period of 1980–1990. However, the AOT40 is related to O3 concentrations alone and ignores the biological regulations on the O3 stomatal uptake, leading to inconsistent tendencies between O3 pollution level and plant damage at the drought conditions (Gong et al., 2021). In acknowledgement of such a deficit, Sitch et al. (2007) proposed a semi-mechanistic scheme calculating O3 vegetation damage based on the stomatal uptake of O3 fluxes and the coupling between stomatal conductance and leaf photosynthesis. Yue and Unger (2014) implemented this scheme into the Yale Interactive terrestrial Biosphere (YIBs) model. Taking into account varied O3 sensitivities of different vegetation types, they estimated that surface O3 led to reductions of 2 %–5 % in the summer gross primary productivity (GPP) in the eastern US from 1998 to 2007. Later, Lombardozzi et al. (2013) conducted a meta-analysis using published chamber data and found different levels of responses to O3 exposure between stomatal conductance and photosynthesis. They further implemented the independent response relationships into the Community Land Model (CLM) and estimated that current ozone levels led to a reduction in global GPP by 8 %%–12 % (Lombardozzi et al., 2015).
The O3 stress on vegetation physiology can feed back to affect regional climate. Lombardozzi et al. (2015) employed the CLM model and found that current O3 exposure reduced transpiration by 2 %–2.4 % globally and up to 15 % regionally over the eastern US, Europe, and Southeast Asia, leading to further perturbations in the surface energy balance. In the US, Li et al. (2016a) found that the O3 vegetation damage reduced latent heat (LH) flux, precipitation, and runoff by 10–27 W m−2, 0.9–1.4 mm d−1, and 0.1–0.17 mm d−1, respectively, and increased surface air temperature by 0.6–2.0 °C during the summer of 2007–2012. In China, Zhu et al. (2022) performed simulations and found that the inclusion of O3–vegetation interaction caused a 5–30 W m−2 decrease in LH, 0.2–0.8 °C increase in surface air temperature, and 3 % reduction in relative humidity during summers of 2014–2017. Recently, Jin et al. (2023) applied a different regional model and estimated that O3 exposure weakened plant transpiration and altered surface heat flux in China, resulting in a significant increase of up to 0.16 °C in the maximum daytime temperature and decrease of −0.74 % in the relative humidity. However, all of these previous estimates of O3-induced feedback to climate were derived using the empirical O3 damage scheme proposed by Lombardozzi et al. (2013), which assumed fixed damage ratios independent of the O3 dose for some vegetation species and, as a result, may have biases in the further estimated feedback to climate.
The O3–vegetation coupling also has intricate implications for air quality. On one hand, O3–vegetation coupling can influence meteorological conditions that affect O3 generation, ultimately influencing the O3 level (Sadiq et al., 2017). On the other hand, it can also influence biogenic emissions and dry deposition, thereby affecting O3 concentrations (Gong et al., 2020). Sadiq et al. (2017) implemented O3–vegetation coupling in the Community Earth System Model (CESM) and estimated that surface O3 concentrations increased 4–6 ppb in Europe, North America, and China due to O3–vegetation coupling. Using the CLM model with the empirical scheme of Lombardozzi et al. (2013), Zhou et al. (2018) found that O3-induced damage on leaf area index (LAI) could lead to changes in global O3 concentrations by −1.8 to +3 ppb in boreal summer. Gong et al. (2020) used the O3 damage scheme from Sitch et al. (2007) embedded in a global climate–chemistry–carbon coupled model and estimated that O3-induced stomatal inhibition led to an average surface O3 increase of 1.2–2.1 ppb in eastern China and 1.0–1.3 ppb in western Europe. Different from the above global simulations with coarse resolutions, regional modeling with a fine resolution can reveal more detail about O3–vegetation coupling and feedback to surface O3 concentrations in China (Zhu et al., 2022; Jin et al., 2023). However, all these regional simulations were carried out using the O3 damage scheme of Lombardozzi et al. (2013), limiting the exploration of model uncertainties due to varied O3 vegetation damage schemes.
In this study, we implemented O3 vegetation damage schemes from both Sitch et al. (2007) and Lombardozzi et al. (2013) into the widely used regional meteorology–chemistry model WRF-Chem (Weather Research and Forecasting model with Chemistry). We validated the simulated meteorology and O3 concentrations and performed sensitivity experiments to explore the O3 damage to GPP and consequent feedbacks to regional climate and air quality in China. Within the same framework, we compared the differences in the O3–vegetation coupling from two schemes and explored the causes for the discrepancies. We aimed to quantify the modeling uncertainties in the up-to-date estimates of O3 impact on regional carbon fluxes and its feedback to regional climate and air quality in China.
2.1 WRF-Chem model
We used WRF-Chem model version 3.9.1 to simulate meteorological fields and O3 concentration in China. The model includes atmospheric physics and dynamical processes, atmospheric chemistry, and biophysical and biochemical processes (Grell et al., 2005; Skamarock and Klemp, 2008). The model domain is configured with 196 × 160 grid cells at 27 km horizontal resolution on the Lambert conformal projection and covers the entire mainland China. In the vertical direction, 28 layers are set extending from surface to 50 hPa. The meteorological initial and boundary conditions were adopted from ERA5 reanalysis produced by the European Centre for Medium-Range Weather Forecasts (ECMWF) at a horizontal resolution of 0.25° × 0.25° (Hersbach et al., 2020). The chemical initial and boundary conditions were generated from the Model for Ozone and Related Chemical Tracer version 4 (MOZART-4), which is available at a horizontal resolution of 1.9° × 2.5° with 56 vertical layers (Emmons et al., 2010).
Anthropogenic emissions are adopted from the 0.25° Multi-resolution Emission Inventory for China (MEIC) and MIX Asian emission inventory for the other regions (available at http://meicmodel.org, last access: 26 March 2024). Biogenic emissions are calculated online using the Model of Emissions of Gases and Aerosols from Nature (Guenther et al., 2006), which considers the impacts of plant types, weather conditions, and leaf area on vegetation emissions. Atmospheric chemistry is simulated using the Carbon Bond Mechanism version Z (CBM-Z) (Zaveri and Peters, 1999) gas-phase chemistry module coupled with a four-bin sectional Model for Simulating Aerosol Interactions and Chemistry (MOSAIC) (Zaveri et al., 2008). The photolysis scheme is based on the Madronich fast-TUV photolysis module (Tie et al., 2003). The physical configurations include the Morrison double-moment microphysics scheme (Morrison et al., 2009), the Grell-3 cumulus scheme (Grell et al., 2002), the rapid radiative transfer model longwave radiation scheme (Mlawer et al., 1997), the Goddard shortwave radiation scheme (Chou and Suarez, 1994), the Yonsei University planetary boundary layer scheme (Hong et al., 2006), and the revised MM5 (Fifth-Generation Penn State/NCAR Mesoscale Model) Monin–Obukhov surface layer scheme.
2.2 Noah-MP model
Noah-MP is a land surface model coupled to WRF-Chem, with multiple options for key land–atmosphere interaction processes (Niu et al., 2011). Noah-MP considers the canopy structure with canopy height and crown radius and depicts leaves with prescribed dimensions, orientation, density, and radiometric properties. The model employs a two-stream radiative transfer approach for surface energy and water transfer processes (Dickinson, 1983). Noah-MP is capable of distinguishing photosynthesis pathways between C3 and C4 plants and defines vegetation-specific parameters for leaf photosynthesis and respiration.
Noah-MP considers prognostic vegetation growth through the coupling between photosynthesis and stomatal conductance (Farquhar et al., 1980; Ball et al., 1987). The photosynthesis rate, A (), is calculated as one of three limiting factors as follows:
where Wc is the RuBisCo-limited photosynthesis rate, Wj is the light-limited photosynthesis rate, and We is the export-limited photosynthesis rate. Igs is the growing season index, with values ranging from 0 to 1. Stomatal conductance (gs) is computed based on the photosynthetic rate as follows:
where b is the minimum stomatal conductance, m is the Ball–Berry slope of the conductance–photosynthesis relationship, Anet is the net photosynthesis by subtracting dark respiration from Atot, and Cs is the ambient CO2 concentration at the leaf surface. The assimilated carbon is allocated to various parts of vegetation (leaf, stem, wood, and root) and soil carbon pools (fast and slow), which determines the variations in the LAI and canopy height. Plant transpiration rate is then estimated using the dynamic LAI and stomatal conductance. Noah-MP also distinguishes the photosynthesis of sunlit and shaded leaves. Sunlit leaves are more limited by CO2 concentration, while shaded leaves are more constrained by insolation, leading to varied responses to O3 damage.
2.3 Scheme for ozone damage on vegetation
We implemented the O3 vegetation damage schemes proposed by Sitch et al. (2007) (hereafter S2007) and Lombardozzi et al. (2013) (hereafter L2013) into the Noah-MP. In the S2007 scheme, the undamaged fraction F for net photosynthesis is dependent on the sensitivity parameter aPFT and excessive area-based stomatal O3 flux, which is calculated as the difference between and threshold yPFT:
where aPFT and yPFT are specifically determined for individual plant functional types (PFTs) based on measurements (Table 1). The stomatal O3 flux is calculated as
where [O3] is the O3 concentration at the reference level (nmol m−3), and ra is the aerodynamic and boundary layer resistance between leaf surface and reference level (s m−1). = 1.67 represents the ratio of leaf resistance for O3 to that for water vapor. rs represents stomatal resistance (s m−1). For the S2007 scheme, stomatal conductance is damaged with the same ratio (1-F) as photosynthesis and further affects O3 uptake. In Noah-MP, the are calculated separately for sunlit and shaded leaves with corresponding stomatal resistance (Text S1 in the Supplement).
Table 1Parameters used for the S2007 O3 damage scheme a.
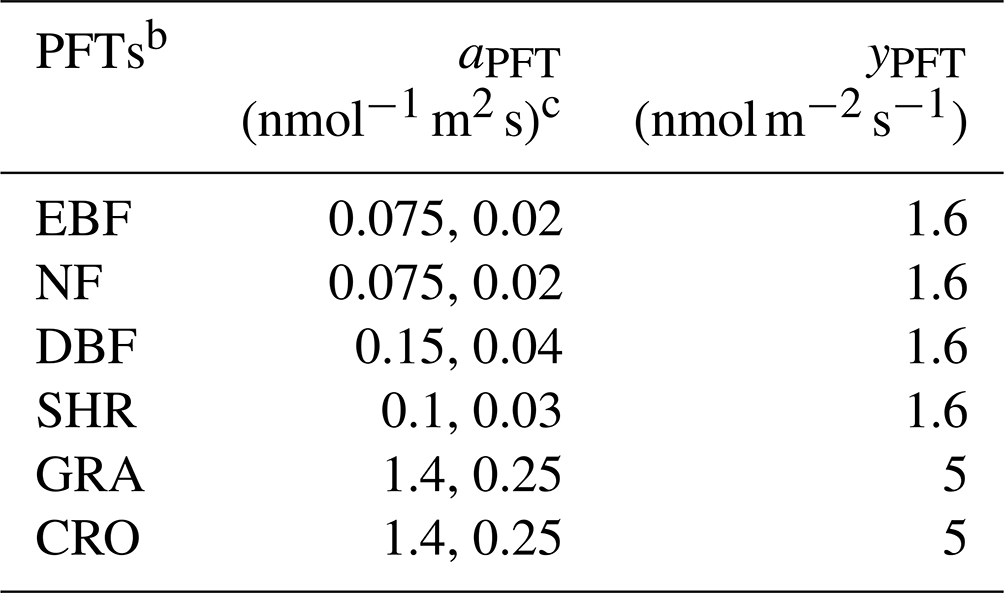
a The data source is Sitch et al. (2007). b The plant functional types (PFTs) include evergreen broadleaf forest (EBF), needleleaf forest (NF), deciduous broadleaf forest (DBF), shrubland (SHR), grassland (GRA), and cropland (CRO). c The first number is for high sensitivity and the second is for low sensitivity.
As a comparison, the L2013 scheme applies separate O3-damaging relationships for the photosynthetic rate and stomatal conductance. These independent relationships account for different plant groups and are calculated based on the cumulative uptake of O3 (CUO) under different levels of chronic O3 exposure. The leaf-level CUO (mmol m−2) is calculated by accumulating stomatal O3 fluxes of Eq. (4) from the start of the growing season to the specific time step with mean LAI > 0.5 (Lombardozzi et al., 2012), when vegetation is most vulnerable to air pollution episodes. O3 uptake is only accumulated when O3 flux is above an instantaneous threshold of 0.8 to account for ozone detoxification by vegetation at low O3 levels (Lombardozzi et al., 2015). We also include a leaf turnover rate for evergreen plants so that the accumulation of O3 flux does not last beyond the average foliar lifetime. The O3-damaging ratios depend on CUO, with empirical linear relationships as follows:
where and are the ozone damage ratios for photosynthesis and stomatal conductance, respectively. The slopes (ap for photosynthesis and ac for stomatal conductance) and intercepts (bp for photosynthesis and bc for stomatal conductance) of regression functions are determined based on the meta-analysis of hundreds of measurements (Table 2). The ratios predicted in Eqs. (5) and (6) are applied to photosynthesis and stomatal conductance, respectively, to account for their independent responses to O3 damages. In Noah-MP, the and are calculated separately for sunlit and shaded leaves based on corresponding stomatal resistance (Text S1).
Table 2Slopes and intercepts used for the L2013 O3 damage scheme∗.
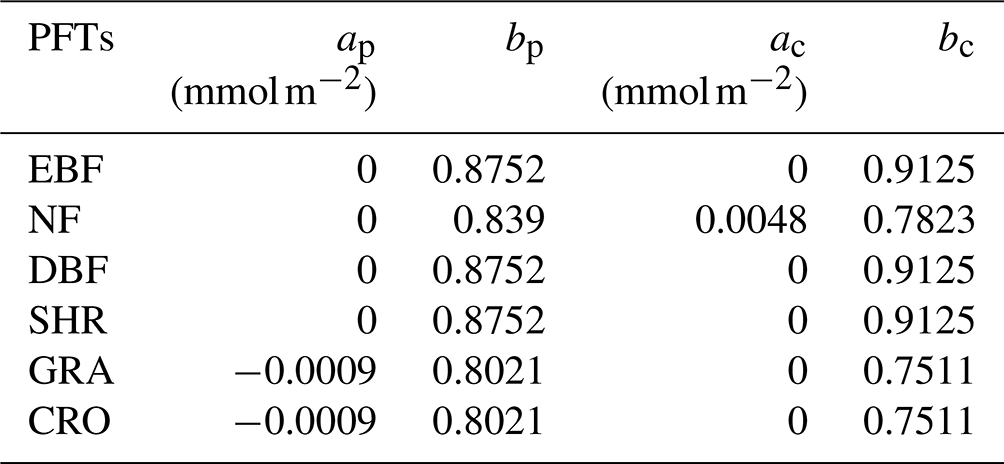
∗ The data source is Lombardozzi et al. (2015). Due to the data limit, we apply the same sensitivity parameters for EBF, DBF, and SHR.
2.4 Observational data
We validated the simulated meteorology and air pollutants with observations. The meteorological data were downloaded from the National Meteorological Information Center of the China Meteorological Administration (CMA Meteorological Data Centre, 2023; http://data.cma.cn/data/detail/dataCode/A.0012.0001.html, last access: 26 March 2024). The daily averaged surface pressure (PRES), wind speed at a height of 10 m (WS10), relative humidity (RH), and temperature at a height of 2 m (T2) were collected from 839 ground stations. Hourly surface O3 concentrations at 1597 sites in China were collected from Chinese National Environmental Monitoring Centre (CNEMC, https://air.cnemc.cn:18007/, last access: 26 March 2024).
2.5 Simulations
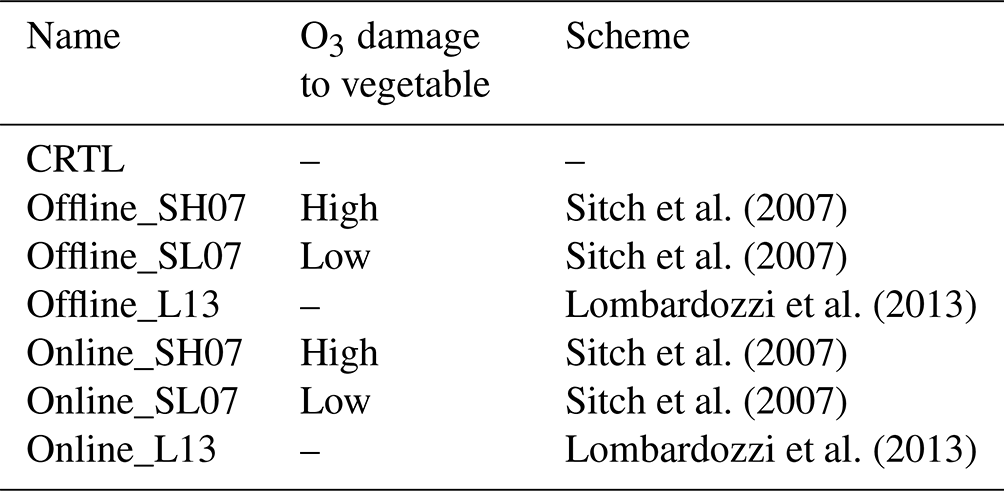
We performed seven experiments to quantify the damaging effects of ambient O3 on GPP and the feedbacks to regional climate and air quality (Table 3). All simulations are conducted from 1 May to 31 August of 2017, with the first month excluded from the analysis as the spin-up. The control simulations (CRTL) excluded the impact of ozone on vegetation. Three offline simulations were performed with the same settings as the CTRL run, except that O3 vegetation damages were calculated and output without feedback to affect vegetation growth. These offline runs were established using either the S2007 scheme (Offline_SH07 for high sensitivity and Offline_SL07 for low sensitivity) or the L2013 scheme (Offline_L13). As a comparison, three online simulations applied the S2007 scheme (Online_SH07 for high sensitivity and Online_SL07 for low sensitivity) and the L2013 scheme (Online_L13) to estimate the O3 damages to GPP, which further influenced LAI development, leaf transpiration, and dry deposition. The differences between CTRL and online runs indicated the responses of surface meteorology and O3 concentrations to the O3-induced vegetation damages.
3.1 Model evaluations
We compared the simulated summer near-surface temperature, relative humidity, wind speed, and surface O3 concentrations to observations. The model reasonably reproduces the spatial pattern of higher near-surface temperature in southeast and northwest and lower temperature over the Tibetan Plateau (Fig. 1a). On the national scale, the near-surface temperature is underestimated with a mean bias (MB) of 1.04 °C, but it shows a high correlation (R = 0.96). Unlike temperature, simulated relative humidity is overestimated with a MB of 5.04 % but a high R of 0.93 (Fig. 1b). Due to the modeling biases in the topographic effects, simulated wind speed is overestimated by more than 1.06 m s−1 on the national scale (Fig. 1c). Such an overestimation was also reported in other studies using WRF models (Hu et al., 2016; Liu and Wang, 2020; Zhu et al., 2022).
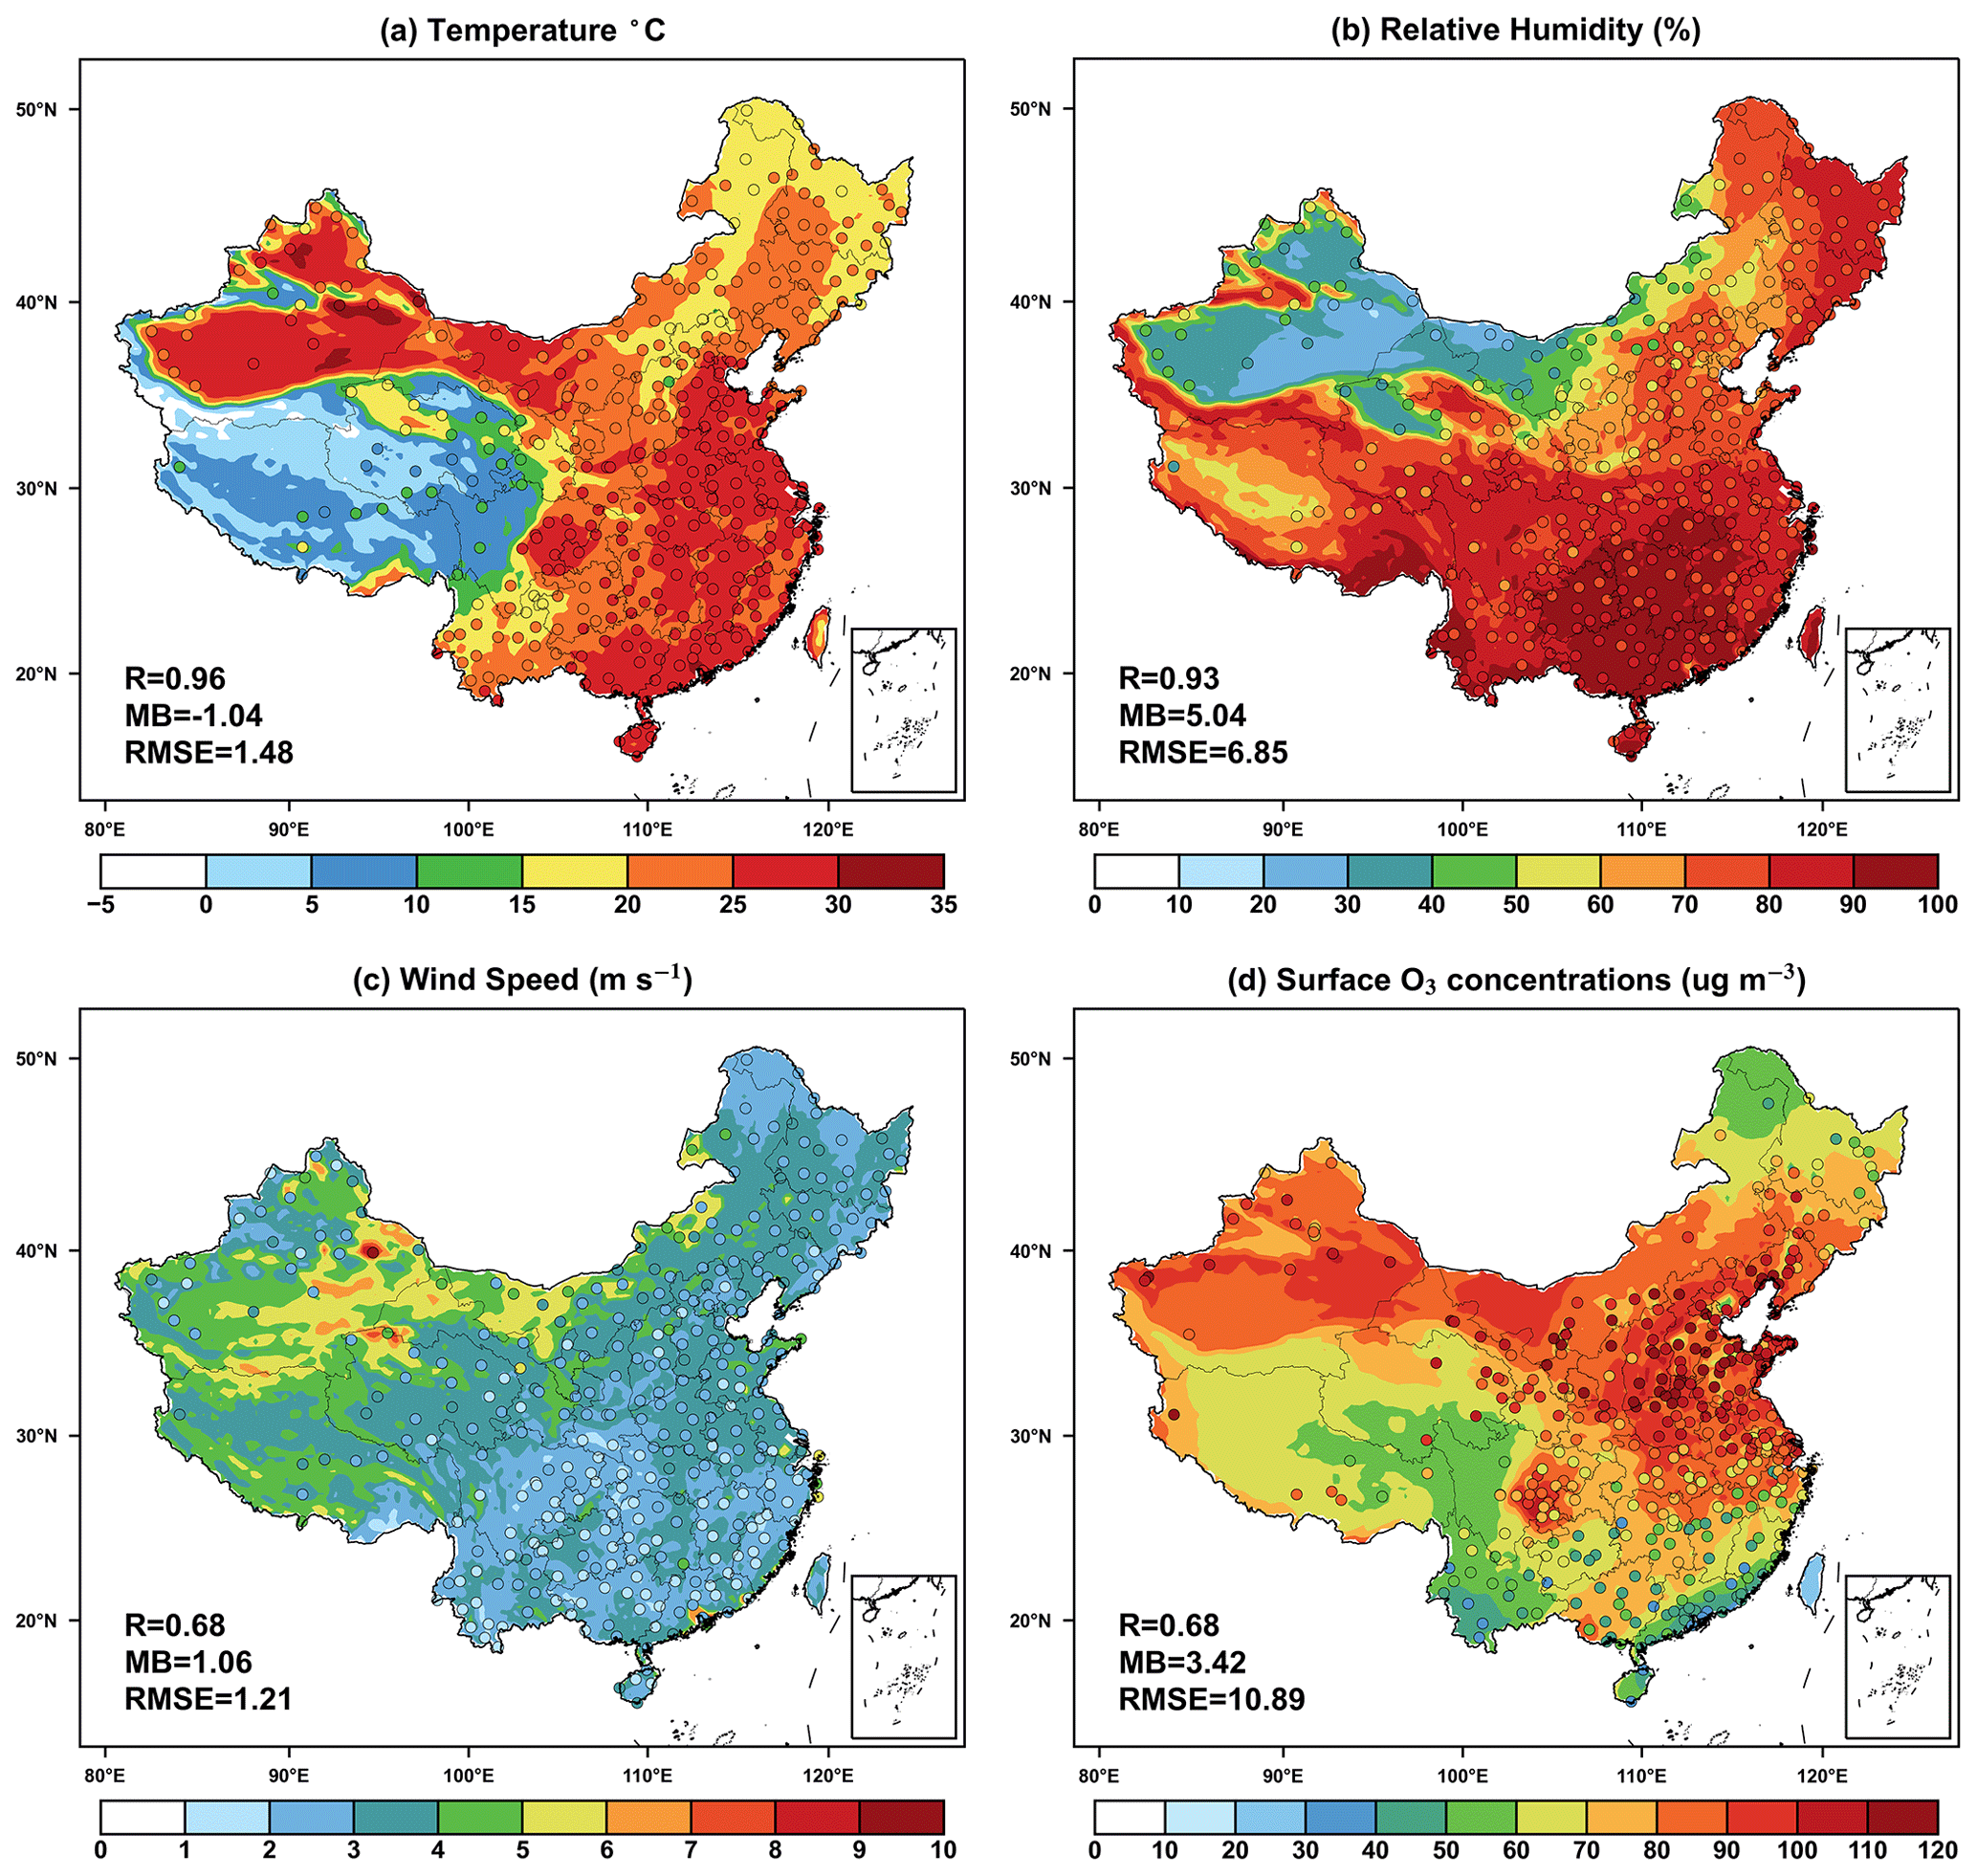
Figure 1Evaluations of simulated summer (June–August) daily (24 h average) (a) near-surface temperature, (b) relative humidity, (c) wind speed, and (d) surface O3 concentrations in China. The dots represent the site-level observations. The correlation coefficients (R), mean biases (MBs), and root mean square error (RMSE) for the comparisons are shown in the lower-left corner of each panel. Publisher's remark: please note that Figs. 1–7 contain disputed territories.
Comparisons with the measurements from air quality sites show that the simulated O3 deviates from the observed mean concentrations by 5.42 µg m−3 with a spatial R of 0.68. The model reasonably captures the hotspots over the North China Plain though with some overestimations, potentially attributed to uncertain emissions and coarse model resolutions. Such elevated bias in summer O3 is a common issue for both global and regional models over Asia. For example, Zhu et al. (2022) reported the overestimated summer average ozone concentration by 13.82 µg m−3 in China. Liu and Wang (2020) reached positive biases ranging from 3.7 µg m−3 to 13.32 µg m−3, using the WRF-CMAQ (Community Multiscale Air Quality) model. Overall, the WRF-Chem model shows reasonable performance in the simulation of surface meteorology and O3 concentrations in China.
3.2 Offline O3 damage
We compared the offline O3 damage to photosynthesis between sunlit (PSNSUN) and shaded (PSNSHA) leaves during the summer. The S2007 scheme is dependent on instantaneous O3 uptake, which peaks in July when both O3 concentrations and stomatal conductance are high (Figs. S1 and S2 in the Supplement). For the same O3 pollution level, the damages are much higher for the sunlit leaves (Fig. 2a and b) than that for the shaded leaves (Fig. 2d and e) because of the higher stomatal conductance linked with the more active photosynthesis for the sunlit leaves. In contrast, the L2013 scheme depends on the accumulated O3 flux and assumes constant damages for some PFTs (Table 2), resulting in reductions in the photosynthesis even at low O3 concentrations. The O3 damage to photosynthesis of sunlit and shaded leaves increases month by month, reaching a maximum in August (Figs. S1 and S2). We found limited differences in the O3 damages between sunlit (Fig. 2c) and shaded (Fig. 2f) leaves with the L2013 scheme. Observations have reported that surface O3 has limited impacts on the shaded leaves (Wan et al., 2014), consistent with the results simulated by the S2007 scheme.
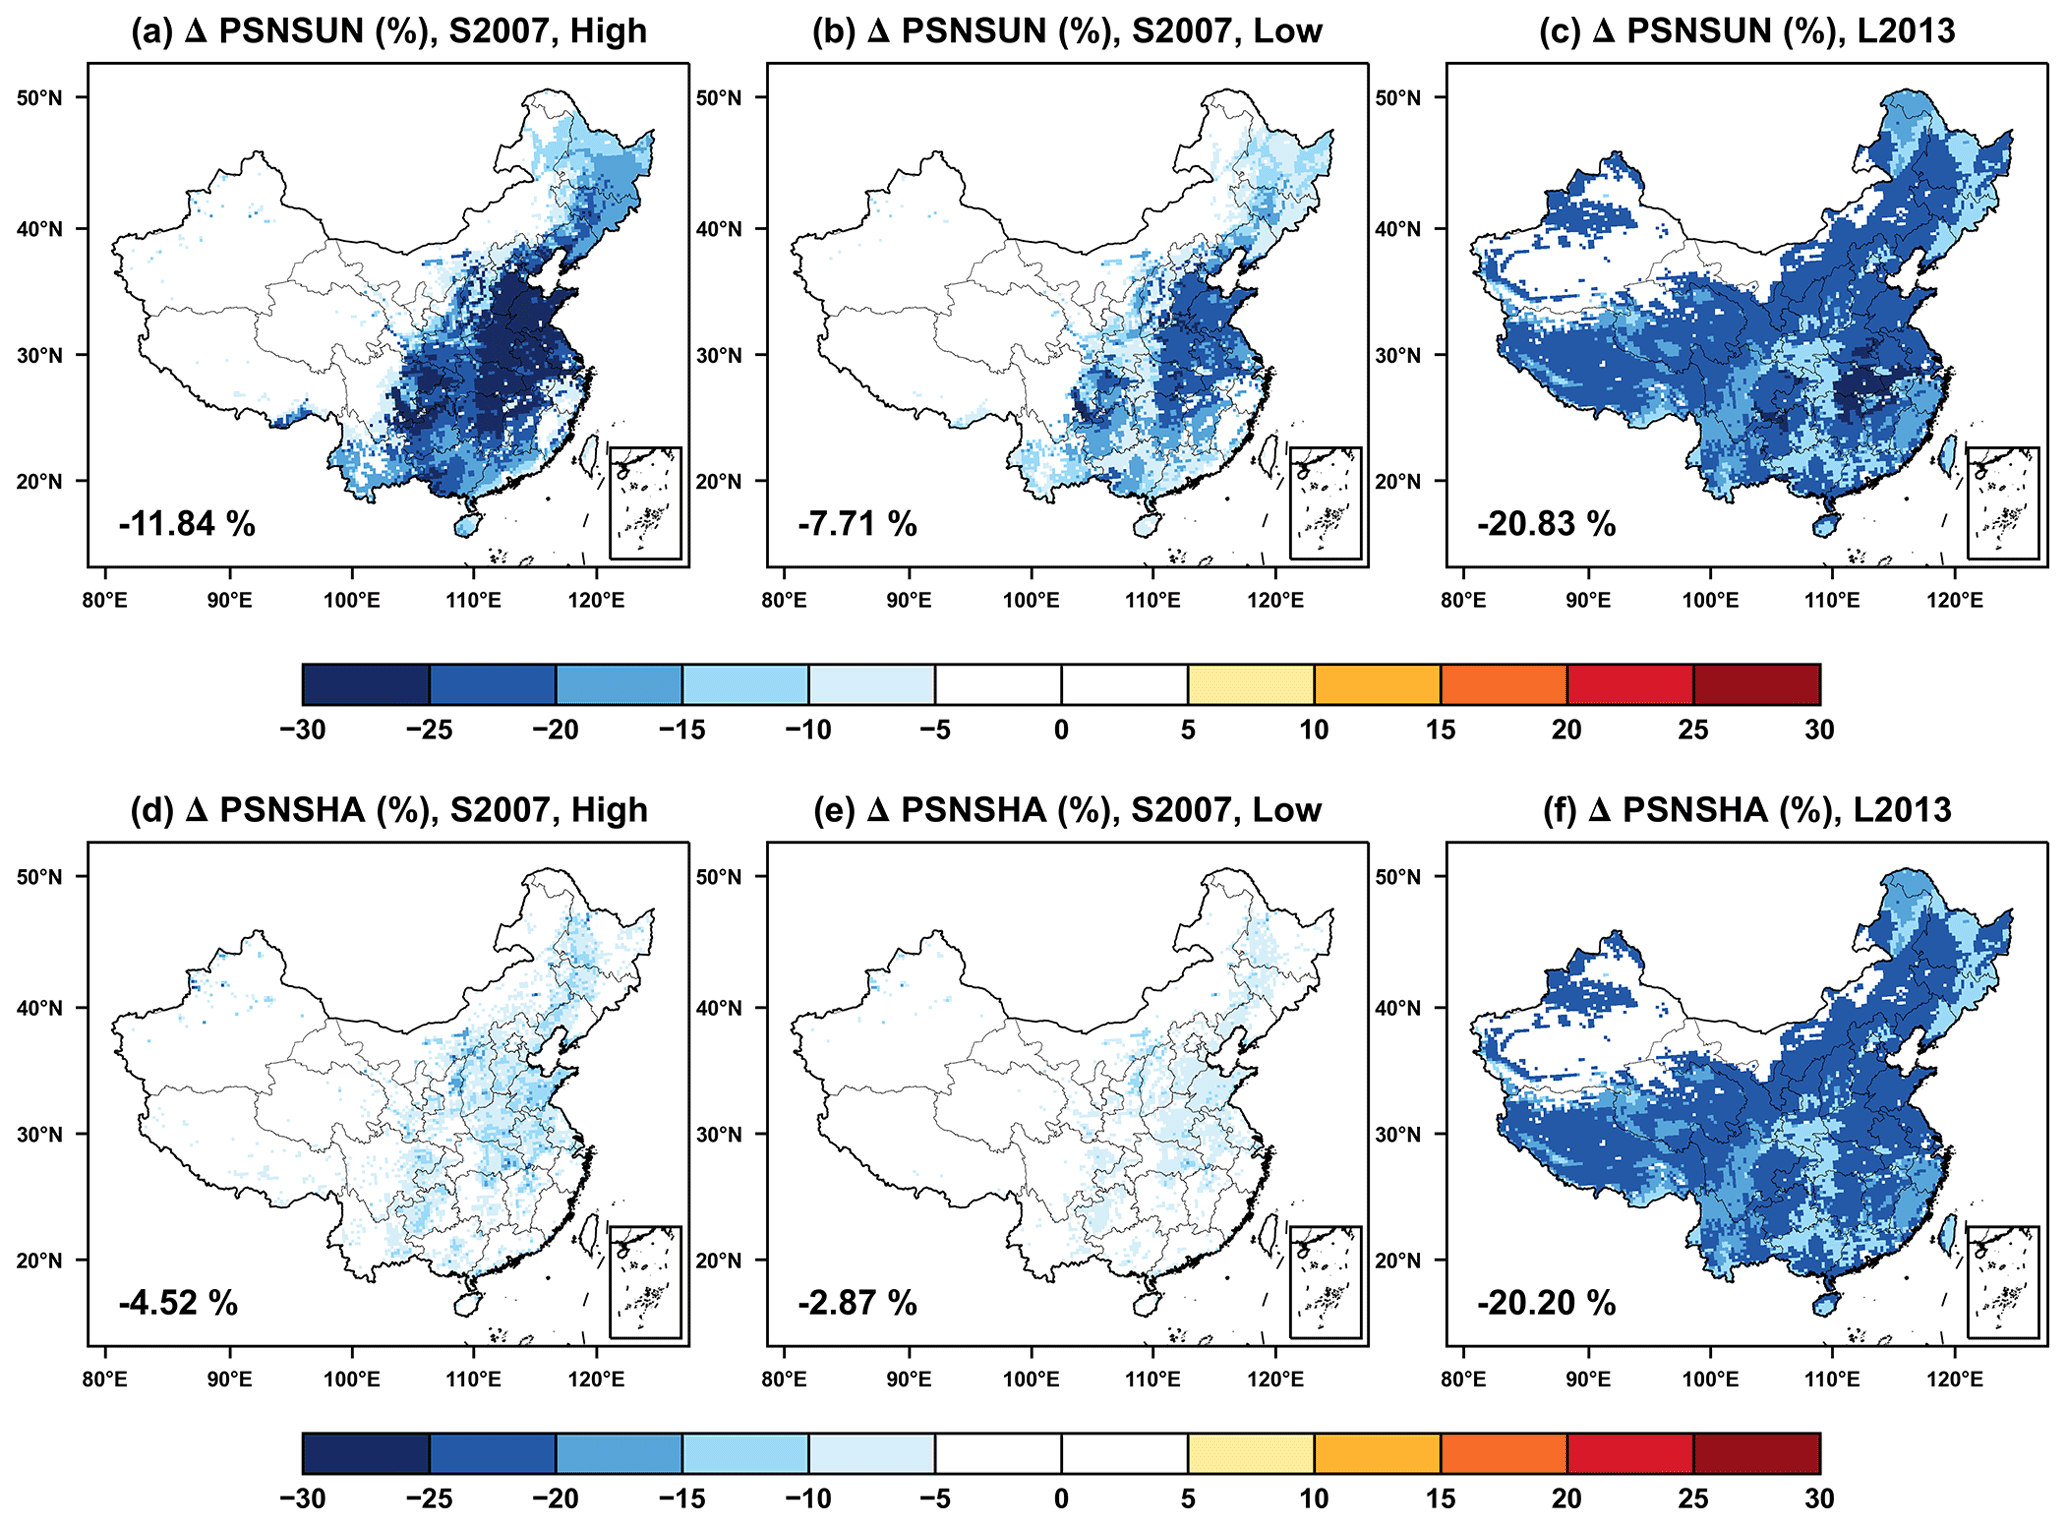
Figure 2Offline O3 damage (%) to the summertime photosynthesis of (a–c) sunlit and (d–f) shaded leaves predicted by the S2007 scheme with (a, d) high and (b, e) low sensitivities or the (c, f) L2013 scheme. The area-weighted percentage changes are shown in the lower-left corner.
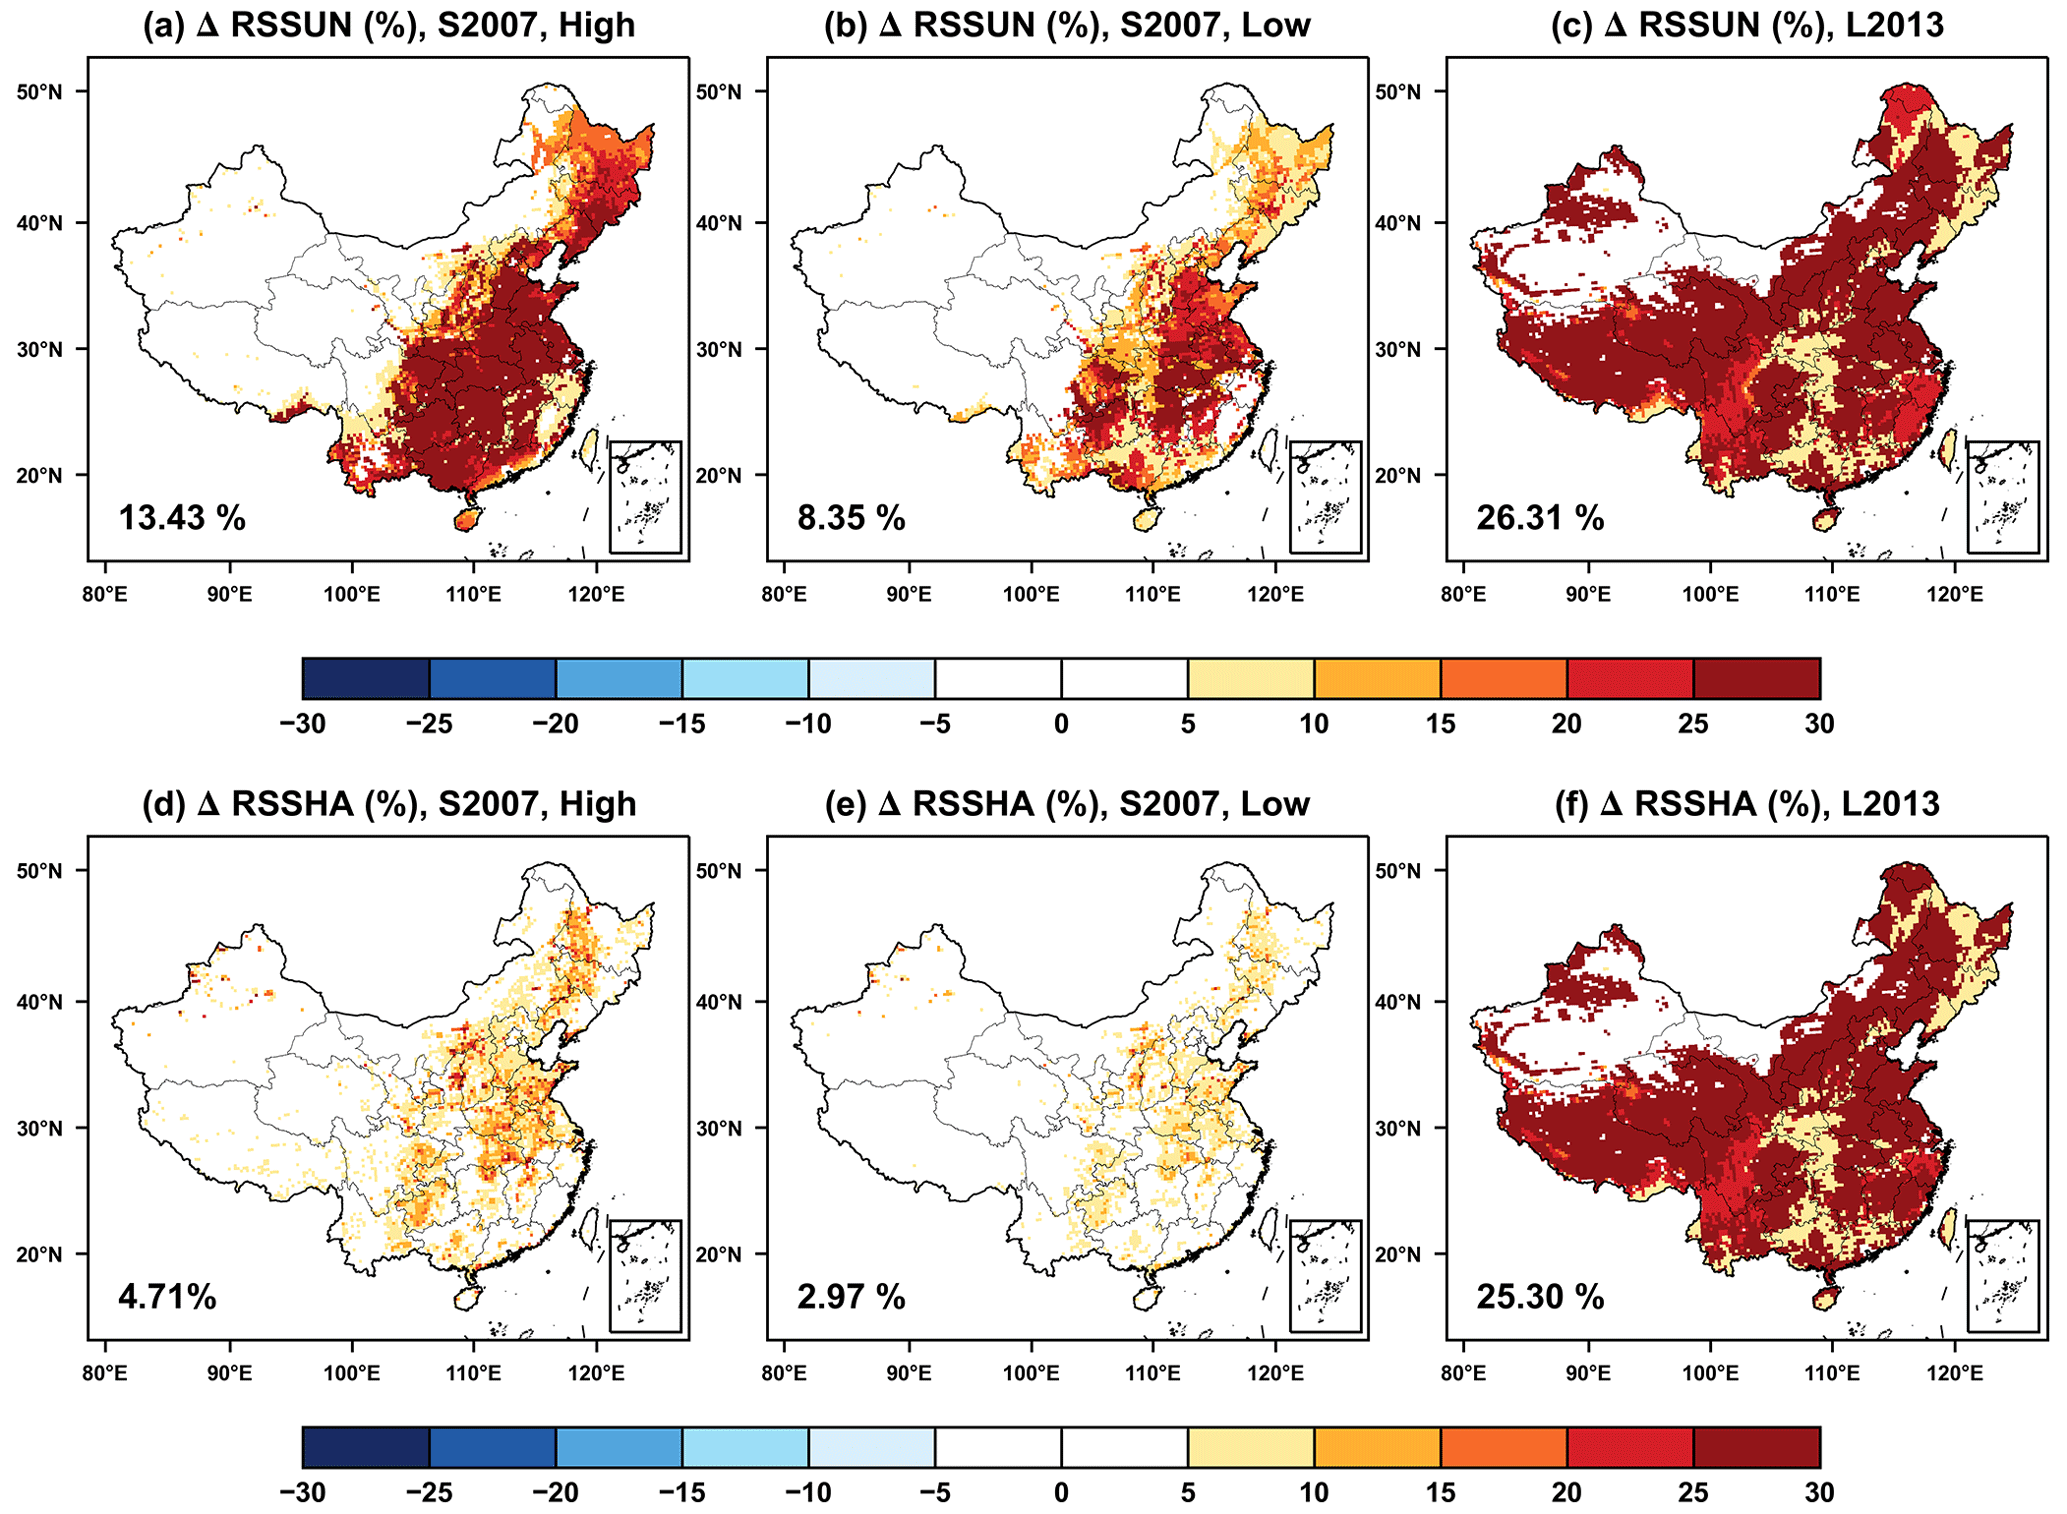
Figure 3The same as Fig. 2 but for the changes in stomatal resistance.
Figure 3 shows the effect of O3 damage to stomatal resistance of sunlit (RSSUN) and shaded (RSSHA) leaves. Overall, the spatial pattern of the changes in stomatal resistance is consistent with those of photosynthesis (Fig. 2) but with opposite signs. Both RSSUN and RSSHA are enhanced by O3 damage so as to prevent more O3 uptake. For the S2007 scheme, RSSUN with high and low sensitivities, respectively increases by 13.43 % (Fig. 3a) and 8.35 % (Fig. 3b), which are higher than the rates of 4.71 % (Fig. 3d) and 2.97 % (Fig. 3e) for RSSHA. These ratios are inversely connected to the changes in the photosynthesis (Fig. 2), suggesting the full coupling of damages between leaf photosynthesis and stomatal conductance. For the L2013 scheme, predicted changes in RSSUN (Fig. 3c) and RSSHA (Fig. 3f) are very similar with the magnitude of 25.3 %–26.3 %. These changes are higher than the loss of photosynthesis (Fig. 2c and f), suggesting the decoupling of O3 damages to leaf photosynthesis and stomatal conductance as revealed by the L2013 scheme.
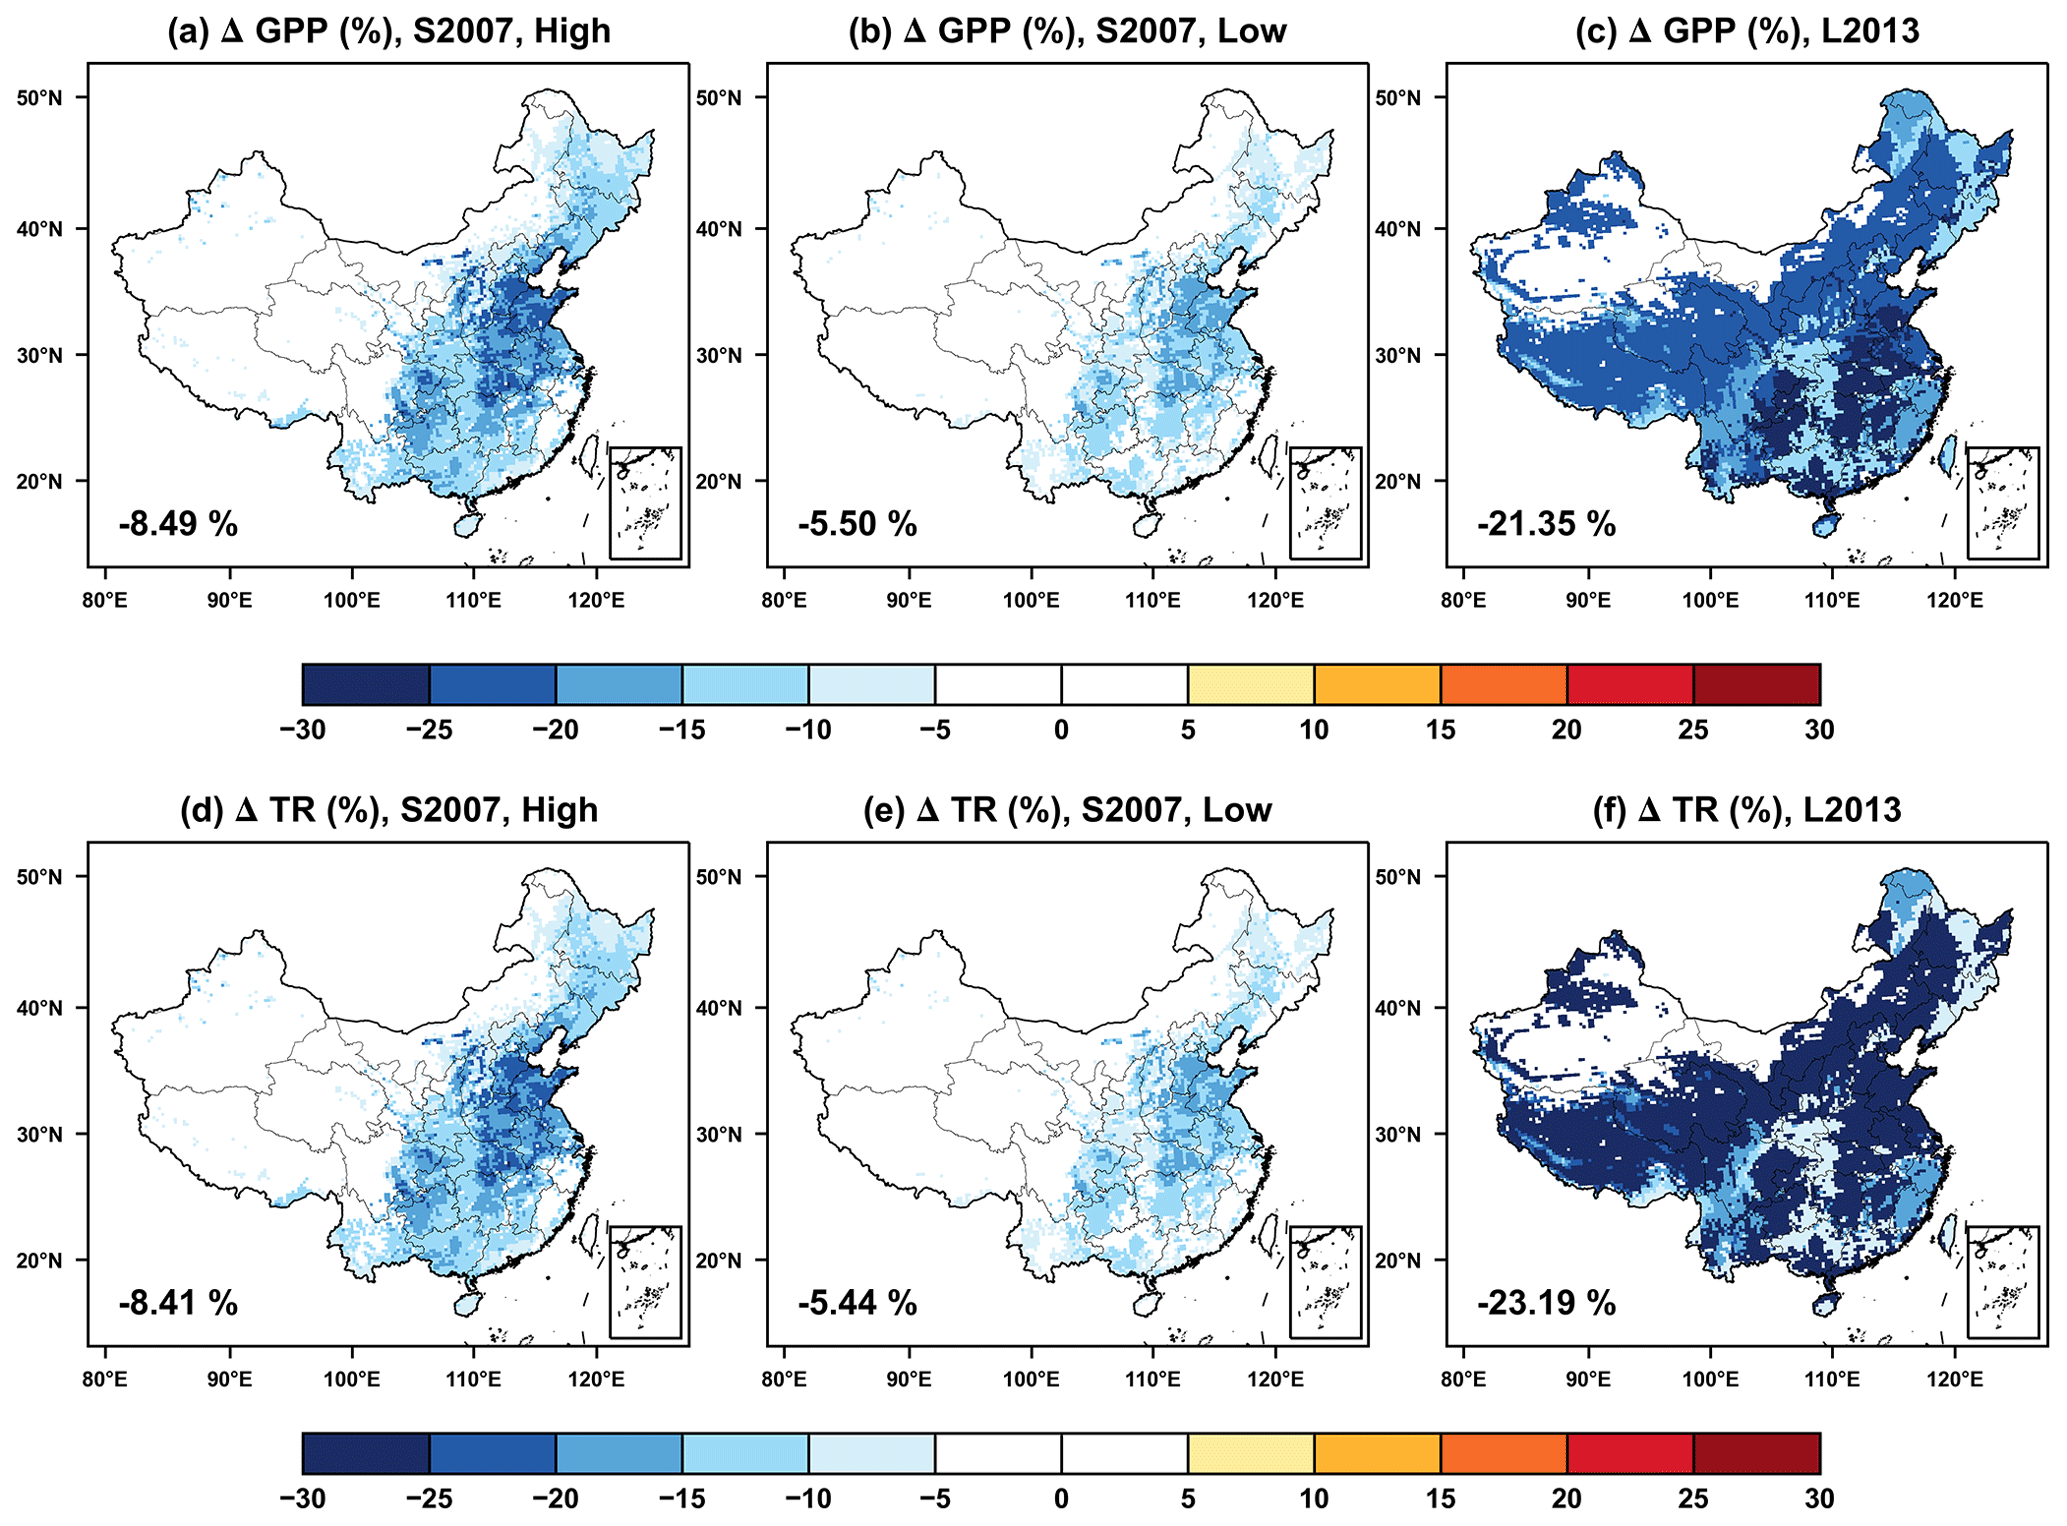
Figure 4Offline O3 damage (%) to the (a–c) gross primary productivity (GPP) and (d–f) transpiration rate (TR) predicted by the Sitch scheme with (a, d) high and (b, e) low sensitivities or the (c, f) Lombardozzi scheme. The area-weighted percentage changes are shown in the lower-left corner.
We further assessed the O3 damage to GPP and transpiration (TR). For the S2007 scheme, O3 causes damages to national average GPP and TR approximately by 5.5 % with low sensitivity (Fig. 4b and e) and 8.4 % with high sensitivity (Fig. 4a and d) compared to the CTRL simulation. The model predicts high GPP damages over the North China Plain and moderate damages in the southeastern and northeastern regions. In the northwest, GPP damage is very limited due to the low relative humidity (Fig. 1b) that constrains the stomatal uptake. For the L2013 scheme, TR shows uniform reductions exceeding −25 % in most regions of China, except for the northwest (Fig. 4f), though O3 concentrations show a distinct spatial gradient (Fig. 1d). The changes in the GPP are similar to that of TR but with lower inhibitions (Fig. 4c). On average, the GPP reduction with the L2013 scheme is 2.5–3.9 times that predicted with the S2007 scheme. The most significant differences are located in Tibetan Plateau with limited damages in S2007 but strong inhibitions of both GPP and TR in L2013. The low temperature (Fig. 1a) and O3 concentrations (Fig. 1d) jointly constrain O3 stomatal uptake (Fig. S3 in the Supplement), leading to low O3 damages over Tibetan Plateau with the S2007 scheme. However, the L2013 scheme applies bp = 0.8021 for grassland (Table 2), suggesting strong baseline damages up to 20 %, even with CUO = 0 over Tibetan Plateau where the grassland dominates (Fig. S4 in the Supplement).
3.3 The O3–vegetation feedback to surface energy and meteorology
The O3 vegetation damage causes contrasting responses in surface sensible heat (SH) and LH (Fig. 5). For the S2007 scheme, the SH fluxes on average increase by 3.17 W m−2 (8.85 %) with low sensitivity (Fig. 5b) and 5.99 W m−2 (16.22 %) with high sensitivity (Fig. 5a). The maximum enhancement is located in southern China, where the increased stomatal resistance (Fig. 3a) reduces transpiration and the consequent heat dissipation. Meanwhile, LH fluxes decrease by 3.26 W m−2 (5.58 %) with low sensitivity (Fig. 5e) and 6.43 W m−2 (15.29 %) with high sensitivity (Fig. 5d), following the reduction in transpiration (Fig. 4d and e). We found similar changes in surface energy by O3–vegetation coupling between the S2007 and L2013 schemes. The SH shows the same hotspots over southern China with national average increase of 12.85 % (Fig. 5c), which is within the range of 8.85 % to 16.22 % predicted by the S2007 scheme. The LH largely decreases in central and northern China with the mean reduction of 17.4 % (Fig. 5f), which is close to the magnitude of 15.29 % predicted with the S2007 scheme using the high O3 sensitivity (Fig. 5d). Although the offline damages to GPP and TR are much larger with the L2013 than S2007 (Fig. 4), their feedback to surface energy shows consistent spatial pattern and magnitude (Fig. 5), likely because the O3 inhibition in S2007 has the same diurnal cycle with energy fluxes, while the L2013 scheme shows almost constant inhibitions throughout the day (Fig. S5 in the Supplement). The zero or near-zero slope parameters (ap and ac) in the L2013 scheme (Table 2) lead to insensitive responses of photosynthesis and stomatal conductance to the variations in CUO. As a result, there were very limited diurnal variations in O3 damage with the L2013 scheme. However, the strong nighttime damages in L2013 have limited contributions to the changes in surface energy, which usually peaks at the daytime.
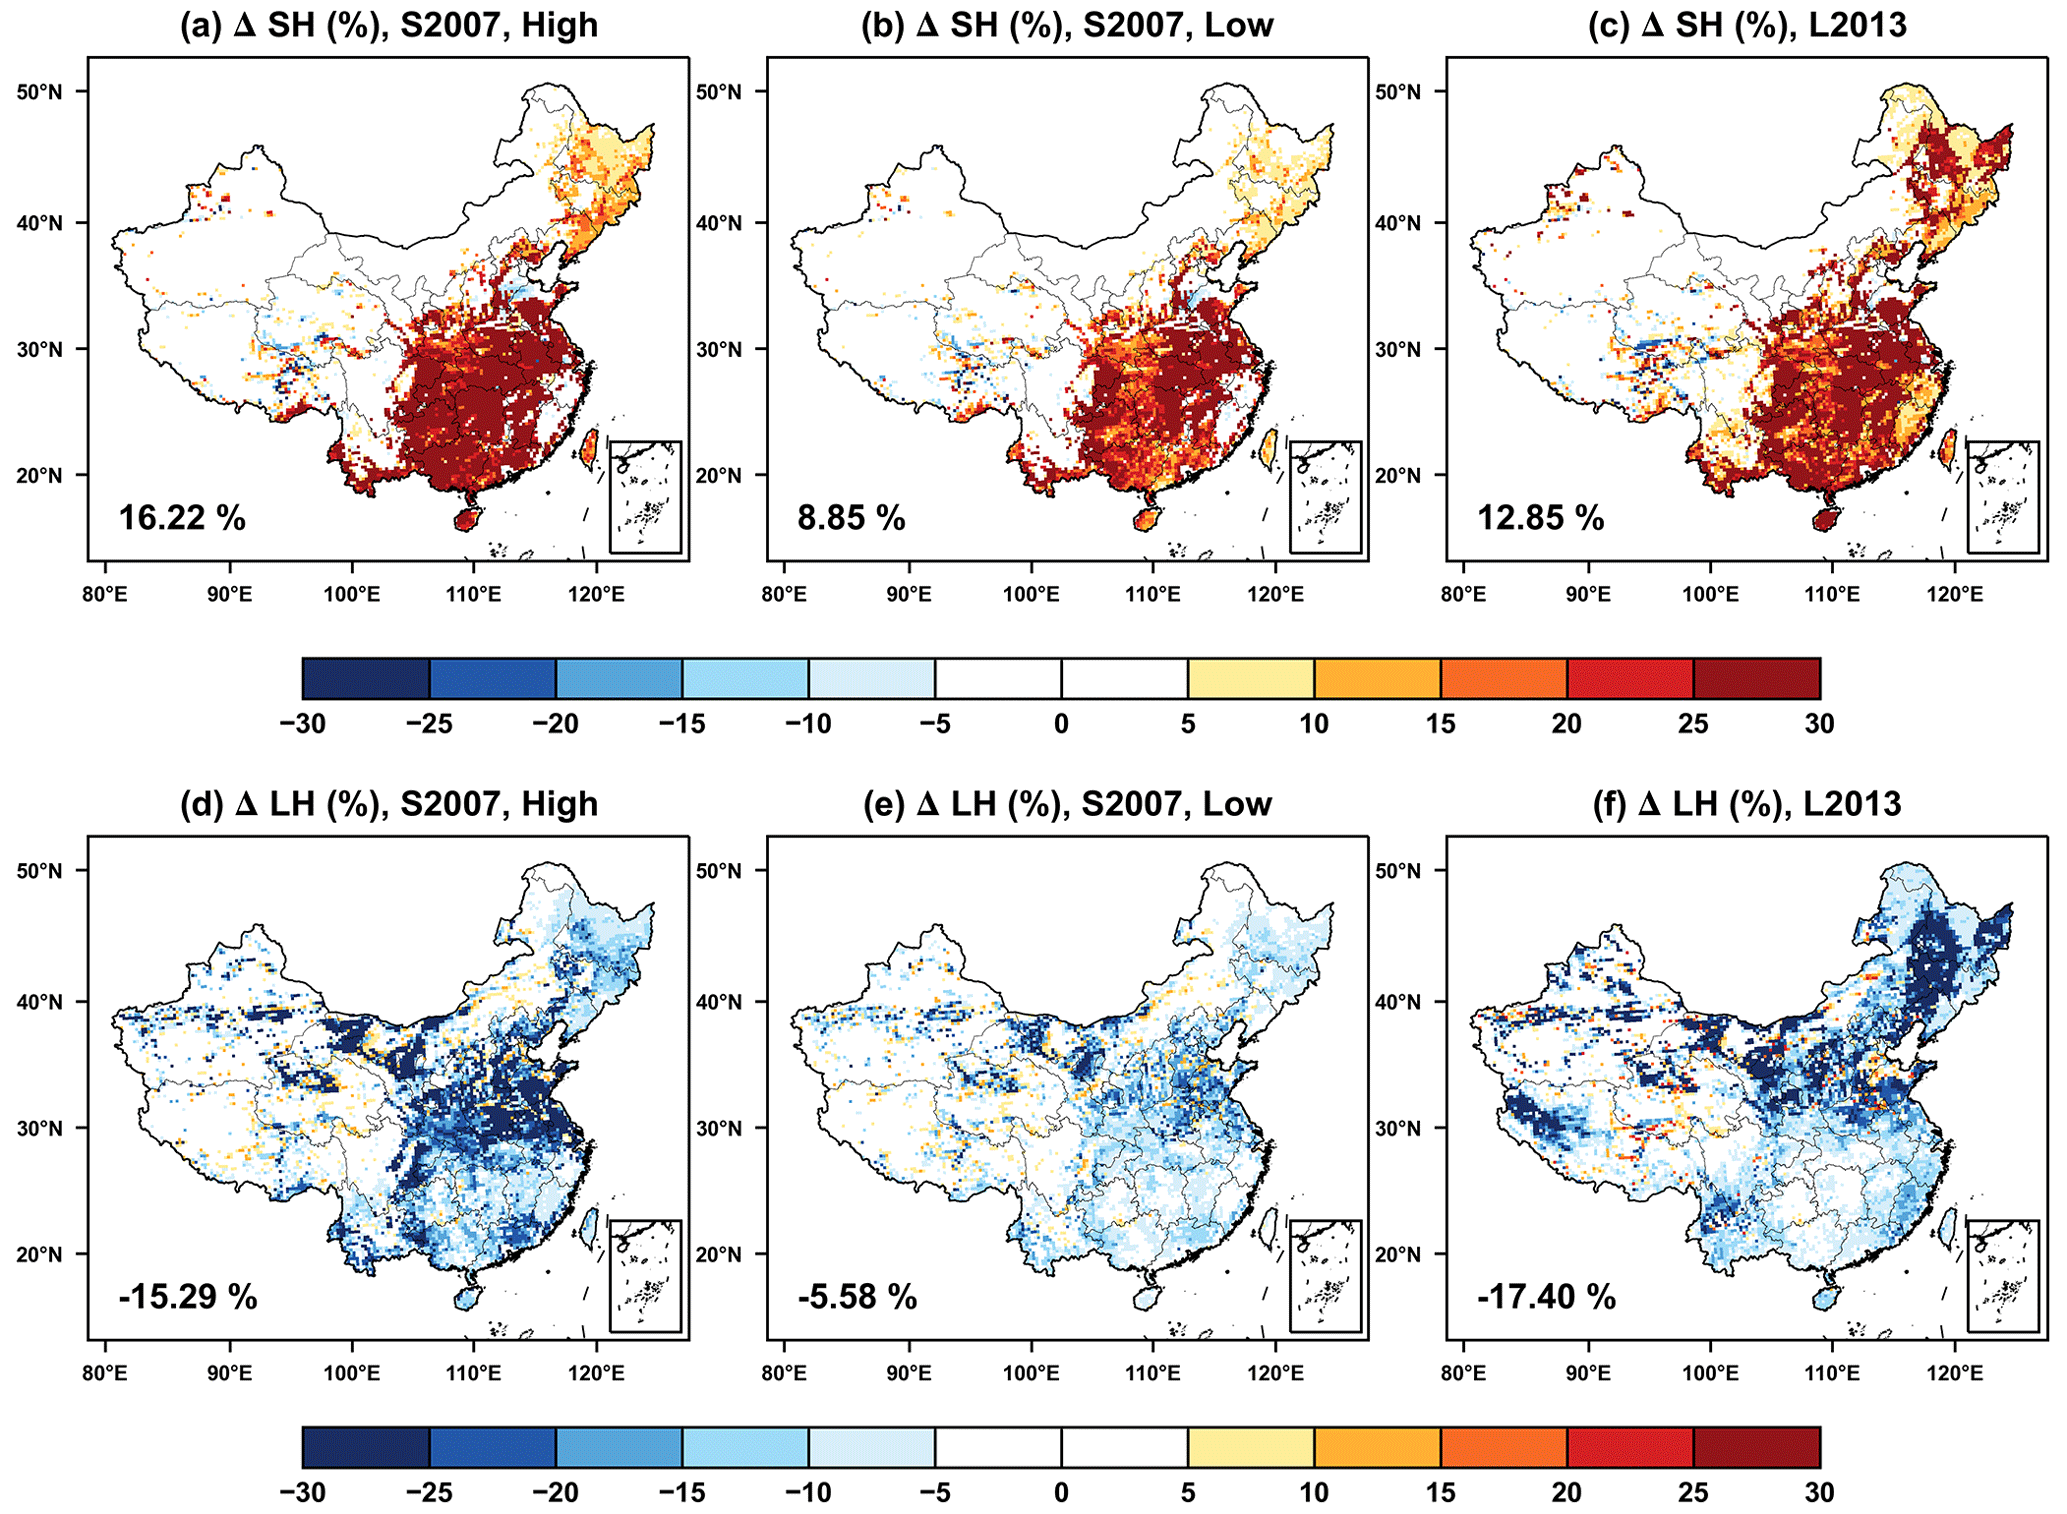
Figure 5The feedback of O3–vegetation interaction to surface (a–c) sensible and (d–f) latent heat fluxes in the summer predicted by the S2007 scheme with (a, d) high and (b, e) low sensitivities or the (c, f) L2013 scheme. The relative changes are shown with area-weighted percentage changes indicated in the lower-left corner.
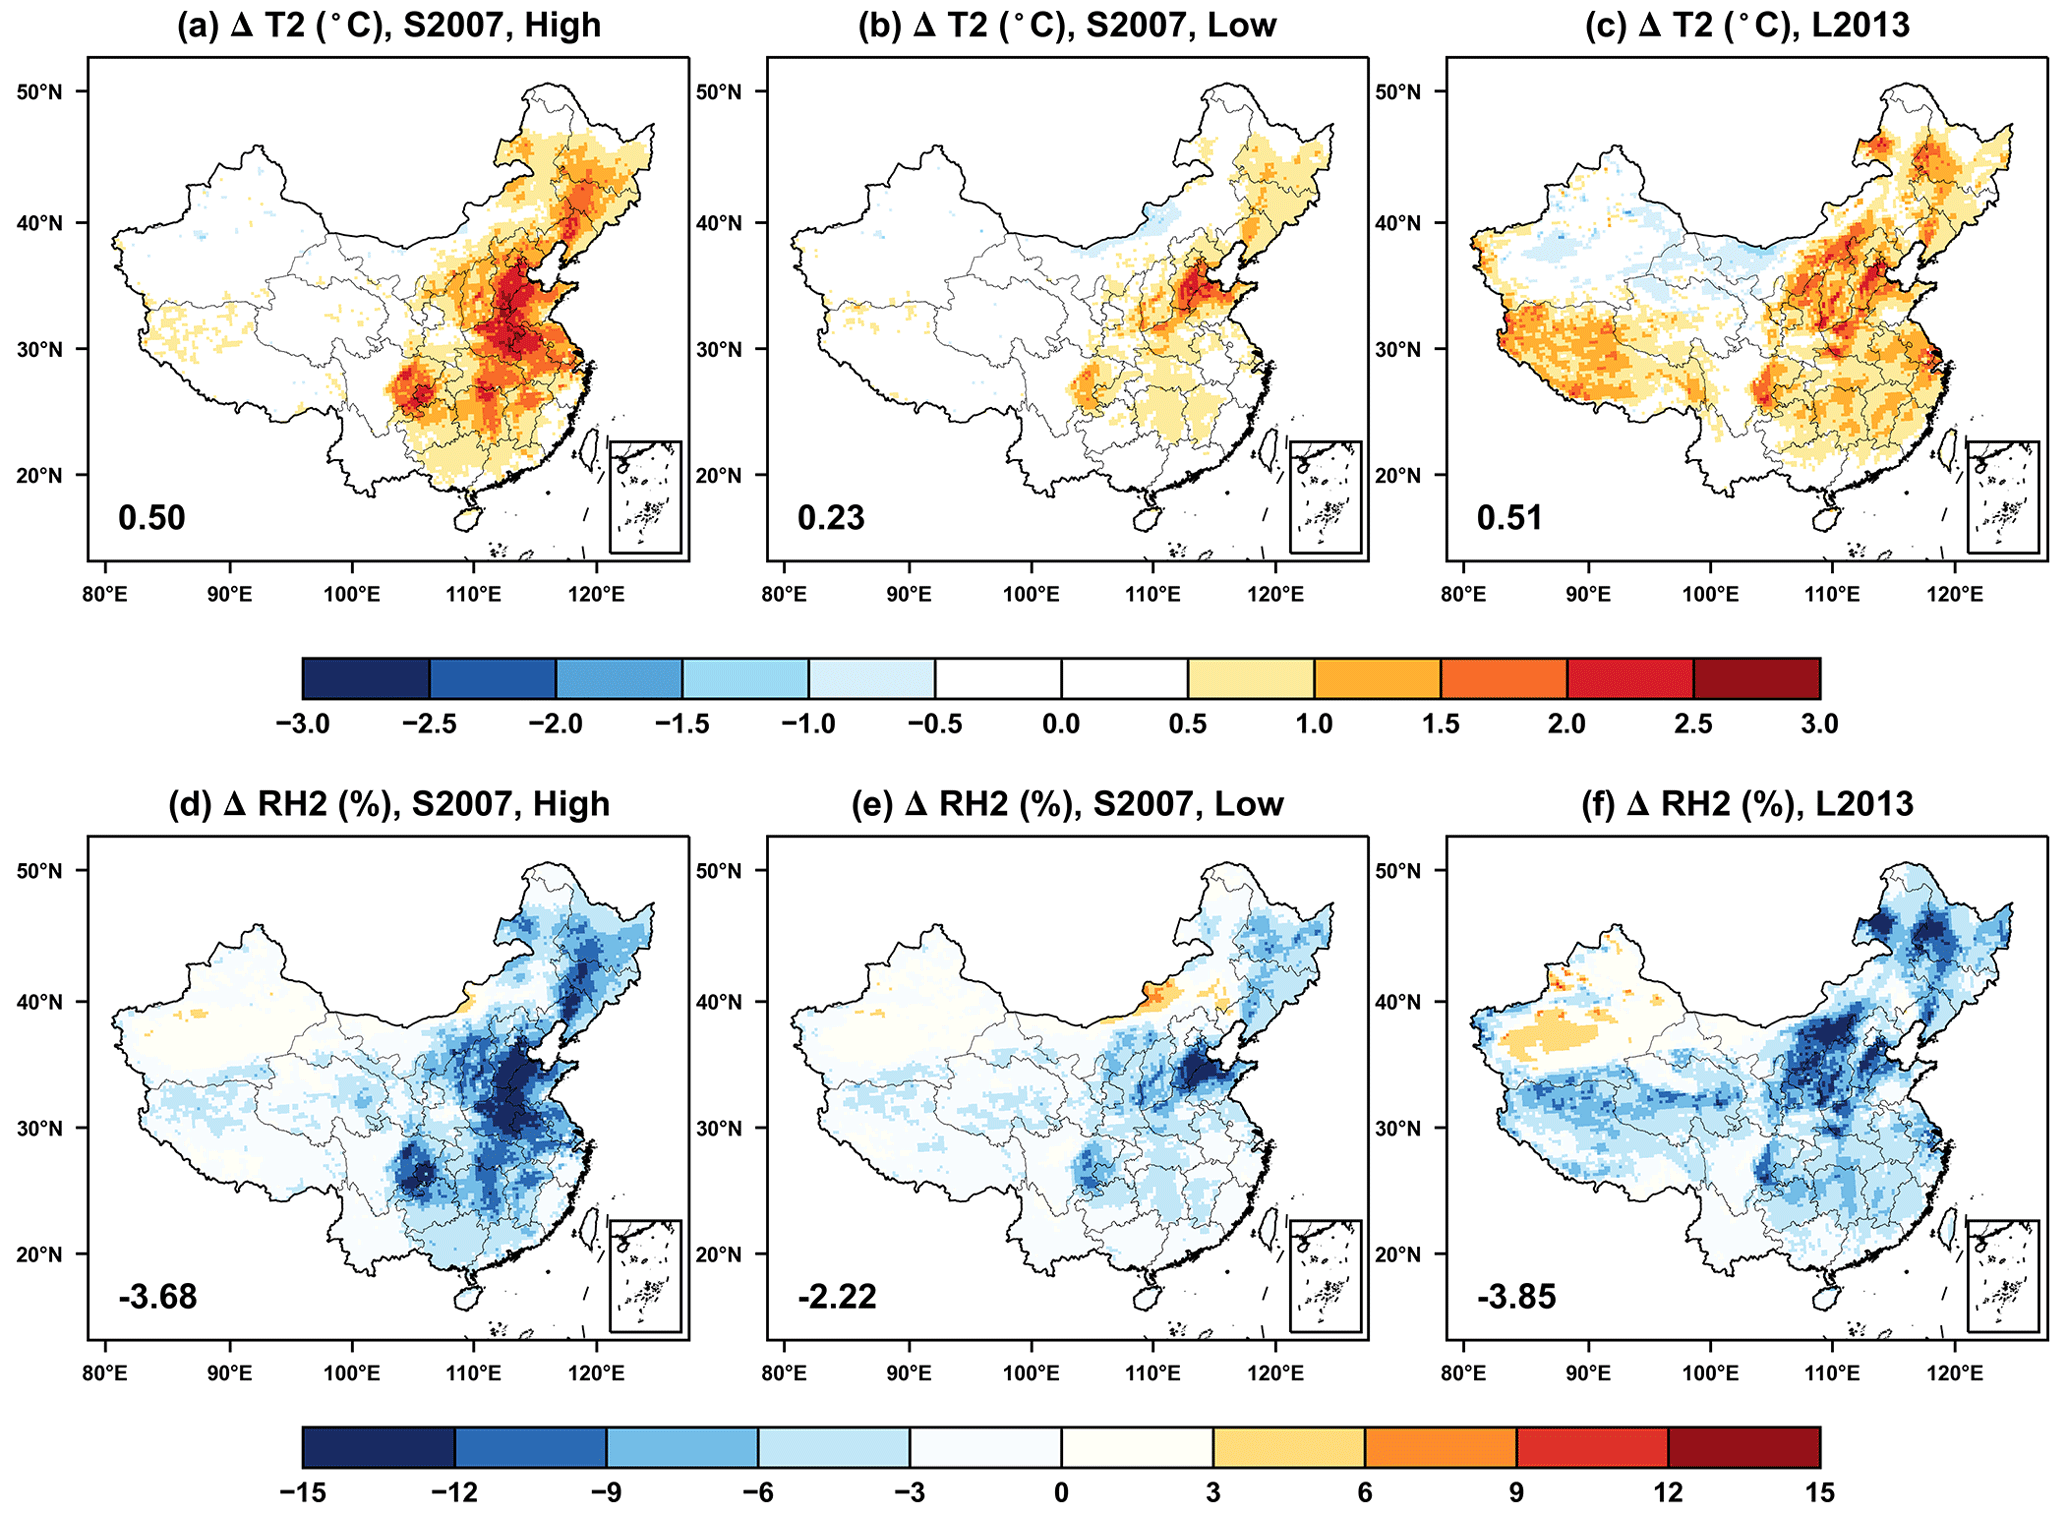
Figure 6The same as Fig. 5 but for changes in (a–c) air temperature and (d–f) relative humidity at 2 m.
The O3-induced damages to stomatal conductance weaken plant transpiration and thus slow down the heat dissipation at the surface, leading to the higher temperature but lower RH in China (Fig. 6). On the national scale, temperature increases by 0.5 °C due to O3 vegetation damage with the high sensitivity (Fig. 6a) and 0.23 °C with the low sensitivity (Fig. 6b) predicted using the S2007 scheme. A similar warming is predicted with the L2013 scheme, except that temperature shows moderate enhancement over Tibetan Plateau (Fig. 6c). The average RH decreases by 3.68 % with the high O3 sensitivity (Fig. 6d) and 2.22 % with the low sensitivity (Fig. 6e) in response to the suppressed plant transpiration. A stronger RH reduction of −3.85 % is achieved with the L2013 scheme, which predicts the maximum RH reductions in the north (Fig. 6f).
3.4 The O3–vegetation feedback to air quality
The O3-induced inhibition on stomatal resistance leads to a significant increase in surface O3 concentrations, particularly in eastern China (Fig. 7a–c). The main cause of such feedback is the reduction in O3 dry deposition, which exacerbates the O3 pollution in China. For the S2007 scheme, this positive feedback can reach up to 15 µg m−3 with high sensitivity (Fig. 7a) and 8 µg m−3 with low sensitivity (Fig. 7b) over the North China Plain. On the national scale, surface O3 enhances 4.40 µg m−3 (5.08 %) with high O3 sensitivity and 2.62 µg m−3 (3.04 %) with low O3 sensitivity through the coupling to vegetation. For the L2013 scheme, the changes in the O3 concentration (Fig. 7c) are comparable to that of the S2007 scheme with high sensitivity (Fig. 7a), except that the O3 enhancement is stronger in the southeast but weaker in the northeast.
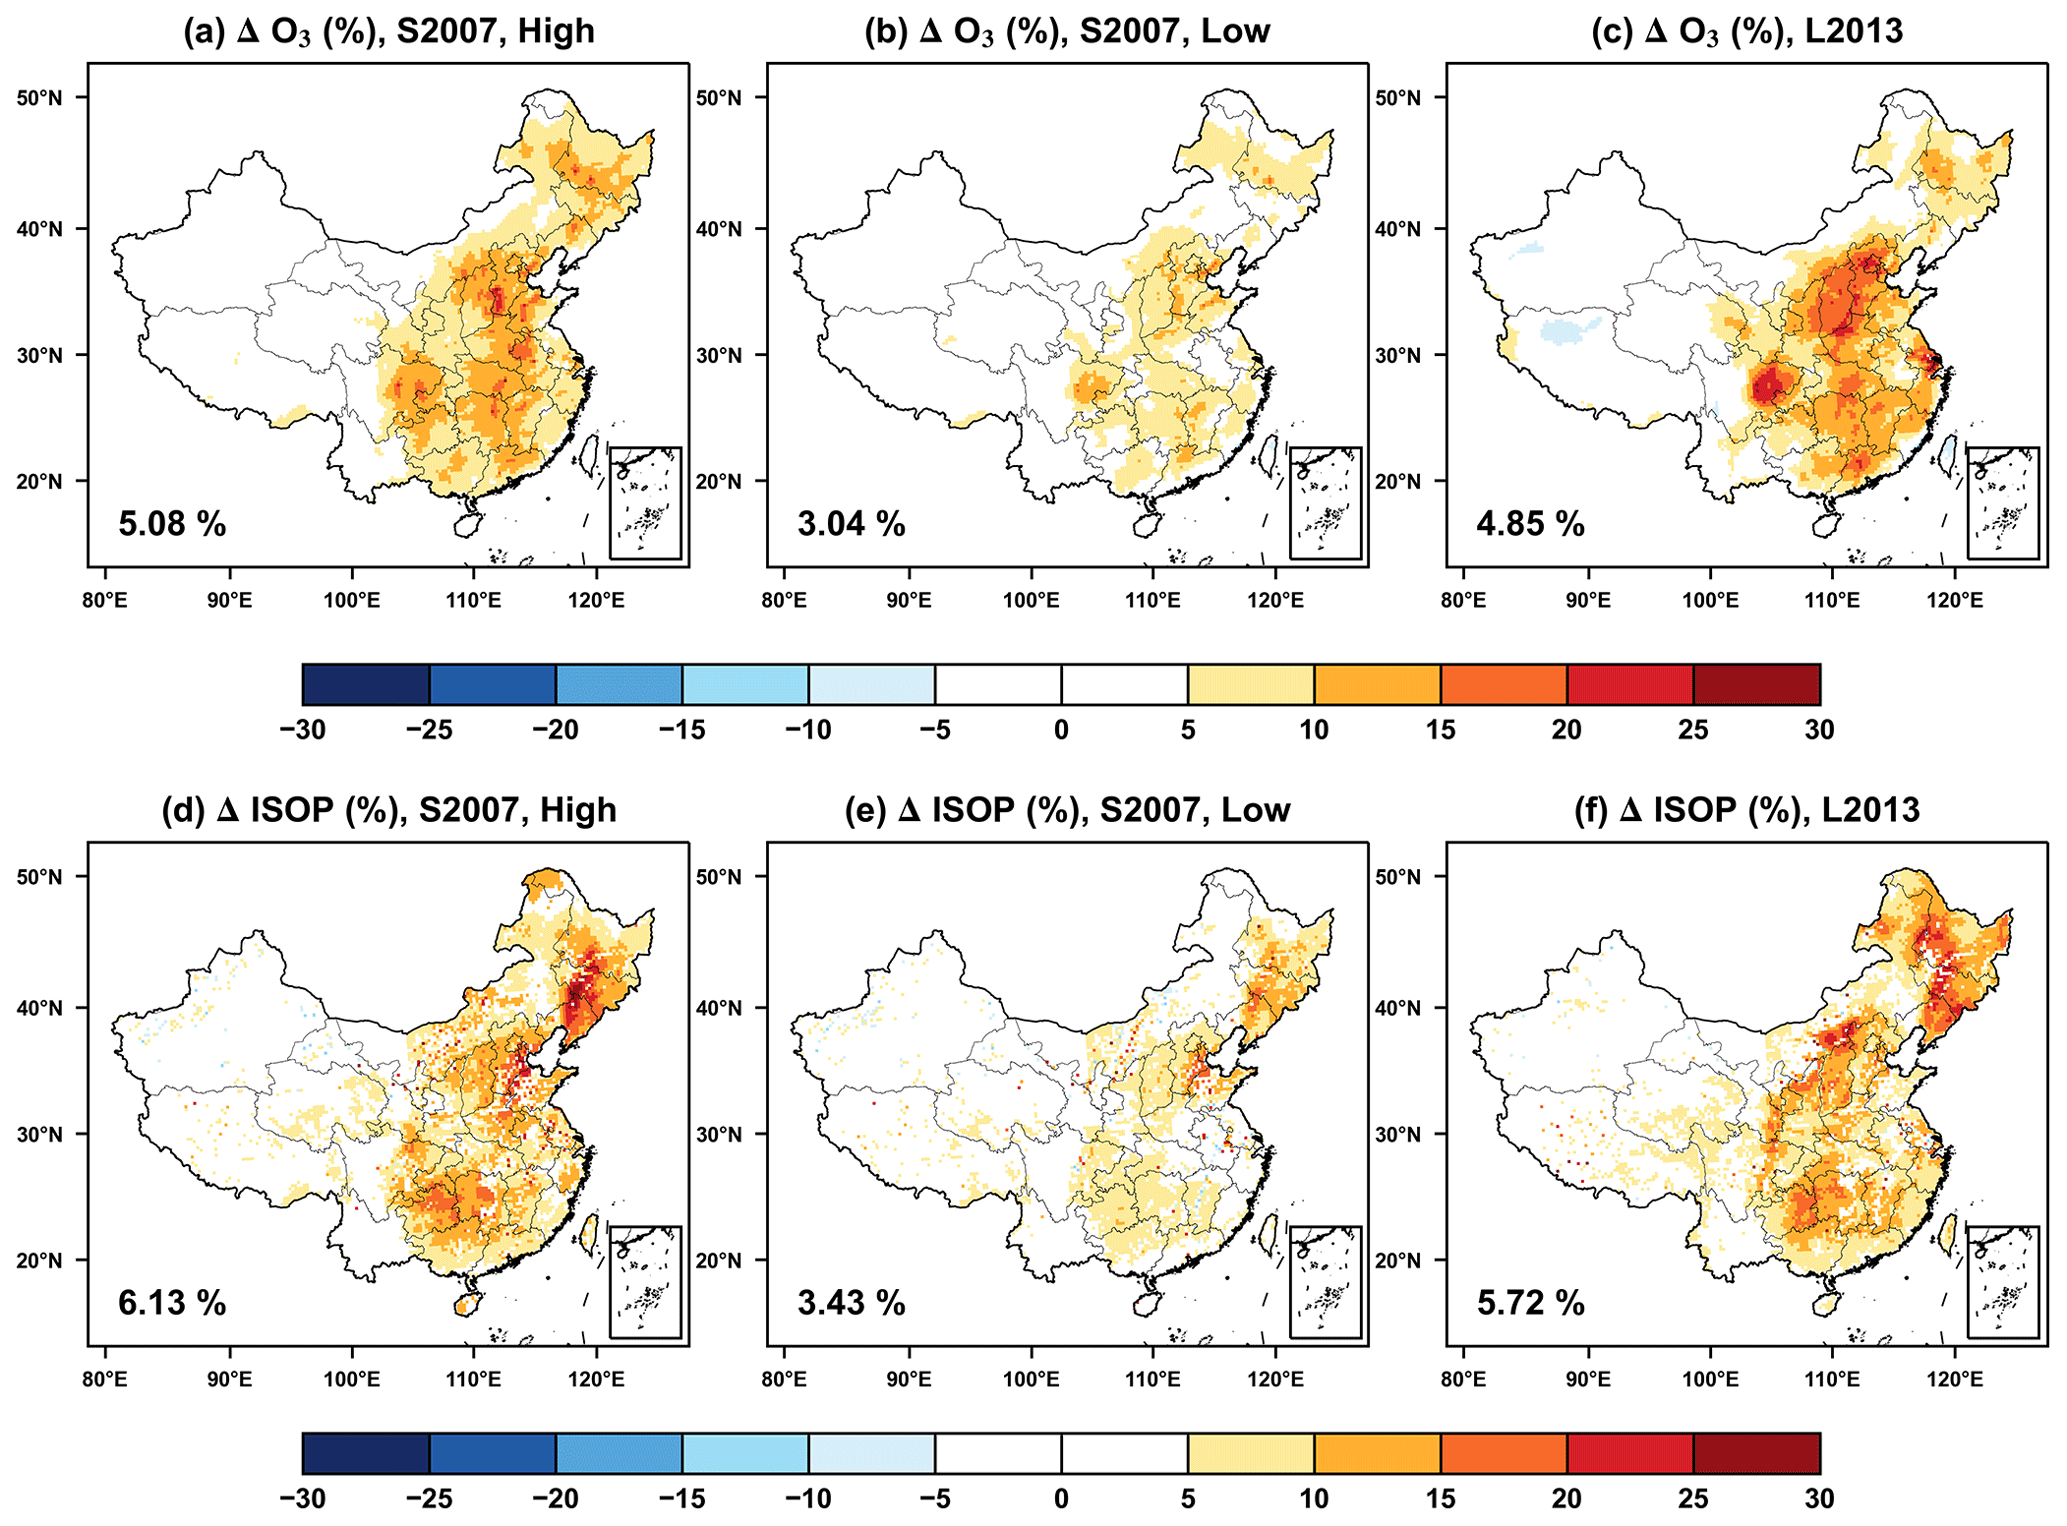
Figure 7The feedback of O3–vegetation interaction to surface O3 concentrations and isoprene emissions in the summer predicted by the S2007 scheme with (a, d) high and (b, e) low sensitivities or the (c, f) L2013 scheme. The area-weighted percentage changes are shown in the lower-left corner.
The O3–vegetation coupling also increases surface isoprene emissions. For the S2007 scheme, isoprene emissions increase by 6.13 % with high sensitivity (Fig. 7d) and 3.43 % with low sensitivity (Fig. 7e), with regional hotspots in the North China Plain and northeastern and southern regions. The predictions using the L2013 scheme (Fig. 7f) show very similar patterns and magnitude of isoprene changes to the S2007 scheme with high sensitivity. Such an enhancement in isoprene emissions is related to the additional surface warming by O3–vegetation interactions (Fig. 6a–c). In turn, the increased isoprene emissions contribute to the deterioration of O3 pollution in China.
In this study, we explored the feedback of O3–vegetation coupling to surface meteorology and air quality in China using two O3 damage schemes embedded in a regional meteorology–chemistry coupled model. The two schemes predicted distinct spatial patterns with much larger magnitude of GPP loss in the L2013 scheme than that in the S2007 scheme. We further distinguished the leaf responses with different illuminations. For the S2007 scheme, the damages to photosynthesis of sunlit leaves are ∼ 2.6 times of that to shaded leaves. However, for the L2013 scheme, limited differences are found between the sunlit and shaded leaves. The damages to leaf photosynthesis increase stomatal resistance, leading to the reductions in the transpiration but enhancement of sensible heat due to the less efficient heat dissipation. These changes in surface energy and water fluxes feed back to increase surface temperature but decrease relative humidity. Although the L2013 scheme predicts much stronger offline damages, the feedback causes a very similar pattern and magnitude in surface warming to the S2007 scheme. Consequently, surface O3 increases due to the stomatal closure and isoprene emissions enhance due to the anomalous warming.
Our predicted O3 damage to GPP was within the range of −4 % to −40 %, as estimated in previous studies using different models and/or parameterizations over China (Ren et al., 2011; Lombardozzi et al., 2015; Yue and Unger, 2015; Sadiq et al., 2017; Xie et al., 2019; Zhu et al., 2022; Jin et al., 2023). Such a wide span revealed the large uncertainties in the estimate of O3 impacts on ecosystem functions. In this study, we employed two schemes and compared their differences. With the S2007 scheme, we predicted GPP reductions of −5.5 % to −8.5 % in China. This is similar to the range of −4 % to −10 % estimated by Yue and Unger (2015) using the same O3 damage scheme. However, it is lower than the estimate of −12.1 % predicted by Xie et al. (2019), likely due to the slight overestimation of surface O3 in the latter study. With the L2013 scheme, we predicted much larger GPP reductions of −21.4 %. However, this value was still lower than the −28.9 % in Jin et al. (2023) and −20 % to −40 % in Zhu et al. (2022) using the same L2013 scheme embedded in WRF-Chem model, though all studies showed similar spatial patterns in the GPP reductions. Such differences were likely attributed to the varied model configuration, as we ran the model from May while the other studies started from the beginning of the year. The longer time for the accumulation of O3 stomatal uptake in other studies might result in higher damages than our estimates with the L2013 scheme.
The O3–vegetation coupling caused strong feedback to surface meteorology and air quality. Our simulations with either scheme revealed that surface SH increases by 2–28 W m−2 and LH decreases by 4–32 W m−2 over eastern China, consistent with the estimates of 5–30 W m−2 by Zhu et al. (2022) using the WRF-Chem model with the L2013 scheme. Consequently, surface air temperature on average increases by 0.23–0.51 °C, while relative humidity decreases by 2.2 %–3.8 %, which is similar to the warming of 0.2–0.8 °C and the RH reduction of 3 %, as predicted by Zhu et al. (2022). However, these changes in surface energy flux and meteorology are much higher than that in Jin et al. (2023), likely because the latter focuses on the perturbations averaged throughout the year instead of summer period as in this study and Zhu et al. (2022). We further predicted that O3 vegetation damage increased surface O3 by 1.0–3.33 µg m−3 in China, similar to the 2.35–4.11 µg m−3 estimated for eastern China using a global model (Gong et al., 2020). Regionally, the O3 enhancement reached as high as 7.84–14.70 µg m−3 in the North China Plain, consistent with the maximum value of 11.76 µg m−3 over the same domain predicted by Zhu et al. (2022). However, limited feedback to surface O3 was predicted in Jin et al. (2023), mainly because the decreased dry deposition had comparable but opposite effects to the decreased isoprene emissions due to the reductions in the LAI. Such a discrepancy was likely caused by the stronger O3 inhibition in Jin et al. (2023), following the longer period of O3 accumulation, consequently exacerbating the negative impacts of LAI reduction on O3 production.
There were some limitations in our parameterizations and simulations. First, we predicted increases in the isoprene emissions in eastern China mainly due to the increased leaf temperature, which is in line with previous studies (Sadiq et al., 2017; Zhu et al., 2022). However, isoprene production is coupled to photosynthesis. There is empirical evidence showing that a high dose of O3 exposure reduces isoprene emissions when O3 exposure is prolonged enough to suppress photosynthesis (Bellucci et al., 2023). Inclusion of such negative feedback might alleviate the O3-induced enhancement in isoprene emissions. Second, the WRF-Chem model slightly overestimated summer O3 concentrations, which could exacerbate the damages to stomatal conductance and the subsequent feedback. Third, the S2007 scheme employed the coupled responses in photosynthesis and stomatal conductance to O3 vegetation damage. However, some observations revealed that stomatal response is slow under long-term O3 exposure, resulting in the loss of stomatal function and decoupling from photosynthesis (Calatayud et al., 2007; Lombardozzi et al., 2012). The L2013 scheme considered the decoupling between photosynthesis and stomatal conductance. However, this scheme shows no significantly different changes for sunlit and shaded leaves. In addition, the calculation of CUO heavily relied on the O3 threshold and accumulation period, leading to varied responses among different studies using the same scheme. Furthermore, the slopes of O3 sensitivity in the L2013 scheme were set to zero for some PFTs, leading to constant damages independent of CUO. Fourth, the current knowledge of the O3 effects on stomatal conductance was primarily derived from leaf-level measurements (Matyssek et al., 2008), which were much fewer compared to that for photosynthesis. The limited data availability and lack of inter-PFT responses constrain the development of empirical parameterizations.
Despite these limitations, our study provided the first comparison of different parameterizations in simulating O3–vegetation interactions. We found similar feedbacks to surface energy and meteorology though the two schemes showed varied magnitude and distribution in the offline responses of GPP and stomatal conductance to surface O3. The main cause of such inconsistency lay in the low feedback of damages in L2013, with some unrealistic inhibitions of ecosystem functions at night and over the regions with low O3 level. Such similarity provides a solid foundation for the exploration of O3–vegetation coupling using different schemes. The positive feedback of O3 vegetation damage to surface air temperature and O3 concentrations posed emerging but ignored threats to both climate change and air quality in China.
The observed hourly O3 concentrations were obtained from Chinese National Environmental Monitoring Centre (https://air.cnemc.cn:18007/; CNEMC, 2023). The observed meteorological data were obtained from the National Meteorological Information Center of the China Meteorological Administration (http://data.cma.cn/data/detail/dataCode/A.0012.0001.html; CMA, 2023). The MEIC and MIX emission inventory are available at http://meicmodel.org.cn/?page_id=560 (MEIC Team, 2018a) and http://meicmodel.org.cn/?page_id=89 (MEIC Team, 2018b).
The supplement related to this article is available online at: https://doi.org/10.5194/acp-24-3973-2024-supplement.
XY conceived the study. XY and JC designed the research and carried out the simulations. JC completed data analysis and the first draft. MM provided useful comments on the paper. XY reviewed and edited the paper.
The contact author has declared that none of the authors has any competing interests.
Publisher's note: Copernicus Publications remains neutral with regard to jurisdictional claims made in the text, published maps, institutional affiliations, or any other geographical representation in this paper. While Copernicus Publications makes every effort to include appropriate place names, the final responsibility lies with the authors.
The authors are grateful to the three anonymous reviewers for their constructive comments that have improved this study.
This study has been jointly funded by the National Key Research and Development Program of China (grant no. 2023YFF0805403), National Natural Science Foundation of China (grant no. 42293323), and Jiangsu Funding Program for Excellent Postdoctoral Talent (grant no. 2023ZB737).
This paper was edited by Leiming Zhang and reviewed by three anonymous referees.
Ainsworth, E. A., Yendrek, C. R., Sitch, S., Collins, W. J., and Emberson, L. D.: The effects of tropospheric ozone on net primary productivity and implications for climate change, Annu. Rev. Plant Biol., 63, 637–661, https://doi.org/10.1146/annurevarplant-042110-103829, 2012.
Ball, J. T., Woodrow, I. E., and Berry, J. A.: A model predicting stomatal conductance and its contribution to the control of photosynthesis under different environmental conditions, Prog. Photosynthesis, 4, 221–224, 1987.
Bellucci, M., Locato, V., Sharkey, T. D., Gara, D., and Loreto, F.: Isoprene emission by plants in polluted environments, J. Plant Interact., 18, 2266463, https://doi.org/10.1080/17429145.2023.2266463, 2023.
Calatayud, V., Cerveró, J., and Sanz, M. J.: Foliar, physiologial and growth responses of four maple species exposed to ozone, Water Air Soil Pollut., 185, 239–254, https://doi.org/10.1007/s11270-007-9446-5, 2007.
Chou, M. D. and Suarez, M. J.: An efficient thermal infrared radiation parameterization for use in general circulation models, NASA Tech. Memo., 104506, 3, Maryland, USA, 85 pp., 1994.
CMA: Basic ground meteorological observation data, Meteorological Data Centre [data set], http://data.cma.cn/data/detail/dataCode/A.0012.0001.html (last access: 26 March 2024), 2023 (in Chinese).
CNEMC: Real-time National Air Quality, Chinese National Environmental Monitoring Centre [data set], https://air.cnemc.cn:18007/ (last access: 26 March 2024), 2023 (in Chinese).
Dickinson, R. E.: Land surface processes and climate – Surface albedos and energy balance, Adv. Geophys., 25, 305–353, https://doi.org/10.1016/S0065-2687(08)60176-4, 1983.
Emmons, L. K., Walters, S., Hess, P. G., Lamarque, J.-F., Pfister, G. G., Fillmore, D., Granier, C., Guenther, A., Kinnison, D., Laepple, T., Orlando, J., Tie, X., Tyndall, G., Wiedinmyer, C., Baughcum, S. L., and Kloster, S.: Description and evaluation of the Model for Ozone and Related chemical Tracers, version 4 (MOZART-4), Geosci. Model Dev., 3, 43–67, https://doi.org/10.5194/gmd-3-43-2010, 2010.
Farquhar, G. D., Caemmerer, S. V., and Berry, J. A.: A biochemicalmodel of photosynthetic CO2 assimilation in leaves of C3 species, Planta, 149, 78–90, https://doi.org/10.1007/bf00386231, 1980.
Felzer, B., Kicklighter, D., Melillo, J., Wang, C., Zhuang, Q., and Prinn, R.: Effects of ozone on net primary production and carbon sequestration in the conterminous United States using a biogeochemistry model, Tellus B, 56, 230–248, https://doi.org/10.1111/j.1600-0889.2004.00097.x, 2004.
Feng, Z., Hu, E., Wang, X., Jiang, L., and Liu, X.: Ground-level O3 pollution and its impacts on food crops in China: A review, Environ. Pollut., 199, 42–48, https://doi.org/10.1016/j.envpol.2015.01.016, 2015.
Gong, C., Lei, Y., Ma, Y., Yue, X., and Liao, H.: Ozone– vegetation feedback through dry deposition and isoprene emissions in a global chemistry–carbon–climate model, Atmos. Chem. Phys., 20, 3841–3857, https://doi.org/10.5194/acp-203841-2020, 2020.
Gong, C., Yue, X., Liao, H., and Ma, Y.: A humidity-based exposure index representing ozone damage effects on vegetation, Environ. Res. Lett., 16, 044030, https://doi.org/10.1088/1748-9326/abecbb, 2021.
Grell, G. A., McKeen, S., Michalakes, J., Bao, J.-W., Trainer, M., and Hsie, E.-Y.: Real-time simultaneous prediction of air pollution and weather during the Houston 2000 Field Experiment, presented at the 4th Conference on Atmospheric Chemistry: Atmospheric Chemistry and Texas Field Study, 13–17 January, American Meteorological Society, Orlando, 2002.
Grell, G. A., Peckham, S. E., Schmitz, R., McKeen, S. A., Frost, G., Skamarock, W. C., and Eder, B.: Fully coupled “online” chem- istry within the WRF model. Atmos. Environ., 39, 6957–6975, https://doi.org/10.1016/j.atmosenv.2005.04.027, 2005.
Guenther, A., Karl, T., Harley, P., Wiedinmyer, C., Palmer, P. I., and Geron, C.: Estimates of global terrestrial isoprene emissions using MEGAN (Model of Emissions of Gases and Aerosols from Nature), Atmos. Chem. Phys., 6, 3181–3210, https://doi.org/10.5194/acp-6-3181-2006, 2006.
Hersbach, H., Bell, B., Berrisford, P., Hirahara, S., Horányi, A., Muñoz-Sabater, J., Nicolas, J., Peubey, C., Radu, R., Schepers, D., Simmons, A., Soci, C., Abdalla, S., Abellan, X., Balsamo, G., Bechtold, P., Biavati, G., Bidlot, J., Bonavita, M., De Chiara, G., Dahlgren, P., Dee, D., Diamantakis, M., Dragani, R., Flemming, J., Forbes, R., Fuentes, M., Geer, A., Haimberger, L., Healy, S., Hogan, R. J., Hólm, E., Janisková, M., Keeley, S., Laloyaux, P., Lopez, P., Lupu, C., Radnoti, G., de Rosnay, P., Rozum, I., Vamborg, F., Villaume, S., and Thépaut, J.-N.: The ERA5 global reanalysis, Q. J. Roy. Meteor. Soc., 146, 1999–2049, https://doi.org/10.1002/qj.3803, 2020.
Hong, S.-Y., Noh, Y., and Dudhia, J.: A new vertical diffusion package with explicit treatment of entrainment processes, Mon. Weather Rev., 134, 2318–2341, https://doi.org/10.1175/MWR3199.1, 2006.
Hu, J., Chen, J., Ying, Q., and Zhang, H.: One-year simulation of ozone and particulate matter in China using WRF/CMAQ modeling system, Atmos. Chem. Phys., 16, 10333–10350, https://doi.org/10.5194/acp-16-10333-2016, 2016.
Jin, Z., Yan, D., Zhang, Z., Li, M., Wang, T., Huang, X., Xie, M., Li S and Zhuang.: Effects of elevated ozone exposure on regional meteorology and air quality in China through ozone–vegetation coupling. J. Geophys. Res.-Atmos., 128, e2022JD038119. https://doi.org/10.1029/2022JD038119, 2023.
Li, J., Mahalov, A., and Hyde, P.: Simulating the impacts of chronic ozone exposure on plant conductance and photosynthesis, and on the regional hydroclimate using WRF/Chem, Environ. Res. Lett., 11, 114017, https://doi.org/10.1088/1748-9326/11/11/114017, 2016a.
Li, P., Calatayud, V., Gao, F., Uddling, J., and Feng, Z. Z.: Differences in ozone sensitivity among woody species are related to leaf morphology and antioxidant levels, Tree Physiol., 36, 1105–1116, https://doi.org/10.1093/treephys/tpw042, 2016b.
Li, P., Feng, Z., Catalayud, V., Yuan, X., Xu, Y., and Paoletti, E.: A meta-analysis on growth, physiological, and biochemical responses of woody species to ground-level ozone highlights the role of plant functional types, Plant Cell Environ., 40, 2369–2380, https://doi.org/10.1111/pce.13043, 2017.
Liu, Y. and Wang, T.: Worsening urban ozone pollution in China from 2013 to 2017 – Part 1: The complex and varying roles of meteorology, Atmos. Chem. Phys., 20, 6305–6321, https://doi.org/10.5194/acp-20-6305-2020, 2020.
Lombardozzi, D., Levis, S., Bonan, G., and Sparks, J. P.: Predicting photosynthesis and transpiration responses to ozone: decoupling modeled photosynthesis and stomatal conductance, Biogeosciences, 9, 3113–3130, https://doi.org/10.5194/bg-9-31132012, 2012.
Lombardozzi, D., Sparks, J. P., and Bonan, G.: Integrating O3 influences on terrestrial processes: photosynthetic and stomatal response data available for regional and global modeling, Biogeosciences, 10, 6815–6831, https://doi.org/10.5194/bg-10-6815-2013, 2013.
Lombardozzi, D., Levis, S., Bonan, G., Hess, P. G., and Sparks, J. P.: The influence of chronic ozone exposure on global carbon and water cycles, J. Climate, 28, 292–305, https://doi.org/10.1175/JCLI-D-14-00223.1, 2015.
Matyssek, R., Sandermann, H., Wieser, G., Booker, F., Cieslik, S., Musselman, R., and Ernst, D.: The challenge of making ozone risk assessment for forest trees more mechanistic, Environ. Pollut., 156, 567–582, https://doi.org/10.1016/j.envpol.2008.04.017, 2008.
MEIC Team: MEIC, MEIC Model, The Multi-resolution Emission Inventory Model for Climate and Air Pollution Research [data set], http://meicmodel.org.cn/?page_id=560 (last access: 26 March 2024), 2018a (in Chinese).
MEIC Team: MIX Asia, MEIC Model, The Multi-resolution Emission Inventory Model for Climate and Air Pollution Research [data set], http://meicmodel.org.cn/?page_id=89 (last access: 26 March 2024), 2018b (in Chinese).
Mlawer, E. J., Taubman, S. J., Brown, P. D., Iacono, M. J., and Clough, S. A.: Radiative transfer for inhomogeneous atmosphere: RRTM, a validated correlated-k model for the longwave, J. Geophys. Res.-Atmos., 102, 16663–16682, https://doi.org/10.1029/97JD00237, 1997.
Monks, P. S., Archibald, A. T., Colette, A., Cooper, O., Coyle, M., Derwent, R., Fowler, D., Granier, C., Law, K. S., Mills, G. E., Stevenson, D. S., Tarasova, O., Thouret, V., von Schneidemesser, E., Sommariva, R., Wild, O., and Williams, M. L.: Tropospheric ozone and its precursors from the urban to the global scale from air quality to short-lived climate forcer, Atmos. Chem. Phys., 15, 8889–8973, https://doi.org/10.5194/acp-15-8889-2015, 2015.
Morrison, H., Thompson, G., and Tatarskii, V.: Impact of cloud microphysics on the development of trailing stratiform precipitation in a simulated squall line: comparison of one- and two-moment schemes, Mon. Weather Rev., 137, 991–1007, https://doi.org/10.1175/2008MWR2556.1, 2009.
Niu, G. Y., Yang, Z. L., Mitchell, K. E., Chen, F., Ek, M. B., Barlage, M., Kumar, A., Manning, K., Niyogi, D., Rosero, E., Tewari, M., and Xia, Y.: The community Noah land surface model with multiparameterization options (Noah-MP): 1. Model description and evaluation with local-scale measurements, J. Geophys. Res.-Atmos., 116, D12, https://doi.org/10.1029/2010JD015139, 2011.
Ren, W., Tian, H., Tao, B., Chappelka, A., Sun, G., Lu, C., Liu, M., Chen, G., and Xu, X.: Impacts of tropospheric ozone and climate change on net primary productivity and net carbon exchange of China's forest ecosystems, Global Ecol. Biogeogr., 20, 391–406, https://doi.org/10.1111/j.1466-8238.2010.00606.x, 2011.
Sadiq, M., Tai, A. P. K., Lombardozzi, D., and Val Martin, M.: Effects of ozone–vegetation coupling on surface ozone air quality via biogeochemical and meteorological feedbacks, Atmos. Chem. Phys., 17, 3055–3066, https://doi.org/10.5194/acp-17-3055-2017, 2017.
Sitch, S., Cox, P. M., Collins, W. J., and Huntingford, C.: Indirect radiative forcing of climate change through ozone effects on the land-carbon sink, Nature, 448, 791–794, https://doi.org/10.1038/nature06059, 2007.
Skamarock, W. C. and Klemp, J. B.: A time-split nonhydrostatic atmospheric model for weather research and forecasting applications, J. Comput. Phys., 227, 3465-3485, https://doi.org/10.1016/j.jcp.2007.01.037, 2008.
Su, B., Zhou, M., Xu, H., Zhang, X., Li, Y., Su, H., and Xiang B.: Photosynthesis and biochemical responses to elevated O3 in Plantago major and Sonchus oleraceus growing in a lowland habitat of northern China, J. Environ. Sci., 53, 113–121, https://doi.org/10.1016/j.jes.2016.05.011, 2017.
Tie, X. X., Madronich, S., Walters, S., Zhang, R. Y., Rasch, P., and Collins, W.: Effect of clouds on photolysis and oxidants in the troposphere, J. Geophys. Res.-Atmos., 108, 4642, https://doi.org/10.1029/2003jd003659, 2003.
Wan, W., Manning, W. J., Wang, X., Zhang, H., Sun, X., and Zhang, Q.: Ozone and ozone injury on plants in and around Beijing, China, Environ Pollut., 191, 215–222, https://doi.org/10.1016/j.envpol.2014.02.035, 2014.
Wittig, V. E., Ainsworth, E. A., and Long, S. P.: To what extent do current and projected increases in surface ozone affect photosynthesis and stomatal conductance of trees? A metaanalytic review of the last 3 decades of experiments, Plant Cell Environ., 30, 1150–1162, https://doi.org/10.1111/j.1365-3040.2007.01717.x, 2007.
Xie, X., Wang, T., Yue, X., Li, S., Zhuang, B., Wang, M., and Yang, X.: Numerical modeling of ozone damage to plants and its effects on atmospheric CO2 in China, Atmos. Environ., 217, 116970, https://doi.org/10.1016/j.atmosenv.2019.116970, 2019.
Yue, X. and Unger, N.: Ozone vegetation damage effects on gross primary productivity in the United States, Atmos. Chem. Phys., 14, 9137–9153, https://doi.org/10.5194/acp-14-9137-2014, 2014.
Yue, X. and Unger, N.: The Yale Interactive terrestrial Biosphere model version 1.0: description, evaluation and implementation into NASA GISS ModelE2, Geosci. Model Dev., 8, 2399–2417, https://doi.org/10.5194/gmd-8-2399-2015, 2015.
Zaveri, R. A. and Peters, L. K.: A new lumped structure photochemical mechanism for large-scale applications, J. Geophys. Res.-Atmos., 104, 30387–30415, https://doi.org/10.1029/1999JD900876, 1999.
Zaveri, R. A., Easter, R. C., Fast, J. D., and Peters, L. K.: Model for simulating aerosol interactions and chemistry (MOSAIC), J. Geophys. Res.-Atmos., 113, D13204, https://doi.org/10.1029/2007JD008782, 2008.
Zhou, S. S., Tai, A. P. K., Sun, S., Sadiq, M., Heald, C. L., and Geddes, J. A.: Coupling between surface ozone and leaf area index in a chemical transport model: strength of feedback and implications for ozone air quality and vegetation health, Atmos. Chem. Phys., 18, 14133–14148, https://doi.org/10.5194/acp-18-14133-2018, 2018.
Zhu, J., Tai, A. P. K., and Hung Lam Yim, S.: Effects of ozone–vegetation interactions on meteorology and air quality in China using a two-way coupled land–atmosphere model, Atmos. Chem. Phys., 22, 765–782, https://doi.org/10.5194/acp-22-765-2022, 2022.