the Creative Commons Attribution 4.0 License.
the Creative Commons Attribution 4.0 License.
 | 27 Mar 2024
Powering aircraft with 100 % sustainable aviation fuel reduces ice crystals in contrails
Raphael Satoru Märkl
Christiane Voigt
Daniel Sauer
Rebecca Katharina Dischl
Stefan Kaufmann
Theresa Harlaß
Valerian Hahn
Anke Roiger
Cornelius Weiß-Rehm
Ulrike Burkhardt
Ulrich Schumann
Andreas Marsing
Monika Scheibe
Andreas Dörnbrack
Charles Renard
Maxime Gauthier
Peter Swann
Paul Madden
Darren Luff
Reetu Sallinen
Tobias Schripp
Patrick Le Clercq
Powering aircraft by sustainable aviation fuels (SAFs) is a pathway to reduce the climate impact of aviation by lowering aviation lifecycle CO2 emissions and by reducing ice crystal numbers and radiative forcing from contrails. While the effect of SAF blends on contrails has been measured previously, here we present novel measurements on particle emission and contrails from 100 % SAF combustion. During the ECLIF3 (Emission and CLimate Impact of alternative Fuels) campaign, a collaboration between the Deutsches Zentrum für Luft- und Raumfahrt (DLR), Airbus, Rolls-Royce, and Neste, the DLR Falcon 20 research aircraft performed in situ measurements following an Airbus A350-941 source aircraft powered by Rolls-Royce Trent XWB-84 engines in 1 to 2 min old contrails at cruise altitudes. Apparent ice emission indices of 100 % HEFA-SPK (hydro-processed esters and fatty acids–synthetic paraffinic kerosene) were measured and compared to Jet A-1 fuel contrails at similar engine and ambient ice-supersaturated conditions within a single flight. A 56 % reduction in ice particle numbers per mass of burned fuel was measured for 100 % HEFA-SPK compared to Jet A-1 under engine cruise conditions. The measured 35 % reduction in soot particle numbers suggests reduced ice activation by the low-sulfur HEFA fuel. Contrail properties are consistently modeled with a contrail plume model. Global climate model simulations for the 2018 fleet conservatively estimate a 26 % decrease in contrail radiative forcing and stronger decreases for larger particle reductions. Our results indicate that higher hydrogen content fuels as well as clean engines with low particle emissions may lead to reduced climate forcing from contrails.
- Article
(3517 KB) - Full-text XML
- BibTeX
- EndNote


As a rapidly growing industry on a global scale, aviation is faced with the challenge of being able to grow in a way that is sustainable and in line with the goals of the Paris Climate Agreement (Grewe et al., 2021). Besides the contribution of carbon dioxide (CO2) to aviation climate forcing, non-CO2 effects from contrail cirrus and nitrogen oxides play a major role in aviation's effective radiative forcing (ERF), amounting to a globally averaged climate forcing contribution share of ∼3.5 % for aviation (Lee et al., 2021). Contrail cirrus can locally either be cooling or warming depending on the angle of incoming solar radiation (Meerkötter et al., 1999; Stuber et al., 2006; Forster et al., 2012; Teoh et al., 2022a). Additionally, the contrail cirrus cover has a diurnal cycle, which is dependent on the frequency distribution of contrail cirrus lifetimes (Newinger and Burkhardt, 2012) as well as seasonal and regional variability (Meijer et al., 2022). The global net radiative effect however is predicted to be warming, amounting to an ERF of 57 mW m−2 for the year 2018 (Lee et al., 2021). The contrail cirrus ERF constitutes the largest contribution to aviation's total net ERF, while accumulated aviation carbon dioxide emissions account for 34 mW m−2 and nitrogen oxide emissions for 17 mW m−2 (Lee et al., 2021). Furthermore, global flight distance is projected to increase by a factor of 4 until 2050 compared to 2006 (Chen and Gettelman, 2016), leading to an expected tripling of contrail cirrus radiative forcing (Bock and Burkhardt, 2019) when assuming the 4-fold increase in air traffic projected by the Aviation Environmental Design Tool (AEDT) air traffic inventory (Wilkerson et al., 2010). In contrast, several studies have shown that the radiative forcing from contrails was significantly reduced in the COVID-19-related low air traffic scenario (Quaas et al., 2021; Schumann et al., 2021; Gettelman et al., 2021; Duda et al., 2023; Teoh et al., 2023).
Combustion products from aircraft engines consist mainly of carbon dioxide (CO2) and water vapor (H2O), which are emitted together with nitrogen oxides, sulfate precursors, a number of unburned organic compounds, soot, and volatile aerosol particle precursors. These hot engine emissions mix with ambient air turbulently and rapidly cool down so that the plume surpasses water saturation and the water vapor condenses preferably onto emitted soot particles (Kärcher and Yu, 2009; Wong and Miake-Lye, 2010; Bier et al., 2022). These small water droplets continue to grow from the surrounding available water vapor and freeze instantaneously at cold temperatures. Hence, contrail ice crystals contain ice nuclei, and therefore supercooled water droplets are not present after the first seconds of formation. Whether contrails form or not is governed by ambient temperature, pressure, and humidity as well as engine and fuel parameters as described by the Schmidt–Appleman threshold temperature (TSA) (Schumann, 1996). Following ice crystal formation, the young contrail ice particles can either sublimate quickly or grow into contrail cirrus clouds that can remain in the atmosphere for several hours in ice-supersaturated air (Minnis et al., 1998; Jensen et al., 1998; Lewellen, 2014; Vázquez-Navarro et al., 2015; Unterstrasser et al., 2017). While CO2 can remain in the atmosphere for centuries, contrail cirrus have lifespans of several hours, which enables an immediate ERF reduction potential when avoiding or decreasing contrail formation. Optimizing flights to avoid warming contrails by horizontal or vertical flight route adaptation based on contrail prediction models is one possible climate impact mitigation strategy under investigation (Schumann et al., 2011; Grewe et al., 2017; Teoh et al., 2020a, b, 2023). However, increased fuel use and CO2 emissions must be considered when routing flights for contrail avoidance (Teoh et al., 2022a). Also, climate-optimized flight routing might not always be feasible due to air traffic management considerations. As contrail cirrus-induced climate forcing is related to contrail ice particle numbers, another approach could be the reduction in contrail ice-nucleating particles such as engine soot emissions (Kärcher and Yu, 2009; Schumann et al., 2013; Unterstrasser and Görsch, 2014; Moore et al., 2017; Bier et al., 2017; Burkhardt et al., 2018; Voigt et al., 2021; Bier and Burkhardt, 2022). Significant reductions in soot emission and corresponding ice particle number concentrations have been reported from previous in situ flight campaigns for the burning of sustainable aviation fuel (SAF) blends due to their different fuel composition compared to conventional jet fuel (Moore et al., 2017; Voigt et al., 2021; Bräuer et al., 2021b, a). Aside from aliphatic hydrocarbon chains, fuels from fossil feedstock are naturally rich in cyclic aromatic hydrocarbons, polycyclic naphthalene, and sulfur, which are typically quasi-absent from all SPK-type SAFs such as HEFA-SPK (hydro-processed esters and fatty acids–synthetic paraffinic kerosene) derived from sustainable feedstocks (Wilbrand, 2017; Moore et al., 2015). Cyclic and polycyclic hydrocarbons have been associated with higher rates of incomplete combustion and subsequent soot formation compared to aliphatic chains (Cain et al., 2013; Brem et al., 2015; Schripp et al., 2022). As a drop-in fuel, SAF blends (up to 50 % blending ratio) require no modifications to aircraft and airport infrastructure and are therefore readily usable and already used by airlines today (Rye et al., 2010; Pechstein, 2017), leading to a reduction in contrail radiative forcing compared to the use of conventional jet fuel (Moore et al., 2017; Burkhardt et al., 2018; Bock and Burkhardt, 2019; Voigt et al., 2021; Teoh et al., 2022b; Bier and Burkhardt, 2022). Additionally, SAF fuels may provide a CO2 reduction potential depending on the type of feedstock, its cultivation method and location, as well as processing and distribution method (Buchspies and Kaltschmitt, 2017; Plassmann, 2017).
Up until now, in situ observations of contrails resulting from the burning of SAF have only been reported for SAF blended with conventional jet fuel, leaving open questions on the effect of burning 100 % SAF on contrail ice particle number concentrations and microphysics. In this work, we present for the first time in situ observations of contrails from the combustion of 100 % SAF fully consisting of HEFA-SPK compared to conventional Jet A-1 fuel. These observations were made at cruise altitudes during a measurement flight of the ECLIF3 campaign in a cooperation between the Deutsches Zentrum für Luft- und Raumfahrt (DLR), Airbus, Rolls-Royce, and Neste, where the DLR Dassault Falcon 20-E5 was able to chase an Airbus A350-941 equipped with Rolls-Royce Trent XWB-84 engines and burning 100 % HEFA-SPK fuel. We aim to contribute to the understanding of the soot and ice particle number reduction potential with the use of 100 % HEFA-SPK fuel compared to Jet A-1. We use these results to model the impact of the soot and ice particle number reductions on the radiative forcing of contrails as well as to compare them to predictions of contrail ice particle number concentrations made by the CoCiP model. By comparing these results to previous in situ contrail measurements of SAF blends and a reference Jet A-1, the influence of the used engine and the fuel parameters can be qualitatively assessed. Further, size distributions of ice particles in the investigated contrails provide insight into microphysical variations in the vertical contrail distribution.
2.1 ECLIF3 campaign
Previous campaigns on Emission and CLimate Impact of alternative Fuels (ECLIF1) (Kleine et al., 2018) in 2015 and ECLIF2/NDMAX (Voigt et al., 2021; Bräuer et al., 2021b, a; Schripp et al., 2022) in 2018 focused on effects resulting from the use of SAF blends with conventional jet fuel. The successor flight experiment campaign ECLIF3 for the first time allowed the investigation of effects from burning 100 % HEFA-SPK on trace gas and particle emissions as well as contrail ice formation from a large commercial passenger aircraft equipped with modern engines. The ECLIF3 campaign took place over two separate time periods with three flights in April 2021 (ECLIF3-1) over the Mediterranean Sea and southern France and with six flights in November 2021 (ECLIF3-2) off the Atlantic coast of France. Here, we focus on results from contrail flights during ECLIF3-1 as most of the flights in ECLIF3-2 were performed in ice-subsaturated conditions either designed as pure emission flights or in sublimating contrails, for which a quantitative data analysis of ice particles remains challenging. The first-ever built Airbus A350-941 (registration: F-WXWB) equipped with two Rolls-Royce Trent XWB-84 engines and operated by Airbus served as the emission source aircraft. Fuel was supplied selectively from the two wing fuel tanks containing a reference fuel and 100 % HEFA-SPK, respectively. This allowed for in-flight switching between two fuels for each engine and the operation of both engines on a single fuel using cross-feed valves. The DLR Dassault Falcon 20-E5 research aircraft followed the emission source aircraft to measure exhaust gases, volatile and nonvolatile aerosol particles, and contrail ice particles (Voigt et al., 2023a, b). Two distance regimes were examined, with near-field measurements probing emissions at ages of sub-seconds to a few seconds and far-field measurements probing contrails aged 1 min to several minutes. This paper will address the contrail measurements during ECLIF3-1.
Two different jet fuels were investigated during the ECLIF3 flight campaign: a conventional reference Jet A-1 fuel supplied by TotalEnergies to Toulouse Blagnac airport and a 100 % HEFA-SPK SAF produced by Neste Corporation. The fuel properties are described in Table 1 and show that the HEFA-SPK after logistics and at the point of use is nearly free of aromatics compared to the used Jet A-1 fuel, which itself has a lower aromatic content than the global mean (Hadaller and Johnson, 2006). The naphthalene content in the HEFA-SPK lies below the ASTM D1840 detection limit, while the total sulfur content is higher by a factor of approximately 30 in Jet A-1 but is still 15 times below the maximum permitted value of the mass fraction of 0.3 % (ASTM D5453). Further, the increased hydrogen content of HEFA-SPK compared to the used Jet A-1 results in a 1.2 % reduced CO2 emission index () for the HEFA-SPK fuel.
Table 1Properties of fuels burned during the measurement flight. Fuel samples were taken from the tank before the measurement flight, and an additional HEFA-SPK sample was taken from the fuel container for hydrogen content determination (ASTM D3701).
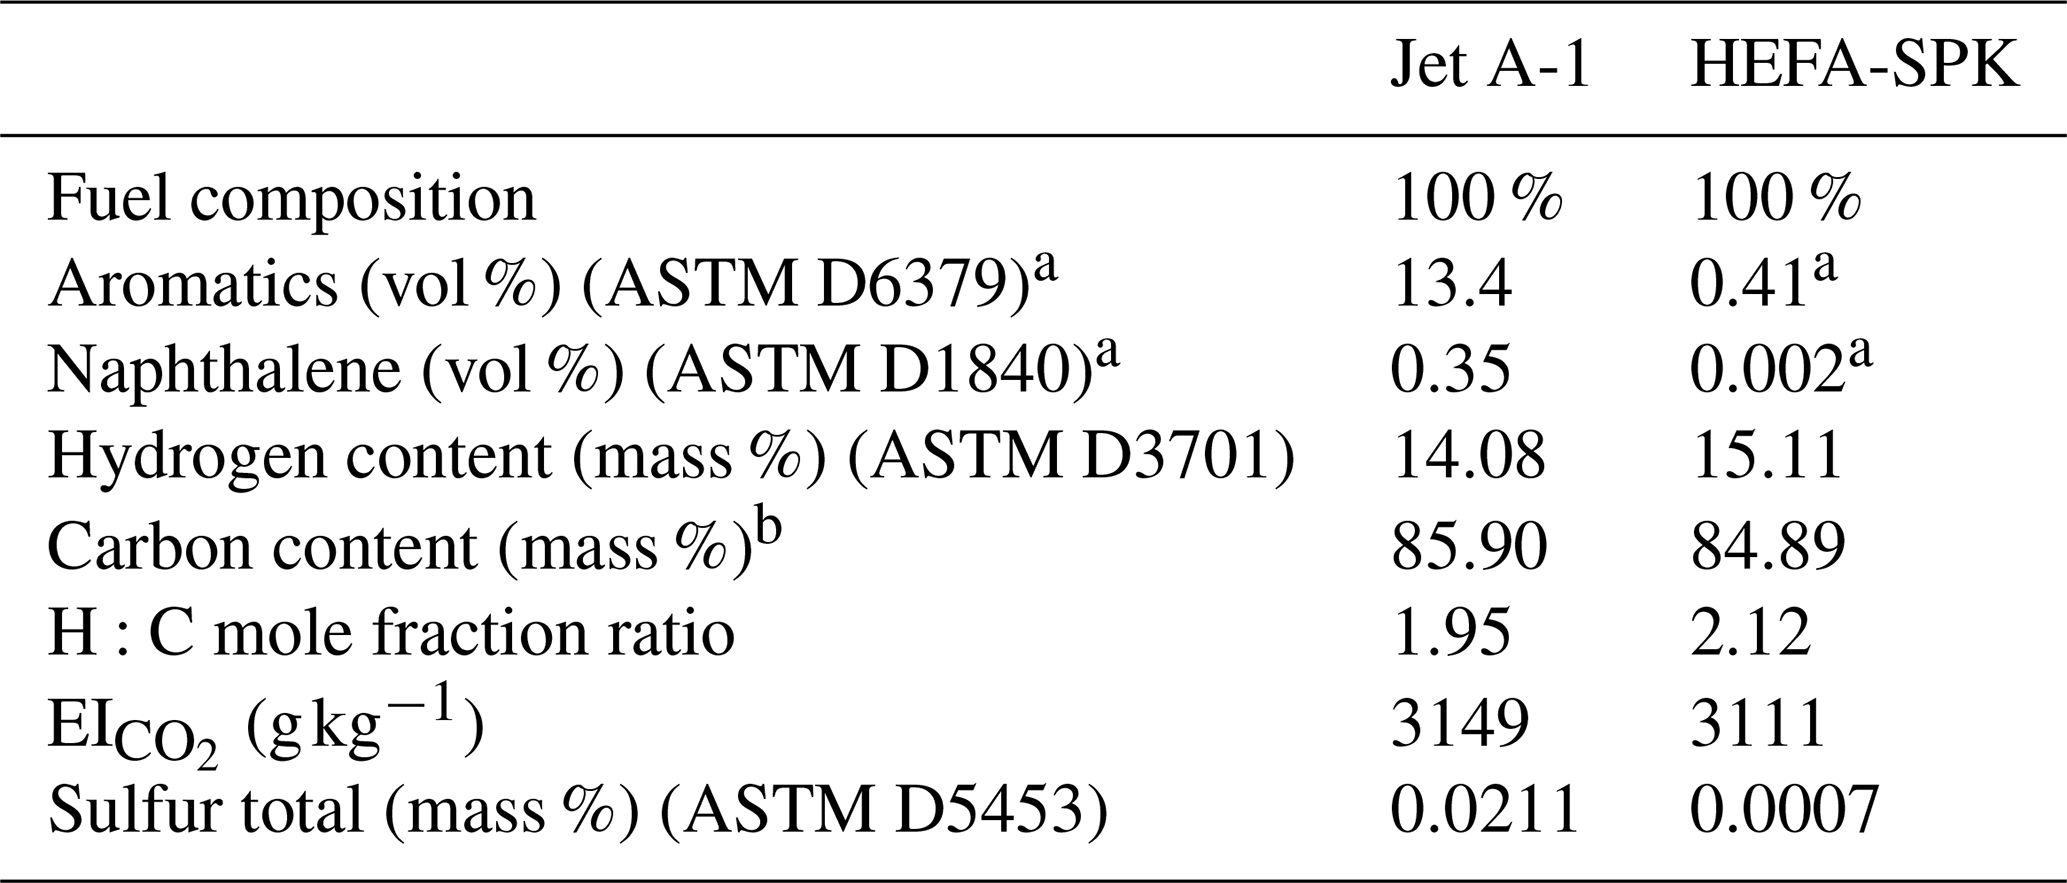
a The aromatic (naphthalene) content of HEFA-SPK is given (mass %) and determined by GCxGC measurements due to the contents being below the ASTM D6379 (D1840) detection limits. b Carbon content based on the difference between 100 % and hydrogen and sulfur content.
From the flights performed during the ECLIF3 campaign, the flight on 16 April 2021 stands out as having produced contrail data under ice-supersaturated conditions in a narrow range of atmospheric ambient and engine conditions as well as contrail ages. During this flight over the Mediterranean Sea, race track patterns were flown in a north–south direction west of Corsica and Sardinia while burning 100 % Jet A-1 and HEFA-SPK fuels sequentially in both engines. The A350 was cruising at flight level FL350 ≈10.65 km, while contrail ice particles formed from the engine exhaust. Contrails in the wake vortex phase were subsequently probed in the range of 48 m below to 96 m above the emission altitude in the secondary wake by the ice crystal instrumentation on board the Falcon.
2.2 Instrumentation and data evaluation
The DLR Falcon research aircraft is a Dassault Falcon 20E5 twin-engine business jet class aircraft, which has been highly modified to accommodate a multitude of atmospheric measurements. The airframe is built sufficiently robustly to enable measurements in the high-turbulence regime behind large passenger aircraft. Extensive onboard instrumentation provides highly resolved aircraft position and dynamics data as well as data on ambient meteorological conditions (Bögel and Baumann, 1991; Krautstrunk and Giez, 2012; Giez et al., 2017, 2020, 2021, 2023). These meteorological parameters such as temperature and pressure serve as input values for the several calculated quantities discussed in this work. Horizontal aircraft distances were determined as the great circle distances based on the WGS84 GPS latitude and longitude of both aircraft, while vertical distances were determined as the difference between the WGS84 GPS altitudes of the two aircraft, resulting in a triangulated total distance. Using wind field measurements on board the preceding Airbus A350 and the DLR Falcon ground speed, the time between plume emission and detection of the drifted contrail was iteratively calculated, thereby providing contrail ages at every point in time during the flight. This age is used to assign the correct aircraft and engine conditions at the time of emission to the time of detection for the respective contrail. During the flights, underwing-mounted cloud probes and a cabin instrumentation for aerosol and trace gas measurements were employed and will be described in the following.
2.2.1 Ice particle and aerosol measurements
Ice particle data were obtained using the two instruments Cloud and Aerosol Spectrometer (CAS) (Baumgardner et al., 2001) and Cloud, Aerosol, and Precipitation Spectrometer (CAPS), containing a CAS part and equipped with an additional Cloud Imaging Probe (CIP). CAS-DPOL was mounted on the port-side inner-underwing position, while CAPS was mounted on the starboard inner-underwing position, resulting in a horizontal distance of approximately 7 m between the two instruments. Nominally, the CAS parts of both probes cover a particle size range of 0.5–50 µm, while the CIP covers 15–900 µm (Moser et al., 2023; De La Torre Castro et al., 2023). Contrail ice particles at a probed age of 1 min to several minutes typically lie in the size range covered by the forward-scattering cloud probes (Voigt et al., 2010, 2011, 2017; Bräuer et al., 2021b), and therefore we direct the focus to the analysis of CAS data. The CAS instruments operate with a λ=658 nm laser, where the detection of forward-scattered laser light delivers information on the number concentration and size distribution of ice particles. The CAS part of the CAPS used in this experiment has been further developed compared to the single CAS, transitioning from a three-gain stage configuration to only two-gain stages with a variable gain stage overlap region. The CAS was calibrated using the methods of Rosenberg et al. (2012), and a size calibration conducted by the manufacturer Droplet Measurement Technologies Inc. was used for the CAPS. This calibration leads to an instrument-specific size range of 0.66–41 µm for the CAS (Voigt and Maerkl, 2024) and a range of 0.5–51 µm for the CAPS. The CAS sampling area SACAS of 0.22 ± 0.04 mm2 was mapped using a mono-dispersed stream of water droplets, and the CAPS sample area SACAPS of 0.25 ± 0.05 mm2 was provided by the manufacturer.
The size-dependent scattering cross section and subsequent size allocation of measured particles are influenced by their aspect ratio. Measurements by Gayet et al. (2012) show that contrail ice crystal shapes transition from quasi-spherical to more aspherical within the first 5 min of contrail age (Jeßberger et al., 2013). Sanz-Morère et al. (2020) suggest that the change in particle shape affects the radiative forcing of contrails. Therefore, for this analysis, an aspect ratio of 0.75 has been chosen with an ice particle refractive index of 1.31 and scattering cross sections derived from T-matrix simulations (Borrmann et al., 2000).
Aircraft engines emit a multitude of particle types called nonvolatile and volatile particles according to the measurement method used (see below). The nonvolatile particle fraction in the exhaust primarily consists of soot from combustion, possibly containing sulfur or other volatile compounds that condense onto the soot particles in the cooling plume. Volatile particles include aqueous particles of sulfur compounds, unburned hydrocarbons, nitrates, and others which are nucleated from precursor gases in the rapidly cooling exhaust at the engine exit. Depending on the engine design, another source of volatile particles can be oil venting from the engine lubrication oil system (Timko et al., 2010; Fushimi et al., 2019; Ungeheuer et al., 2022). The DLR Falcon aerosol measurement system measures particle number concentrations using a set of butanol-based condensation particle counters (CPCs), which have been customized for aircraft use, sampling ambient air through a forward-facing quasi-isokinetic inlet on top of the fuselage. To discriminate between total aerosol (i.e., nonvolatile plus volatile particles) and nonvolatile particles, three of the CPCs are connected to a section of an inlet line heated to 250 °C (thermodenuder) to evaporate volatile components of the bulk aerosol. In addition, the CPCs sample with different lower cutoff diameters D50 using diffusion screen separators (Feldpausch et al., 2006). At altitude, the lower cutoffs for nonvolatile particulate matter (nvPM) are approximately 14, 35, and 90 nm. Total particles are sampled down to 5 nm, not considering inlet losses. In the principally possible case that (semi-)volatile particles survive the thermodenuder, their particle diameter would likely be reduced to below the detection limit of 14 nm, thereby reducing sampling bias. The particle counters are operated roughly at ambient pressure. Butanol-based CPCs encounter a loss of counting efficiency at low sample pressures (Noone and Hansson, 1990), which has been characterized in lab experiments with a setup similar to Hermann and Wiedensohler (2001) using the size-selected Ag aerosol at 35 nm from a tube furnace as a reference aerosol. Based on this characterization, a parameterized correction function is used to correct each particle counter individually. Due to ice activation of nonvolatile particles, particles entering the aerosol inlet are significantly larger than the initial nvPM ice nuclei. An enrichment of aerosol particles occurs in the fuselage-top-mounted inlet owing to slightly sub-isokinetic conditions resulting from true air speeds exceeding values that ensure isokinetic conditions. Based on a typical contrail ice particle size distribution, a correction factor to this enrichment of 76 % was calculated according to the equations in Krämer and Afchine (2004) and Hinds (2012). Assuming a nucleation efficiency of 96 % according to Kärcher et al. (2018), this correction factor is applied to 96 % of the median nvPM EI value from far-field contrail conditions. The overall uncertainty of particle counting during far-field measurements including uncertainties due to the size-distribution-dependent enrichment of aerosol particles in the inlet is conservatively estimated to 18 %.
2.2.2 Trace gas and water vapor measurements
Total reactive nitrogen (NOy), the sum of all reactive nitrogen species in the atmosphere, was measured using a well-established technique. On the surface of a heated gold tube, NOy species are reduced catalytically to NO, followed by detection by a chemiluminescence detector (Ziereis et al., 2022, and references herein). The single-channel instrument (a modified CLD 780TR, Eco Physics) worked with at 1 Hz sampling rate and received ambient air via an upper fuselage mounted inlet as well. The mean measurement uncertainty for the investigated contrail sequences was approximately 1 ppb.
Water vapor measurements were conducted with the water vapor mass spectrometer AIMS (Kaufmann et al., 2016, 2018), also receiving ambient air through an inlet mounted on the upper fuselage and designed for high-frequency measurements in the upper troposphere and lower stratosphere. The measured ambient water vapor mixing ratio together with ambient temperature and pressure measurements from the Falcon instrumentation is used to calculate the relative humidity with respect to ice. Time-averaged RHi values are calculated for each plume encounter to assess whether measurements were taken under ice-supersaturated conditions (RHi>100 %). The uncertainties of 0.5 K in the temperature measurements and 8 %–12 % in the water vapor data combine to an uncertainty of around 15 % for the RHi determination (the uncertainty of static pressure is negligible for the RHi calculation).
2.2.3 Determination of the apparent ice emission index
In order to be able to compare measurements at different contrail ages, stages of contrail vortex dynamics, and positions in the contrail, a dilution-corrected metric is needed. Generally, for particles of type X, an emission index is defined by (Beyersdorf et al., 2014)
Here, ΔX and ΔTr are the enhancement of the particle number and the mixing ratio of a gaseous tracer, which are assumed to have the same mixing behavior as the particles above their respective background. Mair and Mtracer are the molar masses of air and the tracer gas, ρair is the density of ambient air, and EItracer is the emission index of the used tracer gas.
Analogous to the emission index for particle number concentrations, the apparent contrail ice emission index (AEI) describes the number of contrail ice particles formed from aircraft exhaust per kilogram of fuel burned. By using a dilution tracer and measuring in the secondary wake, a dilution-corrected metric is achieved, which can be used to draw conclusions for the two probed fuels independent of contrail age. The AEI is sensitive to processes affecting ice particle number concentrations such as sublimation, thereby resolving small-scale variations in ice particle number concentrations as well as ice particle loss due to entrainment of ice-subsaturated ambient air. The average enhancement of CO2 in contrails during the measurements discussed here was in the range of the background variability of the long-lived greenhouse gas CO2. In contrast, due to the relatively low background concentration and variation in the atmosphere at cruise altitudes, reactive nitrogen species NOy are a useful tracer as an indication of contrail dilution. At high engine power settings, emitted nitrogen compounds mainly consist of NO (>80 %) and NO2, while NO rapidly reacts with O3 to form NO2 (Schulte et al., 1997). Therefore, in order to minimize induced uncertainties due to CO2 background variability, NOy was chosen as a dilution tracer. Measured NOy contains all nitrogen species processed in the atmosphere from the initial NOx emissions. As stated in Schulte et al. (1997), the NOx emission index is defined in mass units of NO2. Therefore, NO2 molar mass is used for the NOy tracer together with the molar mass of air and the gas constant, resulting in the following equation dependent on measured parameters:
During a chosen contrail measurement interval, ΔN and ΔNOy are the time integrals over ice particle number concentration and NOy concentration enhancements over their respective atmospheric backgrounds, and Tamb and pamb are the mean ambient temperature and pressure. refers to the NOx emission index, which is mainly determined by thermal origin NOx related to the combustion state rather than fuel-related effects such as fuel-bound nitrogen and H:C content-dependent peak flame temperature (Blakey et al., 2011). predictions based on the Rolls-Royce prediction method (P3T3 method) and performed by Rolls-Royce are used for the compressor outlet temperature (T30) ranges corresponding to the far-field ice particle measurements presented here. Resulting values are 17.4 g kg−1 for the T30 values of Jet A-1 and 17.5 g kg−1 for the 6.5 K higher T30 values during combustion of HEFA-SPK.
Time intervals are defined as beginning when ice particle number concentrations start significantly departing from background levels and ending when they return to the background. Fluctuations in background concentrations for ice particles are negligible compared to ice particle enhancements in contrails and are therefore assumed to be zero. Background levels of NOy are determined for every time interval and lie at a mean value of (0.76 ± 0.12) ppb for our contrail sequences (where “ppb” denotes the molar mixing ratio nmol mol−1).
If the Falcon is fully immersed in the contrail, a quasi-homogeneous spatial distribution of ice particles at every point of the aircraft is assumed. In certain measurement sequences at the edge of contrails, this assumption does not hold and the ice particle instrumentation may be more immersed in the contrail than the trace gas inlet or vice versa due to the distance between the two instruments. This situation leads to a strong discrepancy in concentration measurements between ice particles and the trace gas, resulting in disagreeing time-resolved peak shapes between the two quantities. This indication is used to mark invalid sequences and to exclude them from further investigation as they would produce misleading apparent ice emission indices based on respective dilutions not equal to those in the ice particle measurement.
2.2.4 Uncertainties of apparent ice emission indices
In the following section, single contributions to the total uncertainty of apparent ice emission indices are explored, and the total uncertainty is quantified. Following Eq. (2) for the definition of AEI, uncertainties of individual parameters are taken into account: (a) ice particle measurements (∂ΔNmeas), (b) NOy measurement (), (c) NOy background determination (), (d) ambient temperature measurements , (e) ambient pressure measurements , and (f) prediction uncertainty .
Ice particle number concentrations according to Eq. (A1) depend on several parameters with individual uncertainties. Uncertainty due to counting statistics is estimated by , where is the sum over 1 Hz counts from the beginning to the end of a single contrail time interval. Further, sample area uncertainty has been determined as approximately for the CAS-DPOL and for the CAPS via sample area calibrations and the uncertainty in using true air speed (TAS), as sample air speed (SAS) has been determined as in simulations. These uncertainties are propagated using Gaussian error propagation, resulting in a total ice particle measurement uncertainty (∂ΔNmeas). NOy measurements are affected by uncertainties consisting of the instrument and measurement accuracy and the uncertainty determined by atmospheric background fluctuations . The total uncertainty of AEI is finally calculated by using the Gaussian error propagation described in Eq. (3).
This amounts to a median AEI uncertainty of approximately 33 % for the determination of absolute AEI values. When only considering non-systematic errors in ice particle measurements and disregarding prediction uncertainty, which do not influence the relative difference of values to each other, the median AEI uncertainty is reduced to approximately 24 %.
2.2.5 The CoCiP model
CoCiP is a Lagrangian model that traces individual contrail segments forming along given flight routes (Schumann, 2012). For the present application, CoCiP prescribes the ambient atmosphere using numerical weather analysis data of the Integral Forecasting System (IFS) of the European Centre for Medium-Range Weather Forecasts (ECMWF) with 0.125° spatial and 1 h temporal resolution, on model levels with about 300 m vertical resolution at the given levels. The model simulates the contrail as forming behind the Airbus aircraft for a given flight route, speed, fuel consumption, and fuel hydrogen content, resulting in a soot emission index computed for the given engine type as in Teoh et al. (2022a). In this application, CoCiP uses the Falcon-measured relative humidity changed by the difference in relative humidity in the IFS values at the contrail position and at the Falcon position (RHi at the Falcon position as measured plus RHi at the contrail position as derived from IFS data minus RHi at the Falcon position as derived from IFS data). The Schmidt–Appleman threshold temperature is computed using the actual overall propulsion efficiency η (Schumann, 1996; Poll and Schumann, 2021). The model assumes that the soot particles emitted into the young exhaust plumes act as condensation nuclei for ice particle formation when humidity exceeds liquid saturation locally in the engine exhaust while mixing with ambient cold air. The resultant droplets freeze soon thereafter because of low temperature. The initial contrail phase is prescribed in terms of the initial number of ice particles per flight distance, the initial geometrical plume cross-sectional area, and the initial ice water content. The initial ice water content is computed from times fuel flow per distance plus the amount of humidity entrained from ambient air into the contrail, assuming uniform mixing across the plume cross section, the area of which varies with age. The initial number of ice particles per flight distance is set equal to the number of soot particles emitted per flight distance into the contrail. Part of the ice particles sublimates in the sinking wake vortex when the ambient air is below ice saturation. This is modeled in CoCiP thermodynamically as a function of adiabatic warming due to contrail sinking. Further losses occur due to detrainment from the wake by turbulent mixing with dry ambient air. Contrails spread vertically, mainly by turbulent mixing excited by shear and limited by stable stratification. The further changes in contrail bulk ice physics are approximated as a function of ice water content and ice particle number Nice per flight distance assuming saturation inside the contrail. The mean local ice particle concentration nice is computed from the number of ice particles per flight distance divided by the plume cross section. The number of ice particles per unit plume length decreases slowly due to parameterized aggregation between contrail particles and turbulent mixing losses. The contrail ice water content grows by uptake of ambient humidity entering the plume when mixing with ambient ice-supersaturated air. When mixing with subsaturated air, the ice water content decreases and the contrail disappears after some time when the contrail ice water content reaches zero. Hence, as observed (Li et al., 2023), the contrails persist for some time in ice-subsaturated air. The volume mean particle radius rvol is computed from the ice mass and particle number per volume. The volume mean ice particle size is used to compute the mean fall speed (Spichtinger and Gierens, 2009). The vertical motion of the contrail follows the sum of the ambient vertical velocity and fall speed. Sedimentation also contributes to enhanced vertical widening of the plume cross section. Contrails terminate when all ice water content is sublimated by mixing with dry air or when the ice particles fall below the model bottom. CoCiP has been compared extensively with in situ and remote sensing observations (Voigt et al., 2010, 2017, 2022; Jeßberger et al., 2013; Schumann and Graf, 2013; Schumann et al., 2013, 2015, 2017, 2021).
2.2.6 Estimating contrail cirrus radiative forcing within a climate model
In order to estimate the climate impact of contrail cirrus, we conducted two global climate simulations, one for a global aircraft fleet using Jet A-1 fuel and the other using 100 % HEFA-SPK. The simulations were performed with the general circulation model ECHAM5 (Roeckner et al., 2003) coupled with the Hamburg Aerosol Module (Stier et al., 2005). Within this model, a contrail cirrus module, CCMod, was implemented, consisting of parameterizations of the processes important for the lifecycle of contrail cirrus and their microphysical properties. The CCMod parameterization introduces a separate cloud class, contrail cirrus, consistent with the model's cloud scheme, which interacts with natural cirrus clouds (Burkhardt and Kärcher, 2009). Water and heat budgets are closed within ECHAM5–CCMod, which means that contrails and cirrus compete for available water vapor and that diabatic heating due to microphysical and radiative processes within contrails has an impact on the atmospheric state. The model uses a microphysical two-moment scheme (Lohmann et al., 2008; Bock and Burkhardt, 2016b). Contrail formation follows the Schmidt–Appleman criterion (Schumann, 1996). The ice nucleation parameterization, based on Kärcher et al. (2015), estimates the number of soot and ambient particles that form droplets, which subsequently freeze. The number of droplets forming and subsequently freezing is not only dependent on the number, size, and hygroscopicity of soot and ambient atmospheric particles but crucially also on the atmospheric state with fewer droplets forming when contrail formation happens close to the Schmidt–Appleman criterion. The ice crystal loss in the vortex phase is parameterized according to Unterstrasser (2016). The parameterization is based on large eddy simulations (LES) with detailed microphysics, assuming a typical initial ice crystal size distribution, and Lagrangian ice crystal tracking. The evolution of young contrails is simulated and dominated by the interplay of microphysics and wake vortex dynamics, leading typically to sublimation and partial loss of contrail ice crystals within the descending vortices. The resulting ice crystal loss is dependent on atmospheric and aircraft-related parameters. The number of ice crystals that form behind an aircraft and survive the vortex phase is parameterized within ECHAM5–CCMod. The number of ice crystals has been shown to be a predictor of contrail cirrus radiative forcing (Burkhardt et al., 2018; Bier and Burkhardt, 2022). Bier and Burkhardt (2022) show that contrail ice nucleation is in good agreement with in situ measurements and that there is a large spatial variability of ice nucleation for fixed soot number emissions with nucleation rates much smaller at lower altitudes and in tropical areas. Contrails are initialized within the model, calculating a consistent set of ice crystal number concentrations and a contrail cross-sectional area from the apparent ice number emission index resulting from the ice nucleation and ice crystal survival parameterizations. Ice water content at initialization results from the water emissions and to a larger degree from the environmental ice supersaturation. Contrails persist and spread within the fraction of the grid box that is ice-supersaturated (Burkhardt et al., 2008). The nucleated ice crystals are assumed to be homogeneously distributed within the plume volume, which grows initially due to turbulent diffusion and later due to the combined action of vertical wind shear, increasing the contrail vertical tilt, and differential sedimentation of the contrail ice crystals (Bock and Burkhardt, 2016b). While contrail ice crystals initially grow by efficiently relaxing high plume ice supersaturations, in the later lifecycle, ice crystal number concentrations are often not large enough to relax atmospheric ice supersaturation within a time step. Therefore, we limit ice crystal growth for low ice crystal number concentrations (Bock and Burkhardt, 2016b). Otherwise, ice microphysical processes within the later lifecycle of contrails are the same as in natural ice clouds and are therefore calculated by the model's microphysical scheme. The ice crystal number concentration, ice water content, and optical depth of young contrails and contrail cirrus were shown to be in good agreement with in situ and satellite-based observations (Bock and Burkhardt, 2016a). The further evolution of the ice crystal size distribution could only be simulated using a higher-order microphysical scheme, which is common, e.g., in LES. Such microphysical schemes would be computationally expensive and difficult to constrain due to the sparseness of measurements.
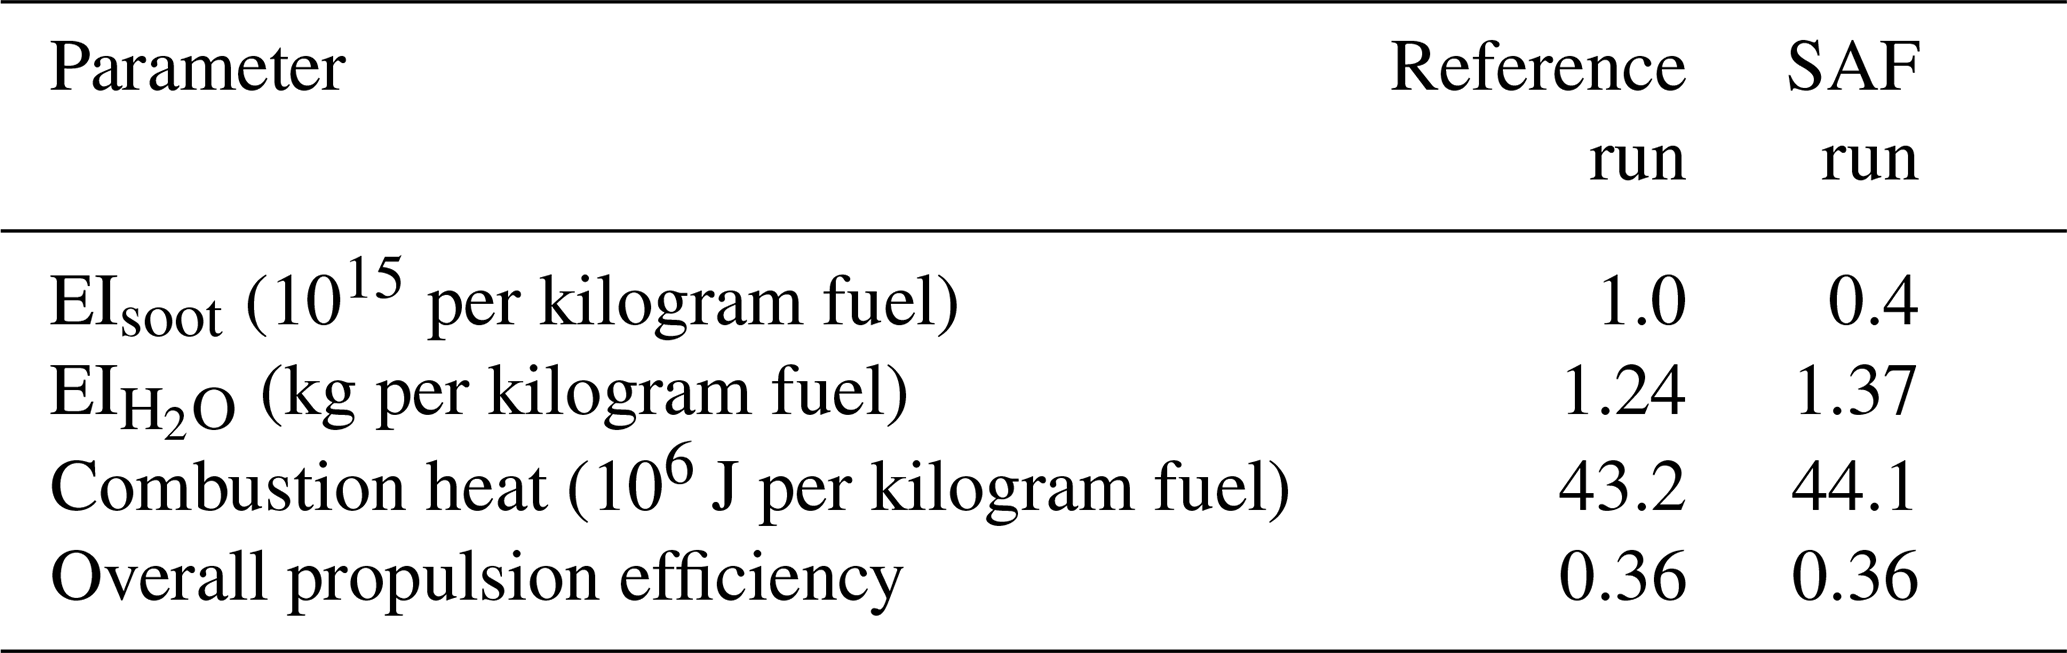
Air traffic (flight distance and fuel consumption) is prescribed by the AEDT flight inventory (Wilkerson et al., 2010) for the year 2006. For the reference simulation representing the average fleet currently in service, we used a soot emission index of (Table 2), which is described in Teoh et al. (2024) as the global fleet average for the year 2019. In the second simulation, portraying the use of 100 % SAF for the entire fleet, we reduced the soot number emission index, consistent with the measurements of the apparent ice number emission index (Sect. 3.2). In the soot-rich regime for temperatures several degrees below the Schmidt–Appleman contrail formation temperature, the decrease in ice crystal numbers is equal to the decrease in emitted soot numbers. We therefore prescribe a reduction in soot number emissions of 60 % resulting in a soot number emission index of . As will be discussed below, this reduction in ice crystal numbers may be partly due to a reduction in soot number emissions and partly due to the low sulfur content of the fuel. The H2O emission index and the combustion heat for kerosene were made consistent with measurements from the ECLIF1 measurement campaign, while the respective values for 100 % SAF were set to values from HEFA-SPK available during measurement campaigns in November 2021. The overall propulsion efficiency is estimated for the current high-bypass ratio fleet (Epstein, 2014). The simulation parameters are summarized in Table 2. The spatial resolution of the climate model was set to T63L41 (equivalent to ∼200 km grid boxes at the Equator and a vertical resolution of approximately 500 m at the tropopause) with a corresponding time step of 10 min. We perform our simulations using an air traffic inventory of the year 2006 and scale our results to the year 2018 as done in Lee et al. (2021).
Table 2Input parameters for the reference fuel and the SAF fuel global climate simulations.
3.1 Measurement of contrails at cruise altitude
This section presents an in-depth analysis of in situ contrail ice particle measurements under cruise conditions during the contrail flight on 16 April 2021 behind an Airbus A350-941 equipped with Rolls-Royce Trent XWB-84 engines and burning 100 % reference Jet A-1 and 100 % HEFA-SPK successively. One other flight from ECLIF3-1 focused on emission measurements, and the other contrail flight did not have the option of providing 100 % HEFA-SPK to the two engines, as this was the first test flight. Far-field contrail measurements (distance between 19 and 35 km) of Jet A-1 fuel were conducted between 11:18:22 and 11:33:00 UTC, while contrails from burning HEFA-SPK were measured between 11:42:16 and 11:52:55 UTC. A detailed time series plot of this measurement sequence is shown in Fig. 1, where the sequences of Jet A-1 and HEFA-SPK are shaded in gray and green, respectively. Contrail encounters are marked by strong increases in ice crystal numbers and soot numbers, in line with enhanced CO2 and NOy measurements. The contrail measurements are clearly identified in the measurement time series.
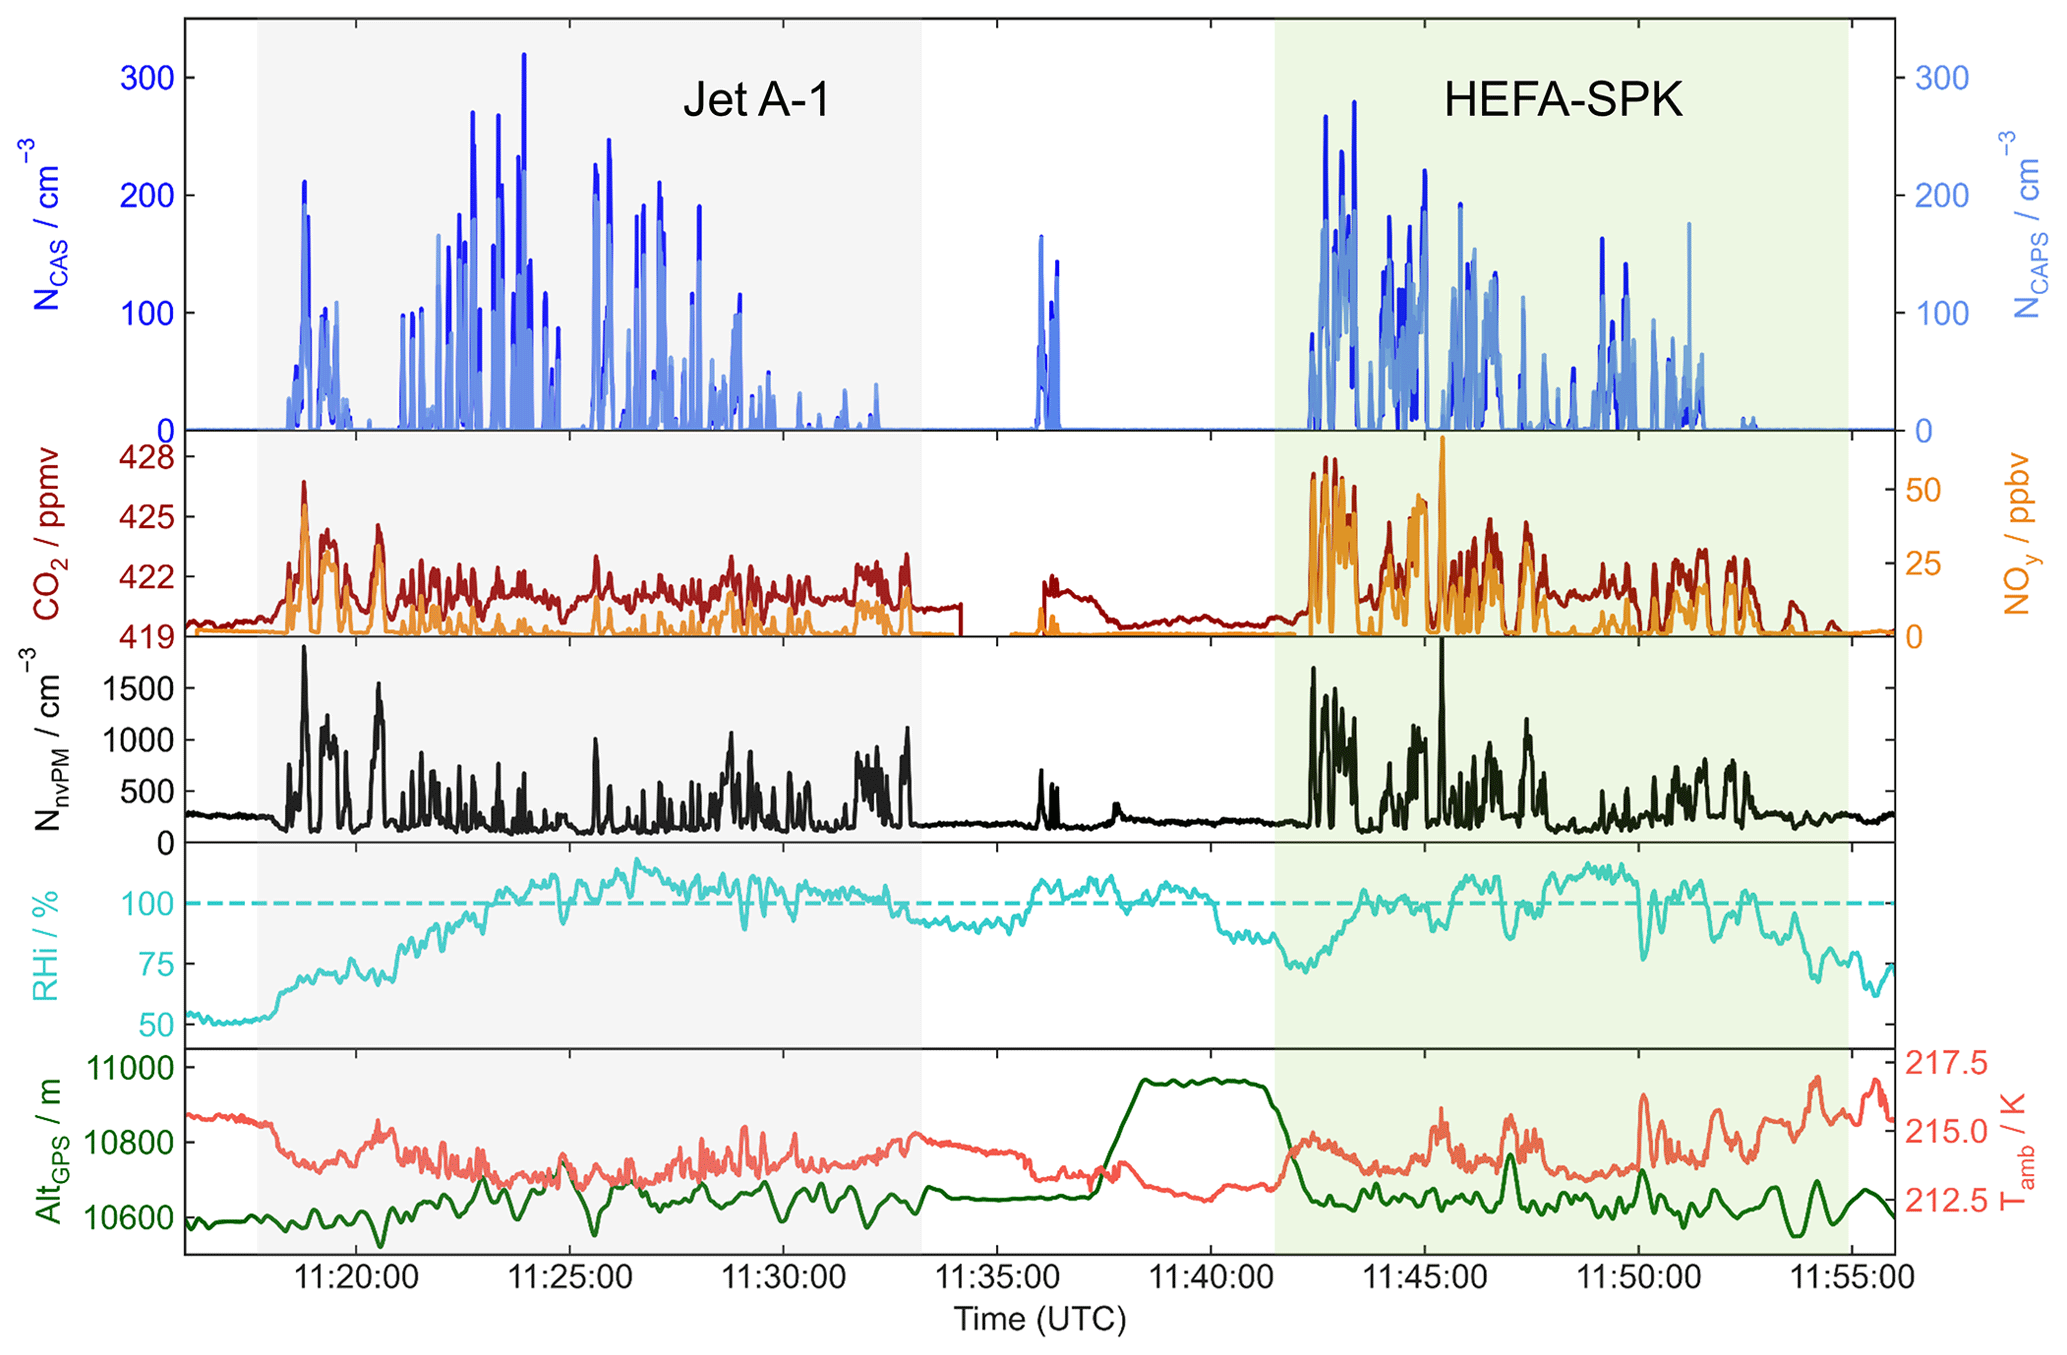
Figure 1Time series of 1 Hz data during far-field measurement sequences of Jet A-1 (gray shading) and HEFA-SPK fuel (green shading) showing number concentrations of ice crystals larger than at least 0.5 µm measured by the CAS (NCAS) and CAPS (NCAPS) instruments, CO2 and NOy mixing ratios, and number concentrations of nonvolatile particles >14 nm (NNvPM), relative humidity over ice (RHi) during the measurements with indicated saturation (dashed line), and the GPS altitude of Falcon (AltGPS) with the Falcon-measured ambient temperature (Tamb).
The difficulty of drawing any reliable conclusions from time series alone illustrates the need for the dilution-corrected apparent contrail ice emission index. In the time series, groups of peaks can be seen where each individual peak of ice particle measurements constitutes a contrail encounter with a peak defined as the time period between the departure from and return to ice particle background concentrations. However, not all of the collected data shown in Fig. 1 can be used to calculate valid apparent ice emission indices. The selection of data sequences to derive apparent ice emission indices is described in Appendix B.
After filtering data according to the criteria described above, a data set remains with quality-controlled valid data points, which can be used to calculate comparable AEI values. Table 3 lists the ranges, means, and standard deviations as computed for the reduced data set. Here, in addition to the columns for Jet A-1 and HEFA-SPK, a third column shows the values for HEFA-SPK when applying a filter to the data set that only accepts contrail encounters where the time series of ice particle measurements and NOy correlate better than 60 %. In this way, aforementioned sequences with preferential contrail immersion of either the aerosol and trace gas inlets or the ice particle instrumentation are quantified and can be disregarded for further analysis. Jet A-1 data are coincidentally not influenced by this filter, and therefore no separate column is given.
Table 3Contrail measurement conditions for the respective fuel measurement sequences. An ice-NOy time series correlation filter of 60 % further reduces HEFA-SPK data (third column), while Jet A-1 data are not further reduced by this filter.
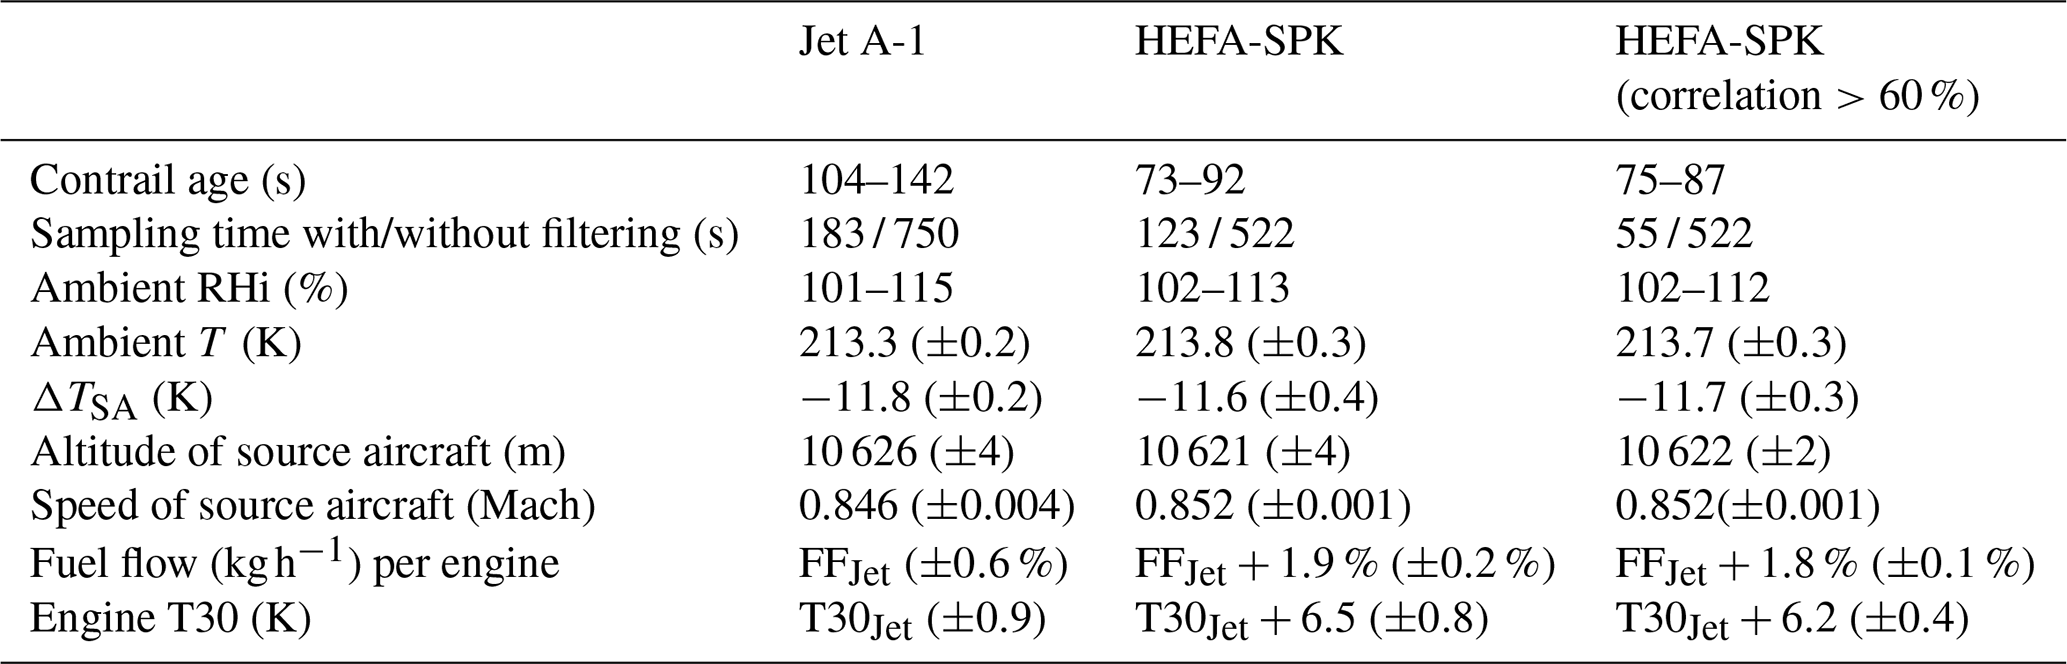
Measurement conditions filtered for RHi>100 %. The sampling time is the sum of valid contrail encounters. The arithmetic standard deviation (± a.s.d.) is given in parentheses. The original sampling time before the filters is given behind the slash.
For Jet A-1, measured contrails were between 104 and 142 s old, while HEFA-SPK contrails were slightly younger, between 73 and 92 s. While performing far-field measurements in contrails, the distance between the source aircraft and the DLR Falcon continuously increases due to the limited propulsion performance of the Falcon compared to the Airbus A350, thereby intentionally leading to the range of contrail ages for each fuel sequence. As the measurements were taken under ice-supersaturated conditions within the vortex regime in the secondary wake of the contrail near flight altitudes, ice particle number concentrations and tracers are assumed to be diluted similarly, so that the AEIs are not expected to be affected by the age difference. The total sampling time in all the valid contrails shown in Table 3 has the largest discrepancy between the two fuels and affects the statistical significance of data. As the data were filtered to only include ice-supersaturated data points, all the shown measurements were taken at RHi>100 % with very similar ranges between Jet A-1 and HEFA-SPK. The temperature-related parameters such as ambient temperature and the difference to the Schmidt–Appleman threshold temperature (ΔTSA) were within each other's standard deviations from the respective means. The emitting Airbus A350 was flying at nearly constant altitudes on flight level FL350 at steady Mach numbers for the two fuel burning sequences. Engine combustion conditions are described by the parameters high-pressure compressor outlet temperature T30 and the fuel flow FF. Their fluctuations are relatively small for each individual fuel sequence where average fuel flow and T30 were, respectively, 1.9 % and 6.5 K higher for HEFA-SPK burning sequences compared to Jet A-1. The differences in the ice-NOy correlation-filtered HEFA-SPK data points and the non-filtered data points are negligible except for the sampling time, which reduces the overall statistics of HEFA-SPK measurements. However, this step leads to an increased quality of data by quantifying spatial inhomogeneities and focusing on homogeneous contrail encounters.
Overall, the quality-controlled and reduced data set with the conditions shown in Table 3 provides a solid basis for comparison of the AEI for HEFA-SPK fuel burning compared to Jet A-1, considering fluctuations of relevant atmospheric and aircraft parameters are statistically distributed.
3.2 Impact of 100 % HEFA-SPK on the apparent ice number emission index AEI
With the quality-controlled data set described in previous sections (filtered for >60 % ice-NOy correlation), it is possible to compare the AEI for Jet A-1 and HEFA-SPK. Figure 2 shows comparisons of the AEI for Jet A-1 and HEFA-SPK (individual data points, medians, and arithmetic standard deviations) versus a set of parameters relevant in ice particle formation. Figure 2a relates contrail ice particle numbers to measured soot particle emission indices corresponding to the contrail measurement data, while further panels compare the AEI depending on the fuel parameters (b) naphthalene, (c) aromatics, and (d) sulfur.
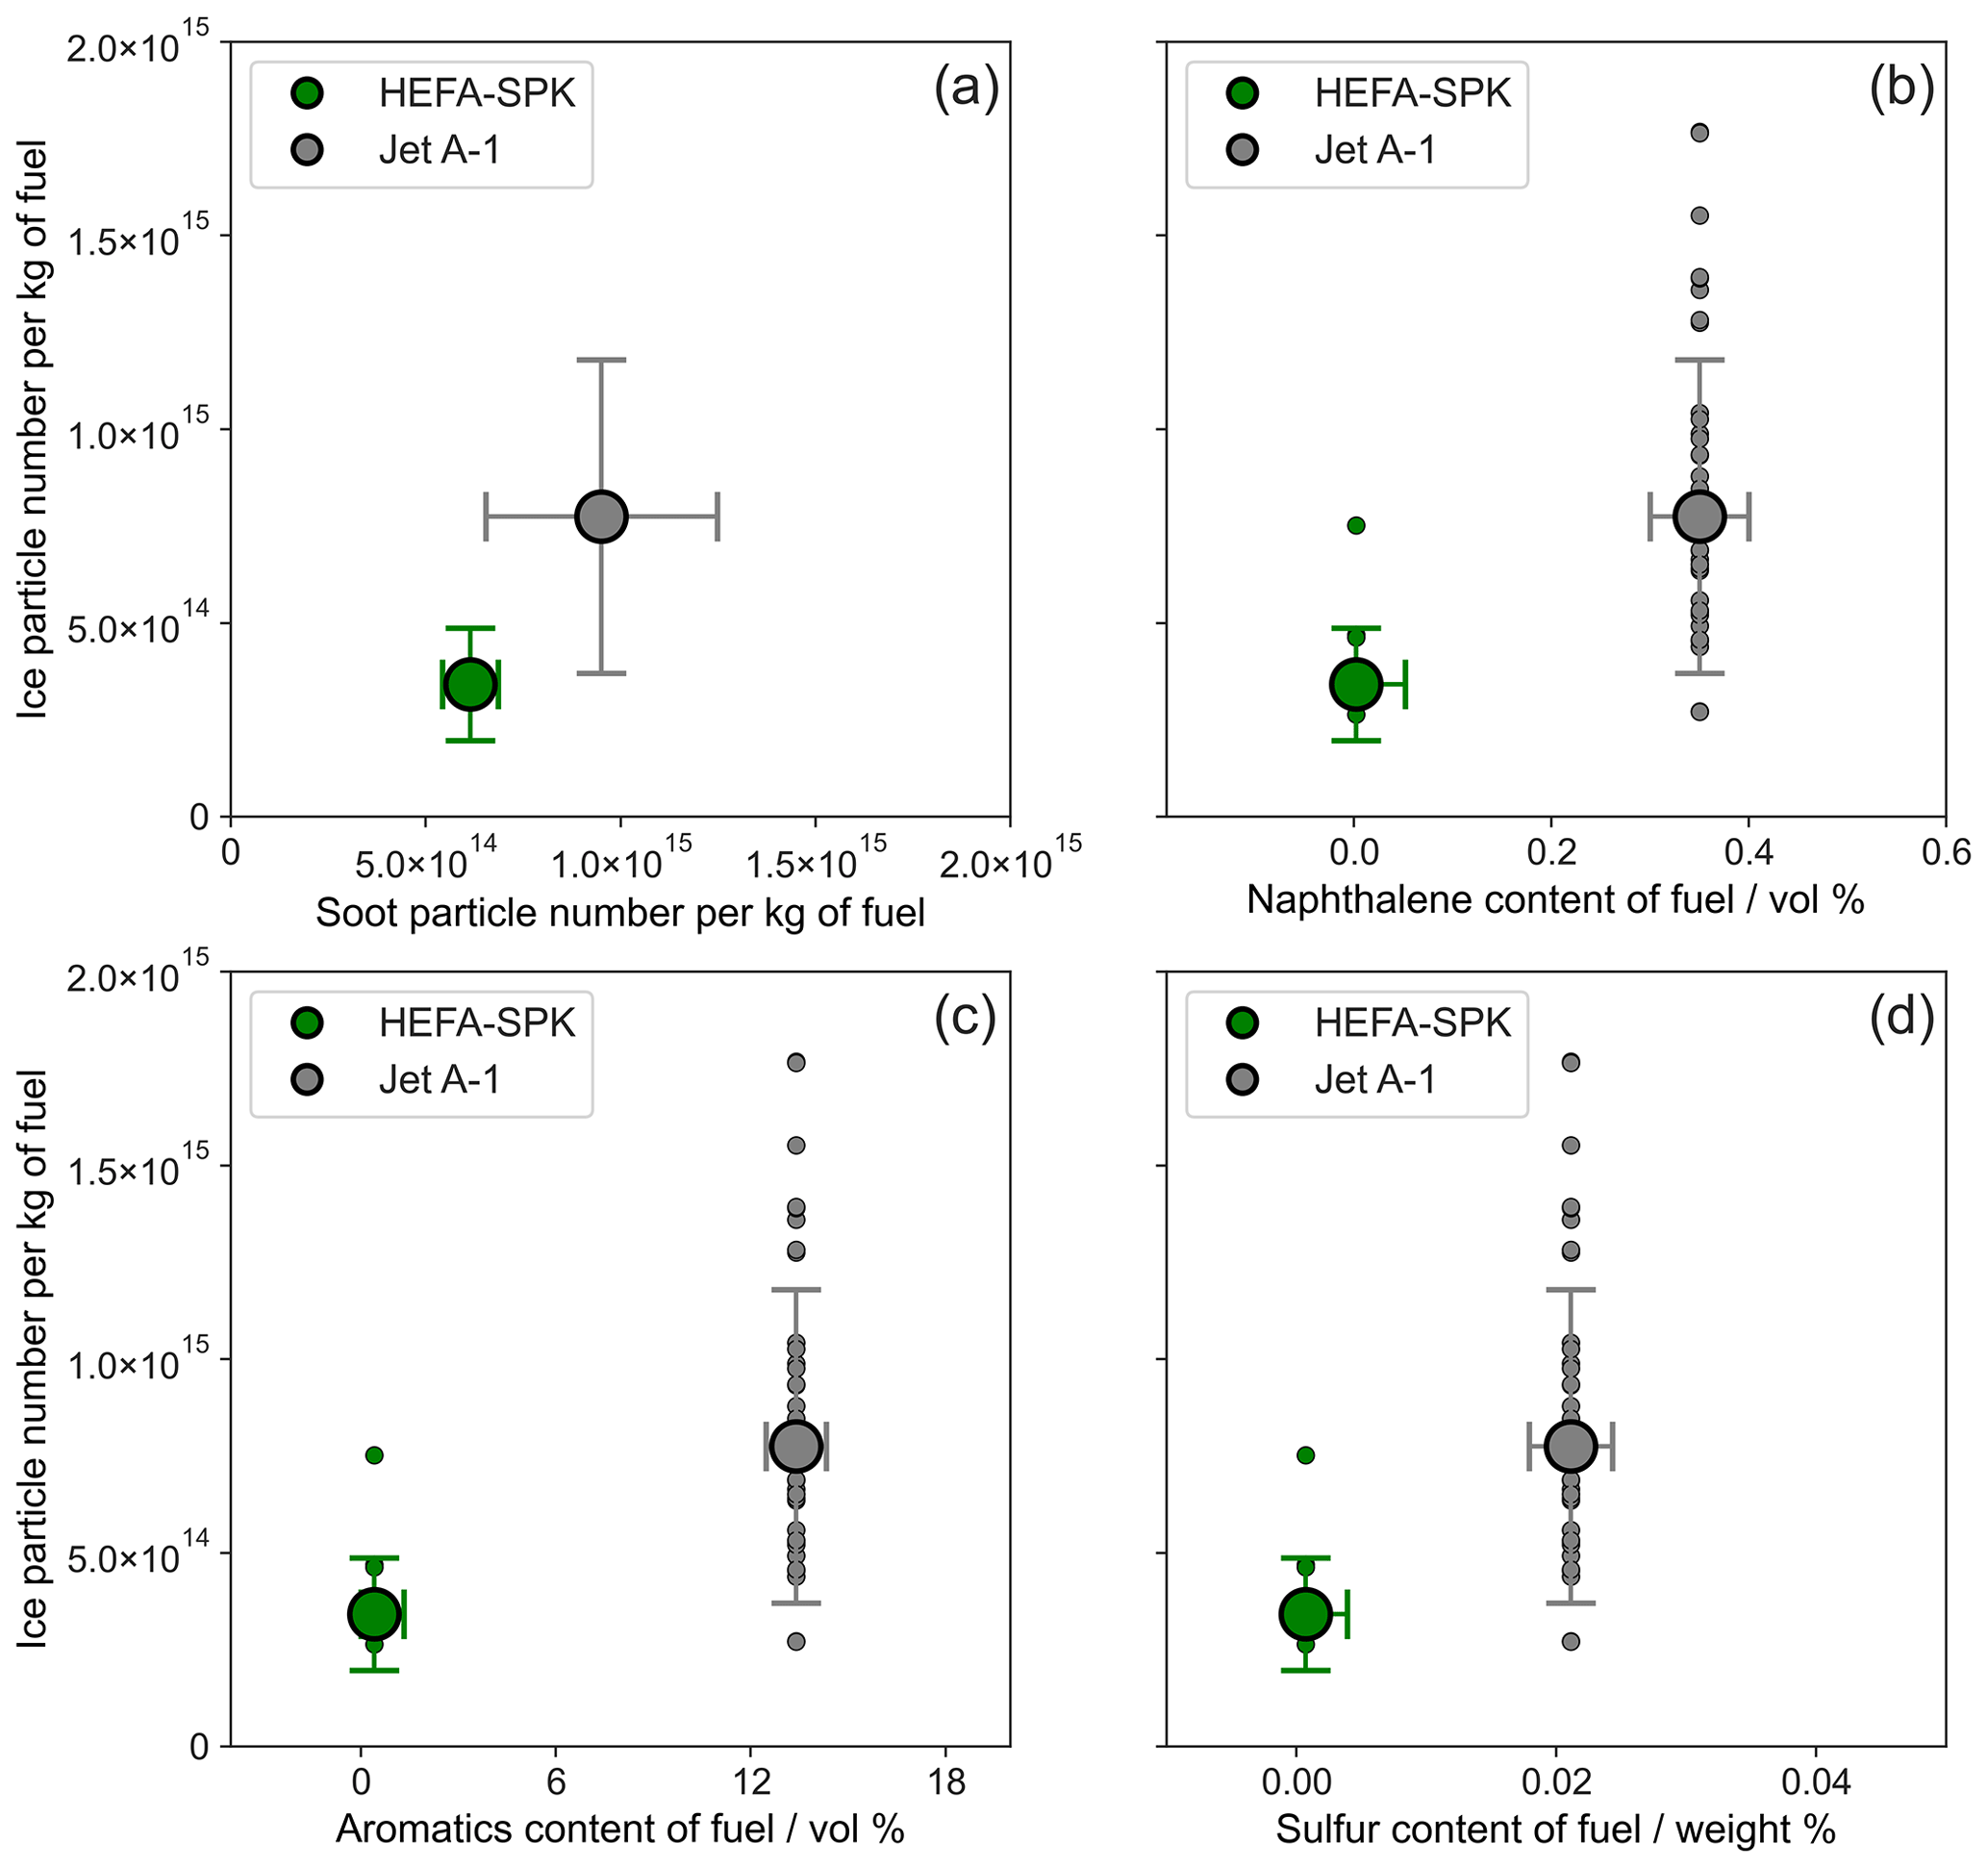
Figure 2The AEI of ECLIF3 (flight on 16 April 2021) contrail measurements of Jet A-1 and HEFA-SPK fuels versus (a) nvPM emission indices and versus the respective fuel parameters (b) naphthalene content, (c) aromatic content, and (d) sulfur content. x-axis values are shown in Table 1. Single-scattered data points show data from individual contrail crossings, large circles represent the respective medians, and the bars give the arithmetic standard deviation. Note: the aromatic (naphthalene) content of HEFA-SPK is based on GCxGC measurements (% w w−1) and not ASTM D6379 (D1840) due to being below the detection limit of these methods. x axis error bars are the reproducibility of the respective ASTM fuel property detection method (also used as a conservative proxy for GCxGC uncertainty).
Figure 2a shows a reduction in the median AEI for 100 % HEFA-SPK compared to Jet A-1 of 56 %. The absolute AEI decreases from 7.8×10¹⁴ to . At the same time, the median nvPM EIs are reduced by 35 % from 9.5×10¹⁴ to . Both fuels were probed under very similar conditions within a single flight, and therefore it is reasonable to attribute these reductions to properties of the probed fuels, which are explored in the following. Due to the higher binding energy between atoms in aromatics compared to aliphatic compounds, incomplete combustion and subsequent soot formation are enhanced for these compounds (Cain et al., 2013; Brem et al., 2015; Schripp et al., 2022). Naphthalene as a polycyclic aromatic compound is especially conducive to soot formation, and a reduction in naphthalene has been experimentally demonstrated to reduce apparent contrail ice emission indices (Voigt et al., 2021; Bräuer et al., 2021b). As shown in Fig. 2b and c, the naphthalene and aromatic contents are reduced to below their ASTM D1840 and ASTM D6379 detection limits for HEFA-SPK compared to Jet A-1. Hence, the soot reduction of 35 % can be explained by this reduction in aromatics and naphthalene in the SAF. It is also worth mentioning that, despite a strong or almost complete reduction in aromatics and naphthalene, there is still a residual amount of soot particle emissions of 6×10¹⁴ nvPM EI per kilogram of fuel that contribute to contrail formation from the combustion of HEFA-SPK. Also, the question arises why the 56 % reduction in ice particles is larger than the corresponding 35 % reduction in soot number emissions. The reduction in the sulfur content of the HEFA-SPK from 0.0211 to 0.0007 mass %, corresponding to a reduction of 97 % for HEFA-SPK compared to Jet A-1 shown in Fig. 2d, could give one possible explanation. Sulfur contained in fuels can result in emissions of gaseous SO2, which can lead to the formation of very small sulfuric acid droplets (Petzold et al., 1997; Schumann et al., 2002; Jurkat et al., 2011; Kärcher, 2018). Moreover, models show that sulfur can activate the initially hydrophobic soot particles (Jones and Miake-Lye, 2023). Thereby it facilitates ice particle nucleation by increasing the hydrophilicity of the soot particles (Wong and Miake-Lye, 2010). Our results point towards a possibly reduced soot particle activation into ice particles due to the low fuel sulfur content and might explain stronger reduction in ice particles than from the reduction in soot alone. A similar effect has been suggested by Jones and Miake-Lye (2023) to explain observations of reduced soot activation into ice for a low-sulfur HEFA-SPK blend measured during the ECLIF2 campaign (Voigt et al., 2021).
At the same time, a larger spread in AEI values is observed for the Jet A-1 data points compared to HEFA-SPK due to the larger sample size of Jet A-1 measurements taken under cruise conditions. A large range of ice crystal number concentrations has been measured in young contrails (Heymsfield et al., 2010; Voigt et al., 2010, 2011, 2017; Schumann et al., 2013, 2017; Jeßberger et al., 2013; Gayet et al., 2012; Chauvigné et al., 2018) due to the strong dynamical variations in humidity and temperature in the expanding plume as well as dilution in the vortex phase. The entrainment of ambient air in the primary vortex and the secondary wake leads to a multitude of conditions within the contrail, which can lead to sublimation locally, reflected in variations in ice crystal number concentrations (Lewellen et al., 2014). This explains the observed variations and shows that the assumption of AEI values not being influenced by vortex phase dynamics is not entirely true in reality. In addition, variations in altitude, position in the contrail, age of the contrail, and resulting state of development add to the distribution of AEI values due to ice crystal loss or measurement fluctuations as described in Sect. 2.2.3.
Medians and means of soot data are based on nvPM emission indices in far-field contrail measurements at the same time as the presented apparent ice emission indices. Although nvPM emissions are preferentially measured under ice-free near-field emission conditions, data from far-field contrail sequences were chosen due to their sensitivity to the Mach number of the source aircraft and the lack of near-field data at similar Mach numbers in the far-field ice measurements. However, nvPM emission indices are slightly higher than their corresponding AEI values, which indicates the presence of interstitial soot, resulting possibly from a reduction in nucleation efficiency for the low sulfur fuel, local sublimation effects, and/or fluctuations in nucleation efficiency. Further, the correction factor accounting for particle enrichment in the aerosol inlet is based on assumptions of ice particle size and nucleation efficiency, and effects such as particle trajectory deviations due to streamline compression and expansion at the fuselage (Afchine et al., 2018) are not considered. This highlights the need for ice-free near-field emission measurements for detailed analyses of aerosol emissions. Although the nvPM EI values in the case presented in Fig. 2a are subject to the described sampling uncertainties, they nonetheless are a valuable indicator of soot particle activation, which is assumed to be the dominant ice particle activation mechanism in the soot-rich regime (Kleine et al., 2018; Kärcher, 2018).
3.3 Impact of fuel composition and engine type on the apparent ice number emission index AEI
These data can now be compared with results from the preceding ECLIF1 and ECLIF2/NDMAX campaigns where particle emissions and apparent contrail ice particle emissions were investigated in a similar manner to ECLIF3. It needs to be kept in mind that we are not able to independently and systematically vary single parameters and investigate their isolated influence on ice particle concentrations. This is amplified when comparing results from several campaigns where different engines, fuels, and measurement platforms were used. Aerosol inlet systems were not identical, and we estimate a 20 % uncertainty for the intercomparison between campaigns for soot particle measurements. During the ECLIF1 and ECLIF2/NDMAX campaigns, the blends of a Fischer–Tropsch-based synthetic jet fuel with Jet A-1 (SSF1) and two blends of 30 % and 50 % biomass-based HEFA-SPK alternative jet fuel with Jet A-1 (SAF2 and SAF1) (Schripp et al., 2022) were compared to a reference Jet A-1 fuel (Ref2) as described in Voigt et al. (2021). However, a qualitative assessment of the influence of fuel composition and the type of engine used can be achieved by comparing the AEIs from different campaigns against their respective soot emissions (Fig. 3) and fuel constituents (Fig. 4).
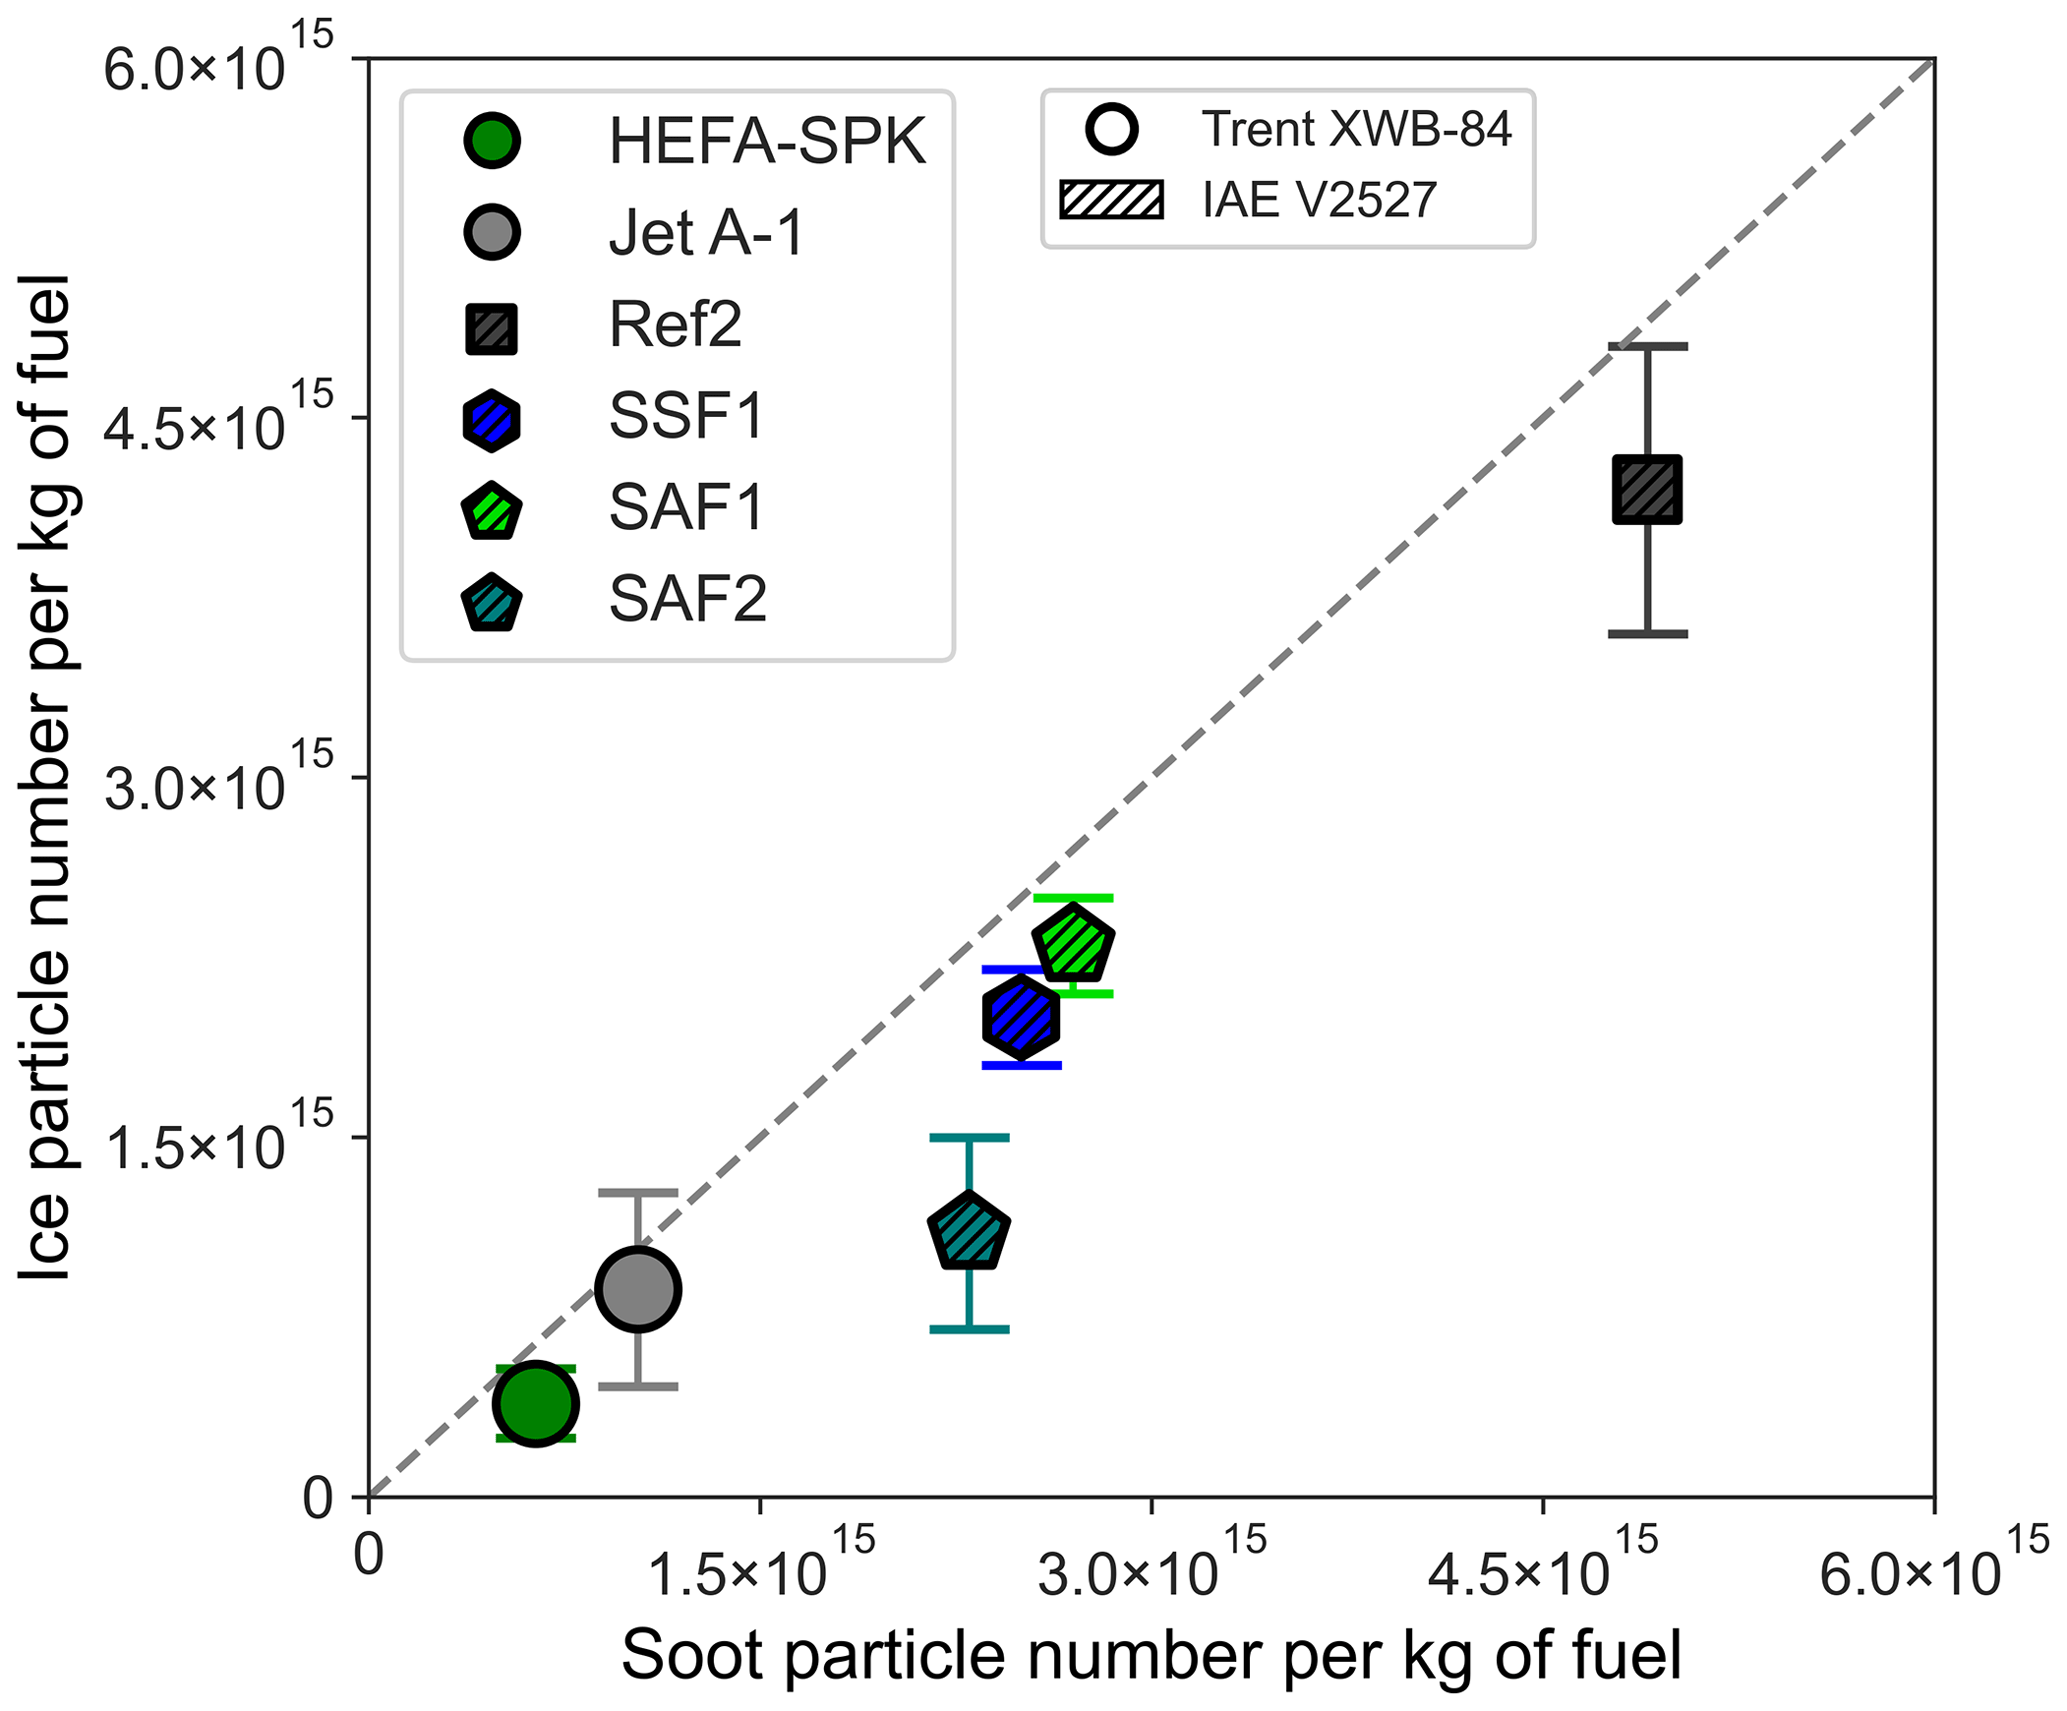
Figure 3Apparent ice emission indices versus nvPM emission indices for Jet A-1 and HEFA-SPK fuel from the ECLIF3 campaign using a Rolls-Royce Trent XWB-84 engine (circles) compared to fuels investigated during ECLIF1 and ECLIF2/NDMAX (Ref2, SSF1, SAF1, SAF2) using an IAE V2527 engine (hatched symbols) (Voigt et al., 2021). The symbols represent means of the respective quantities in order to facilitate comparability between ECLIF1, ECLIF2/NDMAX, and ECLIF3 data. The dashed line shows the ideal 1:1 relationship between the AEI and nvPM EI.
In Fig. 3, mean apparent ice emission indices versus mean nvPM EIs of these fuels are shown together with the mean AEI and nvPM EI of ECLIF3 as described in Table 4. We find a nearly linear relationship between ice particle numbers and nvPM particle numbers for the different fuels and different engines. Measurements during ECLIF1 and ECLIF2/NDMAX were conducted behind the DLR A320 Advanced Technology Research Aircraft (ATRA) equipped with IAE V2527-A5 engines with higher soot emissions compared to the Rolls-Royce Trent XWB-84. Many relevant measurement conditions were similar for the ECLIF1 and ECLIF2/NDMAX data, and the data were also filtered to only include data points with a relative humidity over ice of >100 %. The fuel–engine combinations investigated during ECLIF3 have a lower nvPM EI and therefore a lower AEI compared to the fuel–engine combination probed during ECLIF1 and ECLIF2. In particular, the newer Rolls-Royce Trent XWB-84 engine exhibits lower soot particle emissions compared to the old IAE V2527 engine probed during ECLIF1 and ECLIF2. Also, the aircraft were different, with the smaller and lighter A320 ATRA chased previously and the A350-MSN1 probed during ECLIF3. It is especially interesting that soot and apparent ice particle emissions of the ECLIF3 Jet A-1 lie below the SAF blends from previous campaigns. In order to disentangle fuel and engine effects on the emissions, relevant fuel properties are compared in Fig. 4.
Table 4The AEI and EInvPM for Jet A-1 and HEFA-SPK (based on 60 % correlation filtered data) for the ECLIF3 flight on 16 April 2021.
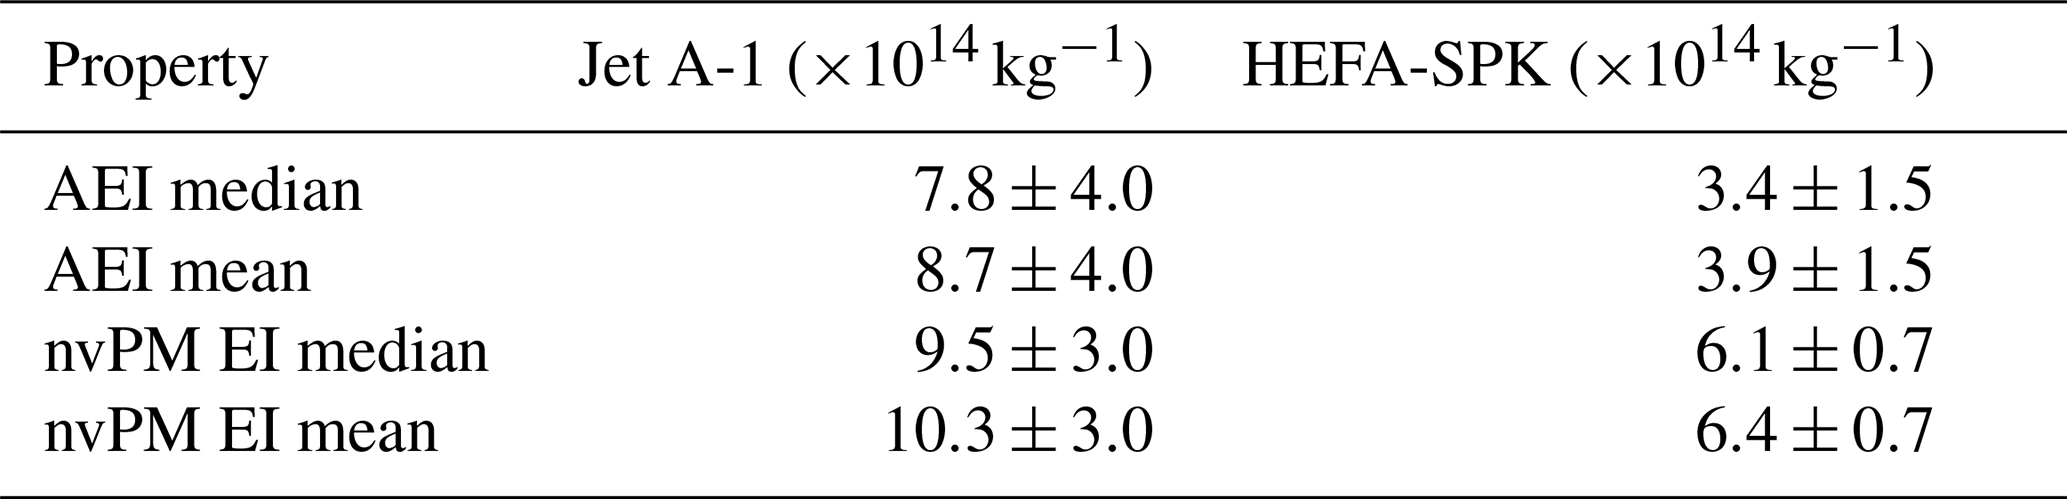
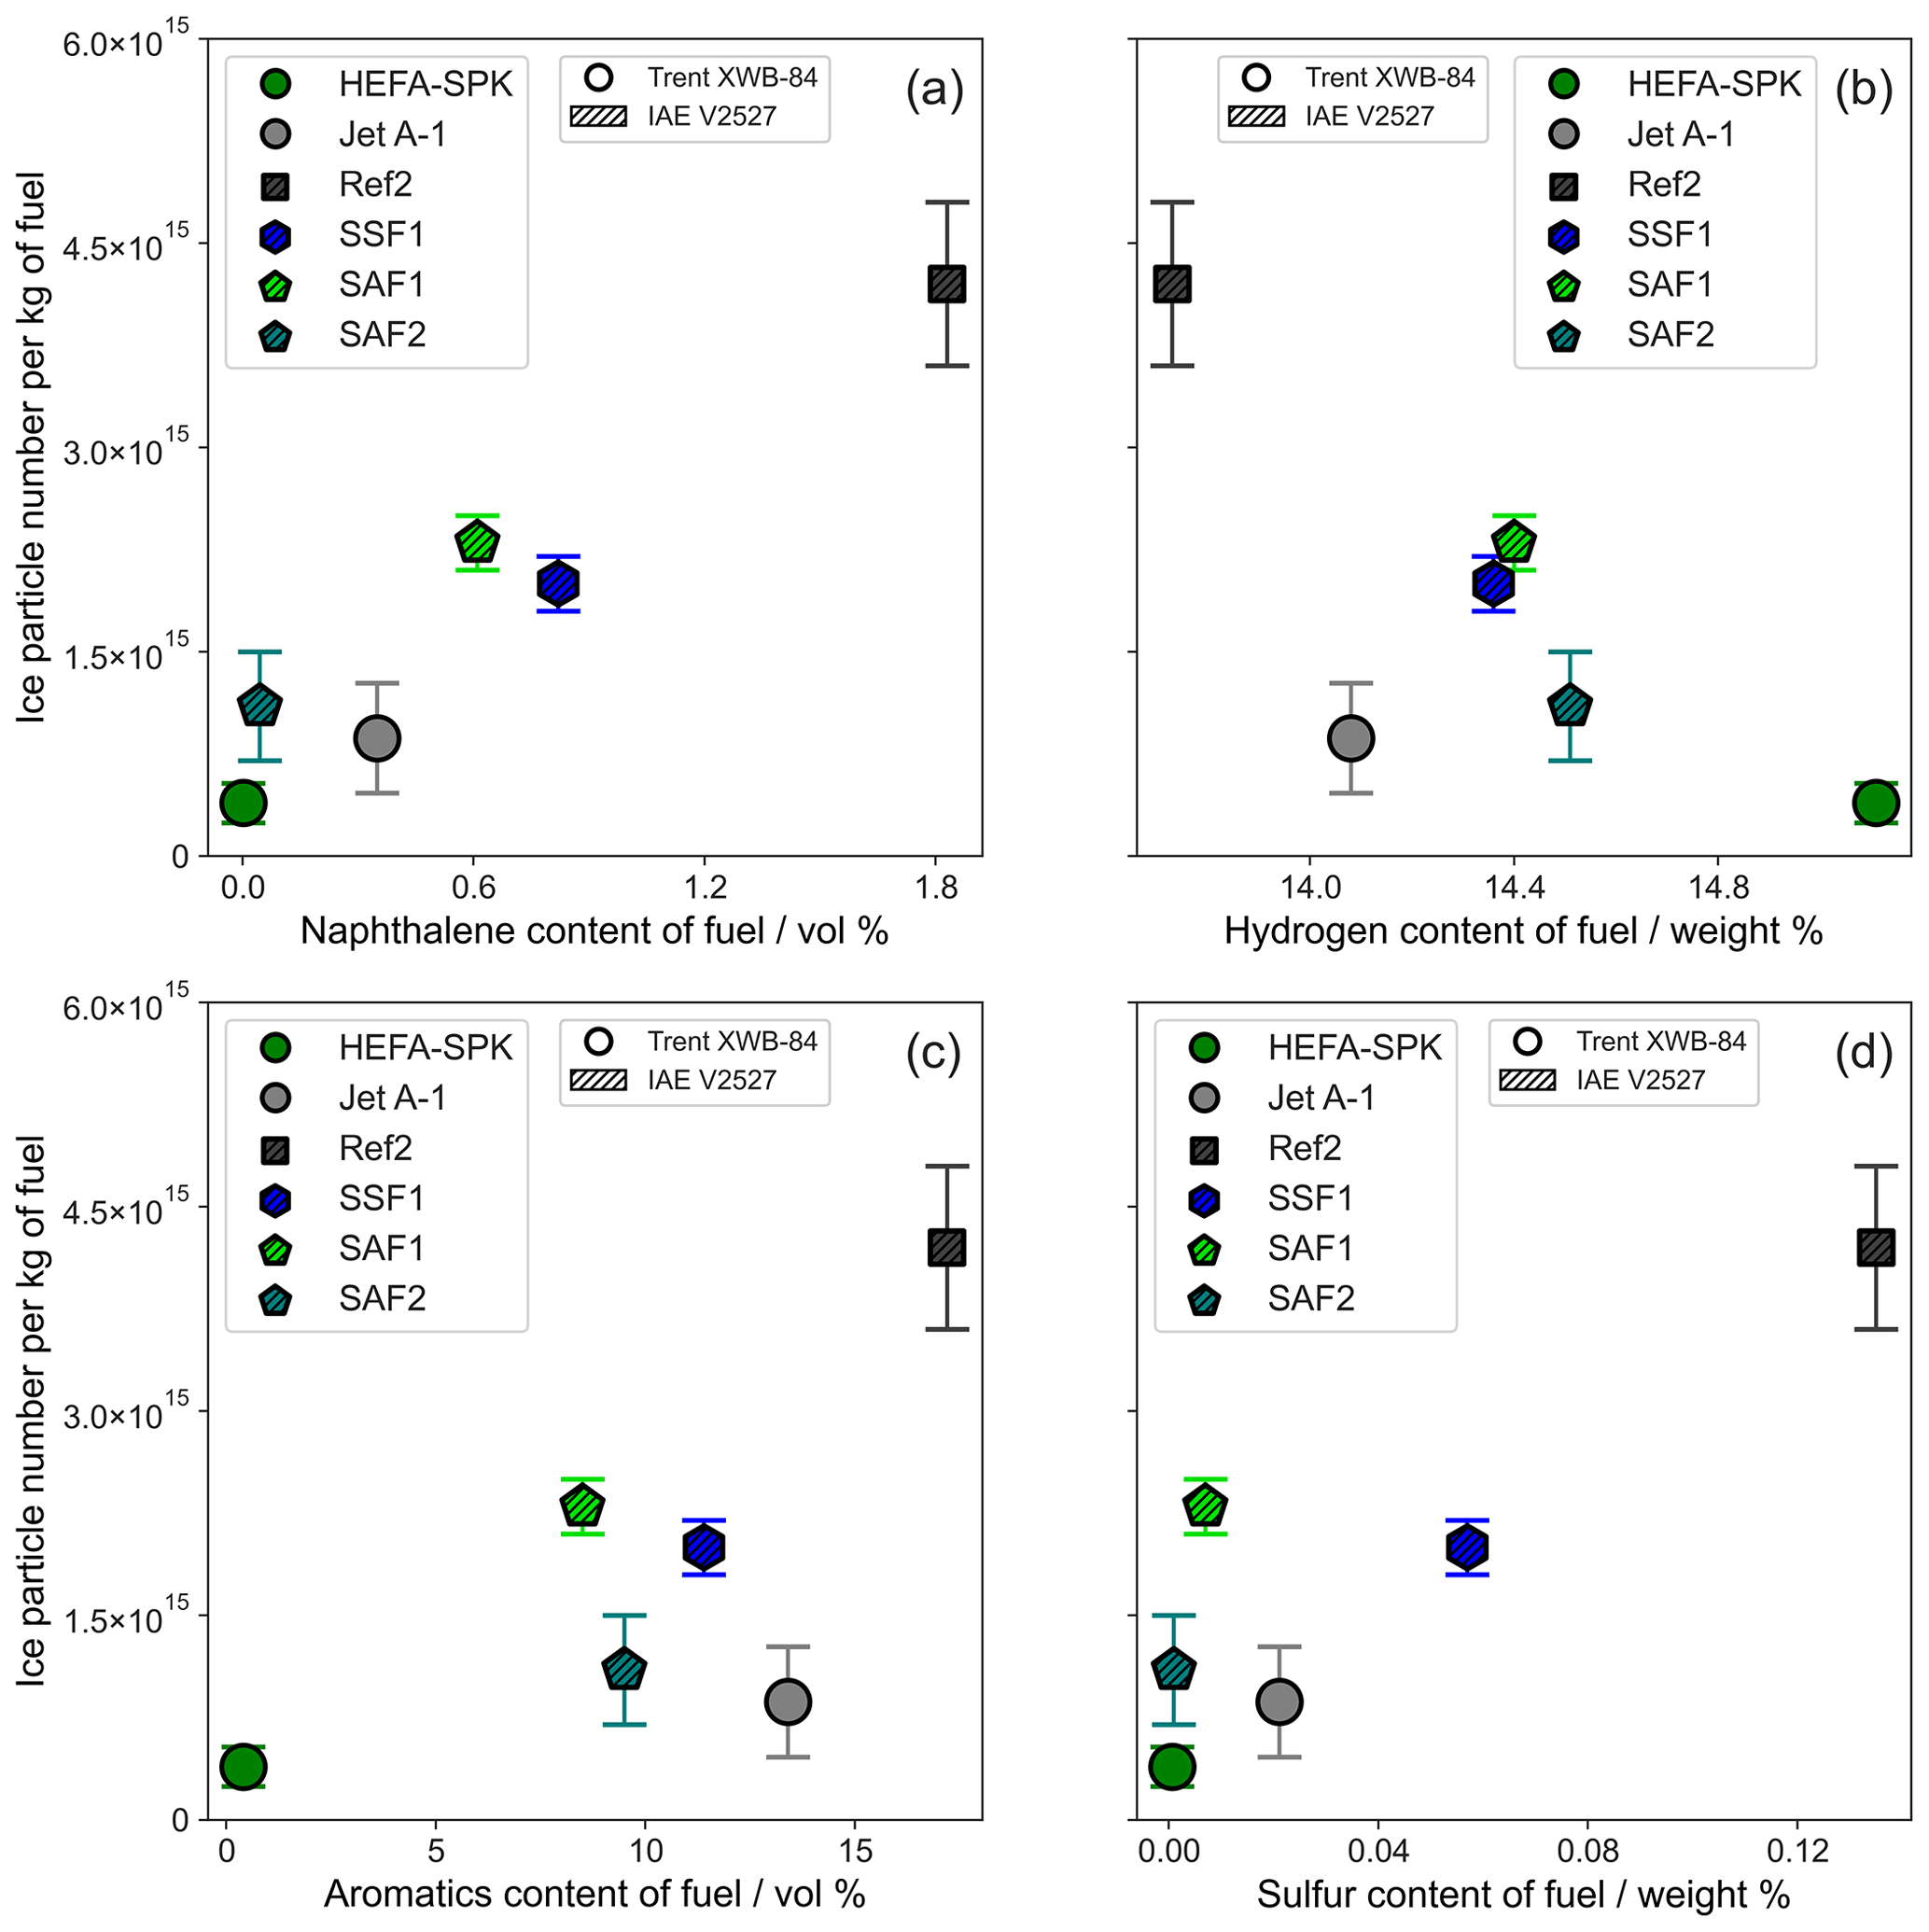
Figure 4The AEI of the ECLIF1, ECLIF2/NDMAX, and ECLIF3 campaigns versus fuel parameters (a) naphthalene content, (b) hydrogen content, (c) aromatic content, and (d) sulfur content. ECLIF3 fuels (HEFA-SPK, Jet A-1) were burned in a Rolls-Royce Trent XWB-84 engine (circles), while ECLIF1 and ECLIF2/NDMAX fuels (Ref2, SSF1, SAF1, SAF2) were burned in an IAE V2527 engine (hatched symbols) (Voigt et al., 2021). Note: the aromatic (naphthalene) content of HEFA-SPK is based on GCxGC measurements (% w w−1) and not ASTM D6379 (D1840) due to being below the detection limit of these methods. y-axis error bars are standard deviations of the means of the measurements shown as symbols.
AEI values from the three ECLIF campaigns from both aircraft and engines are shown in Fig. 4 plotted against the fuel parameters (a) naphthalene, (b) hydrogen content, (c) aromatic content, and (d) sulfur content. The stronger bonding of the monocyclic and polycyclic aromatic compounds explains their propensity to form soot precursors. An increase in hydrogen content thus correlates with decreasing naphthalene or aromatic contents and can be seen as a unified measure attributed to the sooting propensity of the fuels. Therefore, we show the AEI versus the fuel's hydrogen content, which is also used in models to calculate the engine's nvPM particle emissions for specific thrust settings (Teoh et al., 2022b). Of all the fuels, the 100 % HEFA-SPK has the lowest naphthalene, aromatics, and sulfur content and at the same time the highest hydrogen content. Therefore, apparent ice particle emissions from this fuel–engine combination are the lowest in the set of compared fuels. For Jet A-1 from ECLIF3, on the other hand, it is no surprise that its AEI values are lower than those of the Ref2 fuel as Jet A-1 has a much lower naphthalene, aromatics, and sulfur content. However, it becomes more interesting how ECLIF3 Jet A-1 performs compared to the SAF blends SSF1, SAF1, and SAF2. Focusing on the fuel constituents mainly responsible for soot and volatile particle formation, naphthalene, aromatics, and sulfur, ECLIF3 Jet A-1 had a lower naphthalene content but a higher aromatic content compared to SSF1 and SAF1 and lies between those two fuels regarding the sulfur content. However, ECLIF3 Jet A-1 has a lower AEI compared to both fuels, indicating that the Rolls-Royce engine leads to reduced nvPM particle emission indices compared to the older IAE V2527 engine. Finally, ECLIF3 Jet A-1 has a higher naphthalene content, more aromatics, and more sulfur than SAF2, with at the same time a lower AEI. The same relation holds true for the two SAF blends SSF1 and SAF1, where SSF1 has a higher naphthalene, aromatics, and sulfur content but also lower AEI values. This shows that considered fuel constituents alone are not the only parameters that influence soot and ice crystal formation. Soot formation is strongly dependent on the engine cycle, combustion parameters, and combustor design. The Trent XWB-84 engine installed on the Airbus A350 during ECLIF3 is a latest-generation engine on a latest-generation aircraft compared to the IAE V2527-A5 engine installed on the Airbus A320 ATRA. This is also seen in the ICAO engine emissions database, which delivers engine emission indices from different engines probed at four thrust settings for the landing–take off cycle. While to some extent correlations between fuel constituents and apparent contrail ice particle emissions are suggested, other parameters such as the engine cycle, combustion parameters, combustor design, and atmospheric conditions may influence soot emissions as well. A direct cross-campaign comparison can therefore give hints on trends, but differences in ambient conditions and measurement setups impede a direct comparison based solely on the fuel effect, as is done for HEFA-SPK and Jet A-1 in ECLIF3. Here, the reduction of 56 % from the rigidly reduced data set within one flight can be seen as the reduction potential when a flight is conducted with 100 % HEFA-SPK instead of Jet A-1. However, an important fact to consider when interpreting reductions is the reference fuel to which a sustainable aviation fuel or blend is compared. The Jet A-1 used as a reference fuel in ECLIF3 was relatively clean by measures of naphthalene, hydrogen, aromatic, and sulfur content compared to the Ref2 fuel and even compared to the blends by some of the fuel properties. A comparison of ECLIF3 HEFA-SPK to Ref2 from ECLIF1 would lead to higher reduction in soot and ice particles simply due to the higher emissions from the Ref2 fuel.
3.4 Variability in ice particle size distribution
In addition to the fuel–engine-dependent reduction in overall contrail ice particle numbers, we investigate the variability of the ice particle size distributions in contrails and relate this to the vertical distance to the contrail-producing aircraft to account for vortex descent. This study extends beyond the fuel effects on apparent ice emission indices and aims to provide a deeper insight into the ice particle microphysics encountered during ECLIF3 contrail measurements. During the contrail vortex regime, exhaust is entrained in the two counter-rotating vortices, which propagate downward below the flight level. These vortices produce a wake into which some of the exhaust is detrained at altitudes above the primary wake (Gerz et al., 1998). To avoid measuring particles that sublimate in the descending primary wake, we focused our measurements on flight altitudes in the secondary wake at +96 / −48 m vertical distance to the engine of the A350 aircraft. For this purpose, particle size distributions (PSDs) of single encounters of contrails formed on Jet A-1 emissions are viewed depending on the difference of detection altitude and emission altitude (Δz) and are shown in Fig. 5. For the analysis of ice particle size distributions, we concentrate on contrail encounters from Jet A-1 emissions, as a larger Δz is covered and no significant differences in size distribution can be attributed to the different fuels. Due to a better size resolution, we focus on CAS PSDs under ice-supersaturated conditions.
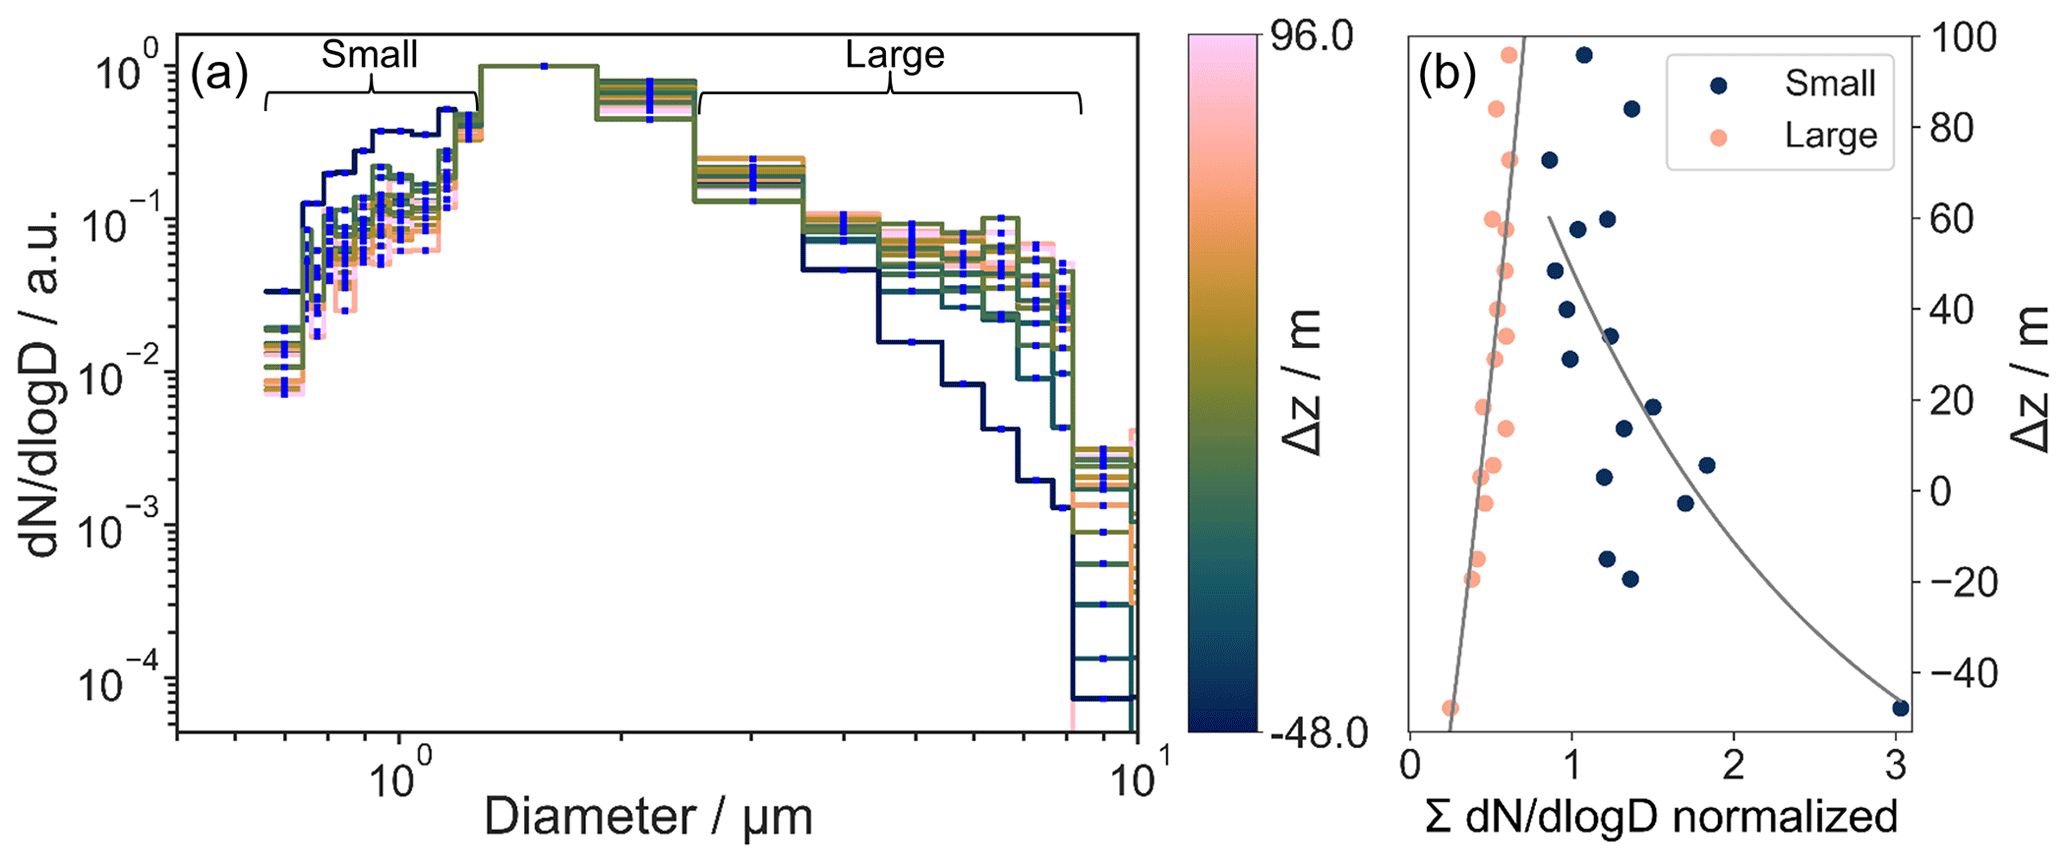
Figure 5Ice particle size distributions (PSDs) of contrail crossings from Jet A-1 emissions measured by the CAS-DPOL instrument. The color bar shows the difference between the detection altitude and the emission altitude (Δz) in meters with positive values (negative values) defined as detected above (below) the emission altitude. Panel (a) shows the PSDs in number concentrations per logarithmic bin width normalized to the bin with the highest concentration. Bins are classified as “small” sizes and “large” sizes and are marked as such. Panel (b) shows the summed bins of small and large particle sizes of the normalized PSDs versus Δz. Gray lines are fits of the exponential function , with a, b, and c being the variable parameters in order to illustrate the trends.
For this study, a mean PSD is calculated for every contrail encounter, and the corresponding mean Δz is indicated as a color in Fig. 5a. The PSDs are normalized to the respective size bin with the highest number concentration in order to be able to compare size ratios independent of absolute number concentrations. As ice particle sizes in contrails a few minutes old are typically below 10 µm and the contribution of larger ice particles was negligible, the PSDs are shown for sizes up to 10 µm. On the y axis is the number concentration normalized to the logarithmic width of the respective size bin, which allows comparison of concentrations over various bin widths. While the majority of the ice particle sizes lie in the range of 1.3 to 2.5 µm, ice particles with sizes below 1.3 µm down to 0.66 µm are henceforth classified as “small”, and ice particles with sizes above 2.5 µm up to 8.2 µm are classified as “large”. The highest concentration of small ice particles is measured in contrails encountered at large negative distances and hence below the emission altitude, and this concentration gradually decreases with increasing Δz. To illustrate this more clearly, the bins of the respective small and large ice particle size areas are summed up for every contrail encounter. These normalized distributions are plotted against the respective Δz in Fig. 5b and facilitate in relating small ice particle size concentrations to large ice particle size concentrations. Relative to the bin with the highest concentration, there are many small and few large particles for low altitudes below the emission altitude. The share of small ice particles decreases with growing Δz, while the share of large ice particles grows.
From this analysis it becomes clear that, in this case, more small ice particles are found below the emission altitude, while the occurrence of large ice particles grows with increasing Δz within the secondary wake. Ice particles detected at different Δz have experienced different temperatures and humidity values along their trajectories from formation of ice in the jet phase and subsequent vortex processing, leading to the variations in ice particle size distributions. This variability in PSD shapes leads to various degrees of deviations from lognormal distributions, with the PSD at the lowest Δz having the largest deviation. While there is no discernible trend of the AEI depending on Δz for RHi>100 %, there appears to be a linear reduction in the total ice particle concentration with growing Δz when the summed of all the bins is regarded as shown in Fig. C1. The measurements thereby confirm simulations by Paugam et al. (2010) that are discussed by Paoli and Shariff (2016), which predict the locations of the largest ice crystals at the top of the secondary wake. There, fewer particles compete for the available water vapor, thereby allowing the growth of larger particles, while water vapor is distributed among more particles at the higher ice crystal number concentrations found at lower Δz, resulting in smaller ice crystals. Unterstrasser (2014) finds from LES that number concentration distributions in the vertical contrail profiles of 5 min old contrails are non-symmetrical, with concentrations decreasing more rapidly for altitudes above the emission level compared to altitudes below the emission level. Similar results were found in the observations (Jeßberger et al., 2013; Schumann et al., 2013). Consistent with these findings, we observe that total number concentrations are systematically lower for Δz≥40 m. We find contrail ice crystals up to 96 m above the flight altitude of the source aircraft, which can be explained by uplift of ice crystals in the secondary wake and the primary vortex caused by vertical oscillation of the plume interacting with the stratified ambient atmosphere (Brunt–Väisälä dynamics). In addition, the adiabatic increase in temperature during the vortex-related descent contributes to the decrease in ice particle size with increasing distance below the emission altitude.
The ice particle size distributions also show for most encounters in the secondary wake that very small ice particles with sizes below 1 µm contribute little to the total size distribution. Similar results are found by Voigt et al. (2021) for the semisynthetic jet fuel with lower AEI values, while higher AEI values for Jet A-1 lead to smaller ice particle sizes due to more initial ice particles competing for the same amount of water (ambient and from the engine) and thus stay smaller. As AEI values for both fuels in ECLIF3 are even lower than AEI values of the semisynthetic jet fuel investigated in Voigt et al. (2021), the similar PSDs for Jet A-1, HEFA-SPK, and the semisynthetic jet fuel are consistent with the conclusion of larger particles correlating with lower AEI values. Schumann et al. (2013) investigate the EI profiles of trace gases, aerosols, and ice crystals in the normalized wake vortex coordinates behind small, medium, and large aircraft. They found far higher ice particle concentrations in the upper contrail parts than in the descending primary vortex, while passive tracers showed opposite trends. Their ice particle contrail profiles are similar to the present results for large ice particles shown in Fig. 5b.
3.5 Comparison of observed and CoCiP-modeled apparent ice number emission indices
The CoCiP model was used to calculate the concentrations of contrail ice particles and emission trace gases in the contrail plume with vertical and lateral Gaussian concentration profiles expanding with time. The initial dilution in this model can be adjusted to values representative of the primary vortex or the secondary wake based on the initial contrail plume depth and width as described in Schumann (2012) and based on the approximate interpolation law described in Schumann et al. (1998). Here we use an initial dilution value representative of the secondary wake measurements, in agreement with the measurements, thereby offering a better representation of the dilution-dependent ice particle loss. The Gaussian profile for both ice and tracers implies that the AEIs for ice particles are uniform over the contrail cross section, while in reality it varies with height and lateral separation of the measurement position relative to the plume center. This limitation can be overcome only by using a more complex plume mixing model. Figure 6 shows AEI values observed during ECLIF3 measurements and their corresponding values as predicted by the CoCiP model for the two fuel types considered. The plotted observations are reduced to a data set as described in Sect. 3.1 and therefore only contain contrail encounters under supersaturated ambient conditions and under stable engine conditions. As a consequence of the uniform AEI profile in the contrail cross section, the CoCiP model predicts only a narrow range of AEI values for each fuel, while a far wider range of AEIs is measured. The reduction in ice particle number concentrations with increasing H content of fuels is well represented in the CoCiP model, which starts from the model-computed soot emission indices (8.2–8.7 () for Jet A-1 and 3.8–3.9 () for HEFA-SPK), independent of the measured emissions, and in this respect the model is fully consistent with the observations. Ice particle numbers are only slightly reduced compared to the initialized soot emission indices, indicating very little ice crystal loss in the secondary wake contrail measurements. This is reasonable for the data set under supersaturated ambient conditions, which has been chosen to increase the comparability of ice particle numbers with as little ice particle loss as possible. The assumption that ice particles and passive tracers (NOy, NOx, or CO2) mix with ambient air homogeneously is not perfectly satisfied in reality. Additionally, the passive tracers are inert on the timescales considered here, while ice particle concentration reductions due to ice particle loss are influenced by the level of dilution. Different measurement positions in the contrail coincide with different states of entrainment of ambient air and resulting states of ice crystal processing, thereby resulting in a wider distribution of AEI values. The modeled and observed median AEIs for Jet A-1 and HEFA-SPK fuels match almost perfectly; see the 1:1 relationship in Fig. 6. This illustrates that the CoCiP model is able to accurately predict average apparent ice emission indices of contrails for the investigated fuels and given conditions, while small-scale fluctuations are not resolved. The trend of reduced apparent ice emission indices for ultra-low aromatic HEFA-SPK fuel compared to the conventional Jet A-1 is captured by the CoCiP model, which reflects the experimental findings well. The results are also in line with simulations by Teoh et al. (2022b), who calculated the effect of enhanced hydrogen content fuels on soot particle emissions, ice crystals in contrails, and the related radiative forcing.
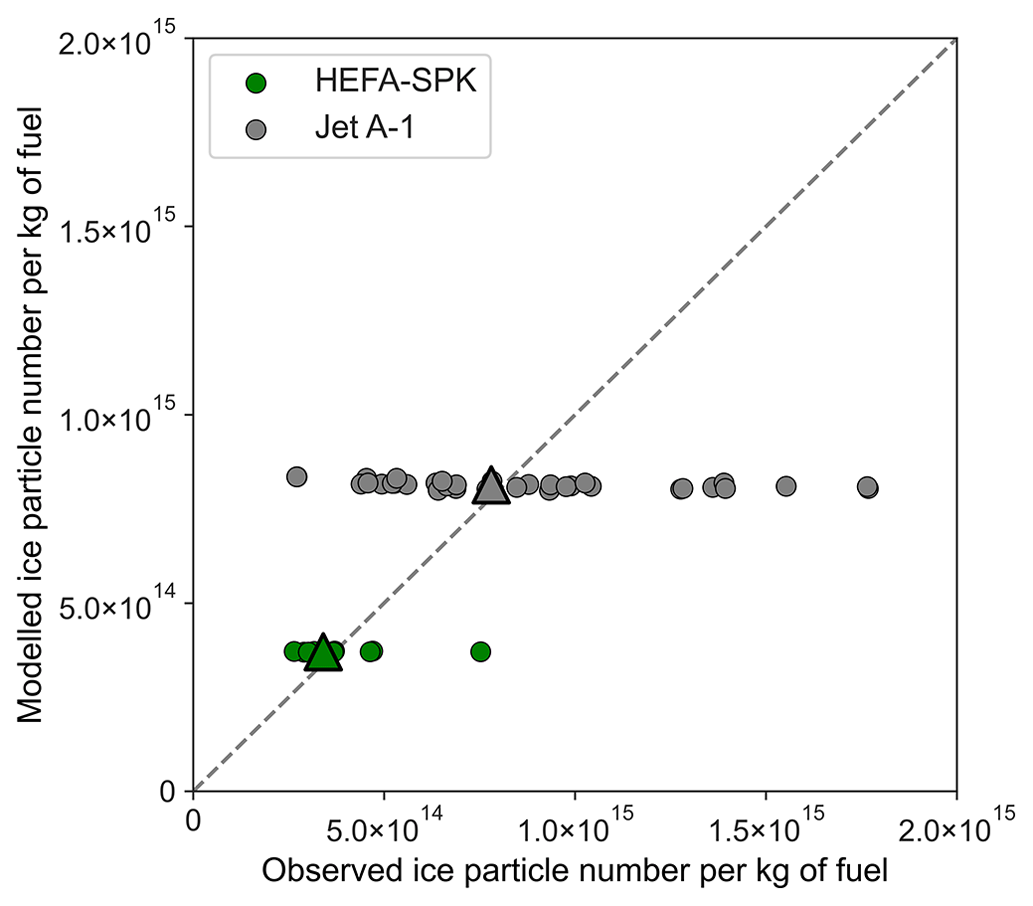
Figure 6Comparison of observed apparent ice emission indices to results from the CoCiP model. Triangles represent median values of the respective fuel, and the dashed line shows the ideal 1:1 relationship between observations and the model.
3.6 Impact of reduced soot particle numbers on the radiative forcing of contrails
Changes in initial ice crystal numbers can have a large impact on the microphysical processes within the contrails, on the contrail lifecycle and optical depth (Unterstrasser and Gierens, 2010; Jeßberger et al., 2013; Schumann et al., 2013; Bier et al., 2017), and consequently on contrail cirrus radiative forcing (Bier et al., 2017; Burkhardt et al., 2018; Bock and Burkhardt, 2019; Teoh et al., 2022b). Here we investigate the effect of lower soot particle number emissions due to the use of 100 % HEFA-SPK combined with a lower fuel sulfur content on the radiative forcing of contrail cirrus. As explained in Sect. 2.2.6, we simulate contrail cirrus using an estimate for the global average Jet A-1 soot number emission index, and in a second experiment we prescribe a lower soot number emission index in line with the measured reduction in the AEI of around 60 %. This assumed soot number reduction is higher than the measured soot number reduction of 35 %. However, as discussed in Sect. 3.3, during the ECLIF3 campaign the reference Jet A-1 fuel was a relatively clean fuel regarding fuel constituents that increase sooting propensity such as aromatics and naphthalene. In order to gain insight into the soot number reduction potential for a realistic global mean as opposed to an extreme case, current fleet average soot number emissions based on Teoh et al. (2024) were chosen as a reference. As the reduced soot particle activation by the low sulfur HEFA-SPK (Wong and Miake-Lye, 2010) as well as volatile particle activation by, e.g., sulfur as described in Sect. 3.2 is not covered in ECHAM5–CCMod, we translated the measured AEI reduction directly into a reduction in emitted soot particle numbers. The simulation parameters are summarized in Table 2.
The resulting number of nucleated ice crystals, simulated by ECHAM5–CCMod, are in line with the measured ice crystal numbers, as the measurements took place in the secondary wake with no significant loss of ice crystals. The estimate for contrail cirrus radiative forcing when using Jet A-1 fuel is 72 mW m−2 for the year 2018. This estimate lies in the lower part, well within the range of the contrail cirrus radiative forcings (33 to 189 mW m−2) given in Lee et al. (2021). Figure 7a shows that the global estimate is dominated by the main air traffic areas, i.e., the United States and Europe. As a consequence, these regions also show the largest absolute reduction in radiative forcing when reducing the number of emitted soot particles as shown in Fig. 7b. Nevertheless, they still remain by far the largest contributors in the 100 % SAF case. The reductions in contrail cirrus radiative forcing are larger in the northern parts of the main air traffic areas of Europe and North America, which is in line with Bier and Burkhardt (2022), who find a smaller impact of soot number reductions on ice crystal number concentrations over Florida than over the areas slightly further to the north and a similar but weaker gradient over Europe. This is also in line with the dependency of contrail ice nucleation on ambient temperatures that leads to lower ice nucleation at warmer temperatures and therefore a weaker dependency on soot number emissions. Significant reductions in contrail cirrus radiative forcing can also be found over Southeast Asia. The global mean radiative forcing estimate for the 100 % SAF run is 53 mW m−2 for the year 2018. Hence, following the ECLIF3 measurements and reducing soot number emissions in line with measurements for a pure SAF fuel on the global scale, a decrease in the contrail cirrus radiative forcing of 26 % may be achieved. Slight fluctuations in the change in radiative forcing shown for a few areas in Fig. 7b are due to differences in the natural variability in the atmospheric fields between the two simulations.
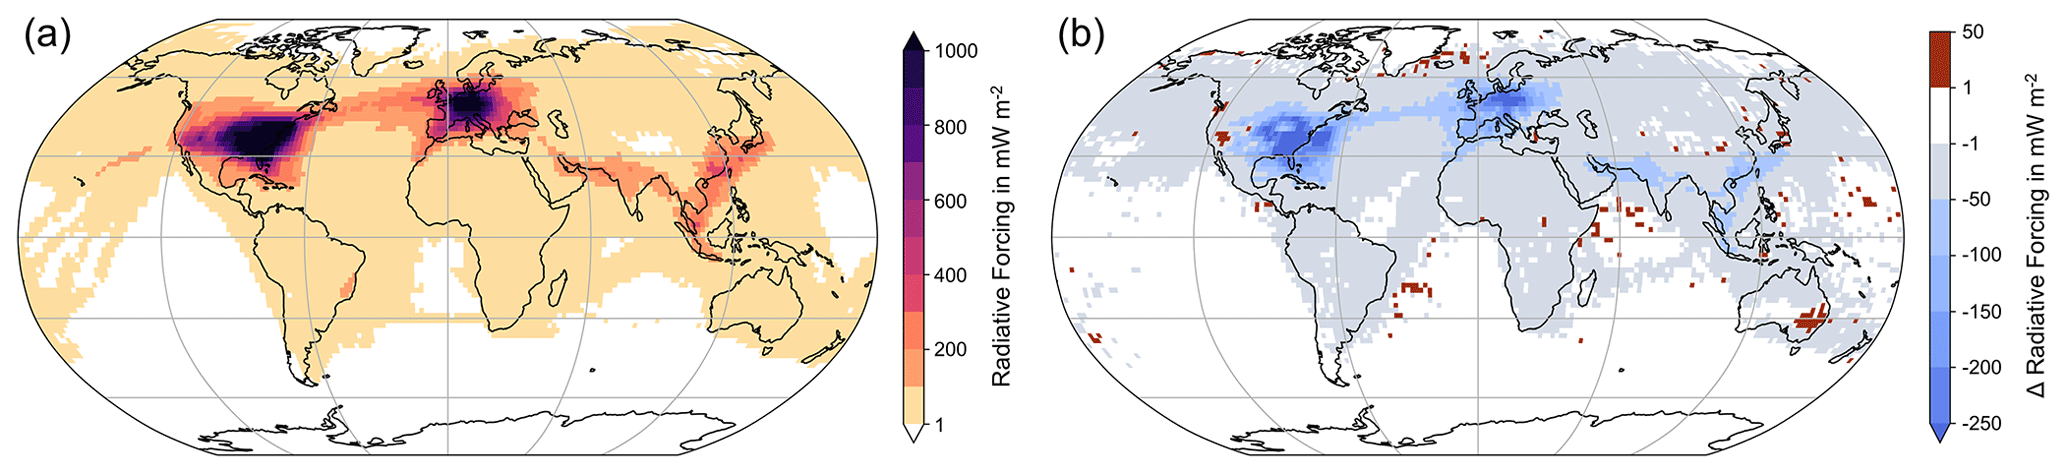
Figure 7Global ECHAM5–CCMod model results of (a) radiative forcing for global mean reference soot emissions for conventional fuel use and (b) changes to radiative forcing resulting from reduced particle emissions for 100 % HEFA-SPK.
The decrease in contrail cirrus radiative forcing of 26 % for a decrease in soot number emissions of 60 % is in line with the estimates of Burkhardt et al. (2018) and Bier and Burkhardt (2022), who find a nonlinear dependency of contrail cirrus radiative forcing when reducing soot number emissions. This dependency originates on the one hand from the nonlinearity in cloud microphysical processes and on the other hand from saturation processes. Besides the number of ice crystals in contrail cirrus clouds, their ice water content and their temporal evolution controlling lifetime and coverage are important parameters when estimating contrail cirrus radiative forcing. In the main air traffic areas, despite significant reductions in contrail ice crystal numbers, the ice water content of contrail cirrus clouds is nearly unchanged when using 100 % SAF relative to using Jet A-1 (not shown). In order to reduce the ice water content of contrail cirrus earlier in the contrail cirrus lifecycle, significantly lower ice nucleation would be needed such that ice crystals on average grow faster, resulting in earlier sedimentation. In contrast, the contrail cirrus coverage of clouds with an optical depth of >0.05 decreases, in particular downwind of the main air traffic areas when reducing contrail ice nucleation (Fig. 8b compared to Fig. 8a). In those areas, in which many aged contrails can be found, contrail optical depth is lower and lifetimes are shorter, so that contrail cirrus coverage is reduced. Hence, the clouds are not advected as far downwind in the 100 % SAF run as in the reference simulation.
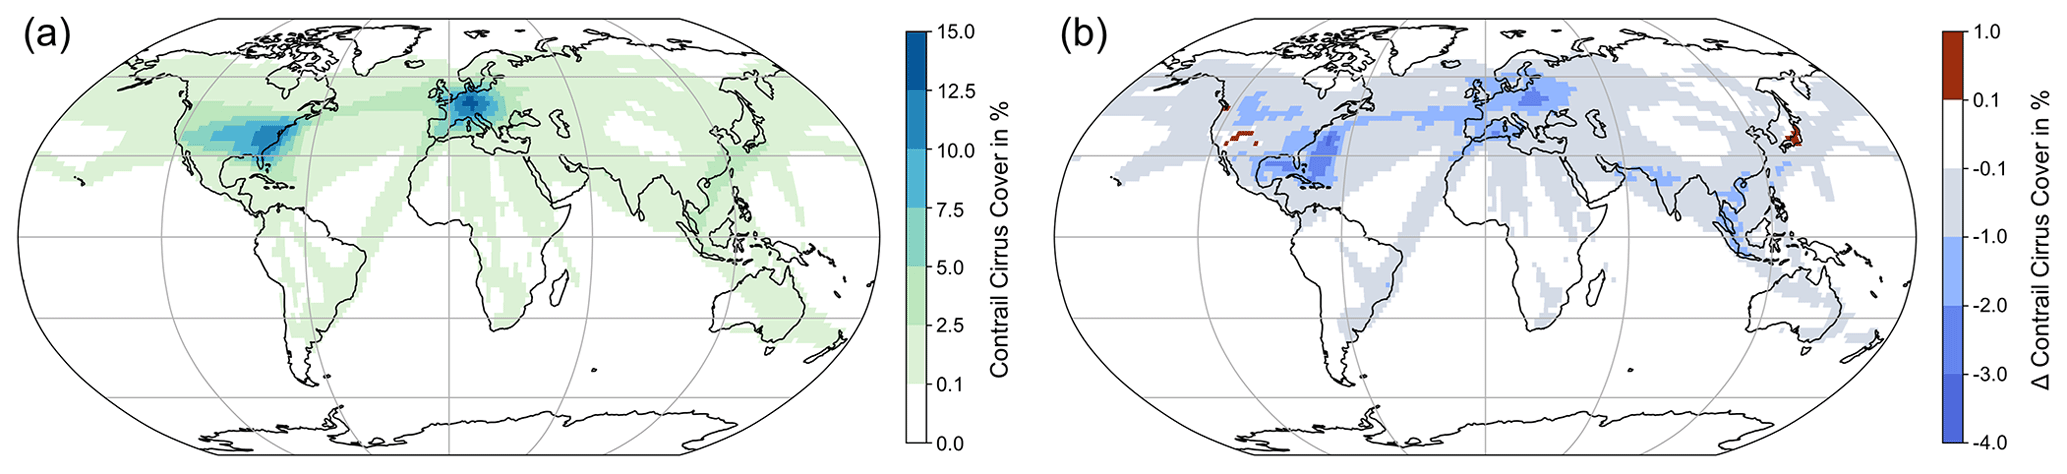
Figure 8Global ECHAM5–CCMod model results of (a) contrail cirrus cover for global mean reference soot emissions for conventional fuel use and (b) changes to contrail cirrus cover resulting from reduced particle emissions with the assumed use of 100 % SAF.
We have simulated RF due to a reduction in the soot number emission index by 60 %, consistent with the measured reduction in the apparent ice number emission index. As explained above, the reduction in ice crystal numbers is dependent not only on the SAF fuel, but also on the reference Jet A-1, which was a relatively clean fuel within the ECLIF3 campaign. Assuming the ECLIF3 HEFA fuel and a slightly “dirtier” Jet A-1 would have led to a slightly larger decrease in contrail cirrus RF. Assuming a reduction in soot number emissions of 66 % would have led to a reduction in contrail cirrus RF by about 30 % (Bier and Burkhardt, 2022). León and Lee (2023) calculate a similar reduction in contrail radiative forcing using radiative transfer simulations for two particle size distribution schemes. For the North Atlantic flight corridor and air traffic in 2019, Teoh et al. (2022b) find a 43 % reduction in contrail radiative forcing and a 51 % soot particle reduction, calculated based on the fuel hydrogen content of 100 % SAF. This lies within the uncertainties in contrail radiative forcing of current model estimates (Lee et al., 2021).
In the course of the ECLIF3 campaign, a measurement flight conducted in April 2021 was identified as having suitable conditions for a side-by-side comparison of contrail properties from 100 % HEFA-SPK sustainable aviation fuel and a conventional reference Jet A-1 fuel. During this flight, ice crystals, together with the trace gases CO2 and NOy as well as aerosols and water vapor, were measured in situ behind a long-range Airbus A350-941 equipped with latest-generation Rolls-Royce Trent XWB-84 engines. Using data from the two forward-scattering laser spectrometers, CAS and CAPS, on board the DLR Falcon research aircraft, apparent ice emission indices for the two probed fuels were derived. Thereby, for similar atmospheric and engine operation conditions of the preceding aircraft within a single flight, a reduction in the ice number concentrations of 56 % for near-zero aromatic and near-zero sulfur HEFA-SPK compared to Jet A-1 were observed, while nonvolatile particle emissions were reduced by 35 %. These reductions were found to depend on the fuel composition. In particular, the lower sulfur content of the HEFA-SPK might explain the stronger reduction in ice crystals compared to the soot reduction. Also, an influence of the engine cycle, combustion parameters, combustor design, and atmospheric conditions becomes apparent when comparing the ECLIF3 AEI to results from previous campaigns where an older IAE V2527 engine with higher soot particle emissions had been probed (Voigt et al., 2021). Fuel compositions of Jet A-1 and SAF are variable in terms of their hydrogen, aromatic, and sulfur contents, which impact particle emissions and should be taken into account for the decision on strategies to reduce the climate impact from aviation by the use of sustainable aviation fuels. Also, cleaner jet fuel with a naturally (or artificially achieved) low aromatic and naphthalene content as well as a low sulfur content could reduce the contrail impact on climate.
Ice crystal particle size distributions were investigated for contrail encounters, and a clear dependence of the particle size distribution on the difference of the detection altitude to the emission altitude Δz was found. On average, larger particles were found up to 96 m above the emission altitude and smaller particles below. In all the cases, the contrail ice crystals had equivalent spherical diameters of 1.3 to 2.5 µm. Here, the experimental data highlight the sensitivity of the ice crystal size distribution to the location within the contrail. The contrail cirrus model CoCiP was applied to compute apparent ice particle emission index values for fuels with a higher hydrogen content and modeled soot emission indices with a one-dimensional Gaussian plume mixing model. The computed AEI values show less variability compared to the measurements but very similar median values. Hence, the model is able to capture the measured soot and ice particle reductions based on the fuel hydrogen content parameterization.
In order to assess the mitigation potential of the climate impact from contrails by the use of 100 % SAF, we performed global model simulations by applying experimentally derived ice particle reductions. The results suggest a reduction of approximately 26 % in contrail radiative forcing for a 60 % reduction in soot number concentrations by the use of 100 % SAF applied to the global fleet average for the year 2018. These reductions are slightly lower than previous model predictions (Burkhardt et al., 2018; Teoh et al., 2022b) but are well within model uncertainties for contrail radiative forcing. Absolute reductions were largest over the main air traffic areas of Europe and the USA, with slightly lower reductions over the southern parts of the main air traffic areas. Contrail cirrus coverage was predominantly reduced downwind of the main air traffic areas, which primarily contain aged contrail cirrus, in line with a reduction in the contrail cirrus lifetimes (Burkhardt et al., 2018).
The in situ measurements of contrails at cruise altitudes in a narrow range of atmospheric, engine, and measurement conditions within a single flight provide insight into the potential benefits of the use of 100 % SAF compared to fossil Jet A-1 fuels under cruise conditions for the current fleet. Variations of external conditions such as temperature or relative humidity are expected to have an influence on the AEI, and future studies are needed to systematically quantify the influence of fuels on nvPM and ice emissions under various conditions. While measured HEFA-SPK provides a benefit regarding the climate impact from contrails, the total climate benefit of different type of SAFs depends on the method of fuel production and the type of SAF used. In addition, the aromatic composition of the kerosene plays a role. With currently limited quantities and higher monetary costs of SAF compared to fossil fuels, one approach could be to preferentially replace the “dirtier” Jet A-1 fuels containing high naphthalene, aromatics, and sulfur content with SAF. Another approach could be to try to achieve a “cleaner” Jet A-1, pending increased availability of SAF. Further, approaches such as intelligent rerouting of flights together with targeted use of SAFs on routes with a high probability of persistent contrails could be pathways to maximize effectiveness as long as SAF is a limited resource (Burkhardt et al., 2018; Teoh et al., 2022b). Finally, a complete lifecycle analysis is necessary for every individual fuel in order to evaluate its CO2 footprint and its non-CO2 effects in order to assess a flight's total climate impact.
Based on wind-tunnel measurements and computational fluid dynamics (CFD) simulations, it has been shown that the Falcon's true air speed (TAS) is a more accurate measure of the sample air speed (SAS) inside the sampling tube of the CAS-DPOL and CAPS-DPOL instruments than the particle air speed (PAS) measured by the respective instruments. The Falcon's TAS is therefore used as the sample air speed leading to a calculation of ice particle number concentrations based on
where n is the sum of particle counts passing through the sample area SA within the respective sampling interval Δt. The use of TAS has been characterized with an uncertainty of 7 %. Coincidence effects, which can lead to undercounting and simultaneous oversizing for higher particle concentrations, have been corrected according to a coincidence correction function, leading to a coincidence-corrected number concentration:
where N and Ncoinc are in particles per cubic centimeter. Although this correction was established for the CAS instrument, it is assumed to be a reasonable approximation for the CAPS as well.
Further, CAS and CAPS counting statistics uncertainty is characterized by Poisson distribution uncertainty for every contrail encounter (Baumgardner et al., 2017). The described uncertainties are propagated using Gaussian error propagation leading to mean number concentration measurement uncertainties of 19.8 % for the CAS and 21.5 % for the CAPS.
The difficulty in drawing any reliable conclusions from time series illustrates the need for the dilution-corrected apparent contrail ice emission index, and not all of the collected data shown in Fig. 1 can be used to calculate valid apparent ice emission indices. Sequences where the Falcon was not fully immersed in the contrail lead to a strong mismatch between ice particle concentrations on the one side and trace gas and nvPM concentrations on the other, an example of which is demonstrated from 11:30:00 to 11:33:00 UTC, where ice particle number concentrations are very low, while trace gas and nvPM concentrations are at similar levels to the previous parts of the Jet A-1 sequence. Together with strongly differing time series curve shapes, a preferential immersion of the Falcon fuselage top, where the aerosol and trace gas inlets are located, compared to only partial immersion of the wing-mounted ice particle instrumentation, is suggested. As a result, the ice particle measurement in this sequence is classified as invalid. Further, for a valid comparison of the AEI, we must ensure that ice particles are in a quasi-stable state and that ice number concentrations do not change significantly on measurement timescales by sublimation. As ice crystals form under ice-supersaturated conditions and are measured about 1 min later under ice-supersaturated conditions in the secondary wake, we hypothesize that no ice crystal loss has occurred, e.g., due to vortex loss processes (Unterstrasser, 2014). By only further analyzing data under ice-supersaturated conditions with RHi>100 %, this focus on quasi-stable ice particle numbers is achieved. Finally, only data are chosen where the engine was determined to have operated under a stable condition at the time of emission, defined as emission sequences where high-pressure compressor outlet temperatures T30 stay within 4 K of stable T30 values. After filtering data according to the criteria described above, a data set remains with quality-controlled valid data points, which can be used to calculate comparable AEI values. This reduces the sampling times from the original 750 to 183 s for Jet A-1 and from 522 to 123 s for HEFA-SPK.
In order to assess the total number concentrations of contrail sequences, the summed bin-resolved are calculated and plotted against the difference to the emission altitude Δz in Fig. C1. The values are calculated to illustrate trends in the shown particle size distributions also given in and do not reflect the absolute number concentrations N. The trend of growing ice particle number concentrations with smaller Δz is indicated by a linear fit function in gray.
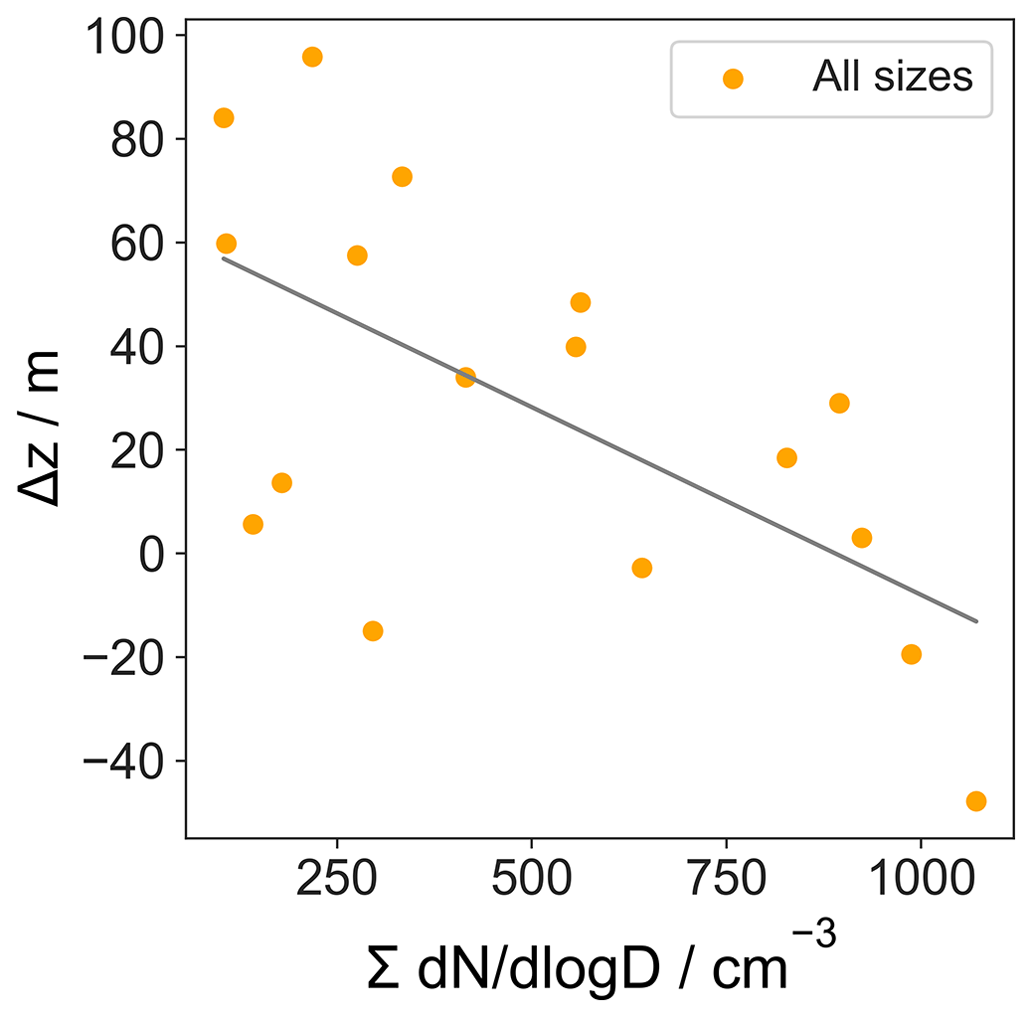
The data were collected at the HALO database at https://halo-db.pa.op.dlr.de/mission/124 (HALO, 2024). Free primary data access begins on 20 April 2026. Until then, download access and access to further data will be given upon request.
CV, SK, CR, and AD planned and coordinated the flight experiment. RSM, DS, RKD, SK, TH, VH, AM, AR, and MS performed the in-flight measurements and analyzed the data. RSM performed the contrail ice data evaluation and wrote the paper. CV conceptualized the study. CWR and UB performed the climate model calculations and authored the respective sections. US performed a contrail model comparison and authored the respective sections. MG assisted in aircraft data analysis. PS, PM, and DL performed NOx model analysis and provided data. RS provided the fuels and fuel analysis. TS and PLC performed the ground measurements and fuel analysis. All the authors contributed to the paper.
Charles Renard and Maxime Gauthier are employed by Airbus Operations. Peter Swann, Paul Madden, and Darren Luff are employed by Rolls-Royce plc. and Reetu Sallinen is employed by Neste Corporation. All the other authors declare that they have no conflict of interest.
Publisher's note: Copernicus Publications remains neutral with regard to jurisdictional claims made in the text, published maps, institutional affiliations, or any other geographical representation in this paper. While Copernicus Publications makes every effort to include appropriate place names, the final responsibility lies with the authors.
The scientific color map batlow (Crameri, 2021) was used in this study (Fig. 5) to prevent visual distortion of the data and exclusion of readers with color vision deficiencies (Crameri et al., 2020).
This research has been supported by the Deutsche Forschungsgemeinschaft (grant nos. SPP 1294 HALO – VO 1504/7-1 – and SPP 1294 HALO – VO 1504/9-1, no.: 510826369).
The article processing charges for this open-access publication were covered by the German Aerospace Center (DLR).
This paper was edited by Dantong Liu and reviewed by two anonymous referees.
Afchine, A., Rolf, C., Costa, A., Spelten, N., Riese, M., Buchholz, B., Ebert, V., Heller, R., Kaufmann, S., Minikin, A., Voigt, C., Zöger, M., Smith, J., Lawson, P., Lykov, A., Khaykin, S., and Krämer, M.: Ice particle sampling from aircraft – influence of the probing position on the ice water content, Atmos. Meas. Tech., 11, 4015–4031, https://doi.org/10.5194/amt-11-4015-2018, 2018. a
Baumgardner, D., Jonsson, H., Dawson, W., O'Connor, D., and Newton, R.: The cloud, aerosol and precipitation spectrometer: a new instrument for cloud investigations, Atmos. Res., 59–60, 251–264, https://doi.org/10.1016/S0169-8095(01)00119-3, 2001. a
Baumgardner, D., Abel, S. J., Axisa, D., Cotton, R., Crosier, J., Field, P., Gurganus, C., Heymsfield, A., Korolev, A., Krämer, M., Lawson, P., McFarquhar, G., Ulanowski, Z., and Um, J.: Cloud Ice Properties: In Situ Measurement Challenges, Meteorol. Mon., 58, 91–923, https://doi.org/10.1175/amsmonographs-d-16-0011.1, 2017. a
Beyersdorf, A. J., Timko, M. T., Ziemba, L. D., Bulzan, D., Corporan, E., Herndon, S. C., Howard, R., Miake-Lye, R., Thornhill, K. L., Winstead, E., Wey, C., Yu, Z., and Anderson, B. E.: Reductions in aircraft particulate emissions due to the use of Fischer–Tropsch fuels, Atmos. Chem. Phys., 14, 11–23, https://doi.org/10.5194/acp-14-11-2014, 2014. a
Bier, A. and Burkhardt, U.: Impact of Parametrizing Microphysical Processes in the Jet and Vortex Phase on Contrail Cirrus Properties and Radiative Forcing, J. Geophys. Res.-Atmos., 127, e2022JD036677, https://doi.org/10.1029/2022JD036677, 2022. a, b, c, d, e, f, g
Bier, A., Burkhardt, U., and Bock, L.: Synoptic Control of Contrail Cirrus Life Cycles and Their Modification Due to Reduced Soot Number Emissions, J. Geophys. Res.-Atmos., 122, 11584–11603, https://doi.org/10.1002/2017JD027011, 2017. a, b, c
Bier, A., Unterstrasser, S., and Vancassel, X.: Box model trajectory studies of contrail formation using a particle-based cloud microphysics scheme, Atmos. Chem. Phys., 22, 823–845, https://doi.org/10.5194/acp-22-823-2022, 2022. a
Blakey, S., Rye, L., and Wilson, C. W.: Aviation gas turbine alternative fuels: A review, Proc. Combust. Inst., 33, 2863–2885, https://doi.org/10.1016/j.proci.2010.09.011, 2011. a
Bock, L. and Burkhardt, U.: Reassessing properties and radiative forcing of contrail cirrus using a climate model, J. Geophys. Res.-Atmos., 121, 9717–9736, https://doi.org/10.1002/2016JD025112, 2016a. a
Bock, L. and Burkhardt, U.: The temporal evolution of a long-lived contrail cirrus cluster: Simulations with a global climate model, J. Geophys. Res.-Atmos., 121, 3548–3565, https://doi.org/10.1002/2015JD024475, 2016b. a, b, c
Bock, L. and Burkhardt, U.: Contrail cirrus radiative forcing for future air traffic, Atmos. Chem. Phys., 19, 8163–8174, https://doi.org/10.5194/acp-19-8163-2019, 2019. a, b, c
Bögel, W. and Baumann, R.: Test and Calibration of the DLR Falcon Wind Measuring System by Maneuvers, J. Atmos. Ocean. Tech., 8, 5–18, https://doi.org/10.1175/1520-0426(1991)008<0005:TACOTD>2.0.CO;2, 1991. a
Borrmann, S., Luo, B., and Mishchenko, M.: Application of the T-matrix method to the measurement of aspherical (ellipsoidal) particles with forward scattering optical particle counters, J. Aerosol Sci., 31, 789–799, https://doi.org/10.1016/S0021-8502(99)00563-7, 2000. a
Bräuer, T., Voigt, C., Sauer, D., Kaufmann, S., Hahn, V., Scheibe, M., Schlager, H., Diskin, G. S., Nowak, J. B., DiGangi, J. P., Huber, F., Moore, R. H., and Anderson, B. E.: Airborne Measurements of Contrail Ice Properties – Dependence on Temperature and Humidity, Geophys. Res. Lett., 48, e2020GL092166, https://doi.org/10.1029/2020GL092166, 2021a. a, b
Bräuer, T., Voigt, C., Sauer, D., Kaufmann, S., Hahn, V., Scheibe, M., Schlager, H., Huber, F., Le Clercq, P., Moore, R. H., and Anderson, B. E.: Reduced ice number concentrations in contrails from low-aromatic biofuel blends, Atmos. Chem. Phys., 21, 16817–16826, https://doi.org/10.5194/acp-21-16817-2021, 2021b. a, b, c, d
Brem, B. T., Durdina, L., Siegerist, F., Beyerle, P., Bruderer, K., Rindlisbacher, T., Rocci-Denis, S., Andac, M. G., Zelina, J., Penanhoat, O., and Wang, J.: Effects of Fuel Aromatic Content on Nonvolatile Particulate Emissions of an In-Production Aircraft Gas Turbine, Environ. Sci. Technol., 49, 13149–13157, https://doi.org/10.1021/acs.est.5b04167, 2015. a, b
Buchspies, B. and Kaltschmitt, M.: Sustainability Aspects of Biokerosene, Springer Berlin Heidelberg, 325–373, https://doi.org/10.1007/978-3-662-53065-8_15, 2017. a
Burkhardt, U. and Kärcher, B.: Process-based simulation of contrail cirrus in a global climate model, J. Geophys. Res., 114, D16201, https://doi.org/10.1029/2008JD011491, 2009. a
Burkhardt, U., Kärcher, B., Ponater, M., Gierens, K., and Gettelman, A.: Contrail cirrus supporting areas in model and observations, Geophys. Res. Lett., 35, L16808, https://doi.org/10.1029/2008GL034056, 2008. a
Burkhardt, U., Bock, L., and Bier, A.: Mitigating the contrail cirrus climate impact by reducing aircraft soot number emissions, npj Climate and Atmospheric Science, 1, 37, https://doi.org/10.1038/s41612-018-0046-4, 2018. a, b, c, d, e, f, g, h
Cain, J., DeWitt, M. J., Blunck, D., Corporan, E., Striebich, R., Anneken, D., Klingshirn, C., Roquemore, W. M., and Wal, R. V.: Characterization of Gaseous and Particulate Emissions From a Turboshaft Engine Burning Conventional, Alternative, and Surrogate Fuels, Energ. Fuel., 27, 2290–2302, https://doi.org/10.1021/ef400009c, 2013. a, b
Chauvigné, A., Jourdan, O., Schwarzenboeck, A., Gourbeyre, C., Gayet, J. F., Voigt, C., Schlager, H., Kaufmann, S., Borrmann, S., Molleker, S., Minikin, A., Jurkat, T., and Schumann, U.: Statistical analysis of contrail to cirrus evolution during the Contrail and Cirrus Experiment (CONCERT), Atmos. Chem. Phys., 18, 9803–9822, https://doi.org/10.5194/acp-18-9803-2018, 2018. a
Chen, C.-C. and Gettelman, A.: Simulated 2050 aviation radiative forcing from contrails and aerosols, Atmos. Chem. Phys., 16, 7317–7333, https://doi.org/10.5194/acp-16-7317-2016, 2016. a
Crameri, F.: Scientific colour maps (7.0.1), https://doi.org/10.5281/zenodo.5501399, 2021. a
Crameri, F., Shephard, G. E., and Heron, P. J.: The misuse of colour in science communication, Nat. Commun., 11, 5444, https://doi.org/10.1038/s41467-020-19160-7, 2020. a
De La Torre Castro, E., Jurkat-Witschas, T., Afchine, A., Grewe, V., Hahn, V., Kirschler, S., Krämer, M., Lucke, J., Spelten, N., Wernli, H., Zöger, M., and Voigt, C.: Differences in microphysical properties of cirrus at high and mid-latitudes, Atmos. Chem. Phys., 23, 13167–13189, https://doi.org/10.5194/acp-23-13167-2023, 2023. a
Duda, D. P., Smith, W. L., Bedka, S., Spangenberg, D., Chee, T., and Minnis, P.: Impact of COVID-19-Related Air Traffic Reductions on the Coverage and Radiative Effects of Linear Persistent Contrails Over Conterminous United States and Surrounding Oceanic Routes, J. Geophys. Res.-Atmos., 128, e2022JD037554, https://doi.org/10.1029/2022JD037554, 2023. a
Epstein, A. H.: Aeropropulsion for Commercial Aviation in the Twenty-First Century and Research Directions Needed, AIAA J., 52, 901–911, https://doi.org/10.2514/1.J052713, 2014. a
Feldpausch, P., Fiebig, M., Fritzsche, L., and Petzold, A.: Measurement of ultrafine aerosol size distributions by a combination of diffusion screen separators and condensation particle counters, J. Aerosol Sci., 37, 577–597, https://doi.org/10.1016/j.jaerosci.2005.04.009, 2006. a
Forster, L., Emde, C., Mayer, B., and Unterstrasser, S.: Effects of Three-Dimensional Photon Transport on the Radiative Forcing of Realistic Contrails, J. Atmos. Sci., 69, 2243–2255, https://doi.org/10.1175/JAS-D-11-0206.1, 2012. a
Fushimi, A., Saitoh, K., Fujitani, Y., and Takegawa, N.: Identification of jet lubrication oil as a major component of aircraft exhaust nanoparticles, Atmos. Chem. Phys., 19, 6389–6399, https://doi.org/10.5194/acp-19-6389-2019, 2019. a
Gayet, J.-F., Shcherbakov, V., Voigt, C., Schumann, U., Schäuble, D., Jessberger, P., Petzold, A., Minikin, A., Schlager, H., Dubovik, O., and Lapyonok, T.: The evolution of microphysical and optical properties of an A380 contrail in the vortex phase, Atmos. Chem. Phys., 12, 6629–6643, https://doi.org/10.5194/acp-12-6629-2012, 2012. a, b
Gerz, T., Dürbeck, T., and Konopka, P.: Transport and effective diffusion of aircraft emissions, J. Geophys. Res.-Atmos., 103, 25905–25913, https://doi.org/10.1029/98JD02282, 1998. a
Gettelman, A., Chen, C.-C., and Bardeen, C. G.: The climate impact of COVID-19-induced contrail changes, Atmos. Chem. Phys., 21, 9405–9416, https://doi.org/10.5194/acp-21-9405-2021, 2021. a
Giez, A., Mallaun, C., Zöger, M., Dörnbrack, A., and Schumann, U.: Static Pressure from Aircraft Trailing-Cone Measurements and Numerical Weather-Prediction Analysis, J. Aircraft, 54, 1728–1737, https://doi.org/10.2514/1.C034084, 2017. a
Giez, A., Zöger, M., Dreiling, V., and Mallaun, C.: Static Source Error Calibration of a Nose Boom Mounted Air Data System on an Atmospheric Research Aircraft Using the Trailing Cone Method, Tech. rep., Deutsches Zentrum für Luft- und Raumfahrt, Flugexperimente, Forschungsflugabteilung Oberpfaffenhofen, https://elib.dlr.de/145770/ (last access: 31 July 2023), 2020. a
Giez, A., Mallaun, C., Nenakhov, V., and Zöger, M.: Calibration of a Nose Boom Mounted Airflow Sensor on an Atmospheric Research Aircraft by Inflight Maneuvers, Tech. rep., Deutsches Zentrum für Luft- und Raumfahrt, Flugexperimente, Forschungsflugabteilung Oberpfaffenhofen, https://elib.dlr.de/145969/ (last access: 31 July 2023), 2021. a
Giez, A., Zöger, M., Mallaun, C., Nenakhov, V., Schimpf, M., ChristophGrad, Numberger, A., and Raynor, K.: Determination of the Measurement Errors for the HALO Basic Data System BAHAMAS by Means of Error Propagation, Tech. rep., Deutsches Zentrum für Luft- und Raumfahrt, Flugexperimente, Forschungsflugabteilung Oberpfaffenhofen, https://doi.org/10.57676/5rdc-q708, 2023. a
Grewe, V., Dahlmann, K., Flink, J., Frömming, C., Ghosh, R., Gierens, K., Heller, R., Hendricks, J., Jöckel, P., Kaufmann, S., Kölker, K., Linke, F., Luchkova, T., Lührs, B., Manen, J. V., Matthes, S., Minikin, A., Niklaß, M., Plohr, M., Righi, M., Rosanka, S., Schmitt, A., Schumann, U., Terekhov, I., Unterstrasser, S., Vázquez-Navarro, M., Voigt, C., Wicke, K., Yamashita, H., Zahn, A., and Ziereis, H.: Mitigating the Climate Impact from Aviation: Achievements and Results of the DLR WeCare Project, Aerospace, 4, 34, https://doi.org/10.3390/aerospace4030034, 2017. a
Grewe, V., Rao, A. G., Grönstedt, T., Xisto, C., Linke, F., Melkert, J., Middel, J., Ohlenforst, B., Blakey, S., Christie, S., Matthes, S., and Dahlmann, K.: Evaluating the climate impact of aviation emission scenarios towards the Paris agreement including COVID-19 effects, Nat. Commun., 12, 3841, https://doi.org/10.1038/s41467-021-24091-y, 2021. a
Hadaller, O. J. and Johnson, J. M.: World Fuel Sampling Program, Final Report CRC Report No. 647, Coordinating Research Council, Inc., https://www.researchgate.net/publication/286177531_World_fuel_sampling_program (last access: 8 March 2024), 2006. a
HALO: Mission: ECLIF3, HALO database [data set], https://halo-db.pa.op.dlr.de/mission/124, last access: 8 March 2024. a
Hermann, M. and Wiedensohler, A.: Counting efficiency of condensation particle counters at low-pressures with illustrative data from the upper troposphere, J. Aerosol Sci., 32, 975–991, https://doi.org/10.1016/S0021-8502(01)00037-4, 2001. a
Heymsfield, A., Baumgardner, D., DeMott, P., Forster, P., Gierens, K., and Kärcher, B.: Contrail Microphysics, B. Am. Meteorol. Soc., 91, 465–472, https://doi.org/10.1175/2009BAMS2839.1, 2010. a
Hinds, W. C.: Aerosol Technology: Properties, Behavior, and Measurement of Airborne Particles, 2nd edn., John Wiley and Sons, ISBN: 978-1-118-59197-0, 2012. a
Jensen, E. J., Toon, O. B., Kinne, S., Sachse, G. W., Anderson, B. E., Chan, K. R., Twohy, C. H., Gandrud, B., Heymsfield, A., and Miake-Lye, R. C.: Environmental conditions required for contrail formation and persistence, J. Geophys. Res.-Atmos., 103, 3929–3936, https://doi.org/10.1029/97JD02808, 1998. a
Jeßberger, P., Voigt, C., Schumann, U., Sölch, I., Schlager, H., Kaufmann, S., Petzold, A., Schäuble, D., and Gayet, J.-F.: Aircraft type influence on contrail properties, Atmos. Chem. Phys., 13, 11965–11984, https://doi.org/10.5194/acp-13-11965-2013, 2013. a, b, c, d, e
Jones, S. H. and Miake-Lye, R. C.: Contrail Modeling of ECLIF2/ND-MAX flights: Effects of nvPM Particle Numbers and Fuel Sulfur Content, Meteorol. Z., https://doi.org/10.1127/metz/2023/1180, 2023. a, b
Jurkat, T., Voigt, C., Arnold, F., Schlager, H., Kleffmann, J., Aufmhoff, H., Schäuble, D., Schaefer, M., and Schumann, U.: Measurements of HONO, NO, NOy and SO2 in aircraft exhaust plumes at cruise, Geophys. Res. Lett., 38, L10807, https://doi.org/10.1029/2011GL046884, 2011. a
Kärcher, B.: Formation and radiative forcing of contrail cirrus, Nat. Commun., 9, 1824, https://doi.org/10.1038/s41467-018-04068-0, 2018. a, b
Kärcher, B. and Yu, F.: Role of aircraft soot emissions in contrail formation, Geophys. Res. Lett., 36, L01804, https://doi.org/10.1029/2008GL036649, 2009. a, b
Kärcher, B., Burkhardt, U., Bier, A., Bock, L., and Ford, I. J.: The microphysical pathway to contrail formation, J. Geophys. Res.-Atmos., 120, 7893–7927, https://doi.org/10.1002/2015JD023491, 2015. a
Kärcher, B., Kleine, J., Sauer, D., and Voigt, C.: Contrail Formation: Analysis of Sublimation Mechanisms, Geophys. Res. Lett., 45, 13547–13552, https://doi.org/10.1029/2018GL079391, 2018. a
Kaufmann, S., Voigt, C., Jurkat, T., Thornberry, T., Fahey, D. W., Gao, R.-S., Schlage, R., Schäuble, D., and Zöger, M.: The airborne mass spectrometer AIMS – Part 1: AIMS-H2O for UTLS water vapor measurements, Atmos. Meas. Tech., 9, 939–953, https://doi.org/10.5194/amt-9-939-2016, 2016. a
Kaufmann, S., Voigt, C., Heller, R., Jurkat-Witschas, T., Krämer, M., Rolf, C., Zöger, M., Giez, A., Buchholz, B., Ebert, V., Thornberry, T., and Schumann, U.: Intercomparison of midlatitude tropospheric and lower-stratospheric water vapor measurements and comparison to ECMWF humidity data, Atmos. Chem. Phys., 18, 16729–16745, https://doi.org/10.5194/acp-18-16729-2018, 2018. a
Kleine, J., Voigt, C., Sauer, D., Schlager, H., Scheibe, M., Jurkat-Witschas, T., Kaufmann, S., Kärcher, B., and Anderson, B. E.: In Situ Observations of Ice Particle Losses in a Young Persistent Contrail, Geophys. Res. Lett., 45, 13553–13561, https://doi.org/10.1029/2018gl079390, 2018. a, b
Krämer, M. and Afchine, A.: Sampling characteristics of inlets operated at low U/U0 ratios: new insights from computational fluid dynamics (CFX) modeling, J. Aerosol Sci., 35, 683–694, https://doi.org/10.1016/j.jaerosci.2003.11.011, 2004. a
Krautstrunk, M. and Giez, A.: The Transition From FALCON to HALO Era Airborne Atmospheric Research, Springer Berlin Heidelberg, 609–624, https://doi.org/10.1007/978-3-642-30183-4_37, 2012. a
Lee, D., Fahey, D., Skowron, A., Allen, M., Burkhardt, U., Chen, Q., Doherty, S., Freeman, S., Forster, P., Fuglestvedt, J., Gettelman, A., León, R. D., Lim, L., Lund, M., Millar, R., Owen, B., Penner, J., Pitari, G., Prather, M., Sausen, R., and Wilcox, L.: The contribution of global aviation to anthropogenic climate forcing for 2000 to 2018, Atmos. Environ., 244, 117834, https://doi.org/10.1016/j.atmosenv.2020.117834, 2021. a, b, c, d, e, f
León, R. R. D. and Lee, D. S.: Contrail radiative dependence on ice particle number concentration, Environ. Res.: Climate, 2, 035012, https://doi.org/10.1088/2752-5295/ace6c6, 2023. a
Lewellen, D. C.: Persistent Contrails and Contrail Cirrus. Part II: Full Lifetime Behavior, J. Atmos. Sci., 71, 4420–4438, https://doi.org/10.1175/JAS-D-13-0317.1, 2014. a
Lewellen, D. C., Meza, O., and Huebsch, W. W.: Persistent Contrails and Contrail Cirrus. Part I: Large-Eddy Simulations from Inception to Demise, J. Atmos. Sci., 71, 4399–4419, https://doi.org/10.1175/JAS-D-13-0316.1, 2014. a
Li, Y., Mahnke, C., Rohs, S., Bundke, U., Spelten, N., Dekoutsidis, G., Groß, S., Voigt, C., Schumann, U., Petzold, A., and Krämer, M.: Upper-tropospheric slightly ice-subsaturated regions: frequency of occurrence and statistical evidence for the appearance of contrail cirrus, Atmos. Chem. Phys., 23, 2251–2271, https://doi.org/10.5194/acp-23-2251-2023, 2023. a
Lohmann, U., Spichtinger, P., Jess, S., Peter, T., and Smit, H.: Cirrus cloud formation and ice supersaturated regions in a global climate model, Environ. Res. Lett., 3, 045022, https://doi.org/10.1088/1748-9326/3/4/045022, 2008. a
Meerkötter, R., Schumann, U., Doelling, D. R., Minnis, P., Nakajima, T., and Tsushima, Y.: Radiative forcing by contrails, Ann. Geophys., 17, 1080–1094, https://doi.org/10.1007/s00585-999-1080-7, 1999. a
Meijer, V. R., Kulik, L., Eastham, S. D., Allroggen, F., Speth, R. L., Karaman, S., and Barrett, S. R. H.: Contrail coverage over the United States before and during the COVID-19 pandemic, Environ. Res. Lett., 17, 034039, https://doi.org/10.1088/1748-9326/ac26f0, 2022. a
Minnis, P., Young, D. F., Garber, D. P., Nguyen, L., Smith, W. L., and Palikonda, R.: Transformation of contrails into cirrus during SUCCESS, Geophys. Res. Lett., 25, 1157–1160, https://doi.org/10.1029/97GL03314, 1998. a
Moore, R. H., Shook, M., Beyersdorf, A., Corr, C., Herndon, S., Knighton, W. B., Miake-Lye, R., Thornhill, K. L., Winstead, E. L., Yu, Z., Ziemba, L. D., and Anderson, B. E.: Influence of Jet Fuel Composition on Aircraft Engine Emissions: A Synthesis of Aerosol Emissions Data from the NASA APEX, AAFEX, and ACCESS Missions, Energ. Fuel., 29, 2591–2600, https://doi.org/10.1021/ef502618w, 2015. a
Moore, R. H., Thornhill, K. L., Weinzierl, B., Sauer, D., D'Ascoli, E., Kim, J., Lichtenstern, M., Scheibe, M., Beaton, B., Beyersdorf, A. J., Barrick, J., Bulzan, D., Corr, C. A., Crosbie, E., Jurkat, T., Martin, R., Riddick, D., Shook, M., Slover, G., Voigt, C., White, R., Winstead, E., Yasky, R., Ziemba, L. D., Brown, A., Schlager, H., and Anderson, B. E.: Biofuel blending reduces particle emissions from aircraft engines at cruise conditions, Nature, 543, 411–415, https://doi.org/10.1038/nature21420, 2017. a, b, c
Moser, M., Voigt, C., Jurkat-Witschas, T., Hahn, V., Mioche, G., Jourdan, O., Dupuy, R., Gourbeyre, C., Schwarzenboeck, A., Lucke, J., Boose, Y., Mech, M., Borrmann, S., Ehrlich, A., Herber, A., Lüpkes, C., and Wendisch, M.: Microphysical and thermodynamic phase analyses of Arctic low-level clouds measured above the sea ice and the open ocean in spring and summer, Atmos. Chem. Phys., 23, 7257–7280, https://doi.org/10.5194/acp-23-7257-2023, 2023. a
Newinger, C. and Burkhardt, U.: Sensitivity of contrail cirrus radiative forcing to air traffic scheduling, J. Geophys. Res.-Atmos., 117, D10205, https://doi.org/10.1029/2011JD016736, 2012. a
Noone, K. J. and Hansson, H.-C.: Calibration of the TSI 3760 Condensation Nucleus Counter for Nonstandard Operating Conditions, Aerosol Sci. Tech., 13, 478–485, https://doi.org/10.1080/02786829008959462, 1990. a
Paoli, R. and Shariff, K.: Contrail Modeling and Simulation, Annu. Rev. Fluid Mech., 48, 393–427, https://doi.org/10.1146/annurev-fluid-010814-013619, 2016. a
Paugam, R., Paoli, R., and Cariolle, D.: Influence of vortex dynamics and atmospheric turbulence on the early evolution of a contrail, Atmos. Chem. Phys., 10, 3933–3952, https://doi.org/10.5194/acp-10-3933-2010, 2010. a
Pechstein, J.: European Emissions Trading Scheme, Springer Berlin Heidelberg, 687–702, https://doi.org/10.1007/978-3-662-53065-8_26, 2017. a
Petzold, A., Busen, R., Schröder, F. P., Baumann, R., Kuhn, M., Ström, J., Hagen, D. E., Whitefield, P. D., Baumgardner, D., Arnold, F., Borrmann, S., and Schumann, U.: Near-field measurements on contrail properties from fuels with different sulfur content, J. Geophys. Res.-Atmos., 102, 29867–29880, https://doi.org/10.1029/97JD02209, 1997. a
Plassmann, K.: Direct and Indirect Land Use Change, Springer Berlin Heidelberg, 375–402, https://doi.org/10.1007/978-3-662-53065-8_16, 2017. a
Poll, D. and Schumann, U.: An estimation method for the fuel burn and other performance characteristics of civil transport aircraft during cruise: part 2, determining the aircraft's characteristic parameters, Aeronaut. J., 125, 296–340, https://doi.org/10.1017/aer.2020.124, 2021. a
Quaas, J., Gryspeerdt, E., Vautard, R., and Boucher, O.: Climate impact of aircraft-induced cirrus assessed from satellite observations before and during COVID-19, Environ. Res. Lett., 16, 064051, https://doi.org/10.1088/1748-9326/abf686, 2021. a
Roeckner, E., Bäuml, G., Bonaventura, L., Brokopf, R., Esch, M., Giorgetta, M., Hagemann, S., Kirchner, I., Kornblueh, L., Manzini, E., Rhodin, A., Schlese, U., Schulzweida, U., and Tompkins, A.: The atmospheric general circulation model ECHAM 5. PART I: model description, Tech. Rep. 349, Max Planck Institute for Meteorology, https://hdl.handle.net/11858/00-001M-0000-0012-0144-5 (last access: 3 November 2023),2003. a
Rosenberg, P. D., Dean, A. R., Williams, P. I., Dorsey, J. R., Minikin, A., Pickering, M. A., and Petzold, A.: Particle sizing calibration with refractive index correction for light scattering optical particle counters and impacts upon PCASP and CDP data collected during the Fennec campaign, Atmos. Meas. Tech., 5, 1147–1163, https://doi.org/10.5194/amt-5-1147-2012, 2012. a
Rye, L., Blakey, S., and Wilson, C. W.: Sustainability of supply or the planet: a review of potential drop-in alternative aviation fuels, Energ. Environ. Sci., 3, 17–27, https://doi.org/10.1039/B918197K, 2010. a
Sanz-Morère, I., Eastham, S. D., Speth, R. L., and Barrett, S. R. H.: Reducing Uncertainty in Contrail Radiative Forcing Resulting from Uncertainty in Ice Crystal Properties, Environ. Sci. Tech. Let., 7, 371–375, https://doi.org/10.1021/acs.estlett.0c00150, 2020. a
Schripp, T., Anderson, B. E., Bauder, U., Rauch, B., Corbin, J. C., Smallwood, G. J., Lobo, P., Crosbie, E. C., Shook, M. A., Miake-Lye, R. C., Yu, Z., Freedman, A., Whitefield, P. D., Robinson, C. E., Achterberg, S. L., Köhler, M., Oßwald, P., Grein, T., Sauer, D., Voigt, C., Schlager, H., and LeClercq, P.: Aircraft engine particulate matter emissions from sustainable aviation fuels: Results from ground-based measurements during the NASA/DLR campaign ECLIF2/ND-MAX, Fuel, 325, 124764, https://doi.org/10.1016/j.fuel.2022.124764, 2022. a, b, c, d
Schulte, P., Schlager, H., Ziereis, H., Schumann, U., Baughcum, S. L., and Deidewig, F.: NOx emission indices of subsonic long-range jet aircraft at cruise altitude: In situ measurements and predictions, J. Geophys. Res.-Atmos., 102, 21431–21442, https://doi.org/10.1029/97JD01526, 1997. a, b
Schumann, U.: On Conditions for Contrail Formation from Aircraft Exhausts, Meteorol. Z., 5, 4–23, https://doi.org/10.1127/metz/5/1996/4, 1996. a, b, c
Schumann, U.: A contrail cirrus prediction model, Geosci. Model Dev., 5, 543–580, https://doi.org/10.5194/gmd-5-543-2012, 2012. a, b
Schumann, U. and Graf, K.: Aviation-induced cirrus and radiation changes at diurnal timescales, J. Geophys. Res.-Atmos., 118, 2404–2421, https://doi.org/10.1002/jgrd.50184, 2013. a
Schumann, U., Schlager, H., Arnold, F., Baumann, R., Haschberger, P., and Klemm, O.: Dilution of aircraft exhaust plumes at cruise altitudes, Atmos. Environ., 32, 3097–3103, https://doi.org/10.1016/S1352-2310(97)00455-X, 1998. a
Schumann, U., Arnold, F., Busen, R., Curtius, J., Kärcher, B., Kiendler, A., Petzold, A., Schlager, H., Schröder, F., and Wohlfrom, K.-H.: Influence of fuel sulfur on the composition of aircraft exhaust plumes: The experiments SULFUR 1–7, J. Geophys. Res., 107, AAC 2-1–AAC 2-27, https://doi.org/10.1029/2001jd000813, 2002. a
Schumann, U., Graf, K., and Mannstein, H.: Potential to reduce the climate impact of aviation by flight level changes, in: 3rd AIAA Atmospheric Space Environments Conference, American Institute of Aeronautics and Astronautics, Honolulu, Hawaii, 27–30 June 2011, AIAA 2011-3376, https://doi.org/10.2514/6.2011-3376, 2011. a
Schumann, U., Jeßberger, P., and Voigt, C.: Contrail ice particles in aircraft wakes and their climatic importance, Geophys. Res. Lett., 40, 2867–2872, https://doi.org/10.1002/grl.50539, 2013. a, b, c, d, e, f
Schumann, U., Penner, J. E., Chen, Y., Zhou, C., and Graf, K.: Dehydration effects from contrails in a coupled contrail–climate model, Atmos. Chem. Phys., 15, 11179–11199, https://doi.org/10.5194/acp-15-11179-2015, 2015. a
Schumann, U., Baumann, R., Baumgardner, D., Bedka, S. T., Duda, D. P., Freudenthaler, V., Gayet, J.-F., Heymsfield, A. J., Minnis, P., Quante, M., Raschke, E., Schlager, H., Vázquez-Navarro, M., Voigt, C., and Wang, Z.: Properties of individual contrails: a compilation of observations and some comparisons, Atmos. Chem. Phys., 17, 403–438, https://doi.org/10.5194/acp-17-403-2017, 2017. a, b
Schumann, U., Bugliaro, L., Dörnbrack, A., Baumann, R., and Voigt, C.: Aviation Contrail Cirrus and Radiative Forcing Over Europe During 6 Months of COVID-19, Geophys. Res. Lett., 48, e2021GL092771, https://doi.org/10.1029/2021GL092771, 2021. a, b
Spichtinger, P. and Gierens, K. M.: Modelling of cirrus clouds – Part 1b: Structuring cirrus clouds by dynamics, Atmos. Chem. Phys., 9, 707–719, https://doi.org/10.5194/acp-9-707-2009, 2009. a
Stier, P., Feichter, J., Kinne, S., Kloster, S., Vignati, E., Wilson, J., Ganzeveld, L., Tegen, I., Werner, M., Balkanski, Y., Schulz, M., Boucher, O., Minikin, A., and Petzold, A.: The aerosol-climate model ECHAM5-HAM, Atmos. Chem. Phys., 5, 1125–1156, https://doi.org/10.5194/acp-5-1125-2005, 2005. a
Stuber, N., Forster, P., Rädel, G., and Shine, K.: The importance of the diurnal and annual cycle of air traffic for contrail radiative forcing, Nature, 441, 864–867, https://doi.org/10.1038/nature04877, 2006. a
Teoh, R., Schumann, U., Majumdar, A., and Stettler, M. E. J.: Mitigating the Climate Forcing of Aircraft Contrails by Small-Scale Diversions and Technology Adoption, Environ. Sci. Technol., 54, 2941–2950, https://doi.org/10.1021/acs.est.9b05608, 2020a. a
Teoh, R., Schumann, U., and Stettler, M. E. J.: Beyond Contrail Avoidance: Efficacy of Flight Altitude Changes to Minimise Contrail Climate Forcing, Aerospace, 7, 121, https://doi.org/10.3390/aerospace7090121, 2020b. a
Teoh, R., Schumann, U., Gryspeerdt, E., Shapiro, M., Molloy, J., Koudis, G., Voigt, C., and Stettler, M. E. J.: Aviation contrail climate effects in the North Atlantic from 2016 to 2021, Atmos. Chem. Phys., 22, 10919–10935, https://doi.org/10.5194/acp-22-10919-2022, 2022a. a, b, c
Teoh, R., Schumann, U., Voigt, C., Schripp, T., Shapiro, M., Engberg, Z., Molloy, J., Koudis, G., and Stettler, M. E. J.: Targeted Use of Sustainable Aviation Fuel to Maximize Climate Benefits, Environ. Sci. Technol., 56, 17246–17255, https://doi.org/10.1021/acs.est.2c05781, 2022b. a, b, c, d, e, f, g
Teoh, R., Engberg, Z., Schumann, U., Voigt, C., Shapiro, M., Rohs, S., and Stettler, M.: Global aviation contrail climate effects from 2019 to 2021, EGUsphere [preprint], https://doi.org/10.5194/egusphere-2023-1859, 2023. a, b
Teoh, R., Engberg, Z., Shapiro, M., Dray, L., and Stettler, M. E. J.: The high-resolution Global Aviation emissions Inventory based on ADS-B (GAIA) for 2019–2021, Atmos. Chem. Phys., 24, 725–744, https://doi.org/10.5194/acp-24-725-2024, 2024. a, b
Timko, M. T., Onasch, T. B., Northway, M. J., Jayne, J. T., Canagaratna, M. R., Herndon, S. C., Wood, E. C., Miake-Lye, R. C., and Knighton, W. B.: Gas Turbine Engine Emissions – Part II: Chemical Properties of Particulate Matter, J. Eng. Gas Turb. Power, 132, 061505, https://doi.org/10.1115/1.4000132, 2010. a
Ungeheuer, F., Caudillo, L., Ditas, F., Simon, M., van Pinxteren, D., Kılıç, D., Rose, D., Jacobi, S., Kürten, A., Curtius, J., and Vogel, A. L.: Nucleation of jet engine oil vapours is a large source of aviation-related ultrafine particles, Commun. Earth Environ., 3, 319, https://doi.org/10.1038/s43247-022-00653-w, 2022. a
Unterstrasser, S.: Large-eddy simulation study of contrail microphysics and geometry during the vortex phase and consequences on contrail-to-cirrus transition, J. Geophys. Res.-Atmos., 119, 7537–7555, https://doi.org/10.1002/2013JD021418, 2014. a, b
Unterstrasser, S.: Properties of young contrails – a parametrisation based on large-eddy simulations, Atmos. Chem. Phys., 16, 2059–2082, https://doi.org/10.5194/acp-16-2059-2016, 2016. a
Unterstrasser, S. and Gierens, K.: Numerical simulations of contrail-to-cirrus transition – Part 2: Impact of initial ice crystal number, radiation, stratification, secondary nucleation and layer depth, Atmos. Chem. Phys., 10, 2037–2051, https://doi.org/10.5194/acp-10-2037-2010, 2010. a
Unterstrasser, S. and Görsch, N.: Aircraft-type dependency of contrail evolution, J. Geophys. Res.-Atmos., 119, 14015–14027, https://doi.org/10.1002/2014JD022642, 2014. a
Unterstrasser, S., Gierens, K., Sölch, I., and Lainer, M.: Numerical simulations of homogeneously nucleated natural cirrus and contrail-cirrus. Part 1: How different are they?, Meteorol. Z., 26, 621–642, https://doi.org/10.1127/metz/2016/0777, 2017. a
Vázquez-Navarro, M., Mannstein, H., and Kox, S.: Contrail life cycle and properties from 1 year of MSG/SEVIRI rapid-scan images, Atmos. Chem. Phys., 15, 8739–8749, https://doi.org/10.5194/acp-15-8739-2015, 2015. a
Voigt, C. and Maerkl, R..: Dataset #9817, Version v1, HALO database [data set], https://doi.org/10.17616/R39Q0T, 2024. a
Voigt, C., Schumann, U., Jurkat, T., Schäuble, D., Schlager, H., Petzold, A., Gayet, J.-F., Krämer, M., Schneider, J., Borrmann, S., Schmale, J., Jessberger, P., Hamburger, T., Lichtenstern, M., Scheibe, M., Gourbeyre, C., Meyer, J., Kübbeler, M., Frey, W., Kalesse, H., Butler, T., Lawrence, M. G., Holzäpfel, F., Arnold, F., Wendisch, M., Döpelheuer, A., Gottschaldt, K., Baumann, R., Zöger, M., Sölch, I., Rautenhaus, M., and Dörnbrack, A.: In-situ observations of young contrails – overview and selected results from the CONCERT campaign, Atmos. Chem. Phys., 10, 9039–9056, https://doi.org/10.5194/acp-10-9039-2010, 2010. a, b, c
Voigt, C., Schumann, U., Jessberger, P., Jurkat, T., Petzold, A., Gayet, J.-F., Krämer, M., Thornberry, T., and Fahey, D. W.: Extinction and optical depth of contrails, Geophys. Res. Lett., 38, L11806, https://doi.org/10.1029/2011GL047189, 2011. a, b
Voigt, C., Schumann, U., Minikin, A., Abdelmonem, A., Afchine, A., Borrmann, S., Boettcher, M., Buchholz, B., Bugliaro, L., Costa, A., Curtius, J., Dollner, M., Dörnbrack, A., Dreiling, V., Ebert, V., Ehrlich, A., Fix, A., Forster, L., Frank, F., Fütterer, D., Giez, A., Graf, K., Grooß, J.-U., Groß, S., Heimerl, K., Heinold, B., Hüneke, T., Järvinen, E., Jurkat, T., Kaufmann, S., Kenntner, M., Klingebiel, M., Klimach, T., Kohl, R., Krämer, M., Krisna, T. C., Luebke, A., Mayer, B., Mertes, S., Molleker, S., Petzold, A., Pfeilsticker, K., Port, M., Rapp, M., Reutter, P., Rolf, C., Rose, D., Sauer, D., Schäfler, A., Schlage, R., Schnaiter, M., Schneider, J., Spelten, N., Spichtinger, P., Stock, P., Walser, A., Weigel, R., Weinzierl, B., Wendisch, M., Werner, F., Wernli, H., Wirth, M., Zahn, A., Ziereis, H., and Zöger, M.: ML-CIRRUS: The Airborne Experiment on Natural Cirrus and Contrail Cirrus with the High-Altitude Long-Range Research Aircraft HALO, B. Am. Meteorol. Soc., 98, 271–288, https://doi.org/10.1175/BAMS-D-15-00213.1, 2017. a, b, c
Voigt, C., Kleine, J., Sauer, D., Moore, R. H., Bräuer, T., Clercq, P. L., Kaufmann, S., Scheibe, M., Jurkat-Witschas, T., Aigner, M., Bauder, U., Boose, Y., Borrmann, S., Crosbie, E., Diskin, G. S., DiGangi, J., Hahn, V., Heckl, C., Huber, F., Nowak, J. B., Rapp, M., Rauch, B., Robinson, C., Schripp, T., Shook, M., Winstead, E., Ziemba, L., Schlager, H., and Anderson, B. E.: Cleaner burning aviation fuels can reduce contrail cloudiness, Commun. Earth Environ., 2, 114, https://doi.org/10.1038/s43247-021-00174-y, 2021. a, b, c, d, e, f, g, h, i, j, k, l
Voigt, C., Lelieveld, J., Schlager, H., Schneider, J., Curtius, J., Meerkötter, R., Sauer, D., Bugliaro, L., Bohn, B., Crowley, J. N., Erbertseder, T., Groß, S., Hahn, V., Li, Q., Mertens, M., Pöhlker, M. L., Pozzer, A., Schumann, U., Tomsche, L., Williams, J., Zahn, A., Andreae, M., Borrmann, S., Bräuer, T., Dörich, R., Dörnbrack, A., Edtbauer, A., Ernle, L., Fischer, H., Giez, A., Granzin, M., Grewe, V., Harder, H., Heinritzi, M., Holanda, B. A., Jöckel, P., Kaiser, K., Krüger, O. O., Lucke, J., Marsing, A., Martin, A., Matthes, S., Pöhlker, C., Pöschl, U., Reifenberg, S., Ringsdorf, A., Scheibe, M., Tadic, I., Zauner-Wieczorek, M., Henke, R., and Rapp, M.: Cleaner Skies during the COVID-19 Lockdown, B. Am. Meteorol. Soc., 103, E1796–E1827, https://doi.org/10.1175/BAMS-D-21-0012.1, 2022. a
Voigt, C., Maerkl, R., and Sauer, D.: Dataset #9662, Version v1, HALO database [data set], https://doi.org/10.17616/R39Q0T, 2023a. a
Voigt, C., Maerkl, R., Sauer, D., Harlass, T., Kaufmann, S., Roiger, A., Dischl, R., and Giez, A.: Dataset #9661, Version v1, HALO database [data set], https://doi.org/10.17616/R39Q0T, 2023b. a
Wilbrand, K.: Potential of Fossil Kerosene, Springer Berlin Heidelberg, 43–57, https://doi.org/10.1007/978-3-662-53065-8_4, 2017. a
Wilkerson, J. T., Jacobson, M. Z., Malwitz, A., Balasubramanian, S., Wayson, R., Fleming, G., Naiman, A. D., and Lele, S. K.: Analysis of emission data from global commercial aviation: 2004 and 2006, Atmos. Chem. Phys., 10, 6391–6408, https://doi.org/10.5194/acp-10-6391-2010, 2010. a, b
Wong, H.-W. and Miake-Lye, R. C.: Parametric studies of contrail ice particle formation in jet regime using microphysical parcel modeling, Atmos. Chem. Phys., 10, 3261–3272, https://doi.org/10.5194/acp-10-3261-2010, 2010. a, b, c
Ziereis, H., Hoor, P., Grooß, J.-U., Zahn, A., Stratmann, G., Stock, P., Lichtenstern, M., Krause, J., Bense, V., Afchine, A., Rolf, C., Woiwode, W., Braun, M., Ungermann, J., Marsing, A., Voigt, C., Engel, A., Sinnhuber, B.-M., and Oelhaf, H.: Redistribution of total reactive nitrogen in the lowermost Arctic stratosphere during the cold winter 2015/2016, Atmos. Chem. Phys., 22, 3631–3654, https://doi.org/10.5194/acp-22-3631-2022, 2022. a
- Abstract
- Introduction
- Experiment and instrumentation
- Results
- Conclusions and outlook
- Appendix A: Details of ice particle number concentration determination
- Appendix B: Selection of data sequences for the derivation of apparent ice emission indices
- Appendix C: Number concentration values of Jet A-1 size distributions
- Data availability
- Author contributions
- Competing interests
- Disclaimer
- Acknowledgements
- Financial support
- Review statement
- References