the Creative Commons Attribution 4.0 License.
the Creative Commons Attribution 4.0 License.
 | 25 Mar 2024
High-resolution mapping of nitrogen oxide emissions in large US cities from TROPOMI retrievals of tropospheric nitrogen dioxide columns
Steffen Beirle
Joanna Joiner
Sungyeon Choi
Zhining Tao
K. Emma Knowland
Steven J. Smith
Daniel Q. Tong
Siqi Ma
Zachary T. Fasnacht
Thomas Wagner
Satellite-derived spatiotemporal patterns of nitrogen oxide (NOx) emissions can improve accuracy of emission inventories to better support air quality and climate research and policy studies. In this study, we develop a new method by coupling the chemical transport Model-Independent SATellite-derived Emission estimation Algorithm for Mixed-sources (MISATEAM) with a divergence method to map high-resolution NOx emissions across US cities using TROPOspheric Monitoring Instrument (TROPOMI) tropospheric nitrogen dioxide (NO2) retrievals. The accuracy of the coupled method is validated through application to synthetic NO2 observations from the NASA-Unified Weather Research and Forecasting (NU-WRF) model, with a horizontal spatial resolution of 4 km × 4 km for 33 large and mid-size US cities. Validation reveals excellent agreement between inferred and NU-WRF-provided emission magnitudes (R= 0.99, normalized mean bias, NMB = −0.01) and a consistent spatial pattern when comparing emissions for individual grid cells (). We then develop a TROPOMI-based database reporting annual emissions for 39 US cities at a horizontal spatial resolution of 0.05° × 0.05° from 2018 to 2021. This database demonstrates a strong correlation (R= 0.90) with the National Emission Inventory (NEI) but reveals some bias (NMB = −0.24). There are noticeable differences in the spatial patterns of emissions in some cities. Our analysis suggests that uncertainties in TROPOMI-based emissions and potential misallocation of emissions and/or missing sources in bottom-up emission inventories both contribute to these differences.
- Article
(2208 KB) - Full-text XML
-
Supplement
(1761 KB) - BibTeX
- EndNote


Nitrogen oxides (NOx), including nitrogen dioxide (NO2) and nitric oxide (NO), play a vital role as trace gases in the atmosphere. They substantially contribute to the formation of secondary aerosols and tropospheric ozone (Seinfeld and Pandis, 2006), which in turn impact climate and human health. The primary source of NOx emissions is fossil fuel combustion from mobile and industrial sources, often concentrated in urban areas (Crippa et al., 2018). Traditionally, NOx emissions are compiled using “bottom-up” methods that rely on total fuel usage and average emission factors. However, determining urban emissions is challenging due to the difficulty of obtaining comprehensive data on operating conditions of emitters and their rapidly changing emission factors (Liu et al., 2016b) at the city level (Butler et al., 2008). Spatial distribution of emissions is commonly estimated by applying proxies, such as road network maps and/or population density maps, to allocate total emissions onto a grid. This process may introduce significant biases due to spatial mismatches between emission locations and spatial proxies (Woodard et al., 2014; Hogue et al., 2016).
Tropospheric NO2 vertical column densities (VCDs) retrieved from satellite observations offer valuable insights into the magnitude and location of global NOx emissions (Martin et al., 2003; Lamsal et al., 2011). Techniques leveraging chemical transport models (CTMs) have been developed to relate NO2 VCDs to NOx emissions, for example, the extended (Ding et al., 2017) and ensemble (Miyazaki et al., 2017) Kalman filter, the four-dimensional variational (4D-Var) method (Henze et al., 2009), and the hybrid mass balance/4D-Var (Qu et al., 2019).
Alternative methods, which are independent of CTMs, have also been proposed to characterize NOx plumes from major sources (e.g., Beirle et al., 2011; Liu et al., 2016a; Laughner and Cohen, 2019). Early studies employed one-dimensional (1D) empirical plume dispersion functions to fit NO2 VCDs surrounding isolated sources. Liu et al. (2016a, 2022) refined these functions to accommodate the description of NO2 plumes from sources in polluted background. The derived fitting parameters yield the magnitude of NOx emissions for point sources, such as power plants (de Foy et al., 2014), and cities, by assuming these sources to be equivalent point sources (Lu et al., 2015; Liu et al., 2017; Goldberg et al., 2019). A recent study (Beirle et al., 2019) introduced a two-dimensional (2D) divergence approach, enabling the identification of finer details in NOx distributions and thus facilitating the detection of smaller sources. Subsequent studies have further refined this approach to enhance divergence calculation (de Foy and Schauer, 2022) and to optimize its performance over mountainous regions (Sun, 2022). Current applications of this divergence method primarily focus on inferring emissions from point sources, e.g., power plants in South Asia (de Foy and Schauer, 2022), oil and gas production areas in the United States (Dix et al., 2022), and a global catalog of point sources (Beirle et al., 2021, 2023). However, the robustness of applying the approach for area sources such as cities has seldom been investigated.
The main goal of this study is to map NOx emissions across major cities in the United States based on the TROPOspheric Monitoring Instrument (TROPOMI; Veefkind et al., 2012) retrievals of NO2 VCDs (Ialongo et al., 2020). We will couple the 1D (Liu et al., 2022) and 2D (Beirle et al., 2019) CTM-independent approaches to infer gridded NOx emissions. Due to the absence of established “true emissions” to serve as a standard for comparison, gauging the precision of the coupled method becomes challenging. We will employ synthetic NO2 observations, generated by a model simulation, to appraise the accuracy of the approach. Section 2 offers a summary of the satellite data used to map urban NOx emissions and the synthetic NO2 observations used for validation. In Sect. 3.1, we assess the coupled approach by juxtaposing the emissions inferred from synthetic NO2 observations with the true emissions used by the model for generating the synthetic observations. In Sect. 3.2, we compare the emissions derived from satellite data with the National Emission Inventory (NEI) developed by the United States Environmental Protection Agency (US EPA) to shed light on the uncertainties of both satellite-derived and bottom-up emissions. Section 3.3 summarizes the uncertainties of the method and the TROPOMI-derived emissions. We discuss the robustness of the derived emissions and outline the planned work in Sect. 4.
2.1 TROPOMI NO2 dataset
TROPOMI is a UV–VIS–NIR–SWIR nadir-viewing imaging spectrometer (Veefkind et al., 2012) on board the Sentinel 5 Precursor (S5P) satellite that was launched in 2017. It had a ground pixel size at nadir of 7.5 km × 3.5 km before 6 August 2019 and improved to 5.5 km × 3.5 km afterwards. It provides daily global coverage with a local Equator crossing time of approximately 13:30 local time (LT; the time zone for all instances in the text is LT). The instrument's radiance and irradiance measurements are utilized to obtain slant NO2 columns using the differential optical absorption spectroscopy (DOAS) algorithm (Platt and Stutz, 2008). The slant columns are subsequently differentiated into stratospheric and tropospheric parts, with the tropospheric slant columns being further converted to vertical columns based on air mass factors.
We selected TROPOMI NO2 retrieved by the NASA Goddard Space Flight Center (GSFC) TROPOMI Multi-Decadal Nitrogen Dioxide and Derived Products from Satellites (MINDS) NO2 product (Lamsal et al., 2022), in this study due to its utility in investigating emission trends. The official NO2 product available at the commencement of this study switched the processor version in December 2020, which introduced a discontinuity in the time series (van Geffen et al., 2022). The GSFC product (Lamsal et al., 2022) utilizes slant columns from the official product to retrieve a full time series of tropospheric NO2 VCDs from spring to autumn months of 2018 to 2021 based on the algorithm developed for the Ozone Monitoring Instrument (OMI) Aura NO2 standard product version 4.0 (Lamsal et al., 2021). TROPOMI NO2 data have been reported to have an overall low bias (Judd et al., 2020; Tack et al., 2021; Verhoelst et al., 2021; Wang et al., 2020), which will be propagated into emissions inferred from TROPOMI NO2.
We further aggregate TROPOMI's individual measurements at spatial resolution of 0.05° × 0.05° by averaging the original pixels weighted by the fraction of the overlapping surface area. Only high-quality pixels with a quality assurance value (qa_value) above 0.75 are considered for averaging, which excludes cloud-covered scenes with cloud radiance fraction > 0.5. Following the approach of earlier research (e.g., Liu et al., 2017), our analysis is confined to the data from May through September. This decision is made to omit winter data, characterized by longer NOx lifetimes, which in turn lead to greater uncertainties to the method.
2.2 Emission mapping algorithm
We couple our 1D CTM-Independent SATellite-derived Emission estimation Algorithm for Mixed-sources (MISATEAM; Liu et al., 2022) with the 2D divergency method of Beirle et al. (2019). The 1D MISATEAM algorithm quantifies the magnitude of city-level NOx lifetime and emissions by conceptualizing urban areas as point sources and thus does not capture the spatial variability within the urban areas. Conversely, the 2D divergence method allows for the resolution of finer spatial details in NOx distributions but relies on additional, often external, sources for determining NOx lifetimes, which can be a significant limitation. The coupled algorithm (hereafter referred to as 2D MISATEAM for simplicity) leverages the strengths of both: it maps NOx emissions over urban areas with enhanced spatial detail and does so independently by deriving lifetimes directly from NO2 measurements, thereby overcoming the need for prescribed or externally sourced lifetime constraints. The 1D and 2D MISATEAM methods deliver consistent estimates for total emissions, displaying a small relative difference of %. While this result demonstrates the internal consistency of the MISATEAM methods, it is important to note that such coherence is due to the shared fundamental principle of mass balance underlying both methodologies. The cities listed in Table S1 in the Supplement that failed NU-WRF validation demonstrate a similar consistency between the two methods, with a relative difference 1±14 %. Therefore, the similarity in emissions estimations should not be viewed as an independent validation metric.
We average both NO2 VCDs and reanalysis wind data from May to September each year. We then use those averaged data to infer NOx emissions E by summing the divergence of the NOx flux D with the NOx sink S based on the continuity equation for a steady state as follows:
where F is the NOx flux. It is calculated from the horizontal fluxes of NO2 VCDs Ω. is the ratio of NOx to NO2 columns. Following previous studies (Beirle et al., 2019), we use an value of 1.32 to represent “typical urban conditions and noontime sun” (Seinfeld and Pandis, 2006). We interpolate the Goddard Earth Observing System Forward Processing for Instrument Teams' (GEOS FP-IT) reanalysis wind vectors (Lucchesi, 2015) to the TROPOMI overpass time and average layers from the surface to 1000 m altitude to derive v used in Eq. (2). Since the NOx sinks are dominated by the chemical loss through the reaction of NO2 with OH at TROPOMI's local overpass time (13:30), it can be characterized by a first-order effective NOx lifetime τ. Consequently, it bears a proportionate relationship to the NO2 VCD itself in Eq. (3). Note that we assume a relatively constant background and subtract the NO2 background b from Ω in the calculation of the divergences and the sinks because we aim to remove the natural and non-local contributions from the total emissions for each urban area in order to infer urban emissions. For each city, we infer b and τ by applying 1D MISATEAM (Liu et al., 2022) to NO2 VCDs averaged from May through September 2018–2021, assuming b and τ are constant over years. Additional technical details for deriving b and τ are given in Fig. S1 and Sect. S1 of the Supplement.
The city of New York serves as a case study to showcase our approach. With its substantial size and numerous point and area sources, this city is an ideal illustration of the capability of 2D MISATEAM to map emissions from various sources. Figure 1a–c illustrate maps of the derived sink S, the divergence D, and the resulting NOx emissions E, respectively. The divergence of the NOx flux (Fig. 1b) presents enhancement throughout the urban area due to emissions from traffic and industrial sources. The divergence is negative outside the urban areas because the change in the NOx flux is dominated by chemical loss here. The addition of sinks (Fig. 1a) compensates for such negative divergences, resulting in the emission pattern E (Fig. 1c). Two point source emissions on Long Island stand out: Glenwood Landing power station (labeled as power plant, PP) and John F. Kennedy (JFK) airport, respectively.
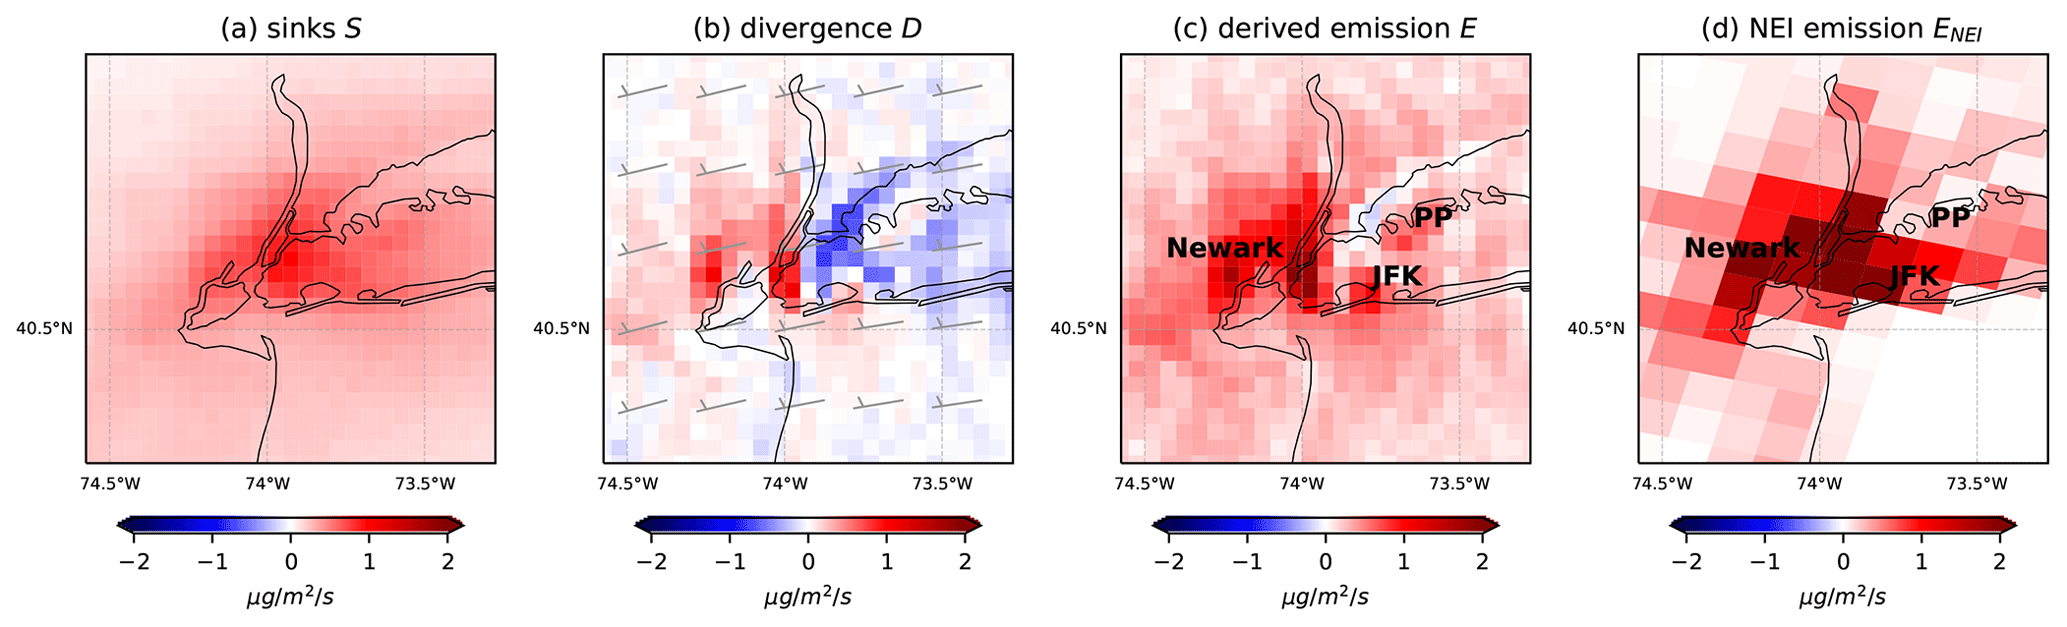
Figure 1NOx budget inferred from TROPOMI NO2 observations around New York City from May through September 2019. (a) Sinks S, (b) divergence D, (c) derived NOx emissions , and (d) NEI NOx emissions ENEI. The locations of Glenwood Landing power station, JFK airport, and the city center of Newark are labeled as PP, JFK, and Newark, respectively. Wind barbs at TROPOMI overpass time from May to September of 2019 are averaged and shown in panel (b). Wind speed is given in the units of knots, where 1 kn is equal to 1 nautical mile per hour (1.9 km h−1). Each short and long barb represents 5 kn (9.3 km h−1) and 10 kn (18.5 km h−1), respectively.
We apply 2D MISATEAM to US cities with populations exceeding 200 000, a categorization that corresponds to medium to large urban areas as designated in Organization for Economic Co-operation and Development (OECD) countries. Adjacent cities, those situated within 50 km of the most populous city in an urban conglomeration, are treated as a single city cluster. Cities producing significantly weaker NO2 signals than the surroundings are excluded (see criteria in Sect. S2). The specified criteria yield a combined count of 52 cities and urban conglomerations (refer to Table S1) that are suitable for the application of 2D MISATEAM. We obtained valid results from 39 of these cities shown in Fig. S2. Cities with invalid results are associated with large fitting errors (see Sect. S2).
2.3 National Emission Inventory (NEI)
We compare emissions derived in this study with those of the bottom-up NEI 2019 processed by George Mason University (Ma and Tong, 2022). NEI is a comprehensive estimate of emissions of criteria air pollutants and their precursors from point, mobile, and area sources, which has been widely used to support urban air quality model simulations. The large point sources in NEI are compiled based on direct stack emissions measurements by continuous emissions monitoring systems (CEMSs). For non-point sources, the gridded data are generated using spatial proxies such as roadway-level traffic data for distributing aggregate emissions to grid cells. Figure 1d displays a map of NEI estimates ENEI at a spatial resolution of 12 km for 2019. NEI has been reported to be biased high by 30 %–70 % in the early years of the 2010s (Choi and Souri, 2015; Dickerson et al., 2019). For example, NEI NOx estimates for 2011 were potentially overestimated by 51 %–70 % over the Baltimore–Washington region (Anderson et al., 2014), 30 %–60 % in the Southeastern United States (Travis et al., 2016), and 30 %–60 % over urban areas of Texas (Souri et al., 2016). NEI NOx emissions for mobile sources alone were reported to be biased high by 28 % (McDonald et al., 2018). We use the lower bound of the reported bias (30 %) as the uncertainty for NEI emissions in this study. The spatial distribution of our estimated emissions E (Fig. 1c) is generally in good agreement with that of NEI emissions (Fig. 1d), with a correlation coefficient of 0.71. More comparisons between these two inventories will be discussed in Sect. 3.2.
2.4 NU-WRF simulations
We use a regional modeling system, the NASA-Unified Weather Research and Forecasting (NU-WRF; Tao et al., 2013; Peters-Lidard et al., 2015), to provide synthetic tropospheric NO2 VCDs ΩNU-WRF and wind fields vNU-WRF over the continental United States. The domain of the simulation is illustrated in Fig. 2 of Liu et al. (2022). We perform the 2016 NU-WRF simulation at a high horizontal spatial resolution of 4 km × 4 km, comparable to the TROPOMI footprint. The meteorological and chemical initial conditions and their lateral boundaries are obtained from NASA's Modern Era Retrospective-Analysis for Research and Applications version 2 (MERRA-2; Gelaro et al., 2017) and the Community Atmosphere Model with chemistry (CAM-chem; Lamarque et al., 2012), respectively. Additional model setup information, including the chemical mechanism, aerosol module, and emissions, is detailed in Tao et al. (2020) and Liu et al. (2022). We integrate simulated NO2 concentrations from the surface to the tropopause to provide ΩNU-WRF. We average wind fields used by NU-WRF from the surface to an altitude of 1000 m to compute vNU-WRF.
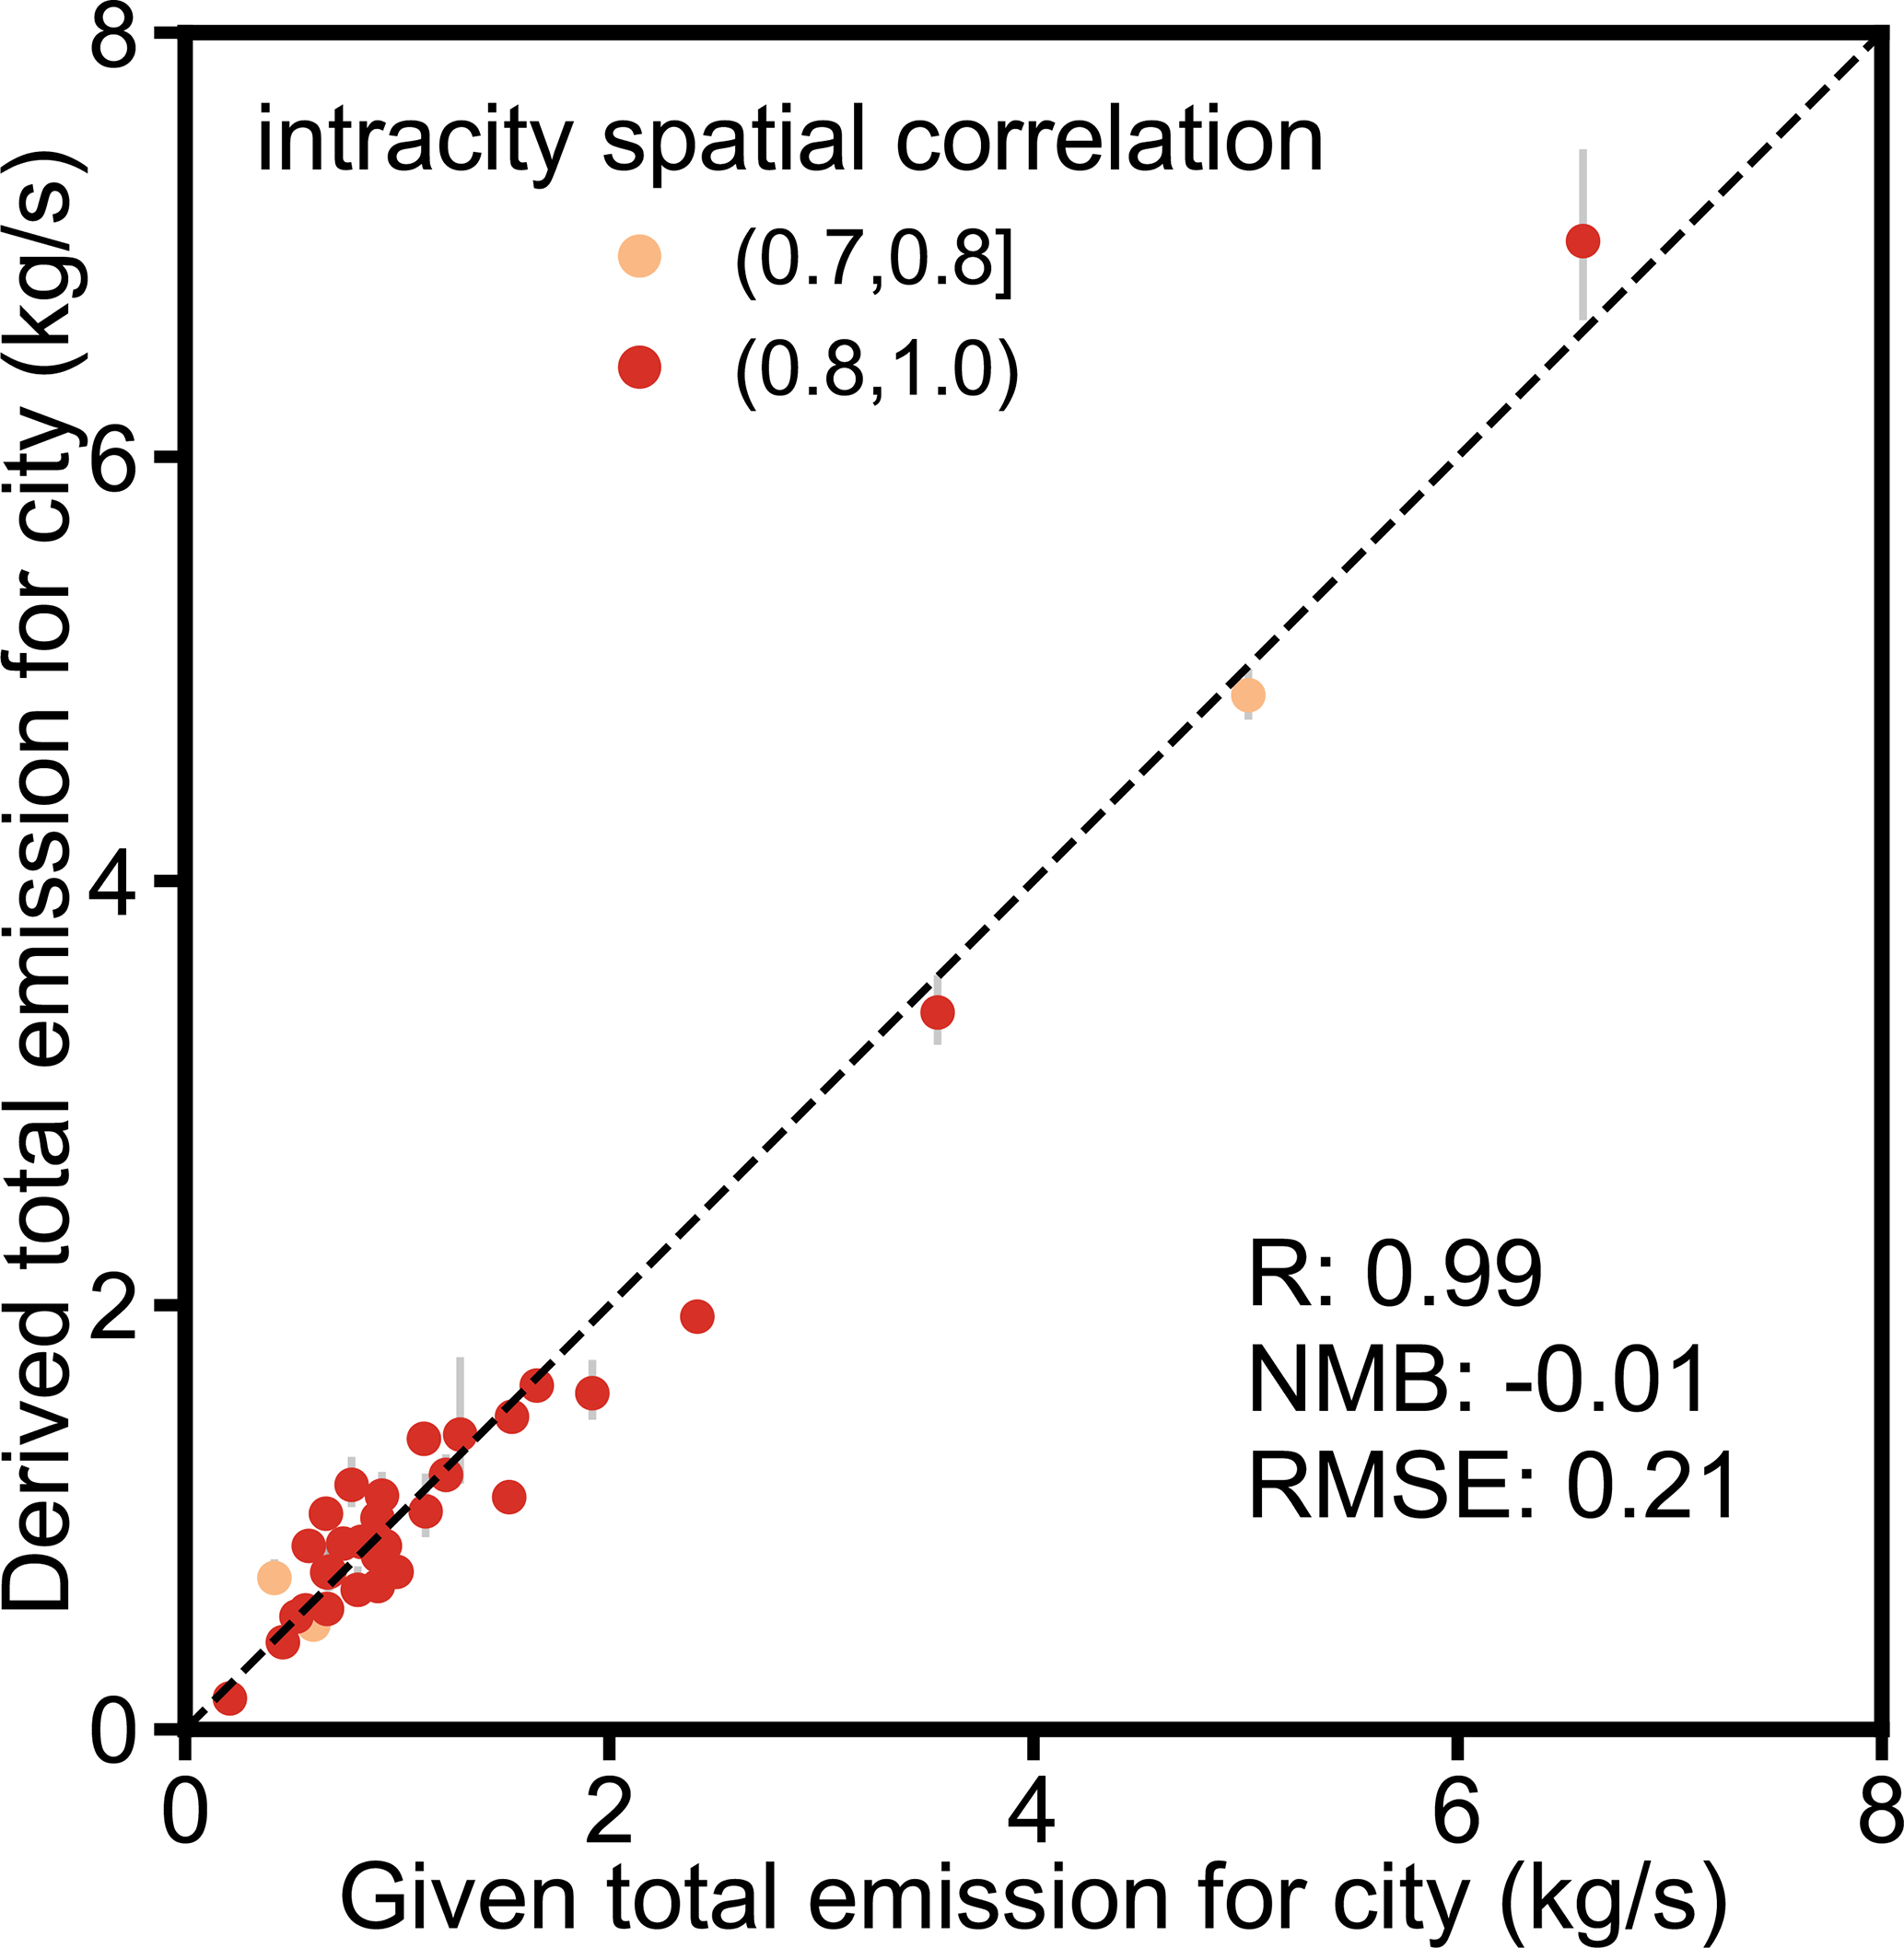
Figure 2Scatter plot of the derived NOx total emissions for the investigated cities based on the NO2 tropospheric VCDs simulated by NU-WRF (y axis) as compared to the given emissions used to drive the NU-WRF simulation (x axis). NOx emissions from all grid cells within the domain of 70 km × 70 km around the city center are summed up to derive the total emission for most cities; a 100 km × 100 km domain is used for New York, Chicago, Los Angeles, and Houston. Error bars show the standard error of the derived emissions for all wind directions with derived NOx lifetime τ. Standard error is defined as standard deviation divided by √n, with n being the number of wind directions with derived NOx lifetime τ. The intracity spatial correlation Rintracity between the derived and given emissions for individual cities is color-coded. The dashed line represents the 1:1 line. Statistics are provided in the figure.
We apply 2D MISATEAM to the synthetic NO2 VCDs ΩNU-WRF and wind fields vNU-WRF to map NOx emissions ENU-WRF for cities in Table S1. We derive valid results for 33 cities (see Sect. S2). We have valid results for a smaller number of cities compared to results derived from TROPOMI data, as cities at the edge of the NU-WRF domain, such as Seattle and San Francisco, are omitted. Since the model output partially lacks the data for their inflow/outflow plumes, it fails to satisfy the requirement for the application of 2D MISATEAM. We further compare ENU-WRF with “true emissions” directly given by the model (hereafter referred to as “given emissions”), which are used to drive NU-WRF simulations, to assess the accuracy of 2D MISATEAM.
2.5 Performance evaluation
We sum up NOx emissions from each grid cell within the city's domain to provide a total emission for an individual city. The city domain is defined as 70 km × 70 km around the city center for most cities, which is large enough to include all urban areas. We use a larger domain of 100 km × 100 km for New York, Chicago, Los Angeles, and Houston due to their larger expanse. The model performance metrics of the normalized mean bias (NMB) and the root mean squared error (RMSE) for the evaluation are defined as
and
respectively, where i denotes an individual city, and n refers to the total count of cities utilized for the evaluation. Emis denotes the total emission from the MISATEAM-derived datasets (i.e., E or ENU-WRF), and Emis′ denotes the total emission from benchmark emission datasets (i.e., ENEI or ). We also assess the intracity spatial correlation Rintracity by calculating the correlation coefficient of emissions at grid level over the city domain between E and ENEI or between ENU-WRF and .
3.1 Validation using NU-WRF simulations
We compare MISATEAM-derived NOx emissions ENU-WRF with given emissions to validate 2D MISATEAM. The validation indicates the uncertainty of MISATEAM assuming a best-case scenario with perfect knowledge of the winds and errorless satellite NO2 retrievals. Figure 2 compares the total emissions from the two datasets for the 33 cities (Table S1). The correlation coefficient is 0.99, which indicates an excellent agreement between the two datasets. The overall bias computed over all valid cities is generally low (NMB = −0.01), and the RMSE is also low (0.21 kg s−1).
We assess 2D MISATEAM's performance to infer the spatial distribution of emissions. Figure 3 displays the emission maps around the city of Jacksonville, Florida. ENU-WRF (Fig. 3c) and (Fig. 3d) show a high intracity spatial correlation Rintracity of 0.92. This good consistency is substantially better than the comparison of with the tropospheric NO2 VCD ΩNU-WRF (Fig. 3a; Rintracity= 0.75), which is often considered to be a reasonable spatial proxy for emissions locations. We further compare the correlation with the comparison of with ΩNU-WRF under calm wind conditions (Fig. 3b). We use the threshold of 2 m s−1 as the criterion for calm wind, allowing for the attainment of an adequate sample size. This threshold reduces the error associated with transport by increasing Rintracity from 0.75 (Fig. 3a) to 0.80 (Fig. 3b). However, this correlation is still smaller than that between ENU-WRF and , suggesting that 2D MISATEAM is successful in allocating emissions by accounting for NOx transport. Similar enhanced correlations are observed for all 33 cities. Figure 2 illustrates Rintracity of ENU-WRF and for individual cities (0.88 ± 0.06, mean ± standard deviation). These correlations are larger than the comparison of ΩNU-WRF (0.78 ± 0.09) or ΩNU-WRF under calm wind conditions (0.80 ± 0.08) against .
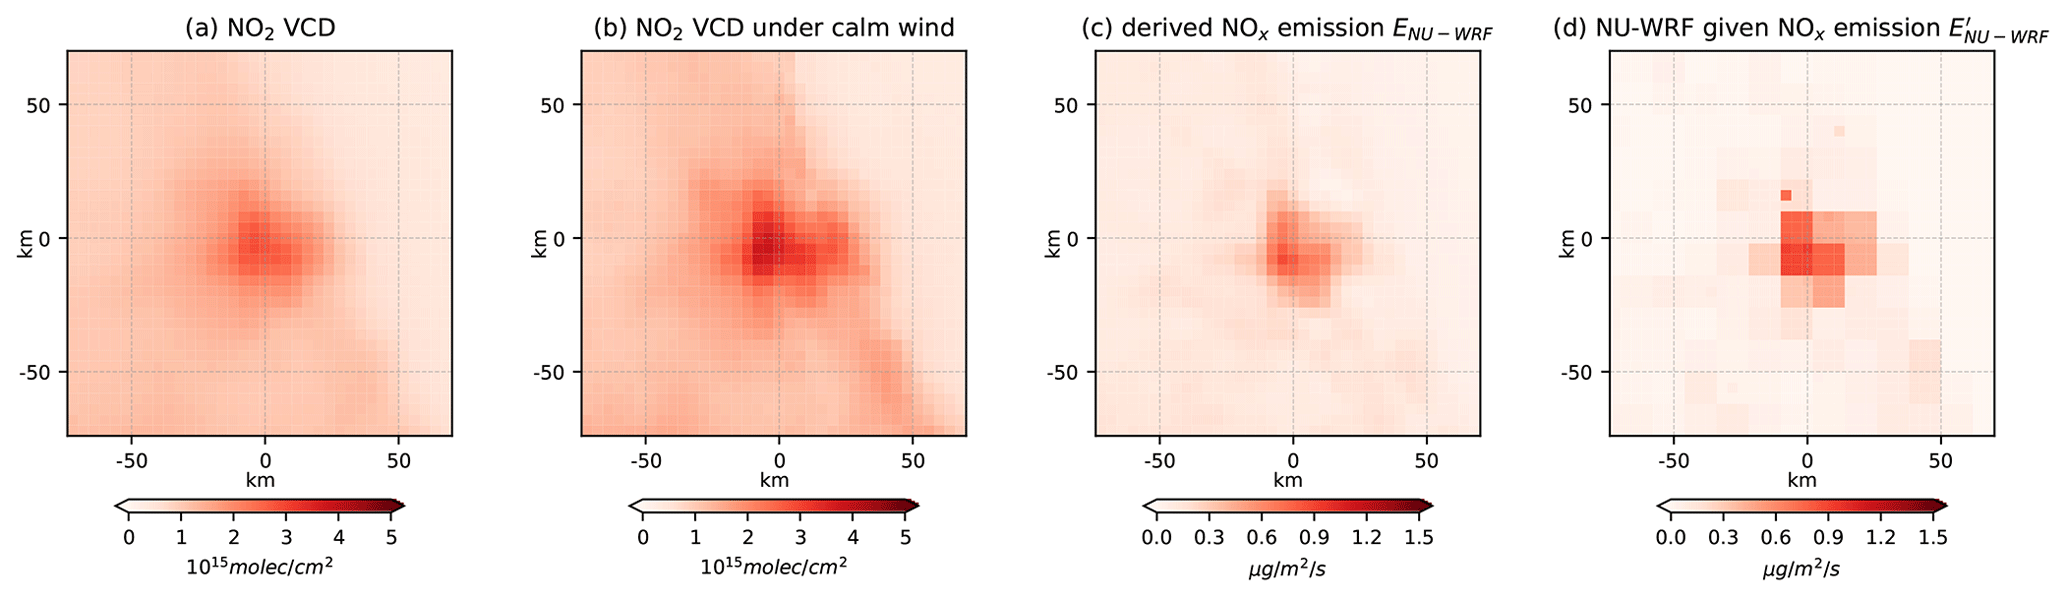
Figure 3Improved spatial correlation of derived and given NOx emissions compared to that of derived NOx emissions and NO2 columns. (a) Mean NU-WRF tropospheric NO2 VCDs ΩNU-WRF. (b) Mean NU-WRF tropospheric NO2 VCDs under calm wind conditions only. (c) Mean NOx emission rates ENU-WRF derived from panel (a). (d) Mean NOx emission rates used to drive the NU-WRF simulation . Hourly mean data at 14:00 LT are averaged from May through September 2016. The city of Jacksonville, Florida, is in the center of the domain shown.
3.2 TROPOMI-based NOx emissions
We compare TROPOMI-based NOx emissions E with NEI estimates ENEI for 2019 in Fig. 4. The total emission estimates for individual cities in the two datasets generally agree well with each other, with a correlation R of 0.90. This level of correlation is comparable to the validation using NU-WRF simulations. The relative difference of the total emission between E and ENEI is within the uncertainty range of E (47 %; see Sect. 3.3) for 31 out of 39 cities. The comparison for all cities shows a bias with NMB of −0.24. The bias is likely associated with uncertainties in the TROPOMI NO2 retrievals, which have been reported to be biased low by 23 % on average (van Geffen et al., 2022). The bias may also arise from the uncertainties in NEI, which has been reported to be biased high by over 30 % (Sect. 2.3).
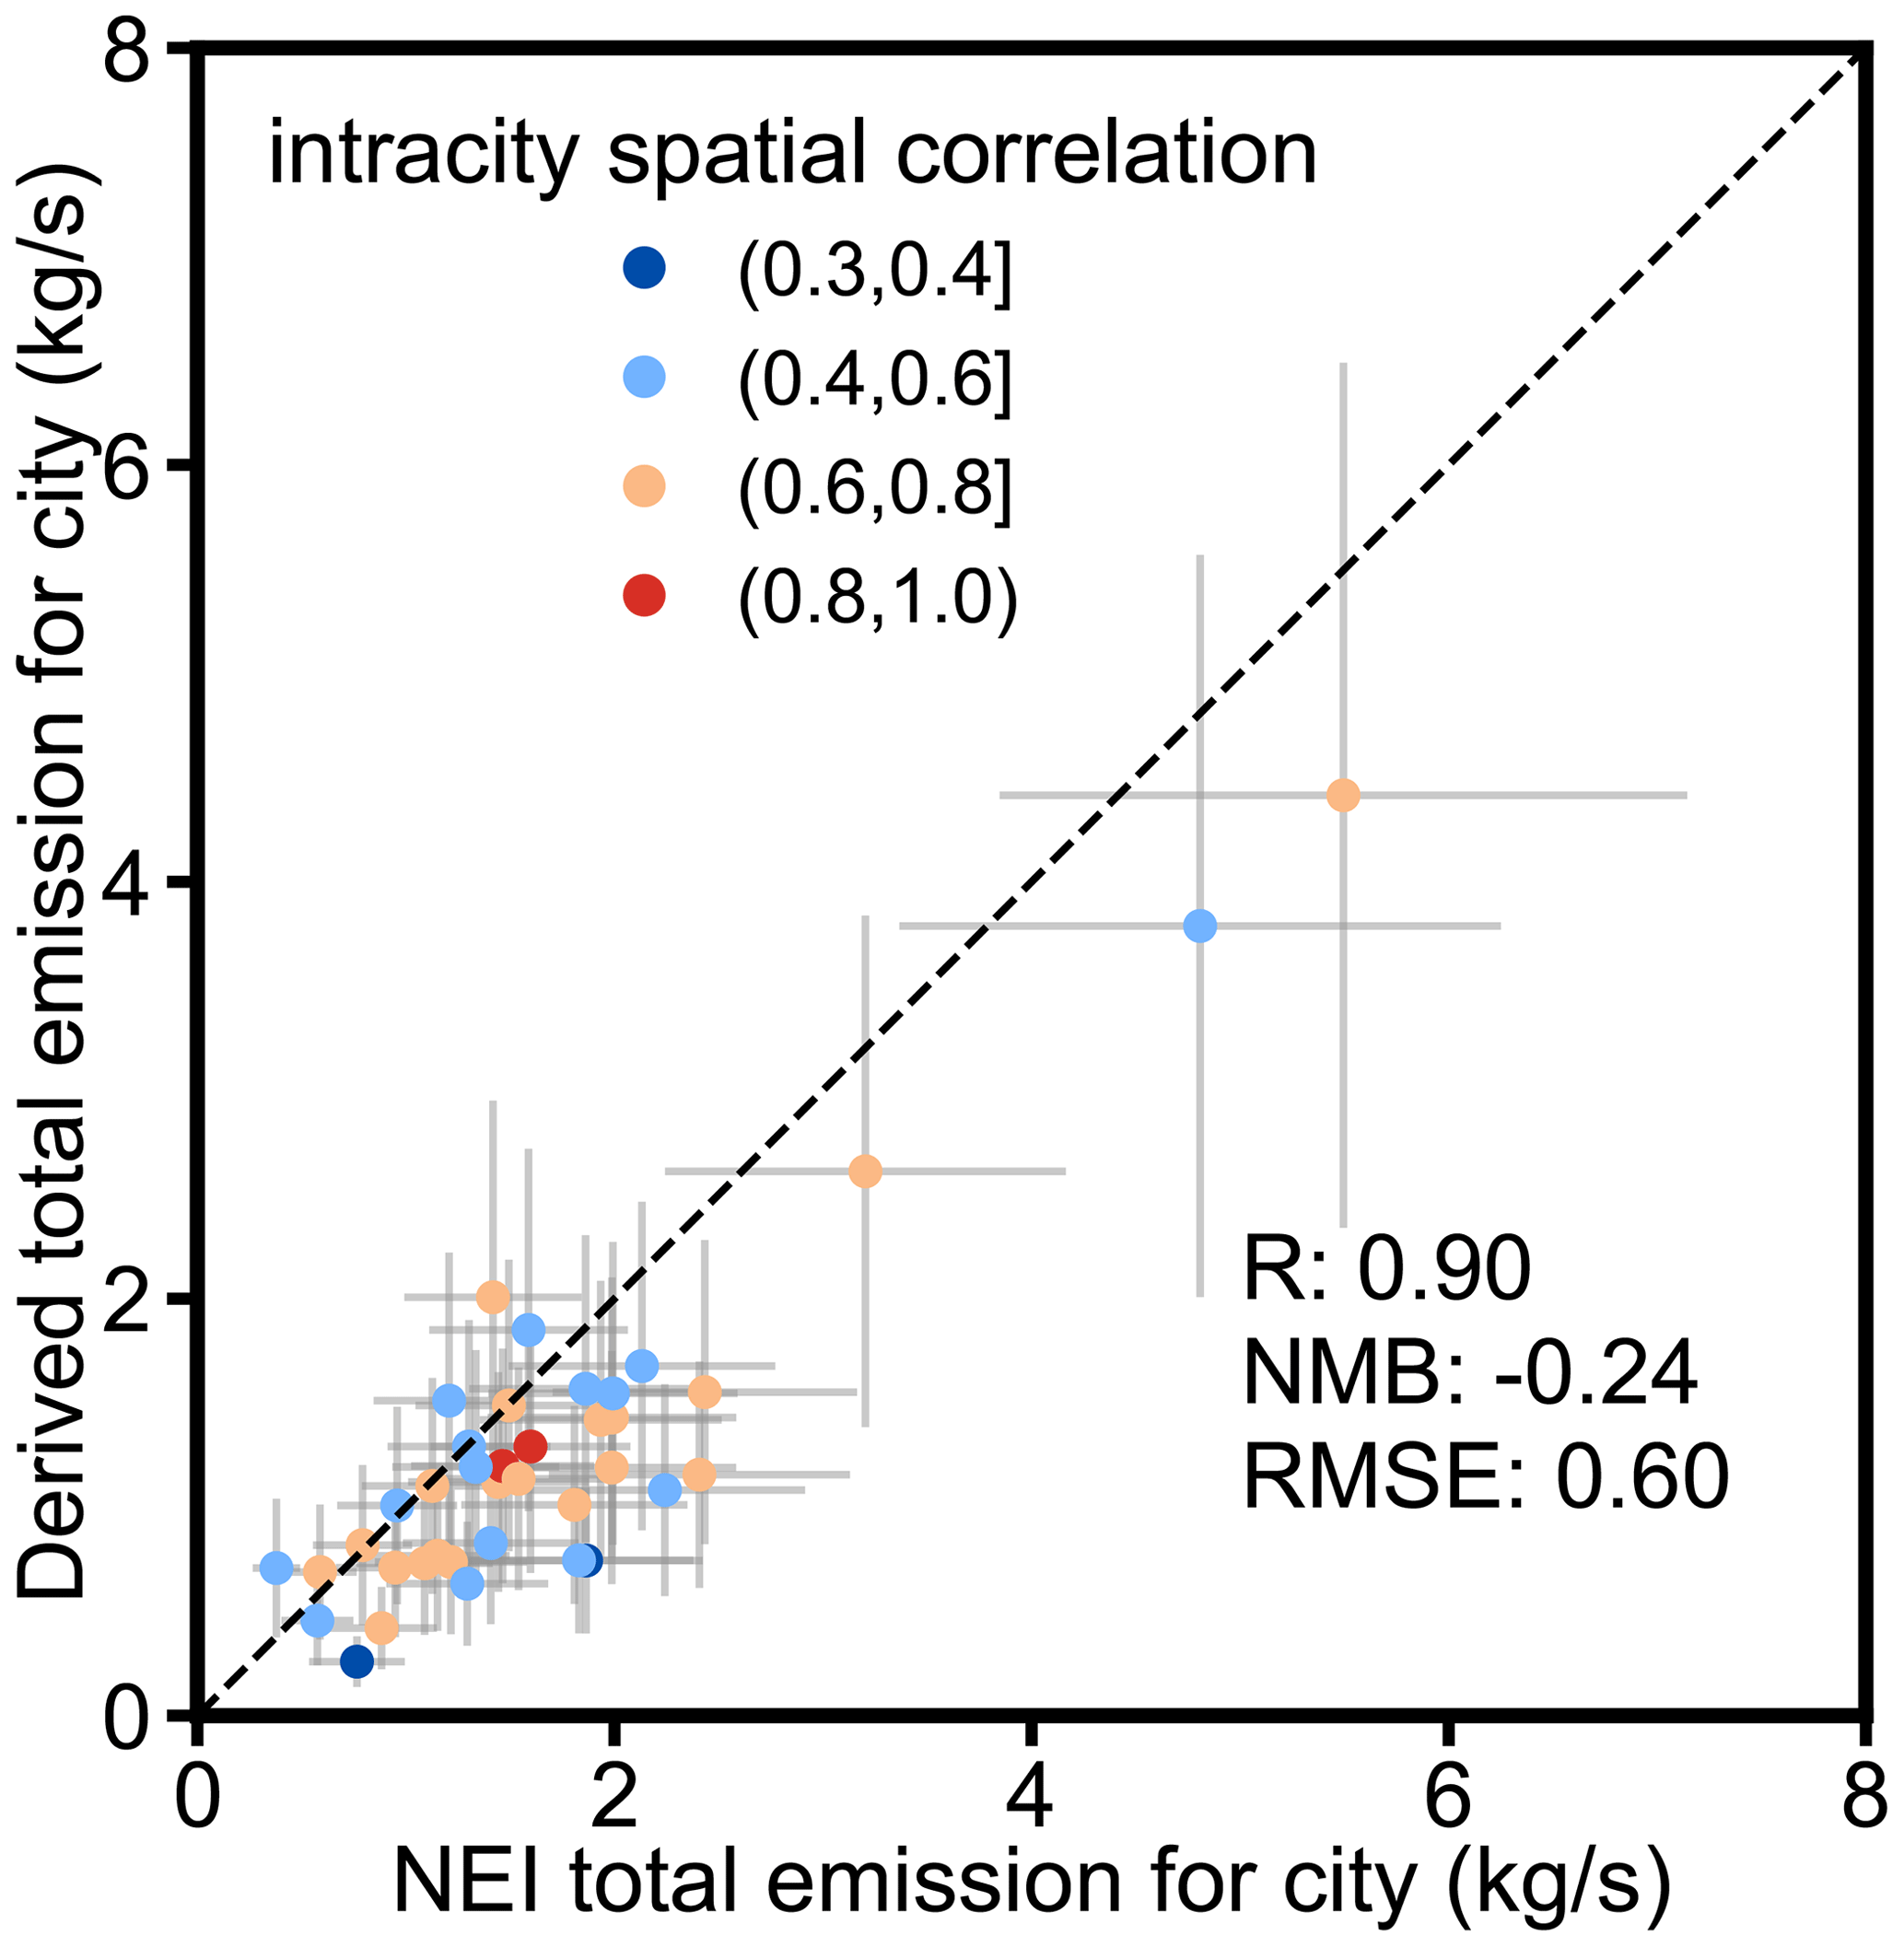
Figure 4Similar to Fig. 2 but for the comparison between the derived NOx total emissions based on TROPOMI tropospheric NO2 VCDs (y axis) with NEI total emissions (x axis) for 2019. Error bars show the uncertainties of NEI (30 %) and fitted (47 %) emissions.
Figure 5 compares the NOx emission patterns from TROPOMI NO2 with those reported in the NEI, using Dallas and Tucson as case studies. Consistent with observations in New York (as shown in Fig. 1), TROPOMI-derived emission maps reveal several more pronounced point sources as compared to NEI. Notable emissions from the Dallas Fort Worth International Airport, Perot Field Fort Worth Alliance Airport, and three major cement factories – TXI, Holcim, and Ash Grove – are distinctly evident (Fig. 5a), whereas these details appear diffused in NEI (Fig. 5b). Similarly, emissions from the Asarco Mission copper mine are clearly discernible in the TROPOMI data (Fig. 5c) but are not as apparent in the NEI data (Fig. 5d).
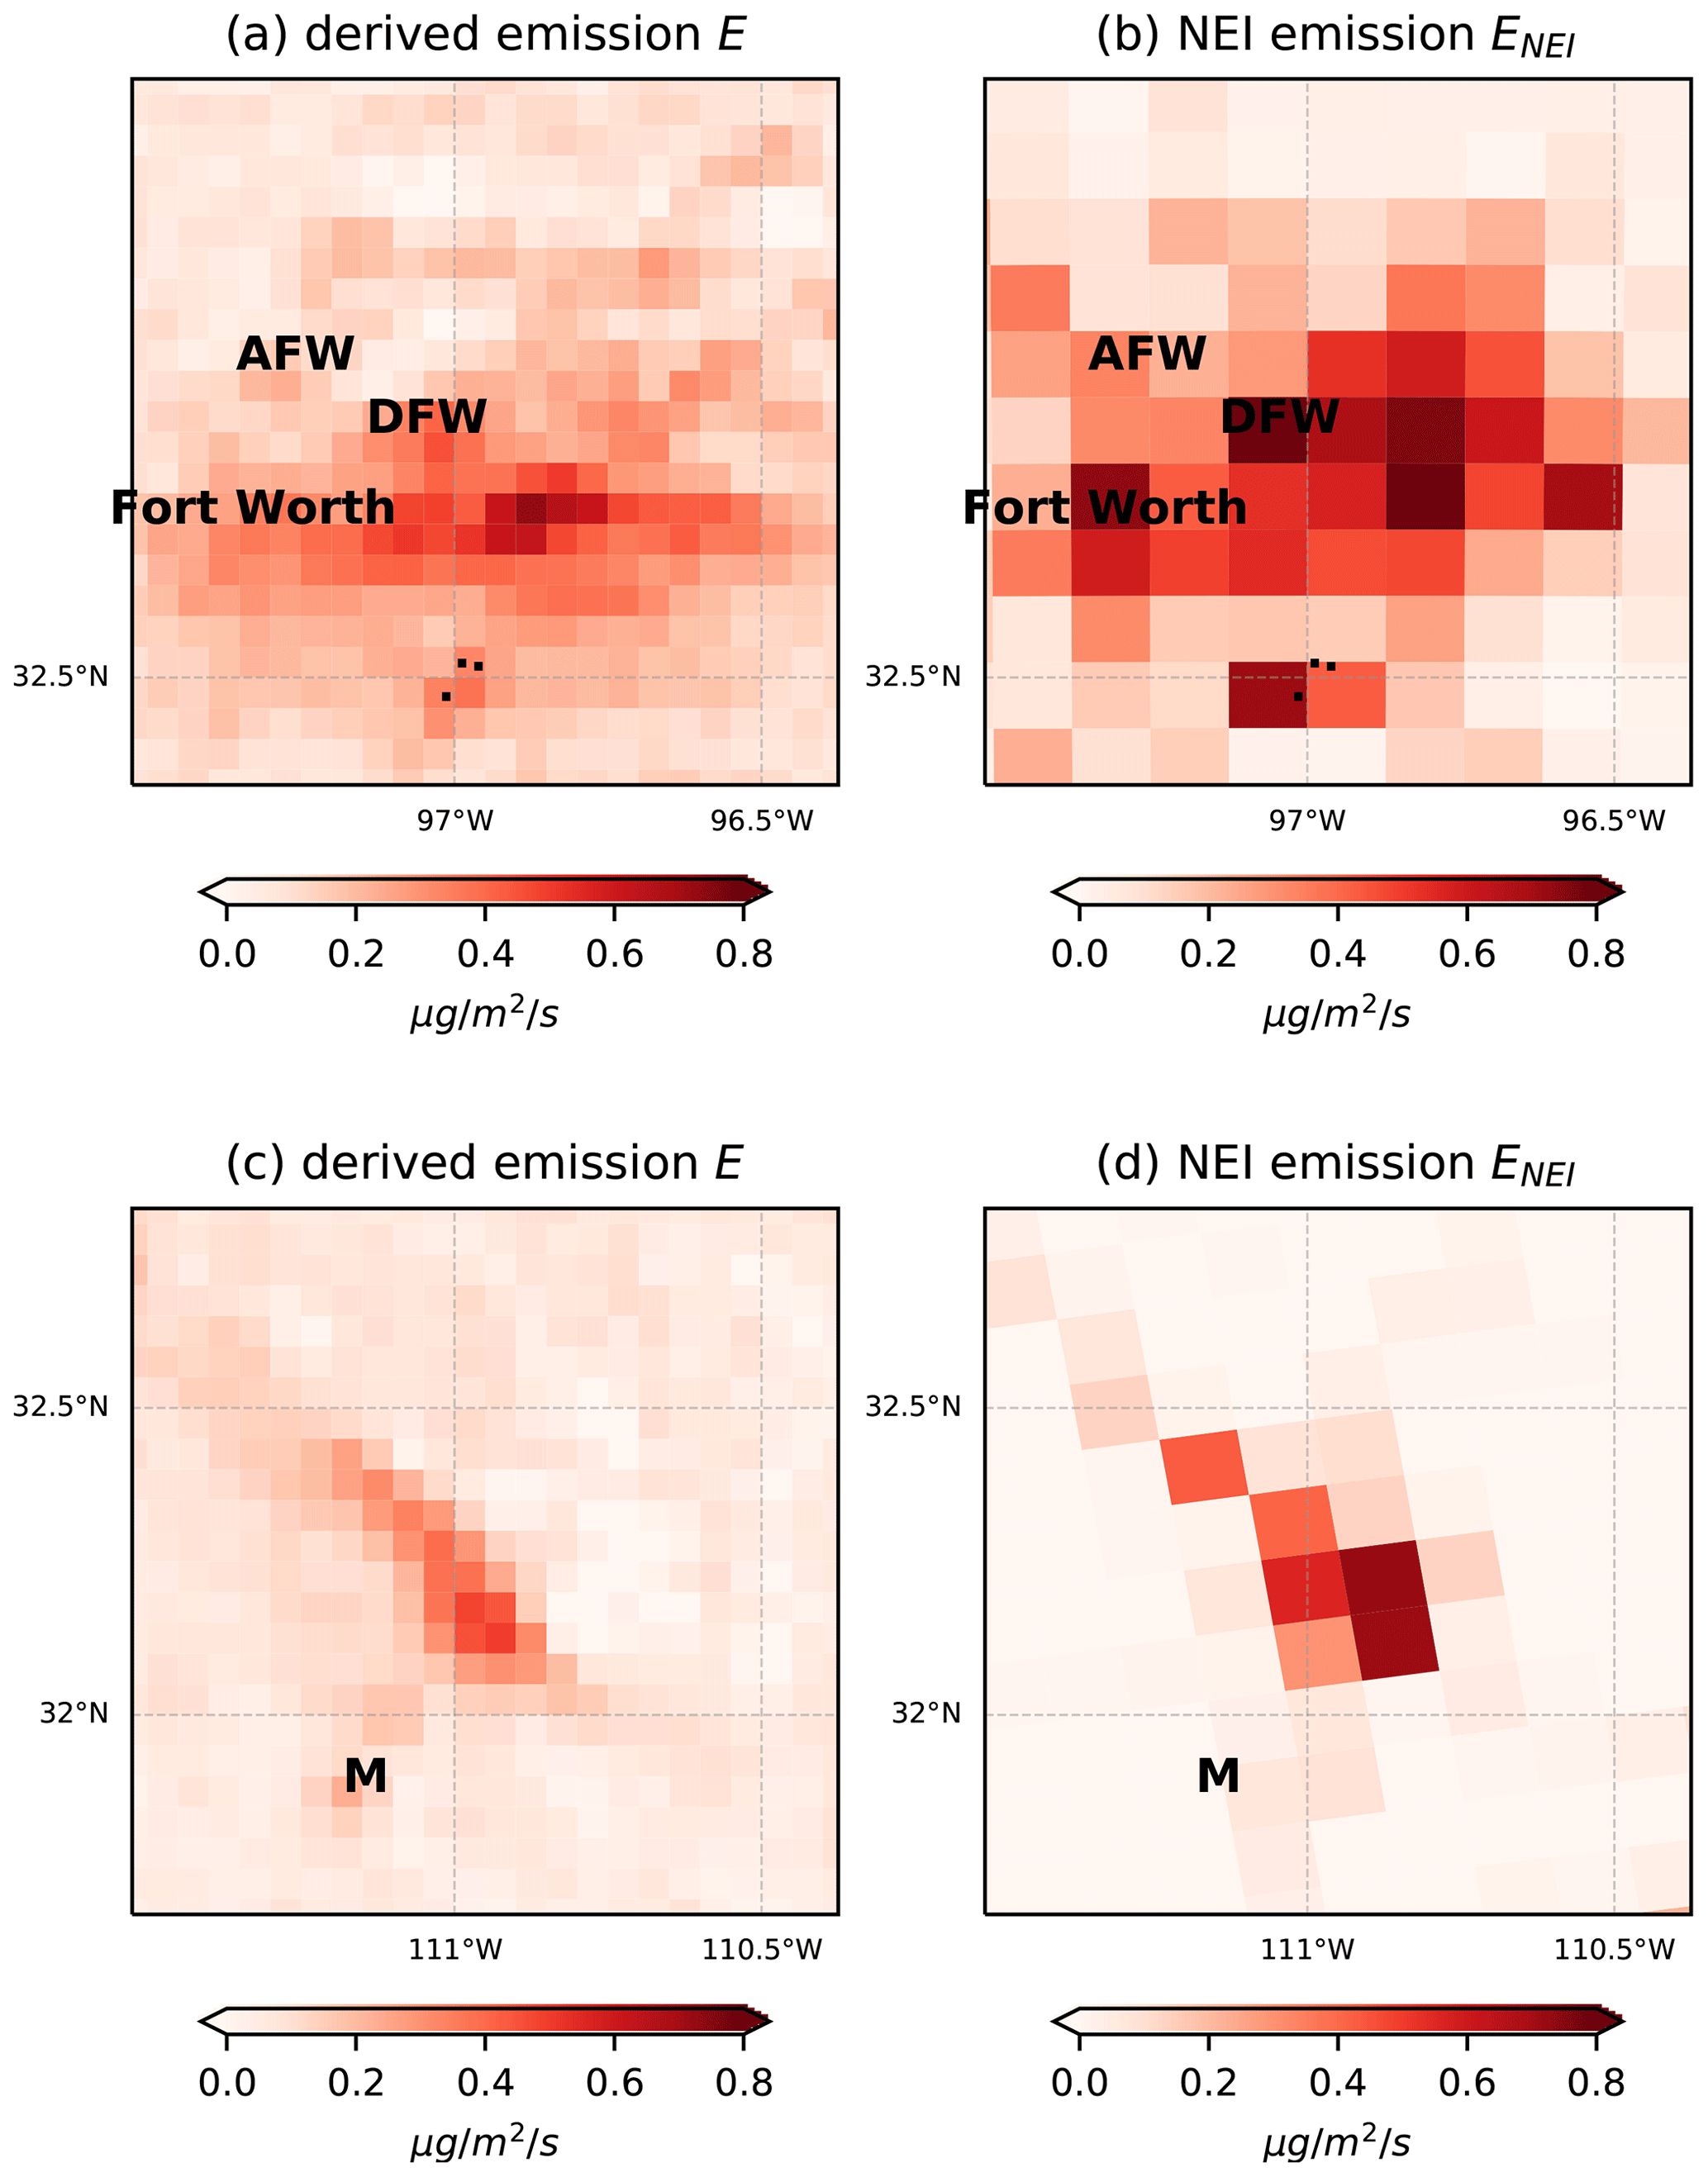
Figure 5Comparison of NOx emissions inferred from TROPOMI NO2 observations with NEI emissions from May through September 2019. (a) TROPOMI-derived NOx emissions E and (b) NEI NOx emissions ENEI for Dallas. The locations of Dallas Fort Worth International Airport, Perot Field Fort Worth Alliance Airport, and the city center of Fort Worth are labeled as DFW, AFW, and Fort Worth, respectively. The locations of three large cement factories (TXI, Holcim, and Ash Grove) are labeled as dots. (c) TROPOMI-derived NOx emissions E and (d) NEI NOx emissions ENEI for Tucson. The location of a large copper mine Asarco Mission is labeled as M.
We use Rintracity to compare the intracity spatial distribution of emissions for more cities in Fig. 4. We upscale E to the same spatial resolution of ENEI to calculate their Rintracity (Fig. S3). Rintracity between E and ENEI is 0.57 ± 0.16, which is smaller than that between ENU-WRF and in the evaluation using model data (0.88 ± 0.06; Fig. 2). The generally smaller values of Rintracity are likely caused by the uncertainties of both TROPOMI-based and NEI emissions. Compared to ENU-WRF inferred from perfect NO2 columns and wind fields, the uncertainties of TROPOMI NO2 retrievals (25 %; van Geffen et al., 2022) and GEOS FP-IT wind reanalysis (30 %; Liu et al., 2022) are propagated into the uncertainties of TROPOMI-based emissions E and may result in incorrect spatial patterns. More details about the uncertainties are discussed in Sect. 3.3. Uncertainties in ENEI also contribute to the disagreement. NEI uses spatial-distribution proxies, such as maps of population densities or road networks, to allocate country-level emissions from non-point sources onto a grid. This procedure may be associated with biases due to either a spatial mismatch between the locations of emissions and spatial proxies or incorrect emission magnitudes. Some hotspots shown in E are missing from ENEI, for instance, JFK airport (Fig. 1) and Asarco Mission mine (Fig. 5), indicating missing sources or misallocation of sources.
Figure 6 presents the trends of derived NOx emissions across US cities from 2018 to 2021. A significant dip in emissions was observed in 2020, primarily attributed to the diminished NOx emissions in response to COVID-related lockdown policies (e.g., Liu et al., 2020). The 2020 emissions saw an average reduction of approximately 25 % from 2019, in agreement with the findings of other studies (Goldberg et al., 2020; Miyazaki et al., 2021). Emissions in 2021 experienced a rebound compared to those in 2020; however, they are still lower than the pre-pandemic levels. The slopes of the linear regression lines in Fig. 6 decrease from 0.91 in 2019 to 0.85 in 2021. This decline aligns with the long-term trend of decreasing emissions in the United States, primarily driven by the downturn trend in vehicular NOx emissions (McDonald et al., 2018). The reduced slope in 2021 (0.85) relative to 2019 (0.91) may also encapsulate lingering impacts of diminished traffic from the COVID-19 pandemic, since the traffic and commercial flight metrics at the end of 2020 were still substantially lower than their January 2020 levels (Laughner et al., 2021).
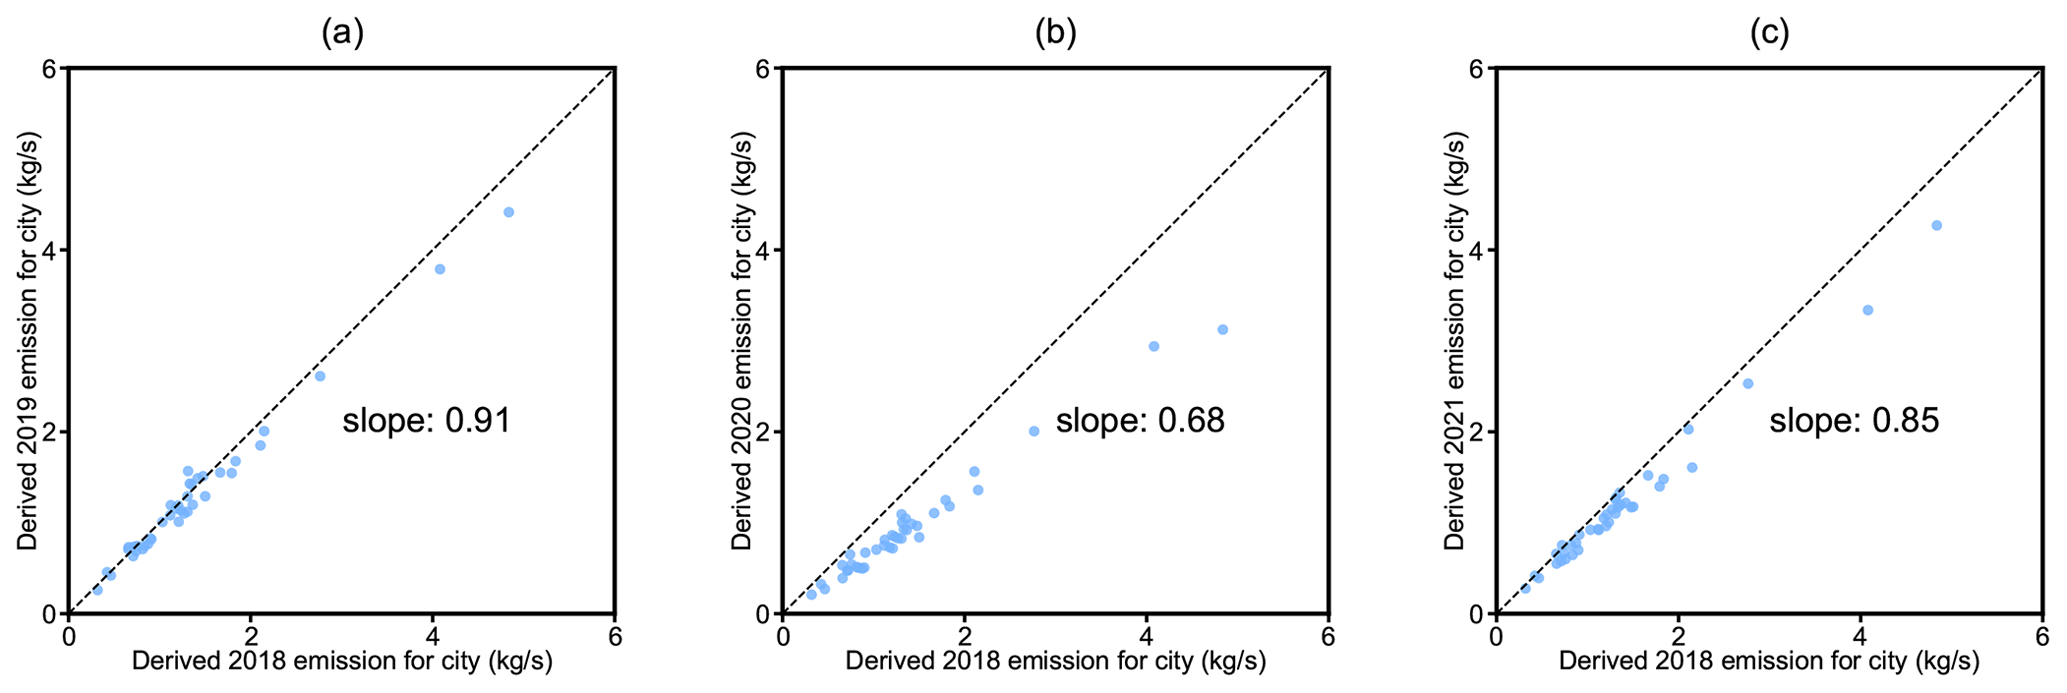
Figure 6Comparison of TROPOMI-derived NOx emission estimates for (a) 2019, (b) 2020, and (c) 2021 with those for 2018. The dashed line represents the 1:1 line. The slope of the least-squares linear regression line is provided in each figure panel.
3.3 Uncertainty analysis
We follow the method proposed by Liu et al. (2022) to evaluate the uncertainties associated with the derived results. We attribute an uncertainty of 20 % to the inferred emissions, based on the relative differences between ENU-WRF and for all 33 cities using the NU-WRF synthetic data (2 ± 24 %). Since the differences are less than 20 % for most cities (73 %), this estimate may be conservative.
Instead of using data spanning multiple years (2018–2021), we apply 1D MISATEAM to annual data to investigate the uncertainty introduced by presuming a consistent NOx lifetime over several years. For each city, we infer τ by applying 1D MISATEAM to TROPOMI NO2 VCDs, averaged from May to September for each individual year from 2018 to 2021. Among the cities analyzed, 14 cities (listed in Table S1) have valid NOx lifetimes available for all 4 years. The ratio of the standard deviation of the fitted τ for these individual years to the average τ, as derived from data from 2018 to 2021, stands at 16 %. This indicates an uncertainty of 16 % in relation to the assumption of a constant NOx lifetime.
We identify additional uncertainties that may arise when implementing 2D MISATEAM to TROPOMI and GEOS-IT data as opposed to synthetic data, as follows:
-
The uncertainty of TROPOMI NO2 observations carries over into the uncertainty of the inferred emissions. We consider an overall uncertainty of 25 % for TROPOMI tropospheric NO2 VCDs, following the recommendation from a recent validation using ground-based measurements (van Geffen et al., 2022). The uncertainty originates from various factors, including the spectral fitting process during the retrieval, the separation of stratospheric and tropospheric columns, and the tropospheric air mass factor (AMF).
AMF accounts for the variable sensitivity of satellite observations to NO2 at different atmospheric altitudes, which is informed by a priori knowledge of NO2 vertical distribution as provided by chemical transport models. Laughner et al. (2016) demonstrated that urban NOx emissions estimated via NO2 VCDs with daily, high-resolution a priori profiles are considerably higher than those derived from retrievals using coarser-resolution profiles. This presents a relevant challenge for our study. To refine the assessment of AMF influences on 2D MISATEAM-derived emissions, a sensitivity analysis where TROPOMI's AMFs are applied to NU-WRF profiles is of help. This would generate NO2 columns with AMF biases, which, when used to calculate emissions, can be contrasted with those derived from idealized columns. Such a comparison would reveal the extent to which AMF biases systematically affect the emissions determined by 2D MISATEAM. Given the extensive computational demands of such a sensitivity analysis, we had to exclude it from this study. Instead, we aim to perform a comprehensive investigation in future research.
The potential bias arising from the separation of stratospheric and tropospheric columns is eliminated by the employment of the background terms b and bcalm within the model functions of MISATEAM. Since the random uncertainty of the tropospheric NO2 observations could be suppressed due to the consideration of long-term means, this estimate may be conservative.
-
The presence of clouds is an additional source of uncertainties. We exclude TROPOMI NO2 data with cloud radiance fraction of 0.5 or greater in our analysis. This exclusion may lead to a bias in the NO2 VCD averages, a consequence of eliminating data with changing the NOx lifetime and ratio during cloudy conditions (Geddes et al., 2012). We attribute an uncertainty of 10 % to cloud selection criteria based on an assessment carried out at urban locations (Geddes et al., 2012). More sensitivity analysis regarding the impact of clouds has been discussed by Liu et al. (2022).
-
The precision of wind fields plays an important role in determining the total uncertainty, as it limits the model functions' ability to describe NO2 transport. We estimate the corresponding uncertainties to be 30 % based on an assessment of reanalysis wind products using sounding measurements (refer to Table S3 in Liu et al., 2016a).
We define the overall uncertainty of the inferred emissions as the root of the quadratic sum of the above-mentioned uncertainties, which are assumed to be independent. We thus calculate that the total uncertainty of MISATEAM-derived NOx emissions for a mid-size US city is 47 %.
In this study, we developed a new method by coupling the 1D CTM-independent methodology (Liu et al., 2022), MISATEAM, with the 2D divergence approach (Beirle et al., 2019) to generate maps of NOx emissions across US cities, using TROPOMI NO2 observations. This coupled method, 2D MISATEAM, is suitable for sources within polluted backgrounds. Our initial application of the approach used synthetic NU-WRF-generated tropospheric NO2 VCDs over the continental United States to evaluate the method. The evaluation yielded robust agreement with the NU-WRF given values, presenting a high correlation coefficient (R= 0.99) and a minimal bias (NMB = −0.01).
Subsequently, we applied 2D MISATEAM to TROPOMI NO2 retrievals across the US cities from 2018 to 2021. We estimated NOx emissions for 39 US cities. Our resulting total city emissions estimates align strongly with NEI (R= 0.90), albeit with a moderate bias (NMB = −0.24). Our derived emissions delineate differences in spatial patterns across certain cities, implying potential inaccuracies in emission allocation and/or missing sources in NEI. Our current estimates suggest that uncertainties in NOx emissions arising from 2D MISATEAM method itself are approximately 20 % for a large and mid-size US city. Additional uncertainties stem primarily from errors in the reanalysis wind dataset as well as the TROPOMI NO2 retrieval, increasing the overall uncertainties of resulting emissions to about 47 %.
The 2D MISATEAM algorithm is contingent on 1D MISATEAM for NOx lifetime estimation. The 1D MISATEAM algorithm relies on NO2 observations under calm wind conditions to infer lifetimes, which in turn influences the temporal resolution of the emissions data we can confidently derive. Our investigation indicates that typically 3 to 6 months of TROPOMI data is required to ensure comprehensive data coverage of calm-wind NO2 observations for urban emissions analysis. Therefore, we advise caution when considering the use of 2D MISATEAM for emission estimations over periods shorter than 3 months, unless we want to use prescribed or externally sourced lifetimes.
In our future research, we plan to extend the application of 2D MISATEAM to observations from geostationary satellites to estimate diurnal variations in urban emissions. Geostationary sensors include the South Korean Geostationary Environmental Monitoring Spectrometer (GEMS; Kim et al., 2012), NASA's Tropospheric Emissions: Monitoring of Pollution (TEMPO; Chance et al., 2012), and ESA's Sentinel-4 (Ingmann et al., 2012). These instruments possess spatial resolutions similar to TROPOMI and the validation of NU-WRF simulation (4 km) utilized in this study. For applications based on geostationary satellites with local observation time extending beyond the early afternoon time frame of TROPOMI in this study, further exploration into the impact of the diurnal cycle of NOx lifetime will be necessary. When applying the 2D MISATEAM to cities globally, particularly in non-OECD countries, it may be necessary to adjust population thresholds to reflect local demographics and urban profiles. We advise removing cities with emissions signals that are too weak following this study, i.e., mean VCDs > 50 % (Sect. S2), as such a high ratio can introduce significant uncertainties associated with determined background bcalm.
In the next phase of our work, we will strive to harmonize bottom-up and satellite-derived urban emissions estimates to produce a fused emission inventory (Liu et al., 2018). This will enable the provision of timely NOx emissions estimates that will be of value to both air quality and climate modeling communities.
The NU-WRF model outputs are available upon request from Zhining Tao (zhining.tao@nasa.gov). Additional data related to this paper may be requested from the corresponding author.
The supplement related to this article is available online at: https://doi.org/10.5194/acp-24-3717-2024-supplement.
Conceptualization and methodology: FL, JJ, and SB. Model simulation: ZT. Satellite data processing: SC. Wind data processing: ZTF. NEI data processing: DQT and SM. Formal analysis: FL. Visualization: FL. Writing (original draft): FL. Review and editing: all authors. Funding acquisition: FL and JJ.
The contact author has declared that none of the authors has any competing interests.
Publisher's note: Copernicus Publications remains neutral with regard to jurisdictional claims made in the text, published maps, institutional affiliations, or any other geographical representation in this paper. While Copernicus Publications makes every effort to include appropriate place names, the final responsibility lies with the authors.
We thank Russell R. Dickerson for helpful discussion on uncertainties in NEI. We thank Josh Laughner and one anonymous reviewer for helpful comments.
This research has been supported by NASA through the Aura project data analysis program; the Atmospheric Composition Modeling and Analysis Program (ACMAP) (grant no. 80NSSC19K0980); and the Modeling, Analysis, and Prediction (MAP) program.
This paper was edited by Steven Brown and reviewed by Josh Laughner and one anonymous referee.
Anderson, D. C., Loughner, C. P., Diskin, G., Weinheimer, A., Canty, T. P., Salawitch, R. J., Worden, H. M., Fried, A., Mikoviny, T., Wisthaler, A., and Dickerson, R. R.: Measured and modeled CO and NOy in DISCOVER-AQ: An evaluation of emissions and chemistry over the eastern US, Atmos. Environ., 96, 78–87, https://doi.org/10.1016/j.atmosenv.2014.07.004, 2014.
Beirle, S., Boersma, K. F., Platt, U., Lawrence, M. G., and Wagner, T.: Megacity emissions and lifetimes of nitrogen oxides probed from space, Science, 333, 1737–1739, https://doi.org/10.1126/science.1207824, 2011.
Beirle, S., Borger, C., Dörner, S., Li, A., Hu, Z., Liu, F., Wang, Y., and Wagner, T.: Pinpointing nitrogen oxide emissions from space, Science Advances, 5, eaax9800, https://doi.org/10.1126/sciadv.aax9800, 2019.
Beirle, S., Borger, C., Dörner, S., Eskes, H., Kumar, V., de Laat, A., and Wagner, T.: Catalog of NOx emissions from point sources as derived from the divergence of the NO2 flux for TROPOMI, Earth Syst. Sci. Data, 13, 2995–3012, https://doi.org/10.5194/essd-13-2995-2021, 2021.
Beirle, S., Borger, C., Jost, A., and Wagner, T.: Improved catalog of NOx point source emissions (version 2), Earth Syst. Sci. Data, 15, 3051–3073, https://doi.org/10.5194/essd-15-3051-2023, 2023.
Butler, T. M., Lawrence, M. G., Gurjar, B. R., van Aardenne, J., Schultz, M., and Lelieveld, J.: The representation of emissions from megacities in global emission inventories, Atmos. Environ., 42, 703–719, https://doi.org/10.1016/j.atmosenv.2007.09.060, 2008.
Chance, K., Lui, X., Suleiman, R. M., Flittner, D. E., and Janz, S. J.: Tropospheric Emissions: monitoring of Pollution (TEMPO), presented at the 2012 AGU Fall Meeting, San Francisco, USA, 3–7 December 2012, A31B-0020, 2012.
Choi, Y. and Souri, A. H.: Chemical condition and surface ozone in large cities of Texas during the last decade: Observational evidence from OMI, CAMS, and model analysis, Remote Sens. Environ., 168, 90–101, https://doi.org/10.1016/j.rse.2015.06.026, 2015.
Crippa, M., Guizzardi, D., Muntean, M., Schaaf, E., Dentener, F., van Aardenne, J. A., Monni, S., Doering, U., Olivier, J. G. J., Pagliari, V., and Janssens-Maenhout, G.: Gridded emissions of air pollutants for the period 1970–2012 within EDGAR v4.3.2, Earth Syst. Sci. Data, 10, 1987–2013, https://doi.org/10.5194/essd-10-1987-2018, 2018.
de Foy, B. and Schauer, J. J.: An improved understanding of NOx emissions in South Asian megacities using TROPOMI NO2 retrievals, Environ. Res. Lett., 17, 024006, https://doi.org/10.1088/1748-9326/ac48b4, 2022.
de Foy, B., Wilkins, J. L., Lu, Z., Streets, D. G., and Duncan, B. N.: Model evaluation of methods for estimating surface emissions and chemical lifetimes from satellite data, Atmos. Environ., 98, 66–77, https://doi.org/10.1016/j.atmosenv.2014.08.051, 2014.
Dickerson, R. R., Anderson, D. C., and Ren, X.: On the use of data from commercial NOx analyzers for air pollution studies, Atmos. Environ., 214, 116873, https://doi.org/10.1016/j.atmosenv.2019.116873, 2019.
Ding, J., van der A, R. J., Mijling, B., and Levelt, P. F.: Space-based NOx emission estimates over remote regions improved in DECSO, Atmos. Meas. Tech., 10, 925–938, https://doi.org/10.5194/amt-10-925-2017, 2017.
Dix, B., Francoeur, C., Li, M., Serrano-Calvo, R., Levelt, P. F., Veefkind, J. P., McDonald, B. C., and de Gouw, J.: Quantifying NOx Emissions from U.S. Oil and Gas Production Regions Using TROPOMI NO2, ACS Earth Space Chem., 6, 403–414, https://doi.org/10.1021/acsearthspacechem.1c00387, 2022.
Geddes, J. A., Murphy, J. G., O'Brien, J. M., and Celarier, E. A.: Biases in long-term NO2 averages inferred from satellite observations due to cloud selection criteria, Remote Sens. Environ., 124, 210–216, https://doi.org/10.1016/j.rse.2012.05.008, 2012.
Gelaro, R., McCarty, W., Suárez, M. J., Todling, R., Molod, A., Takacs, L., Randles, C. A., Darmenov, A., Bosilovich, M. G., Reichle, R., Wargan, K., Coy, L., Cullather, R., Draper, C., Akella, S., Buchard, V., Conaty, A., Silva, A. M. da, Gu, W., Kim, G.-K., Koster, R., Lucchesi, R., Merkova, D., Nielsen, J. E., Partyka, G., Pawson, S., Putman, W., Rienecker, M., Schubert, S. D., Sienkiewicz, M., and Zhao, B.: The Modern-Era Retrospective analysis for Research and Applications, version 2 (MERRA-2), J. Climate, 30, 5419–5454, https://doi.org/10.1175/JCLI-D-16-0758.1, 2017.
Goldberg, D. L., Lu, Z., Streets, D. G., de Foy, B., Griffin, D., McLinden, C. A., Lamsal, L. N., Krotkov, N. A., and Eskes, H.: Enhanced capabilities of TROPOMI NO2: Estimating NOx from North American cities and power plants, Environ. Sci. Technol., 53, 12594–12601, https://doi.org/10.1021/acs.est.9b04488, 2019.
Goldberg, D. L., Anenberg, S. C., Griffin, D., McLinden, C. A., Lu, Z., and Streets, D. G.: Disentangling the Impact of the COVID-19 Lockdowns on Urban NO2 From Natural Variability, Geophys. Res. Lett., 47, e2020GL089269, https://doi.org/10.1029/2020GL089269, 2020.
Henze, D. K., Seinfeld, J. H., and Shindell, D. T.: Inverse modeling and mapping US air quality influences of inorganic PM2.5 precursor emissions using the adjoint of GEOS-Chem, Atmos. Chem. Phys., 9, 5877–5903, https://doi.org/10.5194/acp-9-5877-2009, 2009.
Hogue, S., Marland, E., Andres, R. J., Marland, G., and Woodard, D.: Uncertainty in gridded CO2 emissions estimates, Earths Future, 4, 225–239, https://doi.org/10.1002/2015EF000343, 2016.
Ialongo, I., Virta, H., Eskes, H., Hovila, J., and Douros, J.: Comparison of TROPOMI/Sentinel-5 Precursor NO2 observations with ground-based measurements in Helsinki, Atmos. Meas. Tech., 13, 205–218, https://doi.org/10.5194/amt-13-205-2020, 2020.
Ingmann, P., Veihelmann, B., Langen, J., Lamarre, D., Stark, H., and Courrèges-Lacoste, G. B.: Requirements for the GMES atmosphere service and ESA's implementation concept: Sentinels-4/-5 and -5p, Remote Sens. Environ., 120, 58–69, https://doi.org/10.1016/j.rse.2012.01.023, 2012.
Judd, L. M., Al-Saadi, J. A., Szykman, J. J., Valin, L. C., Janz, S. J., Kowalewski, M. G., Eskes, H. J., Veefkind, J. P., Cede, A., Mueller, M., Gebetsberger, M., Swap, R., Pierce, R. B., Nowlan, C. R., Abad, G. G., Nehrir, A., and Williams, D.: Evaluating Sentinel-5P TROPOMI tropospheric NO2 column densities with airborne and Pandora spectrometers near New York City and Long Island Sound, Atmos. Meas. Tech., 13, 6113–6140, https://doi.org/10.5194/amt-13-6113-2020, 2020.
Kim, J.: GEMS (Geostationary Environment Monitoring Spectrometer) onboard the GeoKOMPSAT to monitor air quality in high temporal and spatial resolution over Asia-Pacific Region, EGU General Assembly, Vienna, Austria, 22–27 April 2012, EGU2012-4051, 2012.
Lamarque, J.-F., Emmons, L. K., Hess, P. G., Kinnison, D. E., Tilmes, S., Vitt, F., Heald, C. L., Holland, E. A., Lauritzen, P. H., Neu, J., Orlando, J. J., Rasch, P. J., and Tyndall, G. K.: CAM-chem: description and evaluation of interactive atmospheric chemistry in the Community Earth System Model, Geosci. Model Dev., 5, 369–411, https://doi.org/10.5194/gmd-5-369-2012, 2012.
Lamsal, L. N., Martin, R. V., Padmanabhan, A., van Donkelaar, A., Zhang, Q., Sioris, C. E., Chance, K., Kurosu, T. P., and Newchurch, M. J.: Application of satellite observations for timely updates to global anthropogenic NOx emission inventories, Geophys. Res. Lett., 38, L05810, https://doi.org/10.1029/2010gl046476, 2011.
Lamsal, L. N., Krotkov, N. A., Vasilkov, A., Marchenko, S., Qin, W., Yang, E.-S., Fasnacht, Z., Joiner, J., Choi, S., Haffner, D., Swartz, W. H., Fisher, B., and Bucsela, E.: Ozone Monitoring Instrument (OMI) Aura nitrogen dioxide standard product version 4.0 with improved surface and cloud treatments, Atmos. Meas. Tech., 14, 455–479, https://doi.org/10.5194/amt-14-455-2021, 2021.
Lamsal, L. N., Krotkov, N. A., Marchenko, S. V., Joiner, J., Oman, L., Vasilkov, A., Fisher, B., Qin, W., Yang, E.-S., Fasnacht, Z., Choi, S., Leonard, P., and Haffner, D.: TROPOMI/S5P NO2 Tropospheric, Stratospheric and Total Columns MINDS 1-Orbit L2 Swath 5.5 km x 3.5 km, NASA Goddard Space Flight Center, Goddard Earth Sciences Data and Information Services Center (GES DISC) [data set], https://doi.org/10.5067/MEASURES/MINDS/DATA203, 2022.
Laughner, J. L. and Cohen, R. C.: Direct observation of changing NOx lifetime in North American cities, Science, 366, 723–727, https://doi.org/10.1126/science.aax6832, 2019.
Laughner, J. L., Zare, A., and Cohen, R. C.: Effects of daily meteorology on the interpretation of space-based remote sensing of NO2, Atmos. Chem. Phys., 16, 15247–15264, https://doi.org/10.5194/acp-16-15247-2016, 2016.
Laughner, J. L., Neu, J. L., Schimel, D., Wennberg, P. O., Barsanti, K., Bowman, K. W., Chatterjee, A., Croes, B. E., Fitzmaurice, H. L., Henze, D. K., Kim, J., Kort, E. A., Liu, Z., Miyazaki, K., Turner, A. J., Anenberg, S., Avise, J., Cao, H., Crisp, D., de Gouw, J., Eldering, A., Fyfe, J. C., Goldberg, D. L., Gurney, K. R., Hasheminassab, S., Hopkins, F., Ivey, C. E., Jones, D. B. A., Liu, J., Lovenduski, N. S., Martin, R. V., McKinley, G. A., Ott, L., Poulter, B., Ru, M., Sander, S. P., Swart, N., Yung, Y. L., and Zeng, Z.-C.: Societal shifts due to COVID-19 reveal large-scale complexities and feedbacks between atmospheric chemistry and climate change, P. Natl. Acad. Sci. USA, 118, e2109481118, https://doi.org/10.1073/pnas.2109481118, 2021.
Liu, F., Beirle, S., Zhang, Q., Dörner, S., He, K., and Wagner, T.: NOx lifetimes and emissions of cities and power plants in polluted background estimated by satellite observations, Atmos. Chem. Phys., 16, 5283–5298, https://doi.org/10.5194/acp-16-5283-2016, 2016a.
Liu, F., Zhang, Q., A, R. J. van der, Zheng, B., Tong, D., Yan, L., Zheng, Y., and He, K.: Recent reduction in NOx emissions over China: synthesis of satellite observations and emission inventories, Environ. Res. Lett., 11, 114002, https://doi.org/10.1088/1748-9326/11/11/114002, 2016b.
Liu, F., Beirle, S., Zhang, Q., van der A, R. J., Zheng, B., Tong, D., and He, K.: NOx emission trends over Chinese cities estimated from OMI observations during 2005 to 2015, Atmos. Chem. Phys., 17, 9261–9275, https://doi.org/10.5194/acp-17-9261-2017, 2017.
Liu, F., Choi, S., Li, C., Fioletov, V. E., McLinden, C. A., Joiner, J., Krotkov, N. A., Bian, H., Janssens-Maenhout, G., Darmenov, A. S., and da Silva, A. M.: A new global anthropogenic SO2 emission inventory for the last decade: a mosaic of satellite-derived and bottom-up emissions, Atmos. Chem. Phys., 18, 16571–16586, https://doi.org/10.5194/acp-18-16571-2018, 2018.
Liu, F., Page, A., Strode, S. A., Yoshida, Y., Choi, S., Zheng, B., Lamsal, L. N., Li, C., Krotkov, N. A., Eskes, H., van der A, R., Veefkind, P., Levelt, P. F., Hauser, O. P., and Joiner, J.: Abrupt decline in tropospheric nitrogen dioxide over China after the outbreak of COVID-19, Science Advances, 6, eabc2992, https://doi.org/10.1126/sciadv.abc2992, 2020.
Liu, F., Tao, Z., Beirle, S., Joiner, J., Yoshida, Y., Smith, S. J., Knowland, K. E., and Wagner, T.: A new method for inferring city emissions and lifetimes of nitrogen oxides from high-resolution nitrogen dioxide observations: a model study, Atmos. Chem. Phys., 22, 1333–1349, https://doi.org/10.5194/acp-22-1333-2022, 2022.
Lu, Z., Streets, D. G., de Foy, B., Lamsal, L. N., Duncan, B. N., and Xing, J.: Emissions of nitrogen oxides from US urban areas: estimation from Ozone Monitoring Instrument retrievals for 2005–2014, Atmos. Chem. Phys., 15, 10367–10383, https://doi.org/10.5194/acp-15-10367-2015, 2015.
Lucchesi, R.: File Specification for GEOS-5 FP-IT, Version 1.3, GMAO Office Note No. 2, 60 pp., http://gmao.gsfc.nasa.gov/pubs/office_notes (last access: 15 March 2024), 2015.
Ma, S. and Tong, D. Q.: Neighborhood Emission Mapping Operation (NEMO): A 1-km anthropogenic emission dataset in the United States, Sci. Data, 9, 680, https://doi.org/10.1038/s41597-022-01790-9, 2022.
Martin, R. V., Jacob, D. J., Chance, K., Kurosu, T. P., Palmer, P. I., and Evans, M. J.: Global inventory of nitrogen oxide emissions constrained by space-based observations of NO2 columns, J. Geophys. Res., 108, 4537, https://doi.org/10.1029/2003jd003453, 2003.
McDonald, B. C., McKeen, S. A., Cui, Y. Y., Ahmadov, R., Kim, S.-W., Frost, G. J., Pollack, I. B., Peischl, J., Ryerson, T. B., Holloway, J. S., Graus, M., Warneke, C., Gilman, J. B., de Gouw, J. A., Kaiser, J., Keutsch, F. N., Hanisco, T. F., Wolfe, G. M., and Trainer, M.: Modeling ozone in the eastern U.S. using a fuel-based mobile source emissions inventory, Environ. Sci. Technol., 52, 7360–7370, https://doi.org/10.1021/acs.est.8b00778, 2018.
Miyazaki, K., Eskes, H., Sudo, K., Boersma, K. F., Bowman, K., and Kanaya, Y.: Decadal changes in global surface NOx emissions from multi-constituent satellite data assimilation, Atmos. Chem. Phys., 17, 807–837, https://doi.org/10.5194/acp-17-807-2017, 2017.
Miyazaki, K., Bowman, K., Sekiya, T., Takigawa, M., Neu, J. L., Sudo, K., Osterman, G., and Eskes, H.: Global tropospheric ozone responses to reduced NOx emissions linked to the COVID-19 worldwide lockdowns, Science Advances, 7, eabf7460, https://doi.org/10.1126/sciadv.abf7460, 2021.
Peters-Lidard, C. D., Kemp, E. M., Matsui, T., Santanello, J. A., Kumar, S. V., Jacob, J. P., Clune, T., Tao, W.-K., Chin, M., Hou, A., Case, J. L., Kim, D., Kim, K.-M., Lau, W., Liu, Y., Shi, J., Starr, D., Tan, Q., Tao, Z., Zaitchik, B. F., Zavodsky, B., Zhang, S. Q., and Zupanski, M.: Integrated modeling of aerosol, cloud, precipitation and land processes at satellite-resolved scales, Environ. Model. Softw., 67, 149–159, https://doi.org/10.1016/j.envsoft.2015.01.007, 2015.
Platt, U. and Stutz, J.: Differential absorption spectroscopy, Berlin and Heidelberg, Germany, Springer, 91–99, 135–159, https://doi.org/10.1007/978-3-540-75776-4_6, 2008.
Qu, Z., Henze, D. K., Theys, N., Wang, J., and Wang, W.: Hybrid mass balance/4D-Var joint inversion of NOx and SO2 emissions in East Asia, J. Geophys. Res., 124, 8203–8224, https://doi.org/10.1029/2018JD030240, 2019.
Seinfeld, J. H. and Pandis, S. N.: Atmospheric chemistry and physics: From air pollution to climate change, 2nd edn., John Wiley and Sons, New York, 204–275, ISBN 978-0471178163, 2006.
Souri, A. H., Choi, Y., Jeon, W., Li, X., Pan, S., Diao, L., and Westenbarger, D. A.: Constraining NOx emissions using satellite NO2 measurements during 2013 DISCOVER-AQ Texas campaign, Atmos. Environ., 131, 371–381, https://doi.org/10.1016/j.atmosenv.2016.02.020, 2016.
Sun, K.: Derivation of emissions from satellite-observed column amounts and its application to TROPOMI NO2 and CO observations, Geophys. Res. Lett., 49, e2022GL101102, https://doi.org/10.1029/2022GL101102, 2022.
Tack, F., Merlaud, A., Iordache, M.-D., Pinardi, G., Dimitropoulou, E., Eskes, H., Bomans, B., Veefkind, P., and Van Roozendael, M.: Assessment of the TROPOMI tropospheric NO2 product based on airborne APEX observations, Atmos. Meas. Tech., 14, 615–646, https://doi.org/10.5194/amt-14-615-2021, 2021.
Tao, Z., Santanello, J. A., Chin, M., Zhou, S., Tan, Q., Kemp, E. M., and Peters-Lidard, C. D.: Effect of land cover on atmospheric processes and air quality over the continental United States – a NASA Unified WRF (NU-WRF) model study, Atmos. Chem. Phys., 13, 6207–6226, https://doi.org/10.5194/acp-13-6207-2013, 2013.
Tao, Z., Kawa, S. R., Jacob, J. P., Liu, D. Y., Collatz, G. J., Wang, J. S., Ott, L. E., and Chin, M.: Application of NASA-Unified WRF model to carbon dioxide simulation- model development and evaluation, Environ. Model. Softw., 132, 104785, https://doi.org/10.1016/j.envsoft.2020.104785, 2020.
Travis, K. R., Jacob, D. J., Fisher, J. A., Kim, P. S., Marais, E. A., Zhu, L., Yu, K., Miller, C. C., Yantosca, R. M., Sulprizio, M. P., Thompson, A. M., Wennberg, P. O., Crounse, J. D., St. Clair, J. M., Cohen, R. C., Laughner, J. L., Dibb, J. E., Hall, S. R., Ullmann, K., Wolfe, G. M., Pollack, I. B., Peischl, J., Neuman, J. A., and Zhou, X.: Why do models overestimate surface ozone in the Southeast United States?, Atmos. Chem. Phys., 16, 13561–13577, https://doi.org/10.5194/acp-16-13561-2016, 2016.
van Geffen, J., Eskes, H., Compernolle, S., Pinardi, G., Verhoelst, T., Lambert, J.-C., Sneep, M., ter Linden, M., Ludewig, A., Boersma, K. F., and Veefkind, J. P.: Sentinel-5P TROPOMI NO2 retrieval: impact of version v2.2 improvements and comparisons with OMI and ground-based data, Atmos. Meas. Tech., 15, 2037–2060, https://doi.org/10.5194/amt-15-2037-2022, 2022.
Veefkind, J. P., Aben, I., McMullan, K., Förster, H., de Vries, J., Otter, G., Claas, J., Eskes, H. J., de Haan, J. F., Kleipool, Q., van Weele, M., Hasekamp, O., Hoogeveen, R., Landgraf, J., Snel, R., Tol, P., Ingmann, P., Voors, R., Kruizinga, B., Vink, R., Visser, H., and Levelt, P. F.: TROPOMI on the ESA Sentinel-5 Precursor: A GMES mission for global observations of the atmospheric composition for climate, air quality and ozone layer applications, Remote Sens. Environ., 120, 70–83, 2012.
Verhoelst, T., Compernolle, S., Pinardi, G., Lambert, J.-C., Eskes, H. J., Eichmann, K.-U., Fjæraa, A. M., Granville, J., Niemeijer, S., Cede, A., Tiefengraber, M., Hendrick, F., Pazmiño, A., Bais, A., Bazureau, A., Boersma, K. F., Bognar, K., Dehn, A., Donner, S., Elokhov, A., Gebetsberger, M., Goutail, F., Grutter de la Mora, M., Gruzdev, A., Gratsea, M., Hansen, G. H., Irie, H., Jepsen, N., Kanaya, Y., Karagkiozidis, D., Kivi, R., Kreher, K., Levelt, P. F., Liu, C., Müller, M., Navarro Comas, M., Piters, A. J. M., Pommereau, J.-P., Portafaix, T., Prados-Roman, C., Puentedura, O., Querel, R., Remmers, J., Richter, A., Rimmer, J., Rivera Cárdenas, C., Saavedra de Miguel, L., Sinyakov, V. P., Stremme, W., Strong, K., Van Roozendael, M., Veefkind, J. P., Wagner, T., Wittrock, F., Yela González, M., and Zehner, C.: Ground-based validation of the Copernicus Sentinel-5P TROPOMI NO2 measurements with the NDACC ZSL-DOAS, MAX-DOAS and Pandonia global networks, Atmos. Meas. Tech., 14, 481–510, https://doi.org/10.5194/amt-14-481-2021, 2021.
Wang, P., Piters, A., van Geffen, J., Tuinder, O., Stammes, P., and Kinne, S.: Shipborne MAX-DOAS measurements for validation of TROPOMI NO2 products, Atmos. Meas. Tech., 13, 1413–1426, https://doi.org/10.5194/amt-13-1413-2020, 2020.
Woodard, D., Branham, M., Buckingham, G., Hogue, S., Hutchins, M., Gosky, R., Marland, G., and Marland, E.: A spatial uncertainty metric for anthropogenic CO2 emissions, Greenhouse Gas Measurement and Management, 4, 139–160, https://doi.org/10.1080/20430779.2014.1000793, 2014.