the Creative Commons Attribution 4.0 License.
the Creative Commons Attribution 4.0 License.
 | 15 Mar 2024
Oxidative potential apportionment of atmospheric PM1: a new approach combining high-sensitive online analysers for chemical composition and offline OP measurement technique
Julie Camman
Nicolas Marchand
Amandine Durand
Grégory Gille
Ludovic Lanzi
Jean-Luc Jaffrezo
Henri Wortham
Gaëlle Uzu
Source apportionment models were widely used to successfully assign highly time-resolved aerosol data to specific emissions and/or atmospheric chemical processes. These techniques are necessary for targeting the sources affecting air quality and for designing effective mitigation strategies. Moreover, evaluation of the toxicity of airborne particulate matter is important since the classically measured particulate matter (PM) concentrations appear insufficient for characterizing the impact on human health. Oxidative potential (OP) measurement has recently been developed to quantify the capability of PM to induce an oxidative imbalance in the lungs. As a result, this measurement unit could be a better proxy than PM mass concentration to represent PM toxicity. In the present study, two source apportionment analyses were performed using positive matrix factorization (PMF) from organic aerosol (OA) mass spectra measured at a 15 min time resolution using a time-of-flight aerosol chemical speciation monitor (ToF-ACSM) and from 19 trace elements measured on an hourly basis using an online metal analyser (Xact 625i). The field measurements were carried out in summer 2018. While it is common to perform PMF studies individually on ACSMs and more recently on Xact datasets, here we used a two-step methodology leading to a complete PM1 source apportionment. The outputs from both OA PMF and Xact PMF, the inorganic species concentrations from the ACSM, and the black carbon (BC) fractions (fossil fuel and wood burning) measured using an Aethalometer (AE33) were gathered into a single dataset and subjected to a combined PMF analysis. Overall, eight factors were identified, each of them corresponding to a more precise source than performing single PMF analyses. The results show that besides the high contribution of secondary ammonium sulfate (28 %) and organic nitrate (19 %), about 50 % of PM1 originated from distinct combustion sources, including emissions from traffic, shipping, industrial activities, cooking, and biomass burning. Simultaneously, PM1 filters were collected during the experimental period on a 4 h sampling basis. On these filters, two acellular OP assays were performed (dithiothreitol; OPDTT and ascorbic acid; OPAA) and an inversion method was applied on factors issued from all PMFs to assess the contribution of the PM sources to the OP. This work highlights the sensitivity of OPAA to industrial and dust resuspension sources and those of OPDTT to secondary ammonium sulfate, shipping, and biomass burning.
- Article
(3276 KB) - Full-text XML
-
Supplement
(2964 KB) - BibTeX
- EndNote


Airborne particulate matter (PM) is a significant contributor to air pollution, leading to adverse effects on ecosystems, climate stability, and the environment (Beelen et al., 2014; Cohen, 2017; Jacob, 1999). Air quality is currently a major public health outcome and is responsible for 4.2 million premature deaths worldwide each year (WHO, 2021). More worryingly, this figure is expected to double by 2050 (Lelieveld et al., 2015). However, the links between air pollution and human health effects are not fully understood yet, but PM appears to be a key pollutant in aerosol toxicity (Medina et al., 2016; Zhang et al., 2016). Depending on the size and chemical composition of the particles, PM may cause significant damage to pulmonary cells due to the ability of particles to penetrate deeply into the organism and induce inflammatory responses in lung cells (Strak et al., 2012). There has been growing interest in recent years in submicron aerosol PM1, which are deposited deeply in the respiratory system, reaching the alveoli of the lungs (Sturm, 2020). PM1 are associated with the physicochemical processing of compounds also resulting from anthropogenic sources, mainly combustion sources, and are known to contribute to the health impacts of PM (Grigas et al., 2017; Manigrasso et al., 2020).
Although an increasing number of studies investigated the potential effects of submicron particles on the risk of respiratory diseases, this subject still represents a research line that needs further toxicological and epidemiological studies (Hu et al., 2022). It was recently shown that these particles are strongly linked to the occurrence of cardiovascular disease, perhaps due to the higher surface-to-volume ratio (Münzel et al., 2022). While the air quality guidelines regarding PM levels were recently updated for PM10 and PM2.5 (WHO, 2021), no regulation for PM1 has yet been established, and several studies suggest their monitoring should be considered in this respect (Kumar et al., 2010).
While all mechanisms leading to the toxicity of airborne particles are not fully established to date, it is generally believed that the activity of reactive oxygen species (ROS) could play an important role. These chemical species that are carried or induced in the lung are suspected of disrupting the natural redox balance, causing oxidative stress, a key factor in the inflammatory response in the organism, ultimately leading to diseases such as asthma or chronic bronchitis (Abrams et al., 2017; Dellinger et al., 2001; Møller, 2014; Pope, 2004). Thus, new approaches have been investigated over the past two decades to better quantify oxidative stress and, ultimately, the impact that exposure to airborne particulate pollution has on the population. Indeed, the measurement the of oxidative potential (OP) of PM is seen as a new promising metric and probably a better representative proxy of health impacts than the PM mass concentration, as it quantifies the ability to generate ROS in vivo. OP measurements integrate many properties of PM that are important for the interactions with lung fluid, such as size distribution, specific surface area, or PM chemical composition (Ayres et al., 2008). Indeed, changes in the chemical composition of aerosol and consequently the type of sources from which they are emitted may lead to a significant difference in airborne particle toxicity (Boogaard et al., 2012). Furthermore, previous studies showed the value of fine-mode particles in understanding the oxidative effects of PM (Chen et al., 2017).
An active field of research for air quality is understanding the emission sources of PM through source apportionment techniques, using approaches such as statistical receptor models (e.g. chemical mass balance (CMB) or positive matrix factorization (PMF)) (Paatero and Tapper, 1994). PMF, which is widely used in the community, can be based on data from online analysers such as aerosol mass spectrometers (AMSs) and aerosol chemical speciation monitors (ACSMs), which determine the resolution of organic mass spectra with high sensitivity (Bozzetti et al., 2017a; Chen et al., 2022; Crippa et al., 2013b) or from off-line filters analyses (Borlaza et al., 2021, 2022).
Several methods have been explored to combined datasets from various online analysers to perform PMF. Some studies proposed the combination of high-resolution AMS and proton transfer reaction–mass spectrometry (PTR-MS) measurements to refine the links between particle-phase organics and their precursors (Crippa et al., 2013a; Slowik et al., 2010). Some others performed source apportionment by including both organic and inorganic fractions from the AMS (Äijälä et al., 2019; McGuire et al., 2014; Sun et al., 2012), improving the resolution of the factors and their chemical nature. More recently, Zografou et al. (2022) performed PMF analysis on a combined organic and inorganic year-long dataset from a ToF-ACSM. Tong et al. (2022) combined into a single dataset AMS and extractive electrospray ionization time-of-flight mass spectrometry (EESI-ToF) measurements providing an optimized identification and quantification of the organic factors, more specifically the SOA fraction. Nursanto et al. (2023) also tried a hybrid approach by combining organic aerosol concentrations from a ToF-ACSM with the particle size distribution from a scanning mobility particle sizer (SMPS) and resolved organic factors related to new particle formation and growth.
However, more efforts are needed to combine instrument datasets and apportion the sources of the total PM1 fraction. A multi-time resolution approach was suggested by Via et al. (2023) mixing PM1 data from online analysers and offline filters.
Belis et al. (2019) conducted three separated PMF analyses (on offline filter data, online organic data, and online inorganic species) which produced reference profiles to constrain a fourth PMF with combined online data. Petit et al. (2014) also followed a multi-step methodology (PMF2) comprising the use of results from the first PMF runs as inputs for their combined PMF using ACSM and Aethalometer (AE33) data. To our knowledge, no other study has performed this type of PMF2 approach, in particular for all PM1 components. A known drawback of performing PMF on OA mass spectra from ACSM or AMS is the resolution of the secondary organic aerosol (SOA) origin. SOA factors are usually reported as either a single factor or two factors separated by their degree of oxygenation rather than in terms of sources. A PMF2 approach using previous OA factors combined with other species and/or PMF factors may enable a more accurate identification and quantification of the SOA fraction in the PM sources. The current study addresses this challenge by using the PMF2 method for the PM1 fraction measured with online analysers (i.e. ToF-ACSM, Xact 625i, and AE33) at a high time resolution (< 1 h).
While the study of the relationship between the OP and single compounds is a step forward in understanding the chemical mechanisms involved, it seems unrealistic to characterize the OP of the aerosol as a whole in this way, given the myriad of chemical elements that make up the aerosol. A more integrative approach is to consider OP sources since aerosol is a complex mixture where synergistic and antagonistic effects can occur (Yu et al., 2018). This enables an estimation of intrinsic OP of sources but also of their contribution to a population's health-related exposure, which is more practical for adapting air quality management policies (Borlaza et al., 2018; Calas et al., 2019; Fang et al., 2016; Grange et al., 2022; Verma et al., 2014; Weber et al., 2018; Yu et al., 2019).
Major insights have been gained from OP measurements on filters. Many studies, based on filters collected at different sites, have established associations between OP and PM sources, thus improving our understanding of the health impact of specific types of airborne particles (Borlaza et al., 2022; Daellenbach et al., 2020; Fang et al., 2016; Weber et al., 2021). However, the next step is to develop online OP measurements to understand one-time extreme events and ultimately enable near-real-time (NRT) OP acquisition for better air quality management.
To make progress in this direction, here we propose to investigate the submicron aerosol sources – highly relevant in health impacts (Lin et al., 2020) – contributing most to two types of OP (ascorbic acid assay (OPAA) and dithiothreitol assay (OPDTT)) in a challenging environment, the Marseille area. Effectively, the activity of the industrial port complex and several industrial areas close to this highly urbanized city, combined with specific meteorological conditions (wind regimes and significant photochemistry in summer), involves frequent pollution episodes (Chazeau et al., 2022, 2021; Salameh et al., 2018). A challenging double-PMF method using chemical online analysers (ToF-ACSM, Xact, and the Aethalometer) is proposed as a first step. High-frequency acquisition of OP observations with filter sampling every 4 h for 7 weeks was then coupled to these data. On this basis, an OP source apportionment using a multilinear regression approach is provided. This method enables an estimation of the oxidizing capacity of each µg of PM1 from the emission sources identified but also the relative contribution of each source to OPAA and OPDTT on a 4 h basis. The complementarity of these assays gives a broader and more representative view of the PM1 health impact.
2.1 Site and sampling
2.1.1 Site
The Marseille-Longchamp supersite is an urban background site of Marseille – the second most populated city in France (about 870 000 inhabitants, with a density of 3600 inhabitants per km2 in 2019). The site is located in the heart of the Parc Longchamp, in the fourth district of Marseille (43° N; 5°23′41; m a.s.l.). Figure 1 shows the site location in the city and the main areas in the surroundings with the maritime port of Marseille within 2 km and industrial areas within 30 km with petroleum refining, coke production, and steel facility activities (Salameh et al., 2018). In addition to shipping and local industrial sources, Marseille suffers from the second largest traffic congestions in France, generating a year-round source of background traffic (Chazeau et al., 2021). The location of the city also leads to influences of natural and biogenic emissions such as marine aerosol, terrestrial vegetation, Saharan dust, or crustal dust. Finally, secondary organic aerosol (SOA) formation events and high ozone concentrations formed by intense photochemistry are frequent during warm periods in the area (El Haddad et al., 2013; Flaounas et al., 2009).
2.1.2 Sampling campaign
The sampling campaign and site have been detailed elsewhere (Chazeau et al., 2022). Briefly, the field work took place during the summer of 2018 over a 7-week period (from 11 July to 1 September 2018). The sampling station was equipped with a range of analytical instruments for characterization of submicron aerosols: a time-of-flight aerosol chemical speciation monitor (ToF-ACSM; Fröhlich et al., 2013) to measure in near real time (10 min resolution) the chemical composition of non-refractory PM1 (organic aerosol, NH, NO, SO, and Cl−); the dual-spot Magee Scientific AE33 Aethalometer (Drinovec et al., 2015) equipped with a PM2.5 cut-off inlet to measure the equivalent black carbon concentrations (BC: with a distinction between BCFF and BCWB origins) at a 1 min resolution; and a Xact625i (Cooper Environmental) to measure a user-defined list of 25 PM1 trace elements with a time resolution of 60 min. PM1, PM2.5, and PM10 mass concentrations were determined with an optical particle counter (FIDAS 200; PALAS). A 3D sonic anemometer for temperature, wind direction, and velocity measurements and O3, NOx, and SO2 analysers are also amongst the permanent instruments of the station. Finally, PM1 collection for OP analysis was performed for 15 d (from 11 July and 25 July 2018) every 4 h on 150 mm diameter quartz fibre filters (Whatman Tissuquartz; pre-heated at 500 °C for 8 h), using a high-volume aerosol sampler (HiVol, Digitel DA80) at a flow rate of 30 m3 h−1. A total of 90 samples and four blank filters were collected with a time resolution of 4 h. Procedural care for filter handling, sampling, and storage was taken to avoid contamination and modification of the filter deposit after sampling (Weber et al., 2018).
All the instruments ran acquisitions during the whole campaign period (i.e. 11 July to 1 September 2018). However, it should be noted that ToF-ACSM stopped between 12 July 2018 19:00 and 13 July 2018 03:00 (UTC) and between 14 July 2018 15:00 and 15 July 2018 03:00 (UTC), which means the number of filter samples decreased to 83 instead of 90 for the OP deconvolution model discussed below.
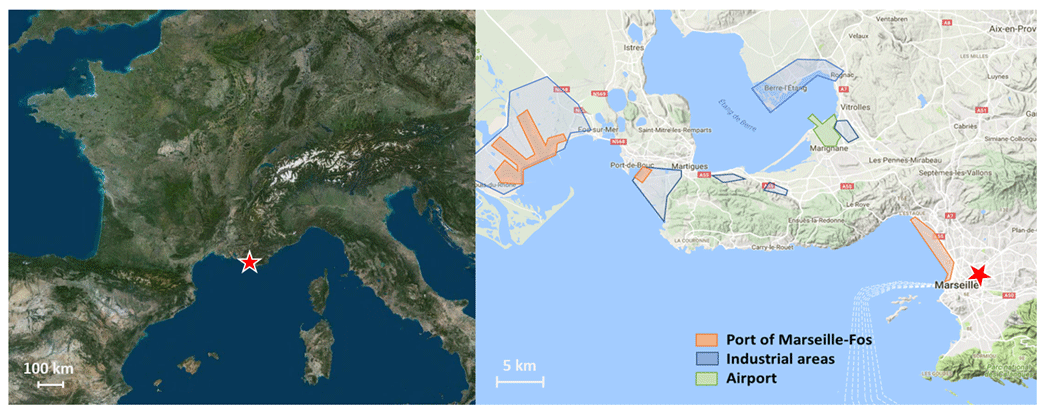
Figure 1Location of the Marseille-Longchamp supersite and localization of the main industrial areas around Marseille, France (© PlanetObserver, Geoportail/© Google Maps).
2.2 OP analysis
OP was assessed by the depletion rate of anti-oxidant compounds, using two methods with dithiothreitol (DTT) and ascorbic acid (AA) (Calas et al., 2019, 2018, 2017). DTT depletion in contact with PM extracts was determined by dosing the remaining amount of DTT with dithionitrobenzoic acid (DTNB) at different reaction times (0, 15, and 30 min), and absorbency was measured at 412 nm using a plate spectrophotometer (Tecan, M200 Infinite). Briefly, 25 µM of DTT and phosphate buffer react for 30 min with PM suspensions at 25 µg mL−1 in a simulated lining fluid. The AA assay is a simplified version of the synthetic respiratory tract lining fluid (RTLF) assay (Kelly, 2003), where only AA is used. A mix of 80 µL of PM suspension with 24 nmol of AA (100 µL of 0.24 mM AA solution in Milli-Q water) is used, and AA depletion is read continuously for 30 min by absorbency at 265 nm (TECAN, M1000 Infinite). The depletion rate of AA was determined by linear regression of the linear section data. For both assays, a 96-well plate was auto-shaken for 3 s before each measurement and kept at physiological conditions (37.4 °C).
Three filter blanks (laboratory blanks) and three positive controls (1,4-naphthoquinone, 24.7 µmol L−1) were included in each plate (AA and DTT). The average values of these blanks were then subtracted from the sample measurements of the given plate. The detection limit value was defined as 3 times the standard deviation of laboratory blank measurements (laboratory blank filters in Gamble + DPPC solution). Three replicates are performed with two absorbance measurements at each time. The short duration of the sampling time (4 h), the type of PM fraction (PM1), and consequently the low mass recovered on each filter resulted in some OP replicate measurements being below the detection limit, suggesting the highest uncertainties in these results as is usual for such measurements (Calas et al., 2018; Weber et al., 2021). A propagation of these uncertainties was carried out (on average 15 % of the OP measurement) to deal with thus issue. Hereafter, the OP normalized in volume relative to the AA assay and the DTT assay is denoted OP and OP, respectively.
2.3 Source apportionment using positive matrix factorization
Source apportionment was performed through the positive matrix factorization (PMF; Paatero and Tapper, 1994) method using the multi-linear engine (ME-2) solver (Paatero, 1999) and run within the Source Finder Professional (SoFi Pro) software (Datalystica Ltd., Villigen, Switzerland; Canonaco et al., 2021, 2013). PMF is a bilinear unmixing model widely used to determine the atmospheric aerosol sources based on online measurements (Canonaco et al., 2021; Chazeau et al., 2022; Chen et al., 2022). The equation is described as follows:
with xi,j a non-negative matrix of measurements which is factorized into gi,k the factor time series, fk,j the factor profiles, and ei,j the model residuals. The indexes i, j, k, and n are the time, variables, discrete factor numbers, and total number of factors in a solution, respectively.
ME-2 solves the model solution by using a least squares algorithm to iteratively minimize the following object function Q defined as the sum of the squared model residuals weighted by their respective uncertainties (σij):
Generally, the PMF model does not result in a mathematically unique solution as a multiple combination of fk,j and gi,k may provide a similar value of Q. ME-2 allows us to introduce a priori information in the model using known source profiles or time series to orient solutions towards environmentally meaningful rotations (Paatero, 1999; Paatero and Hopke, 2009). An advantage of SoFi Pro is that it makes it possible to control the rotational ambiguity of the solution by applying constraints with the a-value approach (Canonaco et al., 2013):
where the scalar a defines the range (between 0 and 1) to which and can vary from the known input profile (fkj) or time series (gik).
In the current study, source apportionment was conducted using the PMF model on three distinct datasets. In the first two analyses, PMF was applied separately to the OA dataset (PMForganics) and the Xact dataset (PMFmetals). As a second step, the outputs from the previous source apportionment analyses, the inorganic species concentrations from the ToF-ACSM measurements (NO, NH, SO, and Cl−), and the deconvolved BC source (BCFF and BCWB) concentrations from the AE33 were combined into a single dataset to perform a total PM1 source apportionment (PMF.
2.4 PMF preparation and optimization
2.4.1 OA dataset
ACSM data were acquired with the Igor-based Acquility v2.1.4 software and analysed with Tofware v3.2 also developed in Igor Pro (Wave Metric inc., Lake Oswego, Oregon, USA). The data treatment including ionization efficiency (IE) and relative ionization efficiency (RIE) calibrations, collection efficiency (CE) correction, and detection limit determination is detailed in Chazeau et al. (2021). The complete PMF methodology and optimization applied to OA mass spectra at MRS-LCP are described in a dedicated paper (Chazeau et al., 2022) and we will provide only a brief summary here. The model is performed on data input including 185 variables from 12 to 214 and 4422 time steps (15 min intervals) from 1 July to 1 September 2018. The error matrix was exported from the Tofware software and the calculation included ion counting statistics, background errors, electronic noise, and a minimum error from the measurement of a single ion.
A five-factor solution was resolved with three constrained and two unconstrained factors. Both hydrocarbon-like organic aerosol (HOA) and cooking-like organic aerosol (COA) factor profiles were constrained using the reference profiles from Ng et al. (2011) and Crippa et al. (2013b), respectively. Shipping and industrial organic aerosol (Sh-IndOA) factor time series were constrained with the SO2 concentrations as this is a specific proxy for these emissions in the Marseille area (El Haddad et al., 2013). The a-value ranges for these constraints were optimized based on previous sensitivity analyses (Chazeau et al., 2022) and random a values of 0–0.6, 0–0.2 and 0–0.2 for HOA, COA, and Sh-IndOA, respectively, were retained. The two remaining factors corresponded to the secondary oxygenated organic fraction separated into two components: a less oxidized organic aerosol (LOOA) factor and a more oxidized organic aerosol (MOOA) factor.
In order to explore the rotational ambiguity and statistical uncertainties of the PMF solution, a bootstrap resampling strategy is applied (Efron, 1979), where 100 repeated runs are performed to test the stability of the solution. The inspection of the 100 generated runs was achieved based on a selection of predefined criteria customized within SoFi Pro (Canonaco et al., 2021; Chazeau et al., 2022; Chen et al., 2022, 2021). First, three criteria are defined as acceptance thresholds to evaluate the quality of the PMF runs. The r Pearson correlation (denoted as r hereafter) with BCFF for HOA, the ratio between lunch hours (11:00 and 12:00 UTC) and the average background hours in the morning (06:00–08:00 UTC) for COA, and the r Pearson correlation with SO2 for Sh-IndOA were used. Then, the monitoring of f43 intensity for LOOA and f44 intensity for MOOA are used as repositioning criteria to avoid mixing of the unconstrained factors since they are not sorted automatically among the different PMF iterations. The bootstrapped runs fulfilling the criteria list were then averaged into a unique PMF solution.
2.4.2 Xact dataset
The PMFmetals was performed on the Xact data matrix of hourly element concentrations from 11 July to 1 September 2018. First, some individual species were excluded to improve the quality of the analysis. Elements whose concentrations were below their respective minimum detection limit (MDL) more than 90 % of the time were not included in the inputs (Fig. S1 in the Supplement). The MDLs were provided by the manufacturer and are given in Table S1 in the Supplement. From this approach, the following 17 elements remained: As, Br, Ca, Cd, Cr, Cu, Fe, K, Mn, Ni, Pb, Sb, Se, Sn, Ti, V, and Zn. Co was also included in the inputs as it showed a good correlation with the Ni element (R2=0.5).
A PMF error matrix (σi, j) was estimated using Eq. 5 for concentrations greater than the MDL (Reff et al., 2007; Ryder et al., 2020):
where ui,j is a specific analytical uncertainty for each data point provided by the Xact software. It includes both the uncertainties of the sampling air volume and the uncertainties of the mass spectra deconvolution calculated by the Xact software. For the concentrations below the MDL, the values were replaced by the MDL of metal divided by 2. The corresponding error is often set to 5/6 × MDL (Polissar et al., 1998). Since the relative error for each data point was mostly less than 50 %, Polissar et al. (1998) recommended applying a relative error between 100 % and 250 % for values below the MDLs. In our dataset, some relative errors for data greater than the MDLs were much larger than 50 %. Following Polissar et al. (2001), the elements were down-weighted by using larger error estimates for values below the MDLs. The methodology and the PMF tests panel applied are described in the Supplement Sect. S1. All the data points with a signal-to-noise ratio (S2N) below 1 were down-weighted by adding a penalty function of 1/S2N to the error (Rai et al., 2020; Visser et al., 2015a). The weighting is performed cell-wise as some variables had low average S2N but some high S2N periods.
Intense firework episodes were recorded during the French National Day celebration on 14 July. While it is common to exclude such episodes from the PMF analyses to reduce modelling uncertainties linked to very high concentrations (Ducret-Stich et al., 2013), some studies succeeded in identifying a firework factor profile. Rai et al. (2020) performed a constrained PMF analysis only on the firework hours and identified a firework factor based on the elemental concentration ratio in black powder. The factor profile of fireworks was then constrained in the final complete dataset PMF analysis. Manousakas et al. (2022) ran a PMF on the entire dataset constraining all the source profiles except the firework factor and the time series of all sources. The firework time series were set to 0 except during the corresponding events. In this study, we followed the same logic and the firework hours (13 July 20:00 UTC to 14 July 05:00 UTC; 14 July 20:00 UTC to 15 July 14:00 UTC) were removed from the dataset to inspect the remaining sources. The PMF inputs without the firework points (WFP) consist of 1201 time points with 1 h step and 18 elements. As a second step, PMF analyses were conducted only on firework day (13 and 14 July) points (FDP) to determine a specific profile. The dataset represented 60 time points and 19 variables. In addition to the elements previously selected, Bi was included as it was exclusively associated with the firework events. Bi in the form of bismuth trioxide (Bi2O3) is commonly used instead of the toxic lead forms for crackling fireworks, the so-called dragon's eggs (Mohan, 2010; Perrino et al., 2011). Finally, PMF was performed on the total dataset (1230 time points and 19 variables) by adding a constrained firework factor.
One important step is selecting the number of factors based on both mathematical diagnostics and the environmental meaning of the factors. Solutions with a range of one to eight factors were examined for the WFP dataset. The selection is made based on the changes in ( and on real and noisy unexplained variation (ΔUEVreal, ΔUEVnoisy) when increasing the number of factors (Fig. S2). A large reduction in these values would indicate limited improvements of the model residuals and explained variability. There were no significant changes in ΔUEVreal and ΔUEVnoisy between two and eight factors. However, showed a decrease of up to five factors, meaning the changes in were very low. To relate the factors from the PMF to specific sources, the diurnal trends, the time series of the elements, and a comparison with some external tracers were examined. We could clearly identify five environmentally relevant factors: dust resuspension, shipping, industrial, tire and/or brake wear, and regional background factors. Selecting the six-factor solution results in an unresolved Br-rich factor which cannot be attributed to a specific source or aerosol processes. Therefore, the five-factor solution was chosen as the best representation of the data.
For the FDP dataset, the PMF analysis resolved the same five factors in addition to a firework factor. However, the analysis showed some mixing between the regional background and the firework factors due to the large contribution of K in both factors. To avoid this mixing, the regional background profile was tightly constrained using the profile resolved with the WFP dataset and an a value of 0.1. The runs were repeated 50 times with a bootstrap resampling strategy to test the stability of the solution. This time a well-defined firework factor was resolved (Fig. S3) with an elemental composition in agreement with other studies (see Sect. 3.2.2).
The averaged firework factor profile retrieved from the FDP dataset was used as a constraint for the complete dataset with a values randomly initialized between 0 and 0.5 with an increment of 0.1. This initialization is used to evaluate whether larger deviations could improve the results (Canonaco et al., 2021). The factor time series were also constrained with similar a values and set to 0 except during the firework events. The remaining factors were left unconstrained in the complete dataset solution.
Similarly to the PMForganics methodology, 100 bootstrapped runs are conducted and a criteria-based selection is used to assess the quality and position of the PMF runs (Fig. S4). This statistical selection is described in the Supplement Sect. S2.
2.4.3 Combined PM1 dataset
Following the methodology described by Petit et al. (2014), we combined PMF outputs with the remaining chemical species of PM1. Thus, the factors from both PMForganics and PMFmetals were combined with BCFF, BCWB, NO, NH, SO, and Cl− concentrations. BCWB and BCFF were deconvolved based on the model of Sandradewi et al. (2008). We used the 470 and 950 nm wavelengths with a constant absorption Angström exponent of 1.68 and 1.02 for pure wood burning and traffic, respectively, as recommended by Zotter et al. (2017) and Chazeau et al. (2021).
The uncertainty matrix was constructed as follows: uncertainties for the ToF-ACSM inorganic species were exported with Tofware similarly to those for the organics; BCFF and BCWB uncertainties were estimated based on Eq. 5 and on Eq. S1 in the Supplement, with MDLs set to 0.1 for both species and ui,j, the relative uncertainties, set to 40 % (Petit et al. 2014) multiplied by the species concentrations; PMForganics and PMFmetals outputs errors were taken from the standard deviations of the factor time series from the bootstrap analyses, which can be used as statistical uncertainties (Canonaco et al., 2021).
All the variables were synchronized to a 1 h time resolution corresponding to the 4 h time resolution of the filter sampling, and the missing measurement periods of each instrument were removed from the PMF analysis. The fireworkmetals factor was excluded here since the ToF-ACSM was not running during the main active period of this event (i.e. 14–15 July). Finally, this leads to PMF being performed over 16 variables and 849 time steps.
Since we combined data from three instruments presenting different measurement uncertainty calculations, S2N ratio, and relative numbers of variables, it is necessary to ensure good representativeness of each group in the PMF analysis (Tong et al., 2022). Some studies suggested applying a relative instrument weight to balance the scaled residuals of each subgroup of data (Crippa et al., 2013a; Slowik et al., 2010; Tong et al., 2022; Via et al., 2023). The details about this instrument weighting process are given in the Supplement Sect. S3. As described in Sect. 2.4.2, a cell-wise down-weighting was applied to data points with a weak S2N ratio. PMF runs were performed from 1 to 12 factors to inspect and identify the most physically meaningful factors. Eight factors were clearly determined: biomass burning, cooking, industrial, dust resuspension, traffic, organic nitrate-rich (ON-rich), shipping, and ammonium sulfate-rich (AS-rich) factors. However, conducting different seed runs showed a high degree of rotational ambiguity in the solution, with some unstable factors which cannot be resolved systematically (Table S4).
While it is common to set some variables to 0 in the factor profiles based on prior chemical knowledge of the sources (Bozzetti et al., 2017b; Weber et al., 2019), this method did not enable a clear separation of factors. Here, the entire profiles were constrained for the biomass burning, cooking, and industrial factors using their profiles from the most interpretable solutions as the base case. Profile constraints were applied with an a value of 0.4, 0.1, and 0.05 for biomass burning, cooking, and industrial factors, respectively, leading to a more stable solution.
Further discussions on the factor identification, the rotational ambiguity, the a-value selection for the constrained profiles, and the acceptance criteria are provided in the Supplement Sect. S4. Similarly to the two previous PMF analyses, a bootstrap analysis was conducted over 100 runs and all the accepted runs were averaged into the reported solution.
2.5 OP apportionment
An inversion method is applied on factors issued from all PMFs to assess contributions of the PM sources to the OP. The dependent variable OP expressed in nmol min−1 m−3 is explained by a linear combination of the mass contribution of PM sources (µg m−3) taken as independent variables as follows:
where the OP vector (p×1) is the measured OP (p observations) with a 4 h time resolution, H is a matrix (nx(p+1)) of n sources resolved from the PMF analyses plus the intercept (data of the source PMF with a time step of 1 h have been averaged over the 4 h time step of the OP data), and the ε vector (p×1) accounts for the misfit between the observations and the model. The regression coefficient β provided by the model (Eq. 6) is interpreted as an intrinsic OP of the n sources (nmol min−1 µg−1). Basically, it expresses how much the OP would increase if we increase 1 µg m3 of the given source. The source-specific OP contribution is calculated by multiplying the regression coefficient β of each source by the respective mass contribution of the source to PM. This methodology is essentially based on previous works detailed in Borlaza et al. (2022) and Weber et al. (2021, 2018).
Three scenarios in the construction of the matrix H (Eq. 6), i.e. the contribution of various source factors of PM identified by each of the three PMFs, have been considered to make the best use of the results from the different PMFs. Three models were tested in each scenario (i.e. nine solutions): weighted least squares linear regression (WLS), weighted robust multiple linear regression with an iterative M-estimator, and partial least square regression (PLS). The description of the three scenarios (Eqs. S4, S5, and S6) and the three models (Eqs. S7, S8, and S9) are shown in the Supplement. The best model solutions with the lowest RSR (RMSE standard deviation ratio) are presented: M-estimator in scenarios 1 and 2 (see Table S3) and WLS in scenario 3. Source factor contributions exhibiting a Pearson's association with OP of less than 0.1 were discarded from the predictor variables. Finally, to provide robust estimates of the model output terms in scenario 3, the process was performed 500 times with bootstrapped inputs by following the method of Canonaco et al. (2021). Briefly, 15 % of the input samples were randomly removed or duplicated before each run. Output runs with values below the value found in the first inversion model without bootstrapping (Eq. 6) (i.e. for OPDTT and for OPAA in scenario 3) were removed. Factors with a variance inflation factor (VIF) of > 10 were also removed, because this suggests strong collinearity between them (Calas et al., 2019). Robust linear regression was performed with the MASS package developed in R (Grange et al., 2022; Venables and Ripley, 1997) and weighted linear regression was performed using the stats package developed in R.
3.1 OP results
Meteorological conditions typical of those prevailing during summertime in the region occurred during the period of the study, with land and sea breeze cycles (except between 20 and 24 July), associated with stable conditions characterized by ozone episodes (six regulatory exceedances, with a maximum at 166 µg m−3). NOx, O3, and SO2 average concentrations during the OP apportionment period were, respectively, 20, 80, and 2.5 µg m−3 (Fig. S5). The overall period (n=83 samples) was characterized by an average PM1 concentration of 13.2±3.4 µg m−3.
This study is the first to characterize OP in France with a 4 h time step, providing an overview of the daily OPv variation. Figure 2a shows the difference between night and day and Fig. 2b presents the typical daily OPv variation (without firework episodes), associated with organic fractions of aerosol quantified by ToF-ACSM, metallic fractions of aerosol quantified by Xact, and PM1 variations. The averages were calculated using 15 d during the period. The mass of PM1, the metallic elements of organic aerosol, and the OP are quite higher during the day than at night, while there is no significant variation in OP between night and day. A t test demonstrates no significant difference (p<0.05) between the OPv measured during the day (07:00–23:00 UTC) and the OPv measured at night (23:00–07:00 UTC), for both OP assays. Two ANOVA variance tests were separately performed on OPAA and OPDTT 4 h series, and the result showed no significant difference between the two assays.
Figure S6b presents the composition in major chemical components of PM1 measured by ToF-ACSM, Xact, and AE33 (organic fraction, metallic fraction, NH, Cl−, NO, SO, BCFF, and BCWB), together with the comparison of the reconstructed mass with these chemical components and the PM1 concentration measured with the FIDAS. The Spearman association between these two time series is rs=0.47, p<0.001. Figure S6a shows periods when the reconstructed mass fits well with the mass provided by the FIDAS, and periods when the reconstructed mass is overestimated and/or underestimated.
OPAA and OPDTT median values are, respectively, 0.62 and 1.47 nmol min−1 m−3. Figure 3 shows variations in both OP assays set against PM1 mass. These OP values are characteristic of the coastal environment in warm periods (Calas et al., 2019), but we note that they are rather low compared to many other series (for PM10 or PM2.5) measured with the same methods in other environments (Weber et al., 2018).
Spearman coefficients (rs) between PM1 mass measured by FIDAS and OP display some differences (rs PM1 vs. OP (p<0.01) and rs PM1 vs. OP (p<0.001)) where PM1 has a greater association with OP than with OP. These Spearman coefficients are close to those found by in't Veld et al. (2023) on PM1 all year long in a similar urban coastal environment (Barcelona) (rs PM1 vs. OP (p<0.001) and rs PM1 vs. OP (p<0.001)). The higher association between OP and PM1 compared to OP and PM1 has already been observed in other studies conducted on PM10 (Calas et al., 2019; Weber et al., 2021; Janssen et al., 2014). This phenomenon is attributed to the heightened sensitivity of AA to chemical composition, exhibiting robust specificity. Moreover, DTT demonstrates superior sensitivity to aerosol concentration owing to its more balanced sensitivity to chemical constituents (Gao et al., 2020a).
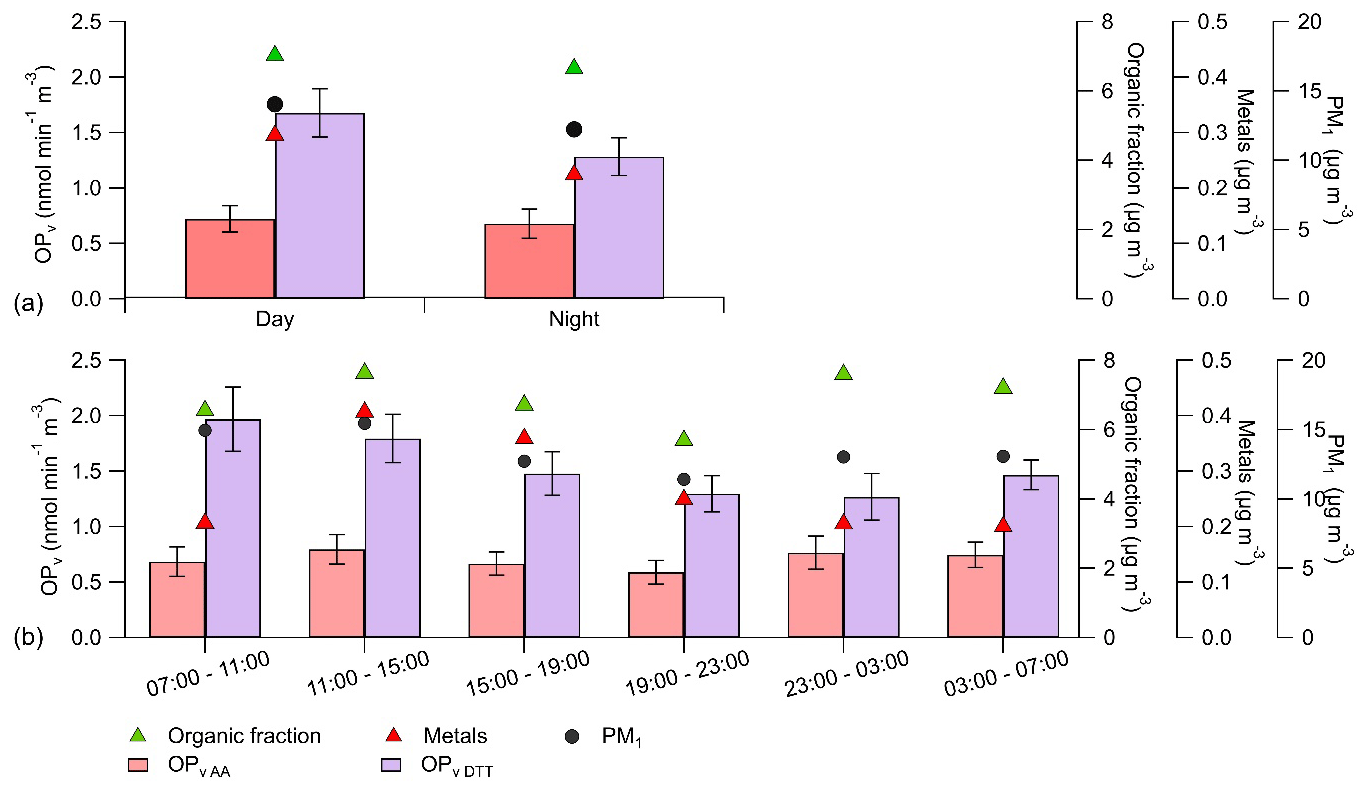
Figure 2Profiles of OP, OP, and organic and metal fractions of submicron aerosol and PM1 during (a) night (23:00–07:00 UTC) and day (07:00–23:00 UTC) and during (b) different times of the day following the time step of OP (4 h).
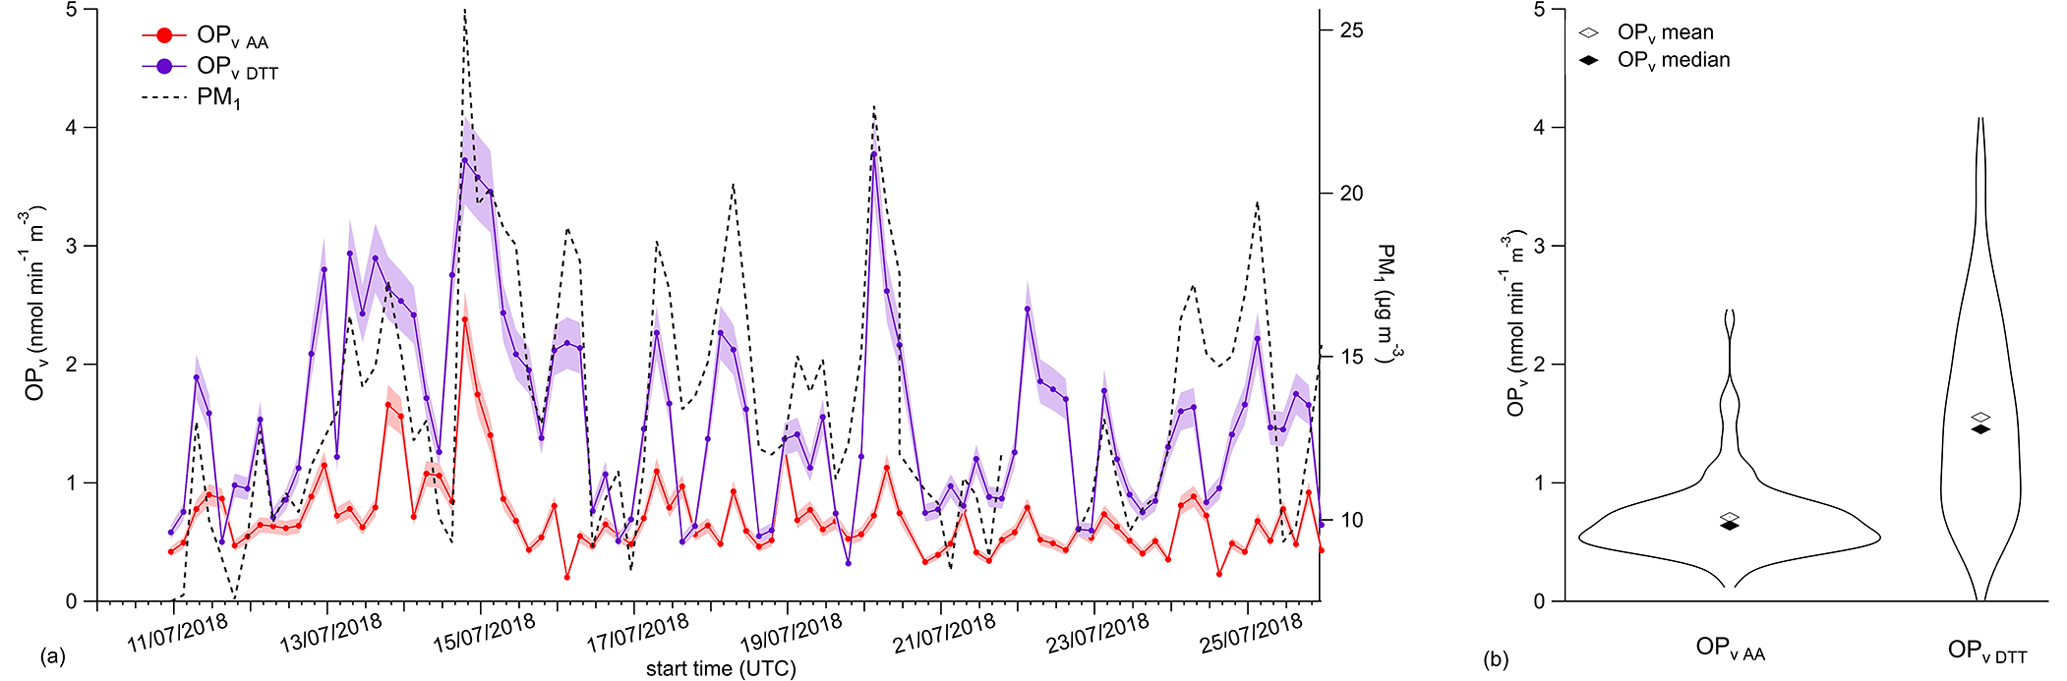
Figure 3(a) OP, OP and PM1 mass time series over the campaign at the Marseille-Longchamp site. (b) Distribution of OP and OP in mean and median values.
3.2 Interpretation of PMF factors
3.2.1 PMF analysis of OA
The PMForganics results are presented in the Supplement section with the profiles of the five factors (Fig. S7a), the time series (Fig. S7b), the relative fractions (Fig. S7c), and the diurnal cycles (Fig. S7d). As expected in this period, the secondary fraction including both LOOA and MOOA contributed to the highest part of OA with 33.4 % each. HOA represented 16.3 % of the total OA, followed by COA (13.7 %) and Sh-IndOA (3.2 %). HOA is assumed to be related to traffic exhaust emissions and displayed a distinct bimodal pattern with significant peaks during the morning and evening rush hours. COA also showed a bimodal pattern with increased concentrations during lunchtime and in the evening. Sh-IndOA concentrations accounted for combined plumes from the industrial area of Fos-sur-Mer and from the shipping activity of Marseille harbour. These emissions are advected on-site by sea breeze in the morning and slowly decrease throughout the day. LOOA and MOOA are distinguished based on their ratio, with the higher ratio for the more oxidized part. According to the diurnal cycles, MOOA showed a flat pattern suggesting a long-range transported origin and a slight increase at mid-day potentially attributed to more local photochemical activity. By contrast, LOOA concentrations were higher at night related to some night-time chemistry. Further descriptions of OA sources in MRS-LCP are provided in Chazeau et al. (2022).
3.2.2 PMF analysis of metals
The PMFmetals solution is investigated with the factor profiles and time series presented in Fig. 4, along with the factor-relative diurnal cycles and contributions shown in Fig. S8. Non-parametric wind regressions (NWR) were also performed to determine the source concentrations attributed to their geographical origins using the wind direction and velocity (Henry et al., 2009; Petit et al., 2017). The results are displayed in Fig. S9.
Fireworks: This factor was only resolved for a short time from 13 to 15 July (see Sect. 2.4.2). Over its activity period, the factor represented a major fraction of the total element mass (up to 80 %) and contributed to K (73 %), Bi (100 %), Ti (71 %), and Cu (68 %). These elements are usually found in the composition of fireworks (Manousakas et al., 2022; Perrino et al., 2011; Rai et al., 2020; Vecchi et al., 2008). K is both a component of gunpowder (Drewnick et al., 2006) and is used as an oxidizer for firework bangs, while Cu and Ti produce blue and white flames when ignited.
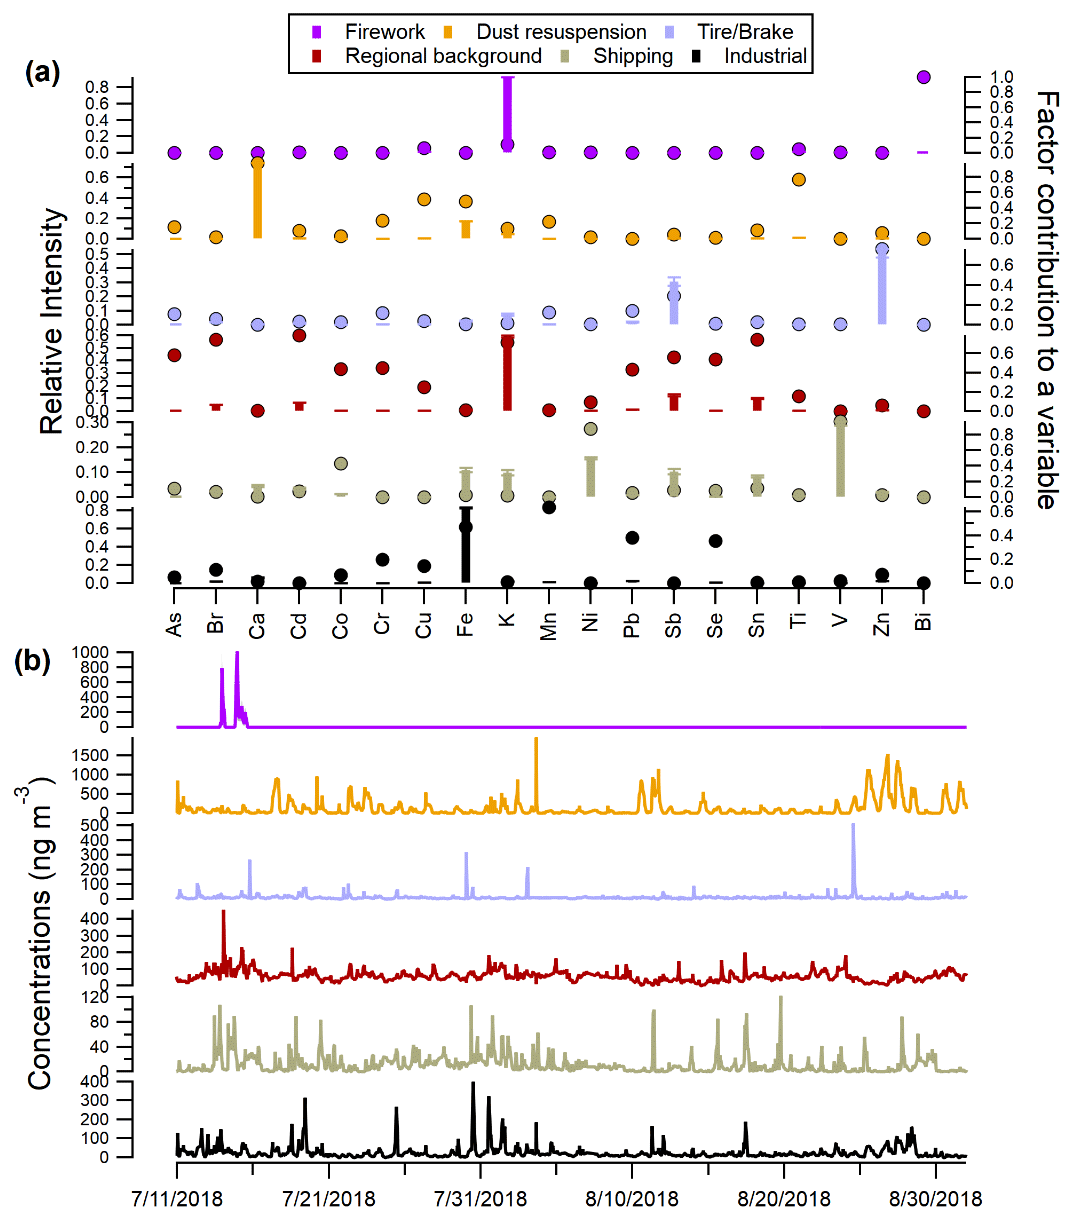
Figure 4(a) Average factor profiles with the coloured sticks indicating the normalized contribution of the element to the factor (left axis) and markers showing the normalized factor contribution to each element (right axis). Error bars represent the standard deviation of each profile. (b) Time series for the six factors resolved by the PMFmetals analysis.
Dust resuspension: This factor accounted for the largest contribution to the total elemental composition (53.7 %). Its profile presented the main fraction to Ca (98 %) and significant contributions to Ti (76 %), Cu (51 %), and Fe (48 %). These elements are major constituents of crustal soils and can be considered here to be urban dust (Almeida et al., 2020; Rai et al., 2021). Ca is also a compound often used for construction materials (Manousakas et al., 2022). The influence of construction work is supported by the factor diurnal profile which displayed increasing concentrations at 07:00 UTC followed by stable levels during the day and very low concentrations at night. The NWR plot showed a clear geographical origin from the northwest associated with a strong wind. Dust resuspension might occur under the mistral conditions (a regional wind for the Rhone Valley) with enhanced concentrations under high-velocity wind and dry conditions (Fig. S11). The factor could also include resuspension from non-exhaust traffic emissions due to the significant contribution of Cu.
Tire and/or brake wear: This factor showed high contributions to Zn (76 %) and Sb (29 %). The factor diurnal profile did not exhibit a distinct pattern and the time series were often affected by some spikes (Fig. 4b), which can be attributed to local short events. The factor time series showed a moderate correlation with exhaust traffic proxies such as BCFF (r=0.33). However, Zn and Sb elements are known tracers of the brake wear emissions (Grigoratos and Martini, 2015; and references therein). While Zn is one of the most abundant metals in the brake linings, Sb is contained in the form of stibnite (Sb2S3) and employed as a lubricant to reduce vibration (Roubicek et al., 2008). Moreover, Zn is considered as a marker of tire wear particles (Panko et al., 2018). It should be noted that the tire and/or brake wear factor contributes to a low extent to the total metal composition (5.3 %). In a previous study in Zurich, Bukowiecki et al. (2009) showed that the contribution to non-exhaust emissions from both light and heavy-duty vehicles was very low in the submicrometre mode. Visser et al. (2015b) demonstrated that elements usually assigned to brake lining and tire wear emissions (e.g. Cu, Sb, Fe or Sn) are mainly found in the coarse mode at the “Marylebone Road” kerbside site, and Hays et al. (2011) reported similar trends for a near-highway site in Raleigh, with Zn being the only element significantly present in the fine mode. Such results suggest the existence of significant alternative source for these elements, potentially mixed in the regional-scale background factor.
Regional background: This factor contributed to a large range of elements: K (71 %), Cd (78 %), Br (74 %), Sn (74 %) and to some extent to As (58 %), Sb (56 %), Se (54 %), and Pb (43 %). The factor diurnal profile was mostly flat suggesting long-range transport of aged background compounds. Since most trace elements in the fine mode are non-volatile, they can undergo long-range atmospheric transport (Morawska and Zhang, 2002). This is supported by a strong correlation with the MOOA factor (r=0.6) resolved during the PMForganics analysis. Furthermore, the NWR analysis displayed a regional geographical origin, with enhanced concentrations from the southerly sector (the Mediterranean Sea) and from the northeast sector with land breeze advecting aged air masses back to the site.
Shipping and industrial: The shipping factor accounted for the main fractions of V (97 %), Ni (88 %), and Co (43 %). The ratio has often been suggested as a proxy of heavy fuel combustion (Pandolfi et al., 2011; Viana et al., 2014). Here, we found a ratio of ∼ 2, which is in agreement with the typical range for shipping emissions (between 2 and 4) and with a ratio found in a previous study in Marseille (2.35; Salameh et al., 2018). The industrial factor contributed to Fe (47 %), Mn (63 %), Pb (38 %), and Se (35 %). This factor profile showed similarities with profiles from several industrial areas (Fig. S15). The contributions of some major elements (i.e. Fe, Ca, Mn, As, Zn) to this factor were in the same range as those of two iron converter zones and two storage zones measured by ICP-MS for the PM2.5 fraction (Sylvestre et al., 2017). Combining these two factors (shipping and industrial factors) showed a strong correlation (r=0.74) and a similar diurnal pattern with Sh-IndOA (Fig. S16), which accounted for both the industrial emissions from Fos-sur-Mer and the shipping activity from the harbour (Chazeau et al., 2022). The shipping diurnal profile in Fig. S8b displayed a bimodal pattern which is linked to the diurnal trend of the ship departures and arrivals at the harbour (Chazeau et al., 2021). Once the sea breeze sets in, the first peak related to the ship arrivals is observed, followed by a second peak at 17:00 UTC due to ship departures. The diurnal profile of the industrial factor also exhibits increasing concentrations once the sea breeze occurs, which then gradually decreases throughout the day. The NWR analyses support the notion that the industrial and shipping factors were advected on-site by breeze from the Mediterranean Sea as they revealed clear hotspots from the southwesterly sector. The shipping factor showed high concentrations at lower wind speed compared with the industrial factor, highlighting more local emissions that were expected due to the proximity of the harbour.
3.2.3 PMF analysis of PM1
The full PM1 source apportionment solution is explored in this section with the average factor profiles (Fig. 5a), the time series (Fig. 5b), the pie chart of mass contributions (Fig. 5c), the average diurnal profiles (Fig. 5d), and the NWR analyses (Fig. S17). The comparison of the time series over the OP sample period of these factor profiles with those of the two OP assays (OPAA and OPDTT) is shown in Fig. 6.
Biomass burning contributed greatly to BCWB (81 %) and to a lower extent to regional background metals (32 %) and MOOA (18 %). This factor accounted for 5.1 % of the total PM1 concentration. While no primary biomass burning organic aerosol (BBOA) factor was resolved with the PMForganics analysis in summer, the presence of a significant MOOA contribution reflects the influence of a secondary process in this biomass burning factor. The low concentration of this factor is in agreement with minor regional emissions linked to agricultural activities, wildfires, and cooking practices such as BBQs, transformed through oxidation processes during regional transport and ageing (Chazeau et al., 2022; Cubison et al., 2011). The NWR analysis in Fig. S17 showed biomass burning concentrations associated with higher wind speed compared with sources with a local origin (traffic, shipping, cooking, and ON-rich), corresponding to southwesterly winds from the Mediterranean Sea. Additionally, the northeast land breeze advected these aged emissions back to the sampling site.
Cooking mainly contributes to COA (92 %) and MOOA (34 %) and represents a 14.2 % contribution to the total PM1 mass. Even if its diurnal pattern is similar to that from primary COA, the factor is mixed with a secondary organic aerosol fraction. Moreover, the cooking source included an unexpected contribution to Cl− (19 %), which was already observed in a rural environment in the Po Valley (Dall'Osto et al., 2015). While this study showed high contributions of Cl− and oxygenated organic aerosol with COA in the cooking source that may be associated with some additional emissions from agricultural activities and waste disposal, these sources are not expected at our urban site.
As presumed, the industrial factor was characterized by high contributions to industrial metals (74 %) and Sh-IndOA (46 %). The factor contributes little to the PM1 composition (3.2 %), which is expected as the size of the industrial particles generally belongs to the ultrafine mode (< 100 nm) (Riffault et al., 2015). Chazeau et al. (2021) and El Haddad et al. (2013) already described that plumes originating from the main industrial area of Fos-Berre are advected on-site by sea breeze conditions and are mainly attributed to ultrafine particles, influencing the mass concentrations only to a minor extent.
The dust resuspension factor was exclusively driven by metals and showed some identical features to the dust resuspension factor from the PMFmetals (100 % of the variable). It should be noted that the factor also included some weak contributions to the brake and/or tire wear and industrial metals (∼ 10 % each), which can be affected by the resuspension processes.
The traffic source was mostly composed of HOA (32 %), BCFF (44 %), and to a lesser extent of LOOA (15 %) and also showed a large contribution of these variables (83 %, 79 %, and 18 %, respectively). Tire and/or brake wear metals were also important contributors to this factor (29 % of the total variable). However, this component presented the highest unexplained variation (> 30 %) from all of the dataset (Fig. S14) and revealed some over-splitting in several factors. It should be emphasized that 23 % of the traffic source was composed of SOA (LOOA and MOOA), meaning that the primary traffic contribution is mixed with secondary aerosol concentrations attributed to fast oxidation of freshly emitted particles (Chirico et al., 2011). The factor represented the second highest fraction of the PM1 mass (21.4 %).
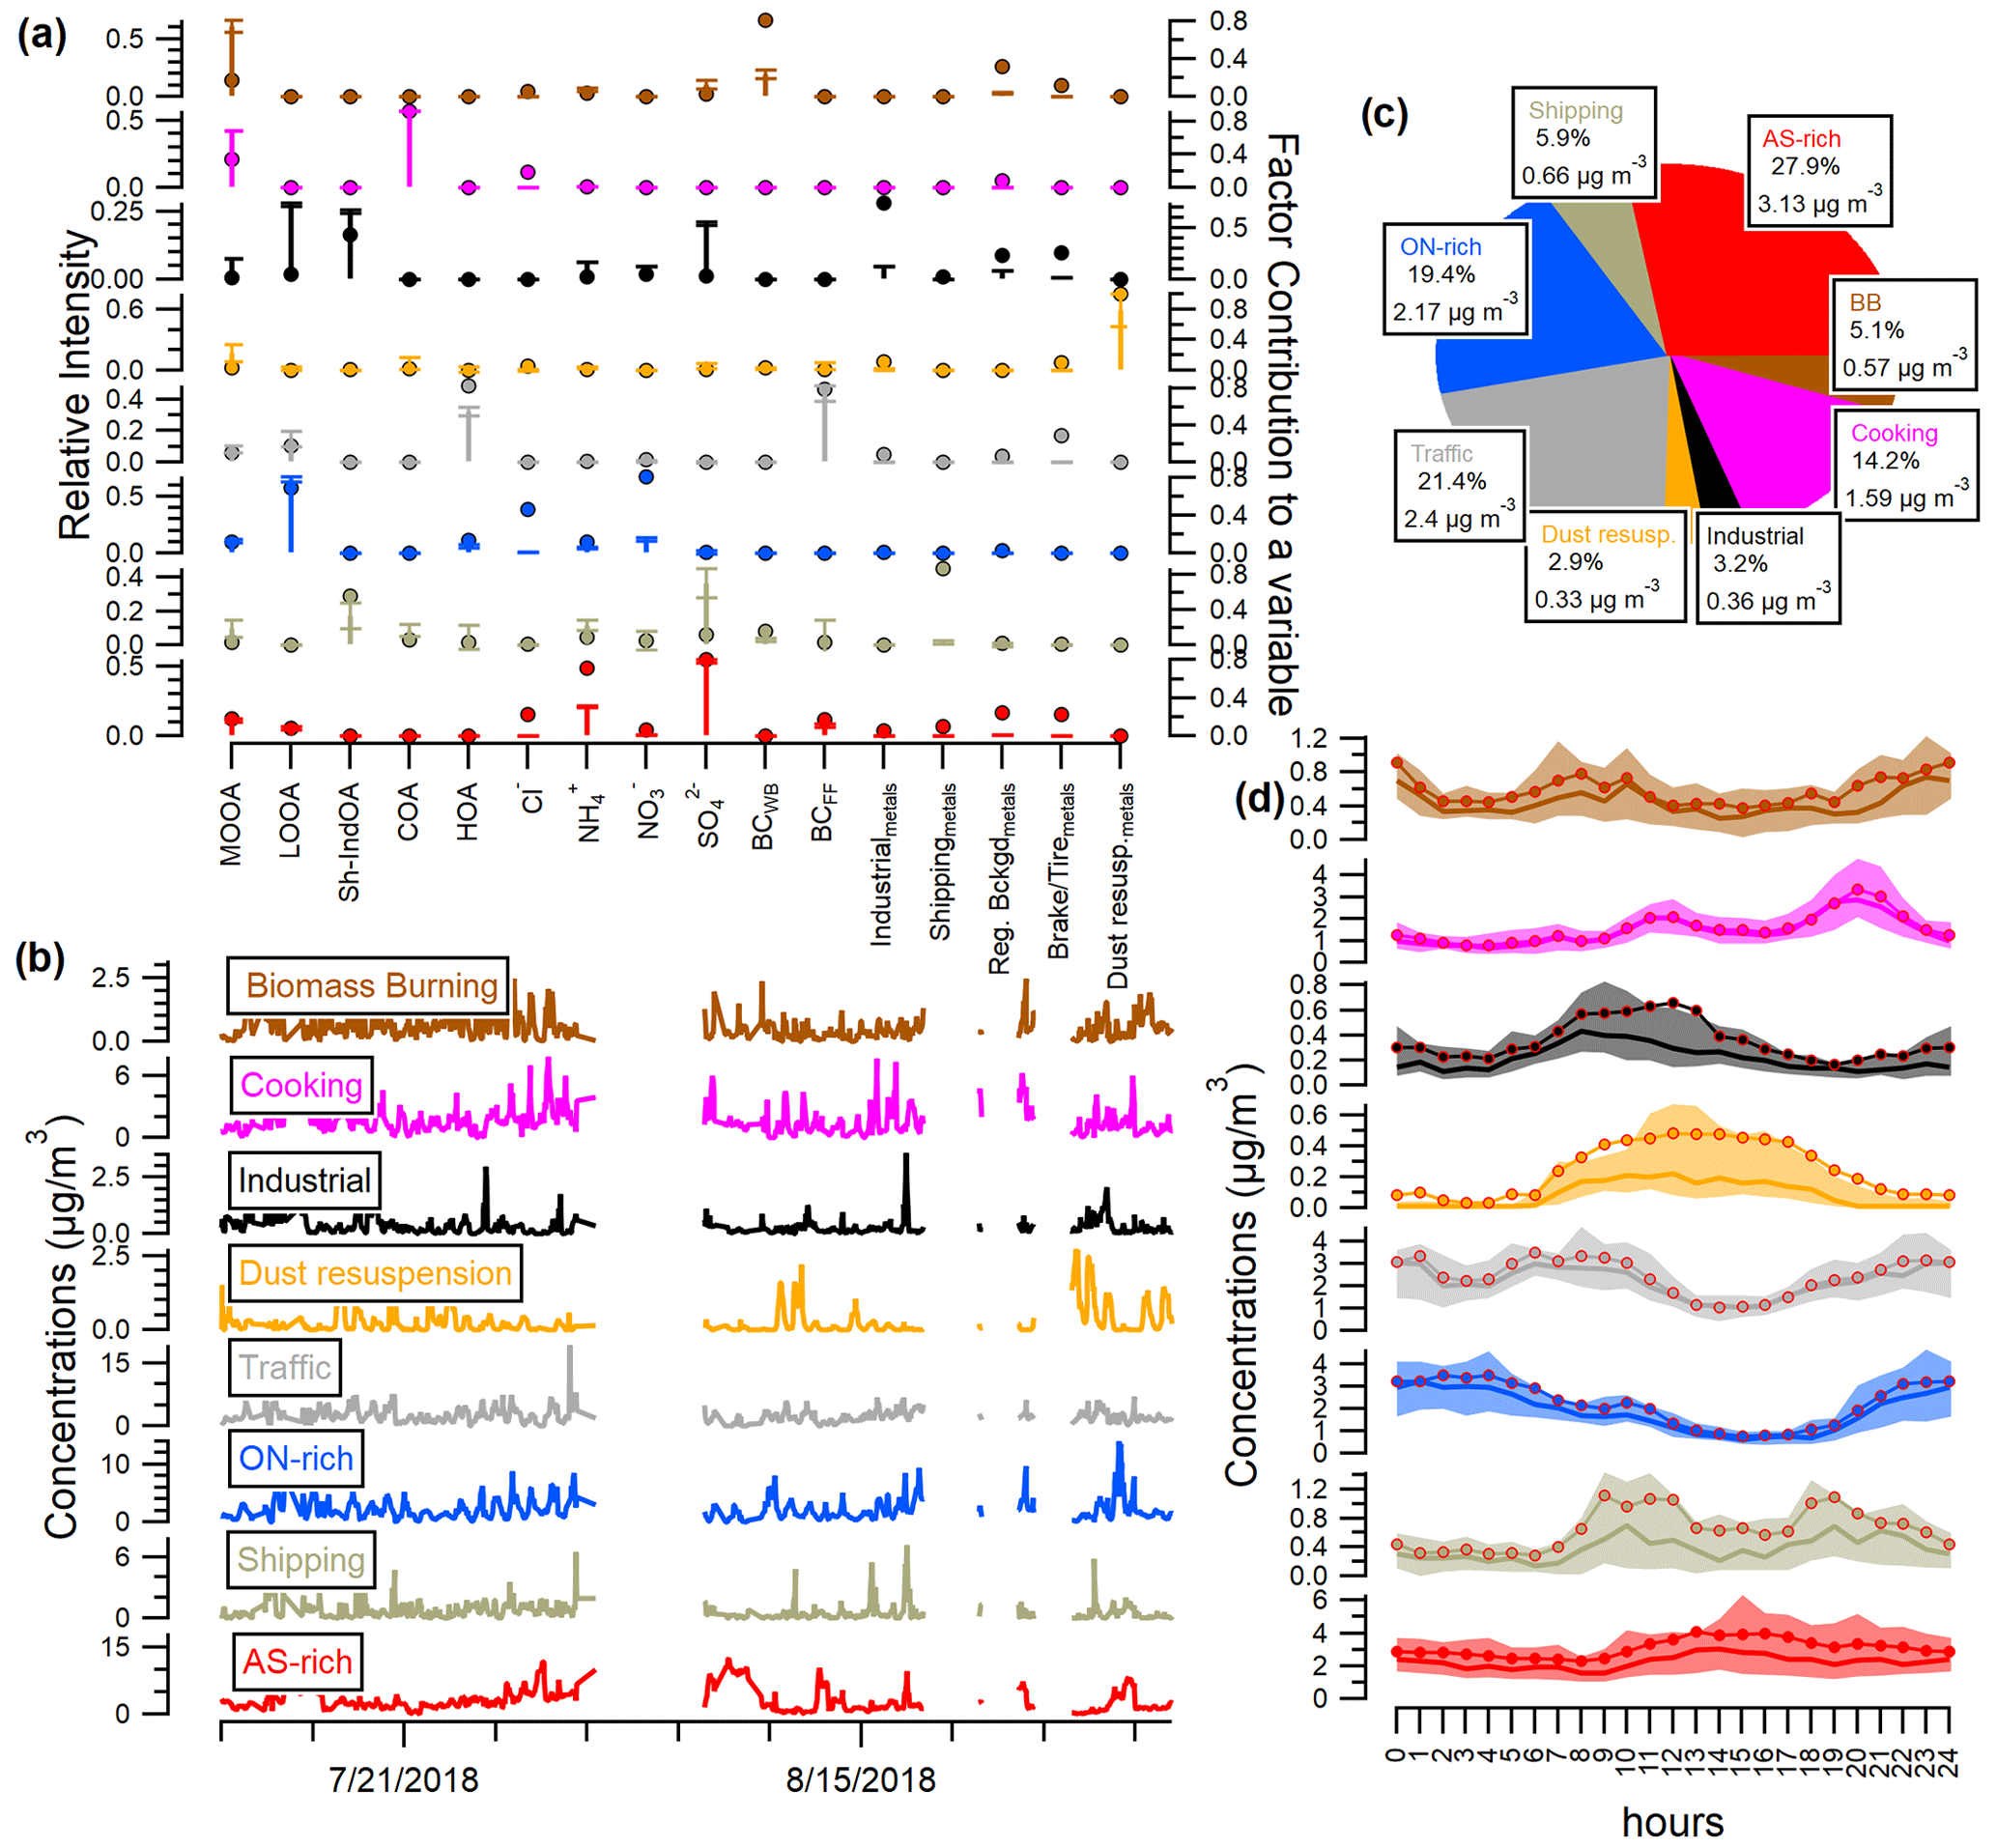
Figure 5(a) Average factor profiles, with the coloured sticks representing the normalized contribution of the variable to the factor (left axis) and the markers showing the normalized factor contribution to each variable (right axis) for the eight factors from the PMF solution. Error bars are the standard deviation of each profile. (b) Time series, (c) pie chart contributions, and (d) diurnal cycles (solid lines indicate the median, red circles the mean, and shaded areas the 25th–75th percentile range) for each factor of the PMF solution.
The organic nitrate-rich (ON-rich) factor was resolved based on the high contribution to NO (81 %) and LOOA (69 %). This factor accounted for 19.4 % of the PM1. The diurnal trend of this factor suggested contributions from night-time chemistry. A significant pathway might be the oxidation of biogenic VOCs by NO3 radicals to produce organic nitrate particles (Kiendler-Scharr et al., 2016; Xu et al., 2015). This factor displayed an origin from north to east within the land.
The shipping source showed an expected contribution from shipping metals (87 %) and Sh-IndOA (56 %) and accounted for 5.9 % of the PM1. This factor further accounts for a noticeable variation in sulfate (11.6 % of the total sulfate concentration). This is in agreement with the results reported by Chazeau et al. (2021), indicating that during 25 % of the days in summer 2017, sulfate concentrations were prominently influenced by the nearby harbour. Shipping emissions from the Marseille harbour are further described in Sect. 3.3.2.
The AS-rich factor represented the largest fraction of the PM1 (27.9 %) and was dominated by the ammonium sulfate contribution (80 % of SO and 72 % of NH. The SO NH ratio in this profile was 2.57, which is consistent with the mass ratio of ammonium sulfate in the (NH4)2SO4 form (2.66). The remaining fraction of SO was attributed to the shipping (12 %) and industrial (4 %) factors. The diurnal profile of the AS-rich factor showed enhanced concentrations in the afternoon linked to the photochemical production of sulfate from its precursor SO2 (Zhuang et al., 1999). The presence of the SOA contribution in this factor (16 %) suggests its formation by a similar process (i.e. photo-oxidation) (Bozzetti et al., 2017a; Salameh et al., 2018; Waked et al., 2014). This ammonium sulfate pattern was already pointed out in summer in Marseille and was attributed to mixed Mediterranean sulfate sources (including industrial and shipping emissions) from a regional origin transported by processed air masses (Chazeau et al., 2021). This interpretation is supported by the NWR analysis presented in Fig. S17. It should be noted that the AS-rich factor might also include some other anthropogenic influence due to its moderate composition of BCFF (17 %).
To assess the robustness of the PMF2 solution, the results were compared with a PMF solution utilizing the OA factors from PMForganics, ACSM inorganic species (SO, NO, NH, Cl−), BC sources, and metal concentrations as the input dataset. Consistent with the PMF2 method, constraints, instrument weighting, criteria selection, and bootstrap analysis were applied and are reported in the Supplement Sect. S5. This alternative approach successfully identified the same eight factors (Fig. S18), exhibiting comparable mass contributions and very high correlations with the PMF2 factor time series (Table S5), all exceeding an R2 of 0.9, except for shipping (R2=0.81).
The biomass burning and shipping factors accounted for slightly higher concentrations in the PMF2 solution, due to the slightly elevated contribution of SO, NH, and MOOA concentrations which dominate the PM1 mass. The metal composition found in the factors from this alternative PMF approach is in agreement with the metal profiles from the PMFmetals solution. Note that Zn and Sb, the most prominent elements in the tire and/or brake metal factor, were mainly present in the traffic source. However, they again displayed some mixing with other factors (dust resuspension, AS-rich, and cooking), suggesting additional sources unresolved by the current PMF solutions. Previous studies suggested that Zn may originate from waste incineration or other industrial processes (Belis et al., 2019; Manousakas et al., 2022; Visser et al., 2015a). Comparable results in terms of explained variability were observed, emphasizing the suitability of both methods for such study.
A PMF analysis was also conducted on all instrument datasets (i.e. organic fragments from to 100, ACSM inorganic species, BC fractions, and metals) merged into a unique input matrix and did not result in a satisfactory solution (see the Supplement Sect. S6 and Fig. S19). Overall, the present PMF approach successfully identified various sources of PM1 during the summer season, consistent with previous studies in Marseille. These sources include traffic (El Haddad et al., 2013; Bozzetti et al., 2017a; Salameh et al., 2018), cooking (Bozzetti et al., 2017a), and a minor contribution from biomass burning (Bozzetti et al., 2017a; Salameh et al., 2018). However, this study marks the first identification of an ON-rich factor. A previous source apportionment of PM2.5 markers by Salameh et al. (2018) highlighted the dominant contribution of ammonium sulfate in summer (35 %) and identified a dust factor with a metal composition similar to the current study (Cu, Fe, Ca). While they identified a fossil fuel factor attributed to mixed harbour and industrial emissions, our results provide new insights by distinctly separating industrial and shipping emissions simultaneously advected on-site by sea breeze.
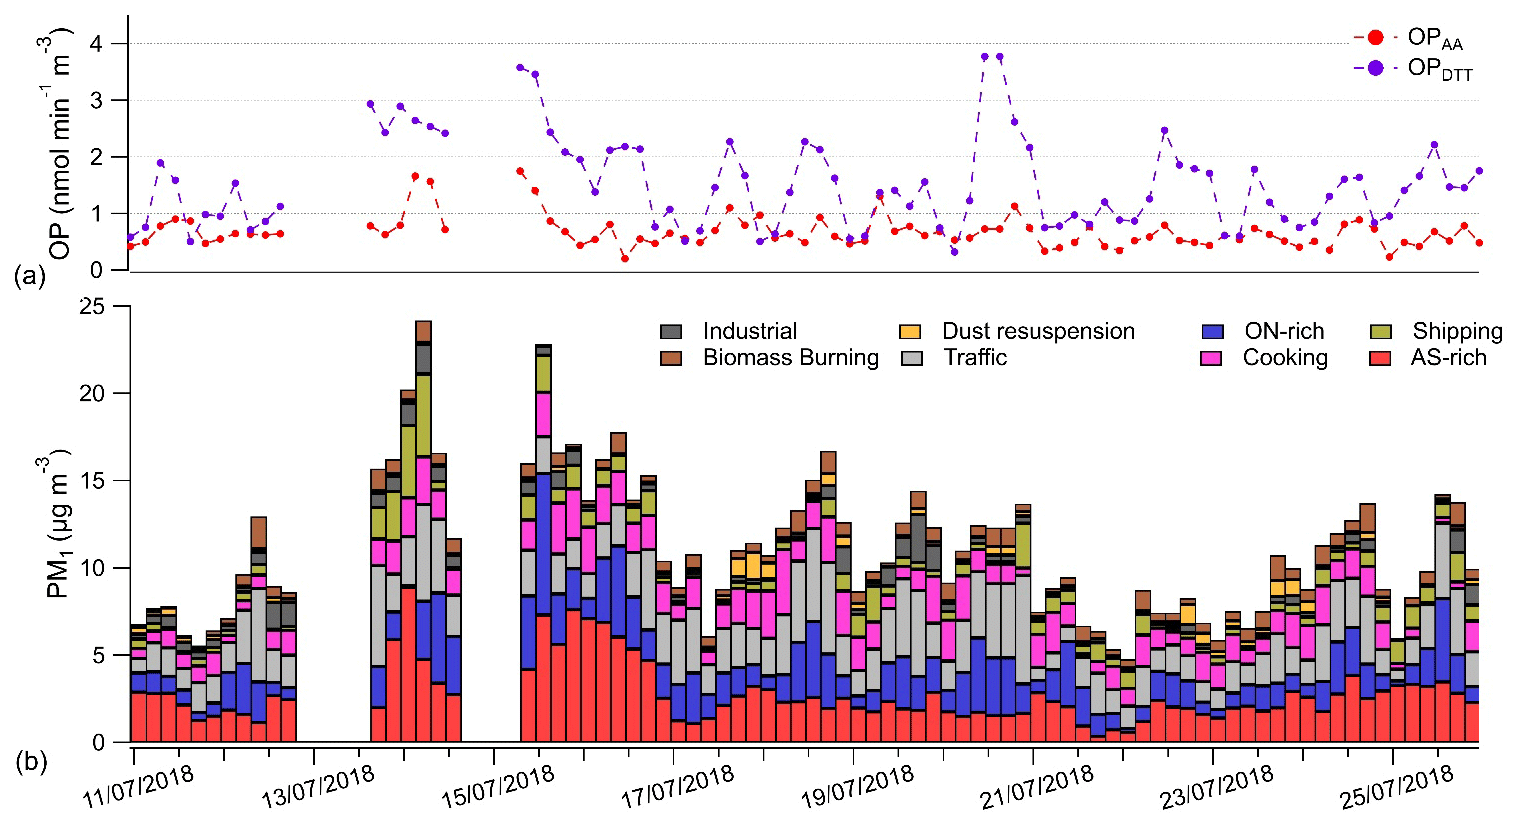
Figure 6(a) Time series of both OP assays during the OP sampling campaign. (b) Contribution of source factors provided by the PMF to PM1 over time.
3.3 Results of OP inversion for the PMF sources
Associations between each of the sources provided by the PMF and the OP measurements are shown in Table S6. The observation of these direct correlations shows that none of the sources identified is dominant on its own in explaining the changes in both OP assays. It is the combination of sources that ultimately leads to the observed OPAA and OPDTT.
3.3.1 Model accuracy
The M-estimator inversion model results issued from PMForganics (scenario 1) or PMFmetals (scenario 2) alone are, respectively, presented in Tables S3a and S3b and are discussed in the Supplement. The results obtained with the WLS inversion applied to the PMF (scenario 3) are the most robust and founded on a geochemical base. The cooking source factor was not considered based on its anti-correlation with OP. All other source factors included in the PMF were considered, since they did not show any multicollinearity (VIF < 5). The accuracy of this model was estimated by its robustness (validity of the error model generated by the bootstrap method) and by a residual analysis between the OP observed and the OP reconstructed by the model. The Breusch–Pagan test performed for each assay assessed the absence of heteroscedasticity in the model residuals ( (see Fig. S20). The observed OP and reconstructed OP showed a fair correlation for both assays (OP: r=0.44, – OP: r=0.54, , p<0.001 in both cases).
3.3.2 Intrinsic OPDTT and OPAA
Intrinsic OP (i.e β coefficients provided by WLS regression models in scenario 3 (see Sect. 2.5), thereafter denoted OPm) of the source factor contributions identified by PMF are shown in Table 1 and are discussed here.
Dust resuspension and industrial factors are the main reactive sources to the AA assay, with OP mean values of 0.26±0.03 and 0.22±0.05 nmol min−1 µg−1, respectively. Since 51 % of copper is found in the dust resuspension factor and as various metals (Fe, Cr, Ti, Mn, Pb, or Se) were found in these two factors, the AA assay confirms its metal-sensitivity especially to Cu (Daellenbach et al., 2020; Grange et al., 2022; Pant et al., 2015; Pant and Harrison, 2013). In parallel, Calas et al. (2019) and Gao et al. (2020b) pointed out the role of organic species in OPAA response, which in this study is sensitive to both less and more oxidized organic aerosols (LOOA and MOOA factors from the PMForganics) and organic compounds from harbour and plant activities (Sh-IndOA factor also from the PMForganics). Thus, 27 % and 25 % of the industrial source factor is constituted by LOOA and Sh-IndOA factors, respectively, and 17 % of the dust resuspension source factor is constituted by MOOA factor. As already reported by Weber et al. (2019) in the OP apportionment study on PM10 at the same site, DTT appears to be sensitive to a wide range of sources. In this study, AS-rich, shipping, and biomass burning sources are the main drivers of OPDTT with, respectively, OP values of 0.18±0.02, 0.16±0.03, and 0.15±0.06 nmol min−1 µg−1.
In addition to the inherent reactivity of the chemical species, high levels of SO in AS-rich and shipping sources (respectively, 54 % and 36 % of the source factor) may increase OP activity through the dissolution of some metallic elements under acidic conditions (Fang et al., 2017). In the same way, toxicological studies highlighted the role of BCWB (81 % of the quantification of BCWB is founded on the biomass burning source) as an indicator of co-transported high DTT-reactive species such as metals or quinones (Niranjan and Thakur, 2017; Shang et al., 2016).
Although several studies emphasized the role of road traffic in OP (Daellenbach et al., 2020; Fang et al., 2016; Saffari et al., 2015), OPm of the traffic source is surprisingly very low for both OP assays in our case (OP: 0.01±0.02 nmol min−1 µg−1–OP nmol min−1 µg−1). This result might be explained by the fact that non-exhaust traffic emissions traditionally associated with OP are mainly found in a coarser mode than PM1 (Piscitello et al., 2021).
Interestingly, the traffic source is well correlated with OP and OP (r=0.40–r=0.34, p<0.01) but associated with the lowest OPm values. Although Pearson's correlation between OP values and source factor contributions is the first indication of the OP sensitivity towards certain sources, it is most likely preferable to be used in association with an MLR-like model, as already underlined by Weber et al. (2018) and in't Veld (2022).
Table 1Intrinsic OPAA and OPDTT (OPm) expressed in nmol min−1 µg−1 of sources provided by the PMF method over the OP sampling campaign without the firework episode (n=78 samples) for both OP assays. Values are the mean ± standard deviation from selected bootstraps of the optimal solution.

3.3.3 Population exposure: median contribution of OP
Source-specific contributions to OPAA, OPDTT, and PM1 mass are presented here, ranked in decreasing order, and reported as median values in Fig. 7. The same results gathered in mean values are shown in Fig. S21. These two metrics do not address the same issue: mean value is generally used in the atmospheric community while epidemiological studies prefer to rely on median value, excluding outlier events which are not representative of a chronic exposure of the population. We observe little difference in the ranking of sources between mean and median values due to the overall low variability of the observed OP during the sampling campaign. However, the mean value and the median value of the contribution of the AS-rich source factor to OPDTT are significantly different, with the mean value being 4 times higher than the median value. The median values of the contribution of the AS-rich source are close to those of biomass burning, shipping, and ON-rich source factor contributions (respectively, with OP values of 0.1 ± 0.01, 0.09 ± 0.01, 0.08 ± 0.01, 0.08 ± 0.02 nmol min−1 m−3).
As already observed in other studies (Borlaza et al., 2022; Weber et al., 2021, 2018), the main observation in Fig. 7 is the clear difference in the factor source contributions when considering the OP activity or PM1 mass. This highlights the fact that the sources driving OP activity are not the same as those driving PM mass. While the industrial source contributes little to the PM1 mass (0.26 µg m−3), it has the highest OP value (0.06 ± 0.01 nmol min−1 m−3) with ON-rich factor (0.05±0.02 nmol min−1 m−3) and followed by the dust resuspension (0.04 ± 0.00 nmol min−1 m−3) source. In the same way, shipping and biomass burning sources contribute greatly to OP (0.08±0.03 and 0.09±0.02 nmol min−1 m−3) while each source contributes less than 13 % of PM1 total mass. On the contrary, AS-rich and cooking sources display negative contributions to OP while they contribute significantly to the PM1 mass. The traffic source does not appear to be a main driver in both types of OP despite its high PM1 mass contribution (21.4 %). However, we note a very large standard deviation in the contribution of this factor to OP.
A previous study was conducted over 1 year on PM10 at the Marseille-Longchamp site, and already emphasizes the contribution of biomass burning and heavy fuel oil (HFO; related to shipping activity) to OP and OP (Weber et al., 2021). Although similar results can be found, they should be treated with caution as different fractions of PM are being studied.
Even though OA and metals are found in all sources, the results suggest that only a fraction of these compounds have a substantial impact on OP activity of PM1. Overall, this draws our attention to the contribution of multiple sources (local and regional) with low PM1 mass loading in the chronic exposure of PM pollutant.
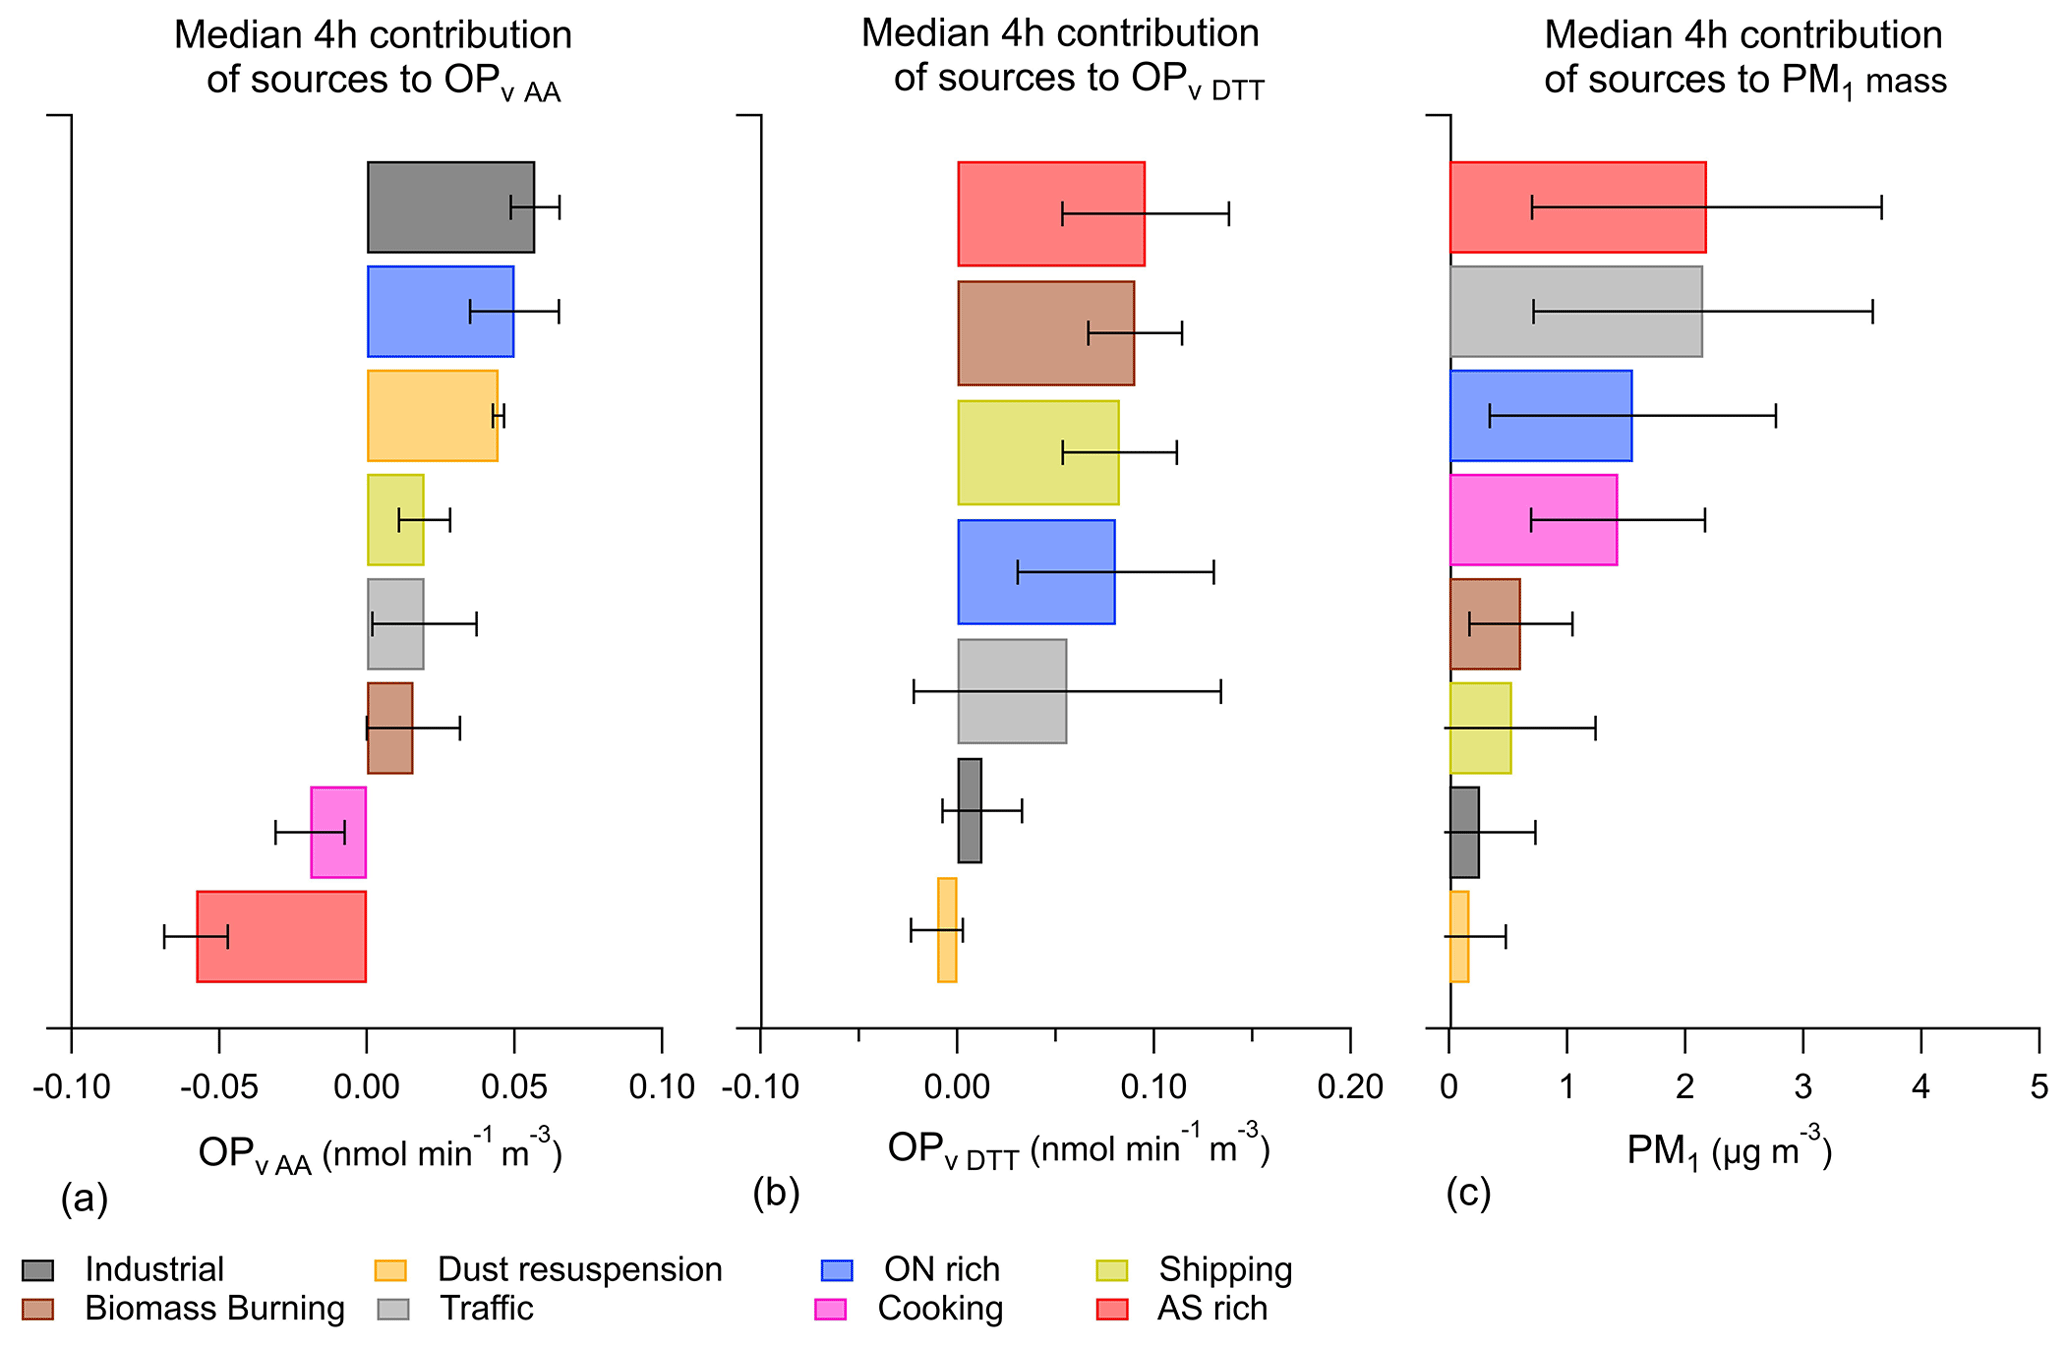
Figure 7Median contribution of the sources identified by PMF over the OP sampling campaign without the firework episode (n=78 samples) to (a) OP, (b) OP, and (c) PM1. Error bars represent the standard deviation of the data distribution.
3.3.4 Discussion
As shown in Table 1 and Fig. 7, OP and OP display various sensitivities to sources, and considering both OP assays does not reveal the influence of any particular source. For example dust resuspension and industrial emissions display significant positive OP values and negative or low OP values. Conversely the shipping emission source and the AS-rich source show significant positive OP and negative or low OP values. This disparity is most likely associated with different oxidative pathways of the two probes, which account for the diversity of defensive mechanisms operating in the pulmonary environment (Bates et al., 2019). AA is naturally present in the lungs, and its predominant anionic form in solution (HA−) is oxidized by various mechanisms facilitated by OH•, O, HO, and other radicals, and by transition metals such as Cu (II) or Fe (III) (Campbell et al., 2019). DTT has a disulfide bond and is considered a chemical substitute for cellular reducing agents such as nicotinamide adenine dinucleotide (NADH) or protein thiols (Verma et al., 2015; Borlaza et al., 2018). Protein thiols play an important role in major oxidative stress, restoring the redox balance by eliminating free radicals (Baba and Bhatnagar, 2018). Many studies have linked these two probes (AA and DTT) to transition metals (Cu, Fe, Mn, Zn), EC, and OC (Gao et al., 2020b). In addition, the different sensitivity of AA and DTT to both organic compounds and transition metals has been evidenced by Calas et al. (2018), Gao et al., 2020b and Pietrogrande et al. (2022).
Today, no consensus has yet been reached on which OP test is most representative of health impact, and the community still recommends the complementary use of OP tests, in particular the association of both AA and thiol-based (DTT or GSH) assays (Moufarrej et al., 2020). This association is currently the only way of assessing the full panel of the most oxidizing compounds of PM. However, recent studies have shown positive associations between OPDTT and various acute cardiac (myocardial infarction) and respiratory endpoints, supporting the relevance of the OPDTT assay for this purpose (Abrams et al., 2017; Weichenthal et al., 2016; He and Zhang, 2023). On the contrary, several studies did not find an association between OPAA and health endpoints including early-life outcomes, respiratory and cardiovascular mortality, cardiorespiratory emergencies, and lung cancer mortality (Borlaza et al., 2023; Marsal et al., 2023b). Nonetheless, a recent study has associated OPAA with oxidative damage to DNA (Marsal et al., 2023a). These results so far may suggest that OPAA provides partial information on the link between OP and adverse health effects, and further epidemiological studies are needed to determine whether OPAA should be considered as a proxy for health impact.
The robust method used in this study is promising for further practical applications. However, there are some limitations that can explain the moderate OP reconstruction. Mainly, little variability in OP measurements and in the chemical composition was observed at the Marseille-Longchamp site over a 15 d period, implying difficulties for models such as MLR to accurately reconstruct OP peaks and thus lowering the Pearson correlation coefficient r between observed OP and modelled OP. Then, averaging the online data which have a time step of 15 min and 1 h, respectively, for ToF-ACSM and Xact over the time step of the OP (4 h) led to a levelling of the pollution peaks visible on the online analysers. Also, the times series of OP and chemistry originates from offline and online methodologies that may introduce additional uncertainties to the results of the study, related to some extent to the sampling artefact. Furthermore, recent studies suspected non-linear relationships for the source apportionment of OP, especially when increasing PM mass (Calas et al., 2017; Charrier et al., 2016; Grange et al., 2022; Weber et al., 2021). Another main limitation is the lack of data between 12 July 2018 21:00–13 July 2018 05:00 UTC (3 points) and 14 July 2018 17:00–15 July 2018 05:00 UTC (4 points), resulting in difficulty for the model to reconstitute certain OP peaks. Lastly, the propagation of uncertainties can be a limitation as we increase the imprecision of the actual measured OP. The combination of all these limitations could explain the unrecovered percentage of the OP variance by the model (i.e. intercept).
To the best of our knowledge, this study is the first to apportion OP from sources provided by a two-step PMF approach using high time resolution online Xact and ToF-ACSM data. The PMF2 approach successfully identified eight well-resolved sources (AS-rich, traffic, ON-rich, cooking, shipping, biomass burning, industrial, and dust resuspension), a solution not achievable through single PMFs conducted separately on OA and metal datasets. The method enabled the assignment of OA factors, which typically described components arising from a mixture of sources and chemical processes rather than a single emission source, to more specific PM1 sources. Additionally, this approach allowed us to assess both the primary and secondary origin of anthropogenic sources, such as traffic and cooking. However, a limitation of this method is that non-explained variability and uncertainties of the factors from the first-step PMFs will propagate into the PMF2 results and therefore need to be carefully assessed. The inclusion of additional element measurements, such as Ba, S, Cl, and Si, to the PMFmetals could be an interesting feature for refining some sources and addressing this limitation.
A redistribution of the sources between mass and OP contributions was observed in both OPAA and OPDTT assays, highlighting the limiting capacity of the mass concentration alone in understanding the redox activity of PM. While the PM1 mass concentrations were dominated by AS-rich, traffic, and ON-rich sources, factors with an anthropogenic origin such as industry, shipping, biomass burning, and dust resuspension, represented only a few percent. However, these factors with a low mass concentration showed a high OP contribution. Therefore, making an effort to reduce these specific anthropogenic sources, regardless of the PM mass regulations, might result in a significant reduction of OP in the submicron mode.
We demonstrated that OP apportionment models performed on source factors deconvolved from partial aerosol composition (only metals or organics) are not robust. The two-step PMF2 approach appears to be a substantial method for integrating a wider range of markers (organic and inorganic) for a better identification of PM sources. The OP apportionment via a WLS inversion model led to comprehensive and realistic OP sources.
Several improvements can be suggested to address the limitations mentioned in Sect. 4, such as the subsequently introduced source uncertainties from the PMF model into the OP deconvolution model. Furthermore, these findings pave the way for the coupling of recent prototypes allowing for in situ OP data with online chemical analysers aiming to understand short-lived processes.
Data from the study are available at https://doi.org/10.7910/DVN/0LMCKU (Chazeau, 2024). More details are available upon request to the corresponding author.
The supplement related to this article is available online at: https://doi.org/10.5194/acp-24-3257-2024-supplement.
NM, HW, JLJ, GU, and BC designed the study. BC, GG, LL, and AD contributed to the measurements and provided logistic support for the campaign. JLJ and GU provided the filter analyses. JC and BC treated the data and analysed the results. JC and BC wrote the manuscript. All the authors reviewed and commented on the manuscript.
The contact author has declared that none of the authors has any competing interests.
Publisher’s note: Copernicus Publications remains neutral with regard to jurisdictional claims made in the text, published maps, institutional affiliations, or any other geographical representation in this paper. While Copernicus Publications makes every effort to include appropriate place names, the final responsibility lies with the authors.
We acknowledge the RI URBANS project (Research Infrastructures Services Reinforcing Air Quality Monitoring Capacities in European Urban & Industrial Areas, European Union's Horizon 2020 research and innovation program, Green Deal, European Commission). All the personnel of the Air-O-Sol platform are also kindly acknowledged.
This research has been supported by the Centre National de la Recherche Scientifique (grant no. MITI-CNRS, program 80Prime, project PAPILLON).
This project was partially supported for the analytical part at IGE by the projects ANR (Agence National de la Recherche) GetOPstandOP ANR19-CE34-002, grant PR-PRE-2021 FUGA Fondation Air Liquide, and by the Air-O-Sol platform within Labex OSUG@2020 (grant no. ANR10 LABX56).
This paper was edited by James Allan and reviewed by two anonymous referees.
Abrams, J. Y., Weber, R. J., Klein, M., Samat, S. E., Chang, H. H., Strickland, M. J., Verma, V., Fang, T., Bates, J. T., Mulholland, J. A., Russell, A. G., and Tolbert, P. E.: Associations between Ambient Fine Particulate Oxidative Potential and Cardiorespiratory Emergency Department Visits, Environ. Health Perspect., 125, 107008, https://doi.org/10.1289/EHP1545, 2017.
Äijälä, M., Daellenbach, K. R., Canonaco, F., Heikkinen, L., Junninen, H., Petäjä, T., Kulmala, M., Prévôt, A. S. H., and Ehn, M.: Constructing a data-driven receptor model for organic and inorganic aerosol – a synthesis analysis of eight mass spectrometric data sets from a boreal forest site, Atmos. Chem. Phys., 19, 3645–3672, https://doi.org/10.5194/acp-19-3645-2019, 2019.
Almeida, S. M., Manousakas, M., Diapouli, E., Kertesz, Z., Samek, L., Hristova, E., Šega, K., Alvarez, R. P., Belis, C. A., and Eleftheriadis, K.: Ambient particulate matter source apportionment using receptor modelling in European and Central Asia urban areas, Environ. Pollut., 266, 115199, https://doi.org/10.1016/j.envpol.2020.115199, 2020.
Ayres, J. G., Borm, P., Cassee, F. R., Castranova, V., Donaldson, K., Ghio, A., Harrison, R. M., Hider, R., Kelly, F., Kooter, I. M., Marano, F., Maynard, R. L., Mudway, I., Nel, A., Sioutas, C., Smith, S., Baeza-Squiban, A., Cho, A., Duggan, S., and Froines, J.: Evaluating the Toxicity of Airborne Particulate Matter and Nanoparticles by Measuring Oxidative Stress Potential – A Workshop Report and Consensus Statement, Inhal. Toxicol., 20, 75–99, https://doi.org/10.1080/08958370701665517, 2008.
Baba, S. P. and Bhatnagar, A.: Role of thiols in oxidative stress, Curr. Opin. Toxicol., 7, 133–139, https://doi.org/10.1016/j.cotox.2018.03.005, 2018.
Bates, J. T., Fang, T., Verma, V., Zeng, L., Weber, R. J., Tolbert, P. E., Abrams, J. Y., Sarnat, S. E., Klein, M., Mulholland, J. A., and Russell, A. G.: Review of Acellular Assays of Ambient Particulate Matter Oxidative Potential: Methods and Relationships with Composition, Sources, and Health Effects, Environ. Sci. Technol., 17, 4003–4019, https://doi.org/10.1021/acs.est.8b03430, 2019.
Beelen, R., Raaschou-Nielsen, O., Stafoggia, M., Andersen, Z. J., Weinmayr, G., Hoffmann, B., Wolf, K., Samoli, E., Fischer, P., Nieuwenhuijsen, M., Vineis, P., Xun, W. W., Katsouyanni, K., Dimakopoulou, K., Oudin, A., Forsberg, B., Modig, L., Havulinna, A. S., Lanki, T., Turunen, A., Oftedal, B., Nystad, W., Nafstad, P., De Faire, U., Pedersen, N. L., Östenson, C.-G., Fratiglioni, L., Penell, J., Korek, M., Pershagen, G., Eriksen, K. T., Overvad, K., Ellermann, T., Eeftens, M., Peeters, P. H., Meliefste, K., Wang, M., Bueno-de-Mesquita, B., Sugiri, D., Krämer, U., Heinrich, J., de Hoogh, K., Key, T., Peters, A., Hampel, R., Concin, H., Nagel, G., Ineichen, A., Schaffner, E., Probst-Hensch, N., Künzli, N., Schindler, C., Schikowski, T., Adam, M., Phuleria, H., Vilier, A., Clavel-Chapelon, F., Declercq, C., Grioni, S., Krogh, V., Tsai, M.-Y., Ricceri, F., Sacerdote, C., Galassi, C., Migliore, E., Ranzi, A., Cesaroni, G., Badaloni, C., Forastiere, F., Tamayo, I., Amiano, P., Dorronsoro, M., Katsoulis, M., Trichopoulou, A., Brunekreef, B., and Hoek, G.: Effects of long-term exposure to air pollution on natural-cause mortality: an analysis of 22 European cohorts within the multicentre ESCAPE project, The Lancet, 383, 785–795, https://doi.org/10.1016/S0140-6736(13)62158-3, 2014.
Belis, C. A., Pikridas, M., Lucarelli, F., Petralia, E., Cavalli, F., Calzolai, G., Berico, M., and Sciare, J.: Source apportionment of fine PM by combining high time resolution organic and inorganic chemical composition datasets, Atmos. Environ., 3, 100046, https://doi.org/10.1016/j.aeaoa.2019.100046, 2019.
Boogaard, H., Janssen, N. A. H., Fischer, P. H., Kos, G. P. A., Weijers, E. P., Cassee, F. R., van der Zee, S. C., de Hartog, J. J., Brunekreef, B., and Hoek, G.: Contrasts in Oxidative Potential and Other Particulate Matter Characteristics Collected Near Major Streets and Background Locations, Environ. Health Perspect., 120, 185–191, https://doi.org/10.1289/ehp.1103667, 2012.
Borlaza, L. J. S., Cosep, E. M. R., Kim, S., Lee, K., Joo, H., Park, M., Bate, D., Cayetano, M. G., and Park, K.: Oxidative potential of fine ambient particles in various environments, Environ. Pollut., 243, 1679–1688, https://doi.org/10.1016/j.envpol.2018.09.074, 2018.
Borlaza, L. J. S., Weber, S., Jaffrezo, J.-L., Houdier, S., Slama, R., Rieux, C., Albinet, A., Micallef, S., Trébluchon, C., and Uzu, G.: Disparities in particulate matter (PM10) origins and oxidative potential at a city scale (Grenoble, France) – Part 2: Sources of PM10 oxidative potential using multiple linear regression analysis and the predictive applicability of multilayer perceptron neural network analysis, Atmos. Chem. Phys., 21, 9719–9739, https://doi.org/10.5194/acp-21-9719-2021, 2021.
Borlaza, L. J., Weber, S., Marsal, A., Uzu, G., Jacob, V., Besombes, J.-L., Chatain, M., Conil, S., and Jaffrezo, J.-L.: Nine-year trends of PM10 sources and oxidative potential in a rural background site in France, Atmos. Chem. Phys., 22, 8701–8723, https://doi.org/10.5194/acp-22-8701-2022, 2022.
Borlaza, L. J. S., Uzu, G., Ouidir, M., Lyon-Caen, S., Marsal, A., Weber, S., Siroux, V., Lepeule, J., Boudier, A., Jaffrezo, J.-L., Slama, R., and SEPAGES cohort study group: Personal exposure to PM2.5 oxidative potential and its association to birth outcomes, J. Expo. Sci. Environ. Epidemiol., 33, 416–426, https://doi.org/10.1038/s41370-022-00487-w, 2023.
Bozzetti, C., Sosedova, Y., Xiao, M., Daellenbach, K. R., Ulevicius, V., Dudoitis, V., Mordas, G., Byčenkienė, S., Plauškaitė, K., Vlachou, A., Golly, B., Chazeau, B., Besombes, J.-L., Baltensperger, U., Jaffrezo, J.-L., Slowik, J. G., El Haddad, I., and Prévôt, A. S. H.: Argon offline-AMS source apportionment of organic aerosol over yearly cycles for an urban, rural, and marine site in northern Europe, Atmos. Chem. Phys., 17, 117–141, https://doi.org/10.5194/acp-17-117-2017, 2017a.
Bozzetti, C., El Haddad, I., Salameh, D., Daellenbach, K. R., Fermo, P., Gonzalez, R., Minguillón, M. C., Iinuma, Y., Poulain, L., Elser, M., Müller, E., Slowik, J. G., Jaffrezo, J.-L., Baltensperger, U., Marchand, N., and Prévôt, A. S. H.: Organic aerosol source apportionment by offline-AMS over a full year in Marseille, Atmos. Chem. Phys., 17, 8247–8268, https://doi.org/10.5194/acp-17-8247-2017, 2017b.
Bukowiecki, N., Lienemann, P., Hill, M., Figi, R., Richard, A., Furger, M., Rickers, K., Falkenberg, G., Zhao, Y., Cliff, S. S., Prevot, A. S. H., Baltensperger, U., Buchmann, B., and Gehrig, R.: Real-World Emission Factors for Antimony and Other Brake Wear Related Trace Elements: Size-Segregated Values for Light and Heavy Duty Vehicles, Environ. Sci. Technol., 43, 8072–8078, https://doi.org/10.1021/es9006096, 2009.
Calas, A., Uzu, G., Martins, J. M. F., Voisin, D., Spadini, L., Lacroix, T., and Jaffrezo, J.-L.: The importance of simulated lung fluid (SLF) extractions for a more relevant evaluation of the oxidative potential of particulate matter, Sci. Rep., 7, 11617, https://doi.org/10.1038/s41598-017-11979-3, 2017.
Calas, A., Uzu, G., Kelly, F. J., Houdier, S., Martins, J. M. F., Thomas, F., Molton, F., Charron, A., Dunster, C., Oliete, A., Jacob, V., Besombes, J.-L., Chevrier, F., and Jaffrezo, J.-L.: Comparison between five acellular oxidative potential measurement assays performed with detailed chemistry on PM10 samples from the city of Chamonix (France), Atmos. Chem. Phys., 18, 7863–7875, https://doi.org/10.5194/acp-18-7863-2018, 2018.
Calas, A., Uzu, G., Besombes, J.-L., Martins, J. M. F., Redaelli, M., Weber, S., Charron, A., Albinet, A., Chevrier, F., Brulfert, G., Mesbah, B., Favez, O., and Jaffrezo, J.-L.: Seasonal Variations and Chemical Predictors of Oxidative Potential (OP) of Particulate Matter (PM), for Seven Urban French Sites, Atmosphere, 10, 698, https://doi.org/10.3390/atmos10110698, 2019.
Campbell, S. J., Utinger, B., Lienhard, D. M., Paulson, S. E., Shen, J., Griffiths, P. T., Stell, A. C., and Kalberer, M.: Development of a Physiologically Relevant Online Chemical Assay To Quantify Aerosol Oxidative Potential, Anal. Chem., 91, 13088–13095, https://doi.org/10.1021/acs.analchem.9b03282, 2019.
Canonaco, F., Crippa, M., Slowik, J. G., Baltensperger, U., and Prévôt, A. S. H.: SoFi, an IGOR-based interface for the efficient use of the generalized multilinear engine (ME-2) for the source apportionment: ME-2 application to aerosol mass spectrometer data, Atmos. Meas. Tech., 6, 3649–3661, https://doi.org/10.5194/amt-6-3649-2013, 2013.
Canonaco, F., Tobler, A., Chen, G., Sosedova, Y., Slowik, J. G., Bozzetti, C., Daellenbach, K. R., El Haddad, I., Crippa, M., Huang, R.-J., Furger, M., Baltensperger, U., and Prévôt, A. S. H.: A new method for long-term source apportionment with time-dependent factor profiles and uncertainty assessment using SoFi Pro: application to 1 year of organic aerosol data, Atmos. Meas. Tech., 14, 923–943, https://doi.org/10.5194/amt-14-923-2021, 2021.
Charrier, J. G., McFall, A. S., Vu, K. K.-T., Baroi, J., Olea, C., Hasson, A., and Anastasio, C.: A bias in the “mass-normalized” DTT response – An effect of non-linear concentration-response curves for copper and manganese, Atmos. Environ., 144, 325–334, https://doi.org/10.1016/j.atmosenv.2016.08.071, 2016.
Chazeau, B.: Oxidative potential apportionment of atmospheric PM1: A new approach combining high-sensitive online analysers for chemical composition and offline OP measurement technique, Harvard Dataverse [data set], V1, https://doi.org/10.7910/DVN/0LMCKU, 2024.
Chazeau, B., Temime-Roussel, B., Gille, G., Mesbah, B., D'Anna, B., Wortham, H., and Marchand, N.: Measurement report: Fourteen months of real-time characterisation of the submicronic aerosol and its atmospheric dynamics at the Marseille–Longchamp supersite, Atmos. Chem. Phys., 21, 7293–7319, https://doi.org/10.5194/acp-21-7293-2021, 2021.
Chazeau, B., El Haddad, I., Canonaco, F., Temime-Roussel, B., D'Anna, B., Gille, G., Mesbah, B., Prévôt, A. S. H., Wortham, H., and Marchand, N.: Organic aerosol source apportionment by using rolling positive matrix factorization: Application to a Mediterranean coastal city, Atmos. Environ., 14, 100176, https://doi.org/10.1016/j.aeaoa.2022.100176, 2022.
Chen, G., Li, S., Zhang, Y., Zhang, W., Li, D., Wei, X., He, Y., Bell, M. L., Williams, G., Marks, G. B., Jalaludin, B., Abramson, M. J., and Guo, Y.: Effects of ambient PM1 air pollution on daily emergency hospital visits in China: an epidemiological study, The Lancet Planetary Health, 1, e221–e229, https://doi.org/10.1016/S2542-5196(17)30100-6, 2017.
Chen, G., Sosedova, Y., Canonaco, F., Fröhlich, R., Tobler, A., Vlachou, A., Daellenbach, K. R., Bozzetti, C., Hueglin, C., Graf, P., Baltensperger, U., Slowik, J. G., El Haddad, I., and Prévôt, A. S. H.: Time-dependent source apportionment of submicron organic aerosol for a rural site in an alpine valley using a rolling positive matrix factorisation (PMF) window, Atmos. Chem. Phys., 21, 15081–15101, https://doi.org/10.5194/acp-21-15081-2021, 2021.
Chen, G., Canonaco, F., Tobler, A., Aas, W., Alastuey, A., Allan, J., Atabakhsh, S., Aurela, M., Baltensperger, U., Bougiatioti, A., De Brito, J. F., Ceburnis, D., Chazeau, B., Chebaicheb, H., Daellenbach, K. R., Ehn, M., El Haddad, I., Eleftheriadis, K., Favez, O., Flentje, H., Font, A., Fossum, K., Freney, E., Gini, M., Green, D. C., Heikkinen, L., Herrmann, H., Kalogridis, A.-C., Keernik, H., Lhotka, R., Lin, C., Lunder, C., Maasikmets, M., Manousakas, M. I., Marchand, N., Marin, C., Marmureanu, L., Mihalopoulos, N., Močnik, G., Nęcki, J., O'Dowd, C., Ovadnevaite, J., Peter, T., Petit, J.-E., Pikridas, M., Matthew Platt, S., Pokorná, P., Poulain, L., Priestman, M., Riffault, V., Rinaldi, M., Różański, K., Schwarz, J., Sciare, J., Simon, L., Skiba, A., Slowik, J. G., Sosedova, Y., Stavroulas, I., Styszko, K., Teinemaa, E., Timonen, H., Tremper, A., Vasilescu, J., Via, M., Vodička, P., Wiedensohler, A., Zografou, O., Cruz Minguillón, M., and Prévôt, A. S. H.: European aerosol phenomenology – 8: Harmonised source apportionment of organic aerosol using 22 Year-long ACSM/AMS datasets, Environ. Int., 166, 107325, https://doi.org/10.1016/j.envint.2022.107325, 2022.
Chirico, R., Prevot, A. S. H., DeCarlo, P. F., Heringa, M. F., Richter, R., Weingartner, E., and Baltensperger, U.: Aerosol and trace gas vehicle emission factors measured in a tunnel using an Aerosol Mass Spectrometer and other on-line instrumentation, Atmos. Environ., 45, 2182–2192, https://doi.org/10.1016/j.atmosenv.2011.01.069, 2011.
Cohen, D. A. J.: Estimates and 25-year trends of the global burden of disease attributable to ambient air pollution: an analysis of data from the Global Burden of Diseases Study 2015, 389, https://doi.org/10.1016/S0140-6736(17)30505-6, 2017.
Crippa, M., Canonaco, F., Slowik, J. G., El Haddad, I., DeCarlo, P. F., Mohr, C., Heringa, M. F., Chirico, R., Marchand, N., Temime-Roussel, B., Abidi, E., Poulain, L., Wiedensohler, A., Baltensperger, U., and Prévôt, A. S. H.: Primary and secondary organic aerosol origin by combined gas-particle phase source apportionment, Atmos. Chem. Phys., 13, 8411–8426, https://doi.org/10.5194/acp-13-8411-2013, 2013a.
Crippa, M., DeCarlo, P. F., Slowik, J. G., Mohr, C., Heringa, M. F., Chirico, R., Poulain, L., Freutel, F., Sciare, J., Cozic, J., Di Marco, C. F., Elsasser, M., Nicolas, J. B., Marchand, N., Abidi, E., Wiedensohler, A., Drewnick, F., Schneider, J., Borrmann, S., Nemitz, E., Zimmermann, R., Jaffrezo, J.-L., Prévôt, A. S. H., and Baltensperger, U.: Wintertime aerosol chemical composition and source apportionment of the organic fraction in the metropolitan area of Paris, Atmos. Chem. Phys., 13, 961–981, https://doi.org/10.5194/acp-13-961-2013, 2013b.
Cubison, M. J., Ortega, A. M., Hayes, P. L., Farmer, D. K., Day, D., Lechner, M. J., Brune, W. H., Apel, E., Diskin, G. S., Fisher, J. A., Fuelberg, H. E., Hecobian, A., Knapp, D. J., Mikoviny, T., Riemer, D., Sachse, G. W., Sessions, W., Weber, R. J., Weinheimer, A. J., Wisthaler, A., and Jimenez, J. L.: Effects of aging on organic aerosol from open biomass burning smoke in aircraft and laboratory studies, Atmos. Chem. Phys., 11, 12049–12064, https://doi.org/10.5194/acp-11-12049-2011, 2011.
Daellenbach, K. R., Uzu, G., Jiang, J., Cassagnes, L.-E., Leni, Z., Vlachou, A., Stefenelli, G., Canonaco, F., Weber, S., Segers, A., Kuenen, J. J. P., Schaap, M., Favez, O., Albinet, A., Aksoyoglu, S., Dommen, J., Baltensperger, U., Geiser, M., El Haddad, I., Jaffrezo, J.-L., and Prévôt, A. S. H.: Sources of particulate-matter air pollution and its oxidative potential in Europe, Nature, 587, 414–419, https://doi.org/10.1038/s41586-020-2902-8, 2020.
Dall'Osto, M., Paglione, M., Decesari, S., Facchini, M. C., O'Dowd, C., Plass-Duellmer, C., and Harrison, R. M.: On the Origin of AMS “Cooking Organic Aerosol” at a Rural Site, Environ. Sci. Technol., 49, 13964–13972, https://doi.org/10.1021/acs.est.5b02922, 2015.
Dellinger, B., Pryor, W. A., Cueto, R., Squadrito, G. L., Hegde, V., and Deutsch, W. A.: Role of Free Radicals in the Toxicity of Airborne Fine Particulate Matter, Chem. Res. Toxicol., 14, 1371–1377, https://doi.org/10.1021/tx010050x, 2001.
Drewnick, F., Hings, S. S., Curtius, J., Eerdekens, G., and Williams, J.: Measurement of fine particulate and gas-phase species during the New Year's fireworks 2005 in Mainz, Germany, Atmos. Environ., 40, 4316–4327, https://doi.org/10.1016/j.atmosenv.2006.03.040, 2006.
Drinovec, L., Močnik, G., Zotter, P., Prévôt, A. S. H., Ruckstuhl, C., Coz, E., Rupakheti, M., Sciare, J., Müller, T., Wiedensohler, A., and Hansen, A. D. A.: The “dual-spot” Aethalometer: an improved measurement of aerosol black carbon with real-time loading compensation, Atmos. Meas. Tech., 8, 1965–1979, https://doi.org/10.5194/amt-8-1965-2015, 2015.
Ducret-Stich, R. E., Tsai, M.-Y., Thimmaiah, D., Künzli, N., Hopke, P. K., and Phuleria, H. C.: PM10 source apportionment in a Swiss Alpine valley impacted by highway traffic, Environ. Sci. Pollut. Res. Int., 20, 6496–6508, https://doi.org/10.1007/s11356-013-1682-1, 2013.
Efron, B.: Bootstrap Methods: Another Look at the Jackknife, The Ann. Stat., 7, 1–26, https://doi.org/10.1214/aos/1176344552, 1979.
El Haddad, I., D'Anna, B., Temime-Roussel, B., Nicolas, M., Boreave, A., Favez, O., Voisin, D., Sciare, J., George, C., Jaffrezo, J.-L., Wortham, H., and Marchand, N.: Towards a better understanding of the origins, chemical composition and aging of oxygenated organic aerosols: case study of a Mediterranean industrialized environment, Marseille, Atmos. Chem. Phys., 13, 7875–7894, https://doi.org/10.5194/acp-13-7875-2013, 2013.
Fang, T., Verma, V., Bates, J. T., Abrams, J., Klein, M., Strickland, M. J., Sarnat, S. E., Chang, H. H., Mulholland, J. A., Tolbert, P. E., Russell, A. G., and Weber, R. J.: Oxidative potential of ambient water-soluble PM2.5 in the southeastern United States: contrasts in sources and health associations between ascorbic acid (AA) and dithiothreitol (DTT) assays, Atmos. Chem. Phys., 16, 3865–3879, https://doi.org/10.5194/acp-16-3865-2016, 2016.
Fang, T., Guo, H., Zeng, L., Verma, V., Nenes, A., and Weber, R. J.: Highly Acidic Ambient Particles, Soluble Metals, and Oxidative Potential: A Link between Sulfate and Aerosol Toxicity, Environ. Sci. Technol., 51, 2611–2620, https://doi.org/10.1021/acs.est.6b06151, 2017.
Flaounas, E., Coll, I., Armengaud, A., and Schmechtig, C.: The representation of dust transport and missing urban sources as major issues for the simulation of PM episodes in a Mediterranean area, Atmos. Chem. Phys., 9, 8091–8101, https://doi.org/10.5194/acp-9-8091-2009, 2009.
Fröhlich, R., Cubison, M. J., Slowik, J. G., Bukowiecki, N., Prévôt, A. S. H., Baltensperger, U., Schneider, J., Kimmel, J. R., Gonin, M., Rohner, U., Worsnop, D. R., and Jayne, J. T.: The ToF-ACSM: a portable aerosol chemical speciation monitor with TOFMS detection, Atmos. Meas. Tech., 6, 3225–3241, https://doi.org/10.5194/amt-6-3225-2013, 2013.
Gao, D., Ripley, S., Weichenthal, S., and Godri Pollitt, K. J.: Ambient particulate matter oxidative potential: Chemical determinants, associated health effects, and strategies for risk management, Free Rad. Biol. Med., 151, 7–25, https://doi.org/10.1016/j.freeradbiomed.2020.04.028, 2020a.
Gao, D., Godri Pollitt, K. J., Mulholland, J. A., Russell, A. G., and Weber, R. J.: Characterization and comparison of PM2.5 oxidative potential assessed by two acellular assays, Atmos. Chem. Phys., 20, 5197–5210, https://doi.org/10.5194/acp-20-5197-2020, 2020b.
Grange, S. K., Uzu, G., Weber, S., Jaffrezo, J.-L., and Hueglin, C.: Linking Switzerland's PM10 and PM2.5 oxidative potential (OP) with emission sources, Atmos. Chem. Phys., 22, 7029–7050, https://doi.org/10.5194/acp-22-7029-2022, 2022.
Grigas, T., Ovadnevaite, J., Ceburnis, D., Moran, E., McGovern, F. M., Jennings, S. G., and O'Dowd, C.: Sophisticated Clean Air Strategies Required to Mitigate Against Particulate Organic Pollution, Sci. Rep., 7, 44737, https://doi.org/10.1038/srep44737, 2017.
Grigoratos, T. and Martini, G.: Brake wear particle emissions: a review, Environ. Sci. Pollut. Res., 22, 2491–2504, https://doi.org/10.1007/s11356-014-3696-8, 2015.
Hays, M. D., Cho, S.-H., Baldauf, R., Schauer, J. J., and Shafer, M.: Particle size distributions of metal and non-metal elements in an urban near-highway environment, Atmos. Environ., 45, 925–934, https://doi.org/10.1016/j.atmosenv.2010.11.010, 2011.
He, L. and Zhang, J. (Jim): Particulate matter (PM) oxidative potential: Measurement methods and links to PM physicochemical characteristics and health effects, Crit. Rev. Env. Sci. Tec., 53, 177–197, https://doi.org/10.1080/10643389.2022.2050148, 2023.
Henry, R., Norris, G. A., Vedantham, R., and Turner, J. R.: Source region identification using kernel smoothing, Environ. Sci. Technol., 43, 4090–4097, https://doi.org/10.1021/es8011723, 2009.
Hu, Y., Wu, M., Li, Y., and Liu, X.: Influence of PM1 exposure on total and cause-specific respiratory diseases: a systematic review and meta-analysis, Environ. Sci. Pollut. Res. Int., 29, 15117–15126, https://doi.org/10.1007/s11356-021-16536-0, 2022.
in't Veld, M., Pandolfi, M., Amato, F., Pérez, N., Reche, C., Dominutti, P., Jaffrezo, J., Alastuey, A., Querol, X., and Uzu, G.: Discovering oxidative potential (OP) drivers of atmospheric PM10, PM2.5, and PM1 simultaneously in North-Eastern Spain, Sci. Total Environ., 857, 159386, https://doi.org/10.1016/j.scitotenv.2022.159386, 2023.
Jacob, D. J.: Oxidizing Power of the Troposphere, Introduction to Atmospheric Chemistry, Chapter 11, 199–219, https://doi.org/10.1515/9781400841547, 1999.
Janssen, N. A. H., Yang, A., Strak, M., Steenhof, M., Hellack, B., Gerlofs-Nijland, M. E., Kuhlbusch, T., Kelly, F., Harrison, R., Brunekreef, B., Hoek, G., and Cassee, F.: Oxidative potential of particulate matter collected at sites with different source characteristics, Sci. Total Environ., 472, 572–581, https://doi.org/10.1016/j.scitotenv.2013.11.099, 2014.
Kelly, F. J.: Education: Oxidative Stress: Its Role in Air Pollution and Adverse Health Effects, Occup. Environ. Med., 60, 612–616, 2003.
Kiendler-Scharr, A., Mensah, A. A., Friese, E., Topping, D., Nemitz, E., Prevot, A. S. H., Äijälä, M., Allan, J., Canonaco, F., Canagaratna, M., Carbone, S., Crippa, M., Dall Osto, M., Day, D. A., De Carlo, P., Di Marco, C. F., Elbern, H., Eriksson, A., Freney, E., Hao, L., Herrmann, H., Hildebrandt, L., Hillamo, R., Jimenez, J. L., Laaksonen, A., McFiggans, G., Mohr, C., O'Dowd, C., Otjes, R., Ovadnevaite, J., Pandis, S. N., Poulain, L., Schlag, P., Sellegri, K., Swietlicki, E., Tiitta, P., Vermeulen, A., Wahner, A., Worsnop, D., and Wu, H.-C.: Ubiquity of organic nitrates from nighttime chemistry in the European submicron aerosol, Geophys. Res. Lett., 43, 7735–7744, https://doi.org/10.1002/2016GL069239, 2016.
Kumar, P., Robins, A., Vardoulakis, S., and Britter, R.: A review of the characteristics of nanoparticles in the urban atmosphere and the prospects for developing regulatory controls, Atmos. Environ., 44, 5035–5052, https://doi.org/10.1016/j.atmosenv.2010.08.016, 2010.
Lelieveld, J., Evans, J. S., Fnais, M., Giannadaki, D., and Pozzer, A.: The contribution of outdoor air pollution sources to premature mortality on a global scale, Nature, 525, 367–371, https://doi.org/10.1038/nature15371, 2015.
Lin, C., Ceburnis, D., Xu, W., Heffernan, E., Hellebust, S., Gallagher, J., Huang, R.-J., O'Dowd, C., and Ovadnevaite, J.: The impact of traffic on air quality in Ireland: insights from the simultaneous kerbside and suburban monitoring of submicron aerosols, Atmos. Chem. Phys., 20, 10513–10529, https://doi.org/10.5194/acp-20-10513-2020, 2020.
Manigrasso, M., Costabile, F., Liberto, L. D., Gobbi, G. P., Gualtieri, M., Zanini, G., and Avino, P.: Size resolved aerosol respiratory doses in a Mediterranean urban area: From PM10 to ultrafine particles, Environ. Int., 141, 105714, https://doi.org/10.1016/j.envint.2020.105714, 2020.
Manousakas, M., Furger, M., Daellenbach, K. R., Canonaco, F., Chen, G., Tobler, A., Rai, P., Qi, L., Tremper, A. H., Green, D., Hueglin, C., Slowik, J. G., El Haddad, I., and Prevot, A. S. H.: Source identification of the elemental fraction of particulate matter using size segregated, highly time-resolved data and an optimized source apportionment approach, Atmos. Environ., 14, 100165, https://doi.org/10.1016/j.aeaoa.2022.100165, 2022.
Marsal, A., Sauvain, J.-J., Thomas, A., Lyon-Caen, S., Borlaza, L. J. S., Philippat, C., Jaffrezo, J.-L., Boudier, A., Darfeuil, S., Elazzouzi, R., Lepeule, J., Chartier, R., Bayat, S., Slama, R., Siroux, V., and Uzu, G.: Effects of personal exposure to the oxidative potential of PM2.5 on oxidative stress biomarkers in pregnant women, Sci. Total Environ., 911, 168475, https://doi.org/10.1016/j.scitotenv.2023.168475, 2023a.
Marsal, A., Slama, R., Lyon, -Caen Sarah, Borlaza, L. J. S., Jaffrezo, J.-L., Boudier, A., Darfeuil, S., Elazzouzi, R., Gioria, Y., Lepeule, J., Chartier, R., Pin, I., Quentin, J., Bayat, S., Uzu, G., Siroux, V., and null, null: Prenatal Exposure to PM2.5 Oxidative Potential and Lung Function in Infants and Preschool- Age Children: A Prospective Study, Environ. Health Persp., 131, 017004, https://doi.org/10.1289/EHP11155, 2023b.
McGuire, M. L., Chang, R. Y.-W., Slowik, J. G., Jeong, C.-H., Healy, R. M., Lu, G., Mihele, C., Abbatt, J. P. D., Brook, J. R., and Evans, G. J.: Enhancing non-refractory aerosol apportionment from an urban industrial site through receptor modeling of complete high time-resolution aerosol mass spectra, Atmos. Chem. Phys., 14, 8017–8042, https://doi.org/10.5194/acp-14-8017-2014, 2014.
Medina S., Pascal M., and Tillier C.: Impacts de l'exposition chronique aux particules fines sur la mortalité en France continentale et analyse des gains en santé de plusieurs scénarios de réduction de la pollution atmosphérique, Saint-Maurice, Santé Publique France, ISBN-NET 979-10-289-0216-2, 63 pp., 2016.
Mohan, R.: Green bismuth, Nat. Chem., 2, 336–336, https://doi.org/10.1038/nchem.609, 2010.
Møller, P.: Oxidative stress and inflammation generated DNA damage by exposure to air pollution particles, Mutation Research, 34, 133–166, https://doi.org/10.1016/j.mrrev.2014.09.001, 2014.
Morawska, L. and (Jim) Zhang, J.: Combustion sources of particles. 1. Health relevance and source signatures, Chemosphere, 49, 1045–1058, https://doi.org/10.1016/S0045-6535(02)00241-2, 2002.
Moufarrej, L., Courcot, D., and Ledoux, F.: Assessment of the PM2.5 oxidative potential in a coastal industrial city in Northern France: Relationships with chemical composition, local emissions and long range sources, Sci. Total Environ., 748, 141448, https://doi.org/10.1016/j.scitotenv.2020.141448, 2020.
Münzel, T., Hahad, O., Sørensen, M., Lelieveld, J., Duerr, G. D., Nieuwenhuijsen, M., and Daiber, A.: Environmental risk factors and cardiovascular diseases: a comprehensive expert review, Cardiovasc. Res., 118, 2880–2902, https://doi.org/10.1093/cvr/cvab316, 2022.
Ng, N. L., Canagaratna, M. R., Jimenez, J. L., Zhang, Q., Ulbrich, I. M., and Worsnop, D. R.: Real-Time Methods for Estimating Organic Component Mass Concentrations from Aerosol Mass Spectrometer Data, Environ. Sci. Technol., 45, 910–916, https://doi.org/10.1021/es102951k, 2011.
Niranjan, R. and Thakur, A. K.: The Toxicological Mechanisms of Environmental Soot (Black Carbon) and Carbon Black: Focus on Oxidative Stress and Inflammatory Pathways, Front. Immunol., 8, 763, https://doi.org/10.3389/fimmu.2017.00763, 2017.
Nursanto, F. R., Meinen, R., Holzinger, R., Krol, M. C., Liu, X., Dusek, U., Henzing, B., and Fry, J. L.: What chemical species are responsible for new particle formation and growth in the Netherlands? A hybrid positive matrix factorization (PMF) analysis using aerosol composition (ACSM) and size (SMPS), EGUsphere [preprint], https://doi.org/10.5194/egusphere-2023-554, 2023.
Paatero, P.: The Multilinear Engine – A Table-Driven, Least Squares Program for Solving Multilinear Problems, Including the n-Way Parallel Factor Analysis Model, J. Comput. Graph. Stat., 8, 854–888, https://doi.org/10.1080/10618600.1999.10474853, 1999.
Paatero, P. and Hopke, P. K.: Rotational tools for factor analytic models, J. Chemomet., 23, 91–100, https://doi.org/10.1002/cem.1197, 2009.
Paatero, P. and Tapper, U.: Positive matrix factorization: A non-negative factor model with optimal utilization of error estimates of data values, Environmetrics, 5, 111–126, https://doi.org/10.1002/env.3170050203, 1994.
Pandolfi, M., Gonzalez-Castanedo, Y., Alastuey, A., de la Rosa, J. D., Mantilla, E., de la Campa, A. S., Querol, X., Pey, J., Amato, F., and Moreno, T.: Source apportionment of PM10 and PM2.5 at multiple sites in the strait of Gibraltar by PMF: impact of shipping emissions, Environ. Sci. Pollut. Res., 18, 260–269, https://doi.org/10.1007/s11356-010-0373-4, 2011.
Panko, J., Kreider, M., and Unice, K.: Chapter 7 – Review of Tire Wear Emissions: A Review of Tire Emission Measurement Studies: Identification of Gaps and Future Needs, in: Non-Exhaust Emissions, edited by: Amato, F., Academic Press, 147–160, https://doi.org/10.1016/B978-0-12-811770-5.00007-8, 2018.
Pant, P. and Harrison, R. M.: Estimation of the contribution of road traffic emissions to particulate matter concentrations from field measurements: A review, Atmos. Environ., 77, 78–97, https://doi.org/10.1016/j.atmosenv.2013.04.028, 2013.
Pant, P., Baker, S. J., Shukla, A., Maikawa, C., Godri Pollitt, K. J., and Harrison, R. M.: The PM10 fraction of road dust in the UK and India: Characterization, source profiles and oxidative potential, Sci. Total Environ., 530–531, 445–452, https://doi.org/10.1016/j.scitotenv.2015.05.084, 2015.
Perrino, C., Tiwari, S., Catrambone, M., Torre, S. D., Rantica, E., and Canepari, S.: Chemical characterization of atmospheric PM in Delhi, India, during different periods of the year including Diwali festival, Atmos. Pollut. Res., 2, 418–427, https://doi.org/10.5094/APR.2011.048, 2011.
Petit, J.-E., Favez, O., Sciare, J., Canonaco, F., Croteau, P., Močnik, G., Jayne, J., Worsnop, D., and Leoz-Garziandia, E.: Submicron aerosol source apportionment of wintertime pollution in Paris, France by double positive matrix factorization (PMF2) using an aerosol chemical speciation monitor (ACSM) and a multi-wavelength Aethalometer, Atmos. Chem. Phys., 14, 13773–13787, https://doi.org/10.5194/acp-14-13773-2014, 2014.
Petit, J.-E., Favez, O., Albinet, A., and Canonaco, F.: A user-friendly tool for comprehensive evaluation of the geographical origins of atmospheric pollution: Wind and trajectory analyses, Environ. Modell. Softw., 88, 183–187, https://doi.org/10.1016/j.envsoft.2016.11.022, 2017.
Pietrogrande, M. C., Romanato, L., and Russo, M.: Synergistic and Antagonistic Effects of Aerosol Components on Its Oxidative Potential as Predictor of Particle Toxicity, Toxics, 10, 196, https://doi.org/10.3390/toxics10040196, 2022.
Piscitello, A., Bianco, C., Casasso, A., and Sethi, R.: Non-exhaust traffic emissions: Sources, characterization, and mitigation measures, Sci. Total Environ., 766, 144440, https://doi.org/10.1016/j.scitotenv.2020.144440, 2021.
Polissar, A. V., Hopke, P. K., Paatero, P., Malm, W. C., and Sisler, J. F.: Atmospheric aerosol over Alaska: 2. Elemental composition and sources, J. Geophys. Res.-Atmos., 103, 19045–19057, https://doi.org/10.1029/98JD01212, 1998.
Polissar, A. V., Hopke, P. K., and Poirot, R. L.: Atmospheric aerosol over Vermont: chemical composition and sources, Environ. Sci. Technol., 35, 4604–4621, https://doi.org/10.1021/es0105865, 2001.
Pope, C. A.: Air Pollution and Health – Good News and Bad, N. Engl. J. Med., 351, 1132–1134, https://doi.org/10.1056/NEJMe048182, 2004.
Rai, P., Furger, M., Slowik, J. G., Canonaco, F., Fröhlich, R., Hüglin, C., Minguillón, M. C., Petterson, K., Baltensperger, U., and Prévôt, A. S. H.: Source apportionment of highly time-resolved elements during a firework episode from a rural freeway site in Switzerland, Atmos. Chem. Phys., 20, 1657–1674, https://doi.org/10.5194/acp-20-1657-2020, 2020.
Rai, P., Furger, M., Slowik, J. G., Zhong, H., Tong, Y., Wang, L., Duan, J., Gu, Y., Qi, L., Huang, R. J., Cao, J., Baltensperger, U., and Prévôt, A. S. H.: Characteristics and sources of hourly elements in PM10 and PM2.5 during wintertime in Beijing, Environ. Pollut., 278, 116865, https://doi.org/10.1016/j.envpol.2021.116865, 2021.
Reff, A., Eberly, S. I., and Bhave, P. V.: Receptor Modeling of Ambient Particulate Matter Data Using Positive Matrix Factorization: Review of Existing Methods, J. Air Waste Manage. Assoc., 57, 146–154, https://doi.org/10.1080/10473289.2007.10465319, 2007.
Riffault, V., Arndt, J., Marris, H., Mbengue, S., Setyan, A., Alleman, L. Y., Deboudt, K., Flament, P., Augustin, P., Delbarre, H., and Wenger, J.: Fine and Ultrafine Particles in the Vicinity of Industrial Activities: A Review, Crit. Rev. Environ. Sci. Technol., 45, 2305–2356, https://doi.org/10.1080/10643389.2015.1025636, 2015.
Roubicek, V., Raclavska, H., Juchelkova, D., and Filip, P.: Wear and environmental aspects of composite materials for automotive braking industry, Wear, 265, 167–175, https://doi.org/10.1016/j.wear.2007.09.006, 2008.
Ryder, O. S., DeWinter, J. L., Brown, S. G., Hoffman, K., Frey, B., and Mirzakhalili, A.: Assessment of particulate toxic metals at an Environmental Justice community, Atmos. Environ., 6, 100070, https://doi.org/10.1016/j.aeaoa.2020.100070, 2020.
Saffari, A., Hasheminassab, S., Wang, D., Shafer, M. M., Schauer, J. J., and Sioutas, C.: Impact of primary and secondary organic sources on the oxidative potential of quasi-ultrafine particles (PM0.25) at three contrasting locations in the Los Angeles Basin, Atmos. Environ., 120, 286–296, https://doi.org/10.1016/j.atmosenv.2015.09.022, 2015.
Salameh, D., Pey, J., Bozzetti, C., El Haddad, I., Detournay, A., Sylvestre, A., Canonaco, F., Armengaud, A., Piga, D., Robin, D., Prevot, A. S. H., Jaffrezo, J.-L., Wortham, H., and Marchand, N.: Sources of PM2.5 at an urban-industrial Mediterranean city, Marseille (France): Application of the ME-2 solver to inorganic and organic markers, Atmos. Res., 214, 263–274, https://doi.org/10.1016/j.atmosres.2018.08.005, 2018.
Sandradewi, J., Prévôt, A. S. H., Szidat, S., Perron, N., Alfarra, M. R., Lanz, V. A., Weingartner, E., and Baltensperger, U.: Using Aerosol Light Absorption Measurements for the Quantitative Determination of Wood Burning and Traffic Emission Contributions to Particulate Matter, Environ. Sci. Technol., 42, 3316–3323, https://doi.org/10.1021/es702253m, 2008.
Shang, J., Jin, M., Chen, Y., Pan, Y., Li, Y., Tao, X., Cheng, Z., Meng, Q., Li, Q., Jia, G., Zhu, T., Hao, W., and Wei, X.: Comparison of lung damage in mice exposed to black carbon particles and 1,4-naphthoquinone coated black carbon particles, Sci. Total Environ., 580, 572–581, https://doi.org/10.1016/j.scitotenv.2016.11.214, 2016.
Slowik, J. G., Vlasenko, A., McGuire, M., Evans, G. J., and Abbatt, J. P. D.: Simultaneous factor analysis of organic particle and gas mass spectra: AMS and PTR-MS measurements at an urban site, Atmos. Chem. Phys., 10, 1969–1988, https://doi.org/10.5194/acp-10-1969-2010, 2010.
Strak, M., Janssen, N. A. H., Godri, K. J., Gosens, I., Mudway, I. S., Cassee, F. R., Lebret, E., Kelly, F. J., Harrison, R. M., Brunekreef, B., Steenhof, M., and Hoek, G.: Respiratory Health Effects of Airborne Particulate Matter: The Role of Particle Size, Composition, and Oxidative Potential – The RAPTES Project, Environ. Health Persp., 120, 1183–1189, https://doi.org/10.1289/ehp.1104389, 2012.
Sturm, R.: Modelling the deposition of fine particulate matter (PM2.5) in the human respiratory tract, AME Med. J., 5, 5–14, https://doi.org/10.21037/amj.2020.03.04, 2020.
Sun, Y., Wang, Z., Dong, H., Yang, T., Li, J., Pan, X., Chen, P., and Jayne, J. T.: Characterization of summer organic and inorganic aerosols in Beijing, China with an Aerosol Chemical Speciation Monitor, Atmos. Environ., 51, 250–259, https://doi.org/10.1016/j.atmosenv.2012.01.013, 2012.
Sylvestre, A., Mizzi, A., Mathiot, S., Masson, F., Jaffrezo, J. L., Dron, J., Mesbah, B., Wortham, H., and Marchand, N.: Comprehensive chemical characterization of industrial PM2.5 from steel industry activities, Atmos. Environ., 152, 180–190, https://doi.org/10.1016/j.atmosenv.2016.12.032, 2017.
Tong, Y., Qi, L., Stefenelli, G., Wang, D. S., Canonaco, F., Baltensperger, U., Prévôt, A. S. H., and Slowik, J. G.: Quantification of primary and secondary organic aerosol sources by combined factor analysis of extractive electrospray ionisation and aerosol mass spectrometer measurements (EESI-TOF and AMS), Atmos. Meas. Tech., 15, 7265–7291, https://doi.org/10.5194/amt-15-7265-2022, 2022.
Vecchi, R., Bernardoni, V., Cricchio, D., D'Alessandro, A., Fermo, P., Lucarelli, F., Nava, S., Piazzalunga, A., and Valli, G.: The impact of fireworks on airborne particles, Atmos. Environ., 42, 1121–1132, https://doi.org/10.1016/j.atmosenv.2007.10.047, 2008.
Venables, W. N. and Ripley, B. D.: Modern applied statistics with S-Plus, 2nd Edn., Springer, New York, 548 pp., ISBN 0-387-98214-0, 1997.
Verma, V., Fang, T., Guo, H., King, L., Bates, J. T., Peltier, R. E., Edgerton, E., Russell, A. G., and Weber, R. J.: Reactive oxygen species associated with water-soluble PM2.5 in the southeastern United States: spatiotemporal trends and source apportionment, Atmos. Chem. Phys., 14, 12915–12930, https://doi.org/10.5194/acp-14-12915-2014, 2014.
Verma, V., Wang, Y., El-Afifi, R., Fang, T., Rowland, J., Russell, A. G., and Weber, R. J.: Fractionating ambient humic-like substances (HULIS) for their reactive oxygen species activity – Assessing the importance of quinones and atmospheric aging, Atmos. Environ., 120, 351–359, https://doi.org/10.1016/j.atmosenv.2015.09.010, 2015.
Via, M., Yus-Díez, J., Canonaco, F., Petit, J.-E., Hopke, P. K., Reche, C., Pandolfi, M., Ivančič, M., Rigler, M., Prévôt, A. S. H., Querol, X., Alastuey, A., and Minguillón, M. C.: Towards a Better Understanding of Fine Pm Sources: Online and Offline Datasets Combination in a Single Pmf, Environ. Int., https://doi.org/10.2139/ssrn.4370338, 2023.
Viana, M., Hammingh, P., Colette, A., Querol, X., Degraeuwe, B., de Vlieger, I., and van Aardenne, J.: Impact of maritime transport emissions on coastal air quality in Europe, Atmos. Environ., 90, 96–105, https://doi.org/10.1016/j.atmosenv.2014.03.046, 2014.
Visser, S., Slowik, J. G., Furger, M., Zotter, P., Bukowiecki, N., Canonaco, F., Flechsig, U., Appel, K., Green, D. C., Tremper, A. H., Young, D. E., Williams, P. I., Allan, J. D., Coe, H., Williams, L. R., Mohr, C., Xu, L., Ng, N. L., Nemitz, E., Barlow, J. F., Halios, C. H., Fleming, Z. L., Baltensperger, U., and Prévôt, A. S. H.: Advanced source apportionment of size-resolved trace elements at multiple sites in London during winter, Atmos. Chem. Phys., 15, 11291–11309, https://doi.org/10.5194/acp-15-11291-2015, 2015a.
Visser, S., Slowik, J. G., Furger, M., Zotter, P., Bukowiecki, N., Dressler, R., Flechsig, U., Appel, K., Green, D. C., Tremper, A. H., Young, D. E., Williams, P. I., Allan, J. D., Herndon, S. C., Williams, L. R., Mohr, C., Xu, L., Ng, N. L., Detournay, A., Barlow, J. F., Halios, C. H., Fleming, Z. L., Baltensperger, U., and Prévôt, A. S. H.: Kerb and urban increment of highly time-resolved trace elements in PM10, PM2.5 and PM1.0 winter aerosol in London during ClearfLo 2012, Atmos. Chem. Phys., 15, 2367–2386, https://doi.org/10.5194/acp-15-2367-2015, 2015b.
Waked, A., Favez, O., Alleman, L. Y., Piot, C., Petit, J.-E., Delaunay, T., Verlinden, E., Golly, B., Besombes, J.-L., Jaffrezo, J.-L., and Leoz-Garziandia, E.: Source apportionment of PM10 in a north-western Europe regional urban background site (Lens, France) using positive matrix factorization and including primary biogenic emissions, Atmos. Chem. Phys., 14, 3325–3346, https://doi.org/10.5194/acp-14-3325-2014, 2014.
Weber, S., Uzu, G., Calas, A., Chevrier, F., Besombes, J.-L., Charron, A., Salameh, D., Ježek, I., Močnik, G., and Jaffrezo, J.-L.: An apportionment method for the oxidative potential of atmospheric particulate matter sources: application to a one-year study in Chamonix, France, Atmos. Chem. Phys., 18, 9617–9629, https://doi.org/10.5194/acp-18-9617-2018, 2018.
Weber, S., Salameh, D., Albinet, A., Alleman, L. Y., Waked, A., Besombes, J.-L., Jacob, V., Guillaud, G., Meshbah, B., Rocq, B., Hulin, A., Dominik-Sègue, M., Chrétien, E., Jaffrezo, J.-L., and Favez, O.: Comparison of PM10 Sources Profiles at 15 French Sites Using a Harmonized Constrained Positive Matrix Factorization Approach, Atmosphere, 10, 310, https://doi.org/10.3390/atmos10060310, 2019.
Weber, S., Uzu, G., Favez, O., Borlaza, L. J. S., Calas, A., Salameh, D., Chevrier, F., Allard, J., Besombes, J.-L., Albinet, A., Pontet, S., Mesbah, B., Gille, G., Zhang, S., Pallares, C., Leoz-Garziandia, E., and Jaffrezo, J.-L.: Source apportionment of atmospheric PM10 oxidative potential: synthesis of 15 year-round urban datasets in France, Atmos. Chem. Phys., 21, 11353–11378, https://doi.org/10.5194/acp-21-11353-2021, 2021.
Weichenthal, S., Lavigne, E., Evans, G., Pollitt, K., and Burnett, R. T.: Ambient PM2.5 and risk of emergency room visits for myocardial infarction: impact of regional PM2.5 oxidative potential: a case-crossover study, Environ. Health, 15, 46, https://doi.org/10.1186/s12940-016-0129-9, 2016.
WHO: Who Global Air Quality Guidelines, Int. J. Public Health, 1604465, https://doi.org/10.3389/ijph.2021.1604465, 2021.
Xu, L., Suresh, S., Guo, H., Weber, R. J., and Ng, N. L.: Aerosol characterization over the southeastern United States using high-resolution aerosol mass spectrometry: spatial and seasonal variation of aerosol composition and sources with a focus on organic nitrates, Atmos. Chem. Phys., 15, 7307–7336, https://doi.org/10.5194/acp-15-7307-2015, 2015.
Yu, H., Wei, J., Cheng, Y., Subedi, K., and Verma, V.: Synergistic and Antagonistic Interactions among the Particulate Matter Components in Generating Reactive Oxygen Species Based on the Dithiothreitol Assay, Environ. Sci. Technol., 52, 2261–2270, https://doi.org/10.1021/acs.est.7b04261, 2018.
Yu, S., Liu, W., Xu, Y., Yi, K., Zhou, M., Tao, S., and Liu, W.: Characteristics and oxidative potential of atmospheric PM2.5 in Beijing: Source apportionment and seasonal variation, Sci. Total Environ., 650, 277–287, https://doi.org/10.1016/j.scitotenv.2018.09.021, 2019.
Zhang, X., Staimer, N., Tjoa, T., Gillen, D. L., Schauer, J. J., Shafer, M. M., Hasheminassab, S., Pakbin, P., Longhurst, J., Sioutas, C., and Delfino, R. J.: Associations between microvascular function and short-term exposure to traffic-related air pollution and particulate matter oxidative potential, Environ. Health, 15, 81, https://doi.org/10.1186/s12940-016-0157-5, 2016.
Zhuang, H., Chan, C. K., Fang, M., and Wexler, A. S.: Formation of nitrate and non-sea-salt sulfate on coarse particles, Atmos. Environ., 33, 4223–4233, https://doi.org/10.1016/S1352-2310(99)00186-7, 1999.
Zografou, O., Gini, M., Manousakas, M. I., Chen, G., Kalogridis, A. C., Diapouli, E., Pappa, A., and Eleftheriadis, K.: Combined organic and inorganic source apportionment on yearlong ToF-ACSM dataset at a suburban station in Athens, Atmos. Meas. Tech., 15, 4675–4692, https://doi.org/10.5194/amt-15-4675-2022, 2022.
Zotter, P., Herich, H., Gysel, M., El-Haddad, I., Zhang, Y., Močnik, G., Hüglin, C., Baltensperger, U., Szidat, S., and Prévôt, A. S. H.: Evaluation of the absorption Ångström exponents for traffic and wood burning in the Aethalometer-based source apportionment using radiocarbon measurements of ambient aerosol, Atmos. Chem. Phys., 17, 4229–4249, https://doi.org/10.5194/acp-17-4229-2017, 2017.