the Creative Commons Attribution 4.0 License.
the Creative Commons Attribution 4.0 License.
 | 04 Mar 2024
Chemical composition, sources and formation mechanism of urban PM2.5 in Southwest China: a case study at the beginning of 2023
Junke Zhang
Yunfei Su
Chunying Chen
Wenkai Guo
Qinwen Tan
Miao Feng
Danlin Song
Tao Jiang
Qiang Chen
Yuan Li
Wei Li
Yizhi Wang
Xiaojuan Huang
Lin Han
Wanqing Wu
Gehui Wang
Despite significant improvements in air quality in recent years, the Sichuan Basin (SCB) is still facing frequent haze pollution in winter, and the causes of severe haze formation have not yet been fully investigated. In this study, the chemical components of PM2.5 (i.e., particulate matter with an aerodynamic diameter of less than 2.5 µm) in a typical pollution period at the beginning of 2023 in Chengdu, a megacity in the SCB, were characterized by bulk-chemical and single-particle analysis, and the PM2.5 sources and formation mechanism of pollution were analyzed. The average mass concentration of PM2.5 during the study period was 95.6 ± 28.7 µg m−3. Organic matter (OM) was the most abundant component (35.3 %), followed by nitrate (22.0 %), sulfate (9.2 %) and ammonium (7.8 %). The individual aerosol particles were classified into five categories, i.e., mineral, OM, secondary inorganic aerosol (SIA), soot and fly ash/metal particles, and most of them were in the state of being internally mixed. The entire observation period could be divided into two non-pollution periods (NP-1 and NP-2) and two haze periods (Haze-1 and Haze-2). With the evolution of pollution, the bulk-chemical and single-particle analysis exhibited similar characteristics, suggesting that Haze-1 was mainly caused by pollutants related to fossil fuel combustion, especially local mobile sources, while Haze-2 was triggered by the rapidly increasing secondary pollutants, which mainly came from regional transmission. The PM2.5 sources included dust (8.5 %), biomass burning (3.5 %), coal combustion (15.4 %), industrial processes (6.5 %), vehicular emissions (25.6 %) and secondary sources (40.5 %). Analysis of Weather Research and Forecasting model with Chemistry (WRF-Chem) model results showed that the average contributions of local sources and regional transmission to pollution in Chengdu were the same (50 % vs. 50 %). In addition, the source composition and WRF-Chem simulation results in different periods confirmed our analysis of the formation mechanisms of the two haze events. This study confirms that further significant reductions in PM2.5 in Chengdu are still needed, and more effective policies for local emission reduction or joint prevention and control of regional air pollution will be necessary in the future.
- Article
(8379 KB) - Full-text XML
-
Supplement
(1387 KB) - BibTeX
- EndNote


In the past few decades, large quantities of pollutants have been emitted during the rapid urbanization, socioeconomic development and associated increase in motorized vehicles in China, which have caused frequent haze events, particularly for some of the highly industrialized and densely populated regions, such as the North China Plain (NCP), Pearl River Delta (PRD), Yangtze River Delta (YRD), Fenwei Plain (FWP) and Sichuan Basin (SCB) (J. K. Zhang et al., 2017; Ji et al., 2014; Liu et al., 2016; Zhu et al., 2016; An et al., 2019; Huang et al., 2014; Xu et al., 2016; Zhang et al., 2015; X. Wang et al., 2018). PM2.5 (i.e., particulate matter with an aerodynamic diameter of less than 2.5 µm) is the most important species that causes haze and comprises a complex mixture of species either emitted directly into the atmosphere (primary) or produced in the air by gas-to-particle conversion (secondary). Many studies have pointed out that elevated levels of PM2.5 can reduce visibility, adversely affect human health and ecosystems, and influence climate change directly by absorbing and reflecting solar radiation and indirectly by modifying cloud formation and properties (Pöschl, 2005; Seinfeld and Pandis, 2006; Gao et al., 2015).
Accurate analysis of PM2.5 sources and clarification of pollution formation mechanisms are considered important prerequisites for formulating effective science-based pollution reduction policies (Huang et al., 2017; Wang et al., 2014; C. Zhang et al., 2020; H. Wang et al., 2018; J. Zhang et al., 2020). Therefore, much research on these scientific issues has been conducted, with extremely valuable results obtained. For example, it has been noted that stagnant meteorological conditions (e.g., low wind speed (WS), high relative humidity (RH) and a shallow boundary layer), primary emissions (e.g., industry, households and vehicular emissions), secondary formation (e.g., homogeneous or heterogeneous reactions) and regional air transport can initiate the rapid formation and persistent evolution of haze episodes in China (Wang et al., 2014; Huang et al., 2014; Song et al., 2022; J. Zhang et al., 2020; Zhang et al., 2015). Moreover, the two-way feedback between the accumulation of air pollutants and depression of the atmospheric boundary layer can also aggravate haze pollution (An et al., 2019). The results of these studies have helped guide the formulation of China's air quality improvement policies in recent years, such as the Atmospheric Pollution Prevention and Control Action Plan (APPCAP) during 2013–2017 and the Three-year Action Plan to Win the Blue Sky Defense War (BSDW) during 2018–2020 (Geng et al., 2019; Huang et al., 2014, 2021b; Wang et al., 2022a), and eventually led to a reduction in PM2.5 mass concentrations in various regions across China. For example, the annual mean PM2.5 mass concentration in China and its three key polluted areas, i.e., the Beijing–Tianjin–Hebei (BTH) and its surrounding areas, the YRD and FWP, decreased from 39, 60, 44 and 58 µg m−3 in 2018 to 29, 44, 31 and 46 µg m−3 in 2022, respectively. Meanwhile, the concentration of SO2, one of the important gaseous precursors of PM2.5, has decreased from 14, 20, 11 and 24 µg m−3 to 9, 10, 7 and 9 µg m−3, respectively (https://www.mee.gov.cn/hjzl/sthjzk/zghjzkgb/, last access: 20 January 2024).
Analyzing the sources and formation mechanism of PM2.5 pollution is intrinsically linked to its physicochemical characteristics, such as the chemical composition, particle size distribution and mixing state, and a variety of methods have been used in this regard. Among these methods, bulk-chemical and single-particle analyses are two important methods used currently, which can characterize PM2.5 from different perspectives. Bulk-chemical analysis methods, such as filter sampling or using instruments like an aerosol mass spectrometer, can accurately determine the mass concentration of PM2.5 and its chemical components (e.g., organic matter (OM), inorganic components and metals) (Zhang et al., 2014; Wang et al., 2022a; Xu et al., 2018). Since the air quality standard is based on the mass concentration of pollutants, these quantitative measurements can be directly related to the evaluation of air quality and play a vital role in the air quality improvement process. However, bulk-chemical analysis methods provide an overall analysis of the PM2.5 samples collected and therefore miss some critical microscopic particle information such as their morphology and mixing state, which is important for simulating and evaluating the impacts of PM2.5 on climate and human health. Thinking specifically about the mixing state of PM2.5, a change in it may cause pronounced changes to its secondary effects (such as optical properties, health effects, hygroscopicity or cloud condensation nuclei activity), even contrary to its initial state (Liu et al., 2021). For example, Zhang et al. (2008) found that coating with sulfuric acid and subsequent hygroscopic growth led to a 10-fold increase in the light-scattering coefficient of black carbon (BC) particles and a near 2-fold increase in the light absorption coefficient at a RH of 80 % as compared to uncoated BC particles. Fortunately, this microscopic information can be obtained by some single-particle analysis methods, such as the aerosol time-of-flight mass spectrometer, single-particle aerosol mass spectrometer, transmission electron microscopy (TEM) or nanoscale secondary ion mass spectrometry (J. Zhang et al., 2020; Li and Shao, 2009; Li et al., 2016; Liu et al., 2021). Due to the complementarity of the bulk-chemical and single-particle analysis methods in the determination of the physicochemical characteristics of PM2.5, an increasing number of studies have combined these two methods to study haze processes. Doing so provides more detailed information on the evolution, formation mechanisms and sources of PM2.5 pollution (J. Zhang et al., 2020; Zhang et al., 2021a). For example, J. Zhang et al. (2020) integrated filter sampling and TEM methods to investigate the formation mechanisms of two types of haze processes in Northeast China and found that one type of haze process was mainly induced by the accumulation of primary OM and deteriorated by secondary aerosol formation, while the other type was caused by the long-range transport of agricultural biomass burning emissions.
Across the different regions or cities of China, haze formation mechanisms will differ because of the different characteristics of emissions and meteorological conditions (Wang et al., 2021). The SCB, located in Southwest China, is not only one of China's most economically developed and industrialized regions, but it is also the area that most frequently experiences haze events. Chengdu is the largest city in the SCB, with a population of well over 20 million. In addition, Chengdu is the city with the highest number of motor vehicles in China (over 6 million, https://www.mps.gov.cn/n2254098/n4904352/c9244719/content.html, last access: 20 January 2024). Topographically, Chengdu is located in the western part of the SCB, which is surrounded by the Qinghai–Tibet Plateau, Yunnan–Guizhou Plateau, Qinling–Daba Mountains and Wushan Mountains in the west, south, north and east, respectively (Peng et al., 2020). Air pollution is a serious issue for this city, presumably due to its large number of pollutant emissions, unfavorable atmospheric diffusion conditions and relatively high humidity (Chen et al., 2022; Huang et al., 2018; Liao et al., 2017; H. Wang et al., 2018). Although the concentration of PM2.5 had decreased to 39.8 µg m−3 in 2021, it still did not meet the secondary grade of the Chinese National Ambient Air Quality Standard (CNAAQS; annual average of 35 µg m−3) and was 8 times the World Health Organization (WHO) guideline value (annual average of 5 µg m−3). At the same time, heavy haze pollution still occurs frequently in winter in Chengdu, which has a serious impact on the daily lives of local residents. Despite numerous studies having used multiple methods to investigate the physical, chemical and seasonal characteristics of PM2.5 during haze processes in Chengdu (Chen et al., 2022; Huang et al., 2018, 2021a; Tao et al., 2014; H. Wang et al., 2018), our knowledge of its sources, evolutionary processes and formation mechanisms is still incomplete. At the same time, recent research found that, with the reduction in pollution, PM2.5 in China has shown many new features, such as a higher nitrate contribution, an enhanced atmospheric oxidizing capability and a stronger secondary source contribution (Feng et al., 2021; Geng et al., 2019; Huang et al., 2021b; Song et al., 2022). This means that the formation mechanism of haze pollution in Chengdu may also be different from previous reports.
At the beginning of 2023, Chengdu experienced several severe haze events. The longest pollution process lasted for 12 d, and the highest daily average of the PM2.5 mass concentration reached 156 µg m−3, which is 2.1 times the CNAAQS (daily average of 75 µg m−3). Meanwhile, the proportion of mild and more severe pollution days in January and February reached 37.3 %. So far, the sources, evolutionary processes and formation mechanisms of these haze events remain unclear. Since the development of effective air pollution control policies relies on such knowledge, in-depth research on these heavy haze events is urgently needed. Accordingly, in this study, a continuous observation campaign at the beginning of 2023 was carried out in the field. The formation mechanisms of two haze events were analyzed based on bulk-chemical and single-particle methods as well as air quality model simulations. Here, we report (1) the mass concentration of PM2.5 and its chemical composition measured by bulk-chemical analysis, (2) the number composition of particulate matter and its mixing state measured by the single-particle method (i.e., TEM) and (3) the formation mechanisms of the two haze events by analyzing them via a combination of chemical component and source apportionment results along with model simulations. This case study may provide valuable information for understanding the formation mechanism of haze in this megacity and even in the broader SCB area, which can then serve as transferrable knowledge to help the government in adopting a scientific approach to forecasting and eliminating the occurrence of haze events in China.
2.1 Observational site
The field campaign was performed at the Air Quality Super Observatory, which is located in Qingyang District in the center of Chengdu (30.65° N, 104.03° E). Sampling was conducted on the roof of a building (approximately 25 m above the ground) from 26 January to 7 February 2023. The site has no surrounding tall buildings within 200 m and is affected by multiple local emissions, including nearby shopping malls, parks, restaurants, traffic and a variety of residential sources. Thus, the site is representative of a typical urban environment in Chengdu.
2.2 Aerosol chemical components, air pollutants and meteorological parameters
The mass concentrations of the main chemical components of PM2.5 (i.e., carbonaceous components, water-soluble inorganic ions and elements) were measured. The carbonaceous components, i.e., organic carbon (OC) and elemental carbon (EC), were measured with a semi-continuous analyzer (Model 4, Sunset Laboratory, USA). The air was drawn through two quartz-fiber filters packed together with a flow rate of 8 L min−1, and PM2.5 was collected onto a sampling spot of 1.31 cm2. The collected sample was subsequently analyzed by the thermal–optical method. The cations (Na+, NH, K+, Mg2+ and Ca2+) and anions (Cl−, NO and SO were measured with an In-situ Gas and Aerosol Composition Monitor (IGAC, Model S-611, Fortelice International Co., China), which is a semicontinuous monitor that separates gases and aerosols into liquid effluent for online chemical analysis at an hourly temporal resolution. The IGAC system mainly consists of three components, including a wet annular denuder, an aerosol collector and two ion chromatography systems. Air samples were pumped into the system at a flow rate of 16.7 L min−1. Gaseous and aerosol samples were alternately collected, evacuated and analyzed with a temporal resolution of 30 min. The elements (K, Al, Si, Ca, Ti, V, Cr, Mn, Fe, Co, Ni, Cu, Zn, As, Cd, Ba and Pb) were monitored by an Xact 625 Ambient Metals Monitor (Cooper Environmental Services LLC, USA). The ambient air was sampled on a Teflon filter tape through a PM2.5 cyclone inlet at a flow rate of 16.7 L min−1. Then, the sample was automatically analyzed by nondestructive energy-dispersive X-ray fluorescence to determine the mass of metals.
The hourly mass concentrations of several air pollutants (PM2.5, PM10, CO, SO2, O3 and CO) were downloaded from the website of the China National Environmental Monitoring Centre (http://www.cnemc.cn/, last access: 20 January 2024). Meteorological parameters, including air temperature (T), RH, WS, wind direction (WD) and visibility, were obtained from the meteorological station (WS600-UMB, Lufft, Germany) of the Sichuan Academy of Eco-Environmental Sciences, approximately 3.5 km away from the air quality observation station.
In addition, in order to analyze the interannual evolution of pollution in Chengdu and its pollution level in China, we also compared the main meteorological parameters (T, RH and WS, downloaded from https://www.timeanddate.com/, last access: 20 January 2024) and pollutants (PM2.5, CO, SO2, O3 and CO, downloaded from http://www.cnemc.cn/, last access: 20 January 2024) observed in the same time period as this study in 2015 and 2018 in Chengdu and in 2023 in some typical cities in various regions of China, including Beijing (representing the NCP), Shanghai (YRD), Guangzhou (PRD) and Xi'an (FWP) (Table S1). Unless otherwise specified, all online observation results in this paper are presented at a 1 h resolution and expressed in Beijing standard time, which is 8 h ahead of coordinated universal time.
2.3 Single-particle aerosol collection and analysis
Individual aerosol particles were collected onto copper TEM grids coated with carbon film (carbon type-B, 300-mesh copper; Tianld Co., China) using a DKL-2 sampler (Genstar Electronic Technology Co., Ltd., China) with a single-stage cascade impactor equipped with a 0.5 mm diameter jet nozzle at a flow rate of 1.0 L min−1 in four periods (two non-pollution periods and two haze periods; see Sect. 3.1.1). Sampling times varied from 30 s to 3 min, depending on the particle loading as estimated from the PM2.5 mass concentration. The collection efficiency of the impactor is 50 % for particles with an aerodynamic diameter of 0.1 mm and a density of 2 g cm−3 (Li and Shao, 2009; Marple et al., 1993). Individual particle samples were placed in a clean, airtight container with controlled T (25°) and RH (20 ± 3 %) before being analyzed via TEM.
Individual aerosol particle samples were analyzed by TEM at 200 kV accelerating voltage (JEM-2100, JEOL Ltd., Japan) equipped with an energy-dispersive X-ray spectrometer (EDS, INCA X-MaxN 80T, Oxford Instruments, United Kingdom). The morphology and mixing state of the aerosol particles were determined by TEM, while the EDS can detect elements with atomic weights corresponding to C and above. Cu was not quantified because the Cu grids would have led to interferences. Detailed information on individual particle analysis can be found in previous studies (Li et al., 2016; Deng et al., 2021; Zhang et al., 2021b). Ultimately, a total of 1325, 1159, 995 and 1870 particles in four periods with diameters < 2.5 µm were analyzed via TEM–EDS.
2.4 Data analysis
2.4.1 Chemical mass closure
According to previous studies (Huang et al., 2017; Zhan et al., 2023), the chemically reconstructed PM2.5 mass (PMchem) was calculated as comprised of eight categories, which can be expressed as follows.
In estimating OM, an OC-to-OM conversion factor of 1.6 was adopted for the aerosols at urban sites (Turpin and Lim, 2001). The calculation of mineral dust was performed on the basis of crustal element oxides. The Ti content was very low (0.01 µg m−3). Thus, eliminating the Ti content has an almost negligible influence on the estimation of the mineral dust. The mineral dust was calculated as follows.
Trace metals reflect the sum of 12 different heavy metals and are expressed as follows.
Similar to results in the YRD (Zhan et al., 2023) and BTH (Huang et al., 2017) regions in China, we found that the PMchem concentration was lower than that of the online PM2.5 mass concentration (PMonline), and the discrepancy between them can be considered a chemical component that we did not measure, which we define as “Unknown” as follows.
2.4.2 Weather Research and Forecasting model with Chemistry (WRF-Chem) simulation
WRF-Chem was used to investigate the contributions of local sources and regional transmission during different periods in Chengdu. Specifically, we set up two simulation scenarios. The first was the baseline scenario, for which the model setup and validation of the scenario are detailed in the Supplement (Sect. S1), and the second was the external emission scenario (sensitivity scenario), in which we eliminated all anthropogenic emissions in the D03 region (Chengdu administrative area). The model settings for the two scenarios were consistent except for the emission differences. By subtracting the sensitivity scenario from the baseline scenario, the contributions of local sources could be obtained. The calculation formulas for the relative contribution of local sources and regional transmission is as follows.
It is worth noting that this study mainly focuses on the contribution of anthropogenic sources, without considering the contribution of natural emissions such as biogenic sources.
2.4.3 Backward-trajectory and source contribution analysis
The National Oceanic and Atmospheric Administration (NOAA) Hybrid Single Particle Lagrangian Integrated Trajectory (HYSPLIT) model has been widely used to simulate and analyze the movement, deposition and diffusion of airflow (Zhang et al., 2014; Luo et al., 2020). In this study, the model was used to simulate 48 h backward trajectories every hour for the study period at the sampling site. The starting height for the backward trajectories was 300 m. The reanalysis data with a spatial resolution of 1° and a temporal resolution of 1 h were obtained from the Global Data Assimilation System (https://rda.ucar.edu/datasets/, last access: 20 January 2024). To identify the pollutant characteristics in the different dominant transport patterns, cluster analysis was performed on the trajectories using HYSPLIT, and six clusters were identified according to the similarity in their spatial distributions (Fig. S3).
The concentration-weighted trajectory (CWT) analysis method was further used to calculate the trajectory-weighted concentration. In the CWT method, the whole study area was divided into i×j grid cells, with the number of endpoints falling in the ijth cell, designated as nij. Then, each grid cell was assigned a weighted concentration by averaging the sampled pollutant concentrations that have associated trajectories crossing the grid cell, as follows.
Cij is the average weighted concentration in the ijth cell. l is the trajectory index. M is the total number of trajectories. cl and τijl are the pollutant concentration and residence time, respectively, of trajectory l.
To reduce the effect of small values of nij, the CWT values were multiplied by an arbitrary weighting function Wij.
nave is the average number of trajectory endpoints for each grid cell. Finally, the weighted CWT is expressed as WCWT.
2.4.4 Positive matrix factorization (PMF)
The U.S. Environmental Protection Agency's PMF 5.0 software was used in this work to perform the PM2.5 source apportionment. PMF is a multivariate factor analysis tool based on a weighted least-squares fit, where the weights are derived from the analytical uncertainty (Paatero and Tapper, 1994; Paatero and Hopke, 2003). The best model solution is obtained by minimizing the residuals obtained between modelled and observed input species concentrations. The uncertainty was set to five-sixths of the method detection limit (MDL) when the data were less than or equal to the provided MDL. When the concentration was greater than the provided MDL, the calculation was defined as follows.
To reduce the error, samples with missing values for individual species were excluded rather than replaced by the mean concentrations of the remaining observations. In this study, a total of 23 species were used in the model (OM, EC, Na+, Mg2+, Ca2+, Cl−, NO, SO, NH, K, Al, Si, Mn, Fe, Co, Cu, Zn, Cd, Ba, Pb, NO2, SO2 and CO). Detailed information on factor selection and determination can be found in our previous studies (Zhang et al., 2024; Huang et al., 2017, 2021b).
3.1 Overall characteristics of the study period
3.1.1 Meteorological and pollution characteristics
As shown in Table S1 in the Supplement, the average T and RH during the observation period were 11.0±3.0 ° and 62.4±11.6 %, respectively, which are significantly higher than those observed in the same period in North China, such as Beijing and Xi'an. Due to the direct influence of T and RH on the homogeneous and heterogeneous generation processes of PM2.5 chemical components, such as nitrates, sulfates and secondary organic compounds (Wang et al., 2021; An et al., 2019). Therefore, this difference inevitably leads to differences in the formation mechanisms of air pollution between the north and south of China. Meanwhile, the average WS was only 0.5±0.4 m s−1, which means that the meteorological conditions were stagnant and unfavorable for the diffusion of pollutants.
The concentration of SO2 (3.6±1.4 µg m−3) is far lower than the CNAAQS (60 µg m−3) as well as previous winters' concentrations in the same period in Chengdu, such as 16.1±12.1 µg m−3 in 2015 and 8.5±3.3 µg m−3 in 2018. Compared with the value of 49.6±20.0 µg m−3 in 2015, the NO2 concentration in this study (43.5±19.2 µg m−3) is only 12.3 % lower, which is much less than the reduction for SO2 (77.6 %). At the same time, the NO2 mass concentration in this study is higher than in all the other considered cities except Xi'an. The O3 mass concentration increased by 175.6 % from 2015 to 2023. This is consistent with the increasing atmospheric oxidizing capacity reported in many regions of China (Feng et al., 2021; Wang et al., 2023). In addition, significant correlation between CO and NO2 was observed (r=0.81), indicating they have common sources, i.e., motor vehicles. In particular, at the beginning of 2023, Chengdu has become the city with the highest number of motor vehicles in China. Therefore, motor vehicles and the increasing atmospheric oxidizing capacity in Chengdu may have an important impact on local air pollution. The average mass concentration of PM2.5 was 95.6±28.7 µg m−3, which is 2.7 times the CNAAQS (35 µg m−3) and 19.1 times the WHO guideline value (5 µg m−3). Although the concentration of PM2.5 decreased by 12.6 % from 2015 to 2018, it had rebounded sharply by 2023, with an increase of 33.3 %. At the same time, the result in this study is 2.9, 3.1 and 3.0 times that of Beijing, Shanghai and Guangzhou, respectively. This directly reflects the fact that Chengdu still faces huge challenges in PM2.5 pollution control. In addition, the increasing PM2.5 / PM10 ratio from 2015 (0.68) to 2023 (0.77) emphasizes the more important role of fine particles in air pollution.
As shown in Fig. 1, during the observation period, Chengdu experienced multiple alternations between non-pollution and haze days. There were two obvious haze events that occurred during the observation period. The first of these started in the early afternoon (13:00) on 27 January. PM2.5 rose slowly in a fluctuating manner with obvious accumulation characteristics. After 106 h, the PM2.5 mass concentration reached its highest value of the first haze event, which was 125 µg m−3. The PM2.5 growth rate was 0.92 µg m−3 h−1. Subsequently, on the afternoon of 1 February, short-term weak precipitation occurred. Meanwhile, the wind transformed into a stable easterly wind, and the WS was significantly higher than that in the period of high PM2.5. Accordingly, the PM2.5 mass concentration decreased rapidly. It only took 31 h to reduce the maximum PM2.5 concentration (125 µg m−3) to the minimum (40 µg m−3), and the reduction rate reached 2.74 µg m−3 h−1. However, at noon on 2 February, with the decrease in WS and the erratic WD, PM2.5 accumulated rapidly. In a short period of 37 h, the PM2.5 mass concentration increased from 40 µg m−3 to more than 150 µg m−3. The growth rate reached 2.97 µg m−3 h−1. From 4 to 7 February, the mass concentration of PM2.5 fluctuated but remained at a high level, with a daily average of more than 115 µg m−3. Finally, the pollution process ended with the appearance of an easterly wind in the early morning of 8 February. Based on the above description and the daily average value of PM2.5 being lower or higher than the CNAAQS (daily average of 75 µg m−3), the whole observation period can be divided into four stages: (1) non-pollution period 1 (NP-1); (2) Haze-1; (3) non-pollution period 2 (NP-2); and (4) Haze-2. The evolutionary and pollution formation mechanisms will be analyzed and discussed later.
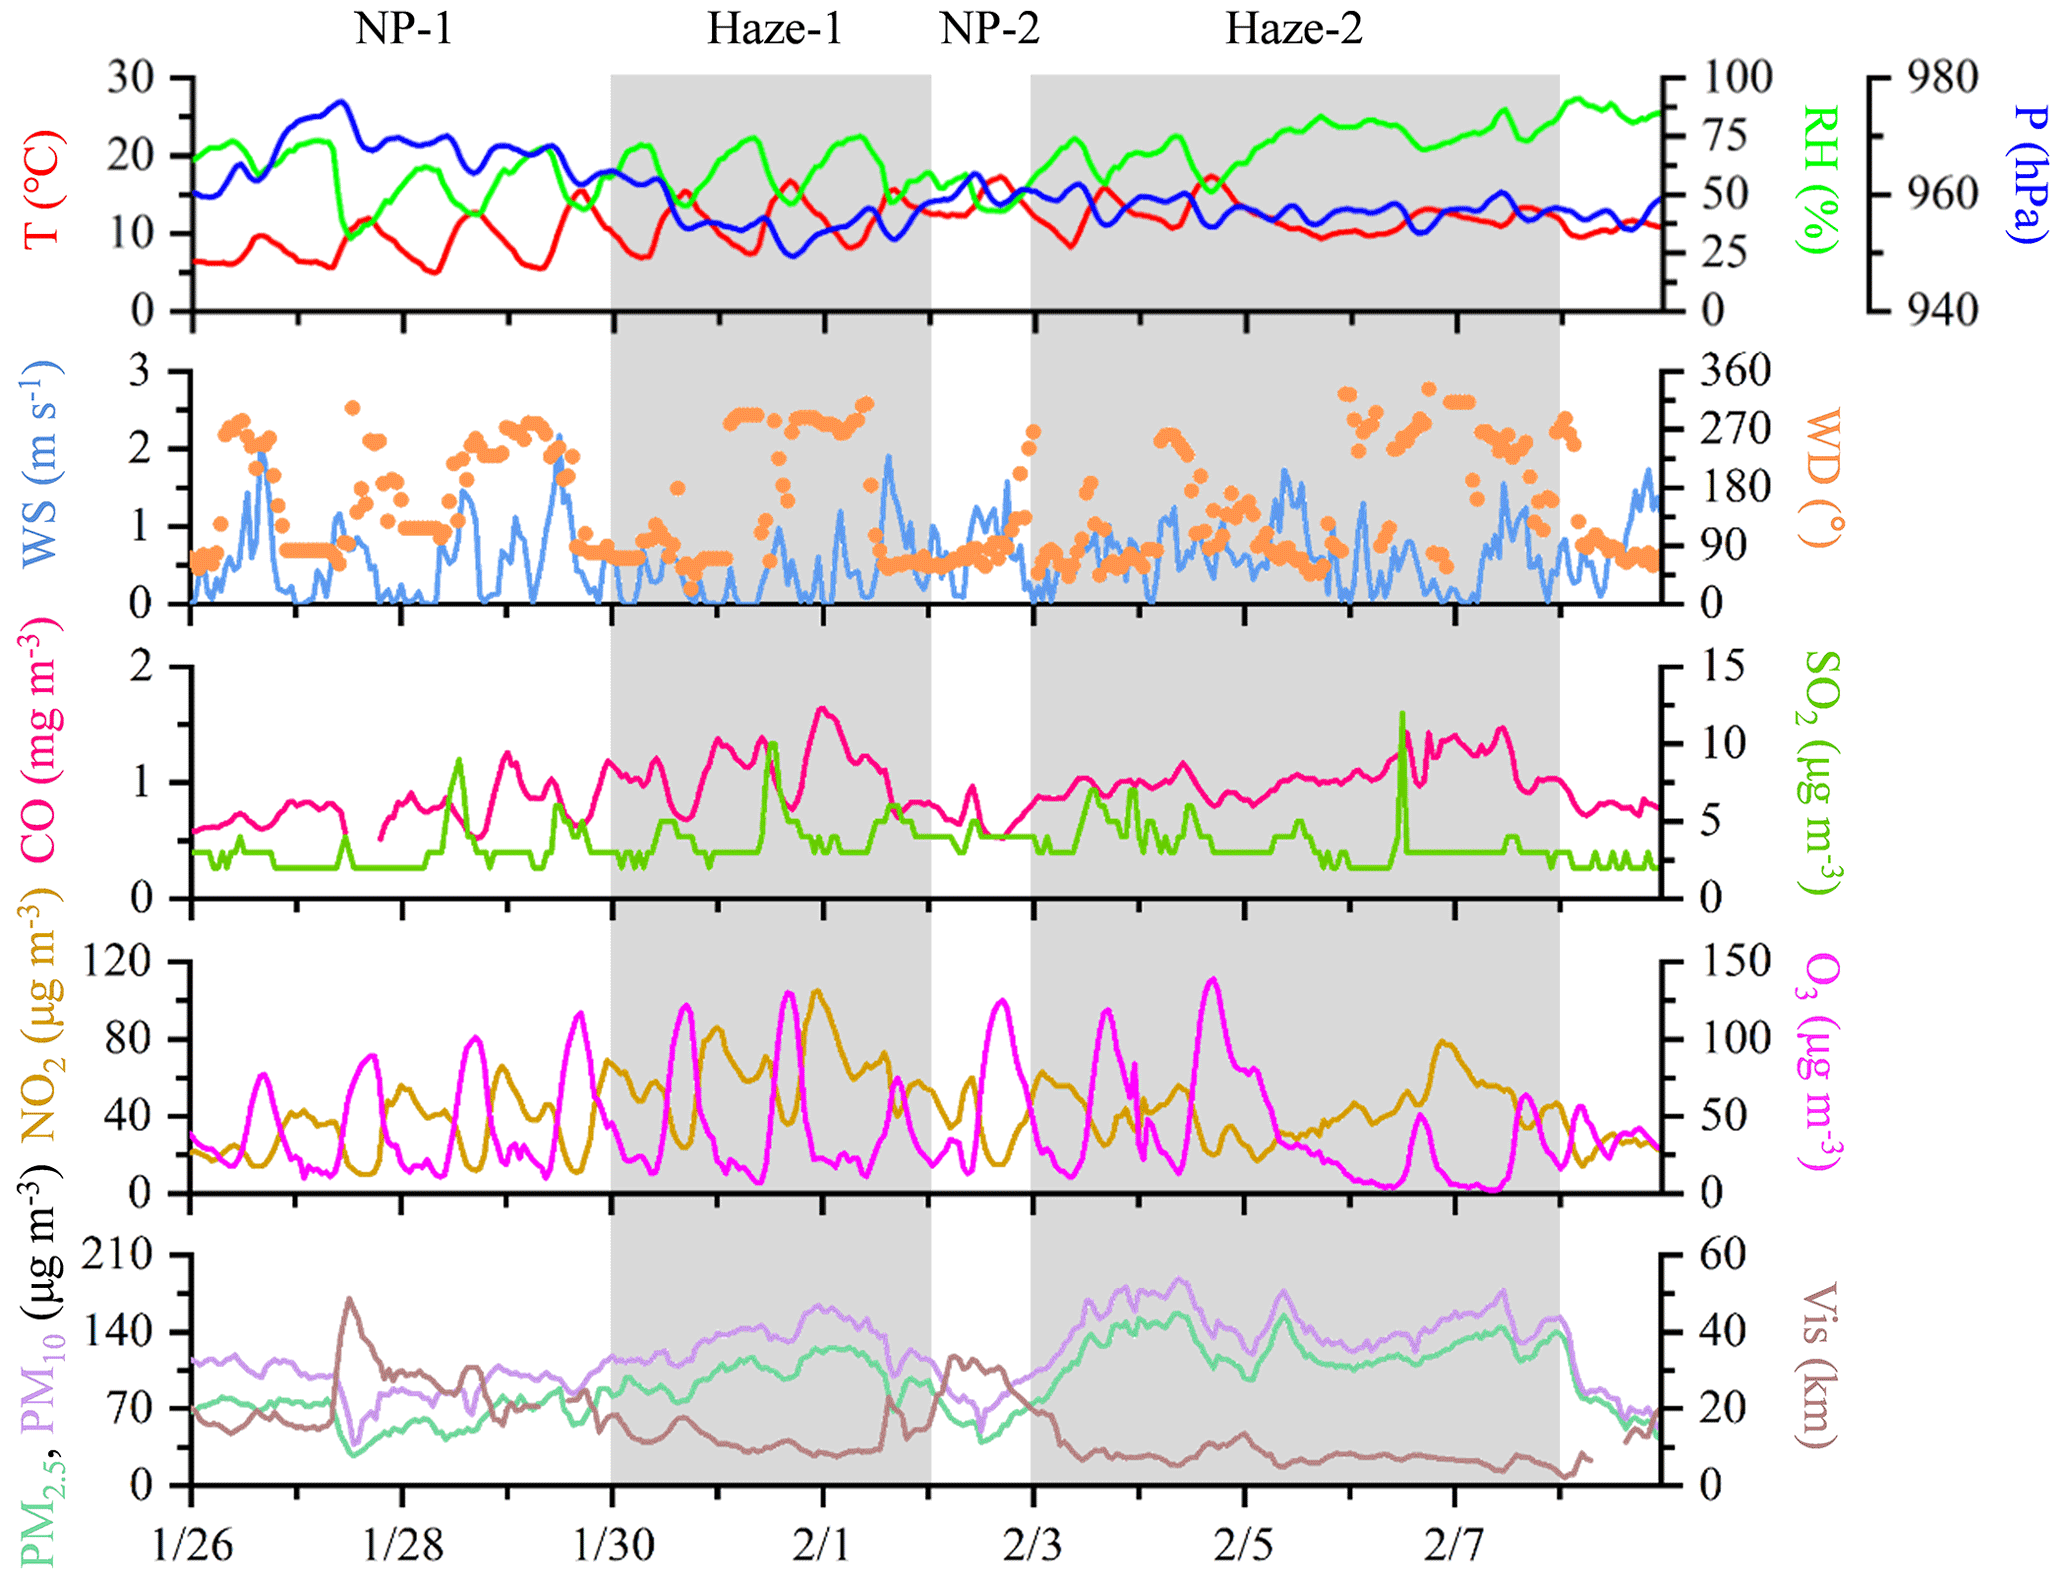
Figure 1Time series of the meteorological conditions and mass concentrations of pollutants in the study period.
In addition, it is worth noting that on 4 February the daily and highest hourly PM2.5 concentrations reached 116 and 150 µg m−3, respectively, leading to the “orange” haze alarm (see Sect. S2 in the Supplement) issued by the Chengdu government and the subsequent strict emission controls implemented during this period. For example, the time limit for motor vehicles was tightened, all open-air operations and all kinds of construction were prohibited and industrial enterprises were instructed to cease production or had limitations imposed on their production, depending on the type of goods they were producing. Due to these emission reduction measures mainly targeting pollution sources that occur during the daytime. Therefore, although there was a significant increase in pollution at night, the pollution level in the daytime in the following days was lower than that on 3 February. This indicates that the various policies issued to reduce pollutant emissions during the orange haze alarm period had a positive effect, which can be further demonstrated by the significantly reduced contributions of relevant pollution sources, such as industrial processes, vehicle emissions and dust (see Sect. 3.4). However, the PM2.5 mass concentration remained at a high level during this period, which means that there were other pollution sources or formation mechanisms strongly affecting the formation of haze, and so the coverage of the emission reduction policies during the alarm period was not sufficiently wide or stringent. Therefore, in order to further reduce similar heavy pollution events in the future, more comprehensive and powerful pollution reduction measures will be needed.
3.1.2 PM2.5 chemical composition
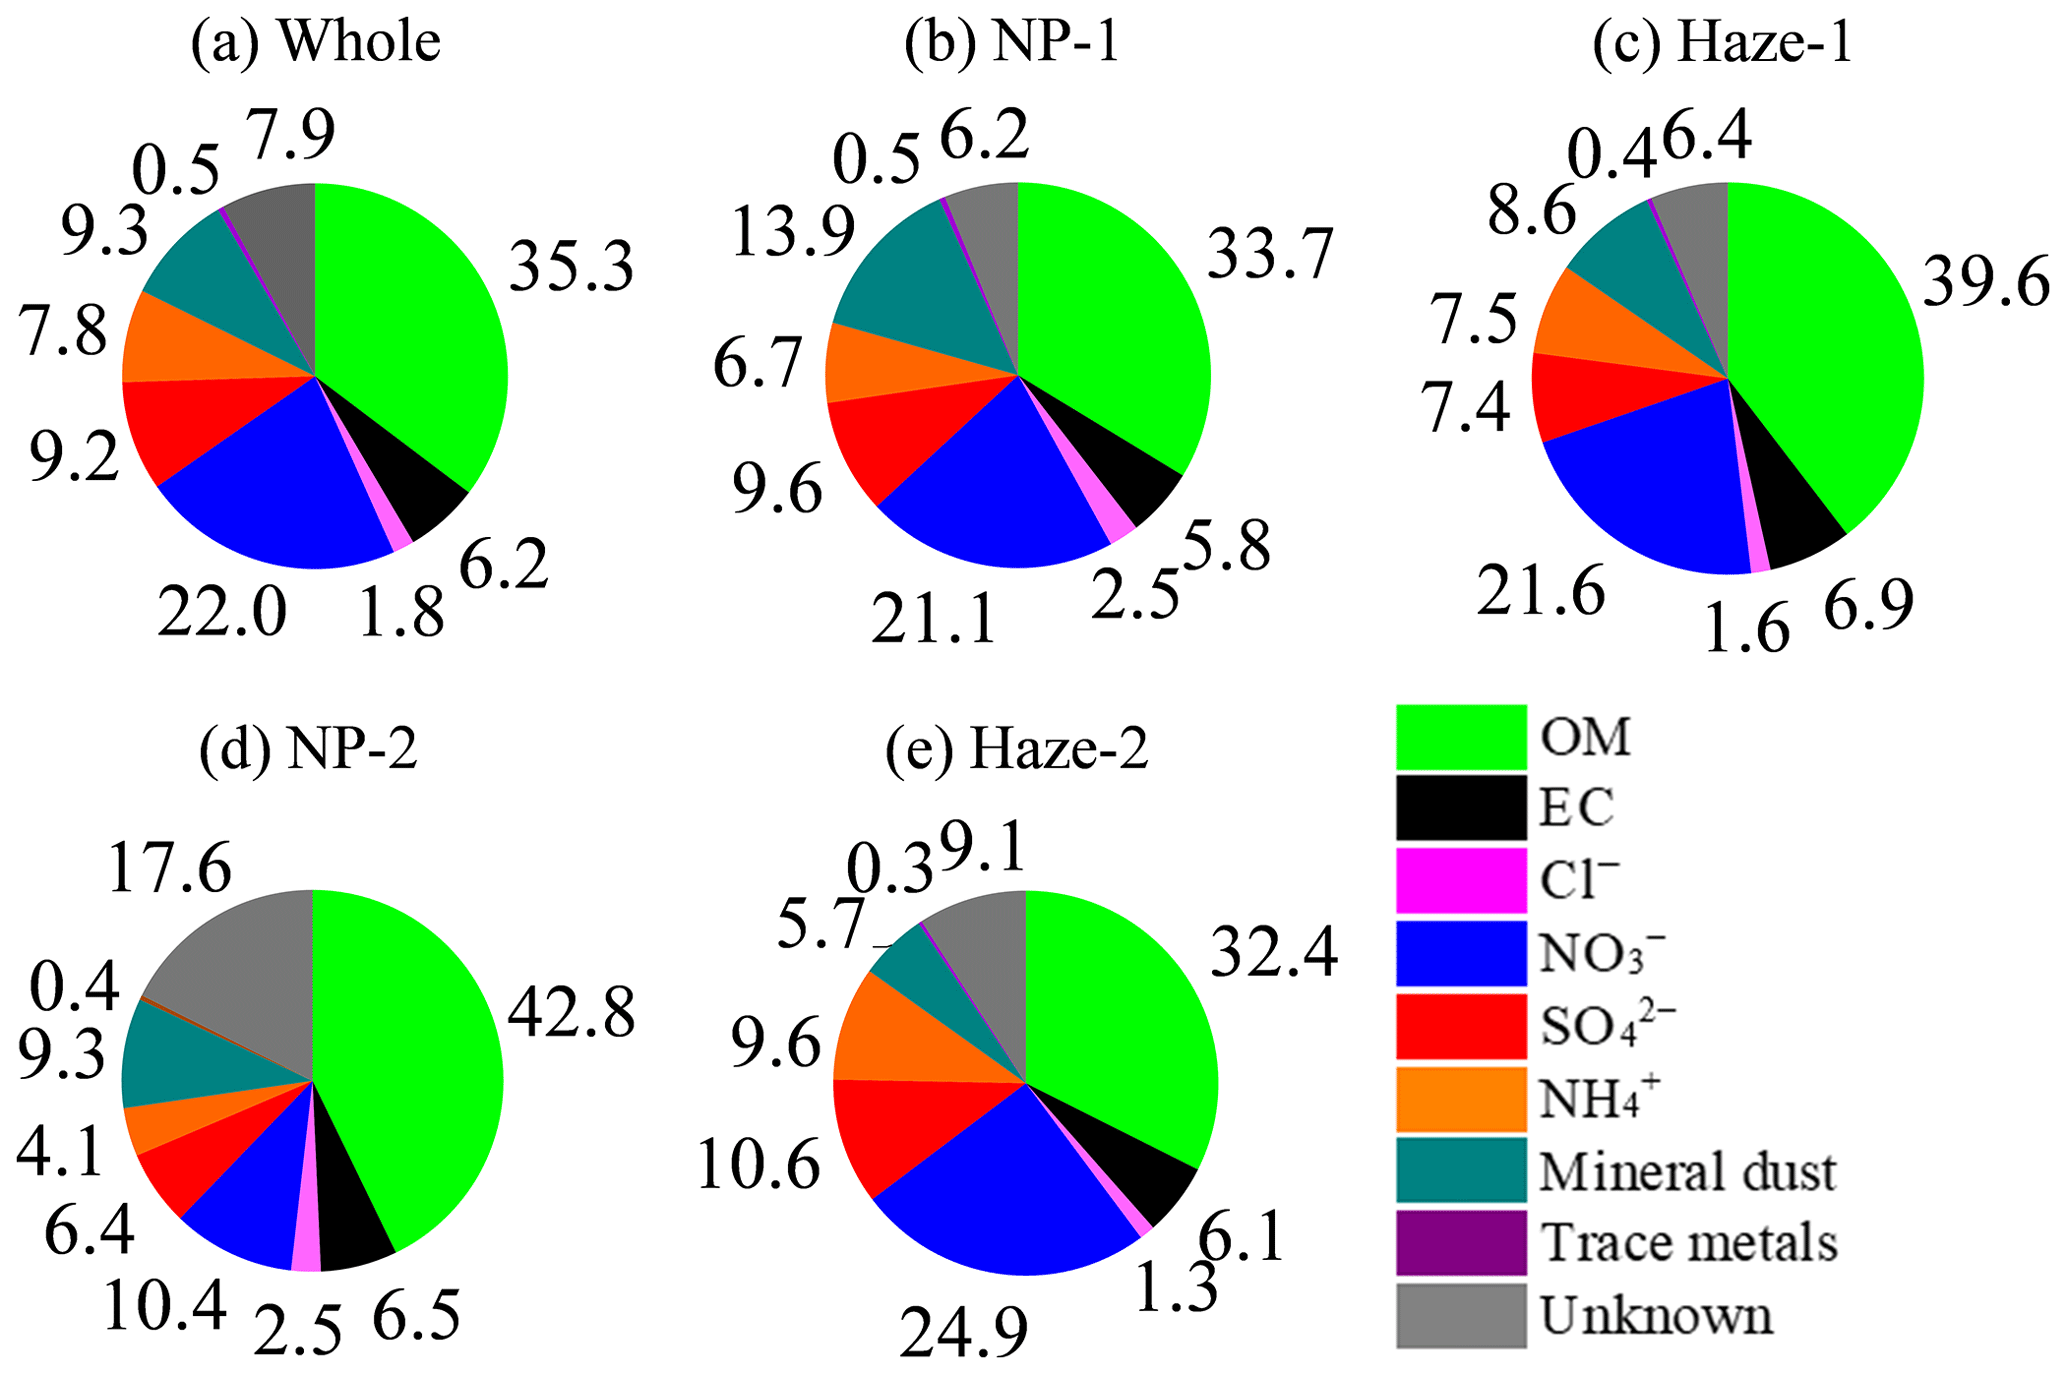
As shown in Fig. 2a, OM constituted the largest component of PM2.5, accounting for 35.3 % of the total mass, and the contributions of three secondary inorganic species, i.e., SO, NO and NH (SNA), were 9.2 %, 22.0 % and 7.8 %, respectively. Compared with previous winters' observation results in Chengdu, such as when the order of contribution was OM (24.3 %) > SO (15.1 %) > NO (12.9 %) > NH (9.0 %) in January 2015, the contributions of OM and NO are 11.0 % and 9.1 % higher, respectively, whereas the contributions of SO and NH are 5.9 % and 1.2 % lower in this study. This indicates the growing significance of OM and nitrate as well as the diminishing significance of sulfate in winter in Chengdu. This is consistent with the trends of change in their precursors; that is, the concentration of SO2 has decreased year on year and been at a very low level. Although NO2 has decreased in recent years, it is at a high level and frequently exceeds the CNAAQS. In fact, due to the greater reduction in emissions of SO2 than NO2 and the negligible change in NH3 since the implementation of APPCAP and BSDW, a considerable increase in the nitrate fractions in aerosols has been observed during pollution events in most regions in China, and thus the transition from sulfate-dominated to nitrate-dominated haze will likely have a significant impact on the mechanism of pollution formation, which is also worthy of attention when developing future pollution control measures (Huang et al., 2021b; Geng et al., 2019; Wang et al., 2022a; C. Zhang et al., 2020).
In addition, it is worth noting that the contribution of OM is significantly higher than that observed in previous winters in Chengdu, such as 27.8 % in 2014, as well as in other cities in China, such as 14.5 % in Beijing (Lv et al., 2022), 26.0 % in Shanghai (C. Zhang et al., 2020) and 23.6 % in Xi'an (Wang et al., 2022b). In fact, our own recent research on the interannual evolution of PM2.5 in winter in Chengdu also found that the proportion of OM in PM2.5 increased year on year, and its contribution to heavy pollution was also increasing (Zhang et al., 2024). Therefore, compared with other cities, the measures introduced to reduce emissions leading to air pollution in Chengdu need to pay attention not only to the high pollution levels of nitrate (similar to other cities), but also those of OM.
The mass ratio of is used to indicate the relative importance of mobile and stationary sources in the atmosphere. In this study, the mass ratio during the whole study period was 2.4, which is significantly higher than that in winter 2011 (0.5) (Tao et al., 2014) and winter 2014 (1.1) (H. Wang et al., 2018) in Chengdu. Such an increasing mass ratio is also apparent in other regions of China, especially in cities. For example, the mass ratio in Beijing was 0.9 in 2011, which increased to 1.7 in 2020 (Wang et al., 2022a). This indicates that the role of mobile sources has become increasingly significant owing to the rapid expansion of transportation. Previous studies have suggested that when the sulfur oxidation rate (SOR = n(SO/[n(SO + n(SO2)]; n is the molar concentration) and nitrogen oxidation rate (NOR = n(NO/[n(NO + n(NO2)]) are greater than 0.2 and 0.1, respectively, intense conversion and formation of secondary inorganic aerosols (SIA) take place (Yang et al., 2015). In this study, the average values of SOR and NOR during the whole observation period were 0.64 and 0.28, respectively, which means that a strong secondary generation process had occurred, and this value is higher than that in winter 2018 in Chengdu (SOR: 0.39, NOR: 0.13) (Song et al., 2022). This enhanced secondary generation process explains why the concentrations of the two species (SO and NO were still at a high level in spite of the reduced concentrations of their precursors (SO2 and NO2).
Overall, although the air quality in Chengdu has improved significantly in recent years, the city still faces serious air pollution in winter, especially in terms of PM2.5 and gaseous pollutants related to mobile sources (such as NO2) and the stronger secondary generation. Similar to other cities, the increasing contribution of nitrate is particularly noteworthy. Moreover, the OM is significantly higher than in other cities, which must not be ignored.
3.2 Classification and mixing state of individual particles
Based on the morphology and elemental composition of individual particles, the particulate matter in winter in Chengdu can be classified into five major aerosol components: mineral, OM, SIA, soot and fly ash/metal particles. Figure 3 shows the TEM images and EDS spectra of the various particle types.
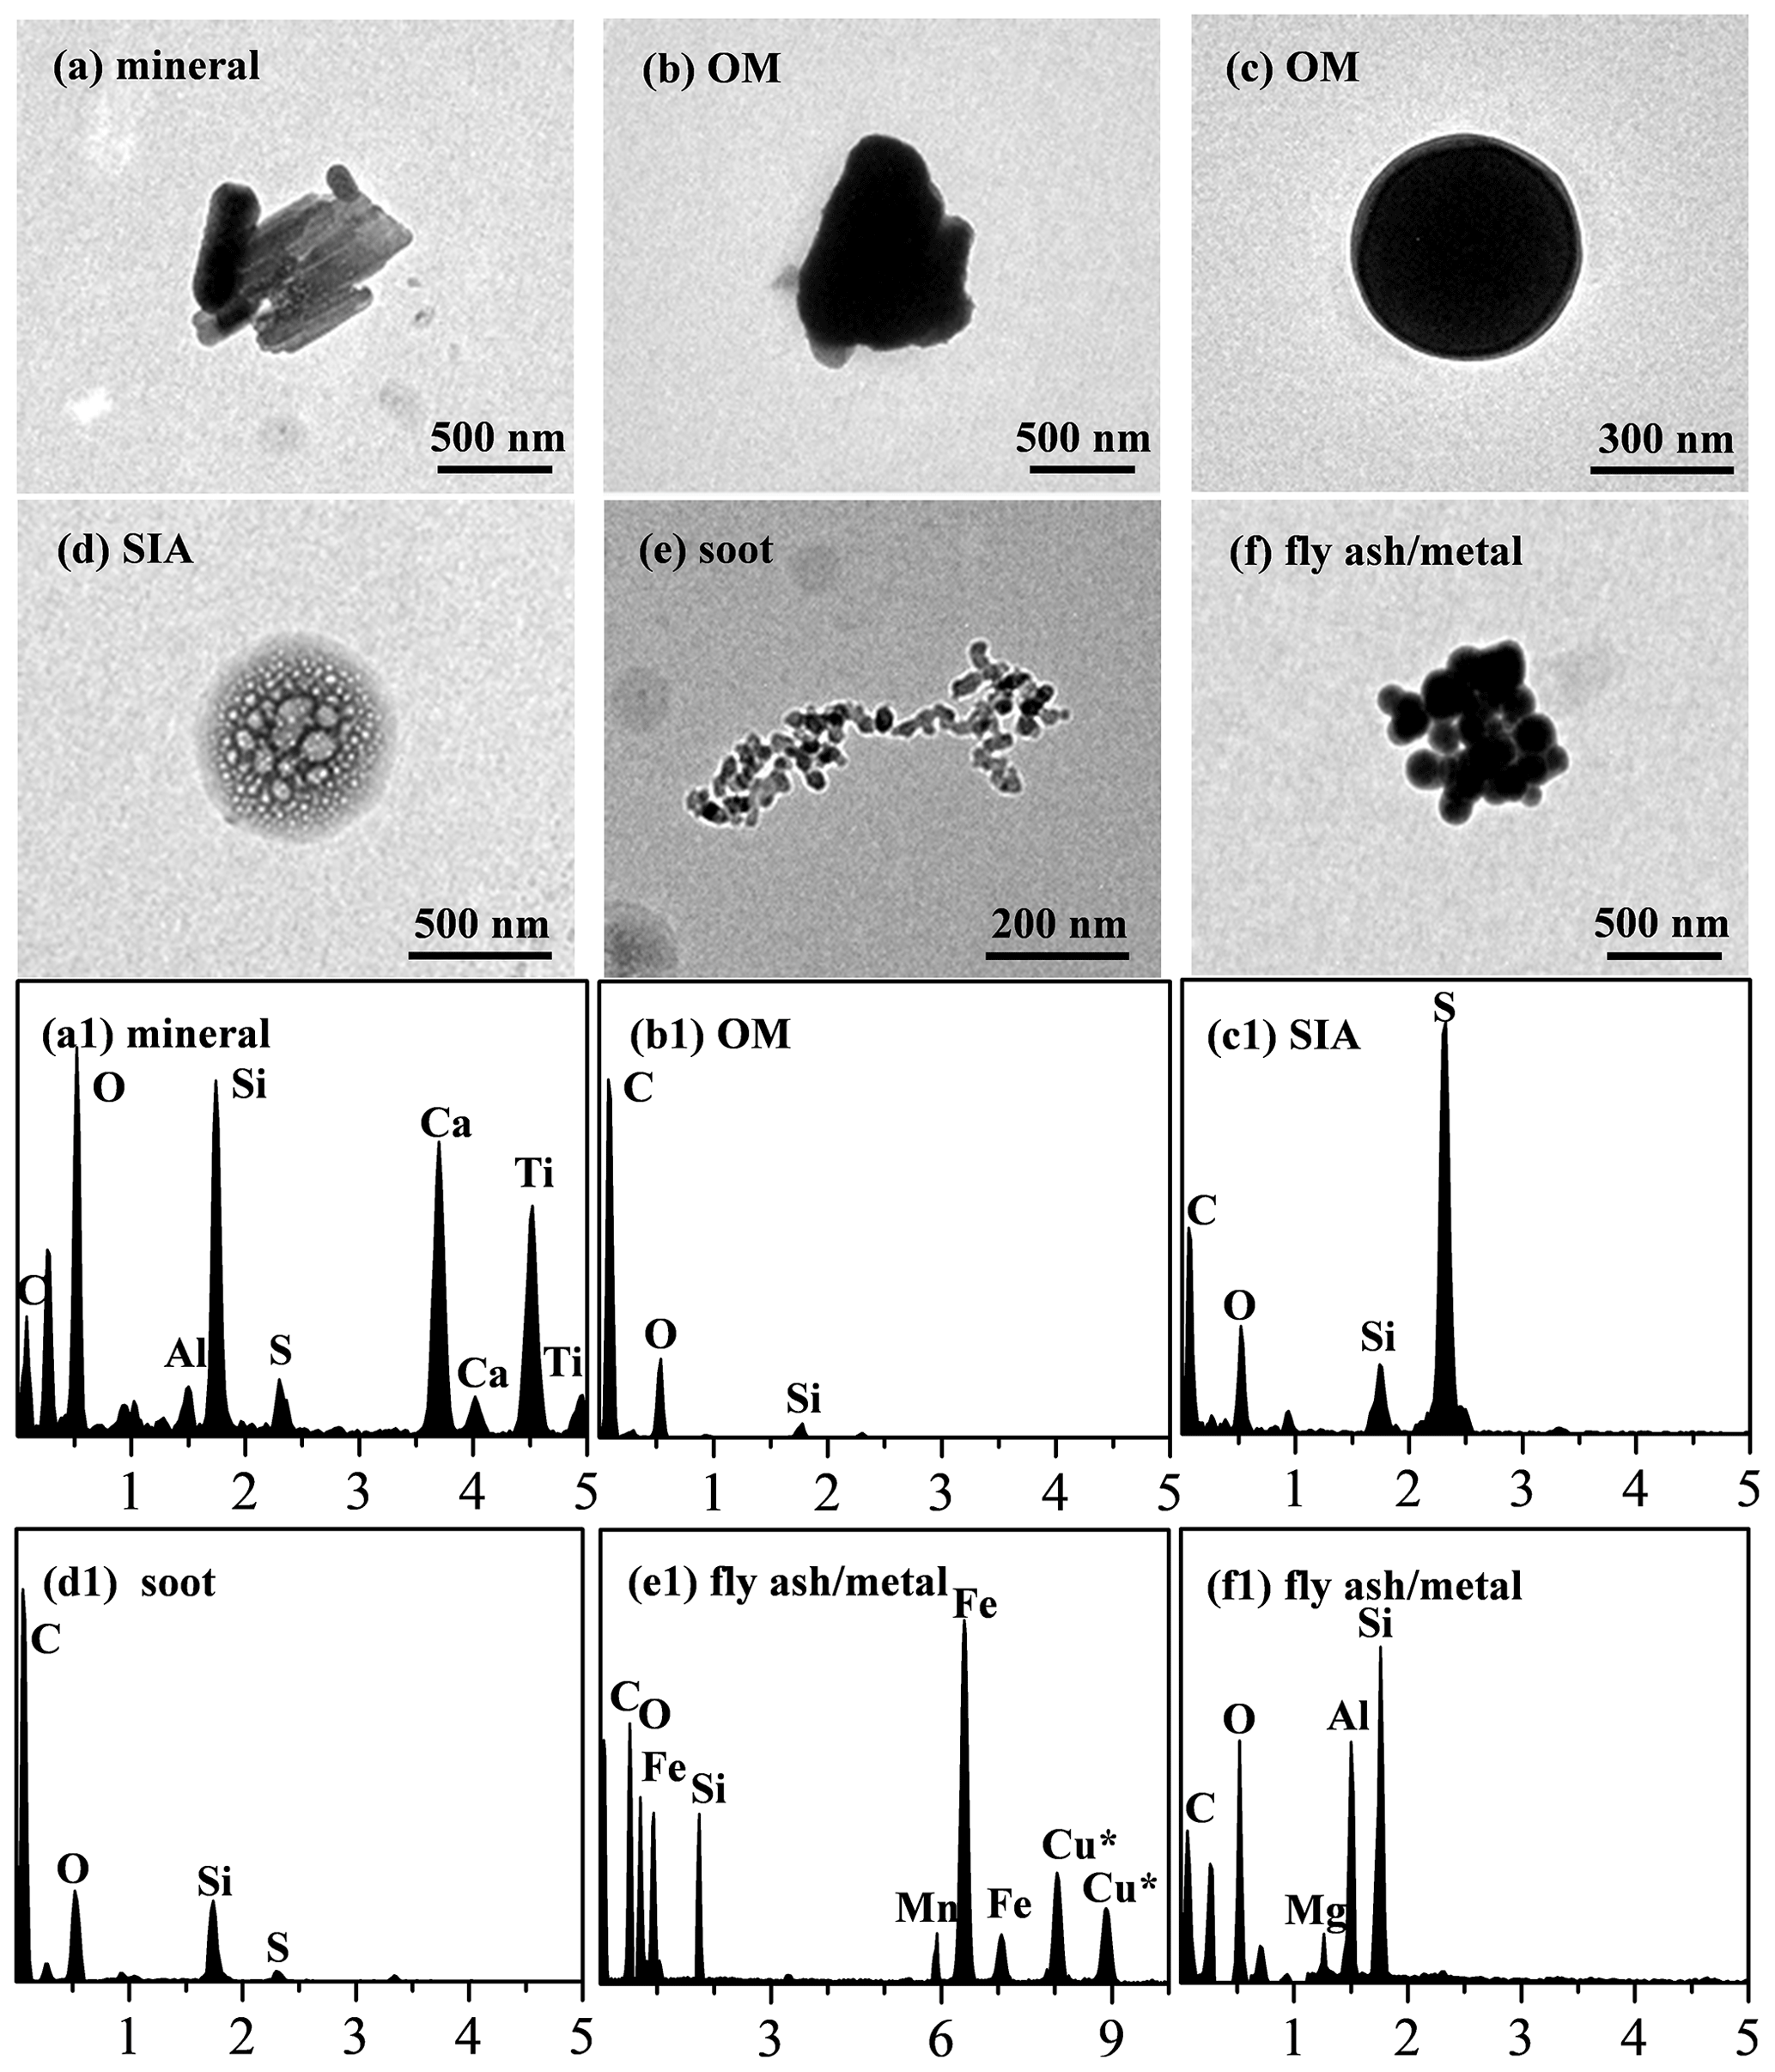
Mineral particles presented an irregular shape (Fig. 3a and 4c), mainly contained the elements C, O, Al, Si, Ca and Ti (Fig. 3a1), and largely occurred in the coarse size range (> 1 µm). Mineral particles are considered to have arisen from deserts, roads and construction activities. OM particles existed in various forms and could be further classified into irregular OM, spherical OM and OM coating, based on their morphology (Figs. 3b, 3c and 4), and were mainly composed of C and O (Fig. 3b1). The irregular and spherical OM are usually considered primary organic matter (POM), which is directly emitted from coal or biomass burning. OM coating, meanwhile, is usually considered to be secondary organic matter (SOM), which is produced from the chemical oxidation of volatile organic compounds (VOCs) (Liu et al., 2018). SIA particles were mainly composed of C, O, Si and S (Fig. 3c1) and formed from the oxidation of SO2, NOx and NH3. SIA particles normally represent the mixture of (NH4)2SO4 and NH4NO3 (Li et al., 2016). Soot particles (i.e., BC or EC) presented a chain-like morphology consisting of an aggregate of carbonaceous spheres with diameters from 10 to 150 nm (Figs. 3e, 4b and 4f). Soot particles mainly contained C and minor amounts of O and Si (Fig. 3d1) and are generated from incomplete combustion processes of biomass burning and fossil fuels. Fly ash/metal particles, with spherical morphology (Figs. 3f, 4d and 4e), were mainly composed of C, O, Si and metallic elements (e.g., Al, Fe or Mn) (Fig. 3e1 and f1). These particles mainly fall within the ultrafine size range (< 100 nm) and normally are emitted from coal-fired power plants and heavy industrial activities. A detailed introduction to the various types of particles can been found in previous studies (Li and Shao, 2009; Li et al., 2016; Deng et al., 2021; Liu et al., 2018).
Numerous studies have shown that aerosol particles from different sources tend to internally mix (mixed with other types of particles) in the atmosphere (Li and Shao, 2009; Li et al., 2016; W. J. Li et al., 2015; Zhang et al., 2021b). Accordingly, we found many different kinds of internally mixed particles; for example, OM or SIA particles were mixed with almost all other types of particles as the core or coating of particles. Meanwhile, mineral, fly ash/metal and soot particles were usually coated by OM or SIA particles as the core of particles. Therefore, based on particle types and mixing states, aerosol particles were further classified into nine groups: OM, soot, mineral, fly ash/metal, OM-SIA, OM-soot, OM-mineral, OM-fly ash/metal and OM-SIA-soot particles (Fig. 4).
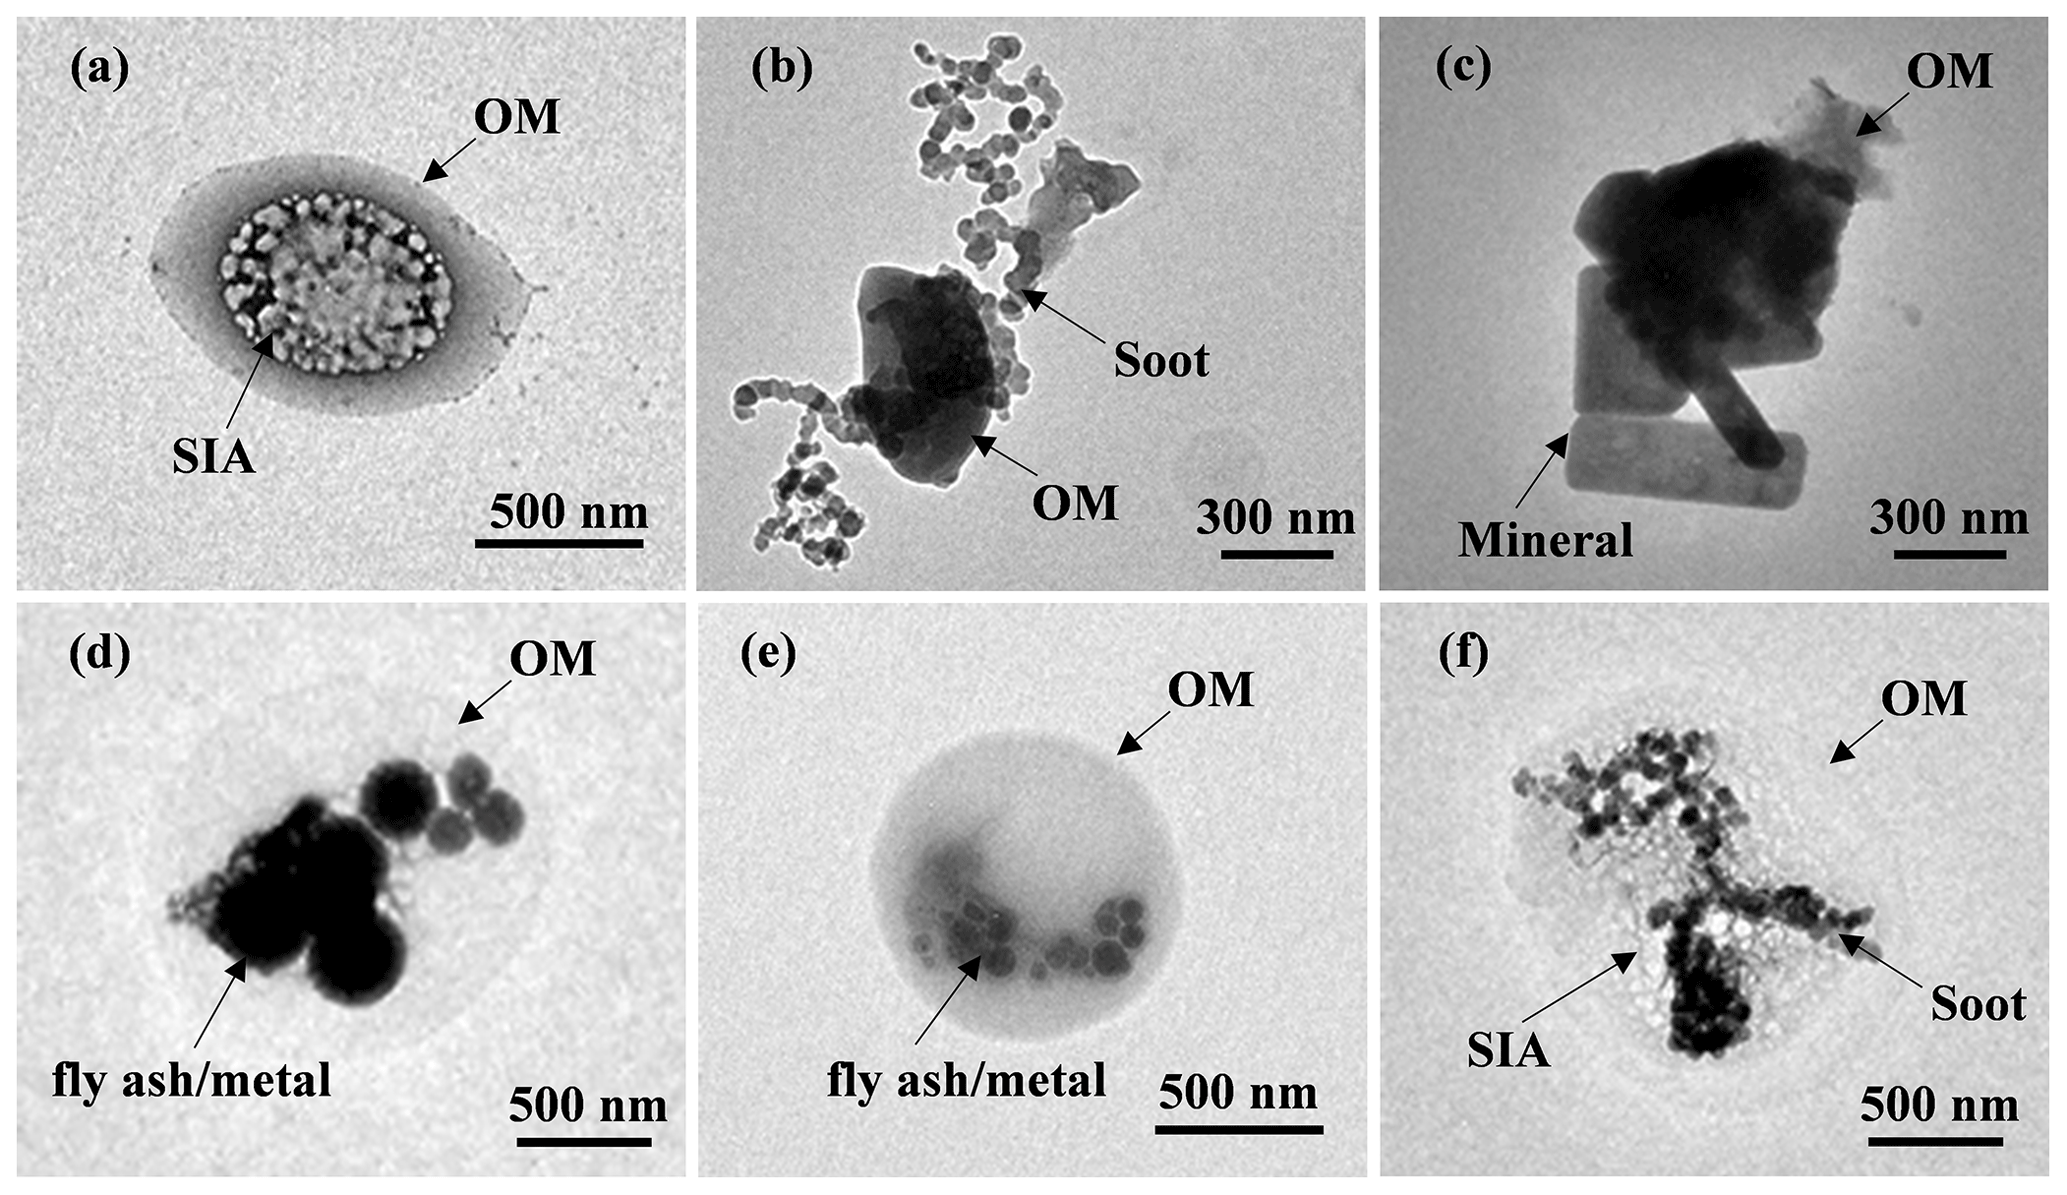
Figure 4TEM images of different types of internally mixed particles: (a) SIA coated by OM; (b) mixture of OM and soot; (c) mixture of OM and minerals; (d, e) fly ash/metal coated by OM; and (f) a mixture of OM, SIA and soot particles.
3.3 Exploring the formation mechanisms of haze events
According to Sect. 3.1, the study period was divided into four subperiods: NP-1, Haze-1, NP-2 and Haze-2 (for ease referred to simply as periods rather than subperiods hereafter). This section analyzes the evolution in pollution characteristics during these four periods, with a focus on the formation mechanisms of the haze events, in order to provide scientific data that can be used to help formulate measures to reduce heavy pollution in winter in Chengdu.
3.3.1 Meteorological conditions
Given that the duration of NP-2 was only 1 d and that the meteorological conditions on that day were characterized by rainfall and subsequent strong winds, this period was an unconventional NP period, and its corresponding meteorological conditions were unsuitable for comparison with the results of the haze events to explore the formation mechanisms of haze. Therefore, the comparison of meteorological conditions in this section mainly focuses on the two haze events and the more conventional NP period, i.e., NP-1. As shown in Fig. S4, the diurnal variations of T and RH in the three periods (NP-1, Haze-1 and Haze-2) were similar, i.e., with the highest and lowest T values appearing at 16:00 and 07:00–08:00 and the highest and lowest RH values appearing at 07:00–09:00 and 15:00–16:00, respectively. However, the difference between the daily maximum and minimum values in each period was different, in which the T and RH in Haze-2 changed most smoothly, with the difference values being 3.9° and 12.2 %, respectively, which was significantly lower than in the other periods, i.e., 6.8° and 22.5 % in NP-1 and 8.4° and 27.4 % in Haze-1, respectively. As shown in Fig. S5, the T and RH of the haze events (11.5 ± 2.9° and 61 ± 9 % in Haze-1, 12.1 ± 1.9° and 72 ± 8 % in Haze-2) were higher compared with those in NP-1 (8.7 ± 2.7° and 57 ± 12 %), making it more conducive to the secondary generation of pollutants through photochemical and liquid-phase reactions. The synchronous increase in T and RH during the haze period in this study is different from a previous report in winter in Beijing (T decreased, RH increased) (Liu et al., 2013). This highlights the differences in the formation mechanisms of haze in different regions of China. In addition, the atmospheric pressure in the two haze periods (956 and 957 hPa in Haze-1 and Haze-2, respectively) was lower than in NP-1 (967 hPa), and the WSs in the three periods were close and at very low levels (0.4–0.6 m s−1). Overall, compared to NP-1, the meteorological conditions during the two haze periods were more conducive to the accumulation and secondary generation of pollutants.
Figure 5 shows the WCWT analysis results of PM2.5 in different periods. It can be found that, from NP-1 to Haze-1, although the potential source area in the eastern areas of Sichuan Province had disappeared, the potential source area in the southern areas had expanded and the high-value areas of PM2.5 had significantly increased, with almost half of the area having a contributing concentration that exceeded 90 µg m−3. From Haze-1 to Haze-2, the potential source area in the south expanded further, covering not only the southeastern region of Sichuan Province, but also the western region of Guizhou Province. Meanwhile, the potential contribution concentration of PM2.5 in the vast majority of areas exceeded 90 µg m−3. Three secondary inorganic components, i.e., SNA, exhibited the same trend of evolution as PM2.5 (Fig. S6). This reflects the significant impact of regional transmission on local pollution in Chengdu, especially during haze periods.
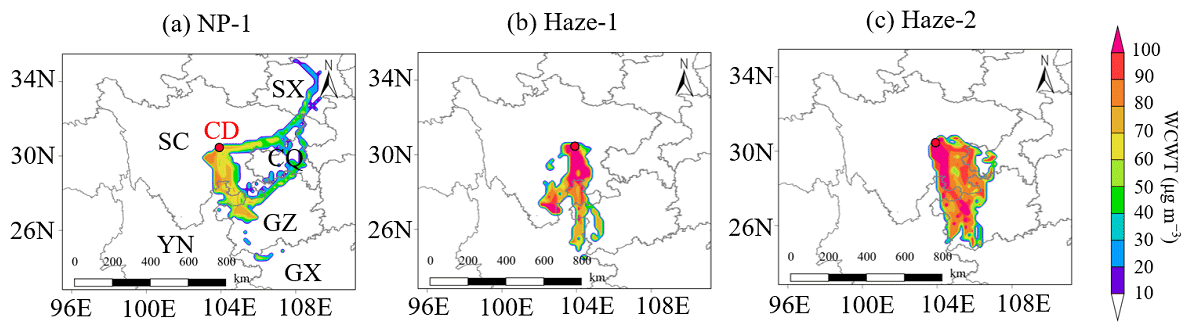
Figure 5WCWT maps of PM2.5 in the (a) NP-1, (b) Haze-1 and (c) Haze-2 periods (CD: Chengdu; SC: Sichuan Province; SX: Shaanxi Province; CQ: Chongqing; GZ: Guizhou Province; GX: Guangxi Province; YN: Yunnan Province).
Figure S3 shows the transmission characteristics of air masses in Chengdu during the study period. It can be seen that all air masses during the observation period can be grouped into six clusters, i.e., C1, C2, C3, C4, C5 and C6, which originated from southern Sichuan Province, Guizhou Province, Chongqing or Shaanxi Province. According to the WCWT analysis results, the southern area was the most important potential source area for pollutants in Chengdu. Correspondingly, the four clusters (i.e., C1, C2, C3 and C4) originating from the southern areas corresponded to high PM2.5 mass concentrations (98.3 to 107.6 µg m−3), which were significantly higher than the concentrations of C5 (51.5 µg m−3) and C6 (58.6 µg m−3). Referring to the CNAAQS, we defined C1 to C4 as “polluted” air masses, while C5 and C6 were defined as “clean” air masses. From the bar chart in Fig. S3, it can be seen that, during the NP1 period, the proportion of clean air masses reached 50 %, while during the two haze periods all the air masses were “polluted” air masses. This is consistent with the pollution levels of the three periods.
3.3.2 Gaseous pollutants
As shown in Fig. S7, compared with the NP periods, the main gaseous precursors, such as NO2, SO2 and CO, increased during the two haze events, which provided an important basis for the formation of PM2.5 chemical components, such as nitrate, sulfate and OM. At the same time, O3 concentrations during the two haze events were close to those of NP-1 and also showed obvious diurnal variations, with the highest values of Haze-1 and Haze-2 reaching 108.7 and 83.0 µg m−3, respectively (Fig. S8). Thus, the contribution of photochemical reactions cannot be ignored in the formation of these heavy haze events. This is different to previous research findings for North China, where the concentration of O3 during haze periods was found to have decreased significantly or remained at nearly zero for several days, and the contribution of photochemical reactions could be ignored (Lin et al., 2022; Yang et al., 2015).
3.3.3 PM2.5 and individual particle composition
The average PM2.5 mass concentration during the two NP periods was 64.9 ± 15.0 µg m−3 (NP-1) and 61.6 ± 14.1 µg m−3 (NP-2), which increased to 101.5 ± 15.2 µg m−3 (Haze-1) and 123.5 ± 17.8 µg m−3 (Haze-2) during the two haze events. Accordingly, the chemical composition of PM2.5 also showed obvious differences with the evolution of pollution. As can be seen from Fig. 2, from NP-1 to Haze-1, the contribution of the carbonaceous component showed the most significant increase, with OM and EC increasing by 5.9 % and 1.1 %, respectively. However, the mineral dust contribution showed the greatest decrease (by 5.3 %). The changes in the chemical components suggest that the formation of this haze event was closely related to the combustion of fossil fuels. Meanwhile, compared to NP-1, the significantly increased NO SO mass ratio (from 2.2 to 2.9) and the NO2 concentration (61.5 ± 18.2 µg m−3, the highest of the four periods) during Haze-1 further suggest that the contribution of mobile sources – the most important fossil fuel combustion source in urban areas – may have dominated. In addition, the correlation between the concentrations of PM2.5 and CO was strong in Haze-1 (R2=0.59), suggesting a strong impact of local emissions on Haze-1.
On the afternoon of 1 February, short-term weak precipitation occurred. At the same time, the winds were generally easterly and the WS was higher than that in the period of high PM2.5. Subsequently, the PM2.5 mass concentration decreased rapidly, and the chemical composition of PM2.5 changed significantly in NP-2. Compared to Haze-1, the proportion of OM further increased by 3.2 %, while the proportion of the three secondary inorganic components, i.e., SNA, decreased by 15.6 %, with the largest decrease being for NO at 11.2 %. This is mainly because of the difference in hygroscopicity; i.e., the strongly hygroscopic SNA would have been more easily removed by precipitation, while precipitation would have been less efficient at removing the weakly hygroscopic, even hydrophobic carbonaceous components (Zhang et al., 2018).
By the beginning of 3 February, Chengdu had entered the Haze-2 period, featuring a higher PM2.5 pollution level and longer duration. Compared with the NP-2 period, the proportion of OM decreased by 10.4 %, while SNA increased by 24.2 %, especially NO (by 14.5 %). This indicates that secondary generation was an important cause of Haze-2. Meanwhile, the NO SO mass ratio and NO2 were lower than that in the Haze-1 period, and the correlation between PM2.5 and CO was weak (0.09), allowing us to infer that secondary generation led to this more serious haze pollution event. The different contributions of secondary generation to the two haze events can be further confirmed by analyzing the SOR and NOR results. As shown in Fig. S7, the SOR and NOR in Haze-2 (0.75 and 0.38) were higher than those in the other periods, while their ratios in the Haze-1 period (0.58 and 0.22) were close to those in the NP-1 period (0.60 and 0.23).
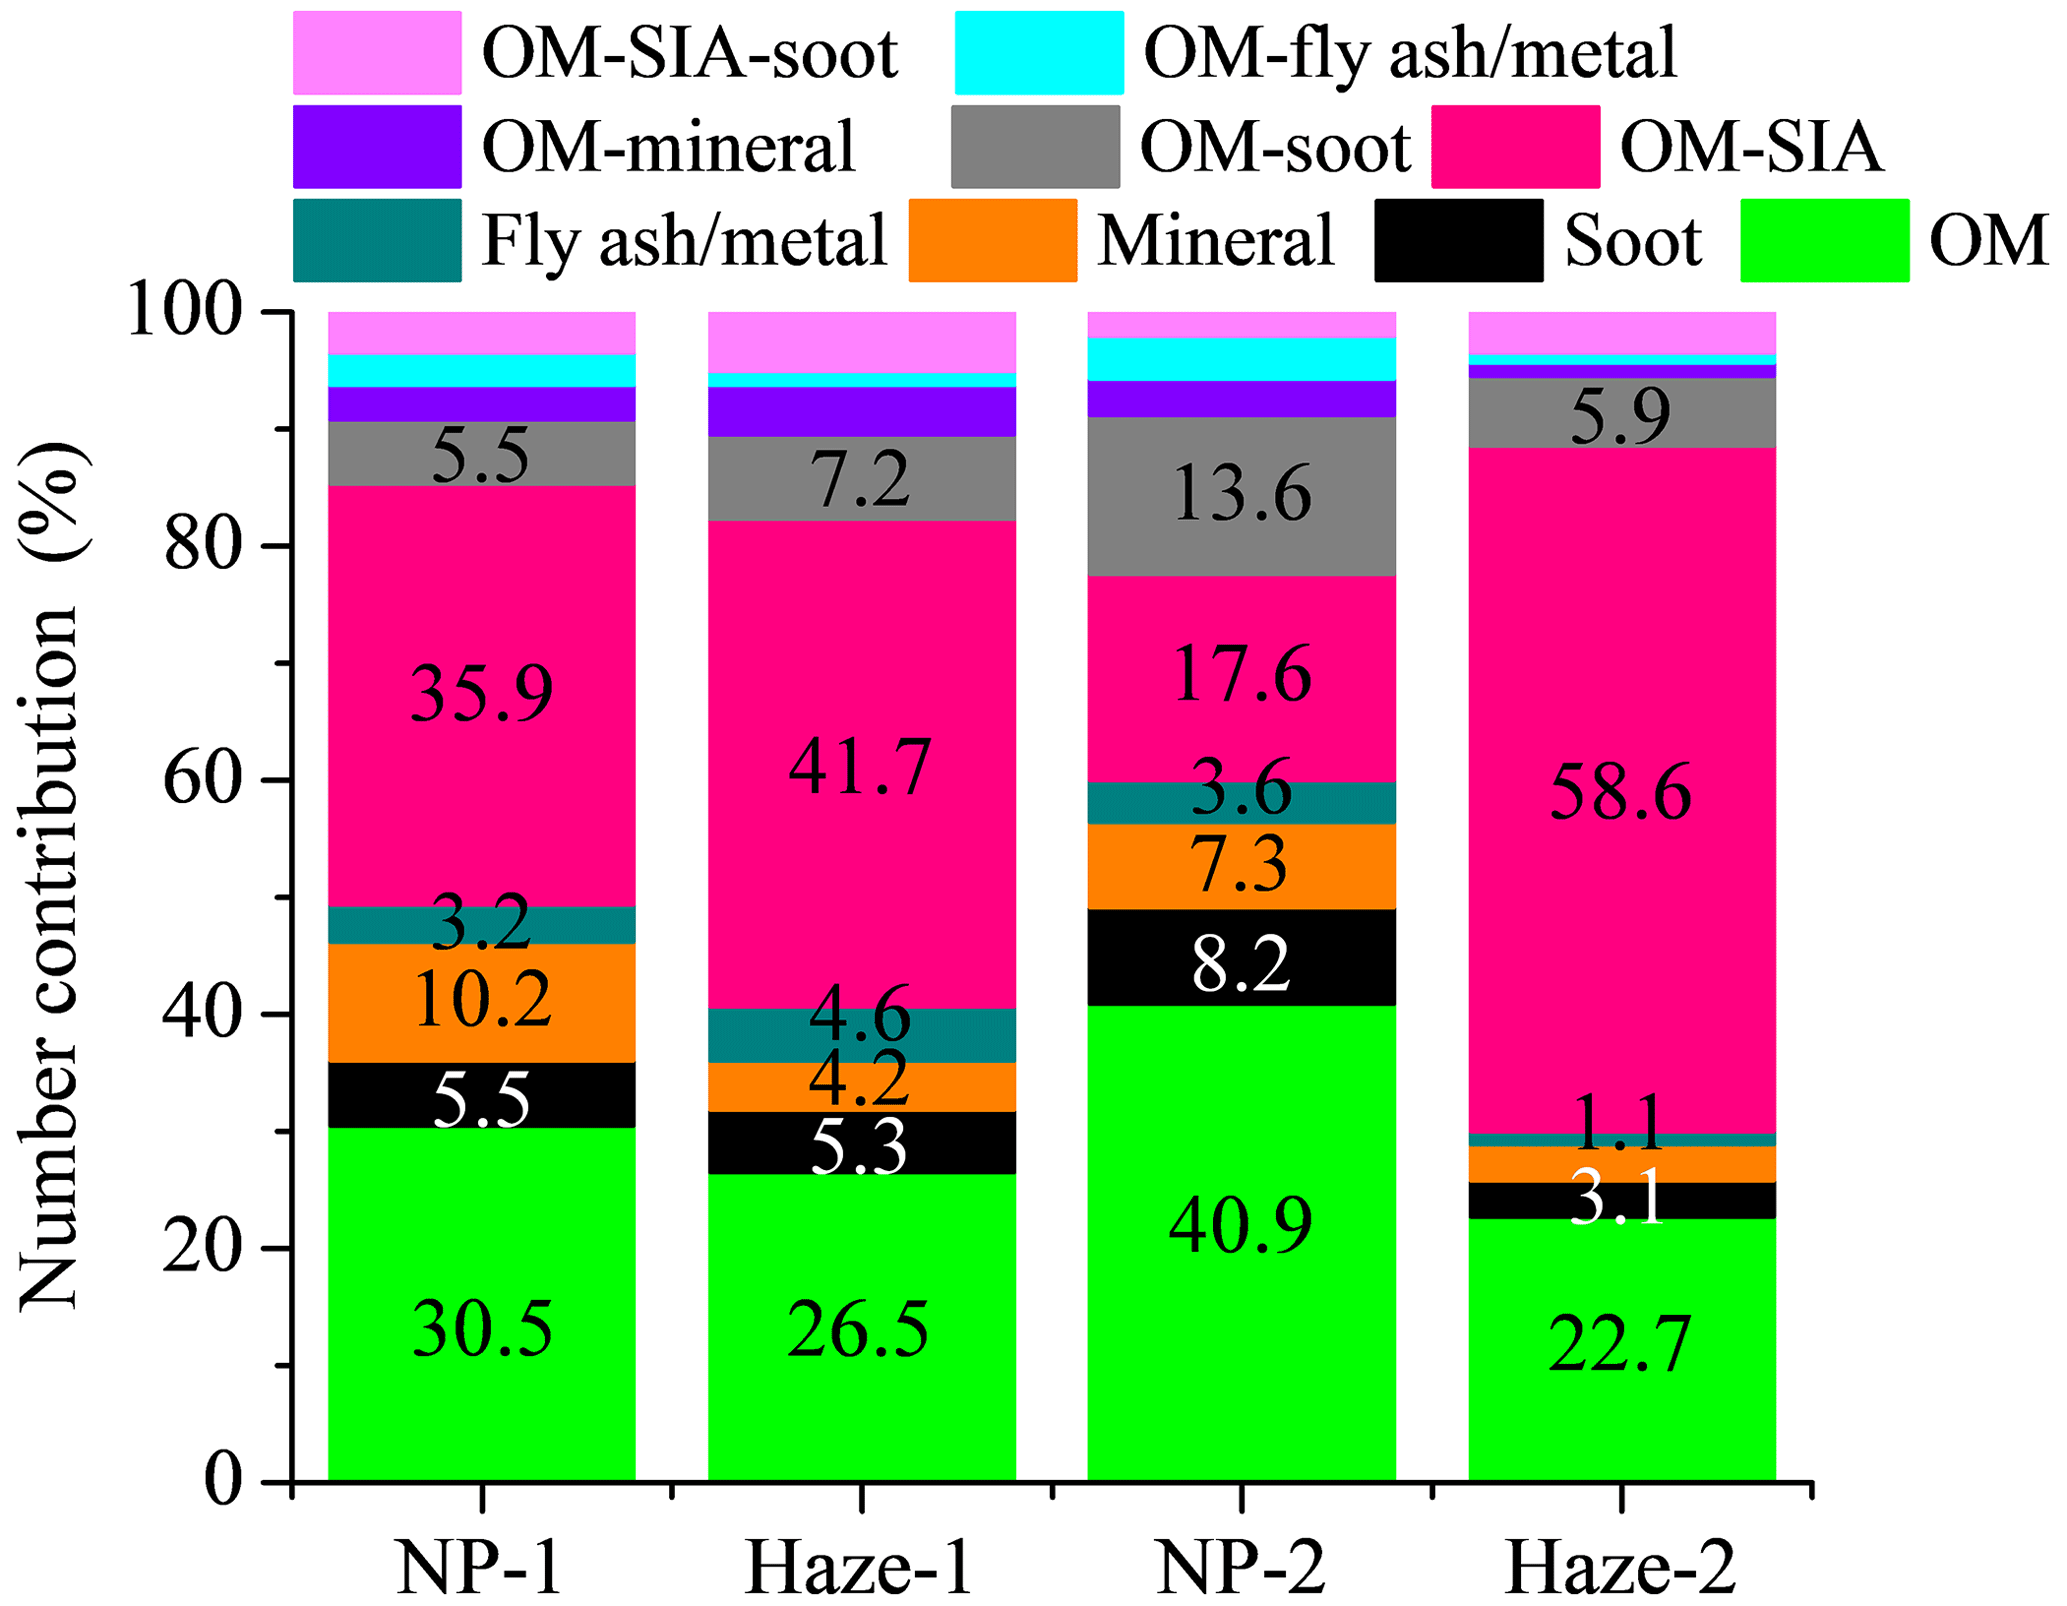
As shown in Fig. 6, from NP-1 to Haze-1, although the contribution of externally mixed (separated from other types of particles) OM particles decreased by 4.0 %, the contribution of internally mixed OM particles, such as OM-SIA, increased by 5.8 %. At the same time, the proportion of OM-soot, the internally mixed product of two types of carbonaceous particles, increased by 1.7 %. Therefore, during this stage, not only did the proportion of OM-related particles increase, but so did the mixing of carbonaceous particles with secondary inorganic components. From Haze-1 to NP-2, the occurrence of precipitation and sustained easterly winds reduced the total contribution of particles related to SIA particles (including OM-SIA and OM-SIA-soot) from 46.8 % to 19.7 %. This would have been mainly due to the stronger hygroscopicity of SIA particles, which determines their susceptibility to precipitation and strong winds (Zhang et al., 2018). By contrast, the contributions of weakly hygroscopic or hydrophobic carbonaceous particles, such as OM, soot and OM-soot particles, increased by 14.4 %, 2.9 % and 6.4 %, respectively (Zhang et al., 2018). When entering the Haze-2 period, the proportions of SIA-related particles and internally mixed particles reached their highest levels among the four periods, with contributions of 62.1 % and 70.0 %, respectively. Therefore, in this period, particles experienced the strongest secondary aging and internal mixing. In addition, due to the limitations imposed by the pollution reduction measures during the orange haze alarm period on industrial sources, the total proportion of particulate matter related to fly ash/metal (fly ash/metal and OM-fly ash/metal) decreased from 7.2 % to 2.0 %. It can be seen that, although single-particle and bulk-chemical methods analyzed the chemical composition of particulate matter from two different perspectives and were differences in the contribution changes of similar species (such as SIA particles and SNA) with pollution evolution, the two types of data exhibited similar trends. By combining these results, we can have a clearer understanding of the formation mechanism of pollution.
3.3.4 Aging characteristics of individual aerosol particles during two haze events
The mixing structure of individual particles can reflect their sources and formation mechanism. Here, we focus on analyzing the mixing structure of carbonaceous particles (i.e., OM and soot) and SIA particles, which were highly abundant in this study, during two haze periods.
As reported in previous studies, the irregular and spherical OM particles belong to POM particles (Yuan et al., 2020) and have generally been considered to be “tarballs” (Adachi et al., 2019), which mainly come from the combustion process. OM coatings, meanwhile, have tended to be perceived as SOM particles and are normally considered to form from the chemical transformation of VOCs in the atmosphere, which are typical secondary particles with a much stronger degree of aging than POM particles (J. Zhang et al., 2017). As shown in Fig. 7, there were a large number of tarball particles during the Haze-1 period, and most of them existed in an externally mixed form or were partly coated by other particles. However, during the Haze-2 period, we found only a few tarball particles, and they were almost entirely embedded within secondary particles such as SIA. Meanwhile, OM particles appeared more frequently in the form of OM coating (i.e., SOM).
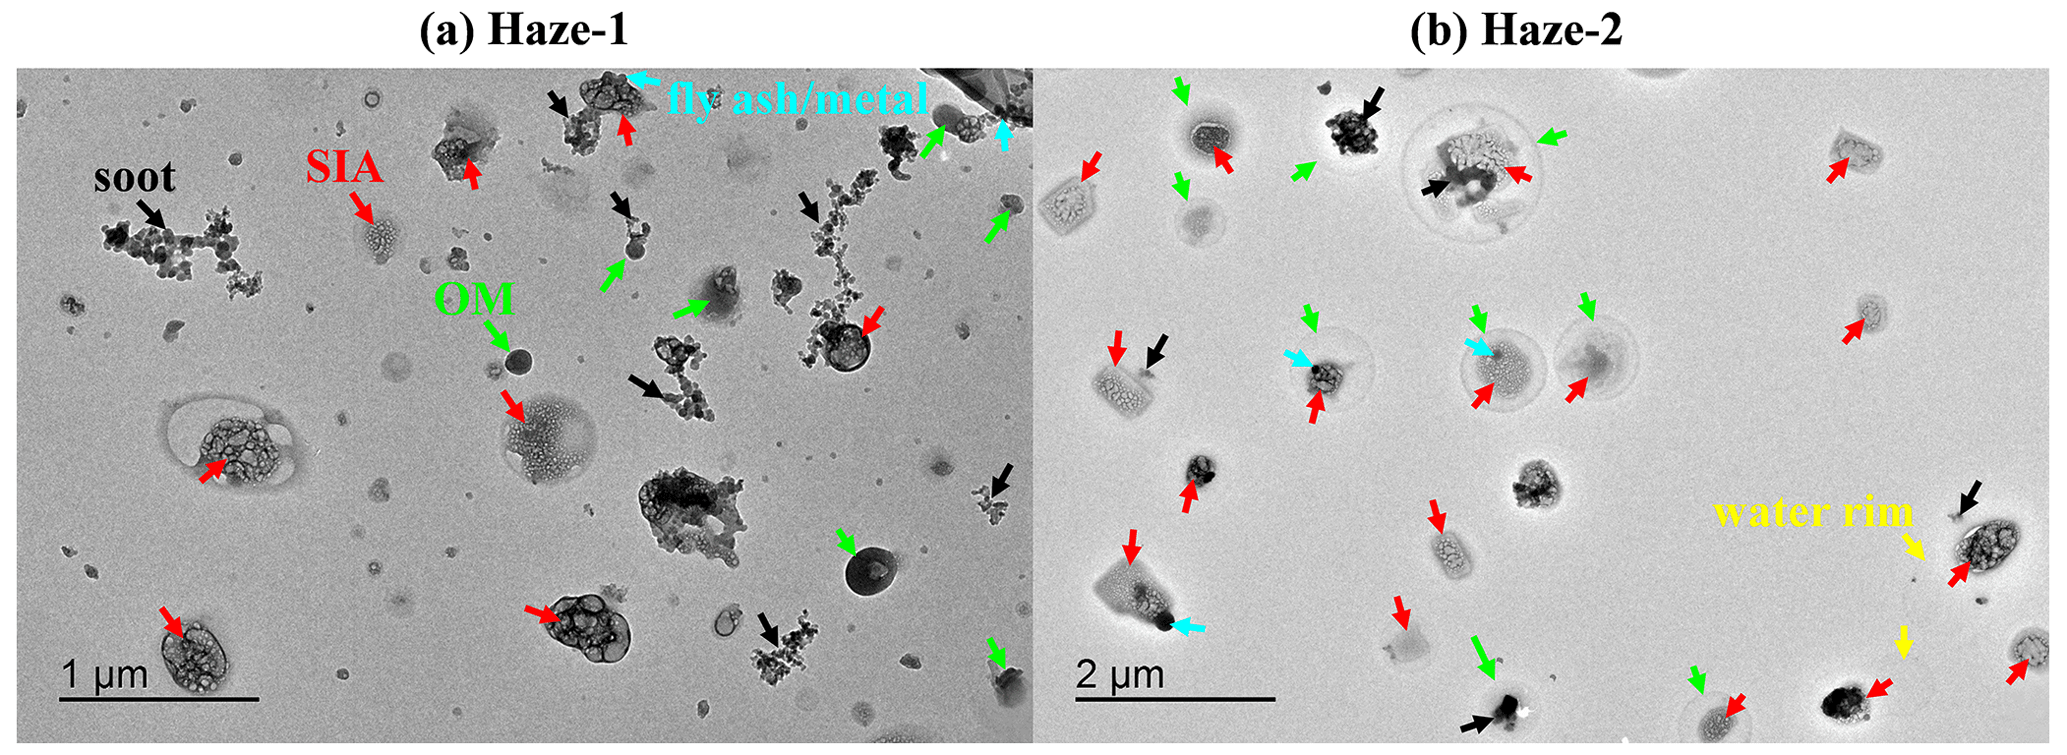
Figure 7Mixing characteristics of individual particles in the (a) Haze-1 and (b) Haze-2 periods.
The morphology of another frequently occurring carbonaceous particle, i.e., soot, also showed significant differences between the two haze periods. In the Haze-1 period, the vast majority of soot particles existed in the form of chain-like particles or particles partially embedded with other species. However, in the Haze-2 period, almost all the soot particles were completely coated by other components, especially SIA, and existed in a fully embedded form. At the same time, compared to Haze-1, their fractal morphologies had transformed into compact shapes, suggesting that secondary aerosol coating formation can significantly compress the fractal morphology of soot particles. Therefore, the high humidity in the Haze-2 period (78 ± 8 %) led to phase changes in secondary aerosols and further caused the morphological compactness of soot aggregations.
Compared to Haze-1, SIA particles with OM coating were the dominant particles during the Haze-2 period. Li et al. (2014) pointed out that this mixing structure could determine the hygroscopic properties of the aerosol particles; i.e., OM coatings on inorganic particles can induce an early deliquescence of particle surfaces compared to those of pure inorganic particles. Mikhailov et al. (2015) also found that the semi-solid state of the OM coating can lead to kinetic limitations of water uptake and release during hydration and dehydration cycles. Gas (e.g., SO2, NO2 and VOCs) condensation on the existing particles is an important chemical process for formation of this type of particulate matter (W. J. Li et al., 2015). Zhang et al. (2021b) also pointed out that more SIA and SOM in fine particles mainly result in earlier deliquescence and larger hygroscopic growth factor values of haze particles, which further implies that aged haze particles can provide aqueous surfaces for the formation of secondary aerosols via heterogeneous reactions.
In addition, we also found that, with the influence of high levels of RH during Haze-2, some particles had a clear water rim around individual particles (Fig. 7b), suggesting that these secondary particles were in an aqueous phase in ambient air (Li et al., 2016). This result suggests that haze particles in the polluted air retained the wet or liquid phase during the Haze-2 period.
3.4 Source contributions
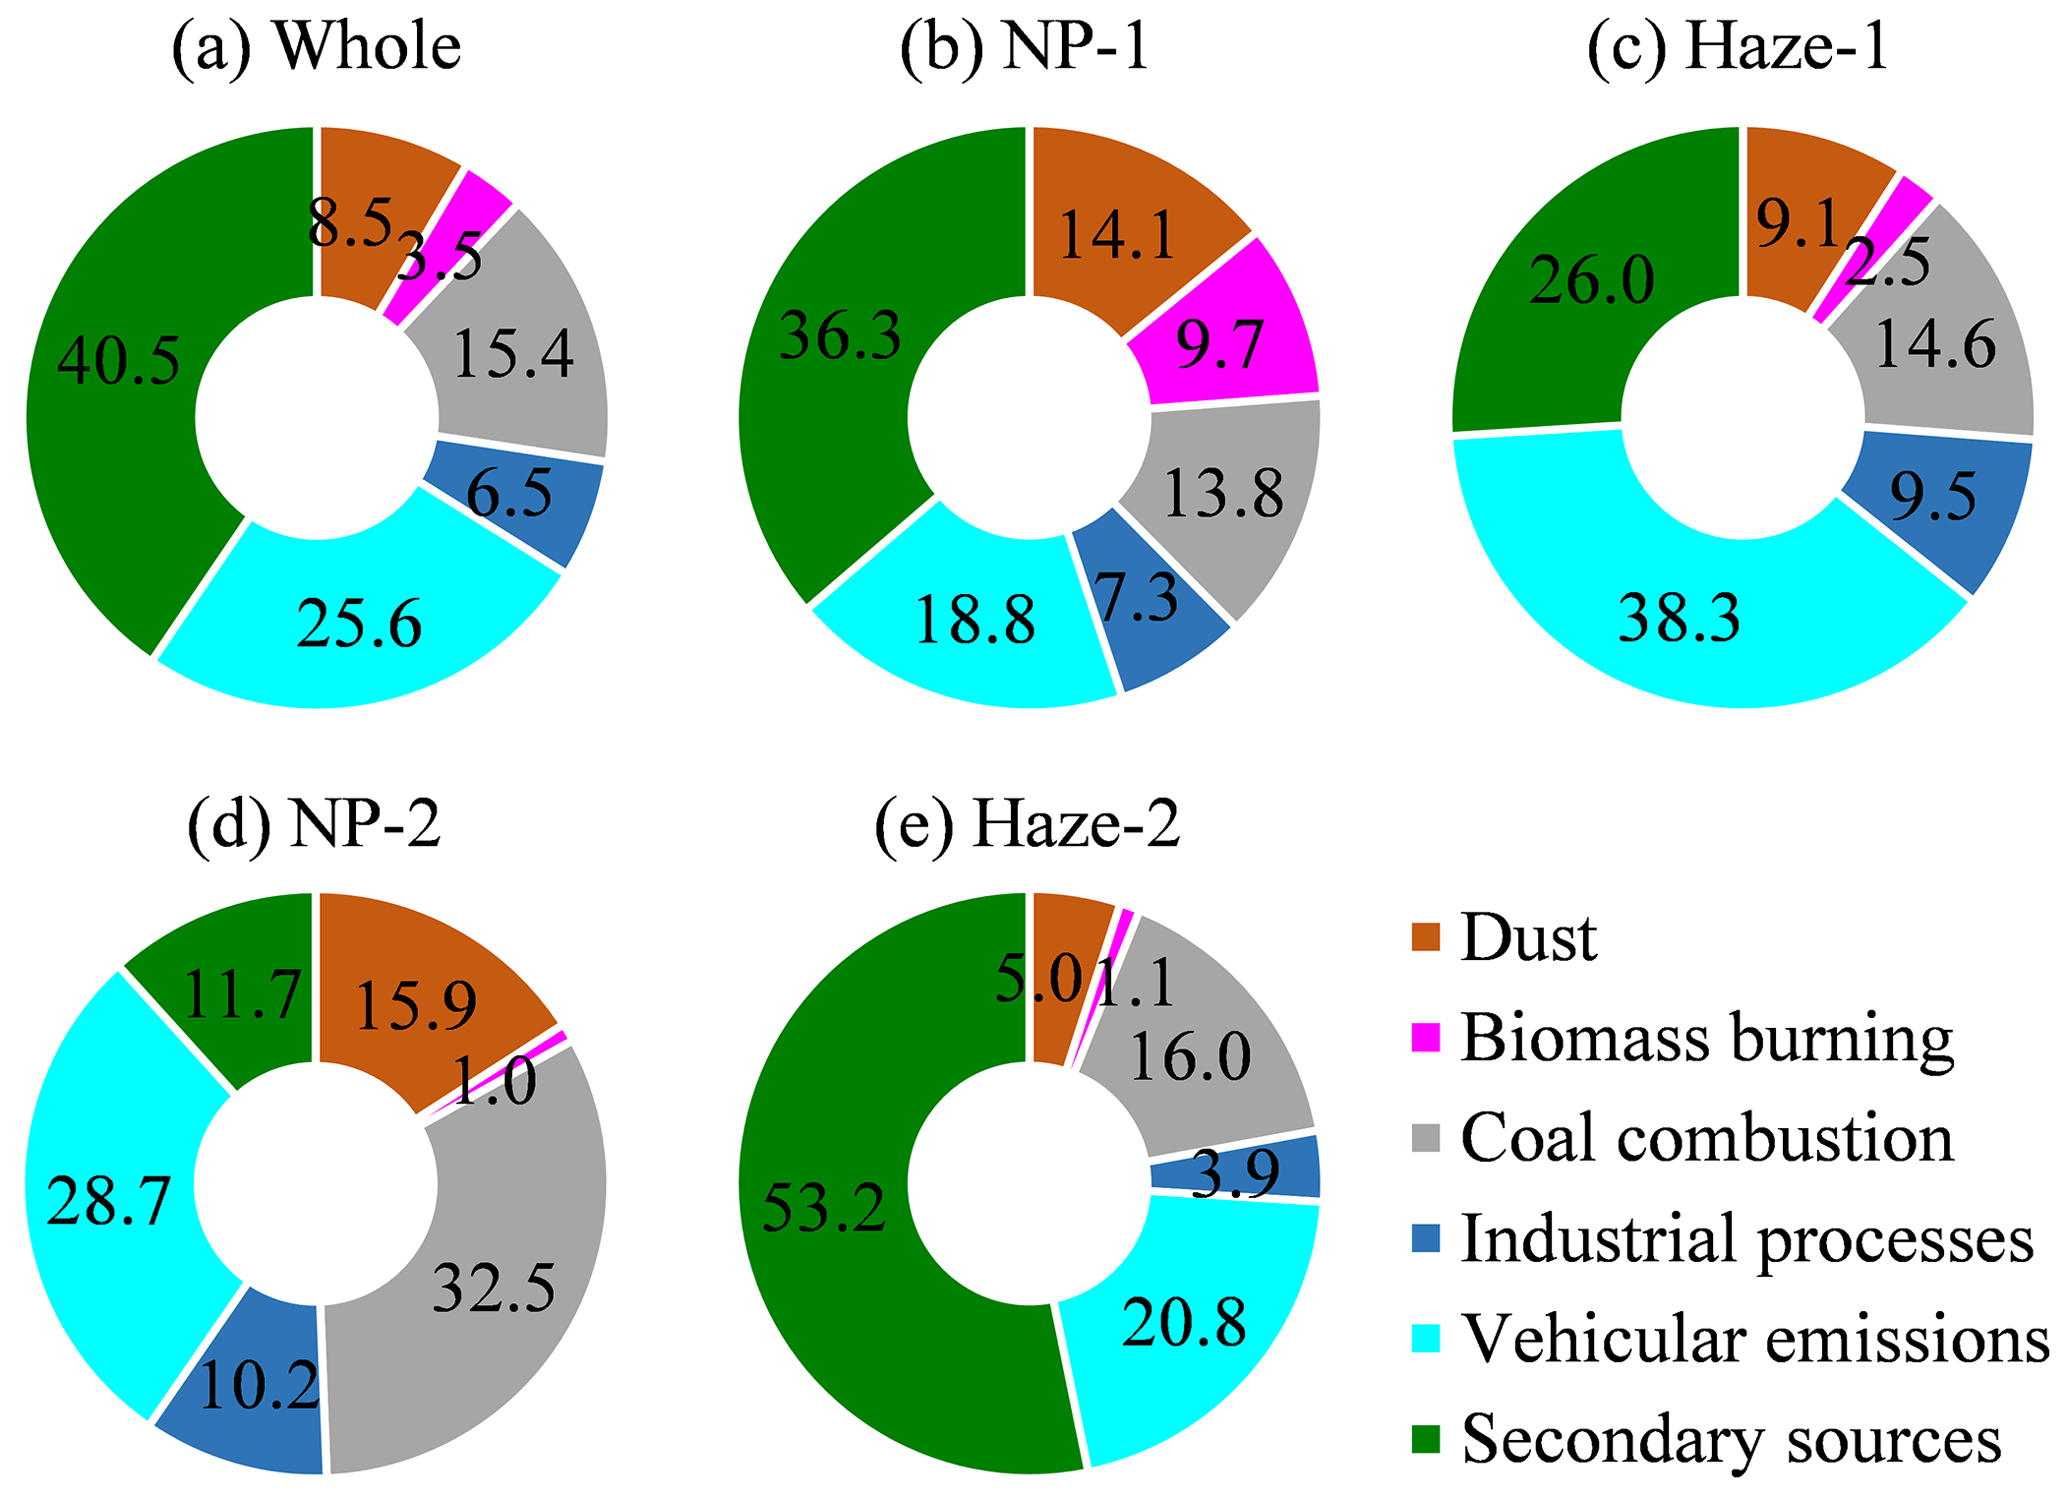
Based on PMF, there were six factors identified in this study: dust, biomass burning, coal combustion, industrial processes, vehicular emissions and secondary sources (Sect. S3). Except for secondary sources, the other five factors can be referred to as primary sources. As shown in Fig. 8, secondary sources were the highest contributor to PM2.5 during the whole study period, accounting for 40.5 %. According to its source profile (Fig. S9), secondary sources included SOM and secondary inorganic matter. Therefore, we can infer that secondary aerosols were produced by secondary reactions of their precursors (SO2, NOx, NH3 and VOCs) in the atmosphere. Vehicular emissions constituted the highest contributing factor among the primary sources, accounting for more than a quarter of the total PM2.5 mass (25.6 %). This high contribution is directly related to the level of vehicle ownership in Chengdu. The contribution of coal combustion (15.4 %) was more than 4 times that of biomass burning (3.5 %), which was mainly because the study period did not cover the traditional biomass burning season (late spring and early summer; Tao et al., 2013), whereas the pollutants emitted from coal combustion from certain industries (such as industrial furnaces and power plants) around Chengdu or other cities may have had a serious impact on the air quality of Chengdu. In addition, the contribution of dust was 8.5 %.
Due to the impact of pollution reduction measures, urbanization and changes in pollutant formation mechanisms in recent years, the contributions of the various sources identified in this study are markedly different compared to previous winters. For example, the contributions of coal combustion, biomass burning and industrial processes in this study are lower than those reported in winter 2011 (18 %, 16 % and 18 %, respectively) (Tao et al., 2014). This is mainly related to the various pollution reduction measures implemented in Chengdu and even the broader SCB in the past decade, such as the optimization of industrial infrastructure and the restructuring of energy, the improvements in industrial source pollutant emission standards, the widespread use of various pollutant treatment technologies and the strict controls imposed on outdoor biomass burning in rural areas (http://sthjt.sc.gov.cn/sthjt/c106120/2018/12/28/8f2a9dead56c4605ad2d26fe2e2fac43.shtml, last access: 20 January 2024). The minimal reduction in coal combustion sources may be due to the rapid development of industry offsetting the effects of pollution reduction. At the same time, it is worth noting that, although the contribution of coal combustion in this study is close to results reported in Beijing (13.3 %) (Lv et al., 2022), compared with Beijing, there is no coal-fired heating in winter in Chengdu. Therefore, coal combustion in Chengdu still deserves attention. The contribution of vehicular emissions increased by 12.0 % compared to 2018 (13.6 %) (Song et al., 2022) and is significantly higher than that of other medium-sized cities in the SCB (8.6 %–11.7 %) (Zhang et al., 2023b). In addition, the contribution of secondary sources is close to the results in 2011 (44.0 %) (Tao et al., 2014) and 2018 (43.4 %) (Song et al., 2022) in Chengdu and slightly lower than that in winter in Beijing (47.7 %) (Lv et al., 2022). Therefore, high levels of secondary sources are one of the common problems faced by many cities in China in reducing PM2.5.
As shown in Fig. 8b–e, from NP-1 to Haze-1, the contributions of secondary sources, biomass burning and dust decreased by 10.3 %, 7.2 % and 5.0 %, respectively. By contrast, the contribution of vehicular emissions increased by 19.5 %, and meanwhile, the contribution from industrial processes – most of which derives from the suburbs of Chengdu – increased by 2.2 %. During the NP-2 period, the precipitation and strong easterly winds not only reduced the contribution of secondary sources rich in hygroscopic species (such as SNA) by 14.3 % but also effectively cleared (decreased by 9.6 %) a large number of accumulated vehicular emission pollutants during Haze-1. In contrast, the contributions of coal combustion and dust sources increased by 17.9 % and 6.8 %, respectively. This is because the continuous easterly winds carried pollutants related to coal combustion in eastern Sichuan Province and Chongqing and greatly increased the contribution of coal combustion. At the same time, this continuous easterly wind also drove the contribution of dust in NP-2 to reach its highest level across the four periods (15.9 %). After entering the Haze-2 period, with the implementation of various emission reduction policies during the orange haze alarm period, compared with NP-2, the contributions of various primary sources decreased significantly. For example, the contributions of industrial processes, coal combustion and vehicular emissions decreased by 6.3 %, 16.5 % and 7.9 %, respectively. With the decrease in wind power and vehicular emissions, the contribution of dust sources was also lowest among the four periods (5.0 %). In contrast to the decrease in contributions from other sources, the secondary sources in the Haze-2 period reached their highest value among the four periods (53.2 %), which may be attributable to a large amount of secondary generation in Chengdu under the high-humidity conditions and regional transmission (Lv et al., 2021). In fact, the source composition of PM2.5 and its chemical components (both bulk-chemical and single-particle analysis) exhibited very similar characteristics during the evolution of the four periods; i.e., although the contribution of regional transmission cannot be ignored, Haze-1 was mainly caused by the gradual accumulation of pollutant emissions from sources related to local fossil fuel combustion, especially mobile sources, while Haze-2 was mainly triggered by high concentrations of secondary pollutants, which mainly came from regional transmission.
We found that the formation mechanism of haze in this study is different from previous winter study results in other regions in China, such as North China. For example, J. Zhang et al. (2020) found that residential coal burning and biomass burning were important factors causing winter haze in Northeast China. The contribution of industrial emissions to the formation of winter haze in the NCP region was much higher than that in Northeast China (Ma et al., 2016). Meanwhile, compared to previous winter studies in Chengdu (Liao et al., 2017; Li et al., 2017; Tao et al., 2013), the haze formation in this study presented some new characteristics. For example, (1) the key potential source areas during the haze period have shifted from the southeast in 2013 to the south; (2) mobile sources played a more important role, while the contributions of biomass burning and dust sources were significantly weaker; and (3) the contribution of nitrate to the formation of heavy pollution was more prominent. This means that, in order to develop efficient pollution reduction policies, it is very necessary to conduct targeted and timely research on the characteristics, sources and formation mechanisms of haze in the areas of concern.
3.5 Contribution of local sources vs. regional transmission
Figure S10 shows the relative contributions of local sources and regional transmission in the WRF-Chem model results during the whole study period and different pollution periods. It can be seen that, during the whole study period, the contributions of local sources and regional transmission were the same (50 % vs. 50 %). This means that pollution control in Chengdu still needs to involve strict joint prevention and control of regional air pollution on the basis of local pollutant emission reduction. In terms of the two haze events, the contribution of regional transmission during Haze-2 was higher than that during Haze-1, with contribution ratios of 55 % and 44 %, respectively. This further confirms our conclusion that regional transmission was key for the formation of Haze-2. It is worth noting that, during the Haze-2 period, Chengdu and the surrounding areas adopted control measures during the orange haze alarm period. However, due to the lack of timely source information, we may have overestimated the contribution of local sources during the Haze-2 period, and accordingly the actual contribution of regional transmission during this period may have been higher. In addition, compared with simulation results during heavy haze periods in other cities in China, the contributions of regional transmission during Haze-2 are close to those in Beijing (56 %) (Li and Han, 2016) but higher than those in Shanghai (37 %) and Suzhou (44 %) (L. Li et al., 2015).
4.1 Summary
The aerosol mass and chemical composition, morphology and mixing state, and sources and evolutionary processes at the beginning of 2023 in Chengdu were investigated with bulk-chemical and single-particle analysis along with numerical model simulations. Although the air quality in Chengdu has improved significantly in recent years, the city still faces serious air pollution in winter, especially from PM2.5 (95.6 ± 28.7 µg m−3) and gaseous pollutants related to mobile sources (such as NO2). Compared with other cities in China, PM2.5 reduction in Chengdu not only needs to focus on the increasing contribution of nitrate but also needs more attention paid to the high levels of OM. Based on the morphologies and elemental compositions of individual particles, these particles could be classified into mineral, OM, SIA, soot and fly ash/metal particles, with most existing in a state of being internally mixed in the atmosphere.
The whole study period included two non-pollution periods (NP-1 and NP-2) and two haze periods (Haze-1 and Haze-2). As pollution evolved, the chemical composition results obtained based on bulk-chemical and single-particle analysis exhibited strong consistency. From NP-1 to Haze-1, the mass contributions of OM and EC increased by 5.9 % and 1.1 %, and the number contributions of OM-SIA and OM-soot particles increased by 5.8 % and 1.7 %, respectively. Meanwhile, the correlation coefficient (R2) between PM2.5 and CO (an indicator of local emissions) reached 0.59, and the NO SO mass ratio and NO2 concentration (indicators of mobile sources) reached their highest values across the four periods. The short-term precipitation and sustained easterly winds led to a significant decrease in secondary inorganic species, i.e., SNA (by 15.6 %) and SIA (by 27.1 %) particles. As pollution evolved from NP-2 to Haze-2, the contributions of SNA and SIA particles experienced explosive growth, with growth rates of 24.2 % and 42.4 %, respectively. Meanwhile, the R2 between PM2.5 and CO was only 0.09, and the NO SO mass ratio and NO2 concentration were lower than in Haze-1, while the SOR and NOR both reached their highest values across the four periods. It can therefore be inferred that Haze-1 was mainly caused by the pollutant emissions from sources related to local fossil fuel combustion, especially mobile sources, while Haze-2 was mainly triggered by high concentrations of secondary pollutants, which mainly came from regional transmission. The differences in the sources and the comparison between local sources and regional transmission across the four periods further validated the different formation mechanisms of the two haze events. Based on the above analysis results, we have created a conceptual model of pollution evolution during the study period (Fig. 9).
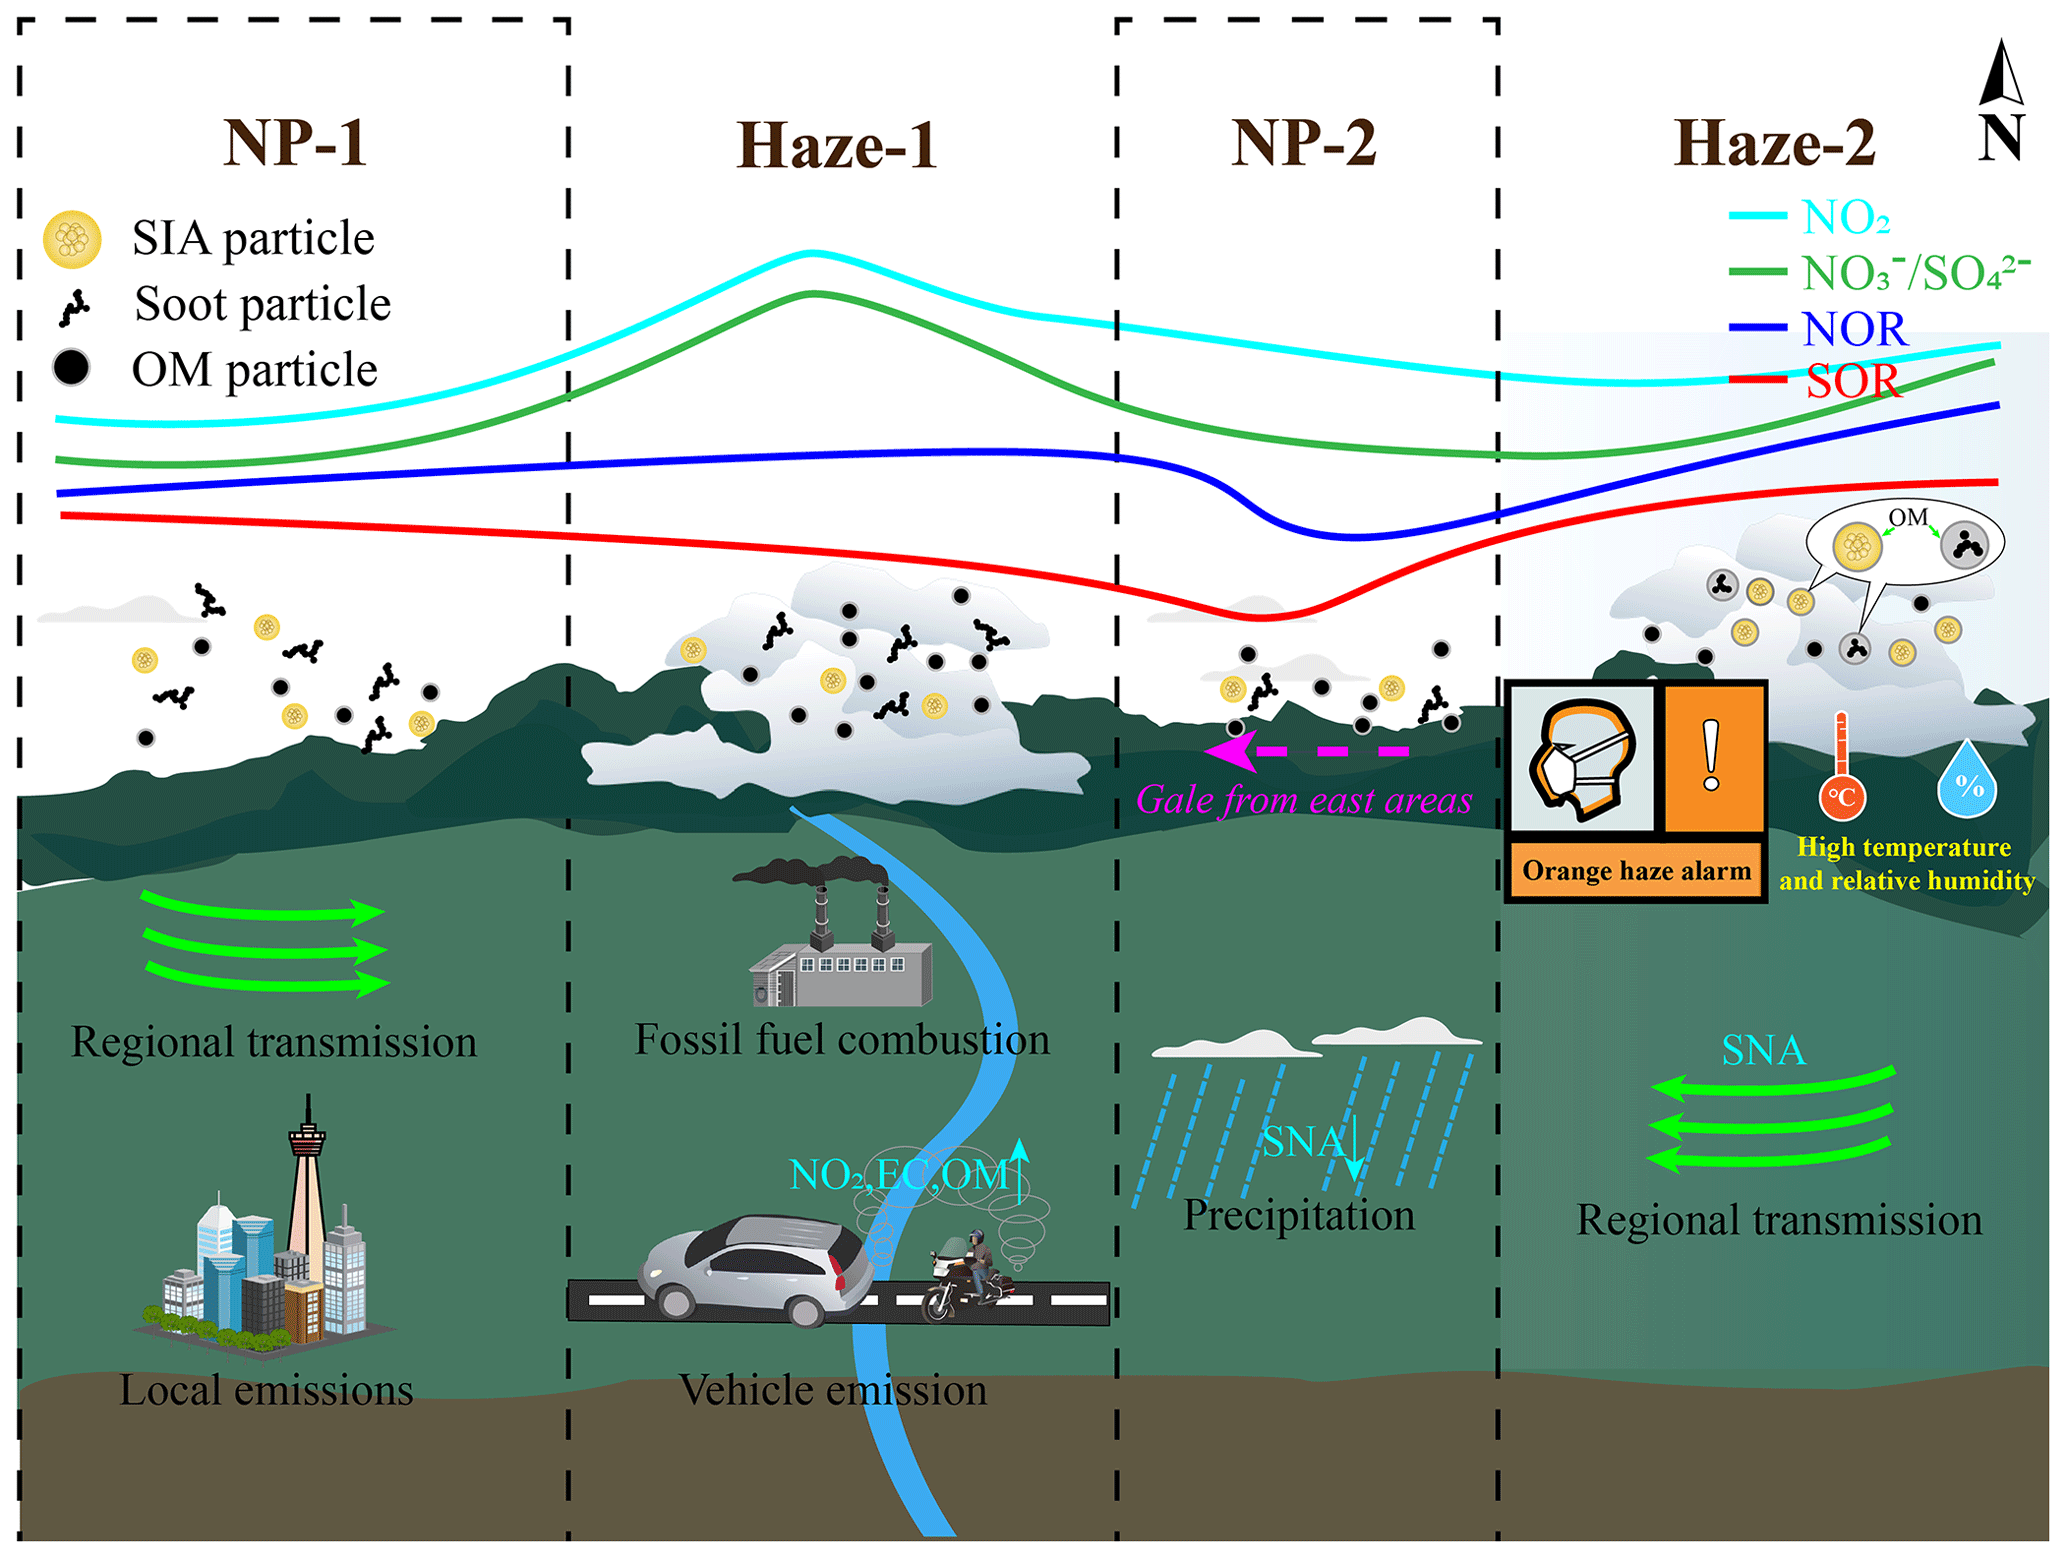
Figure 9Conceptual model of the pollution evolution characteristics and formation mechanisms in this study.
4.2 Implications
At present, the PM2.5 concentration in Chengdu is still higher than the CNAAQS and WHO guidance standards. Therefore, reducing PM2.5 emissions in Chengdu remains one of the important tasks to be faced in the future. Meanwhile, with the reduction in pollution and the enhancement of atmospheric oxidation in recent years, the formation mechanism of haze is also undergoing dynamic changes. This requires us to conduct timely research on the characteristics of PM2.5 and provide the latest information for formulating new pollution reduction policies. This study investigated two different haze processes in Chengdu and revealed their formation mechanism, and the results emphasize that future pollution reduction needs to focus not only on local sources, especially motor vehicle emissions, but also on the contribution of regional transmission, which may be an important factor causing serious pollution.
The TEM–EDS results further emphasized the importance of studying individual aerosol particles and their mixing states. This is mainly reflected in (1) the impact on health. Our study found that high levels of carbonaceous (OM- and soot-related) and fly ash/metal-related particles were present in the atmosphere of Chengdu, which include polycyclic aromatic hydrocarbons and various toxic metals (e.g., Pb, Zn, Cr or Mn), both of which can pose serious risks to human health (Chen et al., 2017; J. Zhang et al., 2020). Oberdörster et al. (2004) indicated that such ultrafine particles can have adverse health impacts via deposition in human lungs and further penetration into blood. Meanwhile, as they age and mix in the atmosphere, their health effects may also change. Li et al. (2013) found that the internal mixing of metals and acidic constituents likely solubilizes metals and modifies metal inclusion shapes, which can extend their toxicity into nontoxic parts in the particles. (2) The impact on climate: the light-absorbing particles (i.e., soot or BC and brown carbon – BrC) have been proven to reduce solar radiation reaching the ground and further influence regional climate and crop production (J. Zhang et al., 2020). In this study, we found that the number contribution of soot-related particles in each period was 12.5 %–23.9 %, which is much higher than the mass contribution of EC to PM2.5 (5.8 %–6.9 %). With the aggravation of pollution, soot particles mixed with other particles, and their particle sizes and morphologies undergo significant changes, which will further lead to changes in their hygroscopicity and optical properties, meaning that, ultimately, their climatic and environmental effects may differ significantly from when they exist alone (Adachi et al., 2010; Zhang et al., 2018). For example, Zhang et al. (2023a) found that the formation of organic coatings under the high RH could induce soot redistribution from the particle center to the edge in embedded soot-containing particles compared to partly coated soot-containing particles, and the soot redistribution reduces ∼ 13 % optical absorption enhancement of long-range-transported soot particles, and the radiative absorption of long-range-transported soot particles with a core-shell structure is overestimated by ∼ 20 % in the traditional Mie optical model. Meanwhile, tarball particles, as the primary BrC type, have a wide absorption spectrum from the visible to ultraviolet wavelengths (Hoffer et al., 2016) and were frequently detected in this study. Therefore, an accurate understanding of their contribution and secondary mixing would be of great value for evaluating the climatic effects of organic aerosol. Therefore, the single-particle analysis can provide in-depth information for studying the climatic and environmental effects of aerosol particles, which is crucial for numerical models applied in the evaluation of the impact of air pollution. However, current research on the mixing state of atmospheric particulate matter in Chengdu, even in Southwest China, is still insufficient, which leads to a serious lack of consideration of the mixing state of particulate matter in the current model.
The data involved in this study are available online in a public data repository of Figshare at https://doi.org/10.6084/m9.figshare.24745581 (Zhang, 2024).
The supplement related to this article is available online at: https://doi.org/10.5194/acp-24-2803-2024-supplement.
JZ and DS planned this campaign. JZ wrote the paper and led this research. YS, CC and WG performed the data analysis and wrote the manuscript together with JZ. QT, MF, TJ, QC, YL, WL and YW conducted the experiments and instrument maintenance. XH, LH, WW and GW helped with the data analysis. All the authors reviewed and edited the manuscript.
The contact author has declared that none of the authors has any competing interests.
Publisher's note: Copernicus Publications remains neutral with regard to jurisdictional claims made in the text, published maps, institutional affiliations, or any other geographical representation in this paper. While Copernicus Publications makes every effort to include appropriate place names, the final responsibility lies with the authors.
We would like to thank the Analysis and Testing Center of Southwest Jiaotong University for the technical support in the single-particle sample determination.
This research has been supported by the National Natural Science Foundation of China (grant nos. U23A2030, 42205100 and 41805095), the Basic Research Cultivation Support Plan of Southwest Jiaotong University (grant no. 2682023ZTPY016) and the Natural Science Foundation of Sichuan Province (grant no. 2022NSFSC0982).
This paper was edited by Dara Salcedo and reviewed by four anonymous referees.
Adachi, K., Chung, S. H., and Buseck, P. R.: Shapes of soot aerosol particles and implications for their effects on climate, J. Geophys. Res.-Atmos., 115, D152061, https://doi.org/10.1029/2009jd012868, 2010.
Adachi, K., Sedlacek, A. J., Kleinman, L., Springston, S. R., Wang, J., Chand, D., Hubbe, J. M., Shilling, J. E., Onasch, T. B., Kinase, T., Sakata, K., Takahashi, Y., and Buseck, P. R.: Spherical tarball particles form through rapid chemical and physical changes of organic matter in biomass-burning smoke, P. Natl. Acad. Sci. USA, 116, 19336–19341, https://doi.org/10.1073/pnas.1900129116, 2019.
An, Z., Huang, R. J., Zhang, R., Tie, X., Li, G., Cao, J., Zhou, W., Shi, Z., Han, Y., Gu, Z., and Ji, Y.: Severe haze in northern China: a synergy of anthropogenic emissions and atmospheric processes, P. Natl. Acad. Sci. USA, 116, 8657-8666, https://doi.org/10.1073/pnas.1900125116, 2019.
Chen, L., Zhang, J., Huang, X., Li, H., Dong, G., and Wei, S.: Characteristics and pollution formation mechanism of atmospheric fine particles in the megacity of Chengdu, China, Atmos. Res., 273, 106172, https://doi.org/10.1016/j.atmosres.2022.106172, 2022.
Chen, S., Xu, L., Zhang, Y., Chen, B., Wang, X., Zhang, X., Zheng, M., Chen, J., Wang, W., Sun, Y., Fu, P., Wang, Z., and Li, W.: Direct observations of organic aerosols in common wintertime hazes in North China: insights into direct emissions from Chinese residential stoves, Atmos. Chem. Phys., 17, 1259–1270, https://doi.org/10.5194/acp-17-1259-2017, 2017.
Deng, J., Jiang, L., Miao, W., Zhang, J., Dong, G., Liu, K., Chen, J., Peng, T., Fu, Y., Zhou, Y., Huang, X., Hu, M., Wang, F., and Xiao, L.: Characteristics of fine particulate matter (PM2.5) at Jinsha Site Museum, Chengdu, China, Environ. Sci. Pollut. Res. Int., 29, 1173–1183, https://doi.org/10.1007/s11356-021-15743-z, 2021.
Feng, T., Zhao, S., Bei, N., Liu, S., and Li, G.: Increasing atmospheric oxidizing capacity weakens emission mitigation effort in Beijing during autumn haze events, Chemosphere, 281, 130855, https://doi.org/10.1016/j.chemosphere.2021.130855, 2021.
Gao, M., Guttikunda, S. K., Carmichael, G. R., Wang, Y., Liu, Z., Stanier, C. O., Saide, P. E., and Yu, M.: Health impacts and economic losses assessment of the 2013 severe haze event in Beijing area, Sci. Total Environ., 511, 553–561, https://doi.org/10.1016/j.scitotenv.2015.01.005, 2015.
Geng, G., Xiao, Q., Zheng, Y., Tong, D., Zhang, Y., Zhang, X., Zhang, Q., He, K., and Liu, Y.: Impact of China's air pollution prevention and control action plan on PM2.5 chemical composition over eastern China, Sci. China Earth Sci., 62, 1872–1884, https://doi.org/10.1007/s11430-018-9353-x, 2019.
Hoffer, A., Tóth, A., Nyirö-Kósa, I., Pósfai, M., and Gelencsér, A.: Light absorption properties of laboratory-generated tar ball particles, Atmos. Chem. Phys., 16, 239–246, https://doi.org/10.5194/acp-16-239-2016, 2016.
Huang, R. J., Zhang, Y., Bozzetti, C., Ho, K. F., Cao, J. J., Han, Y., Daellenbach, K. R., Slowik, J. G., Platt, S. M., Canonaco, F., Zotter, P., Wolf, R., Pieber, S. M., Bruns, E. A., Crippa, M., Ciarelli, G., Piazzalunga, A., Schwikowski, M., Abbaszade, G., Schnelle-Kreis, J., Zimmermann, R., An, Z., Szidat, S., Baltensperger, U., El Haddad, I., and Prevot, A. S.: High secondary aerosol contribution to particulate pollution during haze events in China, Nature, 514, 218–222, https://doi.org/10.1038/nature13774, 2014.
Huang, X., Liu, Z., Liu, J., Hu, B., Wen, T., Tang, G., Zhang, J., Wu, F., Ji, D., Wang, L., and Wang, Y.: Chemical characterization and source identification of PM2.5 at multiple sites in the Beijing–Tianjin–Hebei region, China, Atmos. Chem. Phys., 17, 12941–12962, https://doi.org/10.5194/acp-17-12941-2017, 2017.
Huang, X., Zhang, J., Luo, B., Wang, L., Tang, G., Liu, Z., Song, H., Zhang, W., Yuan, L., and Wang, Y.: Water-soluble ions in PM2.5 during spring haze and dust periods in Chengdu, China: Variations, nitrate formation and potential source areas, Environ. Pollut., 243, 1740–1749, https://doi.org/10.1016/j.envpol.2018.09.126, 2018.
Huang, X., Zhang, J., Zhang, W., Tang, G., and Wang, Y.: Atmospheric ammonia and its effect on PM2.5 pollution in urban Chengdu, Sichuan Basin, China, Environ. Pollut., 291, 118195, https://doi.org/10.1016/j.envpol.2021.118195, 2021a.
Huang, X., Tang, G., Zhang, J., Liu, B., Liu, C., Zhang, J., Cong, L., Cheng, M., Yan, G., Gao, W., Wang, Y., and Wang, Y.: Characteristics of PM2.5 pollution in Beijing after the improvement of air quality, J. Environ. Sci.-China, 100, 1–10, https://doi.org/10.1016/j.jes.2020.06.004, 2021b.
Ji, D., Li, L., Wang, Y., Zhang, J., Cheng, M., Sun, Y., Liu, Z., Wang, L., Tang, G., Hu, B., Chao, N., Wen, T., and Miao, H.: The heaviest particulate air-pollution episodes occurred in northern China in January, 2013: Insights gained from observation, Atmos. Environ., 92, 546–556, https://doi.org/10.1016/j.atmosenv.2014.04.048, 2014.
Li, J. and Han, Z.: A modeling study of severe winter haze events in Beijing and its neighboring regions, Atmos. Res., 170, 87–97, https://doi.org/10.1016/j.atmosres.2015.11.009, 2016.
Li, L., An, J. Y., Zhou, M., Yan, R. S., Huang, C., Lu, Q., Lin, L., Wang, Y. J., Tao, S. K., Qiao, L. P., Zhu, S. H., and Chen, C. H.: Source apportionment of fine particles and its chemical components over the Yangtze River Delta, China during a heavy haze pollution episode, Atmos. Environ., 123, 415–429, https://doi.org/10.1016/j.atmosenv.2015.06.051, 2015.
Li, L., Tan, Q., Zhang, Y., Feng, M., Qu, Y., An, J., and Liu, X.: Characteristics and source apportionment of PM2.5 during persistent extreme haze events in Chengdu, southwest China, Environ. Pollut., 230, 718–729, https://doi.org/10.1016/j.envpol.2017.07.029, 2017.
Li, W. and Shao, L.: Transmission electron microscopy study of aerosol particles from the brown hazes in northern China, J. Geophys. Res.-Atmos., 114, D09302, https://doi.org/10.1029/2008jd011285, 2009.
Li, W., Wang, T., Zhou, S., Lee, S., Huang, Y., Gao, Y., and Wang, W.: Microscopic observation of metal-containing particles from Chinese continental outflow observed from a non-industrial site, Environ. Sci. Technol., 47, 9124–9131, https://doi.org/10.1021/es400109q, 2013.
Li, W., Chi, J., Shi, Z., Wang, X., Chen, B., Wang, Y., Li, T., Chen, J., Zhang, D., Wang, Z., Shi, C., Liu, L., and Wang, W.: Composition and hygroscopicity of aerosol particles at Mt. Lu in South China: Implications for acid precipitation, Atmos. Environ., 94, 626–636, https://doi.org/10.1016/j.atmosenv.2014.06.003, 2014.
Li, W., Sun, J., Xu, L., Shi, Z., Riemer, N., Sun, Y., Fu, P., Zhang, J., Lin, Y., Wang, X., Shao, L., Chen, J., Zhang, X., Wang, Z., and Wang, W.: A conceptual framework for mixing structures in individual aerosol particles, J. Geophys. Res.-Atmos., 121, 13784–13798, https://doi.org/10.1002/2016jd025252, 2016.
Li, W. J., Chen, S. R., Xu, Y. S., Guo, X. C., Sun, Y. L., Yang, X. Y., Wang, Z. F., Zhao, X. D., Chen, J. M., and Wang, W. X.: Mixing state and sources of submicron regional background aerosols in the northern Qinghai–Tibet Plateau and the influence of biomass burning, Atmos. Chem. Phys., 15, 13365–13376, https://doi.org/10.5194/acp-15-13365-2015, 2015.
Liao, T., Wang, S., Ai, J., Gui, K., Duan, B., Zhao, Q., Zhang, X., Jiang, W., and Sun, Y.: Heavy pollution episodes, transport pathways and potential sources of PM2.5 during the winter of 2013 in Chengdu (China), Sci. Total Environ., 584, 1056–1065, https://doi.org/10.1016/j.scitotenv.2017.01.160, 2017.
Lin, Y., Wang, Y., Pan, B., Hu, J., Guo, S., Levy Zamora, M., Tian, P., Su, Q., Ji, Y., Zhao, J., Gomez-Hernandez, M., Hu, M., and Zhang, R.: Formation, radiative forcing, and climatic effects of severe regional haze, Atmos. Chem. Phys., 22, 4951–4967, https://doi.org/10.5194/acp-22-4951-2022, 2022.
Liu, L., Zhang, J., Xu, L., Yuan, Q., Huang, D., Chen, J., Shi, Z., Sun, Y., Fu, P., Wang, Z., Zhang, D., and Li, W.: Cloud scavenging of anthropogenic refractory particles at a mountain site in North China, Atmos. Chem. Phys., 18, 14681–14693, https://doi.org/10.5194/acp-18-14681-2018, 2018.
Liu, L., Zhang, J., Zhang, Y., Wang, Y., Xu, L., Yuan, Q., Liu, D., Sun, Y., Fu, P., Shi, Z., and Li, W.: Persistent residential burning-related primary organic particles during wintertime hazes in North China: insights into their aging and optical changes, Atmos. Chem. Phys., 21, 2251–2265, https://doi.org/10.5194/acp-21-2251-2021, 2021.
Liu, X. G., Li, J., Qu, Y., Han, T., Hou, L., Gu, J., Chen, C., Yang, Y., Liu, X., Yang, T., Zhang, Y., Tian, H., and Hu, M.: Formation and evolution mechanism of regional haze: a case study in the megacity Beijing, China, Atmos. Chem. Phys., 13, 4501–4514, https://doi.org/10.5194/acp-13-4501-2013, 2013.
Liu, Z., Hu, B., Zhang, J., Yu, Y., and Wang, Y.: Characteristics of aerosol size distributions and chemical compositions during wintertime pollution episodes in Beijing, Atmos. Res., 168, 1–12, https://doi.org/10.1016/j.atmosres.2015.08.013, 2016.
Luo, J., Zhang, J., Huang, X., Liu, Q., Luo, B., Zhang, W., Rao, Z., and Yu, Y.: Characteristics, evolution, and regional differences of biomass burning particles in the Sichuan Basin, China, J. Environ. Sci.-China, 89, 35–46, https://doi.org/10.1016/j.jes.2019.09.015, 2020.
Lv, L., Chen, Y., Han, Y., Cui, M., Wei, P., Zheng, M., and Hu, J.: High-time-resolution PM2.5 source apportionment based on multi-model with organic tracers in Beijing during haze episodes, Sci. Total Environ., 772, 144766, https://doi.org/10.1016/j.scitotenv.2020.144766, 2021.
Lv, L., Wei, P., Hu, J., Chen, Y., and Shi, Y.: Source apportionment and regional transport of PM2.5 during haze episodes in Beijing combined with multiple models, Atmos. Res., 266, 105957, https://doi.org/10.1016/j.atmosres.2021.105957, 2022.
Ma, L., Li, M., Zhang, H., Li, L., Huang, Z., Gao, W., Chen, D., Fu, Z., Nian, H., Zou, L., Gao, J., Chai, F., and Zhou, Z.: Comparative analysis of chemical composition and sources of aerosol particles in urban Beijing during clear, hazy, and dusty days using single particle aerosol mass spectrometry, J. Clean. Prod., 112, 1319–1329, https://doi.org/10.1016/j.jclepro.2015.04.054, 2016.
Marple, V. A., Rubow, K. L., and Olson, B. A.: Inertial, gravitational, centrifugal, and thermal collection techniques, in: Aerosol Measurement, edited by: Willike, K. and Baron, P. A., 206–233, Van Nostrand Reinhold, New York, 1993.
Mikhailov, E. F., Mironov, G. N., Pöhlker, C., Chi, X., Krüger, M. L., Shiraiwa, M., Förster, J.-D., Pöschl, U., Vlasenko, S. S., Ryshkevich, T. I., Weigand, M., Kilcoyne, A. L. D., and Andreae, M. O.: Chemical composition, microstructure, and hygroscopic properties of aerosol particles at the Zotino Tall Tower Observatory (ZOTTO), Siberia, during a summer campaign, Atmos. Chem. Phys., 15, 8847–8869, https://doi.org/10.5194/acp-15-8847-2015, 2015.
Oberdörster, G., Sharp, Z., Atudorei, V., Elder, A., Gelein, R., Kreyling, W., and Cox, C.: Translocation of inhaled ultrafine particles to the brain, Inhal. Toxicol., 16, 437–445, https://doi.org/10.1080/08958370490439597, 2004.
Paatero, P. and Hopke, P. K.: Discarding or downweighting high-noise variables in factor analytic models, Anal. Chim. Acta., 490, 277–289, https://doi.org/10.1016/s0003-2670(02)01643-4, 2003.
Paatero, P. and Tapper, U.: Positive matrix factorization-a nonnegative factor model with optimal utilization of error-estimates of data values, Environmetrics, 5, 111–126, https://doi.org/10.1002/ENV.3170050203, 1994.
Peng, C., Yang, F., Tian, M., Shi, G., Li, L., Huang, R. J., Yao, X., Luo, B., Zhai, C., and Chen, Y.: Brown carbon aerosol in two megacities in the Sichuan Basin of southwestern China:Light absorption properties and implications, Sci. Total Environ., 719, 137483, https://doi.org/10.1016/j.scitotenv.2020.137483, 2020.
Pöschl, U.: Atmospheric aerosols: composition, transformation, climate and health effects, Angew. Chem. Int. Edit., 44, 7520–7540, https://doi.org/10.1002/anie.200501122, 2005.
Seinfeld, J. H. and Pandis, S. N.: Atmospheric chemistry and physics: from air pollution to climate change, John Wiley & Sons, New York., 44, 1376–1377, https://doi.org/10.5860/CHOICE.44-4512, 2006.
Song, T., Feng, M., Song, D., Zhou, L., Qiu, Y., Tan, Q., and Yang, F.: Enhanced nitrate contribution during winter haze events in a megacity of Sichuan Basin, China: formation mechanism and source apportionment, J. Clean. Prod., 370, 133272, https://doi.org/10.1016/j.jclepro.2022.133272, 2022.
Tao, J., Zhang, L., Engling, G., Zhang, R., Yang, Y., Cao, J., Zhu, C., Wang, Q., and Luo, L.: Chemical composition of PM2.5 in an urban environment in Chengdu, China: Importance of springtime dust storms and biomass burning, Atmos. Res., 122, 270–283, https://doi.org/10.1016/j.atmosres.2012.11.004, 2013.
Tao, J., Gao, J., Zhang, L., Zhang, R., Che, H., Zhang, Z., Lin, Z., Jing, J., Cao, J., and Hsu, S.-C.: PM2.5 pollution in a megacity of southwest China: source apportionment and implication, Atmos. Chem. Phys., 14, 8679–8699, https://doi.org/10.5194/acp-14-8679-2014, 2014.
Turpin, B. J. and Lim, H.J.: Species Contributions to PM2.5 mass concentrations: revisiting common assumptions for estimating organic mass, Aerosol Sci. Technol., 35, 602–610, https://doi.org/10.1080/02786820119445, 2001.
Wang, H., Tian, M., Chen, Y., Shi, G., Liu, Y., Yang, F., Zhang, L., Deng, L., Yu, J., Peng, C., and Cao, X.: Seasonal characteristics, formation mechanisms and source origins of PM2.5 in two megacities in Sichuan Basin, China, Atmos. Chem. Phys., 18, 865–881, https://doi.org/10.5194/acp-18-865-2018, 2018.
Wang, J., Gao, J., Che, F., Wang, Y., Lin, P., and Zhang, Y.: Decade-long trends in chemical component properties of PM2.5 in Beijing, China (2011–2020), Sci. Total Environ., 832, 154664, https://doi.org/10.1016/j.scitotenv.2022.154664, 2022a.
Wang, X., Shen, Z., Liu, F., Lu, D., Tao, J., Lei, Y., Zhang, Q., Zeng, Y., Xu, H., Wu, Y., Zhang, R., and Cao, J.: Saccharides in summer and winter PM2.5 over Xi'an, Northwestern China: Sources, and yearly variations of biomass burning contribution to PM2.5, Atmos. Res., 214, 410–417, https://doi.org/10.1016/j.atmosres.2018.08.024, 2018b.
Wang, Y., Jin, X., Liu, Z., Wang, G., Tang, G., Lu, K., Hu, B., Wang, S., Li, G., An, X., Wang, C., Hu, Q., He, L., Zhang, F., and Zhang, Y.: Progress in quantitative research on the relationship between atmospheric oxidation and air quality, J. Environ. Sci.-China, 123, 350–366, https://doi.org/10.1016/j.jes.2022.06.029, 2023.
Wang, Y., Hu, M., Hu, W., Zheng, J., Niu, H., Fang, X., Xu, N., Wu, Z., Guo, S., Wu, Y., Chen, W., Lu, S., Shao, M., Xie, S., Luo, B., and Zhang, Y.: Secondary formation of aerosols under typical high-humidity conditions in wintertime Sichuan Basin, China: a contrast to the North China Plain, J. Geophys. Res.-Atmos., 126, D03456, https://doi.org/10.1029/2021jd034560, 2021.
Wang, Y. S., Yao, L., Wang, L. L., Liu, Z. R., Ji, D. S., Tang, G. Q., Zhang, J. K., Sun, Y., Hu, B., and Xin, J. Y.: Mechanism for the formation of the January 2013 heavy haze pollution episode over central and eastern China, Sci. China Earth Sci., 57, 14–25, https://doi.org/10.1007/s11430-013-4773-4, 2014.
Wang, Z., Wang, R., Wang, J., Wang, Y., McPherson Donahue, N., Tang, R., Dong, Z., Li, X., Wang, L., Han, Y., and Cao, J.: The seasonal variation, characteristics and secondary generation of PM2.5 in Xi'an, China, especially during pollution events, Environ. Res., 212, 113388, https://doi.org/10.1016/j.envres.2022.113388, 2022b.
Xu, H., Cao, J., Chow, J. C., Huang, R. J., Shen, Z., Chen, L. W. A., Ho, K. F., and Watson, J. G.: Inter-annual variability of wintertime PM2.5 chemical composition in Xi'an, China: Evidences of changing source emissions, Sci. Total Environ., 545, 546–555, https://doi.org/10.1016/j.scitotenv.2015.12.070, 2016.
Xu, P., Zhang, J., Ji, D., Liu, Z., Tang, G., Jiang, C., and Wang, Y.: Characterization of submicron particles during autumn in Beijing, China, J. Environ. Sci.-China, 63, 16–27, https://doi.org/10.1016/j.jes.2017.03.036, 2018.
Yang, Y. R., Liu, X. G., Qu, Y., An, J. L., Jiang, R., Zhang, Y. H., Sun, Y. L., Wu, Z. J., Zhang, F., Xu, W. Q., and Ma, Q. X.: Characteristics and formation mechanism of continuous hazes in China: a case study during the autumn of 2014 in the North China Plain, Atmos. Chem. Phys., 15, 8165–8178, https://doi.org/10.5194/acp-15-8165-2015, 2015.
Yuan, Q., Xu, J., Liu, L., Zhang, A., Liu, Y., Zhang, J., Wan, X., Li, M., Qin, K., Cong, Z., Wang, Y., Kang, S., Shi, Z., Pósfai, M., and Li, W.: Evidence for large amounts of brown carbonaceous tarballs in the Himalayan atmosphere, Environ. Sci. Technol. Lett., 8, 16–23, https://doi.org/10.1021/acs.estlett.0c00735, 2020.
Zhan, Y., Xie, M., Zhao, W., Wang, T., Gao, D., Chen, P., Tian, J., Zhu, K., Li, S., Zhuang, B., Li, M., Luo, Y., and Zhao, R.: Quantifying the seasonal variations in and regional transport of PM2.5 in the Yangtze River Delta region, China: characteristics, sources, and health risks, Atmos. Chem. Phys., 23, 9837–9852, https://doi.org/10.5194/acp-23-9837-2023, 2023.
Zhang, C., Zou, Z., Chang, Y., Zhang, Y., Wang, X., and Yang, X.: Source assessment of atmospheric fine particulate matter in a Chinese megacity: insights from long-term, high-time resolution chemical composition measurements from Shanghai flagship monitoring supersite, Chemosphere, 251, 126598, https://doi.org/10.1016/j.chemosphere.2020.126598, 2020.
Zhang, J.: Data for “Chemical composition, sources and formation mechanism of urban PM2.5 in Southwest China: A case study at the beginning of 2023”, figshare [data set], https://doi.org/10.6084/m9.figshare.24745581, 2024.
Zhang, J., Liu, L., Wang, Y., Ren, Y., Wang, X., Shi, Z., Zhang, D., Che, H., Zhao, H., Liu, Y., Niu, H., Chen, J., Zhang, X., Lingaswamy, A. P., Wang, Z., and Li, W.: Chemical composition, source, and process of urban aerosols during winter haze formation in Northeast China, Environ. Pollut., 231, 357–366, https://doi.org/10.1016/j.envpol.2017.07.102, 2017.
Zhang, J., Liu, L., Xu, L., Lin, Q., Zhao, H., Wang, Z., Guo, S., Hu, M., Liu, D., Shi, Z., Huang, D., and Li, W.: Exploring wintertime regional haze in northeast China: role of coal and biomass burning, Atmos. Chem. Phys., 20, 5355–5372, https://doi.org/10.5194/acp-20-5355-2020, 2020.
Zhang, J., Huang, X., Yu, Y., Liu, Q., Zhang, J., Song, H., and Wang, Y.: Insights into the characteristics of aerosols using an integrated single particle–bulk chemical approach, Atmos. Res., 250, 105374, https://doi.org/10.1016/j.atmosres.2020.105374, 2021a.
Zhang, J., Yuan, Q., Liu, L., Wang, Y., Zhang, Y., Xu, L., Pang, Y., Zhu, Y., Niu, H., Shao, L., Yang, S., Liu, H., Pan, X., Shi, Z., Hu, M., Fu, P., and Li, W.: Trans-regional transport of haze particles from the North China Plain to Yangtze River Delta during Winter, J. Geophys. Res.-Atmos., 126, D033778, https://doi.org/10.1029/2020jd033778, 2021b.
Zhang, J., Li, W., Wang, Y., Teng, X., Zhang, Y., Xu, L., Yuan, Q., Wu, G., Niu, H., and Shao, L.: Structural collapse and coating composition changes of soot particles during long-range transport, J. Geophys. Res.-Atmos., 128, e2023JD038871, https://doi. org/10.1029/2023JD038871, 2023a.
Zhang, J., Huang, X., Li, J., Chen, L., Zhao, R., Wang, R., Sun, W., Chen, C., Su, Y., Wang, F., Huang, Y., and Lin, C.: Chemical composition, sources and evolution of PM2.5 during wintertime in the city cluster of southern Sichuan, China, Atmos. Pollut. Res., 14, 101635, https://doi.org/10.1016/j.apr.2022.101635, 2023b.
Zhang, J., Li, J., Su, Y., Chen, C., Chen, L., Huang, X., Wang, F., Huang, Y., and Wang, G.: Interannual evolution of the chemical composition, sources and processes of PM2.5 in Chengdu, China: insights from observations in four winters, J. Environ. Sci.-China, 138, 32–45, https://doi.org/10.1016/j.jes.2023.02.055, 2024.
Zhang, J. K., Sun, Y., Liu, Z. R., Ji, D. S., Hu, B., Liu, Q., and Wang, Y. S.: Characterization of submicron aerosols during a month of serious pollution in Beijing, 2013, Atmos. Chem. Phys., 14, 2887–2903, https://doi.org/10.5194/acp-14-2887-2014, 2014.
Zhang, J. K., Luo, B., Zhang, J. Q., Ouyang, F., Song, H. Y., Liu, P. C., Cao, P., Schäfer, K., Wang, S. G., Huang, X. J., and Lin, Y. F.: Analysis of the characteristics of single atmospheric particles in Chengdu using single particle mass spectrometry, Atmos. Environ., 157, 91–100, https://doi.org/10.1016/j.atmosenv.2017.03.012, 2017.
Zhang, Q., Shen, Z., Cao, J., Zhang, R., Zhang, L., Huang, R. J., Zheng, C., Wang, L., Liu, S., Xu, H., Zheng, C., and Liu, P.: Variations in PM2.5, TSP, BC, and trace gases (NO2, SO2, and O3) between haze and non-haze episodes in winter over Xi'an, China, Atmos. Environ., 112, 64–71, https://doi.org/10.1016/j.atmosenv.2015.04.033, 2015.
Zhang, R., Khalizov, A. F., Pagels, J., Zhang, D., Xue, H., and McMurry, P. H.: Variability in morphology, hygroscopicity, and optical properties of soot aerosols during atmospheric processing, P. Natl. Acad. Sci. USA, 105, 10291–10296, https://doi.org/10.1073/pnas.0804860105, 2008.
Zhang, Y., Yuan, Q., Huang, D., Kong, S., Zhang, J., Wang, X., Lu, C., Shi, Z., Zhang, X., Sun, Y., Wang, Z., Shao, L., Zhu, J., and Li, W.: Direct observations of fine primary particles from residential coal burning: insights into their morphology, composition, and hygroscopicity, J. Geophys. Res.-Atmos., 123, 12964–12979, https://doi.org/10.1029/2018jd028988, 2018.
Zhu, X. W., Tang, G. Q., Hu, B., Wang, L. L., Xin, J. Y., Zhang, J. K., Liu, Z. R., Münkel, C., and S., W. Y.: Regional pollution and its formation mechanism over North China Plain: A case study with ceilometer observations and model simulations, J. Geophys. Res.-Atmos., 121, D14574, https://doi.org/10.1002/2016JD025730, 2016.