the Creative Commons Attribution 4.0 License.
the Creative Commons Attribution 4.0 License.
 | 10 Jan 2024
Assessing the assimilation of Himawari-8 observations on aerosol forecasts and radiative effects during pollution transport from South Asia to the Tibetan Plateau
Min Zhao
Daisuke Goto
Guangyu Shi
Emissions from South Asia (SA) represent a critical source of aerosols on the Tibetan Plateau (TP), and aerosols can significantly reduce the surface solar energy. To enhance the precision of aerosol forecasting and its radiative effects in SA and the TP, we employed a four-dimensional local ensemble transform Kalman filter (4D-LETKF) aerosol data assimilation (DA) system. This system was utilized to assimilate Himawari-8 aerosol optical thickness (AOT) into the Weather Research and Forecasting model coupled with Chemistry (WRF-Chem) to depict one SA air pollution outbreak event in spring 2018. Sensitivity tests for the assimilation system were conducted first to tune temporal localization lengths. Comparisons with independent Moderate Resolution Imaging Spectroradiometer (MODIS) and AErosol RObotic NETwork (AERONET) observations demonstrate that the AOT analysis and forecast fields have more reasonable diurnal variations by assimilating all the observations within a 12 h window, which are both better than assimilating the hourly observations in the current assimilation time slot. Assimilation of the entire window of observations with aerosol radiative effect activation significantly improves the prediction of downward solar radiation compared to the free-run experiment. The AOT assimilation with aerosol radiative effect activation led to a reduction in aerosol concentrations over SA, resulting in increased surface radiation, temperature, boundary layer height, and atmospheric instability. These changes facilitated air uplift, promoting aerosol transport from SA to the southeastern TP and leading to an increase in AOT in this region.
- Article
(12211 KB) - Full-text XML
-
Supplement
(1542 KB) - BibTeX
- EndNote


Atmospheric aerosols substantially impact radiative balance by absorbing and scattering solar radiation. Furthermore, aerosols act as cloud condensation nuclei, modifying the properties of clouds and ultimately impacting the hydrological cycle (Ramanathan et al., 2001). Aerosols tend to concentrate near their source regions, but they can also have a significant impact on clean areas through long-range transport (Huang et al., 2007; Liu et al., 2008; Xia et al., 2008). This phenomenon has been observed in many regions worldwide, including the Tibetan Plateau (TP), which is the largest and highest plateau on Earth, covering an area of approximately 2 400 000 km2 with an average elevation of more than 4000 m a.s.l. (above sea level) (Li et al., 2020). The environment in the TP is highly sensitive to climate change and human activities, and the rate of warming in the TP over the past 3 decades has been twice the rate of global warming (Xu et al., 2009). Previous studies have demonstrated that aerosols (i.e., black carbon (BC) and dust) from South Asia (SA) can reach the TP, contributing to influencing radiative heat and further shrinking the local cryospheric system. Light-absorbing carbonaceous aerosol particles, such as BC or brown carbon (BrC), and mineral dust can both warm the atmosphere and reduce the surface albedo (Ming et al., 2013), resulting in accelerated glacier retreat (Jacobson, 2001; Hansen and Nazarenko, 2004; Bond et al., 2013; Sarangi et al., 2020). The retreat of glaciers on the TP and the associated changes in surface heating may adversely affect the hydrological cycle and freshwater supply for most of Asia (Yao et al., 2012, 2015). The TP usually acts as a receptor of aerosols from the surrounding region, especially from heavily polluted SA (Lu et al., 2012; You et al., 2016). Although the high altitude of the Himalayas acts as a natural barrier to inhibit the transport of aerosols to the TP (Marinoni et al., 2010; Qiu, 2013; Xu et al., 2009, 2014), the Yarlung Tsangpo River valley causes a “leaking wall”, forming a pollution channel that affects the southeastern TP (Cao et al., 2010). Furthermore, solar energy is an important clean energy source for local communities in the TP, given the challenges associated with long-distance energy supply (Yang et al., 2010). In fact, aerosols are also considered essential for solar power generation (Trenberth et al., 2014; Stephens et al., 2012). However, the limited availability of aerosol measurements in the TP region, which is mostly limited to a few surface locations (Gui et al., 2010; J. Zhang et al., 2020), poses significant challenges in accurately assessing modeling techniques to simulate aerosol distribution and properties in this area. There is still a lack of research on AOT assimilation technology and application. When large amounts of aerosols are released into the atmosphere, they have significant short-term effects on local meteorological conditions (Koren et al., 2004; Wilcox, 2012). Numerous studies have pointed to significant impacts on the transport of aerosols to the TP associated with SA biomass burning (Yang et al., 2018; Li et al., 2020; Zhao et al., 2021). The optimization of the initial aerosol distribution in SA is crucial for accurate forecasting of aerosols in the TP. Geostationary satellites with intensive observations can be assimilated into numerical models to provide a valuable opportunity to study and improve aerosol forecasts over SA and the TP.
Aerosol data assimilation is an effective statistical approach that combines model outputs with observations to reduce uncertainties in initial fields. Numerous studies have improved aerosol simulation by various data assimilation methods (Collins et al., 2001; Yu et al., 2003; Park et al., 2011; Generoso et al., 2007). The assimilation of satellite aerosol retrievals is one of the most popular approaches used to improve aerosol simulations (Zhang et al., 2008, 2011; Liu et al., 2011; Dai et al., 2014; 2019). In previous studies, researchers have assimilated aerosol retrievals from polar-orbiting satellites, including aerosol optical thickness (AOT) retrieved by the POLDER (Polarization and Directionality of the Earth Reflectances; Generoso et al., 2007; Tsikerdekis et al., 2021), MODIS (Moderate Resolution Imaging Spectroradiometer; Park et al., 2011; Yu et al., 2003; Liu et al., 2011; Benedetti et al., 2009; Yin et al., 2016), Fengyun-3A (Xia et al., 2019), and multiple satellite sensors (Cheng et al., 2019, 2021). Polar-orbiting satellites typically capture global images once per day, providing only a momentary glimpse of the spatial distribution of large-scale aerosols during the satellite's overpass. Geostationary satellites, in contrast, offer a higher temporal resolution of 10 min or more, allowing for more effective monitoring, tracking, and validation of regional aerosol events. Geostationary-satellite-derived AOTs, obtained from satellites such as GOES-8 (Goddard Earth Observing System-8; Wang et al., 2004), GOCI (Geostationary Ocean Color Imager; Lee et al., 2020), Fengyun-4A (Xia et al., 2020), and Himawari-8 (Yumimoto et al., 2016; Dai et al., 2019), have been assimilated using various methods. These studies have demonstrated that assimilating geostationary AOTs has greatly improved dust forecasting and air quality predictions. Letu et al. (2022) have proposed an advanced surface radiation remote sensing algorithm based on AOTs and a new ice cloud scattering model. Moreover, they confirmed that not only the spatial and temporal resolutions but also the accuracy of products produced by geostationary satellites are significantly better than the existing mainstream radiation products such as CERES (Clouds and the Earth's Radiant Energy System) and ERA5, which has become a new benchmark for calculating surface radiation methods.
Aerosol data assimilation plays a crucial role in improving aerosol fields and solar forecasting fields, particularly for surface shortwave radiation. Aerosols are second only to clouds in regional surface solar energy simulations. Without considering the aerosol effect, the description of surface solar energy and meteorological fields cannot be accurate. The online model coupled with an assimilation system and simultaneous consideration of the aerosol modification of atmospheric radiative heating rate and surface radiation in the assimilation of aerosol is beneficial to the simulation of aerosol radiation effects. Wang et al. (2004) demonstrated that aerosol assimilation contributed to reducing the uncertainty of solar downward radiative fluxes in model simulations. They showed that the inclusion of aerosol–radiation interactions significantly reduces the prediction error of radiation under clear-sky conditions. Yumimoto and Takemura (2011) applied a local ensemble transform Kalman filter (LETKF) to a global aerosol climate model and obtained the aerosol direct radiation effect under whole- and clear-sky conditions. An aerosol assimilation system based on GEOS-5 was developed to correct the initial conditions for subsequent 5 d forecasts and illustrated the impact of Saharan dust on the development of tropical cyclones in the Atlantic (Reale et al., 2009, 2014). The success of the 5 d forecast is attributed to the longer lifetime of the dust, i.e., approximately 1 week. The forecast skill strongly depends on the aerosol species, which depends on the period and region. Chen et al. (2014) studied the feedback of the direct and semi-direct radiative effects of aerosols in a wildfire event using the Weather Research and Forecasting model coupled with Chemistry (WRF-Chem) model and the Gridpoint Statistical Interpolation aerosol assimilation system. Their findings show that the assimilation of aerosols improved the simulation of aerosol radiative effects, resulting in more realistic outcomes. This assimilation system was also utilized to analyze the 2006 summer Saharan dust outbreak event, and tests for the presence or absence of dust radiative effects illustrated that the height of the dust caused different thermodynamic changes (Chen et al., 2017). All the aforementioned studies, particularly those utilizing an online model with an assimilation system, have demonstrated that the aerosol radiative effects after assimilation not only impact solar downward radiative fluxes but also have significant effects on the dynamic thermal conditions of the atmosphere.
Limited studies have been conducted to study the influence of aerosol radiation effects on the TP using data assimilation (Adhikary et al., 2008). This is attributed to some primary reasons: first, the number of aerosol satellite observations in the TP region is too sparse due to the heavy cloud cover and high surface albedo in this region; second, the source areas are mainly considered in most studies on aerosol data assimilation; third, the simulation on the TP requires a high-resolution model because steep mountains cannot be analyzed by usual models. Data assimilation techniques that assimilate aerosol information from satellite data can optimize aerosol field model outputs and facilitate the enhancement of AOTs and mass concentration forecasts (Ma et al., 2019; Peng et al., 2017; Liu et al., 2011; Tang et al., 2011). This will provide an important basis for fine-grained studies of the influence of source transport around the TP on the thermal and dynamical characteristics of this region.
The scope of this paper is to first evaluate the analysis AOT field (Sect. 4.1) and the forecast AOT field (Sect. 4.2) and then examine the impact of aerosol–radiation interactions on solar radiation at the surface (Sect. 4.3). Finally, in Sect. 4.4, we focus on the effects of assimilated aerosols on aerosol transport in the presence of aerosol radiation interactions and analyze the differences in climate fields before and after assimilation with the aerosol radiation effect activated. We use the four-dimensional LETKF (4D-LETKF) assimilation system based on the WRF v4.2 model, which is widely used for regional weather simulations, to study one air pollution process from SA to the TP in spring 2018. The assimilated observations are Himawari-8 AOT, and the main assimilated region is SA. This study presents evidence that data assimilation has significant potential for modulating spring atmospheric circulation patterns of cross-TP aerosol transport. By studying aerosol assimilation with suitable assimilation parameters, we explore the impact of the aerosol radiation effect on aerosol transport from SA to the southeastern TP after assimilation.
2.1 Forecast model
WRF-Chem v4.2 (Skamarock et al., 2005; Grell et al., 2005) is a fully coupled meteorology–chemistry online model used for the simulation and prediction of weather and air quality, accounting for the aerosol effect on radiation. The chemical and aerosol mechanism uses the Carbon Bond Mechanism Z gas-phase chemical mechanism (Zaveri and Peters, 1999; Fast et al., 2006) coupled to the eight-bin Model for Simulating Aerosol Interactions and Chemistry (MOSAIC) aerosol module (Zaveri et al., 2008), including sulfate, organic carbon, black carbon, nitrate, ammonium, sodium, chloride, and other inorganics in which dust is included. The physics mechanisms used in this study mainly include the Rapid Radiative Transfer Model for General Circulation Models (RRTMG) for both longwave and shortwave radiation schemes (Iacono et al., 2008), the Yonsei University planetary boundary layer scheme (Hong et al., 2006), the Noah land surface scheme (Chen and Dudhia, 2001), the NSSL two-moment cloud microphysics (Mansell et al., 2010), the MM5 similarity surface layer scheme, and the Grell–Devenyi cumulus scheme (Grell and Devenyi, 2002). We apply the model to one domain (Fig. 1a), which covers the TP and most of SA at a 25 km × 25 km horizontal resolution. We use 32 vertical model layers, defined on sigma coordinates, from the surface to 100 hPa.
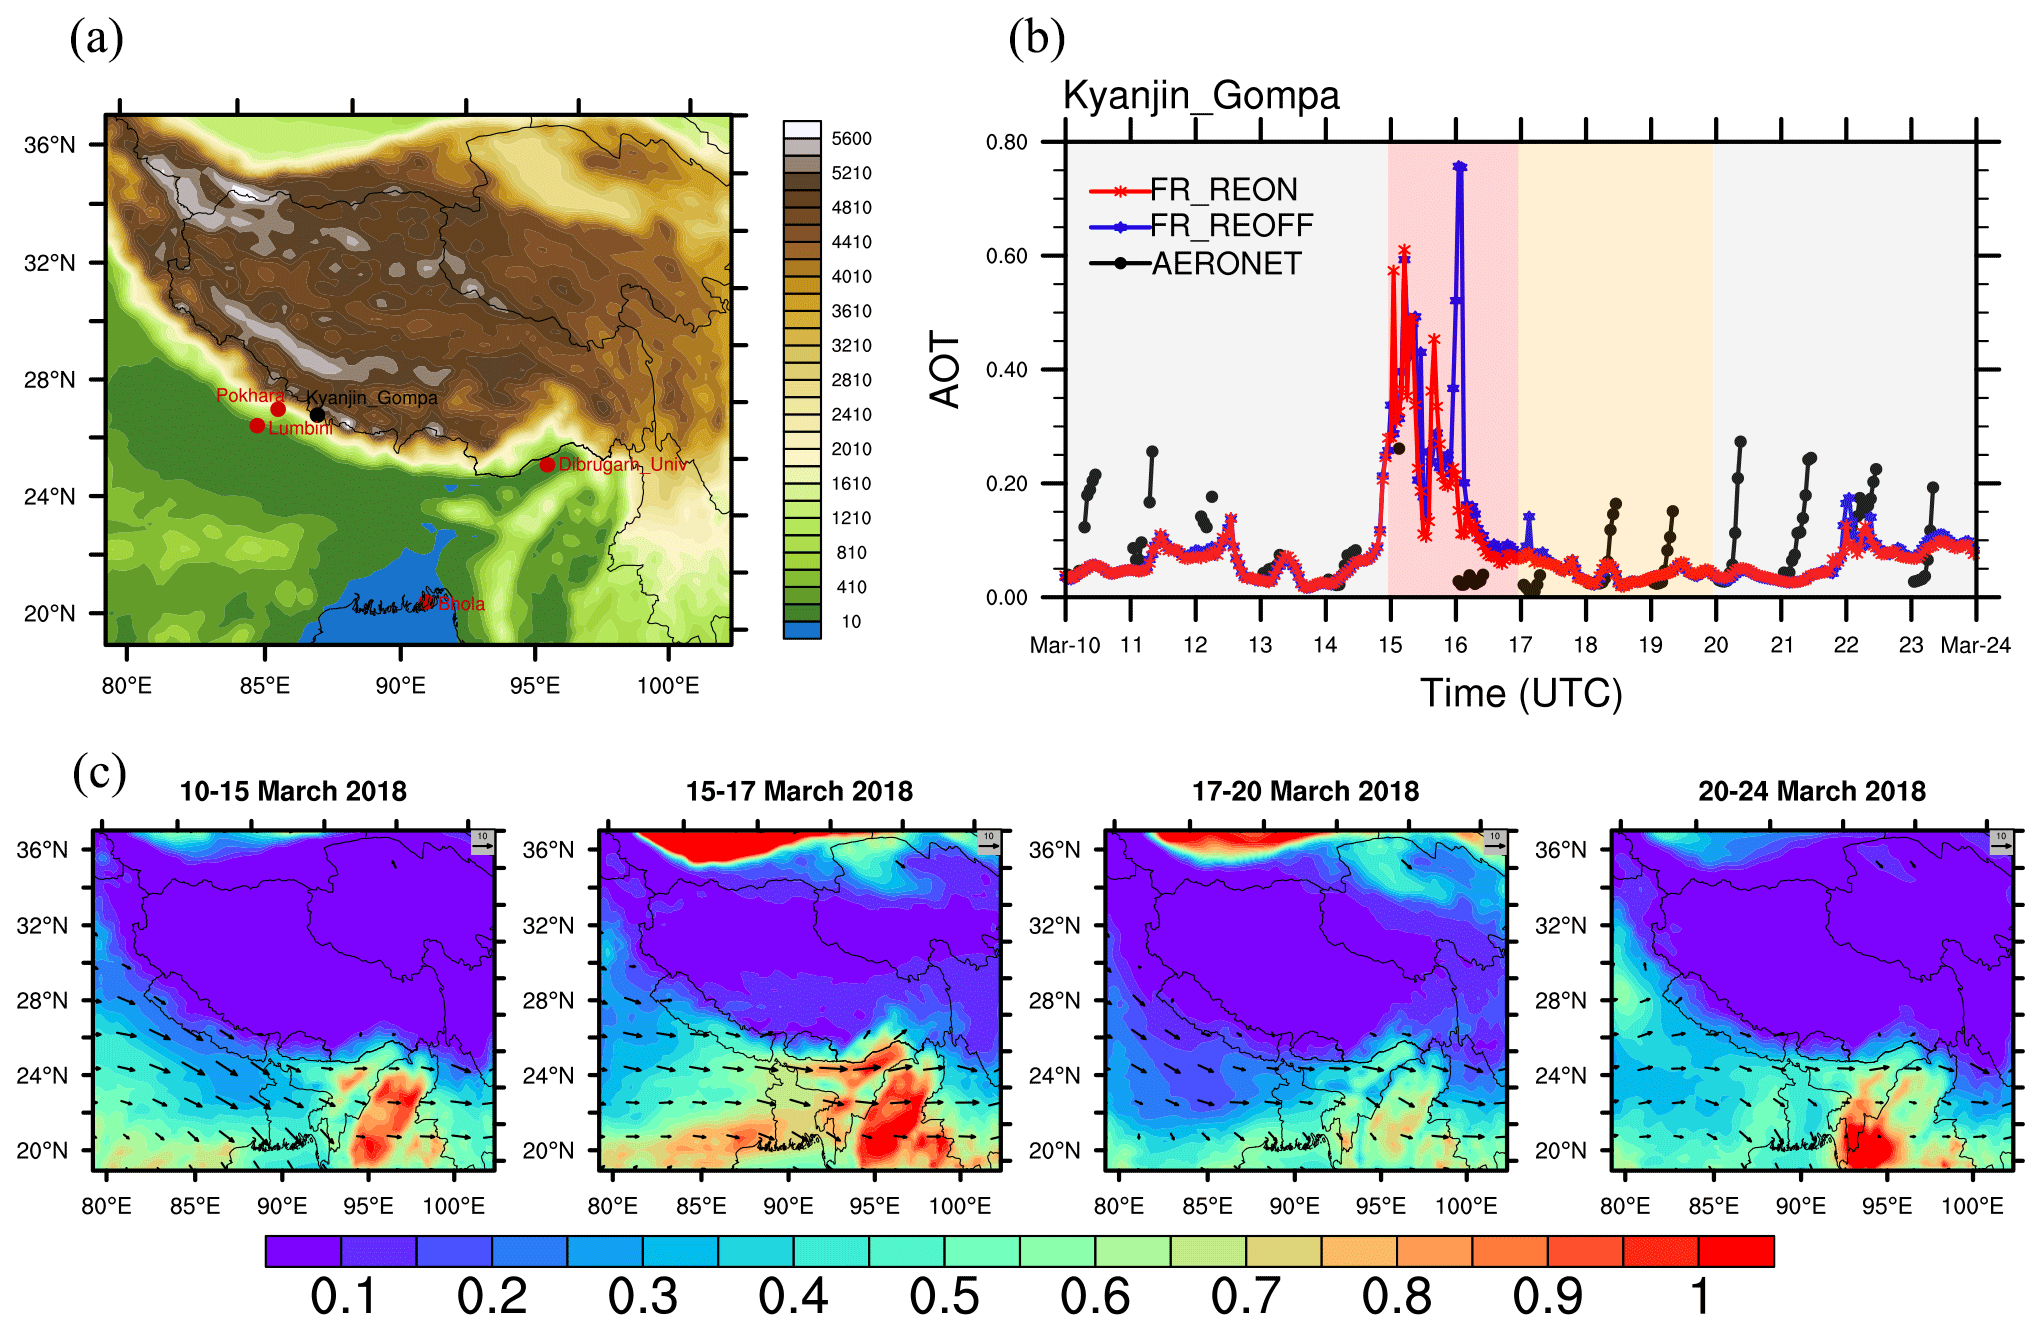
Figure 1(a) Simulation domain with topography (m) and locations of observation sites (black and red dots). (b) Comparison between the simulated and observed hourly AOTs at the Kyanjin_Gompa site. (c) Spatial distributions of simulated average AOT and wind fields at 700 hPa (m s−1) over the TP and SA during four periods.
For anthropogenic emissions, we use the MIX-Asia inventory for March 2010 due to the need to include emission sources from South Asia. The emission inventory contains anthropogenic emissions from power, industry, agriculture, residential, and transportation, and the chemical species include 10 pollutants: BC, OC, fine particulate matter (PM2.5), coarse particulate matter (PM10), NMVOCs (non-methane volatile organic compounds), SO2, NO2, NO, CO, and NH3 (Li et al., 2017). The horizontal resolution of the original MIX-Asia anthropogenic emission source is , and this emission source is interpolated to WRF-Chem grid points to satisfy the use in WRF-Chem. The assignment proportions of the emission sections, vertical profiles, and diurnal variations are in reference to Dai et al. (2021). For biomass burning emissions, we use the Fire INventory from NCAR (FINN) in March 2018. The biogenic emissions are calculated online using the Model of Emissions of Gases and Aerosols from Nature (MEGAN) module (Guenther et al., 2006). The dust emissions are calculated online using the Goddard Chemistry Aerosol Radiation and Transport (GOCART) dust emission scheme (Ginoux et al., 2001). The initial and boundary conditions are treated as follows. Meteorological fields are generated from the National Centers for Environmental Prediction (NCEP) Final (FNL) analysis (http://rda.ucar.edu/datasets/ds083.2/, 23 August 2022). Chemical fields are obtained from the CAM-Chem results, and the chemistry is the MOZART-T1 (Model for Ozone and Related chemical Tracers, version T1) mechanism (Emmons et al., 2020).
2.2 Assimilation system
Data assimilation is essentially for solving the minimum value of the cost function. The method used in this study is based on LETKF, which is an efficient upgrade of the ensemble Kalman filter (EnKF) method. Hunt et al. (2007) described the implementation of this method in detail and noted out the advantages of its ease of use and computational speed. Here, we briefly describe how the LETKF algorithm optimizes the state variables through the following five formulas:
where the state vectors and represent the ensemble mean of the forecast (background) and analysis of aerosol mass mixing ratios in this study; Xf represents the ensemble perturbation of the background field, also known as the ensemble perturbation matrix, calculated as , i=1, 2, …, k, where i represents each ensemble and k represents the total number of ensembles; represents the weight matrix, which is the Kalman gain, and specifically represents the increment between the forecast and the analyzed fields; the vector represents the observations of the ensemble mean background field simulation; is obtained by transforming the ensemble state variable and the observation operator H through the formula yf(i)=H(Xf(i)); and yo represents the observations used for assimilation. The matrix Yf represents the ensemble background observation perturbation field, calculated with the formula , i=1, 2, …, k. The matrix R represents the observation error covariance matrix, and I represents the unit matrix. The ensemble mean of the analysis field is added to Xa to form the optimal initial field for the ensemble forecast, and the initial field for the next forecast can be obtained by optimizing the forecast field by assimilating the observations. Hunt et al. (2007) extended LETKF into 4D-LETKF, which can assimilate observations asynchronously within the assimilation window at each analysis moment and avoid switching between forecast and analysis variables within each hour. In this study, the assimilation window is set to 12 h. The system first performs a 12 h ensemble forecast and outputs the simulated background fields at each hour. According to different time localizations, the trajectory of the state variables within the assimilation window of N hour is a combination of the trajectories of the model background field changes in each ensemble, which forms the background observation mean and perturbation covariance matrix within the assimilation window. Then, it is substituted into Eq. (2) to calculate the weight matrix .
Due to the aerosol simulations being particularly sensitive to emissions, we perturb the aerosol emission to create the model ensemble simulations. The emissions to be perturbed mainly include BC, OC, PM2.5, and PM10, as well as the gaseous precursors, including SO2, NO, and NO2. In each member the emissions are perturbed with the perturbation coefficients fi,j(xy), i=1, 2, …, k; j=BC, OC, …, NO2, following a lognormal distribution, where (xy) is the latitude and longitude of the emission source, and j represents each species. The mean values of the perturbation coefficients fi,j(xy) are all 1, and their variances represent the uncertainties of different emission sources, where the uncertainties of BC, OC, PM2.5, and PM10 emissions are set to 288 %, 322 %, 228 %, and 230 %, respectively. The uncertainties of the aerosol precursor SO2, NO, and NO2 emissions are set to 70 %, 112 %, and 112 %, respectively (Li et al., 2017).
The 4D-LETKF allows flexible assimilation of observations to specific grid points by horizontal, vertical, and temporal observation localization (Miyoshi et al., 2007; Dai et al., 2019; Cheng et al., 2019). With respect to the horizontal and vertical localization, the observation localization gradually reduces the effectiveness of the observations as the distance from the analysis grid increases. A Gaussian function is used to calculate the horizontal and vertical localization factors, where σ represents the physical length and r represents the physical distance between the center grid and the observation position. We cut the tail of the Gaussian function to simulate the fifth-order piecewise rational function and do not assimilate observations beyond the distance (Miyoshi et al., 2007; Dai et al., 2019; Cheng et al., 2019). In this study, a length scale of 25 km is selected as the best assimilation performance, considering the model-level resolution setting and tuning based on the localization length σ. The impacts of the horizontal and vertical localization length scale on the assimilation system performance have been widely discussed in previous studies (Dai et al., 2019; Di Tomaso et al., 2017; Rubin et al., 2017; Schutgens et al., 2010; Yumimoto and Takemura, 2011), whereas temporal localization is worthy of attention. The MOSAIC model within WRF-Chem simulates the mixing ratios of 64 aerosol species, and there are eight species and eight particle size segments. All aerosol mass mixing ratios optimized during the assimilation window are determined from their relative fractions. The observation operators are used to map the model state vector to the aerosol extinction coefficient.
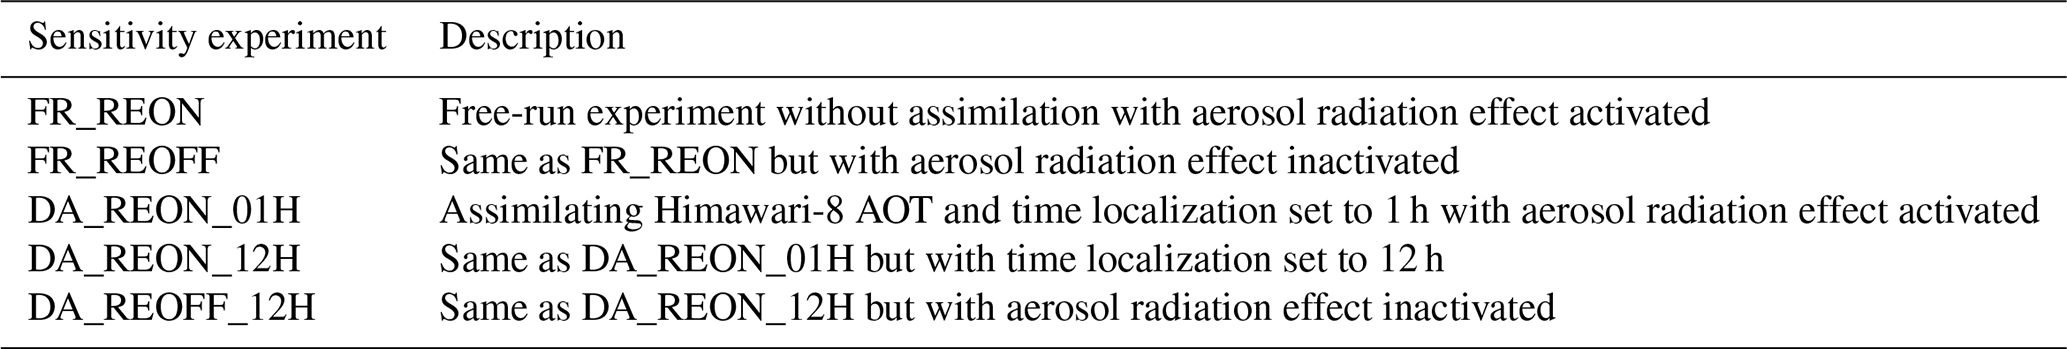
Sensitivity tests on this 4D-LETKF assimilation system with varying parameters (specifically, the ensemble members 10, 20, and 40) were conducted in our previous studies (Dai et al., 2021). Since the finding from the ensemble size has only little effect on the assimilation performance (Dai et al., 2021), the impact of the ensemble size on the data assimilation performance is not a focus of this study. We use 20 ensemble members and a constant multiplicative covariance inflation factor of 1.1 in all our following assimilation experiments. As shown in Table 1, five experiments are conducted in this study. Two free-run (FR) experiments are performed as a reference, and the difference between the two experiments is whether the aerosol radiation effect is activated (FR_REON) or inactivated (FR_REOFF). In FR_REOFF, the aerosol mass is set to zero in the radiation code. Three data assimilation (DA) experiments are performed to study the improvement of the aerosol and radiation forecast fields by DA. The parameter time localization length can be used to determine the assimilated observations in the time space. When the time localization length is set to 12 h, all observations in one assimilation window can be assimilated (DA_REON_12H), whereas when the time localization length is set to 1 h, only the current observations can be assimilated (DA_REON_01H). One assimilation experiment with the aerosol radiation effect inactivated (DA_REOFF_12H) is performed to study the assimilation of the aerosol radiation effect as a reference. Notably, the meteorological initial conditions in all experiments come from the FNL analysis, and there is no regional meteorological nudging in all experiments. Two FR experiments started at 00:00 UTC on 5 March 2018 with a spin-up period of 5 d, and three DA experiments were performed for the period of 10–24 March 2018, when one relatively severe pollution process occurred in SA.
Table 1Experimental design for the sensitivity tests in this study.
3.1 AHI
The AHI (Advanced Himawari Imager), an outstanding high-performance imager that is carried on the Himawari-8 satellite, has 16 observation bands, including 3 visible channels, 3 near-infrared channels, and 10 infrared channels. The multispectral visible and near-infrared channels are optically sensitive to aerosols and can be used for AOT retrieval with much higher quality than that with single-spectrum visible or near-infrared channels. A distinct advantage of the geostationary satellite Himawari-8 is its high temporal resolution, which can provide full-disk images of aerosol optical properties, including AOT and Ångström exponent (AE), every 10 min at a cloud-free location (Yoshida et al., 2018; Fukuda et al., 2013; Higurashi and Nakajima, 1999, 2002). The Himawari-8 satellite aerosol optical properties product is freely available on the website of the Japan Aerospace Exploration Agency (JAXA) (http://www.eorc.jaxa.jp/ptree/index.html, 5 January 2024). We use the hourly AOT at 500 nm in the Himawari-8 satellite retrieval level 3 (L3) version 0.30 aerosol optical properties product for data assimilation. The dataset has been rigorously cloud filtered with a horizontal resolution of and contains as much AOT inversion information as possible (Kikuchi et al., 2018). The original 500 nm Himawari-8 AOT is extrapolated to 550 nm AOT using AE and re-gridded to the model grid using the inverse distance square weight interpolation method. We apply several quality-control methods to improve the observation reliability before using Himawari-8 AOT. The non-uniform grids are constructed identically to the WRF domain, and we perform hourly horizontal aggregation using available observations. To avoid anomalies arising from grid features, the number of observations in each grid must be greater than 10. Each grid is tested for standard deviation, and the variation of AOT (i.e., standard deviation and mean) within the grid cell must be less than 0.5, similar to Zhang and Reid (2006).
3.2 MODIS
The MODIS aboard the Terra and Aqua satellites is an important aerosol observational instrument (King et al., 1992; Salomonson et al., 1989). The MODIS Aqua level 2 (L2) AOT version 6.1 retrievals from the Dark Target (DT) and Deep Blue (DB) merged products at 550 nm are used to validate the model simulations. The product has undergone quality control and cloud processing (Martins et al., 2002). Because the L2 AOT products are orbital data, we utilize a tool dedicated to processing remote sensing and modal data, such as the Community Intercomparison Suite (CIS) (Watson-Parris et al., 2016), to process MODIS L2 AOT products with a temporal resolution of 10 min and a spatial resolution of 10 km into gridded data with a temporal resolution of 1 h and a spatial resolution of 25 km.
3.3 AERONET
The AErosol RObotic NETwork (AERONET) is a ground-based aerosol remote sensing observation network covering the world. The level 2.0 AOT dataset of AERONET version 3 is used in this study. The AERONET dataset provides AOT with a temporal resolution of 15 min on average, and we average the instantaneous data to obtain hourly AOT data. The AOTs at 440 and 675 nm are logarithmically interpolated to obtain the AOT at 550 nm (Dai et al., 2014; Cheng et al., 2021). Five sites in Fig. 1a with at least 10 available hourly AOTs in March 2018 are used for the model validation. The model results are interpolated to the AERONET site using the bilinear interpolation method to match the observed information in space and time in the evaluation process.
3.4 CERES
The CERES synoptic 1∘ (SYN1deg) Ed4.1 hourly data product is used to verify against the simulated downward shortwave radiation of WRF-Chem (Kato et al., 2013), which can provide high accuracy in radiation products. Based on a radiative transfer model of CERES, the CERES-SYN1deg product is obtained by using the more accurate aerosol and cloud dataset derived from the A-train satellite (MODIS, aboard Aqua and Terra). The data from CERES-SYN1deg used in this work are from 10–24 March 2018.
The AOT measurements at the Kyanjin_Gompa site and horizontal distributions of the simulated AOT during 10–24 March 2018 indicate that the air quality in the TP and SA is severely degraded by biomass burning and anthropogenic events (Fig. 1b and c). The spatial map of the average AOT over the domain reveals high aerosol loading over eastern SA during 10–15 March. The outbreak of the whole pollution process occurred in the period of 15–17 March, during which the southeastern TP was obviously affected by pollution from SA. The northward transport pathway extends from the SA region to the southeastern TP, and large amounts of pollutants are carried into the TP along this pathway. Compared to the AERONET observations at the Kyanjin_Gompa site, the model tends to underestimate the AOTs during 10–15 and 17–24 March, but it overestimates the AOTs during 15–17 March. The differences between the model and observed AOTs can contribute to the uncertainties in emission inventories, aerosol processes in the model, the uncertainties in AERONET retrievals, and so on. Data assimilation is an effective tool for better simulation of aerosol fields. The results in five experiments are compared with the assimilated Himawari-8 AOTs as self-verification and different observations (i.e., MODIS Aqua AOTs and AERONET AOTs) as independent verification. The statistical criteria, including mean bias (BIAS), root-mean-square error (RMSE), and correlation coefficient (CORR), are applied between the simulated results and observations.
4.1 AOT analyses verification
4.1.1 Self-check
The AOT analyses are verified with Himawari-8 data that are assimilated using a series of statistics. The benefit of this sort of evaluation is to determine if the assimilation of Himawari-8 retrievals improved the aerosol simulations. Figure 2 shows the horizontal distributions of the BIASs and RMSEs between the AOT simulations or analyses in different experiments and Himawari-8 retrievals. There are important geographic differences regarding AOT simulation performance. The simulated AOTs in the FR_REON and FR_REOFF experiments are both overestimated in eastern SA but underestimated in western SA, which maybe due to the overestimation of combustion sources, the underestimation of anthropogenic sources, and other unresolved aerosol sources (Li et al., 2017). Overall, the average AOTs are weakly lower than those of Himawari-8, with biases of −0.002 and −0.008 in the FR_REON and FR_REOFF experiments, respectively. Figure 2 shows that many available Himawari-8 data can be used to assimilate over SA. However, there are few available satellite data over the TP, which is due to the influence of the high surface albedo on satellite retrievals (Ming et al., 2013).
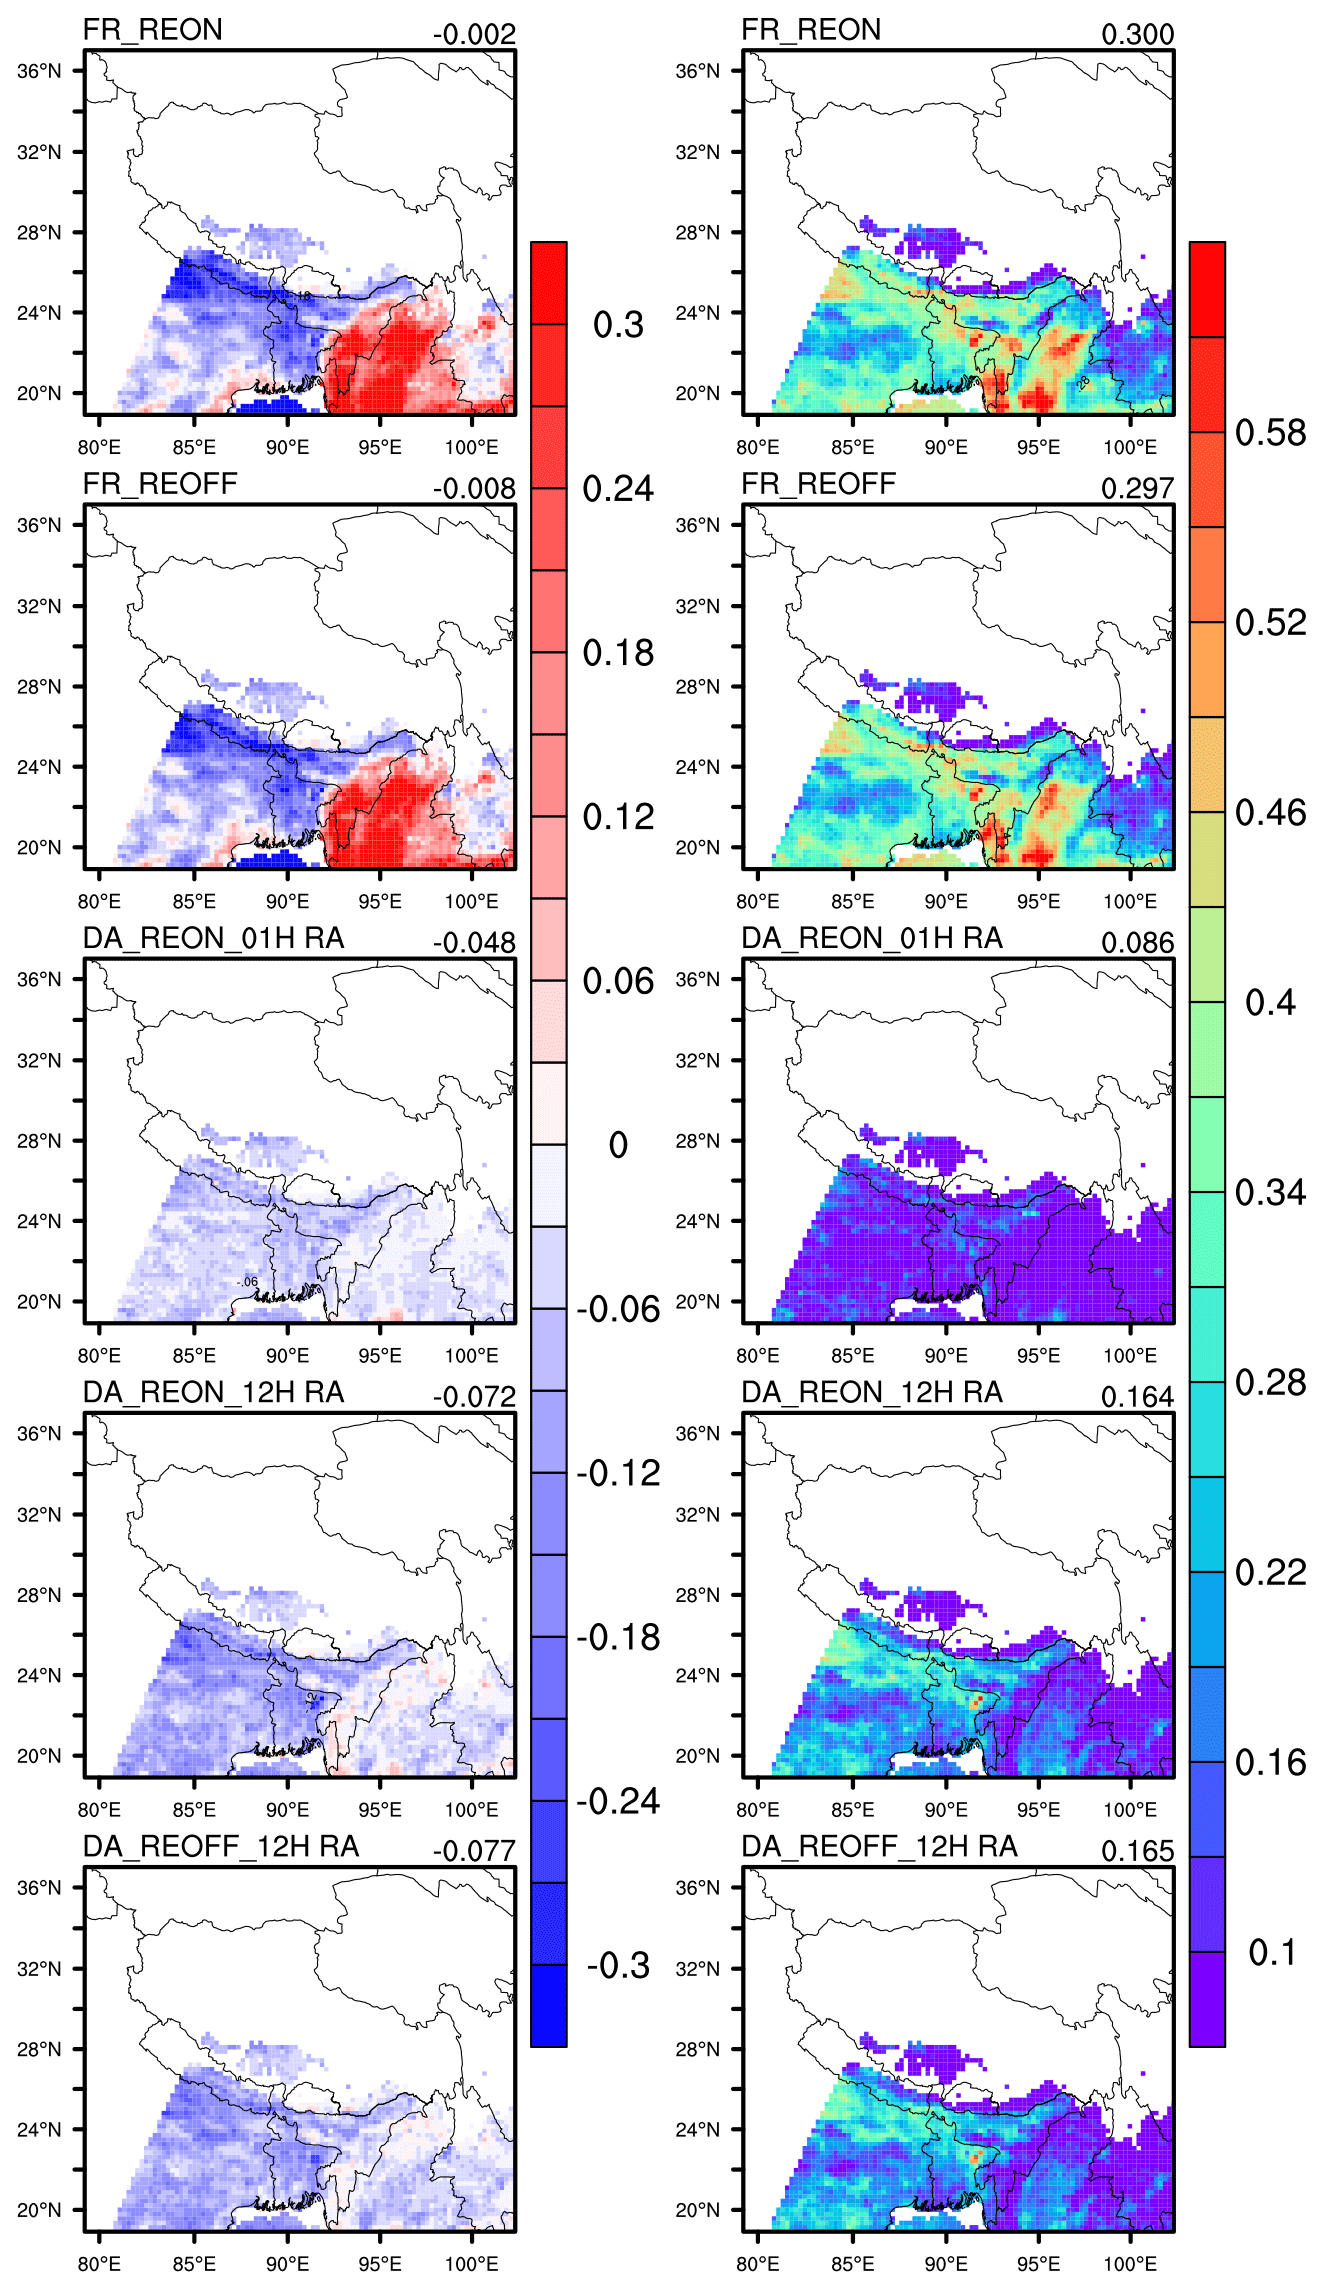
Figure 2Spatial distributions of the BIASs (the simulated AOTs minus the observed ones; left-column panels) and RMSEs (right-column panels) between the simulated or analysis field and Himawari-8 AOTs during 10–24 March 2018 for the FR_REON, FR_REOFF, DA_REON_01H, DA_REON_12H, and DA_REOFF_12H experiments. The value in the top-right corner represents the average value of the data in the figure, and the same applies to the figure below.
The assimilated experiments perform very well regarding the AOT analyzed fields, which are more consistent with the Himawari-8 retrievals. The AOT analyses in the DA_REON_01H experiment improved dramatically, with the BIAS and RMSE virtually disappearing, which illustrates that the data assimilation system is capable of using the AOT provided by the Himawari-8 measurement. Based on the BIASs and RMSEs, the AOT analyses in DA_REON_01H are superior to those in DA_REON_12H, because the DA_REON_01H experiment only assimilates the observations at the current moment. The negligible difference in the AOT analyses between the DA_REON_12H and DA_REOFF_12H experiments is due to the system finding the best compromise when assimilating. Overall, the domain-averaged bias decreases after DA; however, the AOT analyses all show weak underestimation, especially over western SA. This may be because smaller underestimations are always associated with smaller model error values, resulting in larger weights of simulated values and reduced sensitivity to assimilation effects.
The scatter plots of the assimilated Himawari-8 AOTs versus the simulated ones for all experiments are depicted in Fig. 3a–e, and Fig. 3f further shows the probability distribution functions (PDFs) of AOT simulations minus Himawari-8 observation deviations in two FR experiments and AOT analyses minus Himawari-8 observation deviations in three assimilation experiments. The average RMSE is reduced from approximately 0.3 in the two FR experiments to values of approximately 0.15 in the assimilation experiments. The CORR is increased from approximately 0.35 in the FR experiments to above 0.75 in the three assimilation experiments. In particular, the CORR value is 0.939 in the DA_REON_01H experiment. The AOT analyses in DA_REON_01H are most concentrated in the scatter plots, with weak BIAS and RMSE values of −0.048 and 0.086, respectively. The distribution of the AOT deviations shows that the assimilation experiments are more squeezed with higher peaks than the FR experiments. Only 14.36 % (28.16 %) of the AOT deviations are within ±0.05 (±0.1) in the FR_REON experiment, whereas 51.26 % (77.90 %) are within ±0.05 (±0.1) in the DA_REON_01H experiment. The performances of the AOT analyses in the DA_REON_12H and DA_REOFF_12H experiments are inferior to that in DA_REON_01H, which proves that the whole window asynchronous assimilation has a certain impact on the analysis.
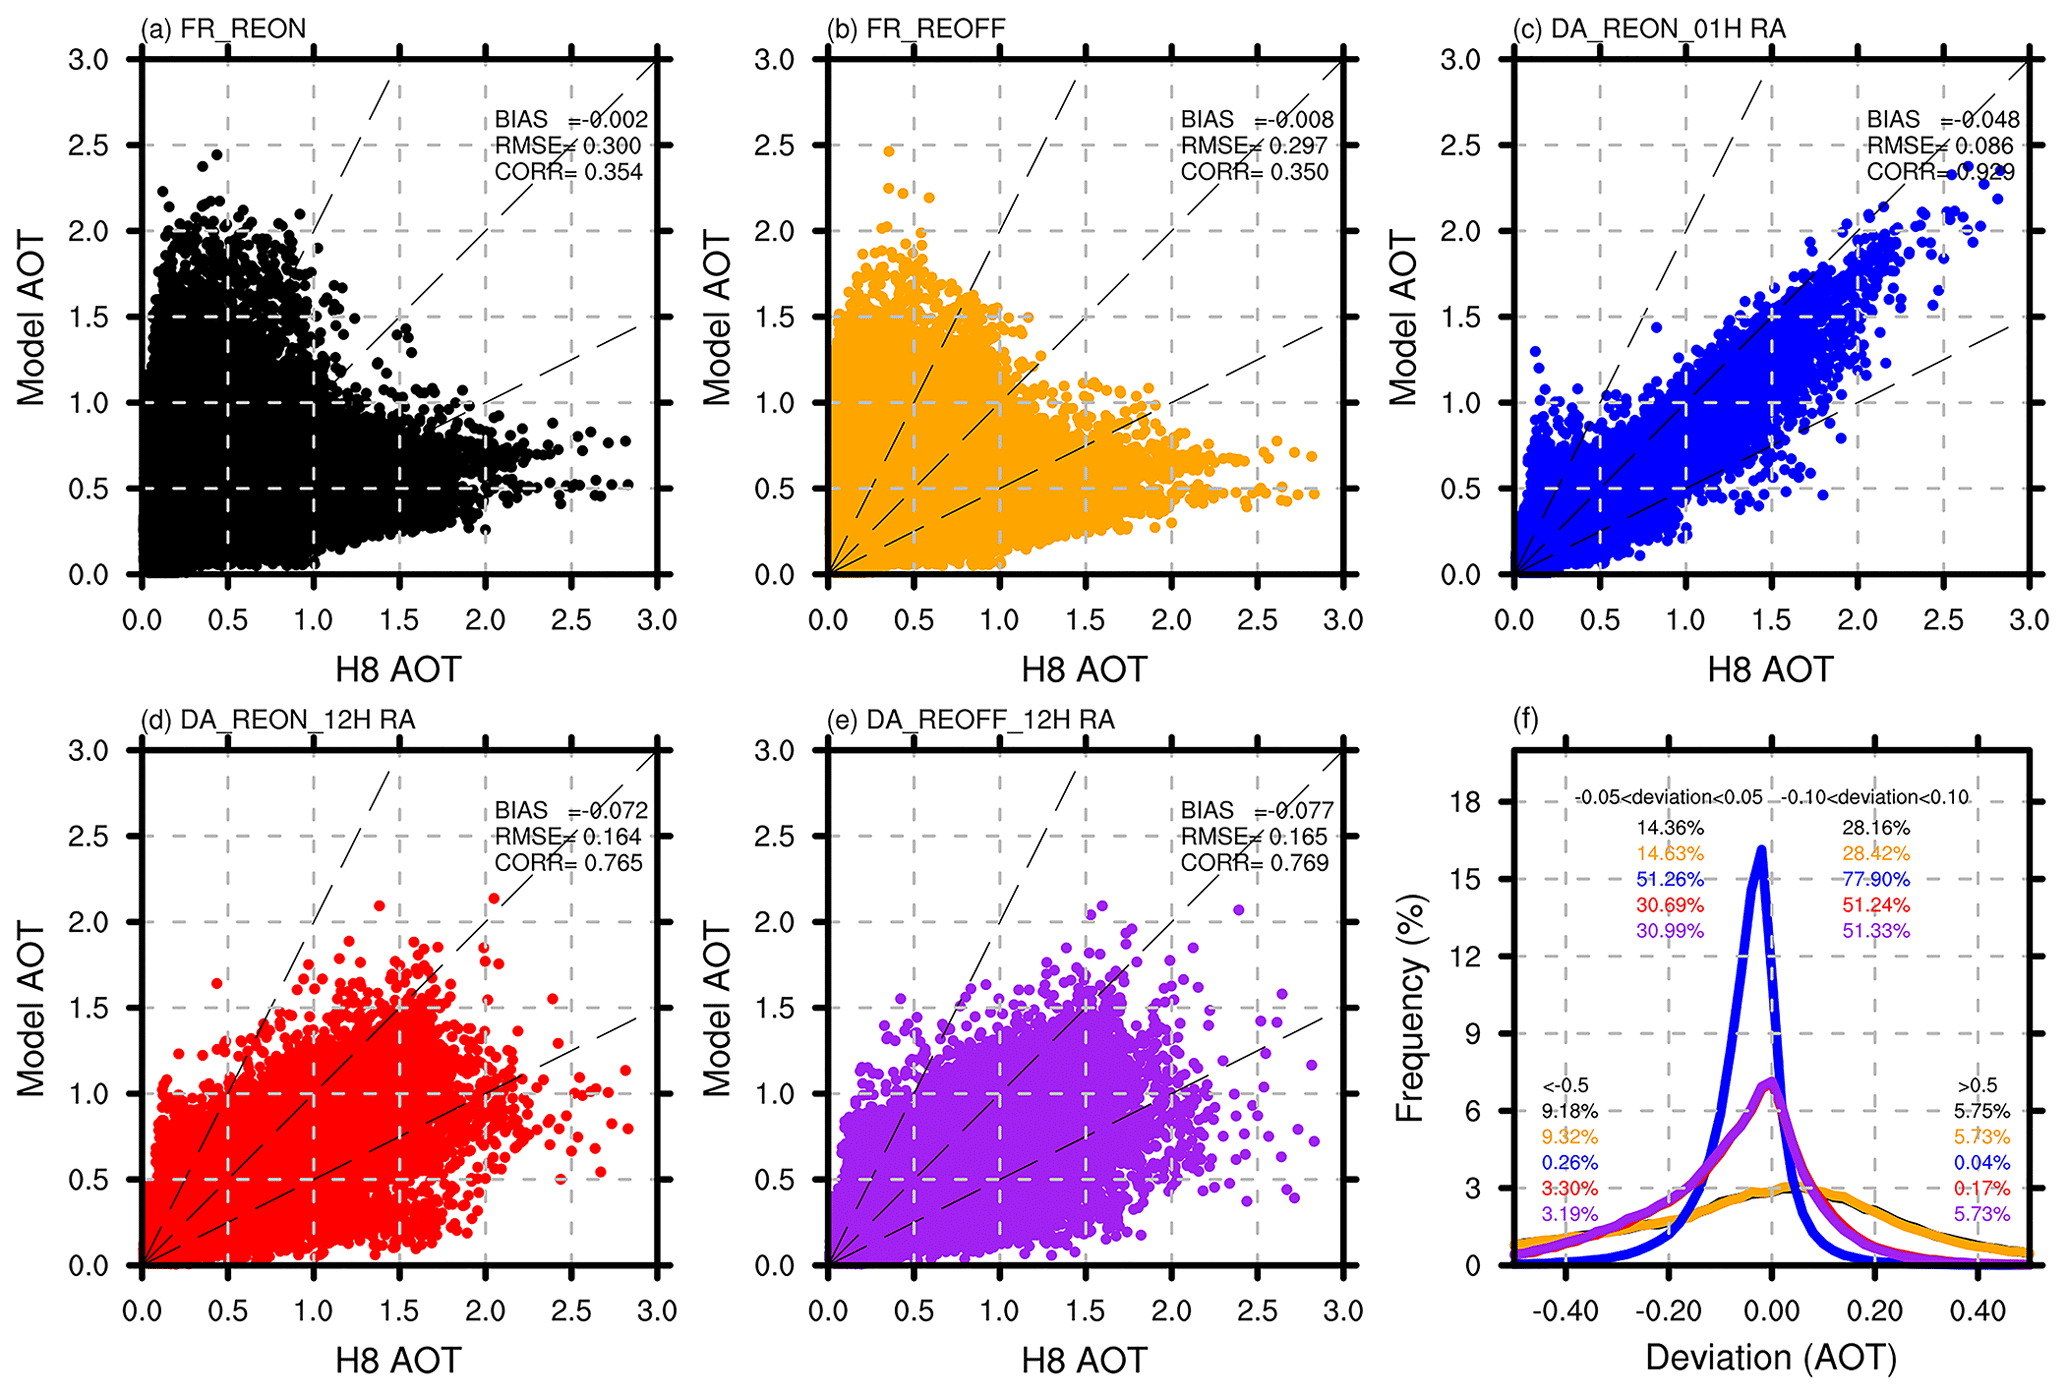
Figure 3Scatter plot of the Himawari-8-observed AOTs and the simulated or analysis field AOTs with (a) FR_REON, (b) FR_REOFF, (c) DA_REON_01H, (d) DA_REON_12H, and (e) DA_REOFF_12H. (f) Frequency distributions of deviations (the simulated AOTs minus the observed ones) from the Himawari-8 observations. The percent ages of deviations between ±0.05, ±0.10, , and >0.5 are also shown.
4.1.2 Independent verification
Several metrics in Fig. 4, including BIASs, RMSEs, and CORRs, are employed to determine the performance of the AOT simulations in two FR experiments and AOT analyses in three assimilation experiments compared to MODIS observations. In general, the independent verification illustrates that the assimilation system can adjust the analysis fields over the domain. Although the negative BIASs are increased in the three assimilation experiments from approximately −0.115 to −0.145, the RMSEs are reduced from 0.266 to 0.247, and the CORRs are increased from approximately 0.36 to 0.52. The reason for this is that the assimilation of Himawari-8 measurements decreases the overestimation of AOT over eastern South Asia, which is attributed to the aggravation of the original negative BIAS. Meanwhile, high values with RMSEs greater than 0.5 in the FR experiments in the western regions of Myanmar are reduced in the assimilation experiments, especially in the DA_REON_12H and DA_REOFF_12H experiments. In contrast to self-checking, the AOT analyses in DA_REON_12H are closer to MODIS than those in DA_REON_01H. The AOT analyses are interpolated to MODIS, which is different in temporal and spatial distribution from Himawari-8. The AOT analyses in DA_REON_12H absorb the entire window of observations, and this asynchronous assimilation corrects the AOT analysis field at all times in each window (Dai et al., 2019).
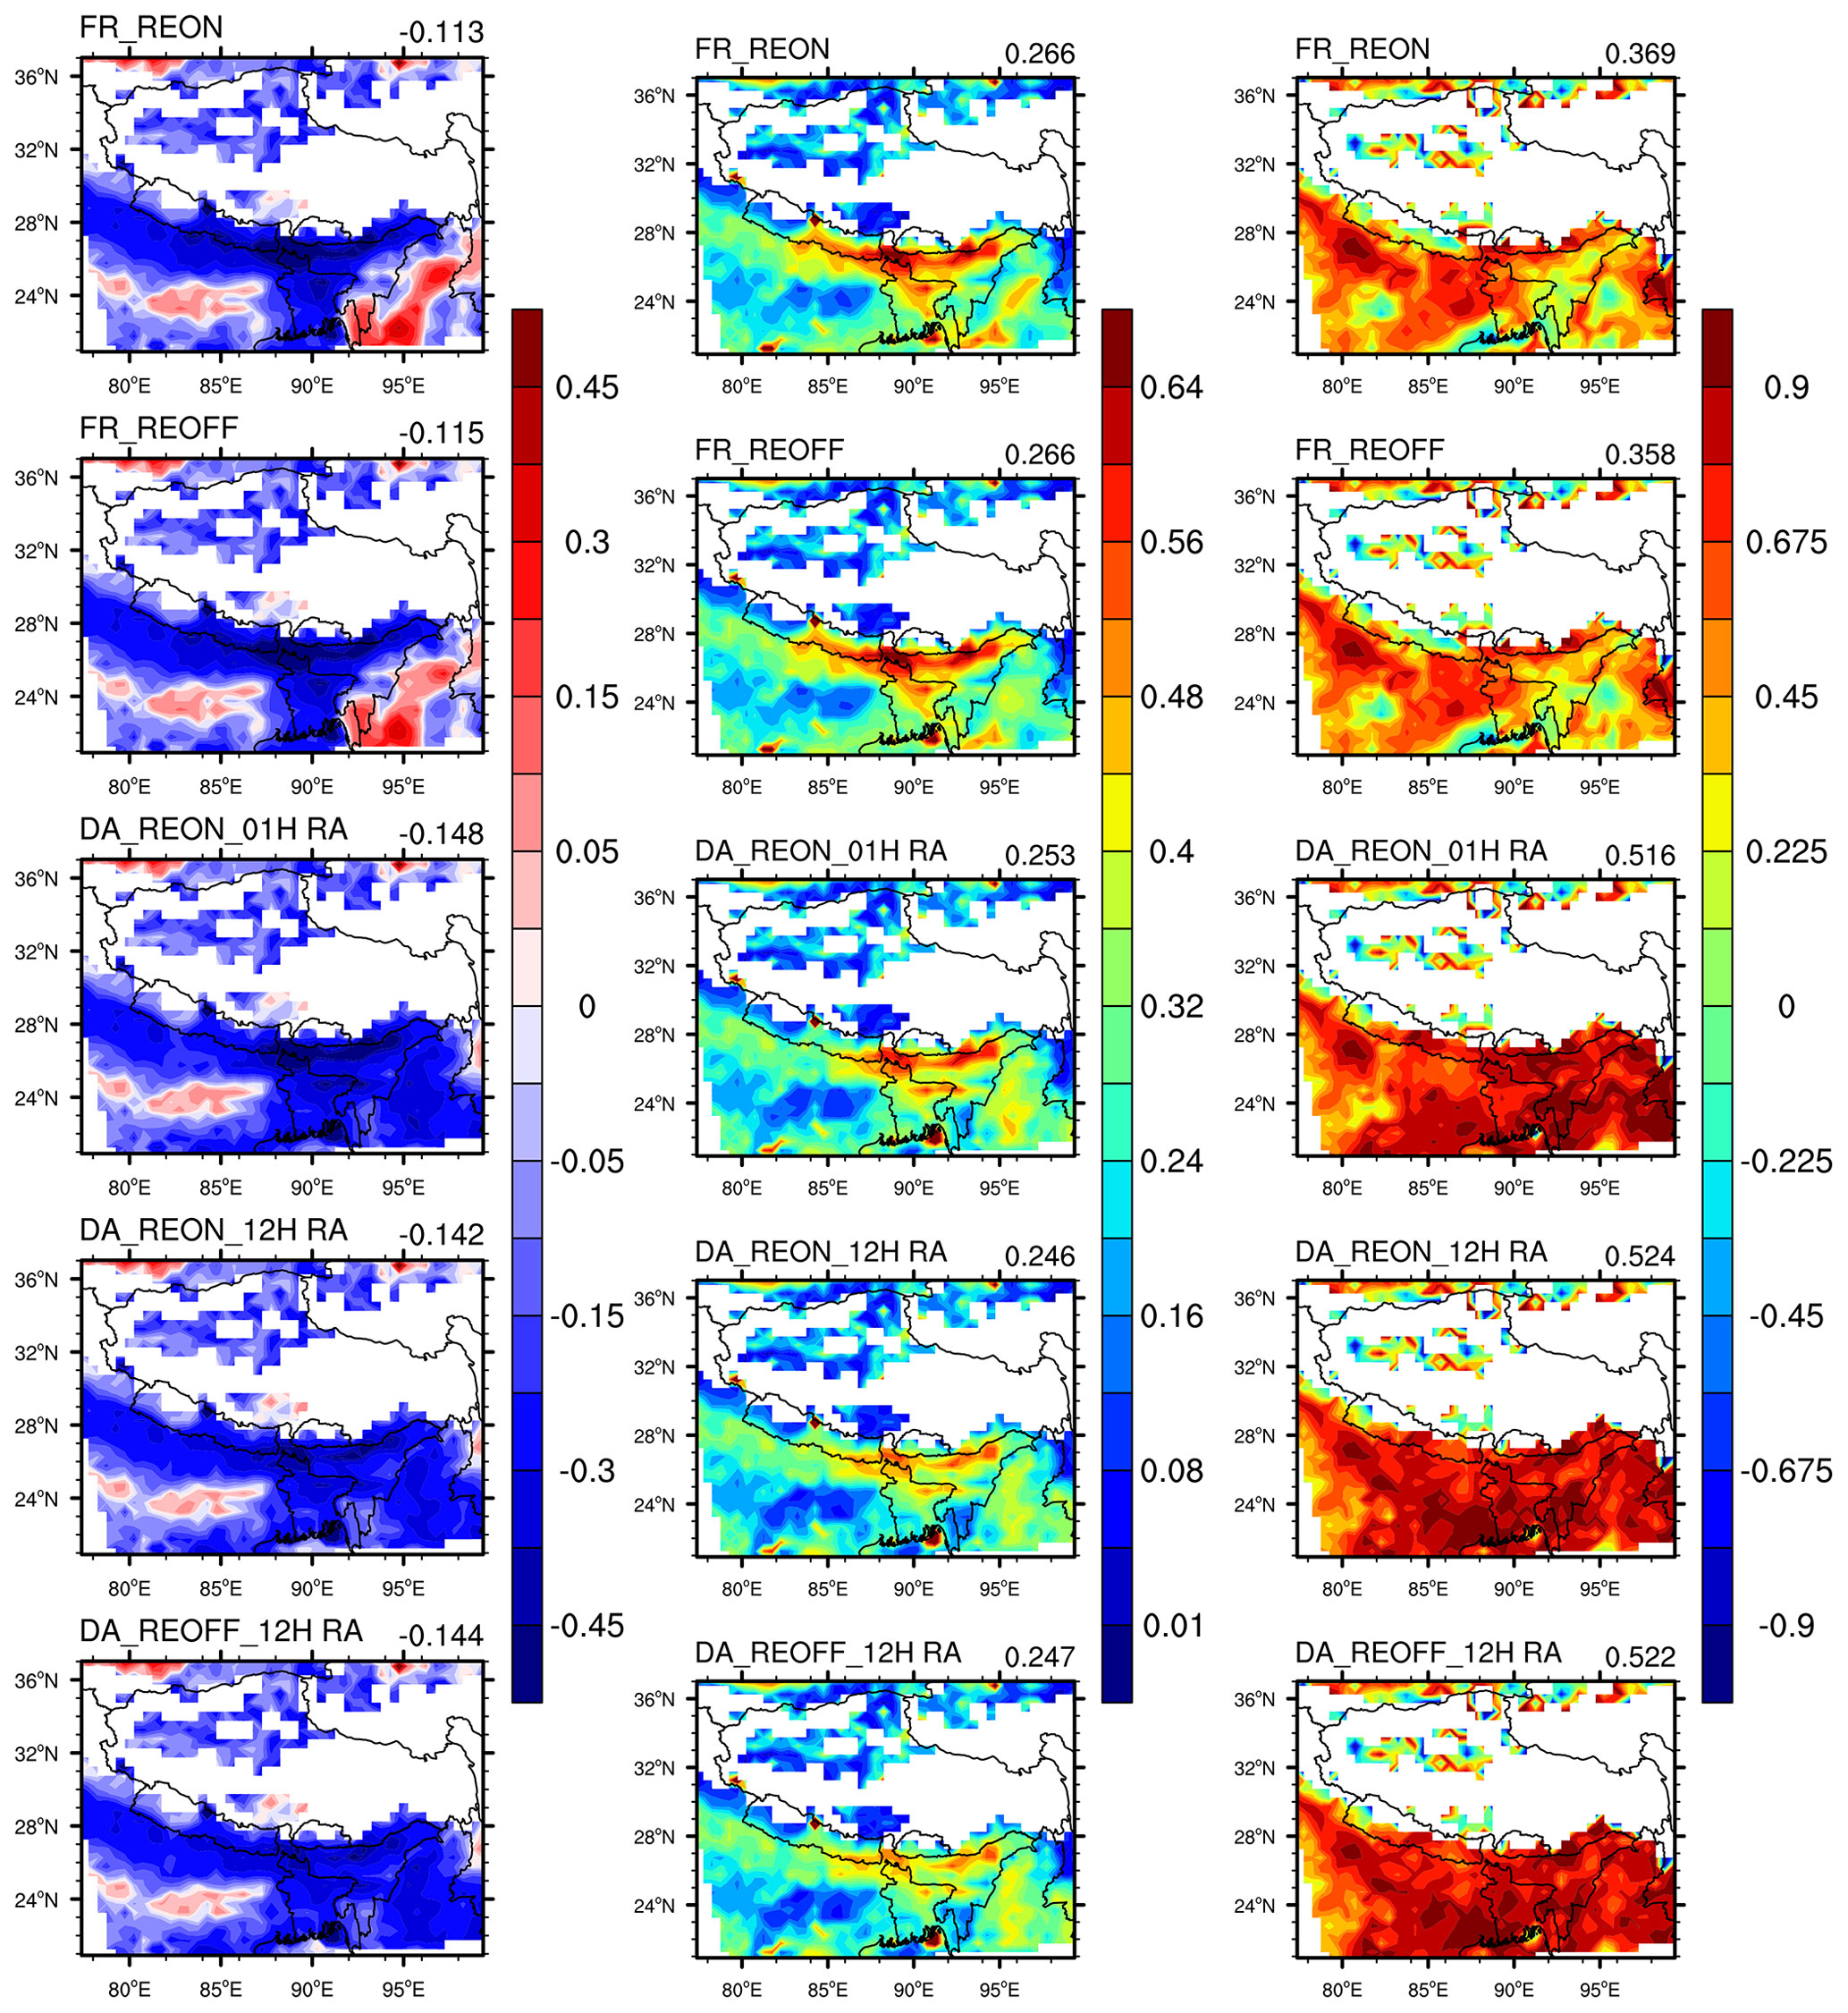
Figure 4Spatial distributions of the BIASs (left-column panels), RMSEs (center-column panels), and CORRs (right-column panels) between the simulated or analysis field and MODIS AOTs at 550 nm during 10–24 March 2018 for the FR_REON, FR_REOFF, DA_REON_01H, DA_REON_12H, and DA_REOFF_12H experiments.
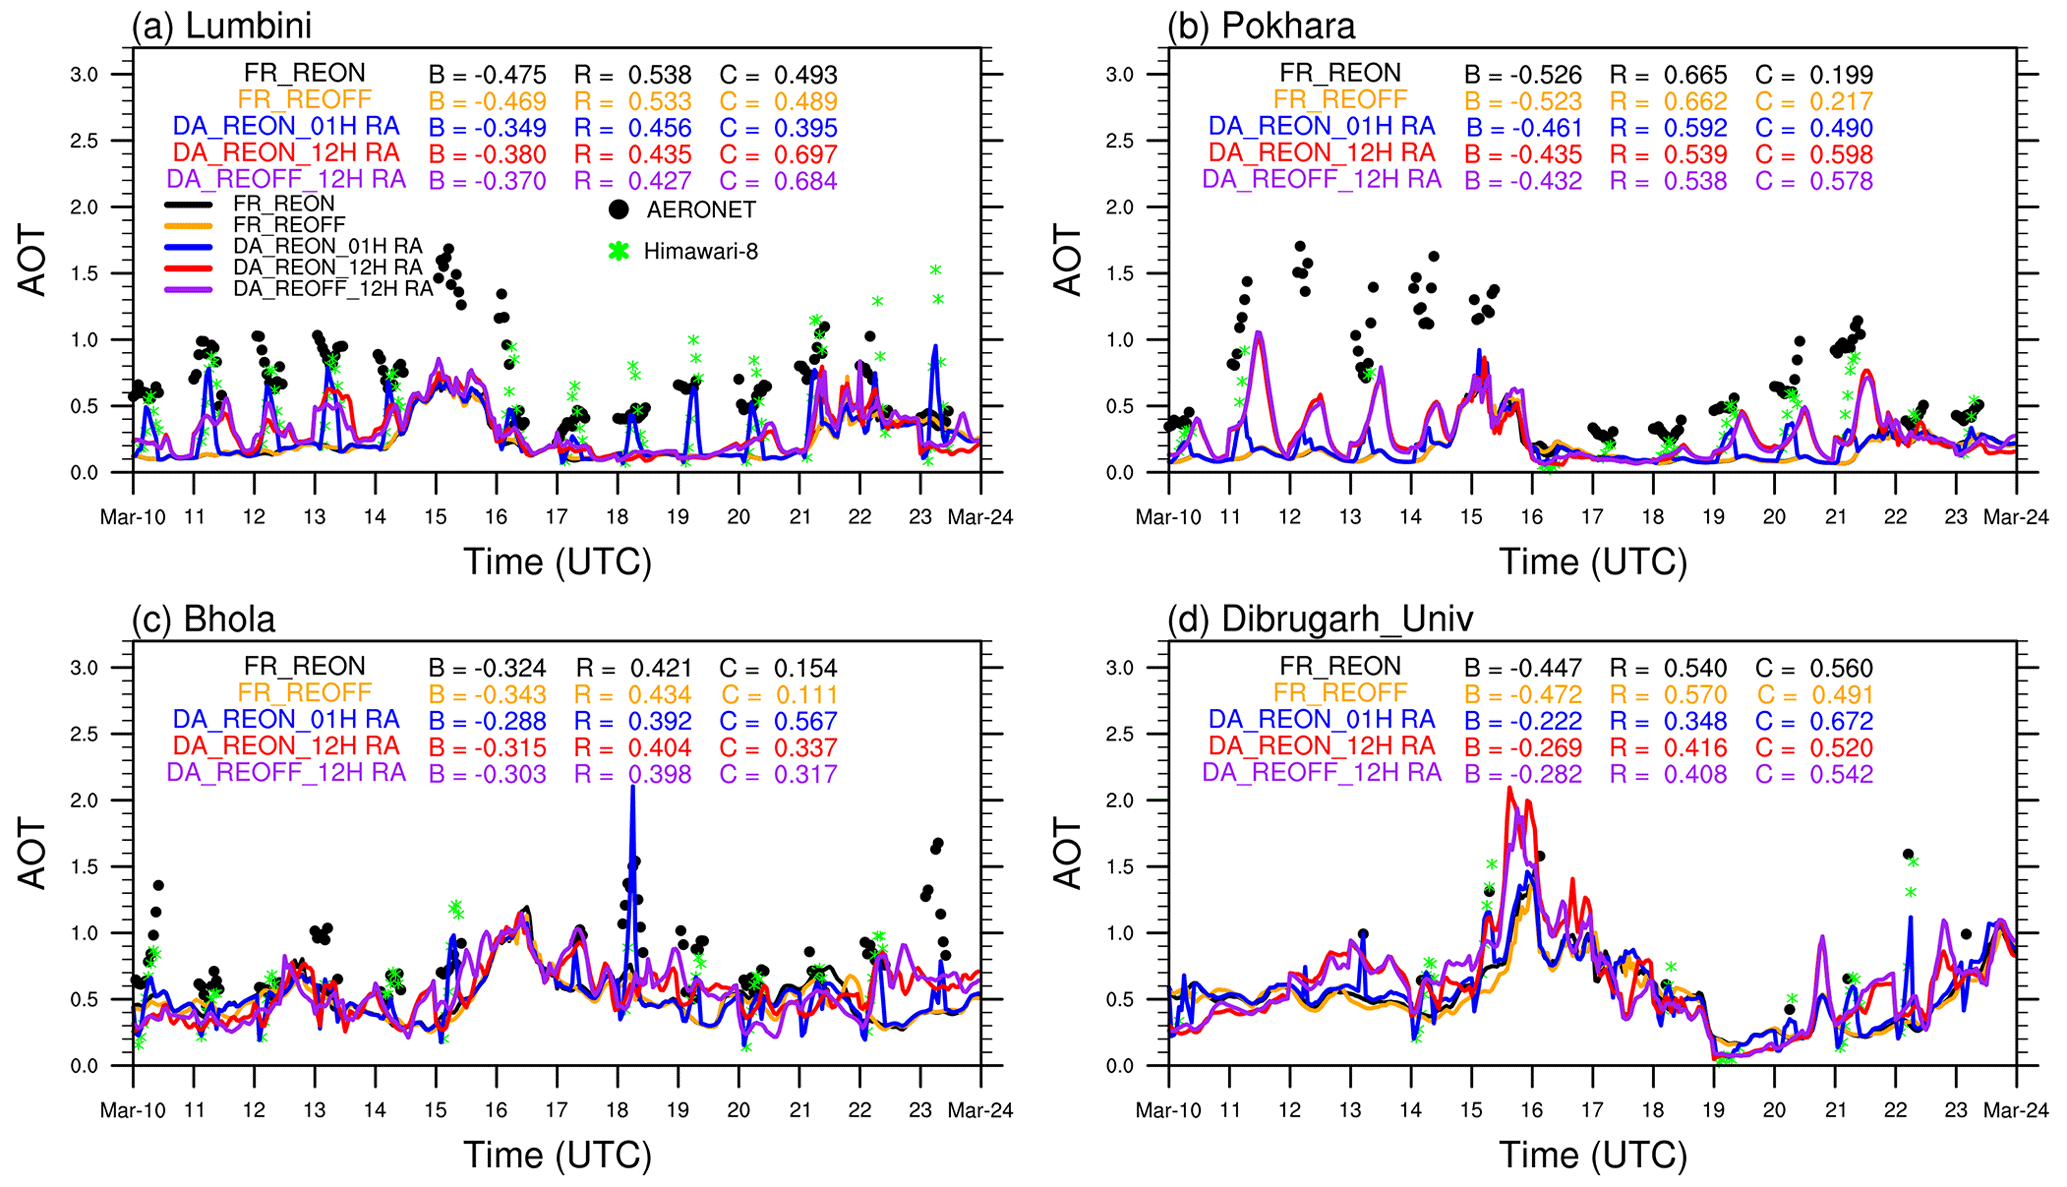
Figure 5Hourly time series of the simulated AOTs for two FR experiments or analysis AOTs for three DA experiments and the observed AOTs from Himawari-8 and AERONET over four AERONET sites. The BIAS (B), RMSE (R), and CORR (C) between the simulated AOTs for the five experiments and the AERONET-observed AOTs are also shown.
AERONET is the most important data source for evaluating AOTs given its high accuracy. The AOT analyses in all experiments are interpolated to the locations of four AERONET sites for verification. The locations of the four AERONET sites are shown as black dots in Fig. 1a. The time trends of the AOT simulations in the FR experiments and analyses in the assimilation experiments are shown in Fig. 5, and the statistical parameters of the total sites are given in Table 2. The BIASs in the two FR experiments with a value of approximately −0.45 indicate that the model tends to underestimate AOTs at the four sites. Three assimilation experiments decrease the bias to approximately −0.33. From the statistical indicators, the AOT analyses in the DA_REON_12H and DA_REOFF_12H experiments are slightly superior to that in the DA_REON_01H. Meanwhile, AOT analyses in DA_REON_12H and DA_REOFF_12H experiments are more reasonable in reflecting the time trend of AOT than that in the DA_REON_01H experiment because the AOT analyses in the DA_REON_01H experiment significantly change. The whole observations of AOTs in the assimilation windows are considered in the DA_REON_12H and DA_REOFF_12H experiments, which illustrate the time change of the AOT analyses that are more in line with the changing characteristics of the AERONET observations. In the Lumbini and Pokhara sites, the AOT analyses in the DA_REON_12H experiment effectively improved the underestimated values in the FR_REON experiment from 10 to 16 March 2018. At the Dibrugarh_Uni site near the southeastern TP, the AOT simulation also captures the AOT fluctuations well. Notably, there is no Himawari-8 observation assimilated at the Dibrugarh_Uni site during the period from 10–14 March 2018. The large decrease in AOT analyses in the DA_REON_12H experiment is the result of the horizontal localization of assimilating observations around this site. In terms of aerosol radiation feedback, some differences occur in the heavily polluted periods, for example, from 15 to 17 March at the Dibrugarh_Uni site. In view of this phenomenon, a detailed analysis is carried out later.
Table 2Comparison with observations of the AERONET AOTs in four sites from the free-run experiments, the assimilation experiments, and the 12 h forecast over all analysis times from 10 to 24 March 2014.
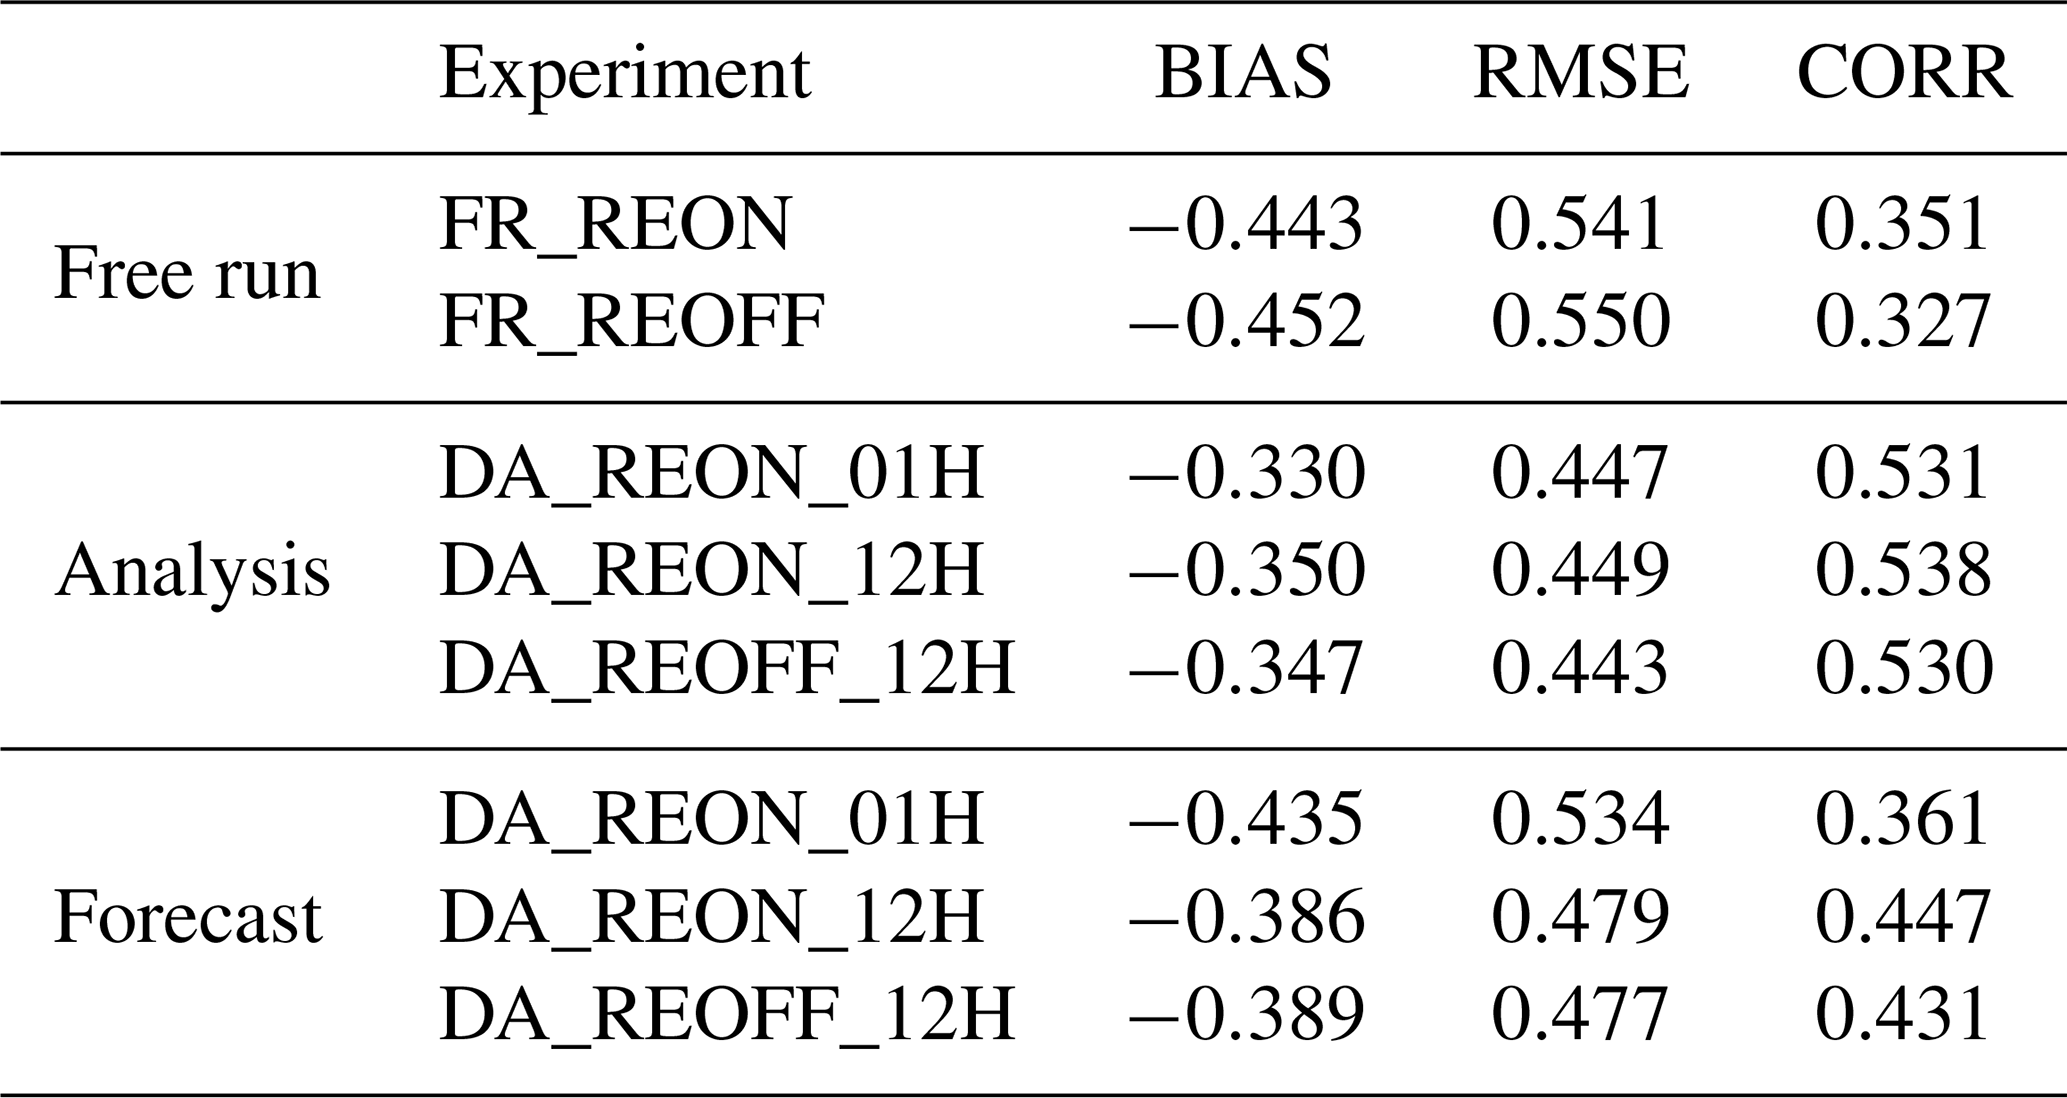
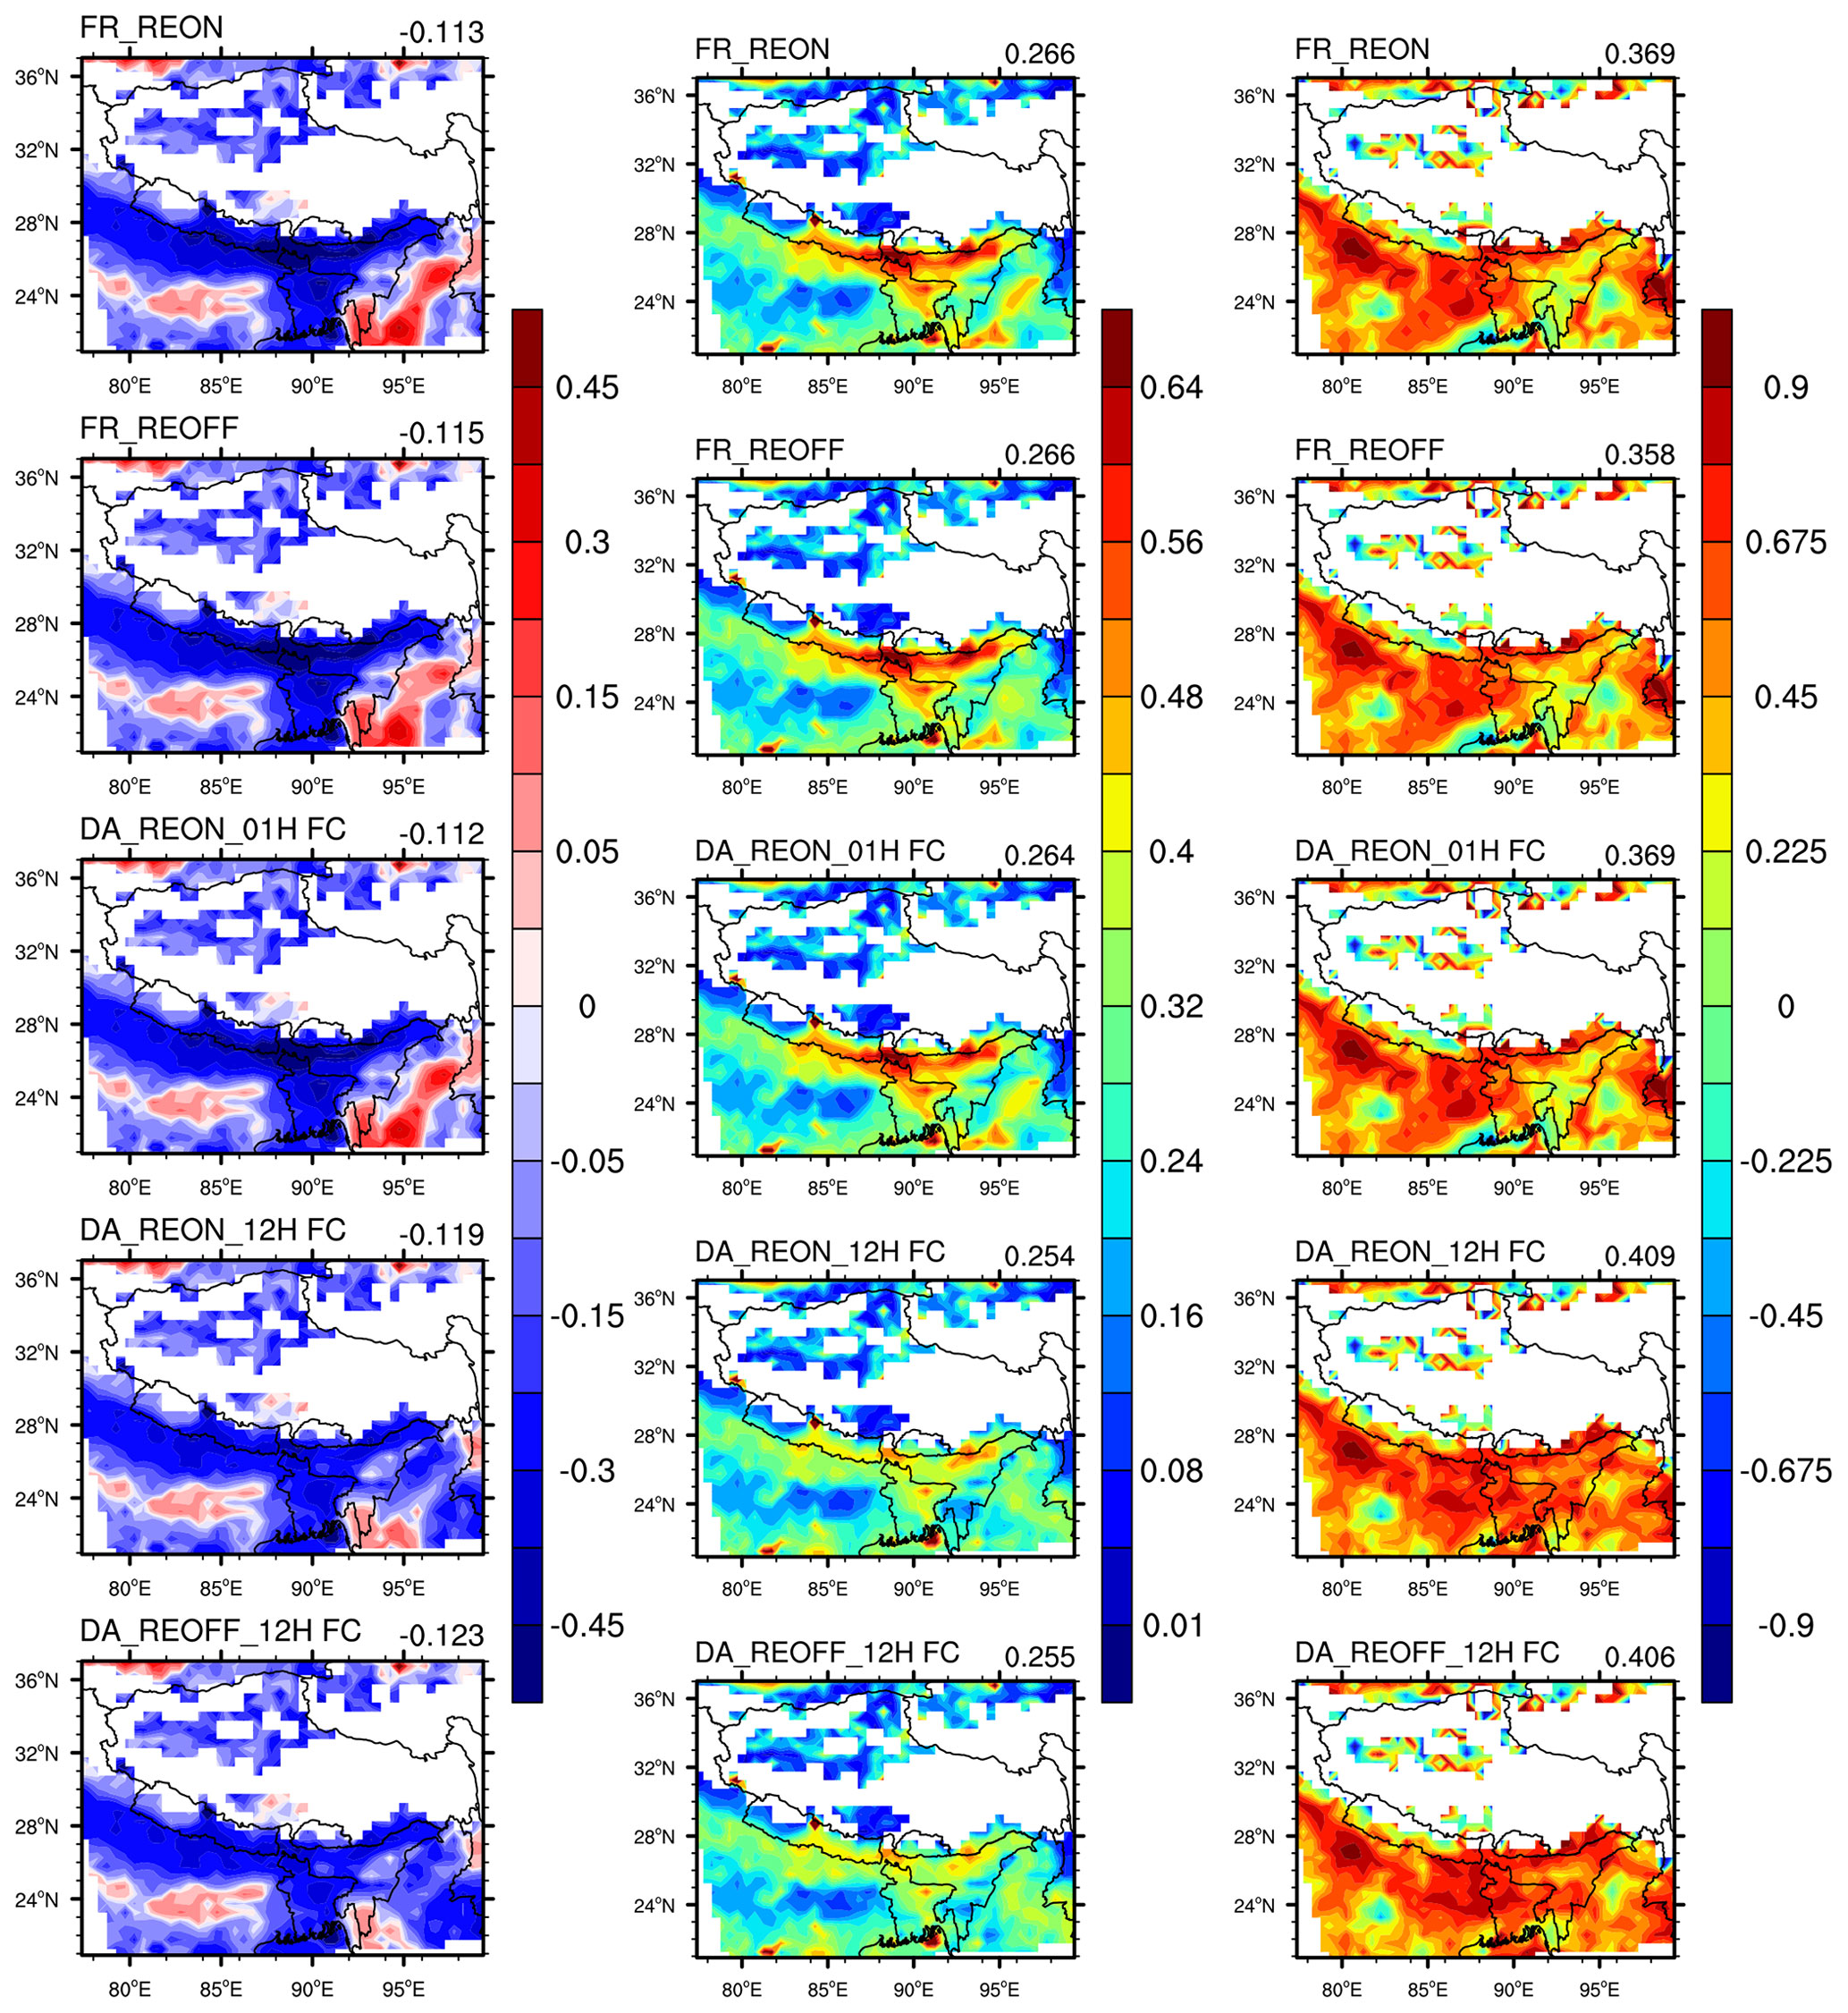
Figure 6Same as Fig. 4 but for forecast filed AOT for DA_REON_01H, DA_REON_12H, and DA_REOFF_12H experiments.
4.2 AOT forecast verification
To further evaluate the Himawari-8 DA impact on AOT forecasting, we perform some independent validations with the MODIS and AERONET observations. Figure 6 presents maps of BIASs, RMSEs, and CORRs between the AOTs simulated in various experiments and MODIS-observed AOTs over the whole domain. In general, the AOT 12 h forecast fields in the DA_REON_12H and DA_REOFF_12H experiments are significantly superior to that in the DA_REON_01H experiment. The AOT forecast fields in DA_REON_12H attenuate the overestimation of the AOT in the FR_REON experiment over eastern SA. Interestingly, the AOT forecast field in DA_REON_01H is almost unchanged compared with that in the FR_REON experiment, which is mainly because the available observations for assimilation are only present between 02:00 and 10:00 UTC, but every assimilation time starts at 00:00 and 12:00 UTC every day. The lack of data at 00:00 and 12:00 UTC led to little change in the initial field in the DA_REON_01H experiment. However, AOT forecasts in DA_REON_12H reduce the high values of the RMSEs in the FR_REON experiment over the southern slope of the Himalayas and reduce the overestimated values during the 23–25∘ N latitude band. Specifically, the CORRs are increased in assimilation experiments from 0.369 (FR_REON) to 0.409 (DA_REON_12H) and from 0.358 (FR_REOFF) to 0.406 (DA_REOFF_12H). The relative differences in the CORRs in the DA_REON_12H and DA_REOFF_12H experiments are both less than 3 %, although the mean biases in the DA_REON_12H experiment tend to be slightly smaller than those in the DA_REOFF_12H experiment. This illustrates that aerosol radiation feedback plays a small role but still affects aerosol forecasts.
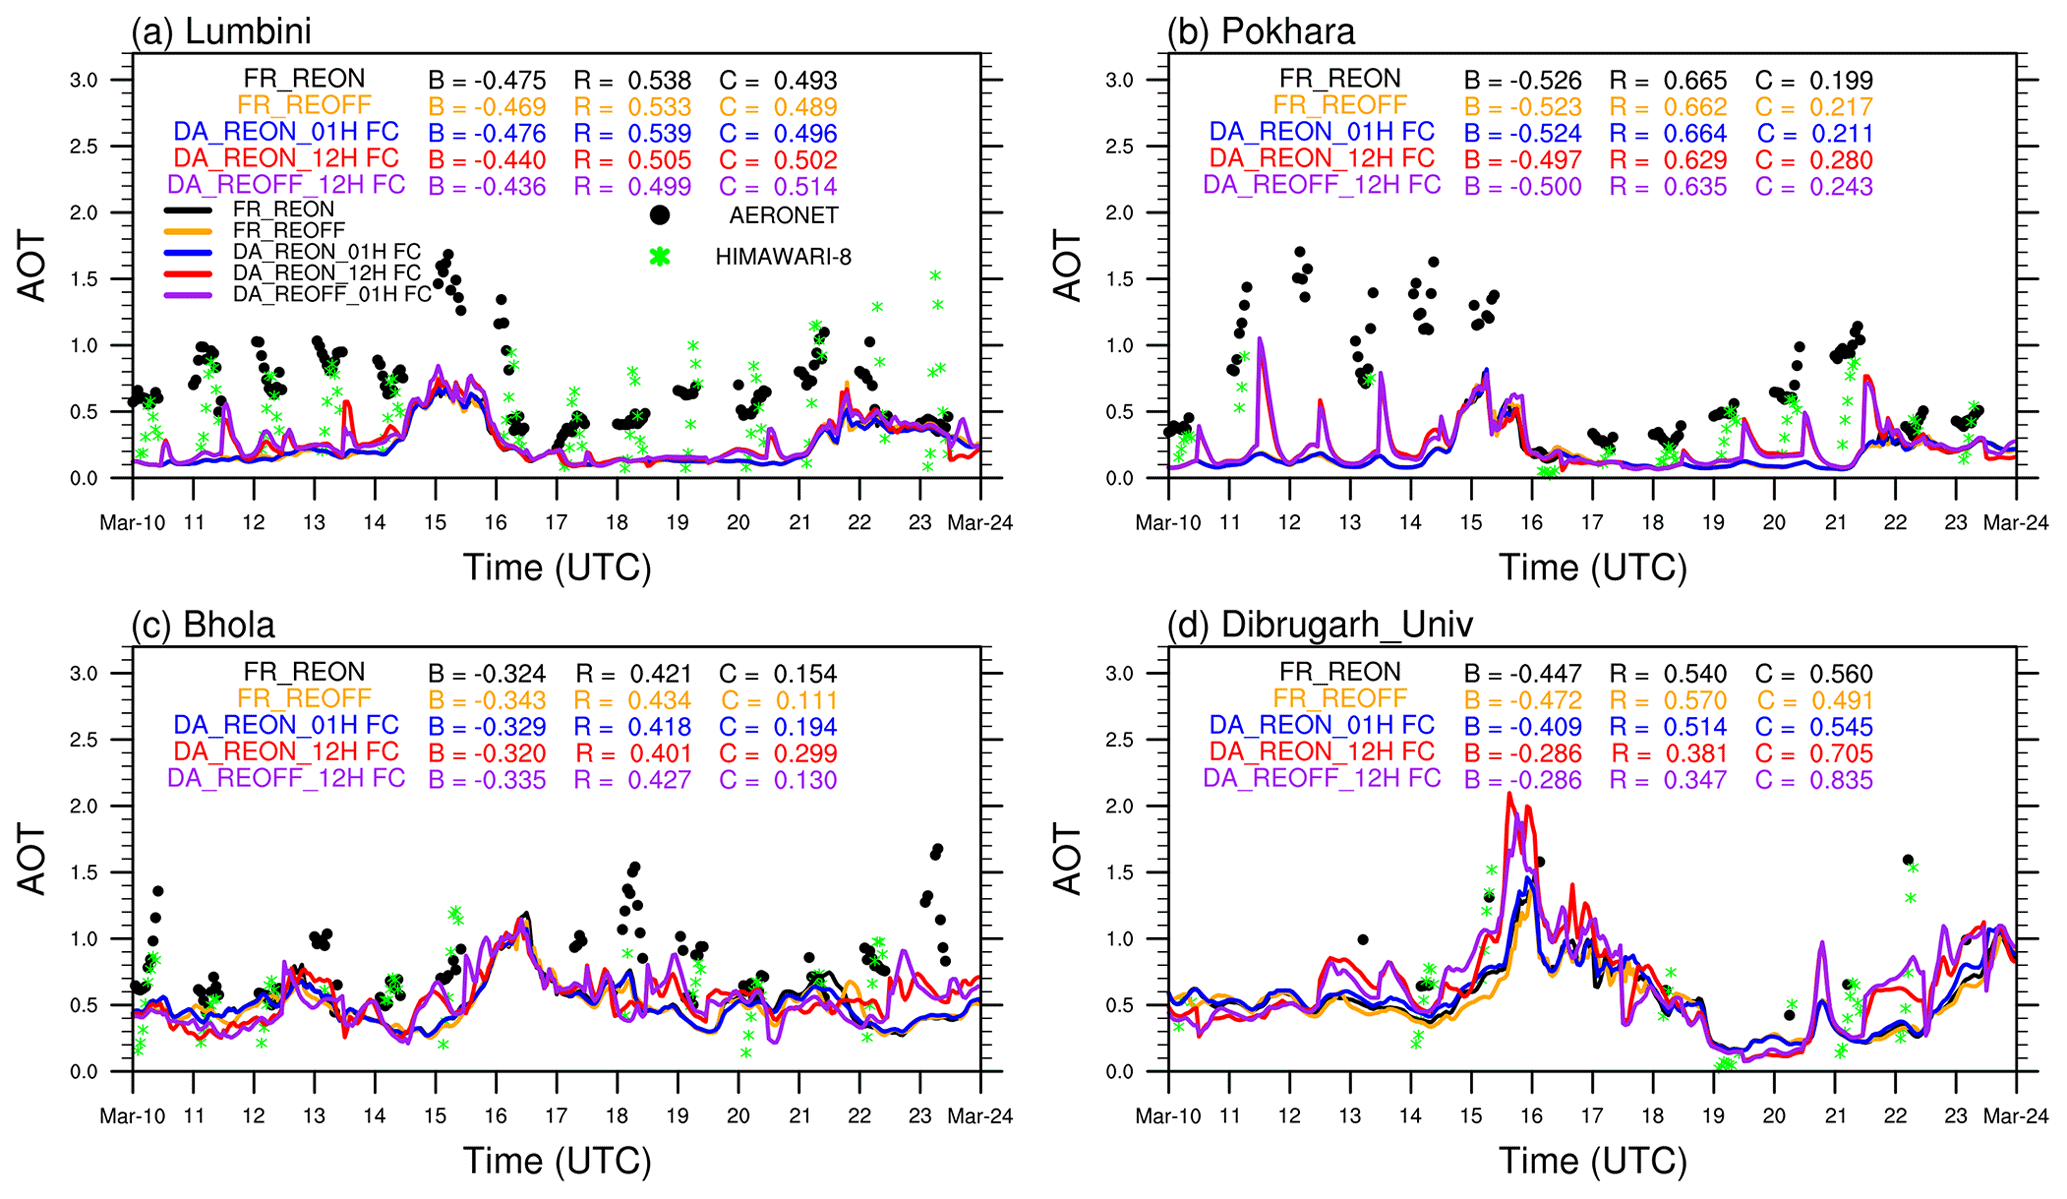
Figure 7Same as Fig. 5 but for forecast filed AOT for DA_REON_01H, DA_REON_12H, and DA_REOFF_12H experiments.
Figure 7 shows the time series of AOT forecasts in various experiments and observed forecasts, and Table 2 also gives the statistical parameters of the total sites in the forecast results. The AOT forecasts in three assimilation experiments are obtained by providing the initial field every 12 h of assimilation tests. However, with assimilation, the AOT forecasts in the DA_REON_12H and DA_REOFF_12H experiments are near the AERONET observations at the four sites, and the underestimations are improved in total. The forecasts are also underestimated, with a value of approximately −0.38. This may be caused by the uncertainty in the emissions inventory. Most likely due to the 12 h forecast only, the forecast fields in the DA_REON_12H and DA_REOFF_12H experiments are very consistent with the analytical fields. The overall BIASs, RMSEs, and CORRs are −0.386, 0.479, and 0.447, respectively, in DA_REON_12H (Table 2). Compared to DA_REON_01H, the optimization of the initial field in DA_REON_12H and DA_REOFF_12H reduces the RMSEs and increases the CORRs at the four sites, indicating that assimilated observations over the whole window are beneficial for improving the forecast field.
The AERONET-observed AOTs over the Lumbini and Pokhara sites reveal that the aerosol is transported to Nepal from 10–15 March. The simulated AOTs in the FR experiments are significantly lower than the AERONET observations during this period, whereas the magnitude and variation of the AOT forecasts in the DA_REON_12H and DA_REOFF_12H experiments are generally reproduced. However, the AOT forecasts in the two assimilation experiments do not adequately capture the observed AOT peaks from 14–16 March at the Lumbini site, likely due to less coverage of the Himawari-8 data. It is worth noting that the improvement in the AOT forecast at the Lumbini site from 17–20 March is limited because the emission perturbation at the Lumbini site is weak.
A summary of the statistics of the simulated, analysis, forecast, and AERONET-observed AOT comparisons is shown in Table 2. In general, the results show good assimilation efficiency to improve the capability of the model to simulate the AOT over SA. As we expected, the analysis results in the assimilation experiments are more consistent with the ground-based values than the forecast results. The forecast results yield larger improvements when observations are assimilated over the whole window. Interestingly, the impact of aerosol radiation feedback is not significant under normal conditions without pollution, whereas some effects occur at the peak of pollution, which is worth further discussion.
4.3 Comparisons of the downward solar radiation
The atmosphere system responds to the aerosol radiation effect in multiple ways. First and most importantly, the impact on the surface solar radiation is of interest. Regardless of the effect of clouds, Fig. 8 shows the spatial distributions of the modeled downward solar radiation under clear sky (DSRc) in five experiments and the comparisons of those and CERES-observed distributions. The high values of the DSRc are mainly located on the TP, which is an attribute of the high atmospheric transparency. The low values are primarily in SA, which is associated with high aerosol loading. The DSRc distribution pattern is similar to that documented by Zhang et al. (2015). Compared to CERES observations, the underestimation occurs in eastern SA, and the overestimation occurs in western SA in FR_REON, with a total domain-mean bias of 10.69 W m−2, which is due to the uncertainty in the aerosols and other factors such as the complex terrain processing in the model. Obviously, the overestimation in the FR_REON experiment is much smaller than that in FR_REOFF, which illustrates that the lack of consideration of aerosol radiation feedback leads to the enhancement of the DSRc, with a domain-mean bias of 31.8 W m−2 in FR_REOFF, in agreement with previous studies (Christopher et al., 2003; Wang et al., 2004). Notably, the DSRc in the FR_REOFF experiment is similar to that in the DA_REOFF_12H experiment, which explains why no aerosol radiation feedback is adverse to the DSRc forecasting.
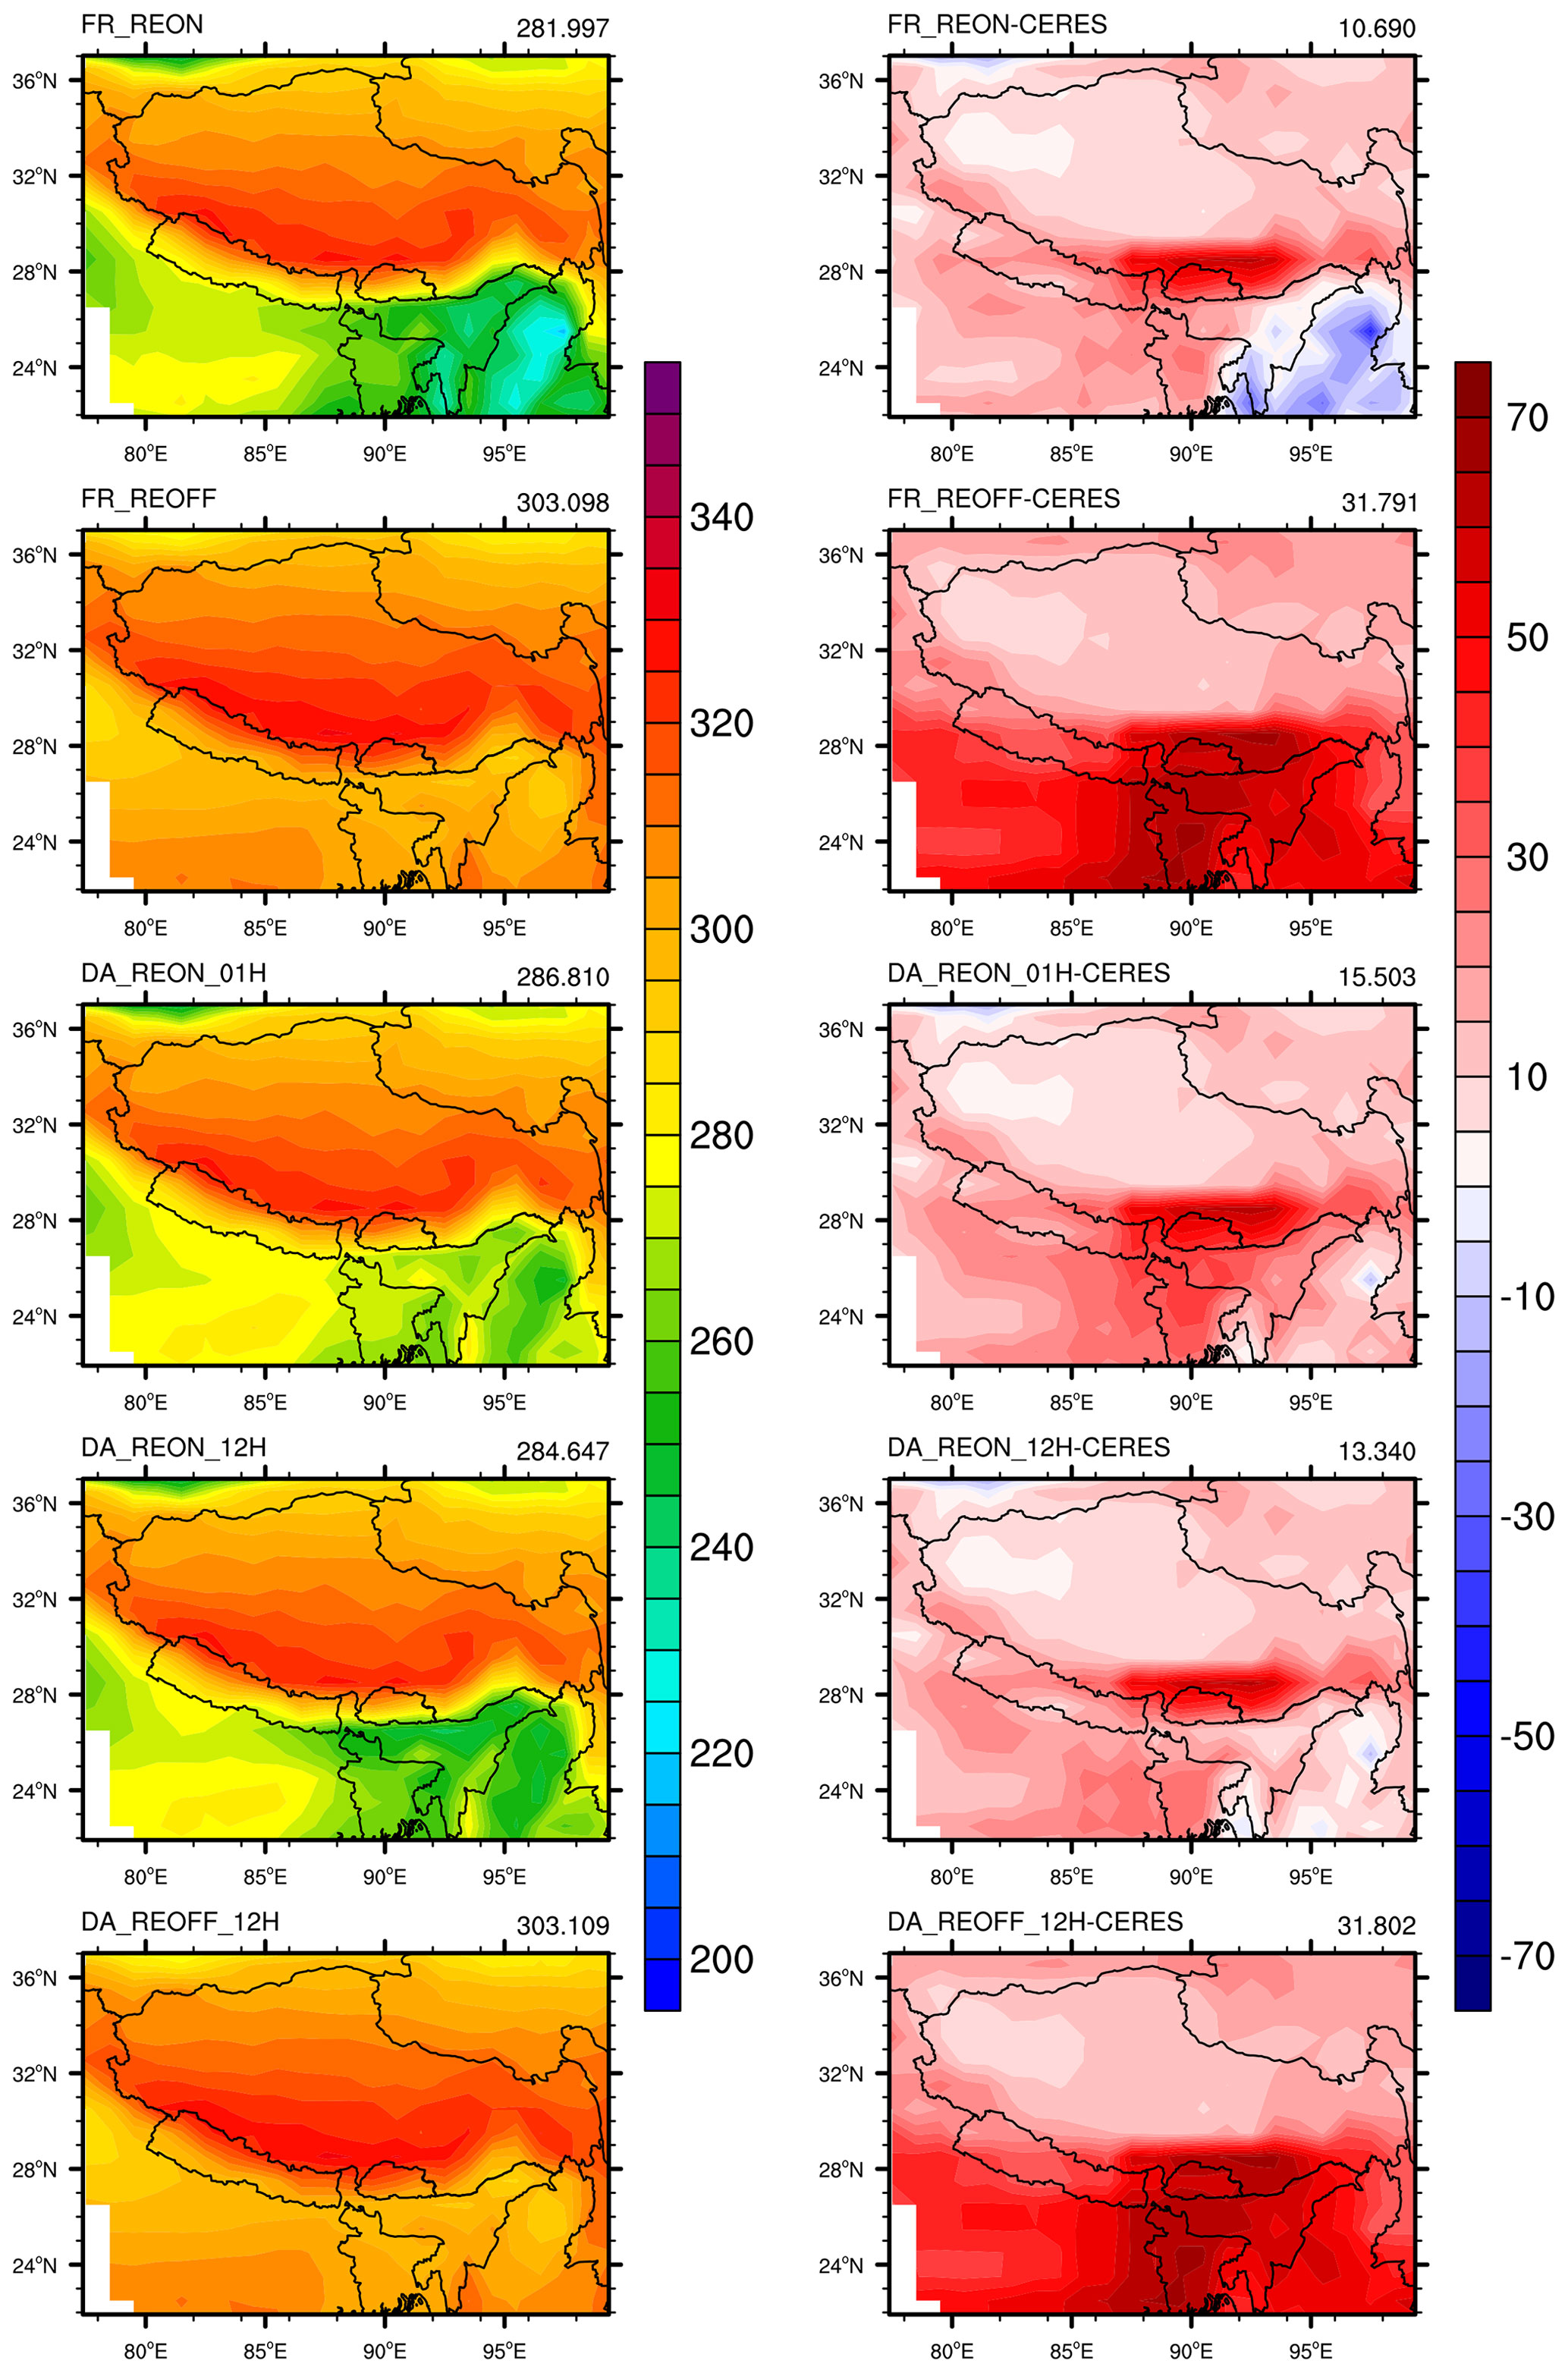
Figure 8Spatial distributions of (left-column panels) the simulated averaged downward solar radiation under clear sky (DSRc, unit: W m−2) and the (right-column panels) BIAS between the forecasted and CERES-observed DSRc for the FR_REON, FR_REOFF, DA_REON_01H, DA_REON_12H, and DA_REOFF_12H experiments.
The two assimilation experiments with the aerosol radiation effect activated significantly improve the DSRc simulation compared with the FR_REON experiment, especially effectively ameliorating the underestimation of the DSRc over eastern SA. The aerosol scatters the incident shortwave flux from the top of the atmosphere; thus, a reasonable aerosol forecast field is beneficial to the simulation of the DSRc. Taking into account the offset of high and low estimations of the DSRc in FR_REON, DA_REON_12H shows the least deviation from CERES in the whole region with a value of 13.34 W m−2. The overestimation of the instantaneous flux in DA_REON_12H ranges from 0 up to 150 W m−2 depending on the magnitude of the AOTs and solar zenith angle at the time of day. The difference between the simulations and CERES also potentially contributes to the fact that the model covers the whole shortwave spectrum, whereas the satellite covers a section of the solar spectrum. It should also be noted that significant overestimation occurs at the latitude of 30∘ N in the western Himalayas in DA_REON_12H, which is partly due to the topography during the pattern interpolation process.
5.1 Aerosol transport from South Asia to the southeastern TP
With the confidence provided by the good quality of the DA forecasts by assimilating all observations within the 12 h window, the analysis in this section is based on the hourly output from the first 12 h of all forecasts from 10 to 24 March. The forecast differences between FR and DA in the two cases where the aerosol radiative effect is activated (REON) or inactivated (REOFF) allow us to have a better understanding of the aerosol radiative effect on the aerosol transport from SA to the southeastern TP. The southeastern TP, indicated by the black rectangle in Fig. 9a and c, is highly susceptible to SA pollutants. Therefore, the time series of the AOT in the southern TP from the two cases are shown in Fig. 9b and d, and the differences between the DA and FR are also shown. Since the emission perturbations are invariant with the model grid and time, the AOTs in the DA and FR experiments show generally consistent temporal patterns. We find that the transport of AOTs produced in SA reached the AOT maximum in the southeastern TP on 16 March from all experiments. This is due to the surface flows on the southeastern TP being mostly from the polluted air masses 2 d before over SA. Sensitivity tests illustrate that the increase in AOTs is greater from 15 to 17 March in the southeastern TP after assimilation with REON than that with REOFF. To emphasize the impact of aerosol changes at times of heavy pollution, the maps in Fig. 9a and c mainly focus on the averaged relative change in AOTs ((DA-FR)/FR) from 15 to 17 March in REON and REOFF, respectively. We find that the horizontal distributions of the relative change in AOTs with REON are more dispersed in the southeastern TP than in the REOFF experiments. To validate the impact of aerosols on meteorological fields during aerosol assimilation, meteorological fields were not nudged. This is because assimilated aerosols further influence radiation and meteorological fields (Gao et al., 2022). As shown in Fig. 9c, in the absence of aerosol radiation effects, the impact of the assimilated SA aerosol field on the TP is caused only by transport through the wind field. In contrast, the average AOT differences between DA_REON_12H and FR_REON reach as high as 0.5 on 15–17 March, and the relative change is almost 20 %.
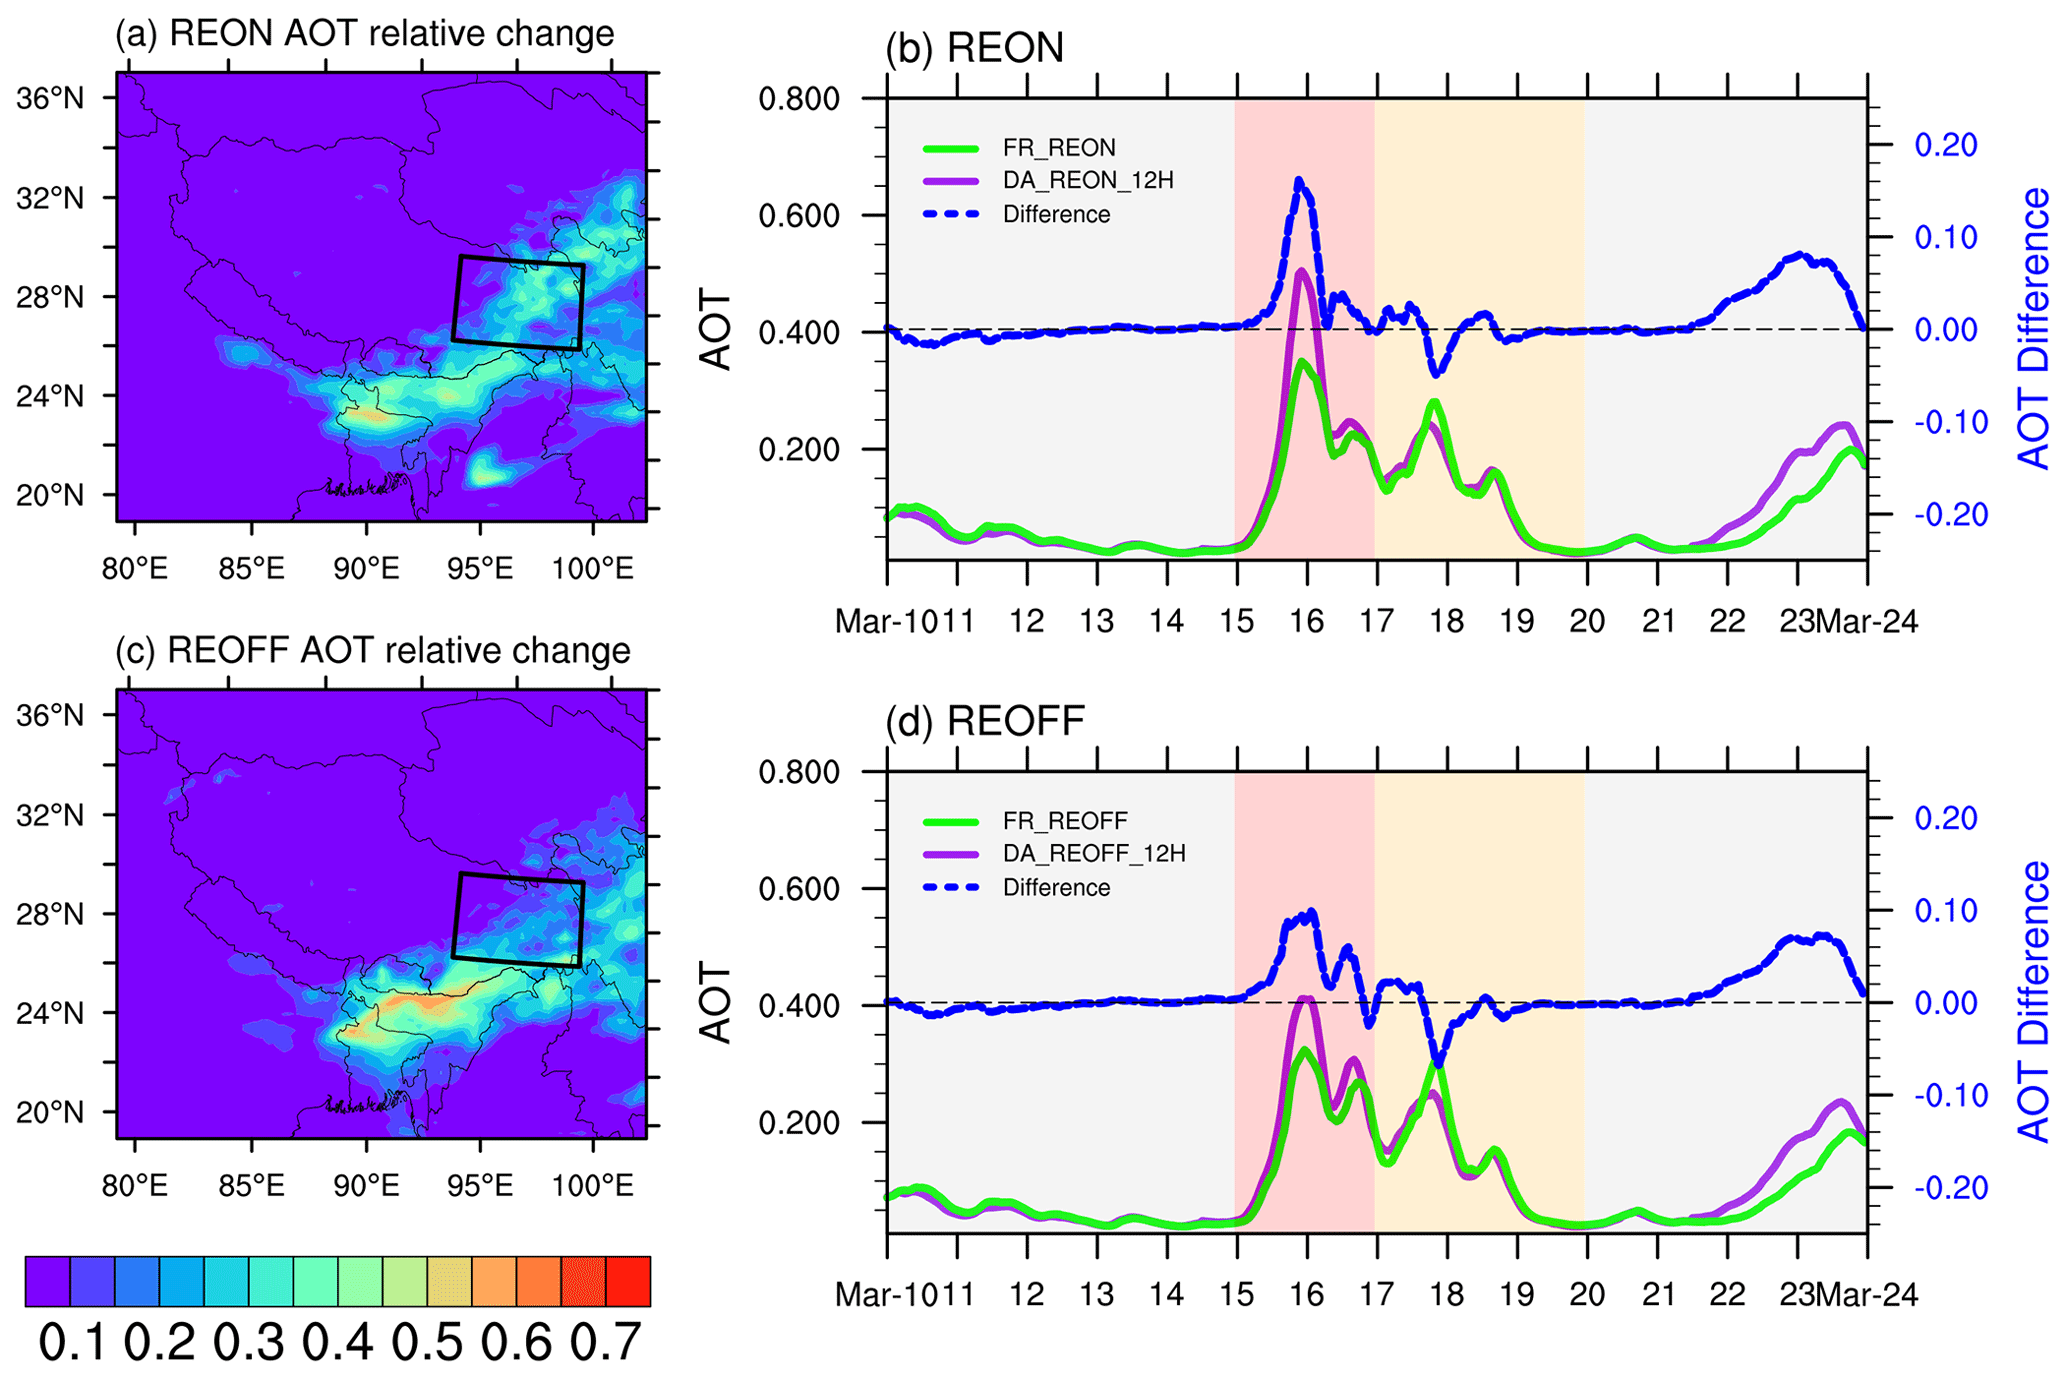
Figure 9Spatial distributions of the relative AOT change during 15–17 March 2018 for (a) REON and (c) REOFF. Hourly time series of the forecasted AOTs in FR and DA experiments, and their differences for (b) REON and (d) REOFF.
To investigate how the meteorological fields are affected by the aerosol radiation effect after assimilation, Fig. 10 shows the averaged horizontal differences in the AOTs, all-sky downward shortwave radiation flux (DSR) at the surface, planetary boundary layer height (PBLH), 2 m temperature (T2), and 2 m relative humidity (RH2) between the DA_REON_12H and FR_REON experiments. Significant positive (negative) DSR anomalies occur over eastern SA (southern Himalayas) due to the decrease (increase) in DA AOTs in eastern SA (southern Himalayas), corresponding to the significant increase (decrease) in PBLHs in eastern SA (southern Himalayas). The decreases in aerosols warm the surface of eastern SA by approximately 0.6 ∘C. The RH2 decreases following the T2 increases. This suggests that within the boundary layer, the aerosols are mainly scattered aerosols, and the decrease in the aerosols leads to an increase in the temperature within the boundary layer, raising the PBLH.
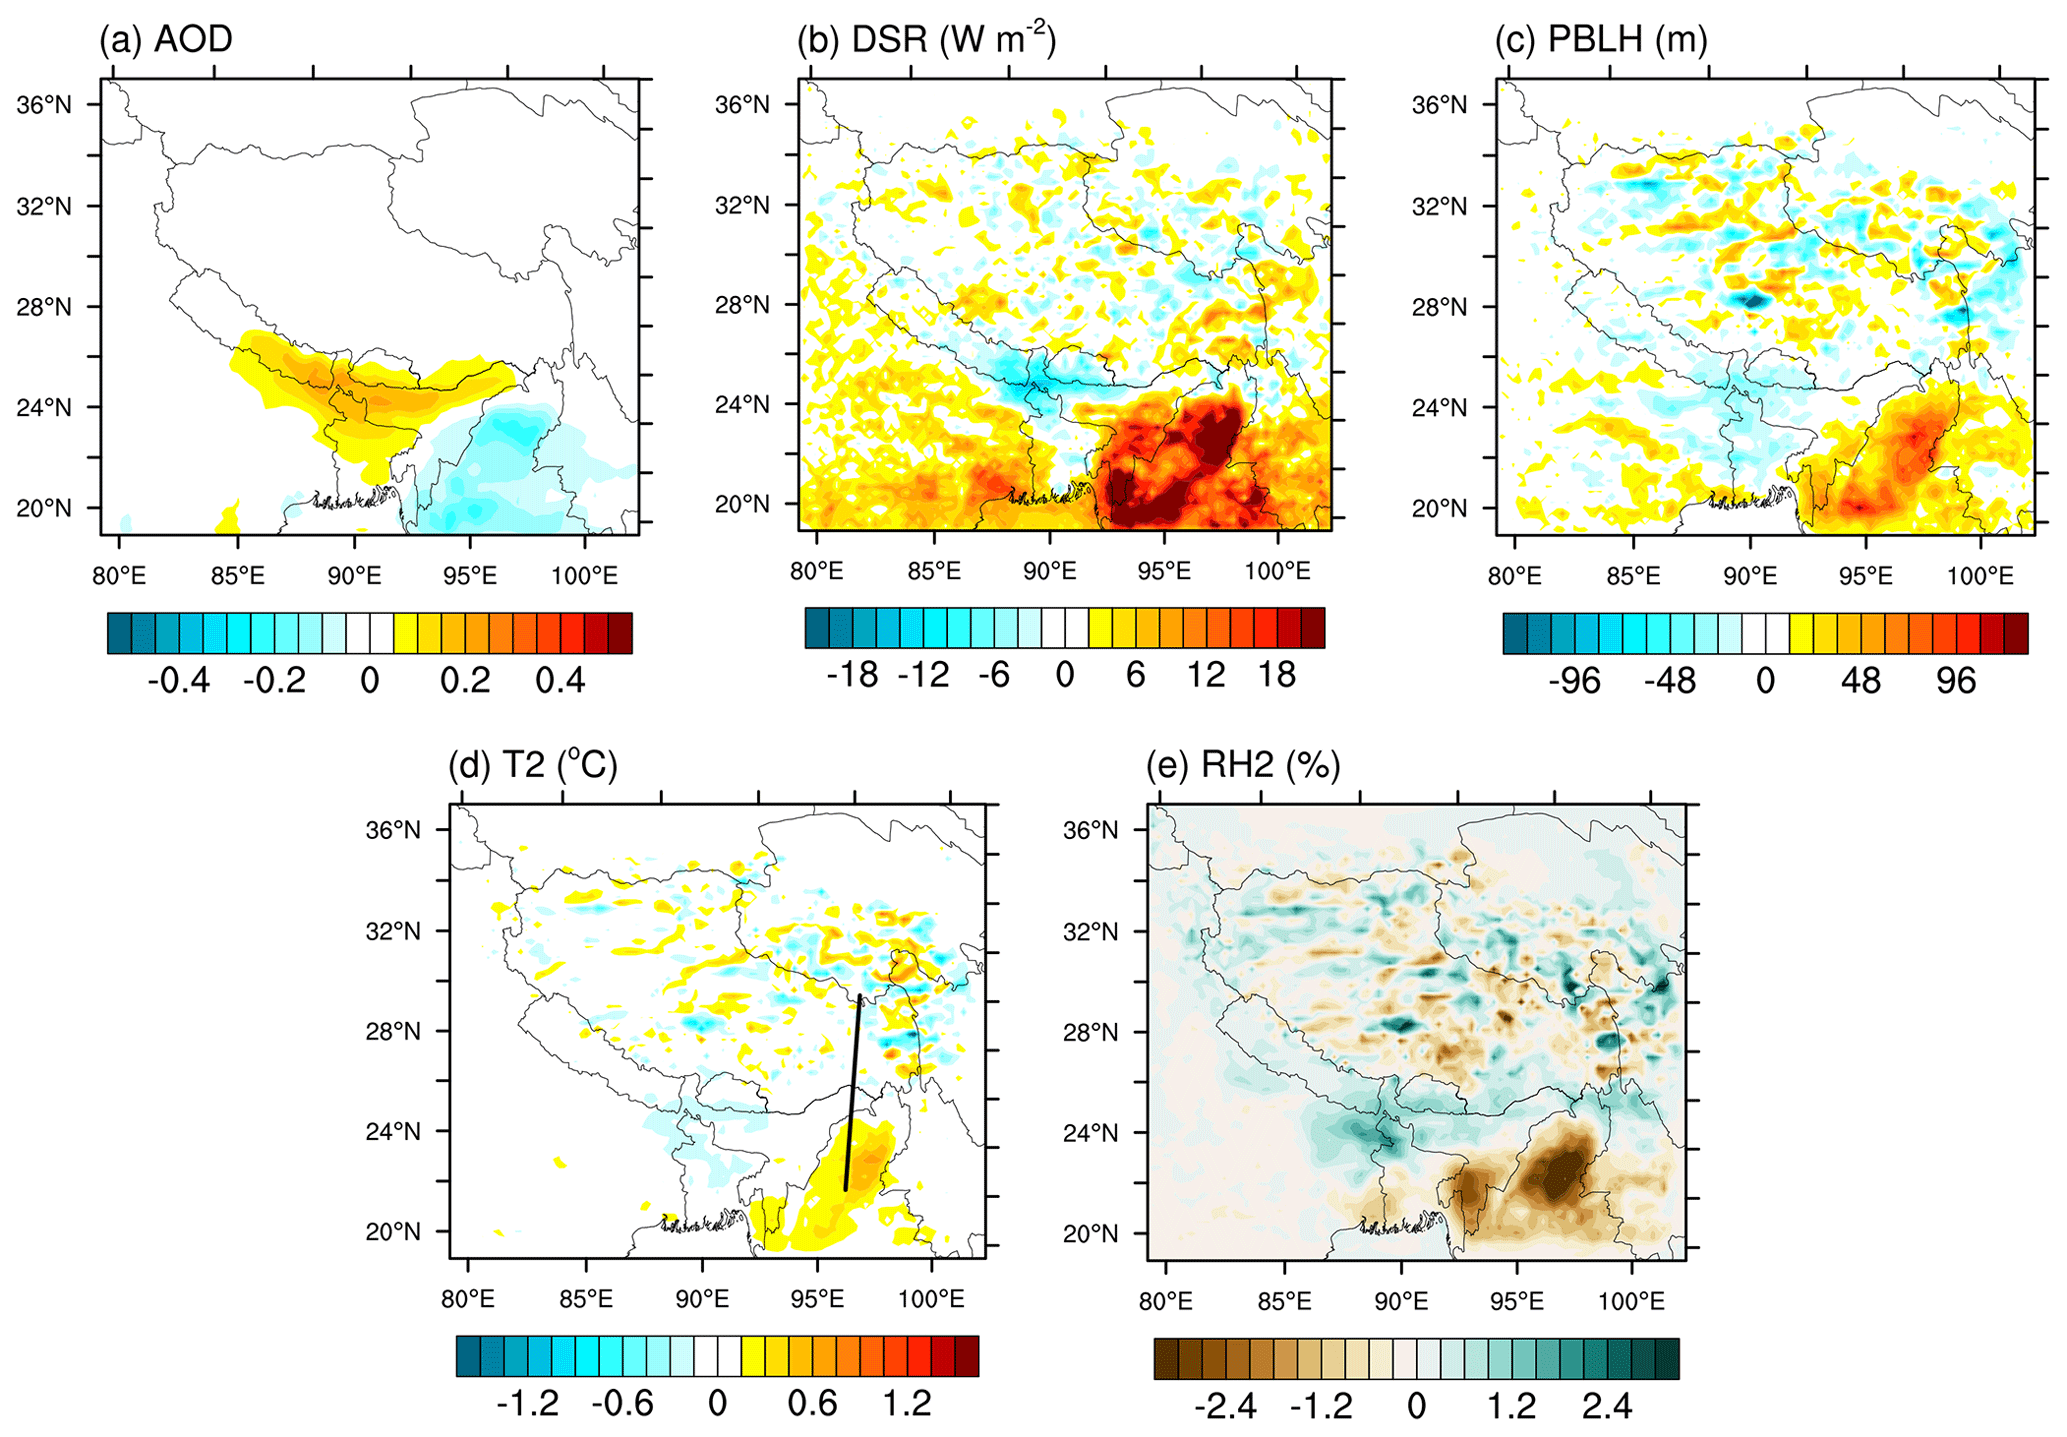
Figure 10Spatial distributions of the difference of (a) AOT, (b) DSR (W m−2), (c) PBLH (m), (d) temperature at 2 m (∘C), and (e) RH at 2 m (%) between DA_REON_12H and FR_REON. The black line in panel (d) represents the position of the vertical profile in Fig. 11.
The physical blockage of the Himalayas causes aerosols to be difficult to transport over the high wall to the TP, while pollutants are relatively easily transported to the southeastern TP through the leaky wall of the Yarlung Tsangpo River Grand Canyon (M. Zhang et al., 2020; Zheng et al., 2017). Therefore, Fig. 11 focuses on the averaged differences in the water vapor mixing ratio (q), temperature (T), and vertical velocity (w) in the vertical distribution from eastern SA to the southeastern TP between the DA_REON_12H and FR_REON experiments. The latitudinal vertical cross section at 96∘ E, indicated by the black line in Fig. 10d, is extracted from 22 to 32∘ N. Remarkable dry and warm anomalies at the surface are present on eastern SA from 22 to 26∘ N. Meanwhile, a well-defined thermal dipole, represented by a warm anomaly below 850 hPa and a cool anomaly between 850 and 650 hPa, can be seen in correspondence to the anomalies of q. This is mainly due to a scattered aerosol decrease after DA occurs at approximately 850 hPa, whereas absorbed aerosols decrease after DA between 850 and 650 hPa, indicating upward transport of fire-emitted absorbing aerosols. Since the DA system with aerosol radiative effect, it appears that warm and dry air intrudes on the surface in eastern SA. This intrusion plays a critical role in the increase in the vertical velocity from south to north at 95∘ E. The above analysis can be used to explain the more pronounced DA aerosol transport from eastern SA to the southeastern TP in the case of aerosol radiative feedback relative to the case of turning off the aerosol radiative effect.
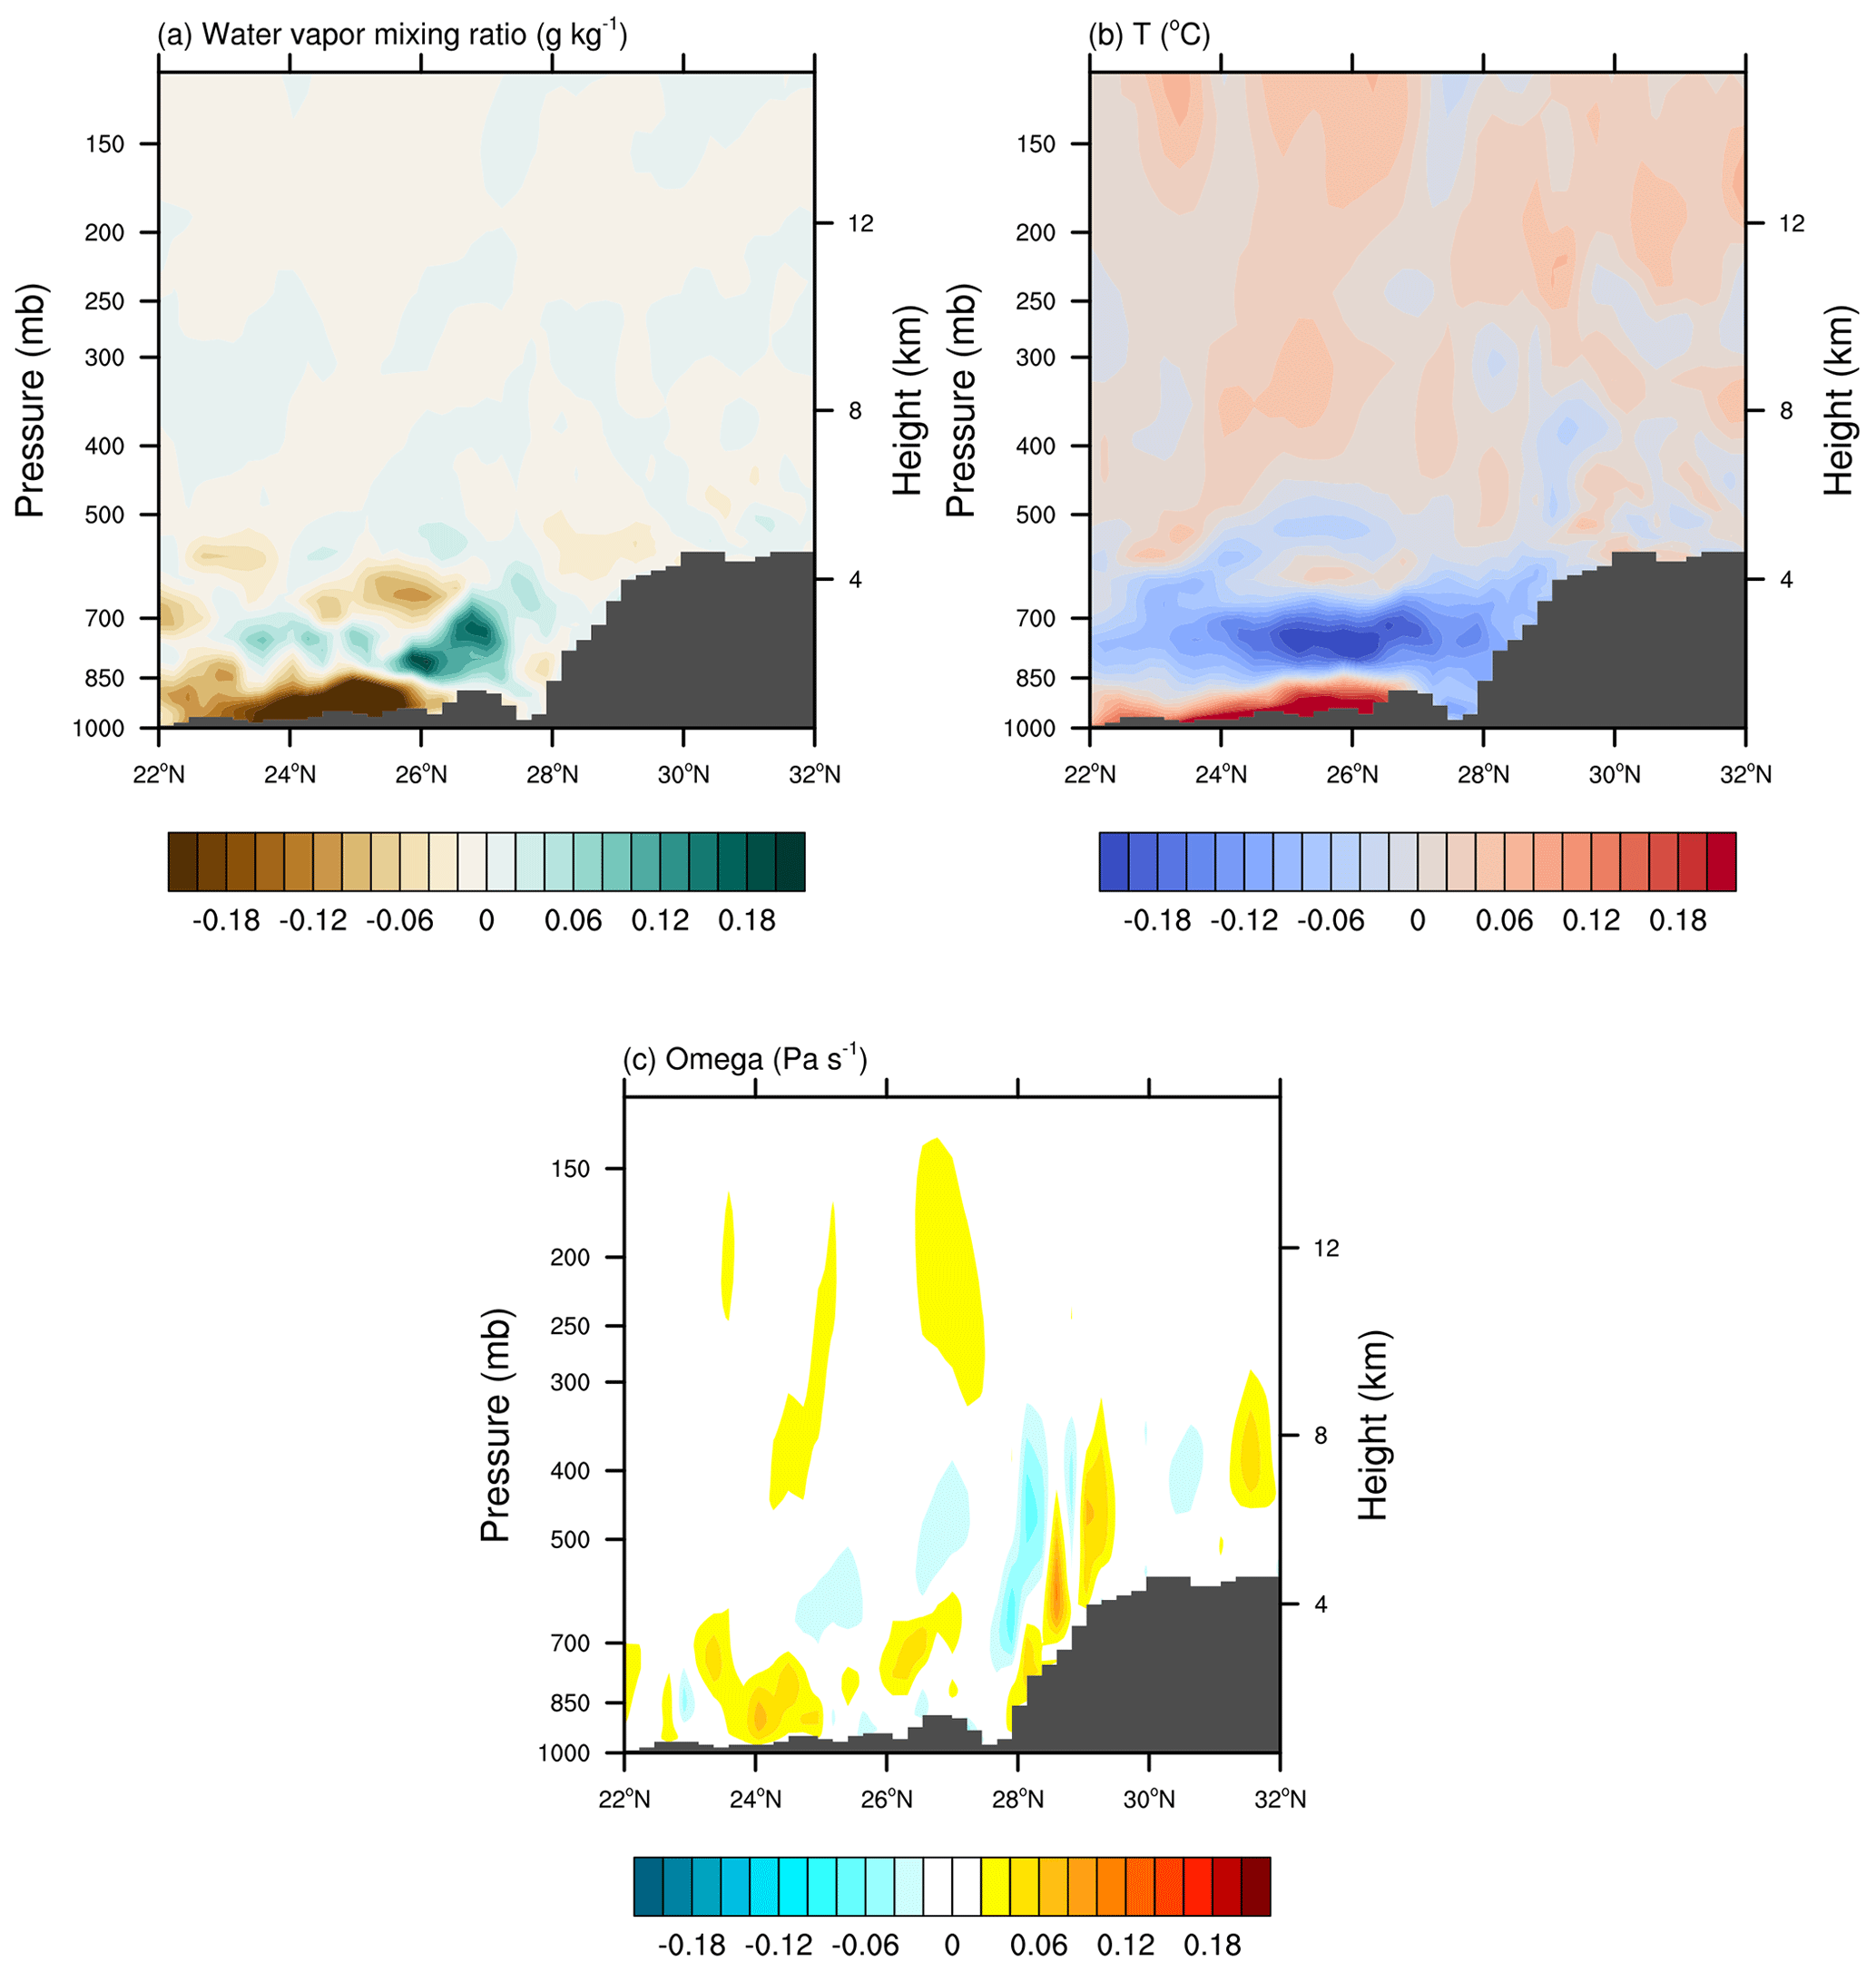
Figure 11Vertical distributions of the difference of water vapor mixing ratio (g kg−1), temperature (∘C), and vertical velocity (Pa s−1) between DA_REON_12H and FR_REON.
5.2 Effects of the different types of aerosols
The fire emissions are considered in this study because March is the season of biomass burning in SA. The inclusion of fire points significantly leads to high-AOT simulations in eastern SA (Fig. 2). Data assimilation does lead to better simulation and forecasting of aerosols. After DA, the aerosol scattering and absorption of solar radiation by anthropogenic emissions or biomass burning can affect the atmospheric temperature profile. The feedback effects of aerosols in the online model are different for different types of aerosols. It is clear that the decrease in temperature within the boundary layer due to the reduction in the AOTs in eastern SA after assimilation is mainly because of the fact that the total aerosols are mainly scattering aerosols. The mass concentrations of organic carbon and sulfate aerosols in this process are roughly 3 times higher than those of black carbon, and there were no dust aerosols during this pollution process on 15–17 March (not shown). It is worth considering that if the same transmission path is dominated by dust aerosols, the impact of aerosol radiative forcing may differ significantly, and this topic deserves further discussion in future studies.
5.3 The influence of clouds
Aerosols influence clouds in terms of both scattering and absorption. Chen et al. (2014) found that a 0.2–0.4 increase in aerosol assimilation increased cloudiness in the boundary layer, suppressed mid-level water clouds and upper-level ice clouds, and ultimately led to a 2 % decrease in precipitation. In this study, it is beyond the scope of this paper to consider cloud changes because there were no precipitation processes during this pollution. However, the influence of clouds is still very important. In Sect. 4.4, the assimilation experiment with aerosol radiative effect activation has significantly better forecast fields for surface solar radiation under clear-sky conditions, but there is still a positive bias in terms of the deviation from CERES. This is most likely related to the amount of clouds simulated in the model, although it is under clear-sky conditions. The difference in the appearance time of clouds in the model and the observed clouds can lead to the difference in solar shortwave radiation under clear-sky conditions. For example, at the time of high solar radiation at noon, cloud-free conditions are simulated in the model, while cloudy conditions are observed. Thus, the surface solar radiation in the clear sky simulated by the model in the average condition significantly increases.
5.4 The uncertainty of emissions
The emission inventory serves as crucial input data for WRF-Chem. However, it is important to note that the anthropogenic emission inventory in MIX-Asia has not been updated since 2010. Anthropogenic aerosols, including BC, OC, and SO2 emissions, are primarily identified from the emission inventories. To compare differences between emission inventories, we select Hemispheric Transport of Air Pollution version 3 (HTAPv3), which spans from 2000 to 2018 (Crippa et al., 2023). A similar spatial emission distribution is visible when comparing MIX-Asia and HTAPv3 emission inventories (Fig. S1 in the Supplement). Specifically, in March 2010, the SO2 emissions in northern India from HTAPv3 are stronger than those from MIX-Asia. Overall, the emissions differences of BC, OC, and SO2 from the HTAPv3 inventory relative to the MIX-Asia inventory in the simulated domain are 28 %, 42 %, and 20 %. Adopting HTAPv3 emissions results in a greater simulation positive bias than MIX-Asia due to high SO2 emissions, particularly in eastern SA.
Additionally, we analyze the differences in aerosol emissions between March 2010 and March 2018 in the HTAPv3 inventory (Fig. S2). In comparison to 2010, there is less variation in BC and OC in northern SA in March 2018. By contrast, there is a significant increase in SO2 emissions in northeastern SA and a decrease in the western TP. Overall, emission inventory disparities outweigh those between different years of the same inventory. We infer that if MIX-Asia is updated, its projected impact on improving the results of the two FR experiments is limited. Further research will be needed to reduce the uncertainty caused by the considerable differences between the emission inventories.
SA is an important emission source of TP aerosols, especially in spring. In this study, WRF-Chem coupled with an AOT DA system was used to investigate pollution transmission from SA to the TP during the spring period of 2018 (10–24 March). By assimilating AOT retrievals from Himawari-8, AOTs in the SA region were substantially improved compared to those when AOTs were not assimilated. Sensitivity tests for the assimilation system were conducted first to tune temporal localization lengths. The self-test comparison with the Himawari-8 AOT entering the system illustrated that the AOT analysis field obtained by assimilating hourly observations was closer to the Himawari-8 AOT, with a correlation coefficient of 0.917 for the whole region throughout the period. Independent validation with MODIS and AERONET AOT data found that the AOT analysis and forecast fields obtained by assimilating all the observations within the 12 h window showed more reasonable distributions in space and time, which were preferable to those obtained by assimilating hourly observations.
Comparisons with CERES showed that the simulated shortwave downward radiation fluxes in assimilated experiments with aerosol radiation active significantly improved the negative biases of the unassimilated experiments in the eastern SA. This can be interpreted as a reduced AOT due to DA scattering less shortwave radiation, leading to reasonable changes in solar energy. On this basis, we analyzed the effect of the DA experiment with the aerosol radiation effect activated on aerosol transport. The DA experiment with the aerosol radiation effect activated had a wider and stronger impact on the southeastern TP than the DA experiment with the aerosol radiation effect inactivated during the period of 15 to 17 March, when the pollution was most severe. We found that the radiative effect of the decreased AOT was to increase the downward solar radiation, PBLH, and surface temperature and suppress the RH. This led to an increase in the vertical velocity from eastern SA to the southeastern TP, which facilitated the transport of pollution from SA to the TP. It is worth noting that the timing of this contamination is dominated by scattered aerosols and that individual cases may not be typical enough. More studies are needed to better understand these complex interactions to further evaluate our hypothesis.
Three primary statistical metrics were employed to assess the simulation performance of observed data on model aerosol fields. These metrics include the bias (BIAS), root mean square error (RMSE), and correlation coefficient (CORR). BIAS is defined as the average difference between simulated results and observed values. RMSE quantifies the standard deviation of the differences between simulated results and observed values. CORR measures the correlation between simulated results and observed values. The formulas for these three statistical metrics are as follows:
Here, N represents the total number of data points, and Mi and Oi are the simulated and observed values, respectively. The symbols and represent the means of simulated and observed values, respectively.
The Himawari-8 data are from http://www.eorc.jaxa.jp/ptree/index.html (JAXA, 2024). The MODIS data are from https://modis-atmos.gsfc.nasa.gov/products/aerosol (NASA, 2024a). The AERONET data are from https://aeronet.gsfc.nasa.gov (NASA, 2024b). The CERES data are from https://ceres.larc.nasa.gov/data/data-product-dois/ (NASA, 2024c).
The supplement related to this article is available online at: https://doi.org/10.5194/acp-24-235-2024-supplement.
MZ and TD designed the study. MZ performed the assimilation experiments, analysis, and interpretation. TD developed the modeling tools used for the experiment results. MZ, TD, DG, HW, and GS wrote the paper with contributions from all authors.
The contact author has declared that none of the authors has any competing interests.
Publisher's note: Copernicus Publications remains neutral with regard to jurisdictional claims made in the text, published maps, institutional affiliations, or any other geographical representation in this paper. While Copernicus Publications makes every effort to include appropriate place names, the final responsibility lies with the authors.
This article is part of the special issue “In-depth study of the atmospheric chemistry over the Tibetan Plateau: measurement, processing, and the impacts on climate and air quality (ACP/AMT inter-journal SI)”. It is not associated with a conference.
We are grateful to the two anonymous reviewers for their valuable suggestions. We acknowledge all of the data providers and laboratories. We acknowledge JAXA for their contribution to the Himawari-8 AHI aerosol optical thickness data product. We also acknowledge the NASA support team for providing MODIS, CERES, and AERONET data. The numerical calculations in this paper were supported by the National Key Scientific and Technological Infrastructure project Earth System Science Numerical Simulator Facility (EarthLab).
This work was jointly supported by the Second Tibetan Plateau Scientific Expedition and Research Program (grant no. 2022QZKK0101); the National Natural Science Funds of China (grant nos. 91937302, 42175186, 41575100, and 41875133); the International Partnership Program of Chinese Academy of Sciences (grant no. 134111KYSB20200006); the Youth Innovation Promotion Association, CAS (grant no. 2020078); and the Special Research Assistantship program, CAS.
This paper was edited by Jayanarayanan Kuttippurath and reviewed by two anonymous referees.
Adhikary, B., Kulkarni, S., Dallura, A., Tang, Y., Chai, T., Leung, L. R., Qian, Y., Chung, C. E., Ramanathan, V., and Carmichael, G. R.: A regional scale chemical transport modeling of Asian aerosols with data assimilation of AOD observations using optimal interpolation technique, Atmos. Environ., 42, 8600–8615, https://doi.org/10.1016/j.atmosenv.2008.08.031, 2008.
Benedetti, A., Morcrette, J. J., Boucher, O., Dethof, A., Engelen, R. J., Fisher, M., Flentje, H., Huneeus, N., Jones, L., Kaiser, J. W., Kinne, S., Mangold, A., Razinger, M., Simmons, A. J., and Suttie, M.: Aerosol analysis and forecast in the European Centre for Medium-Range Weather Forecasts Integrated Forecast System: 2. Data assimilation, J. Geophys. Res.-Atmos., 114, D13205, https://doi.org/10.1029/2008jd011115, 2009.
Bond, T. C., Doherty, S. J., Fahey, D. W., Forster, P. M., Berntsen, T., DeAngelo, B. J., Flanner, M. G., Ghan, S., Kaercher, B., Koch, D., Kinne, S., Kondo, Y., Quinn, P. K., Sarofim, M. C., Schultz, M. G., Schulz, M., Venkataraman, C., Zhang, H., Zhang, S., Bellouin, N., Guttikunda, S. K., Hopke, P. K., Jacobson, M. Z., Kaiser, J. W., Klimont, Z., Lohmann, U., Schwarz, J. P., Shindell, D., Storelvmo, T., Warren, S. G., and Zender, C. S.: Bounding the role of black carbon in the climate system: A scientific assessment, J. Geophys. Res.-Atmos., 118, 5380–5552, https://doi.org/10.1002/jgrd.50171, 2013.
Cao, J., Tie, X., Xu, B., Zhao, Z., Zhu, C., Li, G., and Liu, S.: Measuring and modeling black carbon (BC) contamination in the SE Tibetan Plateau, J. Atmos. Chem., 67, 45–60, https://doi.org/10.1007/s10874-011-9202-5, 2010.
Chen, D., Liu, Z., Schwartz, C. S., Lin, H. C., Cetola, J. D., Gu, Y., and Xue, L.: The impact of aerosol optical depth assimilation on aerosol forecasts and radiative effects during a wild fire event over the United States, Geosci. Model Dev., 7, 2709–2715, https://doi.org/10.5194/gmd-7-2709-2014, 2014.
Chen, D., Liu, Z., Davis, C., and Gu, Y.: Dust radiative effects on atmospheric thermodynamics and tropical cyclogenesis over the Atlantic Ocean using WRF-Chem coupled with an AOD data assimilation system, Atmos. Chem. Phys., 17, 7917–7939, https://doi.org/10.5194/acp-17-7917-2017, 2017.
Chen, F. and Dudhia, J.: Coupling an advanced land surface-hydrology model with the Penn State-NCAR MM5 modeling system. Part I: Model implementation and sensitivity, Mon. Weather Rev., 129, 569–585, https://doi.org/10.1175/1520-0493(2001)129<0569:Caalsh>2.0.Co;2, 2001.
Cheng, Y., Dai, T., Goto, D., Schutgens, N. A. J., Shi, G., and Nakajima, T.: Investigating the assimilation of CALIPSO global aerosol vertical observations using a four-dimensional ensemble Kalman filter, Atmos. Chem. Phys., 19, 13445–13467, https://doi.org/10.5194/acp-19-13445-2019, 2019.
Cheng, Y., Dai, T., Goto, D., Murakami, H., Yoshida, M., Shi, G., and Nakajima, T.: Enhanced Simulation of an Asian Dust Storm by Assimilating GCOM-C Observations, Remote Sens., 13, 3020, https://doi.org/10.3390/rs13153020, 2021.
Christopher, S. A., Wang, J., Ji, Q., and Tsay, S. C.: Estimation of diurnal shortwave dust aerosol radiative forcing during PRIDE, J. Geophys. Res.-Atmos., 108, 8596, https://doi.org/10.1029/2002jd002787, 2003.
Collins, W. D., Rasch, P. J., Eaton, B. E., Khattatov, B. V., Lamarque, J. F., and Zender, C. S.: Simulating aerosols using a chemical transport model with assimilation of satellite aerosol retrievals: Methodology for INDOEX, J. Geophys. Res.-Atmos., 106, 7313–7336, https://doi.org/10.1029/2000jd900507, 2001.
Crippa, M., Guizzardi, D., Butler, T., Keating, T., Wu, R., Kaminski, J., Kuenen, J., Kurokawa, J., Chatani, S., Morikawa, T., Pouliot, G., Racine, J., Moran, M. D., Klimont, Z., Manseau, P. M., Mashayekhi, R., Henderson, B. H., Smith, S. J., Suchyta, H., Muntean, M., Solazzo, E., Banja, M., Schaaf, E., Pagani, F., Woo, J.-H., Kim, J., Monforti-Ferrario, F., Pisoni, E., Zhang, J., Niemi, D., Sassi, M., Ansari, T., and Foley, K.: The HTAP_v3 emission mosaic: merging regional and globalmonthly emissions (2000–2018) to support air quality modelling and policies, Earth Syst. Sci. Data, 15, 2667–2694, https://doi.org/10.5194/essd-15-2667-2023, 2023.
Dai, T., Goto, D., Schutgens, N. A. J., Dong, X., Shia, G., and Nakajima, T.: Simulated aerosol key optical properties over global scale using an aerosol transport model coupled with a new type of dynamic core, Atmos. Environ., 82, 71–82, https://doi.org/10.1016/j.atmosenv.2013.10.018, 2014.
Dai, T., Cheng, Y., Suzuki, K., Goto, D., Kikuchi, M., Schutgens, N. A. J., Yoshida, M., Zhang, P., Husi, L., Shi, G., and Nakajima, T.: Hourly Aerosol Assimilation of Himawari-8 AOT Using the Four-Dimensional Local Ensemble Transform Kalman Filter, J. Adv. Model. Earth Syst., 11, 680–711, https://doi.org/10.1029/2018ms001475, 2019.
Dai, T., Cheng, Y., Goto, D., Li, Y., Tang, X., Shi, G., and Nakajima, T.: Revealing the sulfur dioxide emission reductions in China by assimilating surface observations in WRF-Chem, Atmos. Chem. Phys., 21, 4357–4379, https://doi.org/10.5194/acp-21-4357-2021, 2021.
Di Tomaso, E., Schutgens, N. A. J., Jorba, O., and Garcia-Pando, C. P.: Assimilation of MODIS Dark Target and Deep Blue observations in the dust aerosol component of NMMB-MONARCH version 1.0, Geosci. Model Dev., 10, 1107–1129, https://doi.org/10.5194/gmd-10-1107-2017, 2017.
Emmons, L. K., Schwantes, R. H., Orlando, J. J., Tyndall, G., Kinnison, D., Lamarque, J.-F., Marsh, D., Mills, M. J., Tilmes, S., Bardeen, C., Buchholz, R. R., Conley, A., Gettelman, A., Garcia, R., Simpson, I., Blake, D. R., Meinardi, S., and Petron, G.: The Chemistry Mechanism in the Community Earth System Model Version 2 (CESM2), J. Adv. Model. Earth Syst., 12, e2019MS001882, https://doi.org/10.1029/2019ms001882, 2020.
Fast, J. D., Gustafson, W. I., Jr., Easter, R. C., Zaveri, R. A., Barnard, J. C., Chapman, E. G., Grell, G. A., and Peckham, S. E.: Evolution of ozone, particulates, and aerosol direct radiative forcing in the vicinity of Houston using a fully coupled meteorology-chemistry-aerosol model, J. Geophys. Res.-Atmos., 111, D21305, https://doi.org/10.1029/2005jd006721, 2006.
Fukuda, S., Nakajima, T., Takenaka, H., Higurashi, A., Kikuchi, N., Nakajima, T. Y., and Ishida, H.: New approaches to removing cloud shadows and evaluating the 380 nm surface reflectance for improved aerosol optical thickness retrievals from the GOSAT/TANSO-Cloud and Aerosol Imager, J. Geophys. Res.-Atmos., 118, 13520–13531, https://doi.org/10.1002/2013jd020090, 2013.
Gao, C., Xiu, A., Zhang, X., Tong, Q., Zhao, H., Zhang, S., Yang, G., and Zhang, M.: Two-way coupled meteorology and air quality models in Asia: a systematic review and meta-analysis of impacts of aerosol feedbacks on meteorology and air quality, Atmos. Chem. Phys., 22, 5265–5329, https://doi.org/10.5194/acp-22-5265-2022, 2022.
Generoso, S., Breon, F. M., Chevallier, F., Balkanski, Y., Schulz, M., and Bey, I.: Assimilation of POLDER aerosol optical thickness into the LMDz-INCA model: Implications for the Arctic aerosol burden, J. Geophys. Res.-Atmos., 112, D02311, https://doi.org/10.1029/2005jd006954, 2007.
Ginoux, P., Chin, M., Tegen, I., Prospero, J. M., Holben, B., Dubovik, O., and Lin, S. J.: Sources and distributions of dust aerosols simulated with the GOCART model, J. Geophys. Res.-Atmos., 106, 20255–20273, https://doi.org/10.1029/2000jd000053, 2001.
Grell, G. A. and Devenyi, D.: A generalized approach to parameterizing convection combining ensemble and data assimilation techniques, Geophys. Res. Lett., 29, 38-1–38-4, https://doi.org/10.1029/2002gl015311, 2002.
Grell, G. A., Peckham, S. E., Schmitz, R., McKeen, S. A., Frost, G., Skamarock, W. C., and Eder, B.: Fully coupled “online” chemistry within the WRF model, Atmos. Environ., 39, 6957–6975, https://doi.org/10.1016/j.atmosenv.2005.04.027, 2005.
Guenther, A., Karl, T., Harley, P., Wiedinmyer, C., Palmer, P. I., and Geron, C.: Estimates of global terrestrial isoprene emissions using MEGAN (Model of Emissions of Gases and Aerosols from Nature), Atmos. Chem. Phys., 6, 3181–3210, https://doi.org/10.5194/acp-6-3181-2006, 2006.
Gui, S., Liang, S., Wang, K., Li, L., and Zhang, X.: Assessment of Three Satellite-Estimated Land Surface Downwelling Shortwave Irradiance Data Sets, IEEE Geosci. Remote Sens. Lett., 7, 776–780, https://doi.org/10.1109/lgrs.2010.2048196, 2010.
Hansen, J. and Nazarenko, L.: Soot climate forcing via snow and ice albedos, P. Natla. Acad. Sci. USA, 101, 423–428, https://doi.org/10.1073/pnas.2237157100, 2004.
Higurashi, A. and Nakajima, T.: Development of a two-channel aerosol retrieval algorithm on a global scale using NOAA AVHRR, J. Atmos. Sci., 56, 924–941, https://doi.org/10.1175/1520-0469(1999)056<0924:Doatca>2.0.Co;2, 1999.
Higurashi, A. and Nakajima, T.: Detection of aerosol types over the East China Sea near Japan from four-channel satellite data, Geophys. Res. Lett., 29, 17-1–17-4, https://doi.org/10.1029/2002gl015357, 2002.
Hong, S.-Y., Noh, Y., and Dudhia, J.: A new vertical diffusion package with an explicit treatment of entrainment processes, Mon. Weather Rev., 134, 2318–2341, https://doi.org/10.1175/mwr3199.1, 2006.
Huang, J., Minnis, P., Yi, Y., Tang, Q., Wang, X., Hu, Y., Liu, Z., Ayers, K., Trepte, C., and Winker, D.: Summer dust aerosols detected from CALIPSO over the Tibetan Plateau, Geophys. Res. Lett., 34, L18805, https://doi.org/10.1029/2007gl029938, 2007.
Hunt, B. R., Kostelich, E. J., and Szunyogh, I.: Efficient data assimilation for spatiotemporal chaos: A local ensemble transform Kalman filter, Physica D, 230, 112–126, https://doi.org/10.1016/j.physd.2006.11.008, 2007.
Iacono, M. J., Delamere, J. S., Mlawer, E. J., Shephard, M. W., Clough, S. A., and Collins, W. D.: Radiative forcing by long-lived greenhouse gases: Calculations with the AER radiative transfer models, J. Geophys. Res.-Atmos., 113, D13103, https://doi.org/10.1029/2008jd009944, 2008.
Jacobson, M. Z.: Strong radiative heating due to the mixing state of black carbon in atmospheric aerosols, Nature, 409, 695–697, https://doi.org/10.1038/35055518, 2001.
JAXA: AHI, Himawari-8 data, http://www.eorc.jaxa.jp/ptree/index.html, last access: 5 January 2024.
Kato, S., Loeb, N. G., Rose, F. G., Doelling, D. R., Rutan, D. A., Caldwell, T. E., Yu, L., and Weller, R. A.: Surface Irradiances Consistent with CERES-Derived Top-of-Atmosphere Shortwave and Longwave Irradiances, J. Climate, 26, 2719–2740, https://doi.org/10.1175/jcli-d-12-00436.1, 2013.
Kikuchi, M., Murakami, H., Suzuki, K., Nagao, T. M., and Higurashi, A.: Improved Hourly Estimates of Aerosol Optical Thickness Using Spatiotemporal Variability Derived From Himawari-8 Geostationary Satellite, IEEE T. Geosci. Remote, 56, 3442–3455, https://doi.org/10.1109/tgrs.2018.2800060, 2018.
King, M. D.: Remote-sensing of cloud, aerosol and water-vapor properties from the Moderate Resolution Imaging Spectrometer (MODIS), in: 115th Course of the International School of Physics Enrico Fermi: The Use of Eos (Earth Observing System) for Studies of Atmospheric Physics, 26 June–6 July 1992, Varenna, Italy, 253–285, WOS:A1992BY55L00014, 1992.
Koren, I., Kaufman, Y. J., Remer, L. A., and Martins, J. V.: Measurement of the effect of Amazon smoke on inhibition of cloud formation, Science, 303, 1342–1345, https://doi.org/10.1126/science.1089424, 2004.
Lee, K., Yu, J., Lee, S., Park, M., Hong, H., Park, S. Y., Choi, M., Kim, J., Kim, Y., Woo, J.-H., Kim, S.-W., and Song, C. H.: Development of Korean Air Quality Prediction System version 1 (KAQPS v1) with focuses on practical issues, Geosci. Model Dev., 13, 1055–1073, https://doi.org/10.5194/gmd-13-1055-2020, 2020.
Letu, H., Nakajima, T. Y., Wang, T., Shang, H., Ma, R., Yang, K., Baran, A. J., Riedi, J., Ishimoto, H., Yoshida, M., Shi, C., Khatri, P., Du, Y., Chen, L., and Shi, J.: A new benchmark for surface radiation products over the East Asia–Pacific region retrieved from the Himawari-8/AHI next-generation geostationary satellite, B. Am. Meteorol. Soc., 103, E873–E888, 2022.
Li, F., Wan, X., Wang, H., Orsolini, Y. J., Cong, Z., Gao, Y., and Kang, S.: Arctic sea-ice loss intensifies aerosol transport to the Tibetan Plateau, Nat. Clim. Change, 10, 1037–1044, https://doi.org/10.1038/s41558-020-0881-2, 2020.
Li, M., Zhang, Q., Kurokawa, J.-i., Woo, J.-H., He, K., Lu, Z., Ohara, T., Song, Y., Streets, D. G., Carmichael, G. R., Cheng, Y., Hong, C., Huo, H., Jiang, X., Kang, S., Liu, F., Su, H., and Zheng, B.: MIX: a mosaic Asian anthropogenic emission inventory under the international collaboration framework of the MICS-Asia and HTAP, Atmos. Chem. Phys., 17, 935–963, https://doi.org/10.5194/acp-17-935-2017, 2017.
Liu, Z., Liu, D., Huang, J., Vaughan, M., Uno, I., Sugimoto, N., Kittaka, C., Trepte, C., Wang, Z., Hostetler, C., and Winker, D.: Airborne dust distributions over the Tibetan Plateau and surrounding areas derived from the first year of CALIPSO lidar observations, Atmos. Chem. Phys., 8, 5045–5060, https://doi.org/10.5194/acp-8-5045-2008, 2008.
Liu, Z., Liu, Q., Lin, H.-C., Schwartz, C. S., Lee, Y.-H., and Wang, T.: Three-dimensional variational assimilation of MODIS aerosol optical depth: Implementation and application to a dust storm over East Asia, J. Geophys. Res.-Atmos., 116, D23206, https://doi.org/10.1029/2011jd016159, 2011.
Lu, Z., Streets, D. G., Zhang, Q., and Wang, S.: A novel back-trajectory analysis of the origin of black carbon transported to the Himalayas and Tibetan Plateau during 1996–2010, Geophys. Res. Lett., 39, L01809, https://doi.org/10.1029/2011gl049903, 2012.
Ma, C., Wang, T., Mizzi, A. P., Anderson, J. L., Zhuang, B., Xie, M., and Wu, R.: Multiconstituent Data Assimilation With WRF-Chem/DART: Potential for Adjusting Anthropogenic Emissions and Improving Air Quality Forecasts Over Eastern China, J. Geophys. Res.-Atmos., 124, 7393–7412, https://doi.org/10.1029/2019jd030421, 2019.
Mansell, E. R., Ziegler, C. L., and Bruning, E. C.: Simulated Electrification of a Small Thunderstorm with Two-Moment Bulk Microphysics, J. Atmos. Sci., 67, 171–194, https://doi.org/10.1175/2009jas2965.1, 2010.
Marinoni, A., Cristofanelli, P., Laj, P., Duchi, R., Calzolari, F., Decesari, S., Sellegri, K., Vuillermoz, E., Verza, G. P., Villani, P., and Bonasoni, P.: Aerosol mass and black carbon concentrations, a two year record at NCO-P (5079 m, Southern Himalayas), Atmos. Chem. Phys., 10, 8551–8562, https://doi.org/10.5194/acp-10-8551-2010, 2010.
Martins, J. V., Tanre, D., Remer, L., Kaufman, Y., Mattoo, S., and Levy, R.: MODIS Cloud screening for remote sensing of aerosols over oceans using spatial variability, Geophys. Res. Lett., 29, MOD4-1–MOD4-4, https://doi.org/10.1029/2001gl013252, 2002.
Ming, J., Wang, P., Zhao, S., and Chen, P.: Disturbance of light-absorbing aerosols on the albedo in a winter snowpack of Central Tibet, J. Environ. Sci., 25, 1601–1607, https://doi.org/10.1016/s1001-0742(12)60220-4, 2013.
Miyoshi, T., Yamane, S., and Enomoto, T.: Localizing the Error Covariance by Physical Distances within a Local Ensemble Transform Kalman Filter (LETKF), SOLA, 3, 89–92, https://doi.org/10.2151/sola.2007-023, 2007.
NASA: MYD04_L2, https://modis-atmos.gsfc.nasa.gov/products/aerosol, last access: 5 January 2024a.
NASA: level 2.0 AOT dataset, https://aeronet.gsfc.nasa.gov, last access: 5 January 2024b.
NASA: CERES, SYN1deg-1Hour, https://ceres.larc.nasa.gov/data/data-product-dois/, last access: 5 January 2024c.
Park, R. S., Song, C. H., Han, K. M., Park, M. E., Lee, S. S., Kim, S. B., and Shimizu, A.: A study on the aerosol optical properties over East Asia using a combination of CMAQ-simulated aerosol optical properties and remote-sensing data via a data assimilation technique, Atmos. Chem. Phys., 11, 12275–12296, https://doi.org/10.5194/acp-11-12275-2011, 2011.
Peng, Z., Liu, Z., Chen, D., and Ban, J.: Improving PM2.5 forecast over China by the joint adjustment of initial conditions and source emissions with an ensemble Kalman filter, Atmos. Chem. Phys., 17, 4837–4855, https://doi.org/10.5194/acp-17-4837-2017, 2017.
Qiu, J.: Environmental Science Pollutants Capture the High Ground in the Himalayas, Science, 339, 1030–1031, https://doi.org/10.1126/science.339.6123.1030, 2013.
Ramanathan, V., Crutzen, P. J., Lelieveld, J., Mitra, A. P., Althausen, D., Anderson, J., Andreae, M. O., Cantrell, W., Cass, G. R., Chung, C. E., Clarke, A. D., Coakley, J. A., Collins, W. D., Conant, W. C., Dulac, F., Heintzenberg, J., Heymsfield, A. J., Holben, B., Howell, S., Hudson, J., Jayaraman, A., Kiehl, J. T., Krishnamurti, T. N., Lubin, D., McFarquhar, G., Novakov, T., Ogren, J. A., Podgorny, I. A., Prather, K., Priestley, K., Prospero, J. M., Quinn, P. K., Rajeev, K., Rasch, P., Rupert, S., Sadourny, R., Satheesh, S. K., Shaw, G. E., Sheridan, P., and Valero, F. P. J.: Indian Ocean Experiment: An integrated analysis of the climate forcing and effects of the great Indo-Asian haze, J. Geophys. Res.-Atmos., 106, 28371–28398, https://doi.org/10.1029/2001jd900133, 2001.
Reale, O., Lau, W. K., Kim, K.-M., and Brin, E.: Atlantic Tropical Cyclogenetic Processes during SOP-3 NAMMA in the GEOS-5 Global Data Assimilation and Forecast System, J. Atmos. Sci., 66, 3563–3578, https://doi.org/10.1175/2009jas3123.1, 2009.
Reale, O., Lau, K. M., da Silva, A., and Matsui, T.: Impact of assimilated and interactive aerosol on tropical cyclogenesis, Geophys. Res. Lett., 41, 3282–3288, https://doi.org/10.1002/2014gl059918, 2014.
Rubin, J. I., Reid, J. S., Hansen, J. A., Anderson, J. L., Holben, B. N., Xian, P., Westphal, D. L., and Zhang, J.: Assimilation of AERONET and MODIS AOT observations using variational and ensemble data assimilation methods and its impact on aerosol forecasting skill, J. Geophys. Res.-Atmos., 122, 4967–4992, https://doi.org/10.1002/2016jd026067, 2017.
Salomonson, V. V., Barnes, W. L., Maymon, P. W., Montgomery, H. E., and Ostrow, H.: MODIS – Advanced Facility Instrument For Studies Of The Earth As A System, IEEE T. Geosci. Remote, 27, 145–153, https://doi.org/10.1109/36.20292, 1989.
Sarangi, C., Qian, Y., Rittger, K., Ruby Leung, L., Chand, D., Bormann, K. J., and Painter, T. H.: Dust dominates high-altitude snow darkening and melt over high-mountain Asia, Nat. Clim. Change, 10, 1045–1051, https://doi.org/10.1038/s41558-020-00909-3, 2020.
Schutgens, N. A. J., Miyoshi, T., Takemura, T., and Nakajima, T.: Sensitivity tests for an ensemble Kalman filter for aerosol assimilation, Atmos. Chem. Phys., 10, 6583–6600, https://doi.org/10.5194/acp-10-6583-2010, 2010.
Skamarock, W. C., Klemp, J. B., Dudhia, J., Gill, D. O., Barker, D. M., Wang, W., and Powers, J. G.: A description of the advanced research WRF version 2, Tech. rep., Mesoscale and Microscale Meteorology Div., National Center For Atmospheric Research, Boulder, Co, USA, https://doi.org/10.5065/D68S4MVH, 2005.
Stephens, G. L., Li, J., Wild, M., Clayson, C. A., Loeb, N., Kato, S., L'Ecuyer, T., Stackhouse Jr., P. W., Lebsock, M., and Andrews, T.: An update on Earth's energy balance in light of the latest global observations, Nat. Geosci., 5, 691–696, https://doi.org/10.1038/ngeo1580, 2012.
Tang, X., Zhu, J., Wang, Z. F., and Gbaguidi, A.: Improvement of ozone forecast over Beijing based on ensemble Kalman filter with simultaneous adjustment of initial conditions and emissions, Atmos. Chem. Phys., 11, 12901–12916, https://doi.org/10.5194/acp-11-12901-2011, 2011.
Trenberth, K. E., Fasullo, J. T., and Balmaseda, M. A.: Earth's Energy Imbalance, J. Climate, 27, 3129–3144, https://doi.org/10.1175/jcli-d-13-00294.1, 2014.
Tsikerdekis, A., Schutgens, N. A. J., and Hasekamp, O. P.: Assimilating aerosol optical properties related to size and absorption from POLDER/PARASOL with an ensemble data assimilation system, Atmos. Chem. Phys., 21, 2637–2674, https://doi.org/10.5194/acp-21-2637-2021, 2021.
Wang, J., Nair, U. S., and Christopher, S. A.: GOES 8 aerosol optical thickness assimilation in a mesoscale model: Online integration of aerosol radiative effects, J. Geophys. Res.-Atmos., 109, D23203, https://doi.org/10.1029/2004jd004827, 2004.
Watson-Parris, D., Schutgens, N., Cook, N., Kipling, Z., Kershaw, P., Gryspeerdt, E., Lawrence, B., and Stier, P.: Community Intercomparison Suite (CIS) v1.4.0: a tool for intercomparing models and observations, Geosci. Model Dev., 9, 3093–3110, https://doi.org/10.5194/gmd-9-3093-2016, 2016.
Wilcox, E. M.: Direct and semi-direct radiative forcing of smoke aerosols over clouds, Atmos. Chem. Phys., 12, 139–149, https://doi.org/10.5194/acp-12-139-2012, 2012.
Xia, X., Wang, P., Wang, Y., Li, Z., Xin, J., Liu, J., and Chen, H.: Aerosol optical depth over the Tibetan Plateau and its relation to aerosols over the Taklimakan Desert, Geophys. Res. Lett., 35, L16804, https://doi.org/10.1029/2008gl034981, 2008.
Xia, X., Min, J., Shen, F., Wang, Y., and Yang, C.: Aerosol Data Assimilation Using Data from Fengyun-3A and MODIS: Application to a Dust Storm over East Asia in 2011, Adv. Atmos. Sci., 36, 1–14, https://doi.org/10.1007/s00376-018-8075-9, 2019.
Xia, X., Min, J., Shen, F., Wang, Y., Xu, D., Yang, C., and Zhang, P.: Aerosol data assimilation using data from Fengyun-4A, a next-generation geostationary meteorological satellite, Atmos. Environ., 237, 117695, https://doi.org/10.1016/j.atmosenv.2020.117695, 2020.
Xu, B., Cao, J., Hansen, J., Yao, T., Joswia, D. R., Wang, N., Wu, G., Wang, M., Zhao, H., Yang, W., Liu, X., and He, J.: Black soot and the survival of Tibetan glaciers, P. Natl. Acad. Sci. USA, 106, 22114–22118, https://doi.org/10.1073/pnas.0910444106, 2009.
Xu, C., Ma, Y. M., Panday, A., Cong, Z. Y., Yang, K., Zhu, Z. K., Wang, J. M., Amatya, P. M., and Zhao, L.: Similarities and differences of aerosol optical properties between southern and northern sides of the Himalayas, Atmos. Chem. Phys., 14, 3133–3149, https://doi.org/10.5194/acp-14-3133-2014, 2014.
Yang, J., Kang, S., Ji, Z., and Chen, D.: Modeling the Origin of Anthropogenic Black Carbon and Its Climatic Effect Over the Tibetan Plateau and Surrounding Regions, J. Geophys. Res.-Atmos., 123, 671–692, https://doi.org/10.1002/2017jd027282, 2018.
Yang, K., He, J., Tang, W., Qin, J., and Cheng, C. C. K.: On downward shortwave and longwave radiations over high altitude regions: Observation and modeling in the Tibetan Plateau, Agr. Forest Meteorol., 150, 38–46, https://doi.org/10.1016/j.agrformet.2009.08.004, 2010.
Yao, T., Thompson, L., Yang, W., Yu, W., Gao, Y., Guo, X., Yang, X., Duan, K., Zhao, H., Xu, B., Pu, J., Lu, A., Xiang, Y., Kattel, D. B., and Joswiak, D.: Different glacier status with atmospheric circulations in Tibetan Plateau and surroundings, Nat. Clim. Change, 2, 663–667, https://doi.org/10.1038/nclimate1580, 2012.
Yao, T., Wu, F., Ding, L., Sun, J., Zhu, L., Piao, S., Deng, T., Ni, X., Zheng, H., and Ouyang, H.: Multispherical interactions and their effects on the Tibetan Plateau's earth system: a review of the recent researches, Nat. Sci. Rev., 2, 468–488, https://doi.org/10.1093/nsr/nwv070, 2015.
Yin, X., Dai, T., Schutgens, N. A. J., Goto, D., Nakajima, T., and Shi, G.: Effects of data assimilation on the global aerosol key optical properties simulations, Atmos. Res., 178, 175–186, https://doi.org/10.1016/j.atmosres.2016.03.016, 2016.
Yoshida, M., Kikuchi, M., Nagao, T. M., Murakami, H., Nomaki, T., and Higurashi, A.: Common Retrieval of Aerosol Properties for Imaging Satellite Sensors, J. Meteorol. Soc. Jpn., 96B, 193–209, https://doi.org/10.2151/jmsj.2018-039, 2018.
You, C., Xu, C., Xu, B., Zhao, H., and Song, L.: Levoglucosan evidence for biomass burning records over Tibetan glaciers, Environ. Pollut., 216, 173–181, https://doi.org/10.1016/j.envpol.2016.05.074, 2016.
Yu, H. B., Dickinson, R. E., Chin, M., Kaufman, Y. J., Holben, B. N., Geogdzhayev, I. V., and Mishchenko, M. I.: Annual cycle of global distributions of aerosol optical depth from integration of MODIS retrievals and GOCART model simulations, J. Geophys. Res.-Atmos., 108, 4128, https://doi.org/10.1029/2002jd002717, 2003.
Yumimoto, K. and Takemura, T.: Direct radiative effect of aerosols estimated using ensemble-based data assimilation in a global aerosol climate model, Geophy. Res. Lett., 38, L21802, https://doi.org/10.1029/2011gl049258, 2011.
Yumimoto, K., Nagao, T. M., Kikuchi, M., Sekiyama, T. T., Murakami, H., Tanaka, T. Y., Ogi, A., Irie, H., Khatri, P., Okumura, H., Arai, K., Morino, I., Uchino, O., and Maki, T.: Aerosol data assimilation using data from Himawari-8, a next-generation geostationary meteorological satellite, Geophys. Res. Lett., 43, 5886–5894, https://doi.org/10.1002/2016gl069298, 2016.
Zaveri, R. A. and Peters, L. K.: A new lumped structure photochemical mechanism for large-scale applications, J. Geophys. Res.-Atmos., 104, 30387–30415, https://doi.org/10.1029/1999jd900876, 1999.
Zaveri, R. A., Easter, R. C., Fast, J. D., and Peters, L. K.: Model for Simulating Aerosol Interactions and Chemistry (MOSAIC), J. Geophys. Res.-Atmos., 113, D13204, https://doi.org/10.1029/2007jd008782, 2008.
Zhang, J. and Reid, J. S.: MODIS aerosol product analysis for data assimilation: Assessment of over-ocean level 2 aerosol optical thickness retrievals, J. Geophys. Res.-Atmos., 111, D22207, https://doi.org/10.1029/2005jd006898, 2006.
Zhang, J., Reid, J. S., Westphal, D. L., Baker, N. L., and Hyer, E. J.: A system for operational aerosol optical depth data assimilation over global oceans, J. Geophys. Res.-Atmos., 113, D10208, https://doi.org/10.1029/2007jd009065, 2008.
Zhang, J., Campbell, J. R., Reid, J. S., Westphal, D. L., Baker, N. L., Campbell, W. F., and Hyer, E. J.: Evaluating the impact of assimilating CALIOP-derived aerosol extinction profiles on a global mass transport model, Geophys. Res. Lett., 38, L14801, https://doi.org/10.1029/2011gl047737, 2011.
Zhang, J., Xia, X., Shi, H., Zong, X., and Li, J.: Radiation and aerosol measurements over the Tibetan Plateau during the Asian summer monsoon period, Atmos. Pollut. Res., 11, 1543–1551, https://doi.org/10.1016/j.apr.2020.06.017, 2020.
Zhang, M., Zhao, C., Cong, Z., Du, Q., Xu, M., Chen, Y., Chen, M., Li, R., Fu, Y., Zhong, L., Kang, S., Zhao, D., and Yang, Y.: Impact of topography on black carbon transport to the southern Tibetan Plateau during the pre-monsoon season and its climatic implication, Atmos. Chem. Phys., 20, 5923–5943, https://doi.org/10.5194/acp-20-5923-2020, 2020.
Zhang, X., Liang, S., Wild, M., and Jiang, B.: Analysis of surface incident shortwave radiation from four satellite products, Remote Sens. Environ., 165, 186–202, https://doi.org/10.1016/j.rse.2015.05.015, 2015.
Zhao, M., Dai, T., Wang, H., Bao, Q., Liu, Y., and Shi, G.: Modelling study on the source contribution to aerosol over the Tibetan Plateau, Int. J. Climatol., 41, 3247–3265, https://doi.org/10.1002/joc.7017, 2021.
Zheng, J., Hu, M., Du, Z. F., Shang, D. J., Gong, Z. H., Qin, Y. H., Fang, J. Y., Gu, F. T., Li, M. R., Peng, J. F., Li, J., Zhang, Y. Q., Huang, X. F., He, L. Y., Wu, Y. S., and Guo, S.: Influence of biomass burning from South Asia at a high-altitude mountain receptor site in China, Atmos. Chem. Phys., 17, 6853–6864, https://doi.org/10.5194/acp-17-6853-2017, 2017.
- Abstract
- Introduction
- Model and assimilation system
- Observation data
- Results
- Discussions
- Conclusions
- Appendix A: Statistical criteria
- Data availability
- Author contributions
- Competing interests
- Disclaimer
- Special issue statement
- Acknowledgements
- Financial support
- Review statement
- References
- Supplement