the Creative Commons Attribution 4.0 License.
the Creative Commons Attribution 4.0 License.
 | 06 Feb 2024
Technical note: Multi-year changes in the Brewer–Dobson circulation from Halogen Occultation Experiment (HALOE) methane
This study makes use of Halogen Occultation Experiment (HALOE) methane (CH4) in a search for multi-year changes in the Brewer–Dobson circulation (BDC). Changes in CH4 are determined for three successive 5-year time spans from 1992 to 2005, and there are significant differences between them. There is a clear separation between the changes in the Northern Hemisphere near 30 hPa and at the transition of the shallow and deep branches of the BDC. The CH4 changes are positive and large in the shallow branch following the eruption of Pinatubo, but they then decrease and agree with tropospheric trends in the late 1990s and early 2000s. CH4 decreases in the upper part of the deep branch from 1992 to 1997 or following the eruption of Pinatubo. CH4 continues to decrease in the deep branch in the late 1990s but then increases in the early 2000s, although those changes are small compared with the seasonal and interannual variations of CH4. Multi-year changes are due, in part, to wave forcings during the El Niño–Southern Oscillation (ENSO) of 1997–1998 and beyond and to episodic, sudden stratospheric warming (SSW) events during both time spans. It is concluded that time series of HALOE CH4 provide effective tracer diagnostics for studies of the nature of the BDC from 1992 to 2005.
- Article
(4478 KB) - Full-text XML
- BibTeX
- EndNote


Global-scale stratospheric transport is characterized in each hemisphere by a seasonal Brewer–Dobson circulation (BDC), consisting of upward transport in the tropics, poleward transport to higher latitudes, and descent in the polar vortex region (e.g., Butchart, 2014). Model studies indicate that there are also multi-year changes in the BDC in response to increases in greenhouse gases (GHG) and to dynamical forcings during El Niño–Southern Oscillation (ENSO) events, but the effects of those forcings may differ within the shallow (lower) and deep (upper) regions of the BDC. Remsberg (2015) reported that the distributions of methane (CH4) from the Halogen Occultation Experiment (HALOE) provide tracer diagnostics for changes in the BDC. The present study is a refinement of his initial analysis and gives some insight into the mechanisms for changes in the BDC. Section 2 is a brief description of the methane data and the analysis approach for them. Section 3 presents the results of the analyses in terms of changes in the distribution of CH4 for three successive 5-year time spans. Qualitative attributions are also considered for those changes. Section 4 summarizes the findings from this exploratory study.
HALOE obtained sunrise (SR) and sunset (SS) occultation measurements across latitude zones throughout its mission from October 1991 to November 2005. The present study considers zonal averages of CH4 for nine latitude zones and at 12 pressure levels (0.4 to 50 hPa) for a total of 108 separate time series. A minimum of five profiles gives representative zonal averages for each latitude zone; averages are based on many more profiles in most instances. Figure 1 shows example time series from zonal averages of the SR and SS measurements at specific pressure levels and in three different latitude zones. Figure 1a is the time series for the 10 hPa level at 30∘ N latitude, and there is a clear quasi-biennial oscillation (QBO) signal in the data. Figure 1b is for 10 hPa at 30∘ S, where there is a combination of annual (AO), semi-annual (SAO), and QBO signals. One can also see that seasonal and interannual variations are much larger than the longer-term changes. Figure 1c is for 2 hPa at 45∘ N, where CH4 decreases gradually in the early to middle 1990s but where it also has large amplitudes in early 2002 and 2004.
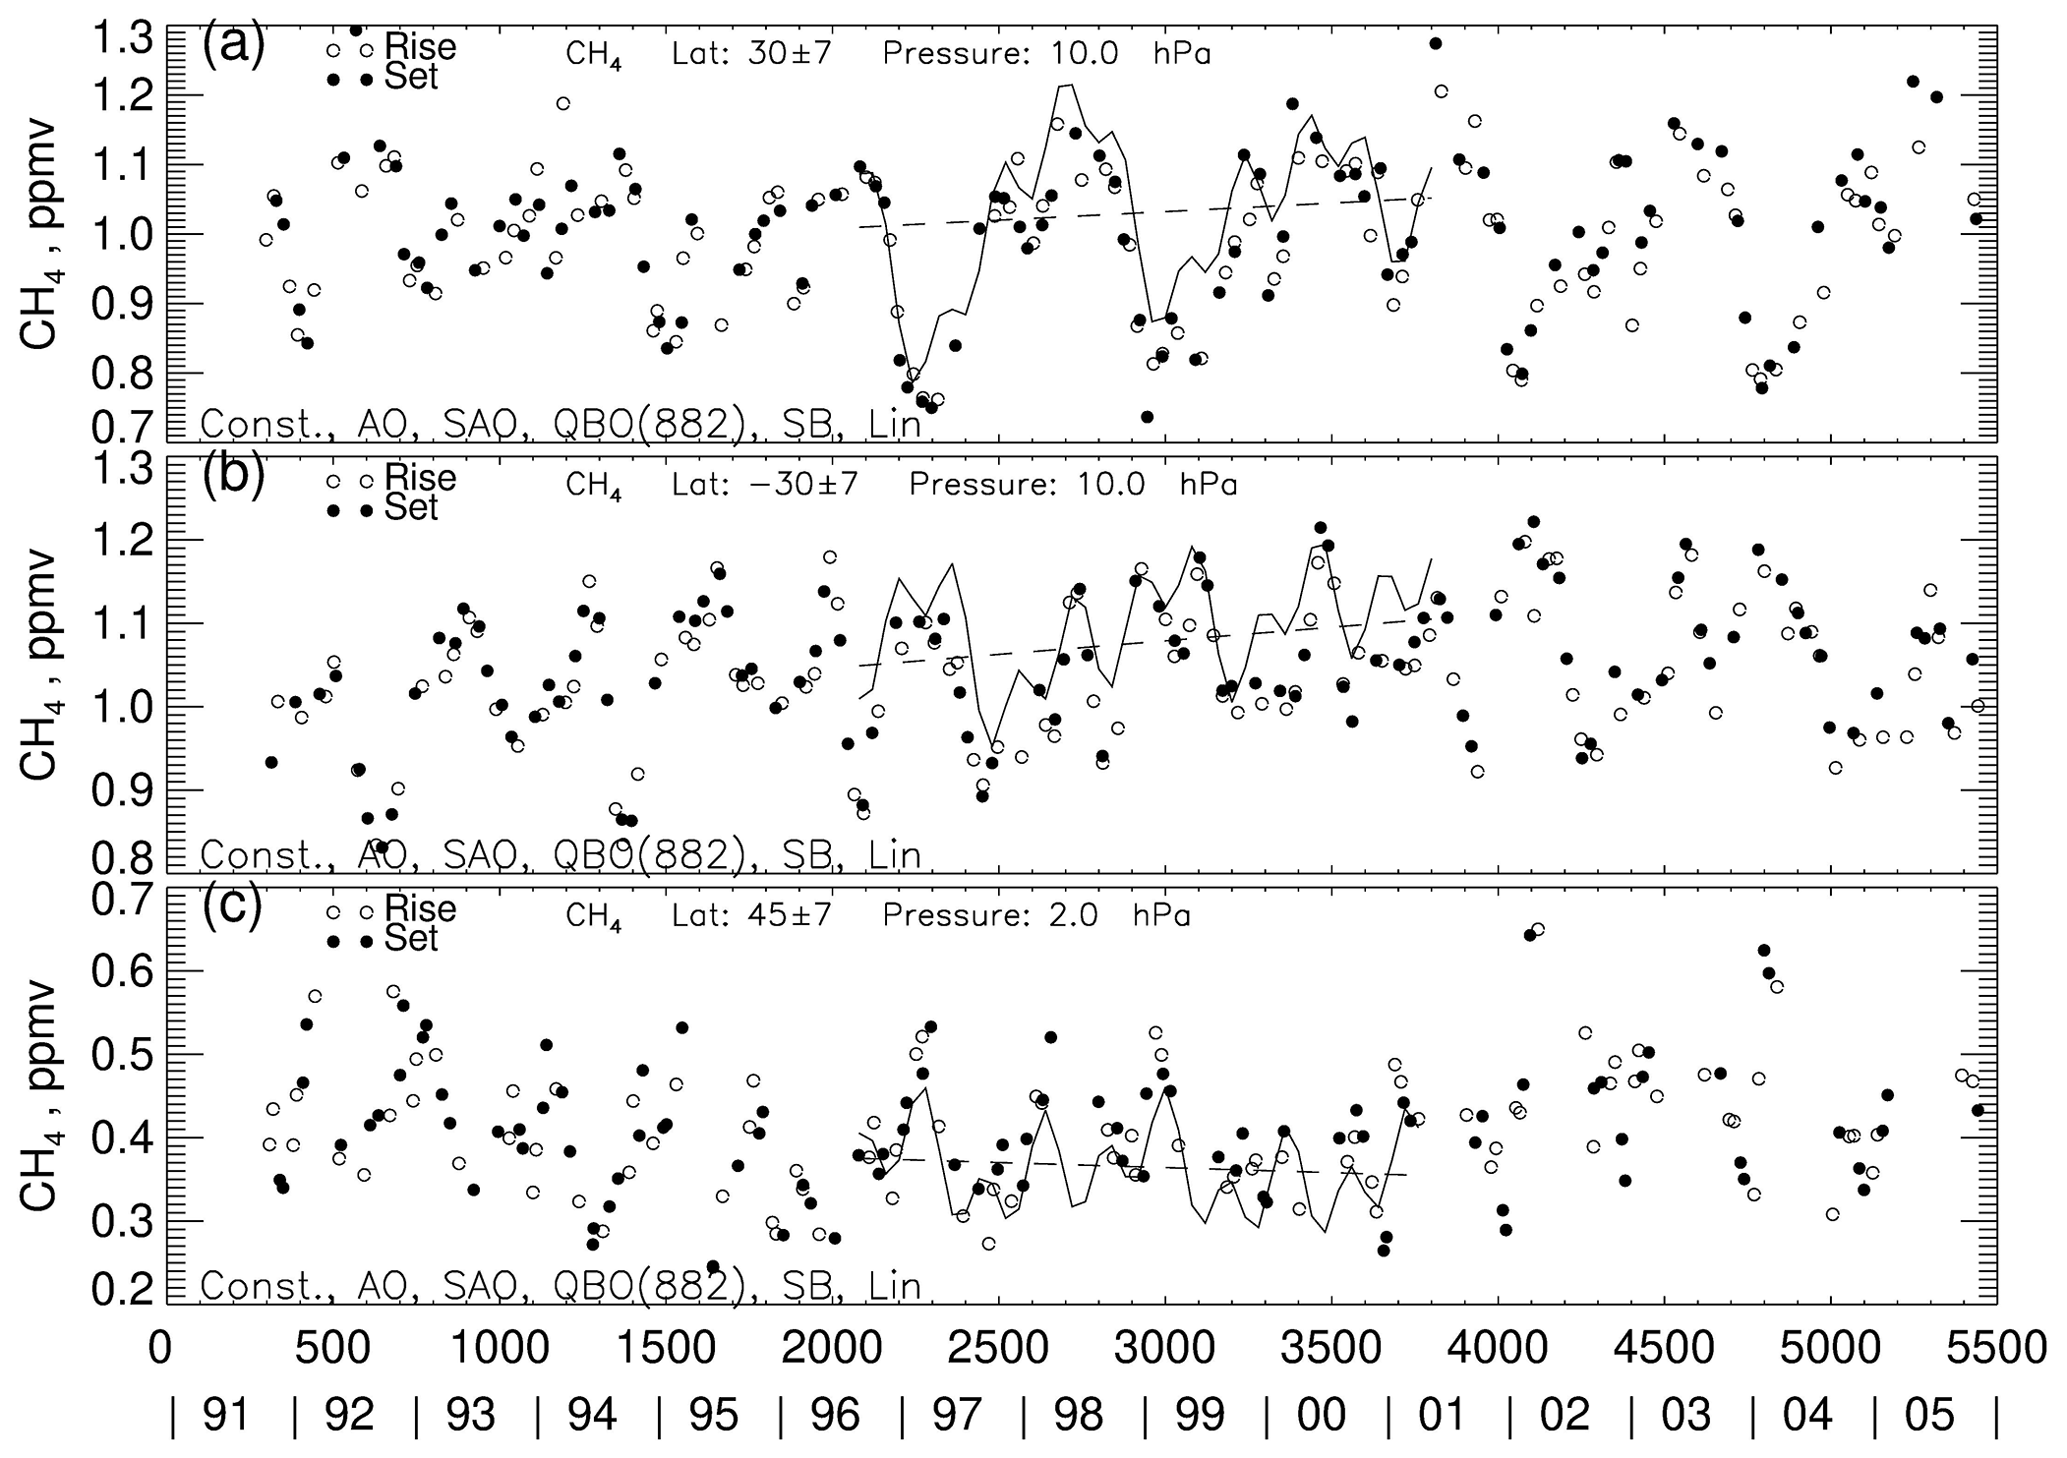
Figure 1Time series of HALOE CH4 at (a) 30∘ N and 10 hPa, (b) 30∘ S and 10 hPa, and (c) 45∘ N and 2 hPa. MLR fit for July 1996 through June 2001 is the solid curve, and its linear trend is the dashed line. Day numbers on the abscissa are from 1 January 1991. Model terms are listed in the bottom left. The Pinatubo eruption occurred in June 1991.
The analysis of CH4 for this study is in the manner of Remsberg (2015) with the following modifications. The nine latitude zones are from 60∘ S to 60∘ N with a spacing of 15∘ and no overlap. The latitude bins are a bit narrower than before (15∘ versus 20∘) but still provide representative sampling, even at ±45∘ latitude from 2000 to 2005, when the samples from HALOE are limited. To look for secular trends in CH4, multiple linear regression (MLR) analysis was applied to the CH4 time series, as separated into three 5-year time spans that overlap by 1 year (July 1992 to June 1997, July 1996 to June 2001, and July 2000 to June 2005). The beginning and end months of July and June, respectively, were selected to avoid large excursions in CH4 at the end points of time series for the Northern Hemisphere during the dynamically active winter season. Data prior to July 1992 were not used to avoid issues related to variable solar lock-down procedures for the HALOE sun sensor and because of significant extinction from interfering aerosols following the Pinatubo eruption of June 1991. The analyses also do not include the period after June 2005, when HALOE operations were limited.
An initial MLR analysis was applied to the 13-year time span of the HALOE measurements for a range of pressures and latitudes but using only AO and SAO terms. Time series residuals from those runs were analyzed for interannual cycles, yielding significant terms with periods of 882 d (∼ 29 months or QBO-like) and of 690 d (22.6 months or sub-biennial (SB)). Those two terms were highly significant for many of the latitude–pressure time series so they were included along with the seasonal terms for the MLR model. The 5-year (or 60-month) time span is equivalent to two complete QBO cycles and avoids biases in the MLR trends due to that periodic term. A biennial (718 d) term was also indicated for the subtropics, but it was not uniformly present elsewhere and was not retained for the model. A linear term completes the final MLR model; the analyses also correct for lag-1 autoregressive (AR1) effects. The MLR model fit to the data points is shown by the oscillating solid curve for July 1996 to June 2001 in each panel of Fig. 1, and the combination of the constant and linear terms is the dashed line. One can see that the seasonal and interannual variations have large amplitudes compared with the overall 5-year trend line, such that even minor changes from year to year can affect the linear changes. Although the MLR fits and trends are based on analyzed AR1 values for each case, the MLR curves in Fig. 1 are based on AR1 = 0 and give maximum amplitudes for the periodic terms.
The sensitivity of the trend coefficient to the approximate QBO term of the MLR fit was determined for Fig. 1a (30∘ N, 10 hPa), where a QBO cycle shows clearly. Specifically, the length of the QBO cycle was altered (28 months versus 29.5 months), as was the length of the time span for the MLR analysis (58 months rather than 60 months). The resulting trend coefficients in each case differ by less than 6 % from the one of Fig. 1a. Figure 1c focuses on the upper stratosphere, where CH4 decreases from 1992 to 1997 or from 1 year after the Pinatubo eruption. The 5-year trend is less negative from 1996 to 2001 and then is positive from 2000 to 2005, punctuated by two winter maximums in early 2002 and 2004.
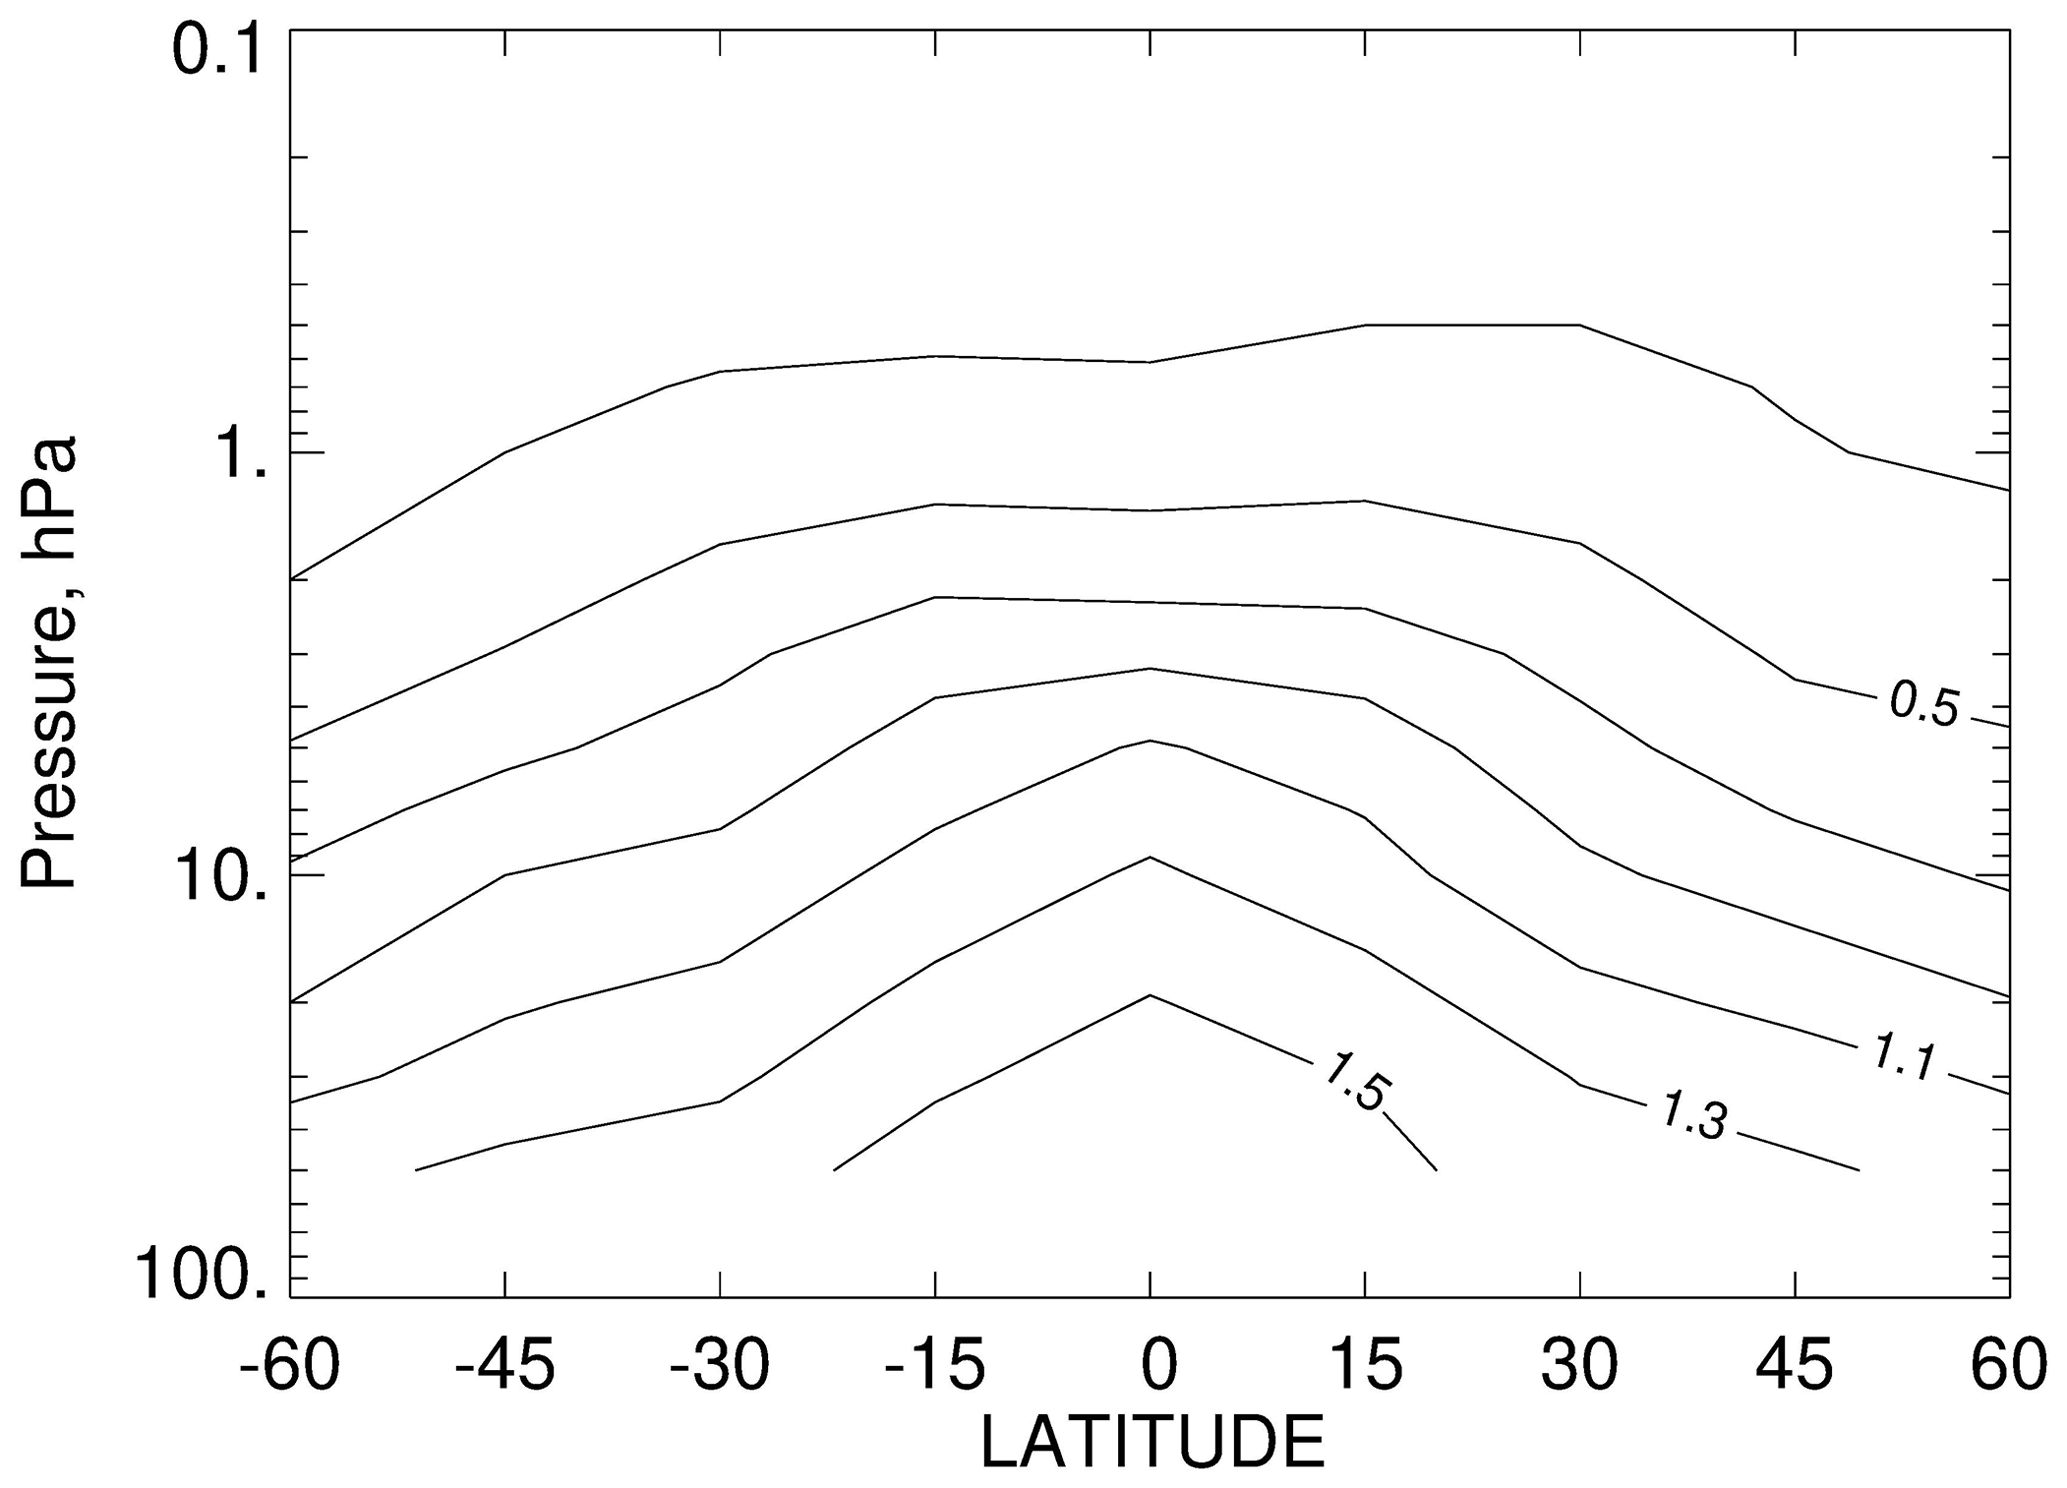
The distribution of the average CH4 (its constant term) is shown in Figure 2 for the time span of July 1996 to June 2001. Tropical entry-level values extend upward and are transported poleward in each hemisphere. CH4 decreases with altitude and latitude due to the relatively slow chemical conversion of CH4 to water vapor (H2O) and molecular hydrogen (H2) in the upper stratosphere (Brasseur and Solomon, 2005). That decay of CH4 is nearly symmetric between the two hemispheres. The primary purpose of Fig. 2 is to show the vertical and meridional gradients of CH4 that are acted upon by the BDC, generically considered to be hemispheric net circulations composed of tropical ascent, poleward transport, and descent in the polar vortex region. Although the CH4 distributions for the other two 5-year time spans are like that of Fig. 2, there are small but distinct differences in the 5-year changes in CH4 for the three successive time spans.
Distributions of the linear terms (percentage change per 5-year period) from the zonally averaged CH4 data are shown and discussed in Sect. 3 for each of the three periods of July 1992 to June 1997, July 1996 to June 2001, and July 2000 to June 2005. Notably, there is good continuity for the trends with pressure and latitude, indicating that each distribution is meaningful and related physically to multi-year changes for the large-scale BDC. Mechanisms giving rise to the changing CH4 are related to external (volcanic) and/or wave forcings followed by radiative and/or chemical relaxations therefrom. The changes in CH4 are also compared with estimates of the stratospheric net circulation that have been diagnosed and reported by other researchers.
3.1 July 1992 to June 1997
Figure 3 shows that CH4 decreased in the upper stratosphere and lower mesosphere from July 1992 to June 1997 or from 1 year after the Pinatubo eruption of June 1991. The shading indicates where the trends are robust, with the dark shading having a confidence interval (CI) of greater than 90 % and the light shading having a CI between 70 % and 90 %. Note that there are small, positive trends in CH4 within the lower stratosphere due to its tropospheric trends of ∼ 0.4 % per year (or 2.0 % for this 5-year period) (Dlugokencky et al., 2009). Changes of the CH4 distributions across the 5-year time span represent where there were accelerations of the BDC (positive changes of more than the tropospheric trends of ∼ 2.0 %) or decelerations of the BDC (changes of less than ∼ 2.0 %).
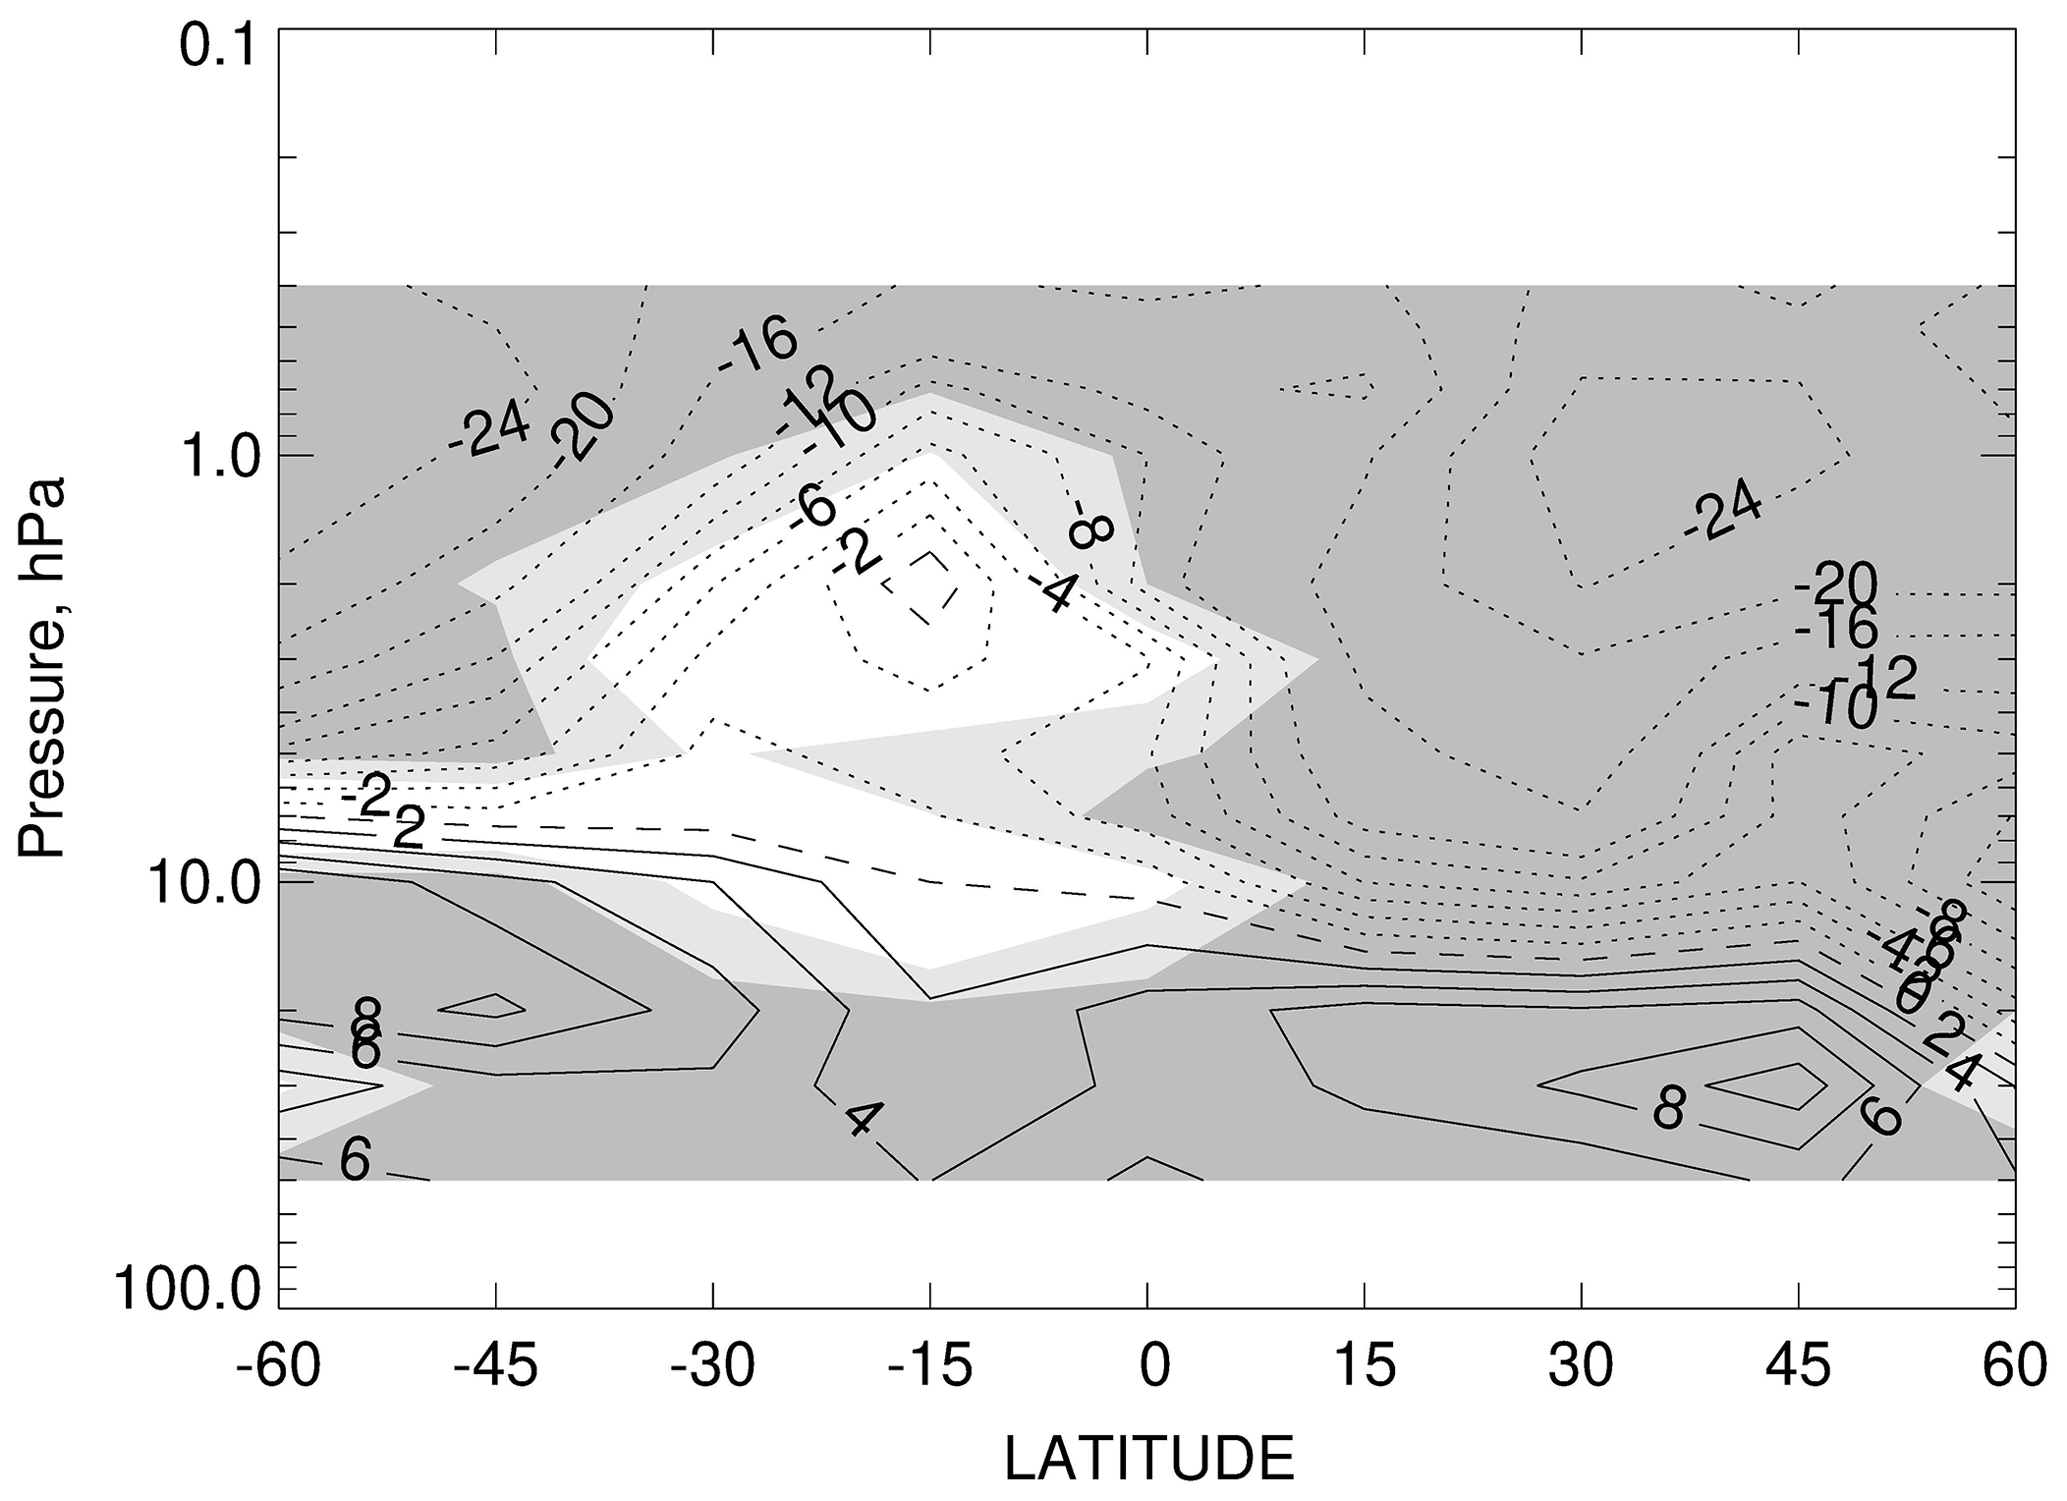
Figure 3Changes in CH4 for July 1992 through June 1997 (in percentage per 5-year period); positive changes are solid, negative changes are dotted, and zero is dashed. Contour interval is 2 % within ±12 % but 4 % outside that range. Dark shading shows where the confidence interval (CI) for the trends is greater than 90 %, and light shading shows where the CI is between 70 % and 90 %.
Negative changes in CH4 in the upper regions of Fig. 3 imply that there was an overall weakening of the deep branch (above the ∼ 20 hPa level) of the stratospheric BDC during this 5-year period. Those negative changes are more pronounced at middle latitudes of the Northern Hemisphere than of the Southern Hemisphere, indicating that there was ascent of CH4 within the deep branch of the BDC in the northern subtropics due to external forcings from the Pinatubo eruption near 15∘ N followed by a relaxation toward lower values thereafter. In fact, separate zonal-mean cross-sections of HALOE CH4 (not shown) reveal that the 0.8 ppmv contour of CH4 occurred at ∼ 4 hPa in November 1991 but had risen to ∼ 2 hPa by February 1992, most likely as a response of the BDC to winter wave forcings (e.g., Russell et al., 1999). Thereafter, the CH4 values that had been lofted to higher altitudes underwent a gradual decline over time. Sudden stratospheric warming (SSW) events also tend to accelerate the deep branch of the BDC and mix middle-latitude and polar air; that mixing flattens the contours of zonal average CH4 mixing ratios. However, there were no SSW events in the Northern Hemisphere from 1992 to 1997 (Choi et al., 2019).
A more traditional indicator of changes in the BDC is stratospheric age of air (AoA), where negative AoA indicates acceleration and positive AoA implies a deceleration of the BDC. Pitari et al. (2016) estimated that AoA decreased in the middle to upper stratosphere by ∼ 0.5 to 0.7 years during 1991–1992, due mainly to ascent following the eruption of Pinatubo. Figure 3 indicates a decline of CH4 (and presumably an increase in AoA) from July 1992 onward. Methane is not a perfect tracer, however, as it has a chemical lifetime as short as only a few months at 45 km (∼ 1.5 hPa), then lengthening to 6 months and longer at 55 km and above and at 40 km and below (Brasseur and Solomon, 2005). The relatively short lifetime of CH4 at 1.5 hPa means that even the seasonal variations of CH4 are dampened at that level. The near-zero changes for CH4 near 15∘ S and 2 hPa in Fig. 3 may imply that there was still some transport of CH4 to that region from the tropics after July 1992.
The 5-year changes in Fig. 3 also indicate that there was an accumulation of CH4 at ∼ 20 to 30 hPa at the middle latitudes of both hemispheres during this period, in reasonable accord with a net poleward transport of tropical CH4 at the top of the shallow (below the ∼ 20 hPa level) branch of the BDC. The tropical trend of 3 % to 4 % at 20 to 30 hPa is half that at middle latitudes (8 %), although it is still larger than the tropospheric trends for CH4 of ∼ 2.0 % for this 5-year period.
Figure 4 gives more detail about the effects of the Pinatubo eruption on CH4 in the lower stratosphere. Figure 4a is for 15∘ N and 50 hPa and shows an initial increase in CH4 in 1991 to the middle of 1992, followed by decreasing values through 1993. HALOE CH4 values are of the order of 1.55 ppmv in 1992, declining to 1.45 ppmv in 1993, and then increasing again. Independent CH4 measurements at ground level are between 1.70 and 1.75 ppmv (Dlugokencky et al., 2009). As an aside, HALOE CH4 values for SR in Fig. 4a are consistently larger than for SS. Those differences are likely due to uncorrected detector hysteresis effects for tropical SR measurements just above cloud tops; they decrease at 30 hPa and are negligible at 20 hPa. Diallo et al. (2017) reported that AoA decreased during the first 6 months following the eruption of Pinatubo due to tropical upwelling. Then, AoA increased from early 1992 to spring 1993 between 20∘ S and 30∘ N and from 20 to 27 km (∼ 50 to 15 hPa), implying a deceleration of the shallow branch of the BDC during that time. The HALOE SR and SS CH4 variations are in accord with the changes in AoA from 1991 to 1993 in the shallow branch of the BDC.
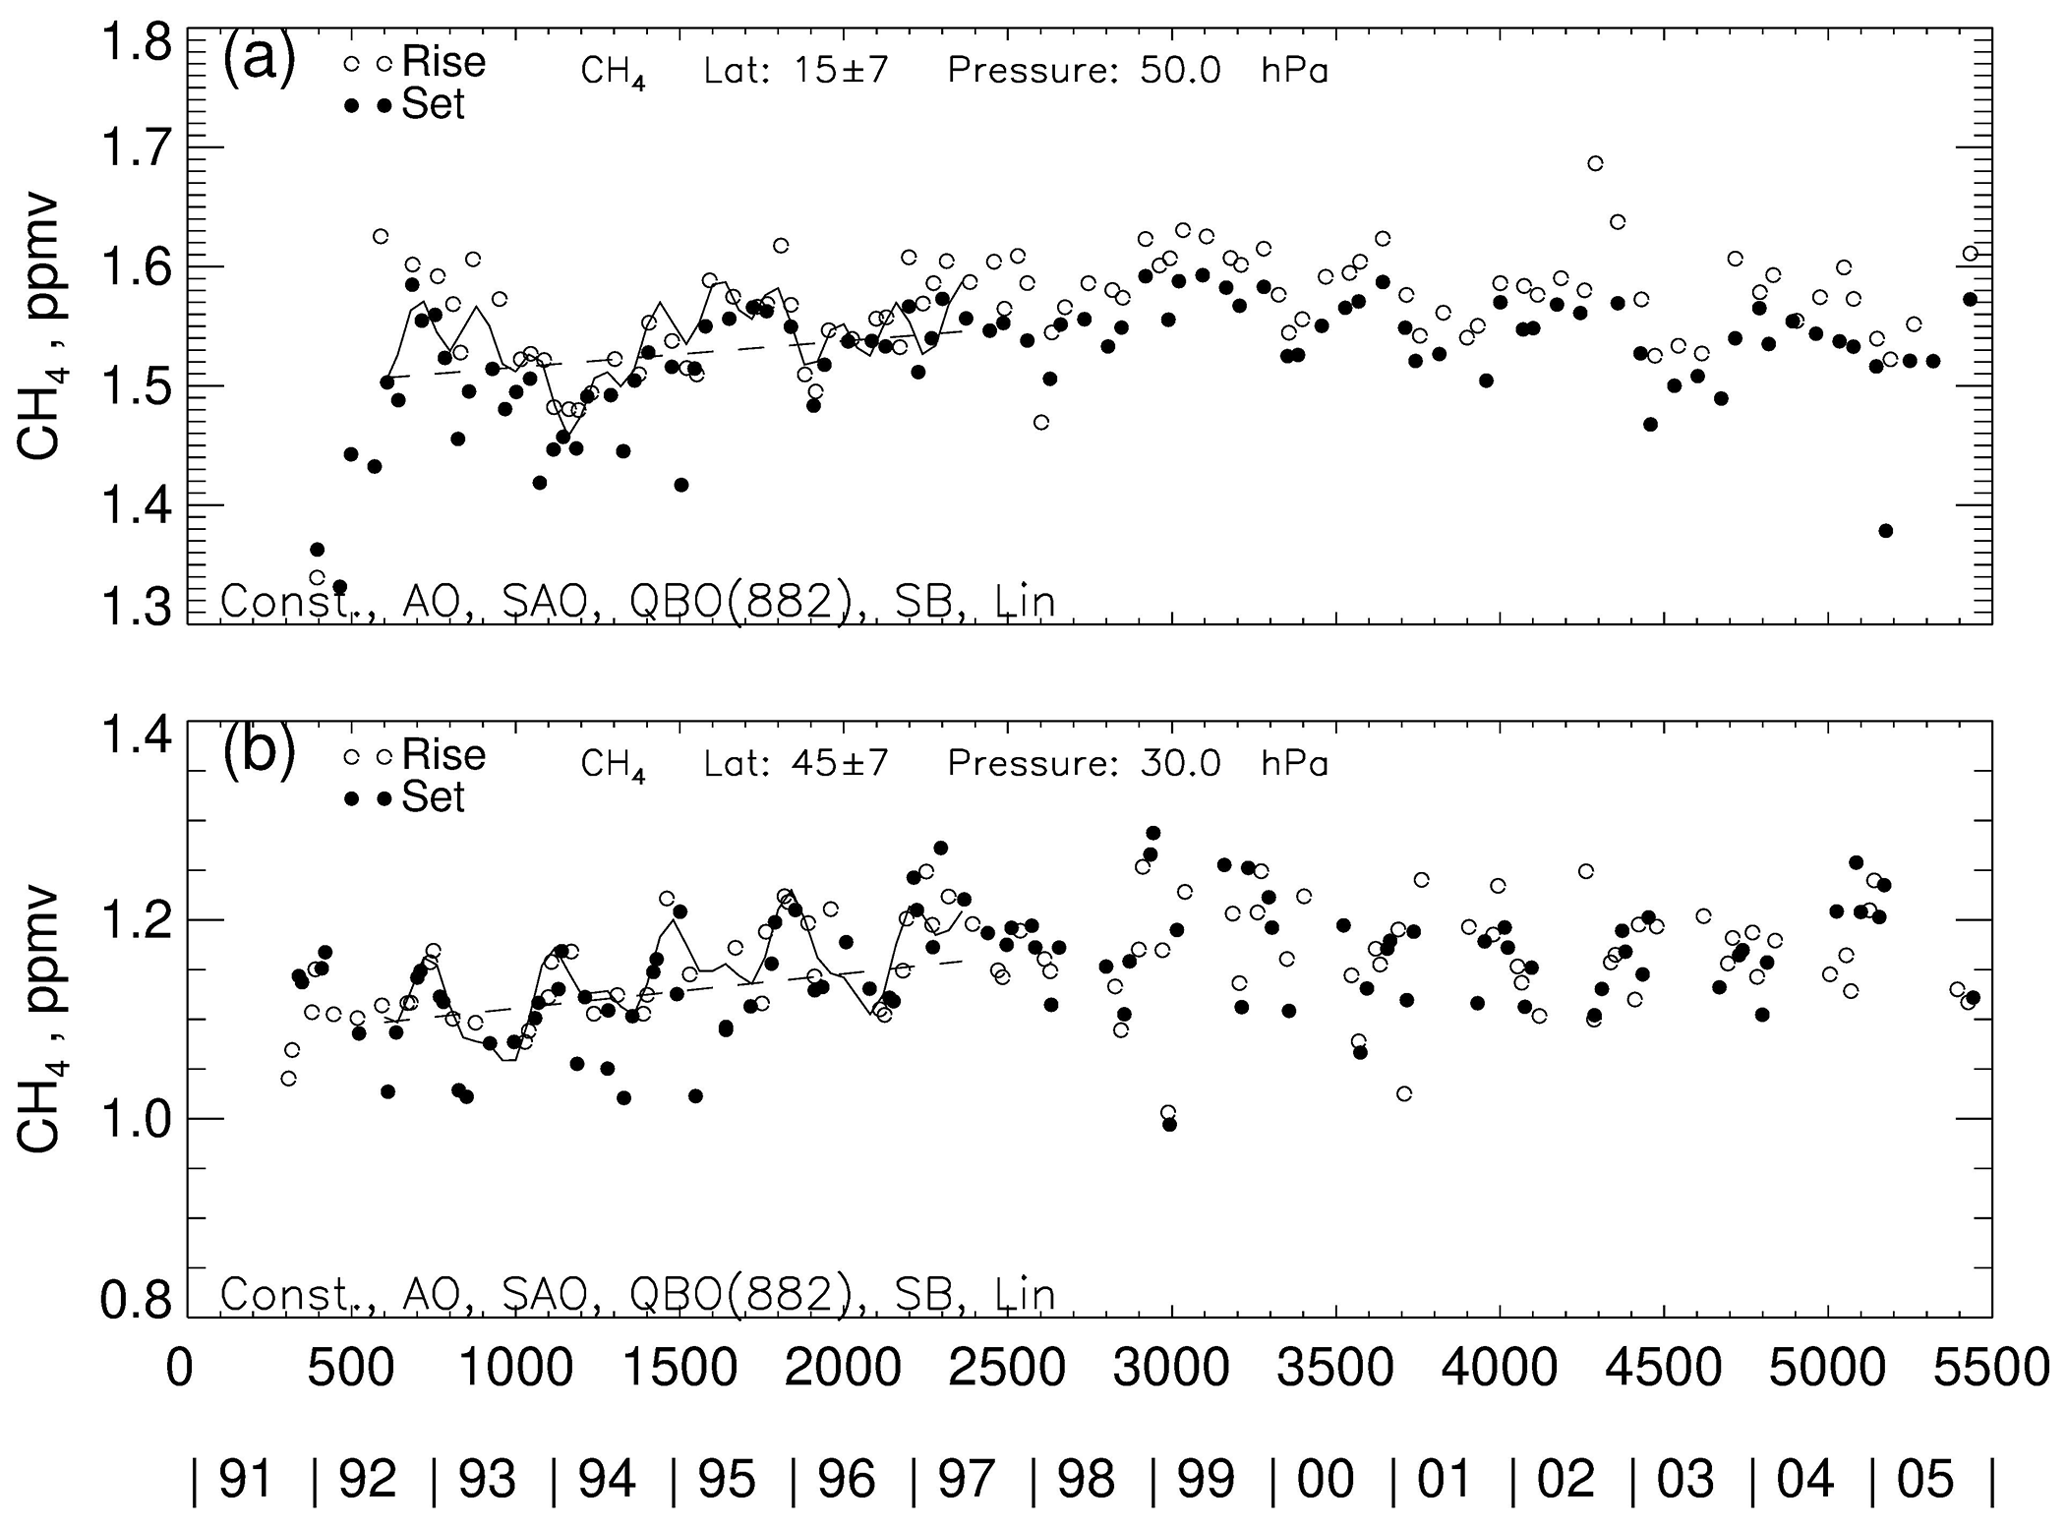
Figure 4As in Fig. 1, but panel (a) is for 15∘ N and 50 hPa, and panel (b) is for 45∘ N and 30 hPa.
Figure 4b is the HALOE CH4 time series for 45∘ N and 30 hPa, and it shows a gradual increase of CH4 for 1993 to 1997. Yet, Diallo et al. (2017) reported increases in AoA for 1993 at tropical and middle latitudes due to meridional mixing, followed by decreases in mixing and AoA through 1997. Figure 3 suggests that there was an accumulation of CH4 at middle latitudes between ∼ 20 and 30 hPa, due in part to that mixing trend. It may also be that there was an overall slowdown in the BDC during this 5-year period, which was devoid of SSW events and any enhanced descent of CH4-poor polar air plus its subsequent mixing to middle latitudes.
3.2 July 1996 to June 2001
Figure 5 shows the 5-year CH4 changes for 1996 to 2001, when there were several SSW events – on 15 December 1998, 25 February 1999, and 20 March 2000 (Choi et al., 2019). The negative trends in the upper stratosphere are smaller in the Northern Hemisphere and larger in the Southern Hemisphere than in Fig. 3, suggesting that there was tropical ascent but also increased mixing of CH4 to higher latitudes, related in part to SSW activity. Those changes are also where the chemical loss of CH4 to H2O and H2 may be a factor. It is apparent that there was greater meridional transport of CH4 from the tropics to middle latitudes and an accumulation of CH4 at ∼ 10 hPa in both hemispheres during 1996 to 2001. Those positive trends are at a level of the stratosphere where the conversion of CH4 to H2O and H2 is not as effective.
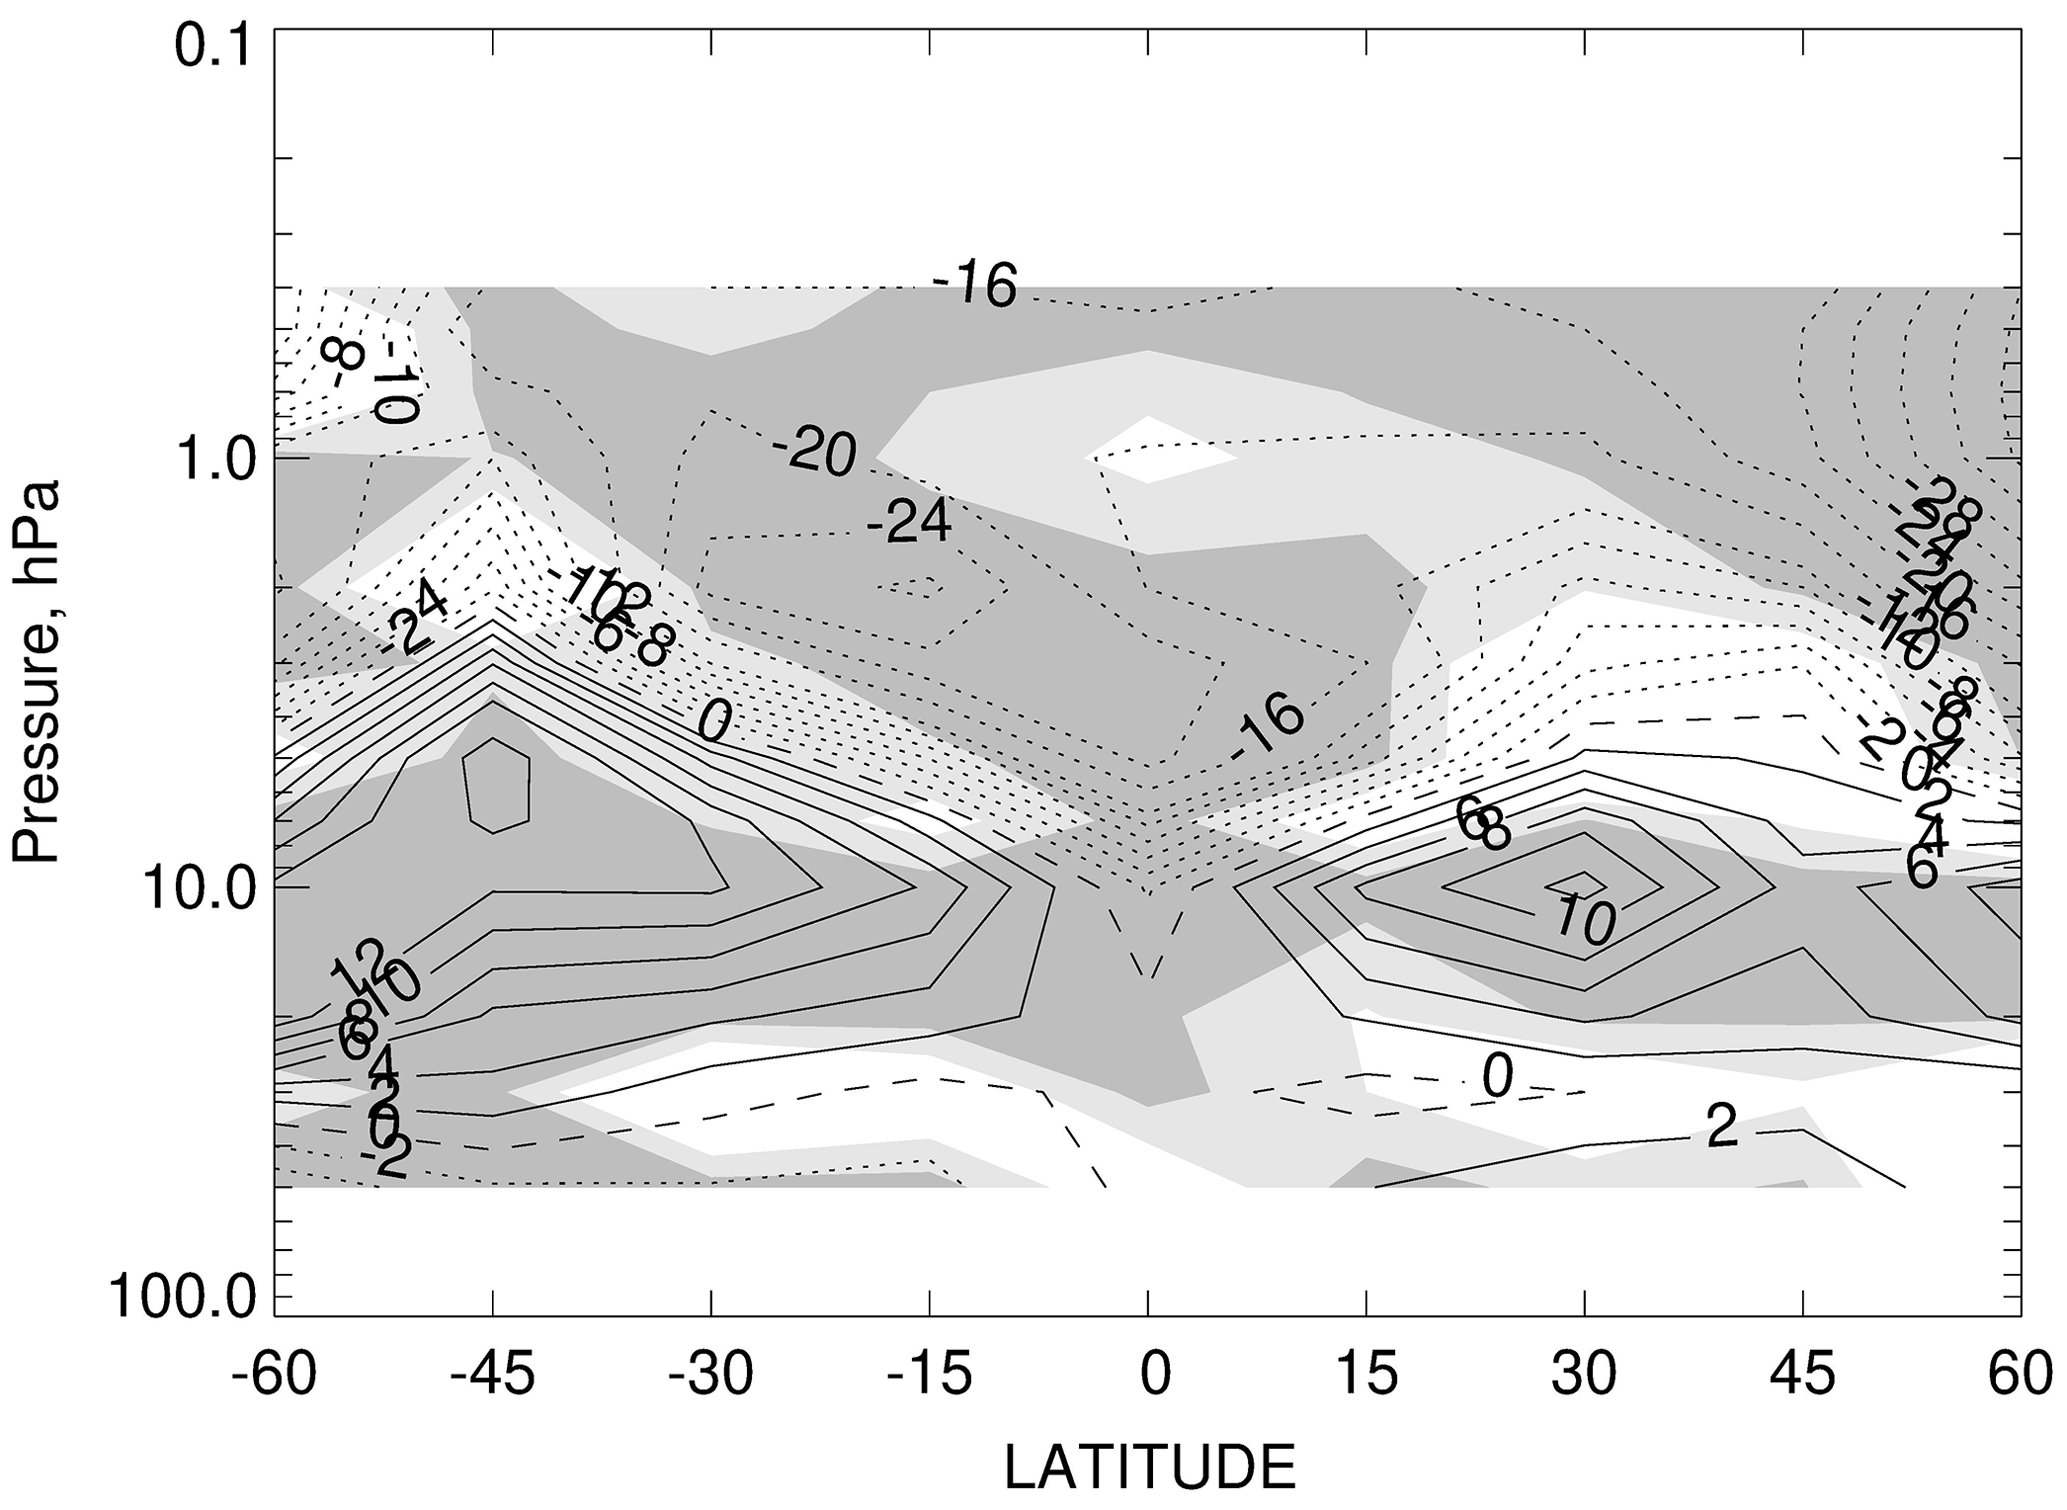
There was a major warm ENSO event in 1997–1998 that altered wave forcing effects on CH4 and for the BDC. Randel et al. (2009) and Calvo et al. (2010) reported enhanced upwelling in the tropics and an acceleration of the BDC at that time. Diallo et al. (2019) reported that ENSO leads to the overall strengthening of the shallow branch of the BDC in the extratropics. It may be that enhanced poleward transport in the shallow branch is why the CH4 changes are more nearly zero in the tropics and agree closely with tropospheric trends that were smaller after 1995 (or ∼ 1.0 % per 5-year period) (Dlugokencky et al., 2009). There is a clear separation at ∼ 30 hPa in the sign of the changes in the shallow versus the deep branch of the BDC in the Northern Hemisphere.
The 1997–1998 warm ENSO event occurred near solar minimum, for which Calvo and Marsh (2011) also found enhanced wave forcing in the middle and upper stratosphere. That activity leads to acceleration of the BDC and poleward transport of CH4 to the extratropics. Barriopedro and Calvo (2014) also found connections between ENSO and SSW events, although the exact effects depend on the relative sequence of those events. Since major SSWs within 1996–2001 occur in December 1998, February 1999, and March 2000, it is likely that they merely led to further accelerations of the BDC. As an example, Tao et al. (2015) gave details about how the SSW of 2009 led to an acceleration of the BDC. Their analyses may support the present finding of increases in CH4 in the extratropics near 10 hPa in Fig. 5. However, more focused studies of the relative roles of SSWs and ENSO on the results of Fig. 5 are beyond the scope of the present exploratory study.
3.3 July 2000 to June 2005
There was even more SSW activity in the Northern Hemisphere during the 5-year span from 2000 to 2005 (on 11 February 2001, 2 January 2002, 18 January 2003, and 7 January 2004, according to Choi et al., 2019). The distribution of changes in CH4 in Fig. 6 includes the net effect of those episodic SSW events. There was an increase in CH4 at upper altitudes, where the effect of SSWs may have also led to greater poleward transport of CH4 to higher latitudes. As before, an SSW event accelerates the deep branch of the BDC, bringing more CH4 to high altitudes and greater meridional transport to higher latitudes. At the stratopause (∼ 1 hPa) and in the lower mesosphere, even small changes in CH4 mixing ratio translate to relatively large percentage changes. Those changes are from negative to positive from Figs. 5 to 6 and are rather uniform across latitude. On the other hand, the changes near 10 hPa and at middle latitudes of the Northern Hemisphere are weaker now than in Fig. 5. Figure 1a indicates that this change may be a consequence, in part, of large seasonal amplitudes for CH4 in early 2001 and in 2005 or near the end points of the 5-year period from July 2000 to June 2005.
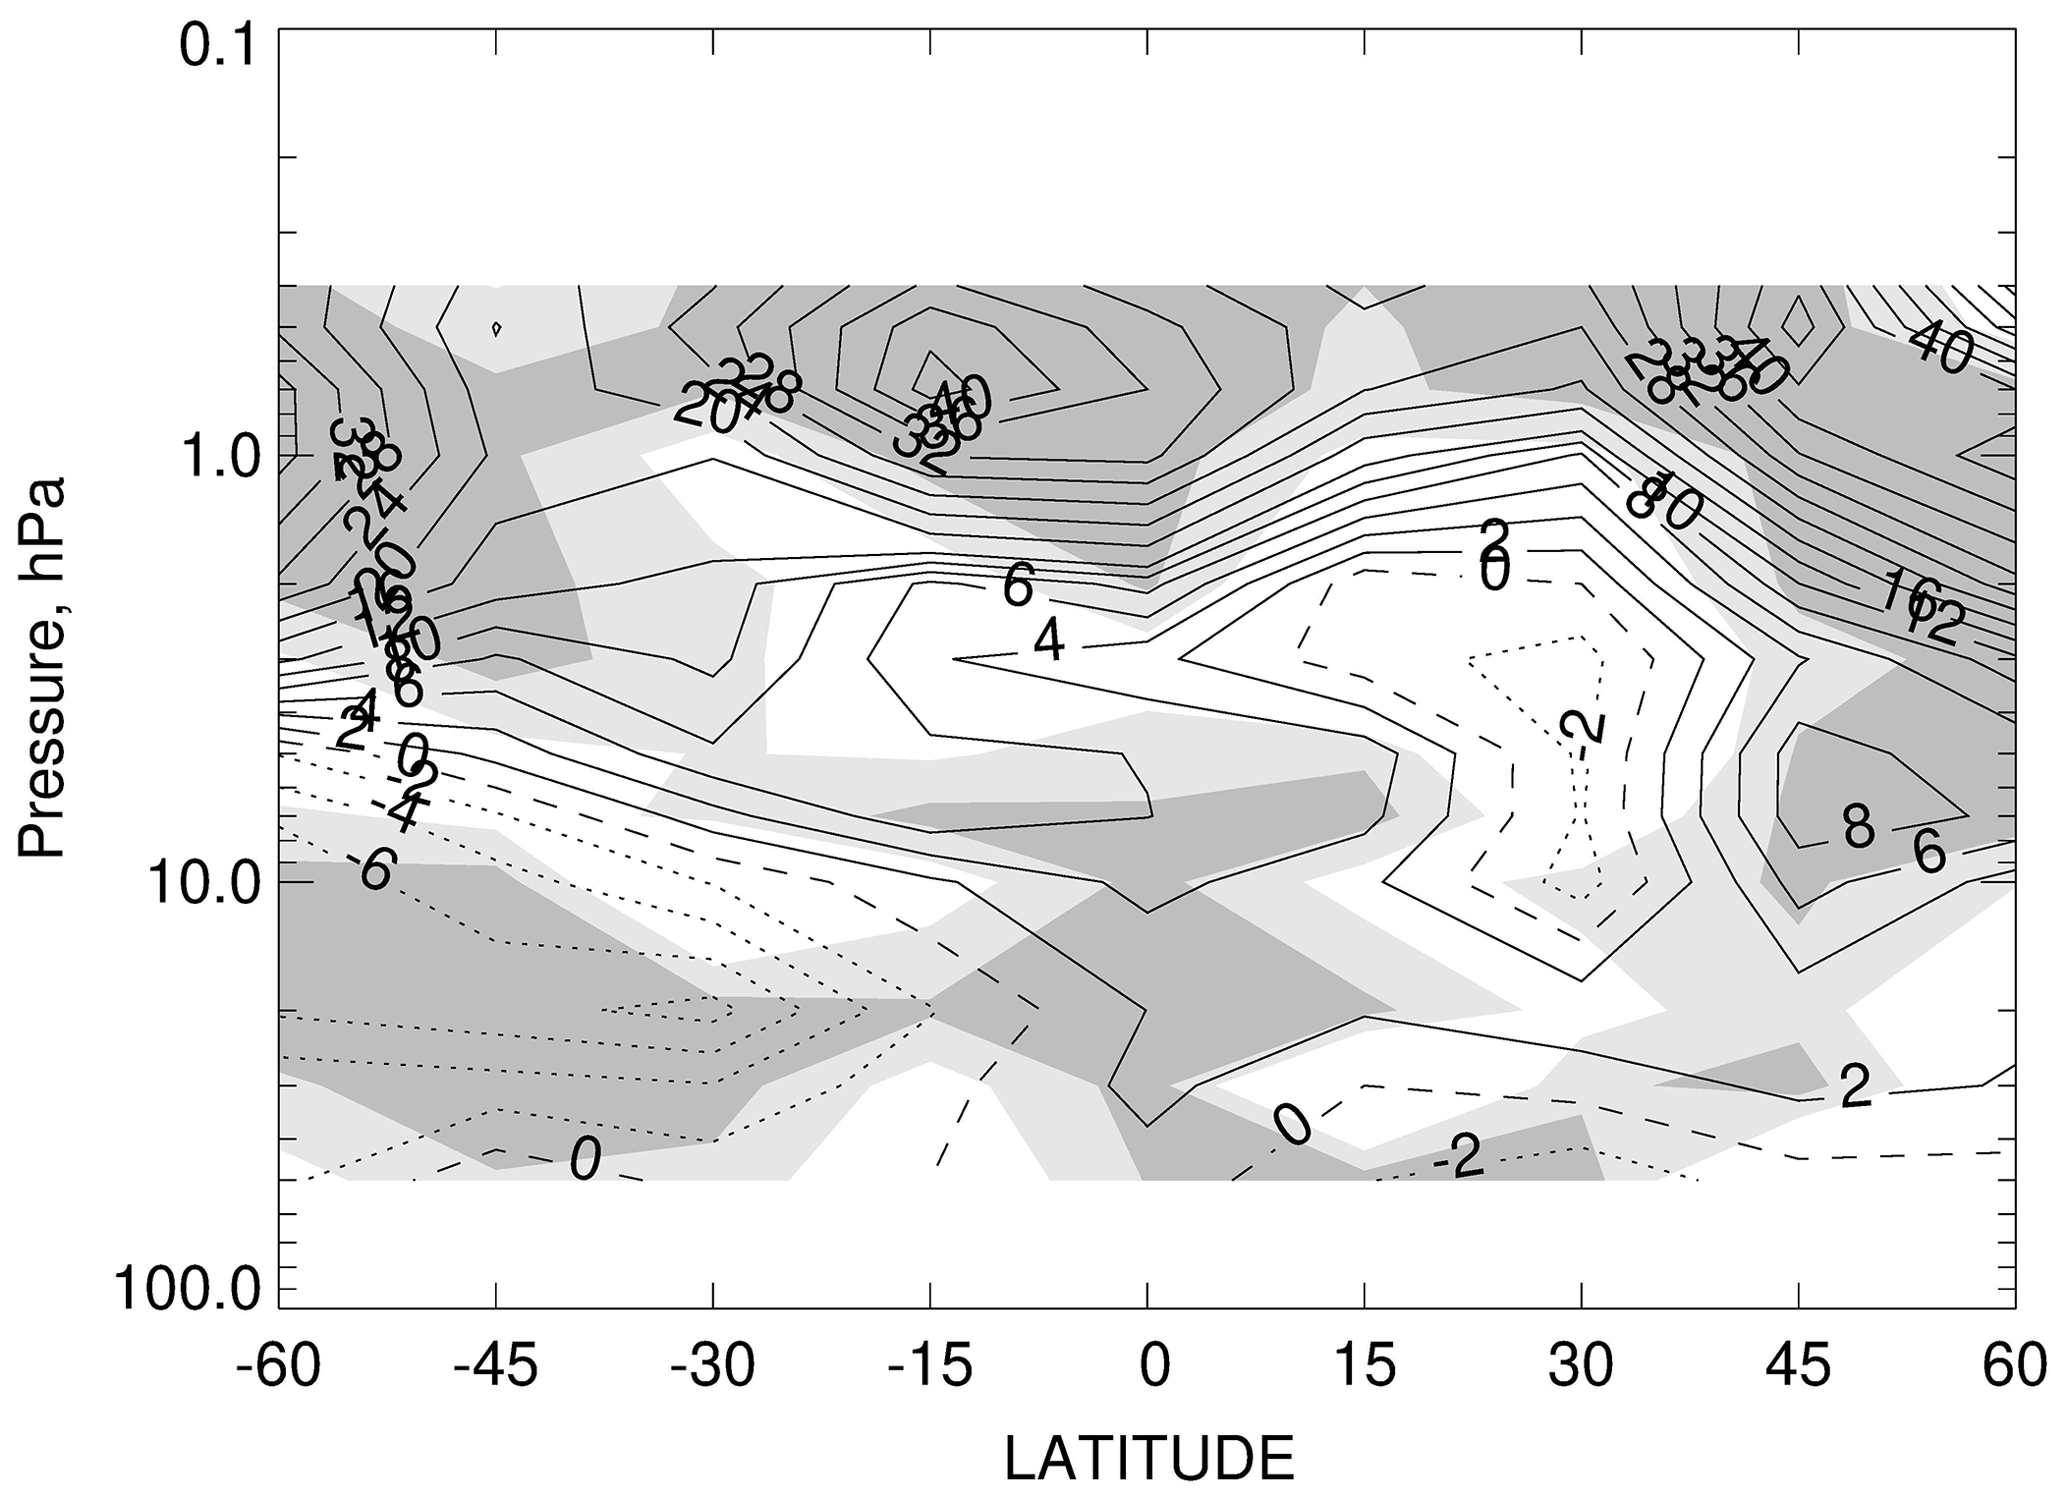
In the Southern Hemisphere, there was an anomalous SSW event on 22 September 2002, leading to a splitting of the polar vortex (Newman and Nash, 2005). The CH4 changes from Figs. 5 to 6 at 10 hPa and 30∘ S were likely altered by that event (as indicated by the data for those two 5-year segments in Fig. 1b). Note that there is no clear separation of the shallow and deep branches of the BDC for the Southern Hemisphere in Fig. 6.
Figure 7 provides a clearer picture of what occurred from 2000 to 2005. Figure 7a is a time series of CH4 at 45∘ S and 20 hPa, and it shows pronounced annual cycles in CH4. A peak seasonal value occurs in 2001, and it may by influencing the overall analyzed trend for that time span. On the other hand, there is little indication of a change in CH4 at the time of the anomalous SSW event of September 2002. Figure 7b shows the corresponding CH4 time series at the Equator and 20 hPa, where CH4 variations are forced primarily by the QBO. There is a clear decrease in CH4 in 2001 compared to the maximum at 45∘ S in Fig. 7a. Figure 7b also shows that tropical QBO signals are nearly absent in CH4 from 1996 to 2000. Bönisch et al. (2011) reported that tropical upwelling increased after 2000 and accelerated the shallow branch of the BDC. Similar studies based on variations in CH4 may be helpful in determining the nature of the shallow layer of the BDC both prior to and after 2000.
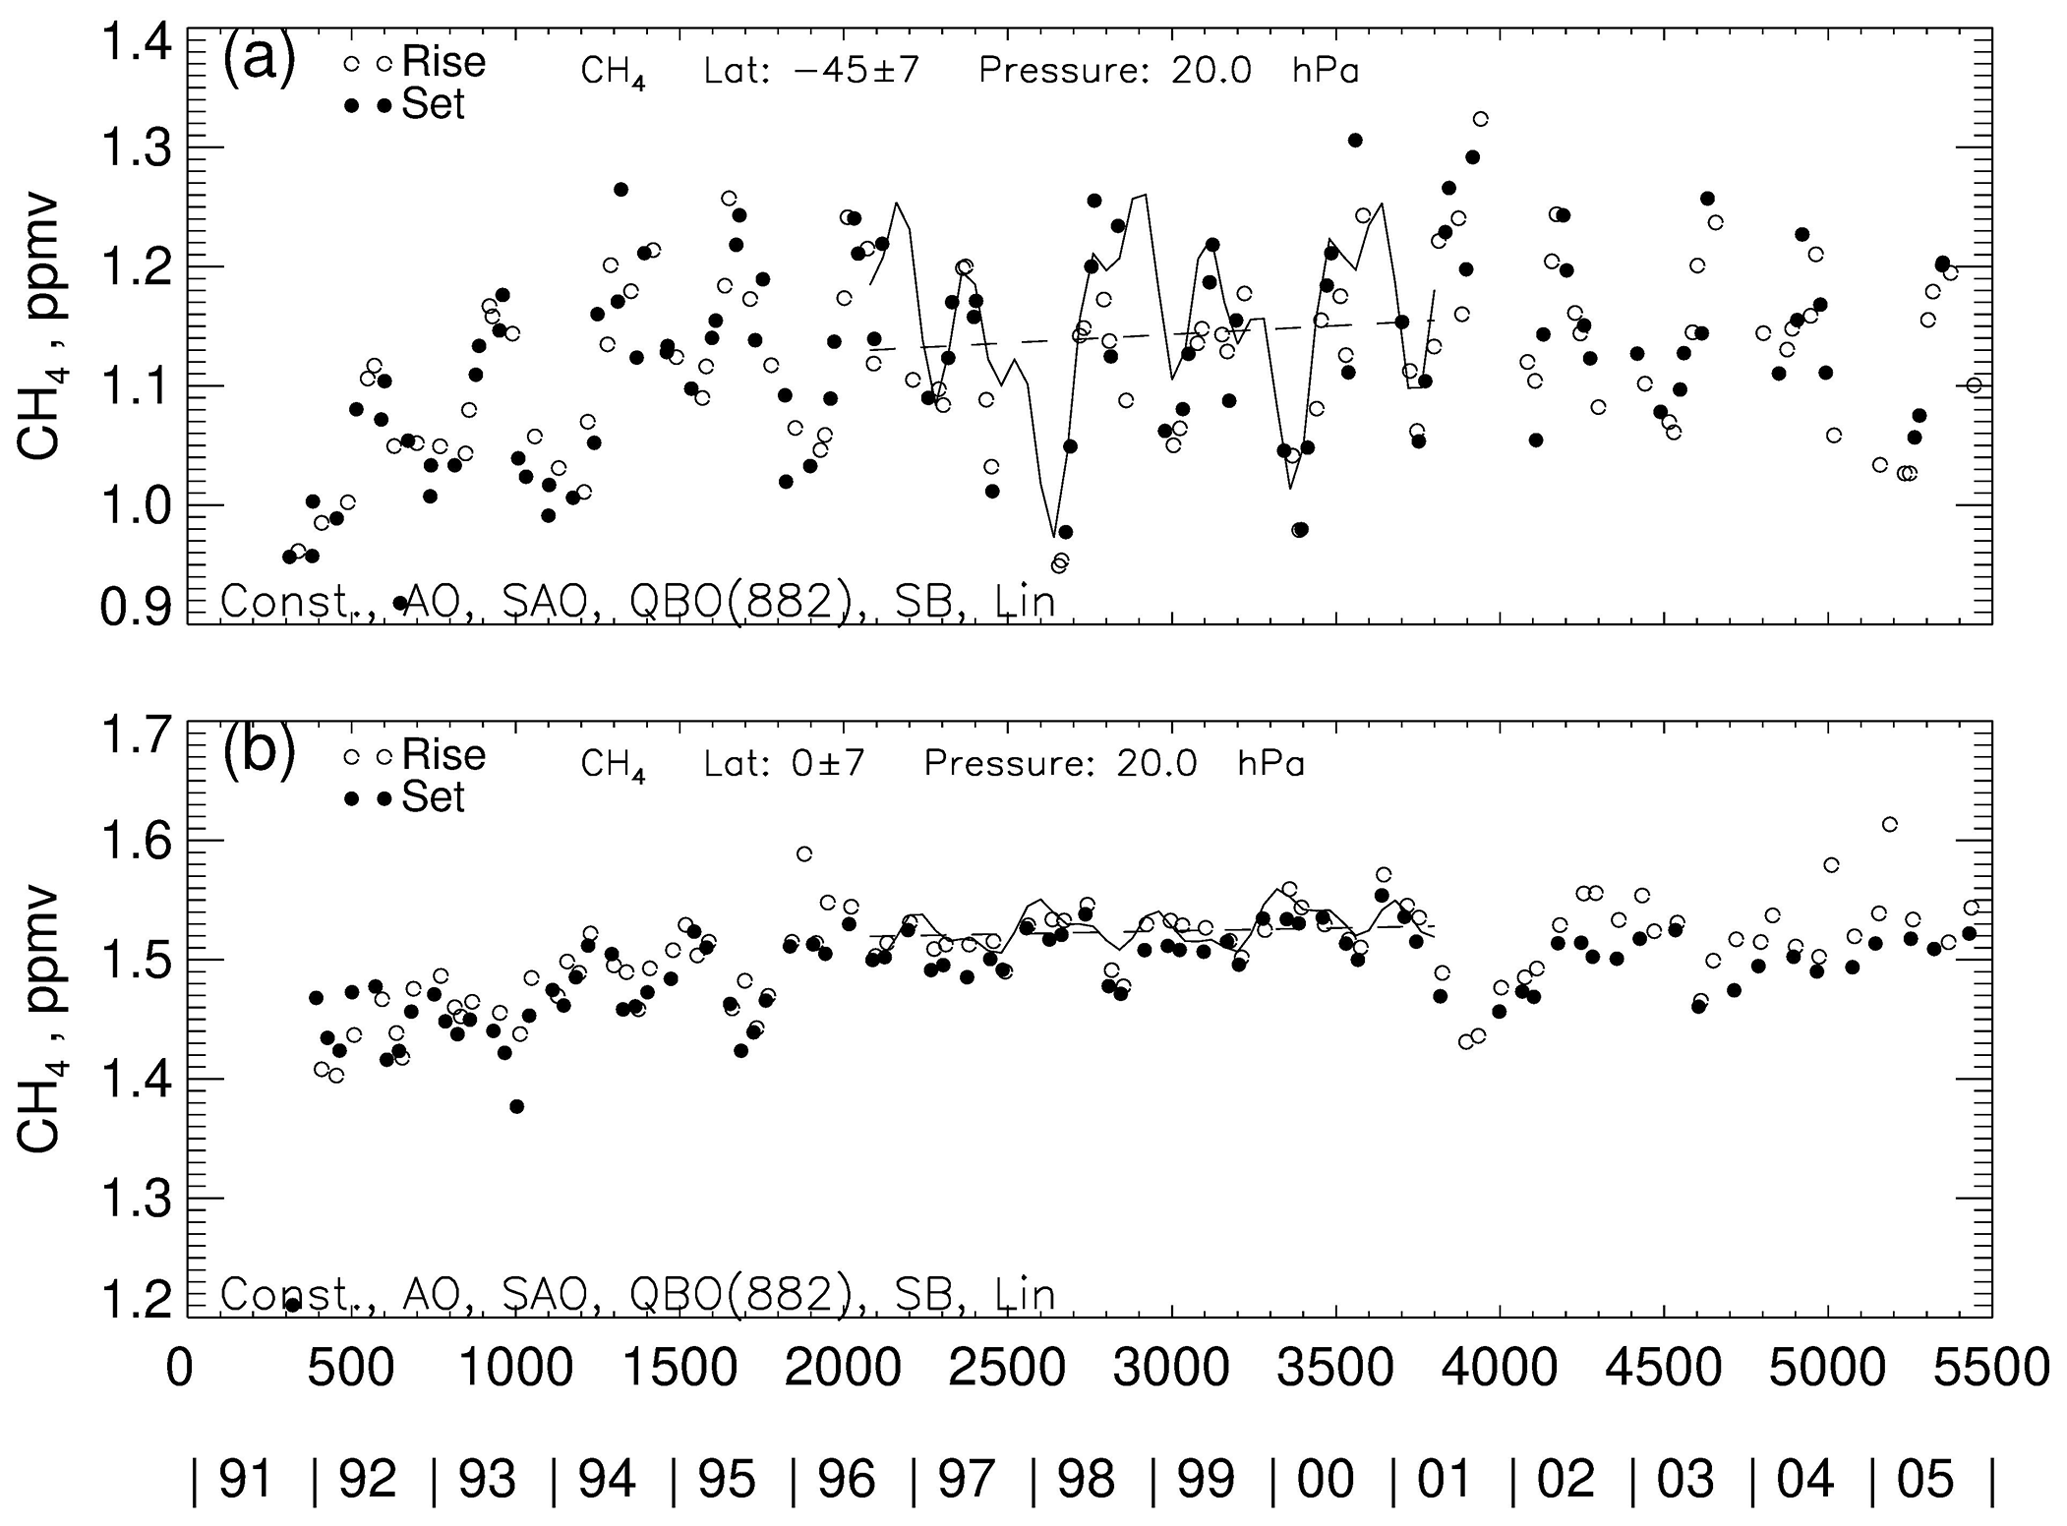
Figure 7As in Fig. 1, but panel (a) is for 45∘ S and 20 hPa, and panel (b) is for Eq and 20 hPa.
The present study is an analysis of the distributions of HALOE CH4 for indications of secular changes in the BDC. Linear trends in CH4 were determined for three successive 5-year time spans, and there are significant differences between them. There is a clear separation of the deep and shallow branches of the BDC at about 30 hPa in the Northern Hemisphere in each time span. Although the changes for CH4 in the shallow branch are rather large following the eruption of Pinatubo, they agree well with tropospheric trends for CH4 during the late 1990s and early 2000s. There are decreasing changes in the upper part of the deep branch of the BDC in the early to middle 1990s, indicating a decline of CH4 from 1 year after the eruption. CH4 changes in the middle and upper stratosphere differ markedly for the early 2000s compared to those of the late 1990s, although those differences are small compared to the seasonal and interannual variations of CH4. In addition, the seasonal changes within the deep branches differ in each hemisphere, perhaps due to episodic SSW events and to wave forcings during ENSO.
In terms of multi-year changes for the BDC, it appears that, during the period of 1992 to 1997, there was acceleration of the shallow branch and deceleration of the deep branch. However, those implied changes in the BDC may be anomalous because of the large perturbation to the CH4 distribution in 1991 from the Pinatubo eruption. During 1996 to 2001, the changes in the shallow branch were nearer to zero, while decreasing trends persisted in the deep branch. Yet, it also appears that there was acceleration of the poleward transport and mixing at middle latitudes within the layer from ∼ 30 to ∼ 7 hPa during that 5-year period. Then, there was a deceleration in the shallow branch and acceleration in the deep branch of the BDC during 2000 to 2005. The implied BDC also differed markedly in the two hemispheres over that final 5-year span. It is concluded that time series of HALOE CH4 provide effective tracer diagnostics for studies of the secular nature of the BDC from 1992 to 2005.
The HALOE V19 profiles are at the NASA EARTHDATA site of EOSDIS, and its website is https://disc.gsfc.nasa.gov/datacollection/UARHA2FN_019.html (Russell et al., 1999).
The author has declared that there are no competing interests.
Publisher’s note: Copernicus Publications remains neutral with regard to jurisdictional claims made in the text, published maps, institutional affiliations, or any other geographical representation in this paper. While Copernicus Publications makes every effort to include appropriate place names, the final responsibility lies with the authors.
The author carried out this work while serving as a Distinguished Research Associate of the Science Directorate at NASA Langley. He thanks Larry Gordley for alerting him of possible detector hysteresis effects for the CH4 gas filter correlation channel of HALOE.
This paper was edited by Rolf Müller and reviewed by three anonymous referees.
Barriopedro, D. and Calvo, N.: On the Relationship between ENSO, Stratospheric Sudden Warmings, and Blocking, J. Climate, 27, 4704–4720, https://doi.org/10.1175/JCLI-D-13-00770.1, 2014.
Bönisch, H., Engel, A., Birner, Th., Hoor, P., Tarasick, D. W., and Ray, E. A.: On the structural changes in the Brewer-Dobson circulation after 2000, Atmos. Chem. Phys., 11, 3937–3948, https://doi.org/10.5194/acp-11-3937-2011, 2011.
Brasseur, G. and Solomon, S.: Aeronomy of the Middle Atmosphere: Chemistry and Physics of the Stratosphere and Mesosphere, 3rd edn., Springer, Dordrecht, the Netherlands, ISBN 978-1-4020-3284-4, 2005.
Butchart, N.: The Brewer-Dobson Circulation, Rev. Geophys., 52, 157–184, https://doi.org/10.1002/2013RG000448, 2014.
Calvo, N. and Marsh, D. R.: The combined effects of ENSO and the 11-year solar cycle on the Northern Hemisphere polar stratosphere, J. Geophys. Res., 116, D23112, https://doi.org/10.1029/2010JD015226, 2011.
Calvo, N., Garcia, R. R., Randel, W. J., and Marsh, D. R.: Dynamical Mechanism for the Increase in Tropical Upwelling in the Lowermost Tropical Stratosphere during Warm ENSO Events, J. Atmos. Sci., 67, 2331–2340, https://doi.org/10.1175/2010JAS3433.1, 2010.
Choi, H., Kim, B.-M., and Choi, W.: Type Classification of Sudden Stratospheric Warming Based on Pre- and Postwarming Periods, J. Climate, 32, 2349–2367, https://doi.org/10.1175/JCLI-D-18-0223.1, 2019.
Diallo, M., Ploeger, F., Konopka, P., Birner, T., Müller, R., Riese, M., Garny, H., Legras, B., Ray, E., Berthet, G., and Jegou, F.: Significant contributions of volcanic aerosols to decadal changes in the stratospheric circulation, Geophys. Res. Lett., 12, 10780–10791, https://doi.org/10.1002/2017GL074662, 2017.
Diallo, M., Konopka, P., Santee, M. L., Müller, R., Tao, M., Walker, K. A., Legras, B., Riese, M., Ern, M., and Ploeger, F.: Structural changes in the shallow and transition branch of the Brewer–Dobson circulation induced by El Niño, Atmos. Chem. Phys., 19, 425–446, https://doi.org/10.5194/acp-19-425-2019, 2019.
Dlugokencky, E. J., Bruhwiler, L., White, J. W. C., Emmons, L. K., Novelli, P. C., Montzka, S. A., Masarie, K. A., Lang, P. M., Crotwell, A. M., Miller, J. B., and Gatti, L. V.: Observational constraints on recent increases in the atmospheric CH4 burden, Geophys. Res. Lett., 36, L18803, https://doi.org/10.1029/2009GL039780, 2009.
Newman, P. A. and Nash, E. R.: The Unusual Southern Hemisphere Stratosphere Winter of 2002, J. Atmos. Sci., 62, 614–628, https://doi.org/10.1175/JAS-3323.1, 2005.
Pitari, G., Cionni, I., Di Genova, G., Visioni, D., Gandolfi, I., and Mancini, E.: Impact of Stratospheric Volcanic Aerosols on Age-of-Air and Transport of Long-Lived Species, Atmosphere, 7, 149, https://doi.org/10.3390/atmos7110149, 2016.
Randel, W. J., Garcia, R. R., Calvo, N., and Marsh, D. R.: ENSO influence on zonal mean temperature and ozone in the tropical lower stratosphere, Geophys. Res. Lett., 36, L15822, https://doi.org/10.1029/2009GL039343, 2009.
Remsberg, E. E.: Methane as a diagnostic tracer of changes in the Brewer–Dobson circulation of the stratosphere, Atmos. Chem. Phys., 15, 3739–3754, https://doi.org/10.5194/acp-15-3739-2015, 2015.
Russell III, J. M., et al.: UARS Halogen Occultation Experiment (HALOE) Level 2 V019, Greenbelt, MD, USA, Goddard Earth Sciences Data and Information Services Center (GES DISC) [data set], https://disc.gsfc.nasa.gov/datacollection/UARHA2FN_019.html (last access: 23 August 2023), 1999.
Tao, M., Konopka, P., Ploeger, F., Grooß, J.-U., Müller, R., Volk, C. M., Walker, K. A., and Riese, M.: Impact of the 2009 major sudden stratospheric warming on the composition of the stratosphere, Atmos. Chem. Phys., 15, 8695–8715, https://doi.org/10.5194/acp-15-8695-2015, 2015.