the Creative Commons Attribution 4.0 License.
the Creative Commons Attribution 4.0 License.
Investigation of non-equilibrium turbulence decay in the atmospheric boundary layer using Doppler lidar measurements
Maciej Karasewicz
Marta Wacławczyk
Pablo Ortiz-Amezcua
Łucja Janicka
Patryk Poczta
Camilla Kassar Borges
Iwona S. Stachlewska
This work concerns analysis of turbulence in the atmospheric boundary layer (ABL) shortly before and after sunset. Based on a large set of Doppler lidar measurements at rural and urban sites, we analyze frequency spectra of vertical wind at different heights and show that they increasingly deviate from Kolmogorov's prediction in the measured low-wavenumber part of the inertial range. We find that before sunset, the integral length scales tend to decrease with time. These findings contrast with a classical model of equilibrium decay of isotropic turbulence, which predicts that the scaling exponent should remain constant and equal to and the integral length scale should increase in time. We explain the observations using recent theories of non-equilibrium turbulence. The presence of non-equilibrium suggests that classical parametrization schemes fail to predict turbulence statistics shortly before sunset. By comparing the classical and the non-equilibrium models, we conclude that the former may underestimate the dissipation rate of turbulence kinetic energy in the initial stages of decay.
- Article
(12234 KB) - Full-text XML
- BibTeX
- EndNote
Turbulence in the atmospheric boundary layer (ABL) undergoes temporal changes with the diurnal cycle. After dawn and under clear sky, the surface heating produces convection and a boundary layer starts to grow. Shortly before sunset, the convective ABL collapses rapidly, and then a stable nocturnal boundary layer (BL) is formed (Nieuwstadt and Brost, 1986).
During the day, turbulence production due to buoyancy is prevalent. In the afternoon, the buoyancy flux decreases gradually and eventually becomes negative (Sorbjan, 1997). The time when the heat flux crosses the zero level was identified by Nadeau et al. (2011) as the beginning of the evening transition. At this time instant, turbulence in the ABL starts to decay more rapidly than in the afternoon. After sunset, turbulence is still produced by shear and the remaining thermal forcing, albeit mostly in a region close to the surface.
Far enough from the surface, turbulence is usually assumed to be approximately homogeneous and isotropic at scales smaller than the integral length scale, respectively. In spite of this considerable simplification, homogeneous and isotropic turbulence is a subject of ongoing research due to its importance for existing theories (Sagaut and Cambon, 2018). Recently, a number of theoretical works have addressed the parametrization of decaying isotropic turbulence (Vassilicos, 2015; Goto and Vassilicos, 2016; Bos and Rubinstein, 2018). In particular, deviations from the predictions of the Kolmogorov theory have been observed in the initial stages of decay, after the forcing is switched off. Kolmogorov's theory of turbulence is of utmost importance as it is widely used to estimate the turbulence kinetic energy dissipation rate ϵ from measured signals. The dissipation rate determines how fast the kinetic energy of turbulence is transferred into heat at the smallest scales, which are of the order of millimeters in atmospheric turbulence. Such small scales can hardly ever be measured with satisfactory accuracy in the free atmosphere. For this reason, the dissipation rate is estimated indirectly by assuming that the energy injected at large scales by forcing is transported at a constant rate from larger to smaller eddies. This process is known as the energy cascade. Taking this assumption, Taylor (1935) formulated the famous relation between the dissipation rate , where ; the turbulence velocity scale , where is the ith component of fluctuating velocity; and the characteristic length scale of large eddies ℒ (the integral length scale),
where Cϵ≈0.5. Equation (1) forms the basis of many turbulence parametrization schemes.
The validity of the Taylor law was questioned in recent theoretical works and experimental observations; see Vassilicos (2015). In particular, it was observed that at the onset of decay, the dissipation rate followed a non-standard relation:
where Cnϵ is a constant and 𝒰0 and ℒ0 denote initial values of the turbulence velocity scale and the length scale. Bos and Rubinstein (2018) argued that the appearance of Eq. (2) is connected with deviations from the scaling of the frequency spectra in the low-wavenumber part of the inertial range. These deviations are observed when the energy transfer rate across the scales is not constant due to a sudden change in forcing. This state will be further referred to as “non-equilibrium”. The same notion is used in thermodynamics and fluid mechanics to describe states after a sudden change in external conditions when the system evolves towards another equilibrium (Wacławczyk, 2021). Here, “equilibrium” is related to Kolmogorov's turbulence characterized by the law or Cϵ≈const. Non-equilibrium, on the other hand, denotes deviations from these laws.
The non-equilibrium scaling has been observed in a number of laboratory and numerical experiments (Valente and Vassilicos, 2012; Obligado and Vassilicos, 2019; Steiros, 2022a; Zheng et al., 2023; Obligado et al., 2022; Steiros, 2022a) as well as in atmospheric turbulence (Wacławczyk et al., 2022). The latter work concerned analysis of airborne measurement data from the stratocumulus-topped boundary layers (STBLs). Non-equilibrium dissipation scaling of a form close to that in Eq. (2) was observed, especially near the surface and inside clouds in the decoupled STBLs. As discussed in (Wacławczyk et al., 2022), weaker turbulence was characterized by larger values of Cϵ. In particular, Cϵ tended to be larger in decoupled STBLs, when turbulence was too weak to mix air over the entire height of the BL. This was in line with previous findings by Nowak et al. (2021), who speculated that turbulence in the decoupled STBLs might be decaying.
To the best of the authors' knowledge, the concept of non-equilibrium has not been discussed in the context of the collapse of the convective BL, although previous studies, when analyzed from this new perspective, deliver strong indications of the non-equilibrium turbulence decay. For example, Lothon et al. (2014) analyzed data from the Boundary-Layer Late Afternoon and Sunset Turbulence (BLLAST) field experiment and calculated the integral length scales ℒw from the measured vertical velocity. As reported by those authors, ℒw initially decreased in the surface layer and next sharply increased after 19:00 local time (LT). In the mixed layer ℒw at first remained constant and then started to increase around 17:00 LT. In classical equilibrium turbulence, the integral length scale is expected to increase in time during the decay. In the non-equilibrium decay, on the other hand, it may initially decrease and next increase in time (Steiros, 2022b). This scenario is consistent with results of Lothon et al. (2014) in the surface layer.
Results of the BLLAST experiment were also analyzed by Darbieu et al. (2015) and were compared to results of numerical simulations. In both cases, the authors found deviations from the Kolmogorov law before sunset, although the validity of the Taylor law (Eq. 1) was not discussed therein. El Guernaoui et al. (2019) discussed the time evolution of the kinetic energy spectra in a numerically simulated ABL. They argued that the decay of the kinetic energy is not uniform across the scales and that the largest scales are the most affected.
Dissipation rates in the surface layer during the afternoon and evening transition were reported by Nilsson et al. (2016). The authors investigated a relation similar to that of Eq. (1) but with the dissipation length lϵ instead of the integral length scale ℒ. They concluded that assuming lϵ∝z, where z denotes the height, is not sufficient to parametrize the dissipation rate in the surface layer. Instead, they proposed to relate lϵ to both z and the height of the boundary layer. Lampert et al. (2016) studied the anisotropy of turbulence during the evening transition and reported that the standard deviation of the vertical velocity decreases with time faster than the corresponding standard deviations of horizontal components. This observation could indicate that the non-equilibrium affects the spectra of the vertical velocity component more than the horizontal ones.
The current work focuses on the decay of turbulence before sunset in order to investigate whether it can be parametrized with the non-equilibrium laws. We analyze data from wind Doppler lidar, which has become a strategic instrument in atmospheric research because it provides vertical profiles of the radial wind component with high spatial and temporal resolution. Our aim is to examine deviations from the Kolmogorov scaling during the evening transition at different heights within the ABL and over different environments. Atmospheric turbulence, which is characterized by huge Reynolds numbers, is an ideal test bed for verifying turbulence theories. Additionally, the theories aim to improve turbulence parametrization schemes, which are of importance for numerical weather prediction and climate models.
It is challenging to provide lidar data with sufficient resolution to recognize deviations from Kolmogorov's scaling in the low-wavenumber part of the inertial range. The spectra are also affected by filtering (averaging) in space and the low signal-to-noise ratio. Hence, these effects should be carefully differentiated. To examine deviations from the Kolmogorov scaling, we also analyze the second-order structure functions. They are mathematically equivalent to the one-dimensional spectra but may respond differently to errors due to the finite frequency of measurements and due to spatial averaging (Schröder et al., 2024; Wacławczyk et al., 2017, 2020). In this work we investigate the scaling of both frequency spectra of vertical wind and the structure functions to assess how they change during the decay of turbulence before sunset. Moreover, we calculate the standard deviations of the vertical velocity and integral length scale and study how they change in time. We also compare the dissipation rates predicted by the classical (Eq. 1) and the non-equilibrium relations (Eq. 2).
The diversified large datasets of sufficient resolution investigated in this work offer a unique opportunity to describe the main differences between decay of turbulent flows generated over urban and rural environments. The rural environment resembles quasi-ideal laboratory conditions for a turbulent flow. The atmospheric boundary layer over an urban environment can experience more shear-driven turbulent flows due to the urban friction and its surface roughness and more thermally generated turbulent flows. The latter are caused by the interactions of the surface with solar radiations (Svensson, 2004; Edokpa and Nwagbara, 2018). Of particular importance is the thermal heat capacity of surfaces and the related urban heat island phenomenon, which is an effect of the heat accumulation in and over an urban area (Oke, 1987). As reported by Nadeau et al. (2011), the decay of turbulence kinetic energy scales with the characteristic time of the heat flux decay. This timescale is smaller for surfaces that cool down more rapidly. In our work we compare the results at both sites (rural and urban) to assess how surface heterogeneity and surface heat capacity affect turbulence properties.
The paper is structured as follows. The theory of equilibrium and non-equilibrium decay is presented in Sect. 2. In Sect. 3 experimental sites and instrumentation are described. Section 4 is devoted to methodology; this is followed by Sect. 5, which contains data analysis. Finally, conclusions and perspectives are discussed in Sect. 6.
2.1 Non-equilibrium spectra and structure functions
The theory of Kolmogorov is the foundation of turbulence research (Pope, 2000). It states that at sufficiently large Reynolds numbers and under the assumption of local isotropy, there exist a range of scales where statistics of velocity take a self-similar form. Further, within this range, a sub-range of scales of size r, where , can be distinguished. This will be further referred to as the “inertial range”. In this range of scales, statistics of turbulence depend not on viscosity but only on the dissipation rate ϵ. It follows that the wavenumber spectrum of the vertical wind velocity component can be expressed as
where is a constant and κ is the wavenumber. Equivalently, the same can be presented in terms of the second-order structure function, which for the vertical velocity component w reads
Within the inertial range and under the assumption of local isotropy, this function takes the form
where C≈2.86. Equations (3) and (4) form the basis of various schemes for the estimation of the energy dissipation rate, including from lidar measurements (O'Connor et al., 2010; Lothon et al., 2009; Sanchez Gomez et al., 2021).
Equations (3) and (4) work well when turbulence is close to isotropic, at least locally, and is stationary. Recently, extensions of Kolmogorov's theory towards unsteady turbulence were put forward by Vassilicos (2015). These extensions predict that the rate of energy transfer across scales in the inertial range is affected by turbulence decay and is not constant. Bos and Rubinstein (2018) expressed the turbulence kinetic energy spectrum as a sum of the equilibrium, Kolmogorov spectrum and a non-equilibrium correction. They derived a formula similar to Eq. (2) and argued that deviations of the spectra from Kolmogorov's scaling are related to the deviations from Cϵ=const in Eq. (1). Goto and Vassilicos (2016) focused on the large-scale part of the turbulence kinetic energy spectrum during the non-equilibrium decay and found that it has the self-preserving form
Steiros (2022a) introduced the notion of “balanced nonstationary turbulence”, where the transfer across the scales is proportional to dissipation, albeit with a proportionality constant smaller than 1. This assumption led to a modified form of the energy spectrum in the inertial range:
where c is a dimensionless constant. The spectra followed the above formula even during the equilibrium decay with Cϵ=const. The function in square brackets in the above equation reaches the value 1 asymptotically, at large wavenumbers (small scales), where the spectra remain close to the Kolmogorov form.
Obligado and Vassilicos (2019) investigated how the inertial range of the structure functions is affected during non-equilibrium decay of turbulence. They concluded that in the case of decaying turbulence, the second- and the third-order structure functions are closest to Kolmogorov's predictions at the small-scale end of the inertial range. For larger scales, the structure functions increasingly deviate from equilibrium, even at very large Reynolds numbers. The authors considered Lundgren's formula for the structure functions, derived with the use of matched asymptotic expansions. For very high Reynolds numbers, it reads
where A2 is a dimensionless constant of the order 1. Under the assumption of local isotropy, the above formula is mathematically equivalent to Eq. (6), provided that the bracketed term in Eq. (6) can be expanded in the Taylor series.
We now discuss turbulence statistics, in particular, the integral length-scale change in time according to the theory of equilibrium and non-equilibrium decay. Based on this, we can identify which type of parametrization more adequately describes the collapse of the convective boundary layer before sunset. Here we mostly refer to the recent papers by Goto and Vassilicos (2016) and Steiros (2022b), who investigated decaying turbulence using numerical experiments and derived non-equilibrium decay laws.
2.2 Equilibrium decay
Under the assumption of horizontal homogeneity, the transport equation for the turbulence kinetic energy in the ABL reads (Pope, 2000)
where
T, P and B stand for the turbulent transport, shear production and buoyancy forcing, respectively. Above, p′ denotes the pressure fluctuations and b′ the fluctuations in buoyancy. The buoyancy flux will be defined as
where θv is the virtual potential temperature and g stands for the gravity acceleration.
Turbulence production due to shear P is an important part of the budget close to the Earth's surface. Buoyancy B plays a dominant role during daytime convection; finally, the role of turbulent transport T is to transfer the kinetic energy produced close to the surface to higher altitudes.
At the beginning of the evening transition, the buoyancy flux B=0 (Nadeau et al., 2011) and the convective boundary layer collapse rapidly. Turbulence is still produced by the shear P in the surface layer; however we can assume that at higher altitudes, turbulence starts to decay freely such that the time derivative of k on the left-hand side (LHS) of Eq. (8) is balanced mainly by the dissipation ϵ. Under such assumptions, Eq. (8) rewritten in terms of the velocity scale is
During the equilibrium decay, the dissipation rate is described by Taylor's law (Eq. 1) and Kolmogorov's type of turbulence kinetic energy spectrum (Eq. 3). For further comparisons with experimental data, it is convenient to express the rate of change of velocity statistics as a function of the turbulence Reynolds number, . It is of note that the product of velocity and length scales 𝒰ℒ is proportional to the eddy viscosity νT. Hence, the Reynolds number Re in fact expresses the ratio of the eddy viscosity and the molecular viscosity .
After substituting Eq. (1) into the right-hand side (RHS) of Eq. (10) and further rearrangements, we obtain
To derive the corresponding equation for the rate of change in L, the equilibrium law (Eq. 1) is differentiated over time:
To express the derivative , the predictions of the classical k−ϵ turbulence model can be used (Launder and Sharma, 1974):
where C0=1.9 is a model constant. Substituting Eq. (13) into Eq. (12), we obtain
After multiplying both sides by 2ℒ2, using Eqs. (1) and (10), the following relation is derived:
where . Hence, the classical theory predicts that the integral length scale increases with time during the decay of turbulence and that the decay of ℒ2 slows down when the Reynolds number Re decreases.
Even though ℒ is expected to increase in time, the product 𝒰ℒ and also the turbulence Reynolds number Re are expected to decrease in time. Indeed, after rearranging and combining Eqs. (11) and (15), we obtain the following formula:
2.3 Non-equilibrium decay
The scenario of non-equilibrium decay predicts that the dissipation rate scales according to the relation of Eq. (2). After introducing this relation into Eq. (10) and further rearrangements, we obtain
where . Equation (17) is different than the corresponding Eq. (11) derived for the equilibrium decay. It scales with Re−2 instead of Re−1, and, additionally, it depends on the initial conditions through Re0. During the turbulence decay, the Reynolds number Re decreases with time, hence the ratio . This implies that decay rates predicted by Eq. (17) increase in time more sharply than those predicted by its equilibrium counterpart (Eq. 11). Fast anomalous changes in turbulence kinetic energy during non-equilibrium decay, which gradually decrease at later times, were observed experimentally by Meldi and Sagaut (2018).
As argued by Goto and Vassilicos (2016), in the initial stages of decay, after the forcing is stopped and long-range correlations suddenly disappear, the integral length scale starts to decrease with time. Using the self-similar form of the spectra (Eq. 5) and relation (Eq. 2), Steiros (2022b) derived the following formula for the time derivative of the length scale:
where Ane and Bne are coefficients related to the initial conditions and integrated spectral function. We note that the formula presented in the original paper by Steiros (2022b) was written in terms of the Reynolds number based on the Taylor length scale. However, in the non-equilibrium decay, this length scale becomes proportional to the integral length scale ℒ, which follows directly from Eq. (2); see also the discussion by Vassilicos (2015). Equation (18) is qualitatively different than its equilibrium counterpart (Eq. 15). For large turbulence Reynolds numbers Re, the time derivative of ℒ2 can be negative, causing ℒ to decay in time. As the Reynolds number decreases during the decay of turbulence, the RHS of Eq. (18) will eventually become positive and ℒ will start to increase with time until reaches its maximum. At this point, the system arrives at its equilibrium state and the statistics further follow the equilibrium Taylor relation (Eq. 1), albeit with a larger value of Cϵ≈1. This also implies that ℒ further grows in time according to Eq. (15).
Results of the numerical experiment presented in Steiros (2022b) confirmed that during the non-equilibrium decay the time derivative of ℒ2 was a decreasing function of the turbulence Reynolds number. Moreover, in the initial stages of decay, .
2.4 Detection of non-equilibrium decay in the ABL
Our purpose is to show, based on the experimental evidence, that the non-equilibrium form of decay is present in the atmospheric turbulence before sunset. During non-equilibrium decay, estimating the dissipation rate from the low-wavenumber part of the wind velocity spectra (Eq. 3) or with the use of Eq. (1) becomes questionable and leads to underpredictions of the dissipation rate. On the other hand, the resolution of the Doppler lidar is not sufficient to measure small turbulent motions, which are less affected by the non-equilibrium correction. Hence, unlike in laboratory experiments, direct verification of Eqs. (1) and (2) is not possible. For this reason, the non-equilibrium will be detected indirectly, by recording changes in the scaling of the frequency spectra and the structure functions. According to Eqs. (7) and (6), increasing deviations from the Kolmogorov scaling can be explained by the decrease in the integral length scale. This is in contrast to the theory of equilibrium decay where the integral length scale should increase with time according to Eq. (15) and the scaling of spectra and structure functions should become closer to the Kolmogorov one. We calculated both frequency spectra and structure functions from time series of the vertical velocity component measured by the Doppler lidar and estimated the scaling exponents (slopes) using least-squares fitting.
Apart from non-equilibrium correction, the slopes can be affected by insufficient resolution in time and space and high noise-to-signal ratios (Frehlich, 1994; Frehlich and Cornman, 1999). Banakh et al. (2021) investigated modifications of spectra due to instrumental noise, aliasing and space averaging. In particular, in the Fourier space, the latter modification affects the whole range of scales and not only the highest wavenumbers. Moreover, the modification depends on the horizontal wind speed . In order to convert time coordinates to space coordinates, Taylor's frozen-eddy hypothesis is used, with . This relation is justified only if the turbulence intensity defined as , where is the mean horizontal wind speed, is small enough. As decreases, frequency spectra become more affected.
Because of these possible modifications of the spectra, in this work we focus on detecting changes in the slopes rather than on their exact values. We filter out data with high instrumental noise and data where . Although the frequency spectra and structure functions are mathematically equivalent, they may respond differently to different sources of errors. In parallel to the slopes, we present the calculated integral length scales and mean wind velocity to verify whether the changes in the scaling are due to changes in the integral length scale, as predicted by Eqs. (7) and (6) or, rather, are affected by changes in the mean wind speed.
The data used for this work were obtained using the Doppler lidar system in rural and urban environments. The measurements were performed over a rural environment during the POLIMOS (Technical assistance for Polish Radar and Lidar Mobile Observation System) campaign, which took place between May and September 2018 at the PolWET peatland site in Rzecin (52°45′ N, 16°18′ E; 54 m a.s.l.), Poland. The measurements over an urban environment were performed at Warsaw Observatory Station in the center of Warsaw (52°12′ N, 20.°58′ E; 112 m a.s.l.), Poland. Both sites are part of the Aerosol, Clouds and Trace Gases Research Infrastructure (ACTRIS ERIC). The locations of each site are presented in Fig. 1.
During the measurements, the meteorological conditions were represented by hot and dry periods for each of the sites. In 2018, the meteorological conditions in Rzecin deviated from the reference values for precipitation and mean air temperature (512 mm and 8.63 °C, respectively), with recorded values of 464 mm and 9.63 °C (Poczta et al., 2023). Furthermore, the summer of 2018 was one of the hottest and driest periods over recent years (122 mm and 19.21 °C) in comparison to the reference values (192 mm and 18.0 °C) for this season. The meteorological conditions in 2023 in Warsaw also differed from the reference values for precipitation and mean air temperature (549.7 mm and 9.00 °C respectively), with recorded values of 620.9 mm and 11.07 °C. Even though the total amount of precipitation for 2023 in Warsaw was higher than the reference value, the summer of 2023 was drier and hotter (184.4 mm and 20.29 °C) than the reference values (257.1 mm and 17.65 °C) for this season. A relative increase in temperature (+14.96 % and +6.72 % in comparison to the reference values for Warsaw and Rzecin, respectively) and relative decrease in precipitation amount (−28.28 % and −36.46 % in comparison to the reference values for Warsaw and Rzecin, respectively) were observed for both of the measurement locations during the summer seasons. It follows that the meteorological conditions for both stations were relatively similar and were characterized by higher temperatures and less precipitation for the summer season for both 2018 and 2023 in comparison to the historical data. The reference values for precipitation and mean air temperature for Rzecin were calculated based on the Szamotuły-Baborówko station meteorological data (IMGW-PIB, 2024a) for the period between 1990–2014 (further data not available). The reference values for Warsaw were calculated from “Climate Standards 1990–2020” (IMGW-PIB, 2024b). The amount of precipitation and average air temperature value for the summer season of 2023 in Warsaw were calculated based on the Warsaw-Filtry station meteorological data (IMGW-PIB, 2024a).
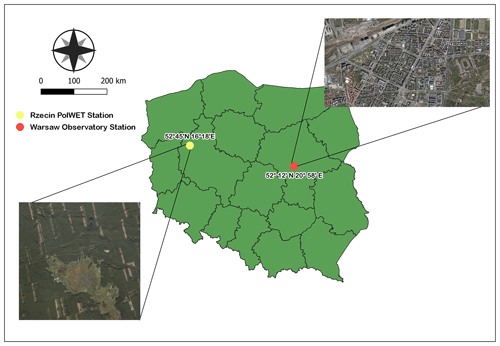
Figure 1Location of ACTRIS ERIC experimental sites, the Rzecin PolWET station of the Poznań University of Life Sciences and Warsaw Observatory Station of the University of Warsaw. The maps were provided by the National Geoportal (https://www.geoportal.gov.pl/, last access: 20 March 2024). The authors acknowledge Zuzanna Rykowska (University of Warsaw) for preparing the figure.
For each location, the vertical and horizontal wind profiles were obtained using measurements from StreamLine (HALO Photonics) Doppler lidars. In the rural environment, the measurements were taken using the Doppler lidar provided by the Atmospheric Physics Group of the University of Granada (GFAT-UGR). The Doppler lidar operating in Warsaw is owned by the Remote Sensing Laboratory (RS-Lab) at the Faculty of Physics of the University of Warsaw. The lidars comprise a solid-state pulsed laser emitting at 1.5 µm and a heterodyne detector with fiber-optic technology. The emission is provided with pulses of energy at 100 µJ; a pulse duration of 200 ns; and pulse repetition rates of 15 and 10 kHz for the GFAT-UGR and RS-Lab systems, respectively. The signal acquisition is performed in continuous and autonomous vertical mode, and regular measurements are made in the vertical azimuth display (VAD). A more detailed description of the Doppler lidar system can be found in Pearson et al. (2009).
The lidar signal acquisition was performed continuously in vertical mode, obtaining a vertical wind component with 30 m spatial and 1 s temporal resolution. For the horizontal profiles of the wind, the VAD scans with a constant elevation of 70° and 12 azimuth points were performed every 30 min. The focus of the optical system was at 535±35 m (Ortiz-Amezcua et al., 2022) and at the infinite value for GFAT-UGR and RS-Lab lidars, respectively. To support our findings, we additionally analyzed the momentum and heat fluxes (30 min averages). The eddy covariance observations were performed in parallel to the lidar measurements with instruments mounted on a meteorological tower (4.5 ) at the Rzecin PolWET station (see Poczta et al., 2023, for details) and on the Radiation Transfer Laboratory measuring platform on the roof of the building of the Faculty of Physics in Warsaw (22 ).
The whole database of Doppler lidar and surface flux measurements consists of 4 months (June–September 2018) of measurements in a rural environment and 4 months (June–September 2023) of measurements in an urban environment. To obtain the data ready for further analyses, the raw Doppler lidar data were firstly background-corrected, using the calibration procedures proposed by Manninen et al. (2016) and Vakkari et al. (2019), and secondly filtered out by values of the signal-to-noise ratio threshold (SNR = 1.006) (Manninen et al., 2016). Errors in the vertical and horizontal velocity measurements were calculated using the software-processing HALO lidar toolbox (Manninen, 2019), with methods proposed by Rye and Hardesty (1993) and Pearson et al. (2009) for the vertical components and by Päschke et al. (2015) for the horizontal ones.
The lidar data were first used to estimate the ABL height. We compare the results of two methods. The first method is the gradient method of the backscatter signal. In lidar measurements, the backscatter signal in the ABL is significantly stronger than in the free troposphere, so there is a distinct change in backscatter signal values when it passes through the boundary between the ABL and the free troposphere (Wang et al., 2020; Liu et al., 2022). The boundary layer height is defined as the height where the range-corrected signal sharply decreases, that is, where its gradient has a minimum value (Dang et al., 2019). The second variance method was used to estimate the height of the convective boundary layer (Dewani et al., 2023). The top of the layer is estimated as the height where the variance of the vertical velocity decreases below a certain threshold value. We use the threshold of 0.09, as in Dewani et al. (2023).
To compute the slopes of the frequency spectra and structure functions and values of integral length scales, the vertical velocity measurements at different heights were grouped in 0.5 h intervals. The recorded signal was decomposed into the mean and fluctuating part as
where 〈w〉 is a 600 s running average. This detrending removes the largest convective scales from outside the inertial sub-range and allows for a better convergence of statistics within 0.5 h intervals. The turbulence velocity scale was calculated from the vertical velocity fluctuations as
for each height and time interval. Cases where the turbulence intensity was larger than 0.15, which would not support Taylor's hypothesis, were filtered out. The frequency spectra were computed for each group, and a logarithmic fit in the frequency range , 0.3 s−1] was performed without fixing the slope. In the logarithmic plot, the power-law function forms a straight line, and its slope is equal to the scaling exponent. We calculated the slopes at each height and each time interval using the least-squares algorithm and investigated whether the slopes deviate from Kolmogorov's predictions ( and scaling of the frequency spectrum and structure function, respectively). To determine the integral length scale, we first calculated the two-point transverse correlation coefficient:
According to the theory of homogeneous, isotropic turbulence (Pope, 2000), the function g(r) takes the form
and crosses the horizontal axis at r=2ℒ. We numerically integrated the function g(r) from r=0 to r=2ℒ. This integral should be approximately equal to 0.57ℒ.
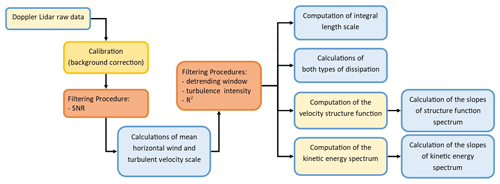
Figure 2 presents the methodology to obtain the mean horizontal wind, slopes of the frequency spectrum and structure function, and the integral length scale for each interval. For slopes, we additionally use the R2 threshold (O'Connor et al., 2010) such that fits with R2 less than 0.6 are considered noise and discarded.
To calculate the buoyancy flux defined in Eq. (9) using the data from the PolWET station, we approximated the virtual potential temperature as
where Rv and Rd are gas constants for water vapor and dry air, respectively, and qv is the mixing ratio of water vapor; we assumed θ≈T, where T is absolute temperature. With this the buoyancy flux was calculated as
For the Warsaw data, we approximated the virtual potential temperature with the measured sonic temperature θv≈Ts and calculated the buoyancy flux as
5.1 ABL height, velocity and timescales
As we focus on the evening hours in this work, we denote the sunset time as t=0. Turbulence statistics are calculated as 0.5 h averages or medians relative to the sunset time for both Rzecin and Warsaw for the same months during the summer. We present the statistics as functions of time to analyze how they change during rapid decay of turbulence.
We first present the evolution of the heights of the ABL and convective boundary layer (CBL) in Fig. 3. The uncertainties were estimated as a standard error of the mean (SEM) of the half-hour time intervals; see Appendix A. As is observed, the ABL height at the rural site is lower and decreases more rapidly compared to the urban site. This may indicate the influence of the urban heat island effect in large cities. The behavior of the CBL height is similar; i.e., much higher values are observed in Warsaw. In both the Rzecin and the Warsaw sites, the CBL collapses rapidly ca. 2.5 h before sunset. The results are in agreement with the long-term study by Wang et al. (2020).
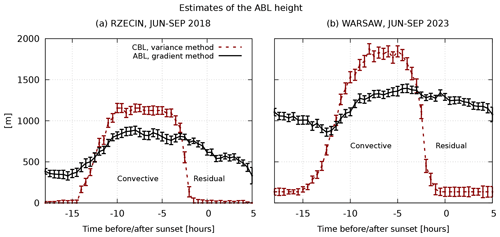
Figure 3The median values of the ABL and CBL heights and error estimates (see Appendix A) during the summer season (June–September) at the Rzecin PolWET station in 2018 (a) and Warsaw Observatory Station in 2023 (b).
In order to estimate the beginning of the evening transition, we present the buoyancy fluxes, their median values and standard errors in Fig. 4. At h, the median values of the fluxes are still positive. Afterwards they cross the zero level at the Rzecin site and become close to zero at the Warsaw site.
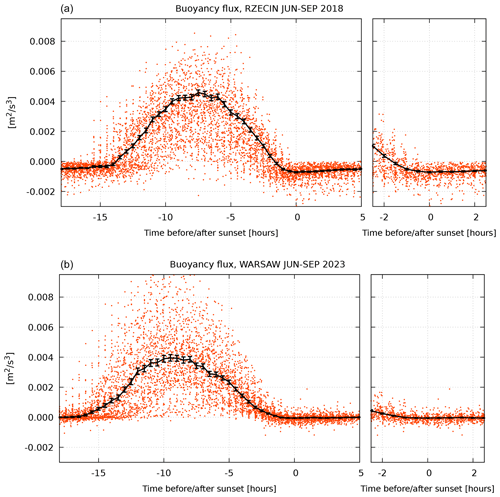
Figure 4The median values of the buoyancy flux and error estimates (see Appendix A) during the summer season (June–September) at the Rzecin PolWET station in 2018 (a) and Warsaw Observatory Station in 2023 (b).
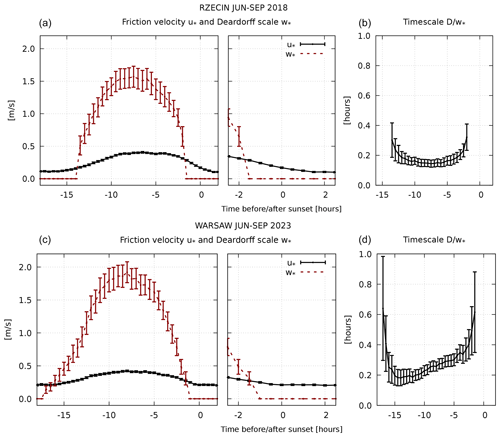
The buoyancy fluxes and the CBL height are further used to calculate the characteristic scales which govern the flow during daytime convection. The convective Deardorff scale w* and the corresponding timescale τ are defined as (Deardorff, 1970)
where the CBL height is denoted by D and is the surface value of the buoyancy flux. We present both scales in Fig. 5 and additionally compare w* with the friction velocity u*. A description of the error estimates is given in Appendix A. As is seen in Fig. 5, both in Rzecin and in Warsaw, w* is still larger than u* at h and the timescale τ increases sharply around h. This timescale is larger in Warsaw, which suggests that the turbulence decay is slower in the urban surface layer. Shortly after h, u* becomes larger than or comparable to w* (within the confidence intervals), which implies that turbulence production due to shear P becomes dominant in the surface layer. We will assume that at higher altitudes the contribution of the shear production is negligible and that, to the leading order, the evolution of the turbulence kinetic energy is described by Eq. (10). Under such assumptions, the changes in 𝒰 and ℒ should be described by formulas derived in Sect. 2.2 and 2.3. For this reason we will further treat statistics at h as initial conditions and focus our attention on the time interval of ±2 h relative to the sunset.
5.2 Spectra and structure functions
At 18:30 UTC, with convection still present, the wind energy spectrum was measured at a height of 195 , i.e., within the mixed layer (see Fig. 6a). In this case the spectrum is visibly steeper than . The steep slopes of frequency spectra in the convective regime were also reported by other authors (Darbieu et al., 2015). Xie and Huang (2022) speculated that these steep slopes could be linked to the presence of inverse cascades at large scales, which leads to the Bolgiano–Obukhov scaling (Bolgiano, 1959). However, as argued by Banakh et al. (2021), in the case of poorly resolved data, the steepening of slopes may also be caused by the artificial instrumental dissipation due to effective low-pass filtering.
Figure 6b shows that before sunset, when the convective layer rapidly decays, the frequency spectrum becomes less steep than the Kolmogorov's prediction. This observation is not related to instrumental artificial dissipation, which rather causes the opposite effect (steepening of the spectra).
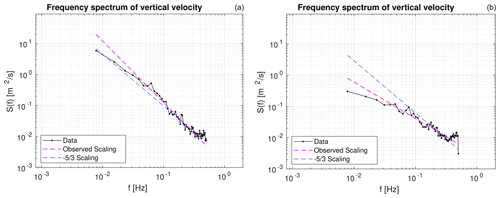
Figure 6Exemplary frequency spectra of vertical wind measured on 28 June 2018 at the Rzecin PolWET station, at (a) 195 at 18:30 UTC and (b) 195 at 19:30 UTC, showing the steeper and less steep frequency spectrum, respectively, as compared to Kolmogorov's prediction.
In Fig. 7, the time–height evolution of the slopes of the frequency spectra and velocity structure functions and the estimate of the CBL height are shown. The regions marked by red and orange colors in Fig. 7a and yellow and light green in Fig. 7b exhibit scaling steeper than that of Kolmogorov. Before sunset, when the CBL collapses, the turbulence kinetic energy decays rapidly (El Guernaoui et al., 2019) and a sharp decrease in the slopes at all heights is observed. Decrease in the slopes is also seen in the upper part of the convective ABL, where the rising updrafts become weaker. Therein, stable stratification possibly alters the spectra and structure functions. The stratification effects on spectral slopes were included in a recent model by Cheng et al. (2020). This issue is, however, beyond the scope of the present work, as we focus instead on the modification of the spectra due to nonstationarity.
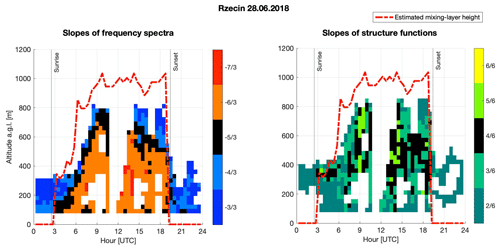
Figure 7Slopes of the frequency spectra and velocity structure functions and estimates of the CBL height for data measured on 28 June 2018 at the Rzecin PolWET station. The boxes marked in black indicate the slopes of frequency spectra equal to and slopes of the velocity structure function equal to .
5.3 Influence of the detrending window
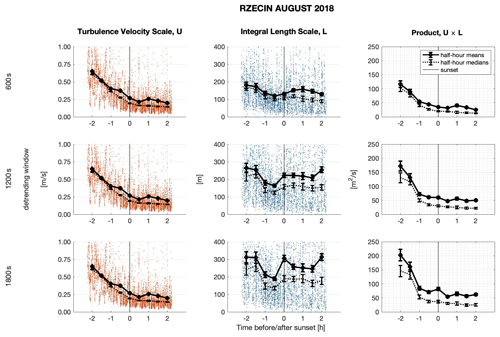
We next investigated how different values of the detrending window influence the results in order to choose the most appropriate value. The size of the detrending window can potentially affect the turbulence velocity scale and the integral length scale, calculated from Eqs. (20) and (22), respectively. To estimate the errors, we took into account the standard error of the mean and errors in velocity estimates from the HALO lidar toolbox (see Appendix A for details). We calculated and compared both mean and median values, and their comparison is shown in Fig. 8. Median values are advantageous if the probability distribution of the data is non-Gaussian or in the presence of rare but very large or very small values (outliers), which affect the mean. As can be seen in Fig. 8, all the mean values are larger then the corresponding medians. Both the mean and the median values of 𝒰 are not much affected by the change in the detrending window in the algorithm. They decrease with time during the evening transition. Mean and median values of the integral length scales increase with increasing size of the detrending window. The data become considerably scattered for the largest window. This is to be expected, as ℒ converges slowly and a large sample is needed to estimate it with sufficient accuracy (Lenschow et al., 1994). The time span needed to calculate statistics is proportional to ℒ; hence larger length scales require longer time spans. As a result, 0.5 h averages may be insufficient to reduce random errors to acceptable levels needed to calculate the time derivatives from Eqs. (15) and (18). Independent of the size of the detrending window, we find that the median values of integral length scales first decrease with time and next increase or become constant. This conclusion seems to be universal and allows further analysis to be performed using only one set value for the detrending window, which has been chosen to be 600 s. The median values of the product 𝒰ℒ (and also the turbulence Reynolds number Re) decrease with time, as expected, for all detrending windows. The corresponding mean values decrease in time before sunset for the two smaller detrending windows.
5.4 Turbulence properties: statistical analysis
To investigate how the turbulence properties change not only in time but also with altitude, we divided results into three altitude ranges: 75–345 , 345–585 and 585–855 According to Fig. 3, the measurements are within the residual layer, and in Rzecin the level 75–345 corresponds to the lower and middle part of the ABL, 345–585 reaches the top of the layer, and the third level of 585–855 is placed partly above the mean top of the ABL. The ABL is higher in Warsaw such that the three levels corresponds to its lower, middle and upper part, respectively. In spite of the scatter of results for individual 0.5 h averages, median values of the slopes of frequency spectra determined for the range , 0.3 s−1] (Fig. 9) clearly increase from values close to Kolmogorov's to around −1 after sunset. Analogously, slopes of the structure functions (Fig. 10) determined for the range r∈[40 m, 150 m] decrease with time for both sites, Rzecin and Warsaw. The inertial ranges of structure functions tend to be smaller than those for wind frequency spectra. Hence, due to the finite temporal resolution of the measurements, the calculated structure functions may be affected by large eddies from beyond the inertial range. As a result, the slopes of structure functions are gentler than the Kolmogorov predictions even at , especially for the Rzecin site. The slopes also show the altitude-dependent relation. What can be observed from both figures (Figs. 9 and 10) is that for Warsaw the median values of slopes at higher altitudes are much closer to Kolmogorov's predictions than they are for the rural case. This can be partly explained by the urban heat island effect and differences between the urban and rural morphologies. The turbulent flows are generated due to an intense shear at the top of the canopy layer H (Roth, 2000). In the urban environment, this is at the height of the rooftops of the buildings. In Warsaw, in a 1 km × 1 km area centered on the RS-Lab, H≈12.2 m. In Rzecin, the top canopy layer height reaches H=2–2.5 m. As far as the thermally driven turbulent flows are concerned, the city centers are usually warmer than the suburbs and areas of urban agglomeration because of the urban heat island phenomenon (Kuchcik et al., 2014; Stopa-Boryczka et al., 2002) and, related to this, have relatively high heat capacity (Oke, 1982) compared to the rural environment. This implies that the urban surface can still emit heat even after sunset. Heat emitted from a warm urban surface generates convection and mixes the air in the urban canopy layer. It also generates a dome of warm air in higher parts of the boundary layer. The temperature profile of this dome is quasi-adiabatic and similar to the temperature profiles around midday (Oke, 1987). Results presented in Figs. 9 and 10 suggest, however, that the heat island effects are most significant 2 h before sunset at the highest altitude range of 585–855 Afterwards, a rapid change in the scaling exponent is observed.
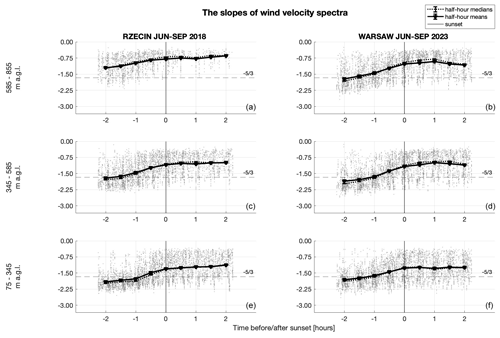
Figure 9Slopes of the frequency spectra of vertical wind, with means, medians and error estimates (see Appendix A) at different altitudes for data measured during the summer season (June–September) in rural and urban environments at the Rzecin PolWET station in 2018 (a, c, e) and Warsaw Observatory Station in 2023 (b, d, f), respectively.
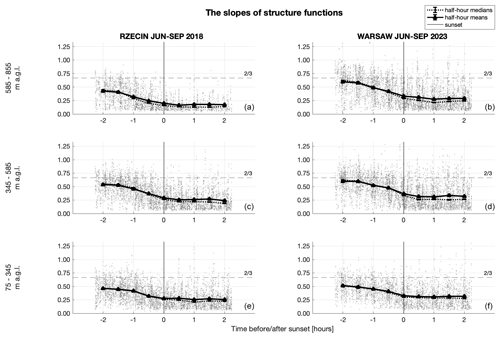
Figure 10Slopes of the second-order structure functions, means, medians and error estimates (see Appendix A) at different altitudes for data measured during the summer season (June–September) in rural and urban environments at the Rzecin PolWET station in 2018 (a, c, e) and Warsaw Observatory Station in 2023 (b, d, f), respectively.
In order to examine if the changes in the scaling exponent are induced by changes in the mean velocity, we analyzed how changes with time and height. If turbulence were Kolmogorov-like and the spectra were affected only by spurious modifications due to insufficient resolutions in time and space, then a decrease in mean velocity would increase the absolute value of the slopes by introducing artificial dissipation. An increase in the mean velocity, on the other hand, would bring the scaling closer to the Kolmogorov (or for the structure function) but not below this value. Figure 11 presents the mean horizontal velocity . As is seen in the figure, increases with time mostly close to the surface and only after sunset. At higher altitudes, it has only a slight tendency to increase. At the same time, the absolute values of slopes in Figs. 9 and 10 decrease considerably below and , respectively. Hence, we conclude that changes in the slopes are not primarily affected by the changes in the mean wind speed. Instead, the collapse of the largest convective motions possibly leads to the non-equilibrium states of turbulence as predicted by Eqs. (6) and (7). Later on, the size of the inertial range decreases and is shifted towards small scales (large wavenumber) which are not detected by the lidars.
A difference between rural and urban sites observed in Fig. 11 is that in the latter, mean velocity starts to slightly increase before sunset at low altitudes. As described by Mahrt (2017), when turbulence decreases rapidly, the airflow becomes more influenced by the surface heterogeneity and horizontal temperature variations. The temperature variations lead to local horizontal pressure gradients. These, in turn, could induce stronger horizontal winds to increase the horizontal temperature transport.
Mahrt (1981) discussed the formation of early-evening calm periods during which the mean velocity decreased in the surface layer and had a tendency to increase at higher altitudes. Busse and Knupp (2012), on the other hand, observed a decrease in the mean speed at altitudes of up to 500 m. The early-evening calm periods in the surface layer were also recorded in other studies (Mahrt et al., 2012; Román-Cascón et al., 2015). No systematic decrease in the mean wind speed is observed in Fig. 11 before sunset. However, we recall that, to calculate turbulence properties, we removed data for which the Taylor frozen-eddy hypothesis was not satisfied, that is data with a high ratio. This procedure could, to some extent, affect the tendencies observed in Fig. 11.
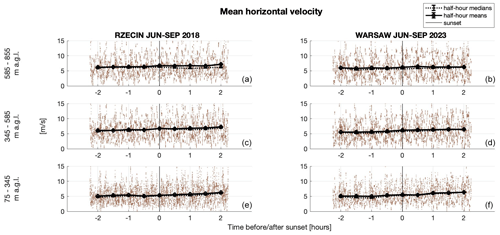
Figure 11Horizontal velocity, with means, medians and error estimates (see Appendix A) at different altitudes for data measured during the summer season (June–September) in rural and urban environments at the Rzecin PolWET station in 2018 (a, c, e) and Warsaw Observatory Station in 2023 (b, d, f), respectively.
The dependence of the integral length scales on time and altitude is presented in Fig. 12. The vertical integral length scales increase with the altitude. Moreover, at the urban site they are larger at higher altitudes, which follows from stronger convection and more shear-driven turbulent flows in this part of the ABL. As argued by Akinlabi et al. (2022), the roughness surface layer in cities may be higher than previously expected and can reach up to , where H is the mean height of buildings (at the Warsaw site, H≈12.2 m).
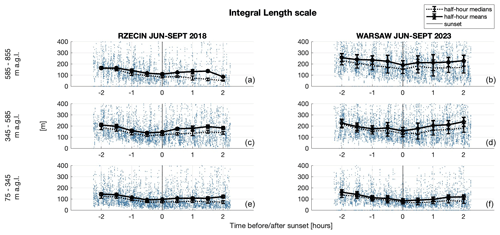
Figure 12Integral length scales at different altitudes for data, with means, medians and error estimates (see Appendix A), measured during the summer season (June–September) in rural and urban environments at the Rzecin PolWET station in 2018 (a, c, e) and Warsaw Observatory Station in 2023 (b, d, f), respectively.
According to Fig. 13, the turbulent velocity scale decreases with time for both rural and urban cases. In connection with the stable horizontal wind velocity, before and after sunset the figure shows that the observed turbulent flows are mostly driven by the convection, which agrees with our observational statement about the decay of the ABL and the presence of the decaying convection-driven turbulent flows before sunset.
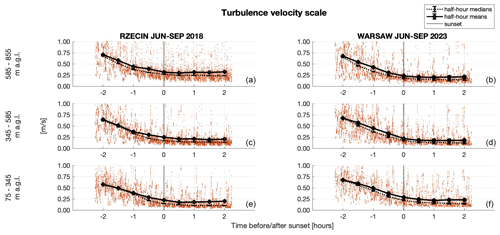
Figure 13Standard deviation of the vertical velocity component at different altitudes for data, with means, medians and error estimates (see Appendix A), measured during the summer season (June–September) in rural and urban environments at the Rzecin PolWET station in 2018 (a, c, e) and Warsaw Observatory Station in 2023 (b, d, f), respectively.
To study decay of turbulence with reference to the values measured 2 h before sunset, normalized 15 min median values of and , where and h), are plotted in Fig. 14. In this figure we include only data measured before sunset. It is seen that both turbulence kinetic energy and the integral length scale have a tendency to decrease with time before sunset. As follows from Eqs. (6) and (7), a decrease in the integral length scale during the decay of turbulence will cause increasing deviations from the Kolmogorov scaling. This appears to be the case in the observed decay of the convective boundary layer and explains the changes in the slopes, presented in Figs. 9 and 8.
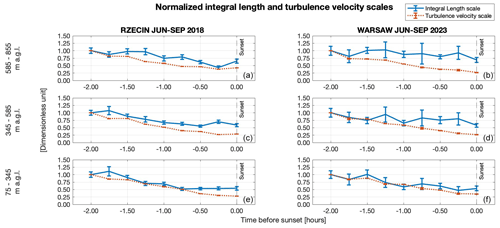
Figure 14Integral length scales and turbulence velocity scales before sunset normalized by the values measured at , with means, medians and error estimates (see Appendix A): the Rzecin PolWET station, rural environment (a, c, e), and Warsaw Observatory Station, urban environment (b, d, f).
We finally calculated the time derivatives and from the 0.5 h median values (for both sites and at all heights) for −2 h (evening hours) and present them in Fig. 15 as functions of Re. We compare experimental data with the classical predictions of Eqs. (11) and (15) with Cϵ=0.5 and the non-equilibrium predictions (17) and (18). The coefficients Ane, Bne and Cne in Eqs. (17) and (18) were estimated from linear regression as the best fit.
The errors in the estimates in Fig. 15 are considerable such that it is difficult to identify the scaling of . However, is clearly a decreasing function of the turbulence Reynolds number Re, as predicted by both equilibrium and non-equilibrium relations.
As far as is concerned, points follow the non-equilibrium scaling. As the Reynolds number decreases, both equilibrium and non-equilibrium predictions for become close, so we expect that at even lower Re values, the data will follow the equilibrium predictions. Hence, by analysis of both panels in Fig. 15, it can be concluded that the non-equilibrium decay is likely to be present in the initial stages.
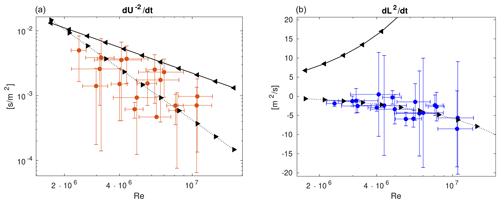
Figure 15(a) Dependence of on the Reynolds number. (b) Dependence of on the Reynolds number. Derivatives are estimated from half-hour medians and error estimates (see Appendix A) (symbols with error bars) compared to equilibrium relations (Eqs. 11 and 15) (solid lines) and non-equilibrium relations (Eqs. 17 and 18) (dotted lines).
5.5 Dissipation rates: comparison
Due to large deviations from the equilibrium scaling, the energy dissipation estimates with the use of Eq. (3) or Eq. (4) are not reliable at h. Therefore we used Eq. (4) to calculate the profile of ϵ only at h and for . An example of the second-order structure function is presented in Fig. 16a, and the dissipation rate, non-dimensionalized with the use of w* and the CBL height D, is presented in Fig. 16b and c, as a function of . We use these estimates for comparison with the predictions of Eqs. (1) and (2) in Fig. 17 and mark them as red dots at h. Figure 17 presents median dissipation values before sunset obtained using the classical Taylor law (Eq. 1), with Cϵ=0.5 and assuming the non-equilibrium scenario. In the latter, the dissipation rate is expected to follow the non-equilibrium relation (Eq. 2), until its values become equal to the predictions of the classical Taylor law (Eq. 1) but with a higher value of the constant Cϵ=1, which is the upper bound of the dissipation coefficient (Bos and Rubinstein, 2018). The dissipation rate further follows the equilibrium Taylor law (Eq. 1) with Cϵ=1. During this latter period, the frequency spectra will still deviate from Kolmogorov's scaling at low wavenumbers (Steiros, 2022b). The same is true for the structure functions; see Eq. (7). The equilibrium and slopes of spectra and structure functions will be reached asymptotically at high wavenumbers which are not measured by the lidar system. By comparing both scaling laws, it can be concluded that the equilibrium Taylor law underpredicts the dissipation rate of turbulence kinetic energy by up to a factor of 2.
The dissipation values decrease with altitude and in time. In Rzecin, the decrease is most rapid closer to the surface. Under the conditions of radiative cooling over a rural area, surface-based inversion is developed, which stops the air mixing above the ground faster than at the urban sites. As a consequence of very similar meteorological conditions for both stations (dry and warm conditions), we assume that the differences in turbulence properties result mainly from differences in surface morphology between both environments. Due to the difference in surface morphology, at the urban site the effect of wind shear and the presence of shear-driven turbulent flows are still significant at altitudes of 75–345 On the other hand, Fig. 17 suggests that at higher altitudes, the dissipation rates decrease in time much faster over the urban site. Shortly before sunset, the heat island effects are possibly much more limited in height.
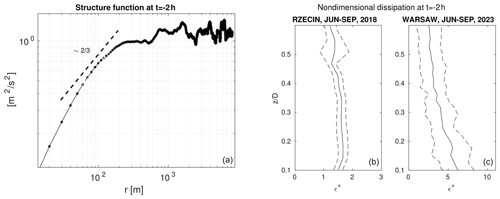
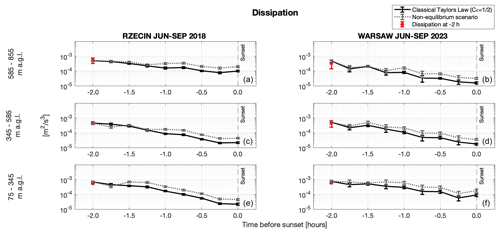
Figure 17The turbulence kinetic energy dissipation rate calculated from the equilibrium Taylor law (Eq. 1) and with the non-equilibrium scenario, with error estimates (see Appendix A) at different altitudes for data measured in rural and urban environments at the Rzecin PolWET station (a, c, e) and Warsaw Observatory Station (b, d, f), respectively. Dots at h are estimates from the second-order structure function.
The analysis performed in this work showed time, altitude and surface-type dependencies of the properties of turbulent flows during the evening transition at a time span of ±2 h relative to the sunset. The calculated slopes of the frequency spectra and structure function of vertical wind before sunset deviate increasingly from Kolmogorov's predictions, which agrees with the non-equilibrium scenario. These values also deviate more with altitude, implying the possible maximum height of the turbulence presence in the ABL during its rapid decay. We argued that it is possible to explain the increasing deviations of the slopes with the use of recent theories of turbulence. The crucial part was the observed decrease in the turbulence length scale, ℒ, during turbulence decay, which was also predicted by the non-equilibrium relations.
In this work we assumed that within the residual layer, where turbulence decays, the production and turbulent transport of kinetic energy are negligible such that, to the leading order, the time change in kinetic energy is balanced by the dissipation rate. Under these assumptions, the rates of change and can be expressed as functions of the turbulence Reynolds number Re. We choose as the initial condition h, when the estimated convective Deardorff scale w* is still larger than the friction velocity u*. For this choice, our results suggest that statistics follow non-equilibrium relations before sunset, when the turbulence Reynolds numbers are very high. Hence, non-equilibrium relations should be taken into account for the estimation of the dissipation rate of turbulence kinetic energy in the initial stages of decay.
Our work also shows differences in the turbulence properties between two different environments, the rural and urban. The latter is much more morphologically diverse and has a higher heat capacity. We found that over the urban area, turbulence is initially present at higher altitudes. Moreover, the convective timescale τ calculated 2 h before sunset is larger in Warsaw, which suggests that the decay of turbulence in the urban layer is slower as compared to the rural one. However, our observations suggest that this is the case only at lower altitudes. At heights of 585–855 , turbulence seems to decrease very rapidly over the urban site. Turbulence production by shear, which is affected by the surface morphology, could also contribute to the difference between the two environments, especially at lower altitudes. We conclude that the influence of the surface morphology and heat capacity on turbulence decay is significant and should be accounted for in parametrization schemes, which is in line with the results reported by Couvreux et al. (2016).
In the analyses we used the standard error of the mean (SEM) of a quantity 〈ϕ〉, defined as
where σ is the standard deviation and N is the number of samples. We assumed that the relative errors in median values are equal to the relative errors of the mean values. The uncertainties presented in Figs. 4–17 were determined as follows:
-
Errors in the ABL and CBL heights D presented in Fig. 3 were estimated as SEMs.
-
Errors in the buoyancy fluxes from Fig. 4 were determined from a sum of relative SEMs of temperature and temperature fluxes as
-
Error in the friction velocity u* in Fig. 5 was estimated as SEMs; errors in the Deardorff velocity w* and the timescale τ are defined as
-
To estimate errors in the turbulence velocity and length scales in Figs. 8, 12, 13 and 14, we took into account errors in vertical velocity measurements δw obtained from the HALO lidar toolbox (Manninen, 2019) and errors of the mean. The half-hour averages were calculated by averaging over time, and their measurement error is determined as
where Δt=0.5 h. Next, the mean values were calculated by averaging over N half-hour averages. Error of the mean value was calculated from the sum of squares of the measurement error δ𝒰2 and the convergence error as
The length scales ℒ were also calculated based on the vertical velocity measurements, and we assumed that their error consists of the measurement error δℒ and the convergence error Δℒsem as
-
Errors in the slopes in Figs. 9 and 10 and errors in the horizontal velocity in Fig. 11 were calculated as SEMs.
-
Derivatives presented in Fig. 15 were estimated as forward finite differences, and their errors were estimated as
-
Errors in the dissipation rate estimates in Fig. 16 are SEMs.
-
Errors in the dissipation rates presented in Fig. 17 are
in the equilibrium and non-equilibrium cases, respectively.
The Doppler lidar data from the Rzecin PolWET site used in this study are published in the Zenodo repository at https://doi.org/10.5281/zenodo.8181343 (Ortiz-Amezcua, P. and Alados-Arboledas, L., 2023) under the Creative Commons Attribution 4.0 International License. The Doppler lidar data from Warsaw Observatory Station are generated by the Aerosol, Clouds and Trace Gases Research Infrastructure (ACTRIS ERIC) and are available from the ACTRIS Data Centre at https://doi.org/10.60656/9d58dca11d6e4122 (Ortiz-Amezcua et al., 2024) under the Creative Commons Attribution 4.0 International License. The Doppler lidar high-level data products obtained for the purpose of this work are published in RepOD at https://doi.org/10.18150/LSLM10 (Karasewicz et al., 2024) the under Creative Commons Zero 1.0 License.
POA, MK, ŁJ, ISS and PP performed the measurements and collection of the data. MW, POA and ISS worked on the concept of this work and the methodology. POA, MW, MK and ISS contributed to the development of the code. POA and ŁJ developed the code and performed initial data analysis. MW contributed to the theory and its application in the data analysis and wrote the first draft of the manuscript. MK performed data curation and analysis. ISS, MW and MK contributed to the interpretation of the results and prepared the figures. CKB and PP performed calculations of the fluxes. MW, MK, CKB and PP worked on the revision of the manuscript and answers to the referees' comments. ISS instructed the measurements, supported the analysis, and provided effective and constructive comments to improve the manuscript. All authors contributed to the writing and revision of the text.
The contact author has declared that none of the authors has any competing interests.
Publisher's note: Copernicus Publications remains neutral with regard to jurisdictional claims made in the text, published maps, institutional affiliations, or any other geographical representation in this paper. While Copernicus Publications makes every effort to include appropriate place names, the final responsibility lies with the authors.
Patryk Poczta, Iwona S. Stachlewska and Pablo Ortiz-Amezcua performed the measurements in Rzecin in 2018 within the Technical assistance for Polish Radar and Lidar Mobile Observation System (POLIMOS) campaign funded by ESA ESTEC contract no. 4000119961/16/NL/FF/mg. We acknowledge the provision of technical support at the PolWET site by PULS led by PI Bogdan Chojnicki. We acknowledge provision of the Doppler lidar system thanks to GFAT-UGR led by PI Lucas Alados-Arboledas.
Pablo Ortiz-Amezcua, Marta Wacławczyk and Łucja Janicka performed the measurements in Warsaw in 2023 with support of the European Commission under the Horizon 2020 Research and Innovation Framework Programme with the ACTRIS IMP project (grant agreement no. 871115) and ATMO-ACCESS (grant agreement no. 101008004).
Pablo Ortiz-Amezcua, Maciej Karasewicz, Marta Wacławczyk and Iwona S. Stachlewska acknowledge financial support from the National Science Centre, Poland, through project 2021/40/C/ST10/00023 of the SONATINA 5 program; the algorithm to obtain the turbulent properties from the Doppler lidar measurements was developed within this project.
Marta Wacławczyk acknowledges financial support from the National Science Centre, Poland (project no. 2020/37/B/ST10/03695), through the OPUS 19 program; the theory of this paper was developed and its application to data analysis was carried out within this project.
Camilla Kassar Borges and Iwona S. Stachlewska acknowledge financial support of the National Science Centre, Poland, under the Weave-UNISONO program (project no. 2021/03/Y/ST10/00206); the calculations of the surface flux in Warsaw were made within this project.
The experimental sites in Rzecin and Warsaw are a part of the Aerosol, Clouds and Trace Gases Research Infrastructure (ACTRIS ERIC; https://www.actris.eu/, last access: 6 September 2024).
This research has been supported by the European Space Agency (grant no. 4000119961/16/NL/FF/mg), Horizon 2020 (ACTRIS IMP project (grant no. 871115) and ATMO-ACCESS (grant no. 101008004)) and the Narodowe Centrum Nauki (grant nos. 2021/40/C/ST10/00023, 2020/37/B/ST10/03695 and 2021/03/Y/ST10/00206).
This paper was edited by Michael Tjernström and reviewed by Lakshmi Kantha and one anonymous referee.
Akinlabi, E., Maronga, B., Giometto, M. G., and Li, D.: Dispersive Fluxes Within and Over a Real Urban Canopy: A Large-Eddy Simulation Study, Bound.-Lay. Meteorol., 185, 93–128, https://doi.org/10.1007/s10546-022-00725-6, 2022. a
Banakh, V. A., Smalikho, I. N., Falits, A. V., and Sherstobitov, A. M.: Estimating the Parameters of Wind Turbulence from Spectra of Radial Velocity Measured by a Pulsed Doppler Lidar, Remote Sens., 13, 2071, https://doi.org/10.3390/rs13112071, 2021. a, b
Bolgiano, R.: Turbulent spectra in a stably stratified atmosphere, J. Geophys. Res., 64, 2226–2229, 1959. a
Bos, W. and Rubinstein, R.: Dissipation in unsteady turbulence, Phys. Rev. Fluids, 2, 022 601(R), https://doi.org/10.1103/PhysRevFluids.2.022601, 2018. a, b, c, d
Busse, J., and K. Knupp: Observed Characteristics of the Afternoon–Evening Boundary Layer Transition Based on Sodar and Surface Data, J. Appl. Meteor. Climatol., 51, 571–582, 2012. a
Cheng, Y., Li, Q., Argentini, S., Sayde, C., and Gentine, P.: A model for turbulence spectra in the equilibrium range of the stable atmospheric boundary layer, J. Geophys. Res.-Atmos., 125, e2019JD032191, https://doi.org/10.1029/2019JD032191, 2020. a
Couvreux, F., Bazile, E., Canut, G., Seity, Y., Lothon, M., Lohou, F., Guichard, F., and Nilsson, E.: Boundary-layer turbulent processes and mesoscale variability represented by numerical weather prediction models during the BLLAST campaign, Atmos. Chem. Phys., 16, 8983–9002, https://doi.org/10.5194/acp-16-8983-2016, 2016. a
Darbieu, C., Lohou, F., Lothon, M., Vilà-Guerau de Arellano, J., Couvreux, F., Durand, P., Pino, D., Patton, E. G. Nilsson, E., Blay-Carreras, E. and Gioli, B.: Turbulence vertical structure of the boundary layer during the afternoon transition, Atmos. Chem. Phys., 15, 10071–10086, https://doi.org/10.5194/acp-15-10071-2015, 2015. a, b
Dang, R., Yang, Y., Li, H., Hu, X., Wang, Z., and Zhang, S.: A Review of Techniques for Diagnosing the Atmospheric Boundary Layer Height (ABLH) Using Aerosol Lidar Data, Remote Sens., 11, 1590, https://doi.org/10.3390/rs11131590, 2019. a
Deardorff, J. W.: Convective Velocity and Temperature Scales for the Unstable Planetary Boundary Layer and for Rayleigh Convection, J. Atmos. Sci., 27, 1211–1213, 1970. a
Dewani, N., Sakradzija, M., Schlemmer, L., Leinweber, R., and Schmidli, J.: Dependency of vertical velocity variance on meteorological conditions in the convective boundary layer, Atmos. Chem. Phys., 23, 4045–4058, https://doi.org/10.5194/acp-23-4045-2023, 2023. a, b
Edokpa, D. and Nwagbara, M.: Atmospheric Stability across the Lower Troposphere in Enugu City, Nigeria, Journal of Geography, Environ. Earth Sci. Int., 15, 1–10, 2018. a
El Guernaoui, O., Reuder, J., and Esau, I. E. A.: Scaling the decay of turbulence kinetic energy in the free-convective boundary layer, Bound.-Lay. Meteorol., 173, 79–97, https://doi.org/10.1007/s10546-019-00458-z, 2019. a, b
Frehlich, R.: Coherent Doppler lidar signal covariance including wind shear and wind turbulence, Appl. Opt., 33, 6472–6481, 1994. a
Frehlich, R. and Cornman, L.: Coherent Doppler lidar signal spectrum with wind turbulence, Appl. Opt., 38, 7456–7466, 1999. a
Goto, S. and Vassilicos, J. C.: Unsteady turbulence cascades, Phys. Rev. E, 94, 053108, https://doi.org/10.1103/PhysRevE.94.053108, 2016. a, b, c, d
IMGW-PIB, Polish Institute of Meteorology and Water Management – National Research Institute: https://dane.imgw.pl/data/dane_pomiarowo_obserwacyjne/ (last access: 20 July 2024), data from Szamotuły-Baborówko (no. 252160110) and Warszawa-Filtry (no. 252200230) stations of the Institute of Meteorology and Water Management – National Research Institute have been processed, 2024a. a, b
IMGW-PIB, Polish Institute of Meteorology and Water Management – National Research Institute: https://klimat.imgw.pl/pl/climate-normals/ (last access: 20 July 2024), data from Warszawa (no. 12375) station of the Institute of Meteorology and Water Management – National Research Institute have been processed, 2024b. a
Karasewicz, M., Wacławczyk, M., Ortiz-Amezca, P., and Stachlewska, I. S.: Turbulence properties for June-September period at rural and urban environment, RepOD, V1 [data set], https://doi.org/10.18150/LSLM10, 2024. a
Kuchcik, M., Błażejczyk, K., Milewski, P., and Szmyd, J.: Urban climate research in Warsaw: The results of microclimatic network measurements, Geogr. Pol., 87, 491–504, 2014. a
Lampert, A., Pätzold, F., Jiménez, M. A., Lobitz, L., Martin, S., Lohmann, G., Canut, G., Legain, D., Bange, J., Martínez-Villagrasa, D., and Cuxart, J.: A study of local turbulence and anisotropy during the afternoon and evening transition with an unmanned aerial system and mesoscale simulation, Atmos. Chem. Phys., 16, 8009–8021, https://doi.org/10.5194/acp-16-8009-2016, 2016. a
Launder, B. E., and Sharma, B. I.: Application of the Energy Dissipation Model of Turbulence to the Calculation of Flow Near a Spinning Disc, Lett. Heat Mass Transf., 1, 131–138, 1974. a
Lenschow, D. H., Mann J., and Kristensen, L., How long is long enough when measuring fluxes and other turbulence statistics?, J. Atmos. Ocean. Technol., 11, 661–673, 1994. a
Liu, Z., Chang, J., Li, H., Chen, S., and Dai, T.: Estimating Boundary Layer Height from LiDAR Data under Complex Atmospheric Conditions Using Machine Learning, Remote Sens., 14, 418, https://doi.org/10.3390/rs14020418, 2022. a
Lothon, M., Lenschow, D. H., and Mayor, S. D.: Doppler Lidar Measurements of Vertical Velocity Spectra in the Convective Planetary Boundary Layer, Bound.-Lay. Meteorol., 132, 205–226, 2009. a
Lothon, M., Lohou, F., Pino, D., Couvreux, F., Pardyjak, E. R., Reuder, J., Vilà-Guerau de Arellano, J., Durand, P., Hartogensis, O., Legain, D., Augustin, P., Gioli, B., Lenschow, D. H., Faloona, I., Yagüe, C., Alexander, D. C., Angevine, W. M., Bargain, E., Barrié, J., Bazile, E., Bezombes, Y., Blay-Carreras, E., van de Boer, A., Boichard, J. L., Bourdon, A., Butet, A., Campistron, B., de Coster, O., Cuxart, J., Dabas, A., Darbieu, C., Deboudt, K., Delbarre, H., Derrien, S., Flament, P., Fourmentin, M., Garai, A., Gibert, F., Graf, A., Groebner, J., Guichard, F., Jiménez, M. A., Jonassen, M., van den Kroonenberg, A., Magliulo, V., Martin, S., Martinez, D., Mastrorillo, L., Moene, A. F., Molinos, F., Moulin, E., Pietersen, H. P., Piguet, B., Pique, E., Román-Cascón, C., Rufin-Soler, C., Saïd, F., Sastre-Marugán, M., Seity, Y., Steeneveld, G. J., Toscano, P., Traullé, O., Tzanos, D., Wacker, S., Wildmann, N., and Zaldei, A.: The BLLAST field experiment: Boundary-Layer Late Afternoon and Sunset Turbulence, Atmos. Chem. Phys., 14, 10931–10960, https://doi.org/10.5194/acp-14-10931-2014, 2014. a, b
Mahrt, L.: The near-surface evening transition, Q. J. Roy. Meteorol. Soc., 143, 2940–2948, 2017. a
Mahrt, L.: The early evening boundary layer transition, Q. J. Roy. Meteorol. Soc., 107, 329–343, 1981. a
Mahrt, L., Richardson, S., Seaman, N., and Stauffer, D.: Non-stationary drainage flows and motions in the cold pool, Tellus A, 62, 698–705, 2010. a
Manninen, A. J.: HALO lidar toolbox, GitHub, available at: https://github.com/manninenaj/HALO_lidar_toolbox (last access: August 2024), 2019. a, b
Manninen, A. J., O'Connor, E. J., Vakkari, V., and Petäjä, T.: A generalised background correction algorithm for a Halo Doppler lidar and its application to data from Finland, Atmos. Meas. Tech., 9, 817–827, https://doi.org/10.5194/amt-9-817-2016, 2016. a, b
Meldi, M. and Sagaut, P.: Investigation of anomalous very fast decay regimes in homogeneous isotropic turbulence, J. Turb., 19, 390–413, 2018. a
Nadeau, D. F., Pardyjak, E. R., Higgins, C. W., Fernando, H. J. S., and Parlange, M. B.: A simple model for the afternoon and early evening decay of convective turbulence over different land surfaces, Bound.-Lay. Meteorol., 141, 301–324, 2011. a, b, c
Nieuwstadt, F. T. M. and Brost, R. A.: The decay of convective turbulence, J. Atmos Sci., 43, 532–546, 1986. a
Nilsson, E., Lohou, F., Lothon, M., Pardyjak, E., Mahrt, L., and Darbieu, C.: Turbulence kinetic energy budget during the afternoon transition – Part 1: Observed surface TKE budget and boundary layer description for 10 intensive observation period days, Atmos. Chem. Phys., 16, 8849–8872, https://doi.org/10.5194/acp-16-8849-2016, 2016. a
Nowak, J. L., Siebert, H., Szodry, K.-E., and Malinowski, S. P.: Coupled and decoupled stratocumulus-topped boundary layers: turbulence properties, Atmos. Chem. Phys., 21, 10965–10991, https://doi.org/10.5194/acp-21-10965-2021, 2021. a
Obligado, M. and Vassilicos, J. C.: The non-equilibrium part of the inertial range in decaying homogeneous turbulence, EPL, 127, 64004, https://doi.org/10.1209/0295-5075/127/64004, 2019. a, b
Obligado, M., Brun, C., and Silvestrini, J. E. A.: Dissipation scalings in the turbulent boundary layer at moderate Reθ, Flow Turb. Comb., 108, 105–122, https://doi.org/10.1007/s10494-021-00270-1, 2022. a
O'Connor, E. J., Illingworth, A. J., Brooks, I. M., Westbrook, C. D., Hogan, R. J., Davies, F., and Brooks, B. J.: A Method for Estimating the Turbulent Kinetic Energy Dissipation Rate from a Vertically Pointing Doppler Lidar, and Independent Evaluation from Balloon-Borne In Situ Measurements, J. Atmos. Ocean. Technol., 27, 1652–1664, 2010. a, b
Oke, T.: The energetic basis of urban heat island, Q. J. Roy. Meteorol. Soc., 108, 1–24, 1982. a
Oke, T. R.: Boundary Layer Climates (2nd ed.), Routledge, 464 pp., https://doi.org/10.4324/9780203407219, 1987. a, b
Ortiz-Amezcua, P., and Alados-Arboledas, L., Doppler lidar vertical wind profiles from Rzecin during POLIMOS 2018, Zenodo [data set], https://doi.org/10.5281/zenodo.8181343, 2023. a
Ortiz-Amezcua, P., Martínez-Herrera, A., Manninen, A. J., Pentikäinen, P., O'Connor, E. J., Guerrero-Rascado, J. L., and Alados-Arboledas, L.: Wind and turbulence statistics in the urban boundary layer over a mountain-valley system in Granada, Spain, Remote Sens., 14, 2321, https://doi.org/10.3390/rs14102321, 2022. a
Ortiz-Amezcua, P., Janicka, Ł., and Stachlewska, I.: Custom collection of doppler lidar data from Warsaw between 1 Jun and 30 Sep 2023, ACTRIS Cloud remote sensing data centre unit (CLU), Cloudnet Data Portal [data set], https://doi.org/10.60656/9d58dca11d6e4122, 2024. a
Päschke, E., Leinweber, R., and Lehmann, V.: An assessment of the performance of a 1.5 μm Doppler lidar for operational vertical wind profiling based on a 1-year trial, Atmos. Meas. Tech., 8, 2251–2266, https://doi.org/10.5194/amt-8-2251-2015, 2015. a
Pearson, G., Davies, F., and Collier, C.: An analysis of the performance of the UFAM pulsed Doppler lidar for observing the boundary layer, J. Atmos. Ocean. Technol., 26, 240–250, https://doi.org/10.1175/2008JTECHA1128.1, 2009. a, b
Poczta, P., Urbaniak, M., Sachs, T., Harenda, K.M., Klarzyńska, A., Juszczak, R., Schüttemeyer, D., Czernecki, B., Kryszak, A., and Chojnicki, B. H.: A multi-year study of ecosystem production and its relation to biophysical factors over a temperate peatland, Agr. Forest Meteorol., 338, 109529, https://doi.org/10.1016/j.agrformet.2023.109529, 2023. a, b
Pope, S. B.: Turbulent flows, Cambridge University Press, Cambridge, 771 pp., https://doi.org/10.1017/CBO9780511840531, 2000. a, b
Román-Cascón, C., Yagüe, C., Mahrt, L., Sastre, M., Steeneveld, G.-J., Pardyjak, E., van de Boer, A., and Hartogensis, O.: Interactions among drainage flows, gravity waves and turbulence: a BLLAST case study, Atmos. Chem. Phys., 15, 9031–9047, https://doi.org/10.5194/acp-15-9031-2015, 2015. a
Roth, M.: Review of atmospheric turbulence over cities, Q. J. Roy. Meteorol. Soc., 126, 941–990, 2000. a
Rye, B. J. and Hardesty, R. M.: Discrete spectral peak estimation in incoherent backscatter heterodyne lidar. I. Spectral accumulation and the Cramer-Rao lower bound, Geoscience and Remote Sensing, IEEE Transactions, 31, 16–27, 1993. a
Sagaut P., and Cambon, C.: Homogeneous turbulence dynamics, Springer, 897 pp., https://doi.org/10.1007/978-3-319-73162-9, 2018. a
Sanchez Gomez, M., Lundquist, J. K., Klein, P. M., and Bell, T. M.: Turbulence dissipation rate estimated from lidar observations during the LAPSE-RATE field campaign, Earth Syst. Sci. Data, 13, 3539–3549, https://doi.org/10.5194/essd-13-3539-2021, 2021. a
Schröder, M., Bätge, T., Bodenschatz, E., Wilczek, M., and Bagheri, G.: Estimating the turbulent kinetic energy dissipation rate from one-dimensional velocity measurements in time, Atmos. Meas. Tech., 17, 627–657, https://doi.org/10.5194/amt-17-627-2024, 2024. a
Sorbjan Z.: Decay of convective turbulence revisited, Bound.-Lay. Meteorol., 82, 501–515, 1997. a
Steiros, K.: Balanced nonstationary turbulence, Phys. Rev. E, 105, 035109, https://doi.org/10.1103/PhysRevE.105.035109, 2022a. a, b
Steiros, K.: Turbulence near initial conditions, Phys. Rev. Fluids, 10, 104607, https://doi.org/10.1103/PhysRevFluids.7.104607, 2022b. a, b, c, d, e, f
Stopa-Boryczka, M., Kopacz-Lembowicz, M., and Wawer, J.: The climate of Warsaw in the research conducted at the department of climatology of Warsaw Univeristy, Warszawa 2002, Miscellanea Geographica, 10, 119–129, 2002. a
Svensson, M. K.: Sky view factor analysis – implications for urban air temperature differences, Met. Apps, 11, 201–211, 2004. a
Taylor, G. I.: Statistical theory of turbulence, Proc. R. Soc. Lond. A, 151, 421–444, 1935. a
Valente, P. C., and Vassilicos, J. C.: Universal dissipation scaling for nonequilibrium turbulence, Phys. Rev. Lett., 108, 214 503, https://doi.org/10.1103/PhysRevLett.108.214503, 2012. a
Vassilicos, J. C.: Dissipation in turbulent flows, Annu. Rev. Fluid Mech. 47, 95–114, https://doi.org/10.1146/annurev-fluid-010814-014637, 2015. a, b, c, d
Wacławczyk, M., Nowak, J. L., Siebert, H., and Malinowski, S. P.: Detecting non-equilibrium states in atmospheric turbulence, J. Atmos. Sci., 79, 2757–2772, https://doi.org/10.1175/JAS-D-22-0028.1, 2022. a, b
Wacławczyk, M., Gozingan, A. S., Nzotungishaka, J., Mohammadi, M., and Malinowski, S. P.: Comparison of different techniques to calculate properties of atmospheric turbulence from low-resolution data, Atmosphere 11, 199, https://doi.org/10.3390/atmos11020199, 2020. a
Wacławczyk, M., Ma, Y.-F., Kopeć, J. M., and Malinowski, S. P.: Novel approaches to estimating the turbulent kinetic energy dissipation rate from low- and moderate-resolution velocity fluctuation time series, Atmos. Meas. Tech., 10, 4573–4585, https://doi.org/10.5194/amt-10-4573-2017, 2017. a
Wacławczyk, T.: Modeling of non-equilibrium effects in intermittency region between two phases, Int. J. Multiphase Flow, 134, 103459, https://doi.org/10.1016/j.ijmultiphaseflow.2020.103459, 2021. a
Wang, D., Stachlewska, I. S., Song, X., Heese, B., and Nemuc, A.: Variability of the Boundary Layer Over an Urban Continental Site Based on 10 Years of Active Remote Sensing Observations in Warsaw, Remote Sens. 12, 340, https://doi.org/10.3390/rs12020340, 2020. a, b
Vakkari, V., Manninen, A. J., O'Connor, E. J., Schween, J. H., van Zyl, P. G., and Marinou, E.: A novel post-processing algorithm for Halo Doppler lidars, Atmos. Meas. Tech., 12, 839–852, https://doi.org/10.5194/amt-12-839-2019, 2019. a
Xie, J.-H. and Huang, S.-D.: Bolgiano–Obukhov scaling in two-dimensional isotropic convection, J. Fluid Mech., 942, A19, 2022. a
Zheng, Y., Nakamura, K., Nagata, K., and Watanabe, T.: Unsteady dissipation scaling in static- and active-grid turbulence, J. Fluid Mech., 956, A20, https://doi.org/10.1017/jfm.2022.937, 2023. a


