the Creative Commons Attribution 4.0 License.
the Creative Commons Attribution 4.0 License.
Projected future changes in extreme precipitation over China under stratospheric aerosol intervention in the UKESM1 climate model
Ou Wang
Yuchen Gu
Jim M. Haywood
Ying Chen
Chenwei Fang
Extreme precipitation events are linked to severe economic losses and casualties in China every year; hence, exploring the potential mitigation strategies to minimize these events and their changes in frequency and intensity under global warming is of importance, particularly for the populous subregions. In addition to global warming scenarios, this study examines the effects of the potential deployment of stratospheric aerosol injection (SAI) on hydrological extremes in China based on the SAI simulations (G6sulfur) of the Geoengineering Model Intercomparison Project (GeoMIP) by the UK Earth System Model (UKESM1) simulations. G6sulfur is compared with simulations of the future climate under two different emission scenarios (SSP5-8.5 and SSP2-4.5) and a reduction in the solar constant (G6solar) to understand the effect of SAI on extreme precipitation patterns. The results show that under global warming scenarios, precipitation and extreme wet climate events during 2071–2100 are projected to increase relative to the control period (1981–2010) across all the subregions in China. Extreme drought events show a projected increase in southern China. The G6sulfur and G6solar experiments show statistically similar results to those under SSP2-4.5 in extreme precipitation intensities of China in UKESM1. These results are encouraging. The efficacy of SAI in decreasing extreme precipitation events and consecutive wet days is more pronounced than that of G6solar when compared to SSP2-4.5. While both G6sulfur and G6solar show drying at high-latitude regions, which is consistent with our understanding of the spin-down of the hydrological cycle under SRM. Given the limitations of the current model and the small ensemble size, and considering that the hydrological effects are less beneficial than those indicated for temperature, it is recommended that further, more comprehensive research be performed, including using multiple models, to better understand these impacts.
- Article
(11306 KB) - Full-text XML
-
Supplement
(1487 KB) - BibTeX
- EndNote
China, as a country that hosts the world's second-largest population, is acutely vulnerable to extreme hydrological events caused by climate change. For example, climate change can cause sea level rise which could significantly impact flooding hazards for coastal cities in China, and flooding events in China are consistently projected to increase under the influence of rising greenhouse gas (GHG) emissions. For example, studies show that precipitation and flooding caused by heavy rainfall events will increase across China by the end of the 21st century (Ying et al., 2014; Yang et al., 2021; Zhang and Zhou, 2020).
Extreme precipitation events appear to have impacted China more frequently in recent years. For example, severe flooding affected southern, eastern, and parts of central China in the summer of 2020 (Jia et al., 2022), and extremely intense hourly and daily precipitation also occurred over Zhengzhou (central China) in 2021 (Zhao et al., 2021; Dong et al., 2022). Typhoon Doksuri in 2023 resulted in significant flooding in China, setting records near Beijing, while Yunnan province experienced its most severe drought since 1961 (WMO, 2024). These events suggest a potential expansion of regions that could be influenced by increasing precipitation under the changing climate. On a global scale, climate change has been influencing hydroclimatic conditions (Donat et al., 2016; Pendergrass and Knutti, 2018).
The direct influence of global warming is that rising atmospheric temperatures induce stronger evapotranspiration, and the atmosphere can hold more water vapour. The intensified hydrological cycle exacerbates heavy rainfall and flooding but can also contribute to further drying over land areas and prolonged drought periods (IPCC, 2021). Consequently, precipitation tends to increase significantly during events commonly classified as extreme in response to warming (Pendergrass and Knutti, 2018). Extreme weather events, including droughts and flooding, could be worsened by global warming. A global scale study indicates that global warming will potentially increase drought severity, as well as drought frequency, in the future (Qi et al., 2022). Flooding events also occur at a higher frequency and intensity under extreme precipitation amplification (Tabari, 2020). Weather and climate disasters such as extreme temperatures and severe snowstorms have caused serious economic losses in densely populated east Asian countries (Huang et al., 2007; Li et al., 2016). An increase in precipitation projected by current climate models, particularly that projected over the populated areas in east Asia, such as China (Liang and Haywood, 2023), indicates an urgent need for mitigation efforts (i.e. reducing carbon emissions) to prevent worsening impacts from climate change. However, it has been suggested that climate interventions could complement these actions in further mitigating the impacts of climate change.
Owing to the difficulties in achieving climate targets such as the 1.5 or 2 °C above pre-industrial levels proposed by the 21st Conference of the Parties (COP 21) of the United Nations Framework Convention on Climate Change (UNFCCC) in 2015 (Rhodes, 2016; Klein et al., 2017), Solar Radiation Modification (SRM) proposals, i.e. strategies to mitigate the worst impacts of climate change by brightening the planet, have been developed. To understand the robust climate model responses to geoengineering, the Geoengineering Model Intercomparison Project (GeoMIP) was established to provide a comprehensive multi-model assessment of the effects of SRM (Kravitz et al., 2013, 2011). Numerous studies support these effects associated with volcanic eruptions and their simulation through stratospheric aerosol injection (SAI) techniques (e.g. Imai et al., 2020; McLandress et al., 2011; Jones et al., 2018, 2021; Liang and Haywood, 2023; Lee et al., 2021; Plazzotta et al., 2019). G6sulfur experiment is one of the most prominent SRM strategies of recent simulations (Tilmes et al., 2022). To some extent, SAI can partially counteract climate warming by injecting reflective particles, or their gaseous precursors, into the stratosphere (Zarnetske et al., 2021). In addition to reducing the temperature, SAI also influences tropospheric and stratospheric ozone, terrestrial ecosystem, terrestrial carbon, and hydrological cycle by changing the physical climate system and atmospheric chemistry. Thus, SAI would come with some adverse consequences, including stratospheric polar ozone depletion, leading to increased surface UV radiation and increased sulfate deposition to the surface (acid rain). Moreover, the potential risks of abrupt termination also reveal significant changes in temperature and precipitation velocities, with potential severe impacts on ecological systems (e.g. Trisos et al., 2018). Despite the numerous drawbacks (e.g. Robock et al., 2008), its potential climate regulation effects make it arguably a plausible strategy to address escalating climate change challenges.
The latest phase of policy-relevant GeoMIP simulations (GeoMIP6) proposed two new experiments, G6sulfur and G6solar (Kravitz et al., 2015), which are designed to simulate the influence of SAI and solar constant reduction to the end of the 21st century, based on predicted future emission pathways (Shared Socioeconomic Pathways – SSPs). G6sulfur and G6solar aim to lower global mean surface temperatures from a high-tier emission scenario (SSP5-8.5; Meinshausen et al., 2020) to a medium-tier emission scenario (SSP2-4.5). Previous studies from a range of modelling experiments indicate that SAI will exert a negative radiative forcing and reduce mean surface air temperature and may reduce global mean precipitation (Liu et al., 2021; Pinto et al., 2020; Simpson et al., 2019). For example, the GLENS experiments revealed significant alterations in precipitation patterns across tropical and midlatitude regions when stratospheric sulfur is used to moderate global mean temperatures (Simpson et al., 2019). Although SAI can effectively moderate global mean temperature increases, it cannot fully offset the effects at the regional scale (Niemeier et al., 2013; Tilmes et al., 2013; Tye et al., 2022). Furthermore, the climate effects in terms of magnitude, as well as spatial and temporal distribution, depend largely on the scenario of SAI deployment. To date, only a few studies have concentrated on the impact of SAI on the future changes in weather systems over east Asia (Liang and Haywood, 2023; Liu et al., 2023; Tew et al., 2023).
In this study, we focus on the potential effects of SAI on hydrological extremes over China. Based on simulations of the UKESM1 model and CMIP6 experiments, our study explores the differences in the frequency and intensity of extreme precipitation between scenarios of projected warming alone and warming with solar geoengineering (G6sulfur and G6solar). The results of the period towards the end of this century, 2070–2100, were compared with that of the control period (CP; 1981–2010). Section 2 describes the experimental design and details of the model used in this study. In Sect. 3, results are presented to show the changes in extreme indices in China under the SAI (G6sulfur) and solar constant reduction (G6solar) during 2071–2100, compared to the CP and future emission scenarios (SSP5-8.5 and SSP2-4.5). The regional analysis of China's extreme precipitation and cumulative distribution function is also provided in Sect. 3. Section 4 summarizes and discusses the findings.
2.1 Study area
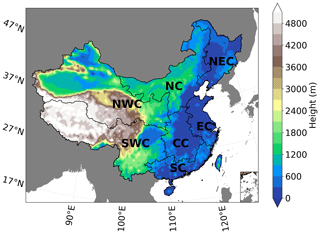
To quantitatively examine regional differences and better visualize the future extreme climate features, China is divided into seven different sub-regions (Fig. 1) to distinguish extreme climates across the following regions: northeast China (NEC), north China (NC), northwest China (NWC), central China (CC), east China (EC), south China (SC), and southwest China (SWC), following Liang et al. (2023).
2.2 UKSEM1 model and model simulations
This study was based on the simulations by the UK Earth System Model, UKESM1 (Sellar et al., 2019). UKESM1 contains the sophisticated United Kingdom Chemistry and Aerosols (UKCA) module that represents the sulfur cycle in the troposphere and stratosphere (Archibald et al., 2020), is a fully coupled model with a resolution of 1.25° latitude by 1.875° longitude (Storkey et al., 2018; Walters et al., 2019; Mulcahy et al., 2018; Sellar et al., 2019), and contributes to both CMIP6 and GeoMIP6 (Jones et al., 2021). The Scenario Model Intercomparison Project (ScenarioMIP) high-GHG-forcing scenario, SSP5-8.5 (O'Neill et al., 2016), is used as the baseline scenario of both G6solar and G6sulfur experiments (Kravitz et al., 2015). The SSP scenarios were developed by the Coupled Model Intercomparison Project Phase 6 (CMIP6; Eyring et al., 2016), which provides multi-model climate projections based on alternative scenarios of future emissions and land use changes produced by integrated assessment models (O'Neill et al., 2016). Studies such as Jones et al. (2021) and Ji et al. (2018) included detailed descriptions and explanations of the CMIP6, GeoMIP, and the differences in the models' assumptions. In the G6sulfur experiment, UKESM1 simulates SO2 injection in the stratosphere along the Greenwich meridian at an altitude of 18–20 km between 10° N and 10° S (Kravitz et al., 2015; Haywood et al., 2022). A parallel experiment to the G6sulfur, the G6solar experiment, reduces the ScenarioMIP high-forcing scenario to the medium-forcing scenario by reducing solar irradiance. Notably, it is anticipated that the G6solar will exhibit reduced inter-model disparities in the spatial distribution of forcing when compared to the G6sulfur, owing to model differences in representing the complexities of the sulfur cycle within global models. Therefore, the G6solar is proposed as a parallel experiment to the G6sulfur for the purpose of comparing the impacts of solar reduction with those of stratospheric aerosols (Kravitz et al., 2015).
In the UKESM1 model, three ensemble members, “r1i1p1f2”, “r4i1p1f2”, and “r8i1p1f2”, are run for the G6sulfur and the G6solar, as specified in the GeoMIP protocol (Kravitz et al., 2015). We calculated the ensemble mean for all simulations, including SSP5-8.5, SSP2-4.5, G6sulfur, G6solar, and historical data (defined as CP in this study). Future changes in extreme climates were assessed by comparing the future simulations (SSP5-8.5, SSP2-4.5, G6sulfur, and G6solar) for the period 2071–2100 with the CP of 1981–2010, using the UKESM1 historical simulations for CMIP6. The results for the future 30 years of the 21st century (2071–2100) from the simulations were used to investigate the influences of the G6sulfur and the G6solar experiments.
2.3 APHRODITE precipitation data
The APHRODITE (Asian Precipitation – Highly-Resolved Observational Data Integration Towards Evaluation) dataset was created from spatial interpolation of gauge observation data with a resolution of 0.25° × 0.25° (Lai et al., 2020; Yatagai et al., 2012) and was used to validate the performance of the UKESM1 model in simulating the CP extremes. APHRODITE is a dataset containing long-term gridded daily precipitation (1951–2015). The high-resolution daily product of APHRODITE is developed based on the rain gauge data across Asia presented on a continental scale (Sunilkumar et al., 2019). In this study, we applied APHRODITE's climatological daily mean precipitation as observation data for validating the UKEMS1 simulations.
2.4 Extremes precipitation indices
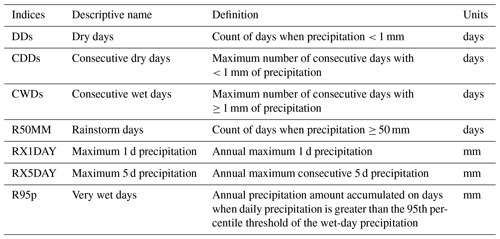
To quantify extreme precipitation, a range of indices were defined by the World Climate Research Programme (WCRP). In this study, eight extreme indices were selected according to the WCRP's Expert Team on Climate Change Detection and Indices (ETCCDI) (Frich et al., 2002; Klein Tank et al., 2009), as shown in Table 1.
2.5 Statistical methods and cumulative distribution functions (CDFs)
At first, for validating the model simulations, the APHRODITE data were re-gridded to the resolution of the UKESM1 ensemble mean data. To examine the statistical importance of the changes in precipitation between different experiments, we performed the Wilcoxon rank sum test. The Wilcoxon rank sum test works as a non-parametric two-sample t test and is more appropriate for use with atmospheric data (Wilks, 2011) with a 5 % confidence level of statistical significance.
To better visualize the future extreme climate features and the effects of SAI, the cumulative distribution functions (CDFs) for precipitation have been calculated. CDFs is frequently employed for bias correction to enhance the accuracy of precipitation analysis (e.g. Apurv et al., 2015; Rana et al., 2014; Xiong et al., 2019). This approach allows for a nuanced exploration of the distribution, accommodating the continuous and discrete aspects of our dataset. The calculated CDFs offer a holistic perspective, providing insights into the probability distribution patterns for various events over the study period.
Unlike Tung et al. (2022), where CDFs were employed, a choice was made to use reversed CDFs in our study to better illustrate the thresholds for extreme precipitation events exceeding certain values. To achieve this, during the continuous 30-year study period, we computed the average annual extreme precipitation index values for each grid point and plotted their CDFs over all grid points in a region.
To establish the CDFs for an extreme precipitation index, first, the yearly mean extreme precipitation index was calculated over the three ensemble model members and the 30 years at each grid point. Then, for each region and the whole of China, the empirical CDFs (ECDFs) of the extreme precipitation index were statistically established as histograms, based on the values over all the grids. To achieve a smooth representation of the distribution, we applied a Gaussian smoothing technique. By doing so, we were able to obtain smoothed representations of the empirical distributions, which provided clearer insights into the underlying patterns of the data. This analysis facilitated the observation of continuous probability distribution patterns and the assessment of tail-end magnitudes, providing insights into the continuous likelihood of varying precipitation levels and revealing extremes throughout the studied period.
3.1 Precipitation changes
As mentioned in Sect. 2.2, UKESM1 is a fully coupled GEM and has been widely applied in research on meteorological issues (Haywood et al., 2022; Jones et al., 2022; Liang and Haywood, 2023; Wells et al., 2024). In this paper, detailed discussions about the UKESM1 model performance have been minimized in the main text, with some validation provided in the Supplement.

Figure 2Relative changes in land precipitation (mm d−1) of the period 2071–2100 compared to that of the CP (1981–2010). (a) SSP5-8.5, (b) SSP2-4.5, (c) G6sulfur, and (d) G6solar. The dotted areas indicate where the difference is statistically significant at the 95 % confidence level when using a Wilcoxon rank sum test.
Figure 2 illustrates the spatial distribution of relative changes in mean precipitation for different simulations during the future period 2071–2100 relative to the CP. In all four simulations, most of the region is dominated by increased precipitation. For SSP5-8.5 (Fig. 2a), the most prominent increase in precipitation occurs within SC (near the Tropic of Cancer, up to 3 mm), but the precipitation in northern Taiwan and Hainan is projected to decrease in the future. For SSP2-4.5 (Fig. 2b), a similar pattern can be seen, but the magnitude of increases is generally reduced, particularly in SC (up to 1.8 mm), by about 50 %, relative to SSP5-8.5. For G6sulfur (Fig. 2c), changes are similar to that of SSP2-4.5, indicating the SAI is approximately successful in modelling future precipitation effects in China. Both G6sulfur (Fig. 2c) and G6solar (Fig. 2d) show ameliorated changes with respect to SSP5-8.5, but the projected decrease in G6sulfur in area and magnitude is larger than SSP2-4.5 and G6solar, reaching up to 1 mm d−1. Regional changes in precipitation patterns under SSPs (SSP5-8.5 and SSP2-4.5) can be attributed to shifts in the Inter-Tropical Convergence Zone (ITCZ) caused by alterations in the inter-hemispheric temperature gradient, general circulation changes due to stratospheric heating, and regional and seasonal variations in heat fluxes and temperature gradients (Visioni et al., 2021).
Figure S3 compares the simulated future precipitation between G6sulfur and other experiments. Compared with SSP5-8.5 (Fig. S3a), the simulated SAI by G6sulfur leads to a decrease in precipitation over almost the entire China. This suggests that the effect of SAI on future precipitation is more widespread and remarkable compared to that of SSP5-8.5, particularly over the SWC, which includes the southeastern part of the Qinghai–Tibet Plateau (QTP), and the CC regions. The difference in precipitation between G6sulfur and SSP2-4.5 (Fig. S3b) or G6solar (Fig. S3c) is smaller compared to the difference between G6sulfur and SSP5-8.5 (Fig. S3a). This indicates that SAI somewhat mitigates the increase in mean precipitation from the high-GHG SSP5-8.5 scenario to the medium-GHG SSP2-4.5 scenario across most of China. It is important to note that this finding is based on a single model, and future studies could validate these results using multiple models. Compared with SSP2-4.5 (Fig. S3b), the maximum differences in simulated SAI by G6sulfur, including both increases and decreases, occur in the western region. Specifically, the greatest increases are observed in the southwest of SWC, and the greatest decreases in the southwest of NWC, with maximum changes reaching 0.7 mm d−1. The difference in precipitation between G6solar and SSP2-4.5 (Fig. S3d) is similar but smaller than the difference between G6sulfur and SSP2-4.5 (Fig. S3b). For the “G6sulfur–G6solar” comparison (Fig. S3c), the magnitude is smaller than Fig. S3b, suggesting that the effect of simulated SAI by G6sulfur leads to a greater change compared to the ideal solar constant reduction in land mean precipitation of China. The differences between G6sulfur and SSP2-4.5 (both with the same global mean temperature) may be attributed to the specific setup of this model under SAI and the latitudinal and temporal distribution of the aerosol cloud as well. However, the differences between G6sulfur and G6solar (which also have the same global mean temperature) may be due to variations in latent heat resulting from different ratios of diffuse solar radiation (which increases with sulfate aerosols); this can lead to more atmospheric absorption or changes in cloud formation caused by different vertical temperature gradients (Visioni et al., 2020, 2021).
3.2 Hydrological extreme changes
The small-scale flooding risk is assessed by the RX1day index, and the extreme threshold index of very wet-day precipitation is represented by the R95p, for which the 95th percentile of threshold was computed for each grid based on the 30-year (1981–2010) daily precipitation. The changes in RX1day and R95p for the future period (2071–2100) relative to the CP (1981–2010) are shown in Fig. 3. Simulations under the SSP5-8.5 scenario project significant increases (p value < 0.05) in RX1day in east China (Fig. 3a). The greatest magnitude of increase (above 50 mm) is seen in SC, CC, east coastal NC, and a small part of SWC regions. Under SSP2-4.5 (Fig. 3b), a similar pattern for the RX1day change to SSP5-8.5 is projected but with smaller magnitudes, and the largest increases are up to 30 mm. G6sulfur (Fig. 3c) and G6solar (Fig. 3d) show generally ameliorated changes compared to SSP5-8.5 and are generally similar to those under SSP2-4.5, suggesting that SRM strategies yield RX1day patterns comparable to SSP2-4.5 in UKESM1. However, the decreases in RX1day are more pronounced in G6sulfur in western China, with a reduction of up to 2.5 mm. This indicates that G6sulfur significantly reduces future RX1day intensity, attributable to the aerosol–climate feedback under SAI in specific areas.
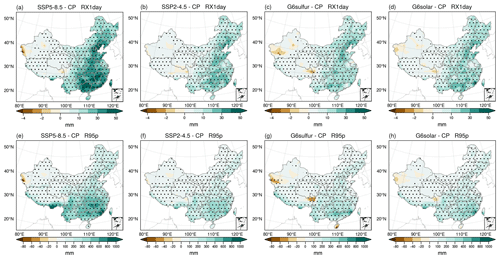
Figure 3Relative changes in RX1day (a–d) and R95p (e–h) for the future period of 2071–2100 compared to the control period (CP). The dotted areas indicate where the difference is statistically significant at the 95 % confidence level using a Wilcoxon rank sum test.
In the future, an increase in RX5day is anticipated across most of China, with the most substantial increments occurring in the eastern part of the country and on the QTP (Fig. S4a–d). The largest increases are anticipated under the SSP5-8.5 scenario (Fig. S4a), reaching a maximum of over 100 mm. In the other three simulations, the increase in RX5day is considerably smaller than that under SSP5-8.5, with none exceeding 100 mm compared to the CP (Fig. S4a–d). This suggests a mitigated future RX5day simulation compared to SSP5-8.5 in these three models. It is observed that under G6solar (Fig. S4d), the maximum RX5day is observed in the southeastern part of the SC region. RX5day, which has a similar pattern to RX1day, is projected to decrease in a small part of western regions in the future, although the magnitude is small at less than 5 mm.
R95p is projected to significantly increase in CC, SC, and the south SWC regions under the SSP5-8.5 scenario (Fig. 3e), consistent with previous studies (Wang et al., 2016; Qin and Xie, 2016; Peng et al., 2018). Similar patterns are observed under SSP2-4.5 (Fig. 3f), while the magnitude of increases in R95p is reduced by about one-third compared to SSP5-8.5. The increase in extreme precipitation across southern China for RX1day, RX5day, and R95p under SSPs may be attributed to the strengthened water vapour and southwesterly winds across southern China caused by the land–sea contrast between China and the adjacent oceans, as well as global warming contributing to increased water vapour, thereby enhancing the likelihood of precipitation and related extremes (Tang et al., 2021). The increase in extreme precipitation may be related to the increase in atmospheric rivers (ARs). However, precipitation extremes are linked to different types of weather systems (e.g. tropical cyclones and easterly waves), particularly in southern China. Therefore, the synoptic mechanisms behind these increased metrics still require further investigation. G6sulfur and G6solar experiments present similar spatial distributions but smaller magnitudes of changes (Fig. 3g, h).
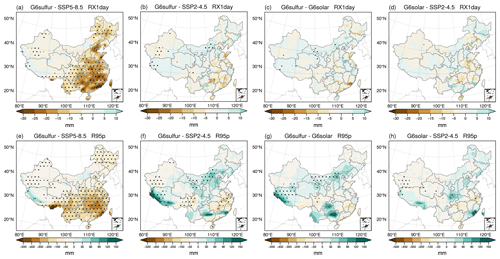
Figure 4Differences in RX1Day (a–c) and R95p (d–f) for the future period of 2071–2100 between G6sulfur and SSP5-8.5 (a, e), SSP2-4.5 (b, f), and G6solar (c, g), as well as between G6solar and SSP2-4.5 (d, h). The dotted areas indicate where the difference is statistically significant at the 95 % confidence level when using a Wilcoxon rank sum test.
Figure 4 illustrates how SAI modulates the distribution of extreme precipitation intensity indices by depicting differences between G6sulfur and other experiments. Compared with SSP5-8.5, G6sulfur shows a significant amelioration of the decreases in RX1day (Fig. 4a), particularly in China's first-tier regions. Compared with SSP2-4.5 (Fig. 4b), G6sulfur leads to decreases mainly in eastern China, with a reduction of up to 20 mm in RX1day, suggesting that G6sulfur reduces the intensity of extreme precipitation events under the same global mean surface warming. The spatial distribution and magnitude of “G6solar-SSP2-4.5” (Fig. 4d) are similar to “G6sulfur-SSP2-4.5” (Fig. 4b), but the magnitude of the decrease is smaller in most areas. The similarity of G6sulfur to SSP2-4.5 and G6solar suggests that the primary impact on RX1day over China is driven simply by the temperature; a global mean temperature of the standard CMIP6 SSP2-4.5 scenario gives very similar results to those achieved when SSP5-8.5 temperatures are brought down to those of SSP2-4.5.
However, the same cannot be said for R95p, where the ensemble mean of UKESM1 projects a significant increase in north SC and southwestern SWC (Fig. 4f) for the G6sulfur (2071–2100) relative to the SSP2-4.5 (2071–2100) but decreases in the south SC, EC, CC, and high-altitude areas of eastern SWC, with reductions reaching 200 mm in Hainan. This suggests that R95p cannot achieve the SSP2-4.5 scenario level through the simulated SAI by G6sulfur in UKESM1. For “G6solar-SSP2-4.5”, significant increases occur in the southeastern SC near the Tropic of Cancer, up to 150 mm (Fig. 4h). The differences are also evident in south China, with significant increases mainly in north SC, and eastern and southwestern SWC under G6sulfur relative to G6solar (Fig. 4g). These findings suggest that G6sulfur induce an uneven distribution of R95p in China compared to SSP2-4.5, and cannot reach the ideal solar constant reduction, especially in south China.
From Fig. S5a, it is evident that G6sulfur mitigates RX5day under SSP5-8.5, particularly in the eastern and southwestern regions under UKESM1. The most notable impact is observed in the SC region and the south QTP, with a mitigation of up to 80 mm. In comparison to SSP2-4.5 (Fig. S5b), G6sulfur exhibits an increase in RX5day, primarily in the region between 100 and 120° E, with the maximum reduction occurring in Hainan, reaching up to 30 mm. For “G6sulfur-G6solar” (Fig. S5c), similar to Fig. S5b, positive values of RX5day are more pronounced in certain areas between 100 and 120° E, especially in the low-latitude zone between 20 and 30° N. Therefore, although G6sulfur successfully ameliorates the increase in RX5day compared to SSP5-8.5, there are noticeable differences as G6sulfur and G6solar cannot reach the SSP2-4.5 level. The green areas show a worse increase in RX5day for G6sulfur compared to SSP2-4.5 and G6solar.
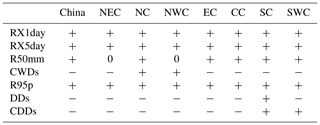
Table 2 presents the differences in maximum values of the index between the G6sulfur and SSP5-8.5 scenarios. A positive difference suggests a mitigation effect of SAI, while a negative difference indicates an exacerbation in index thresholds for projected increase regions. In regions where the projected index is decreasing, the meaning of positive and negative signs is opposite to that in regions where the index is projected to increase. In addition, the 0 values indicate that there is almost no difference, suggesting a negligible impact of SAI on the indices threshold. G6solar's ameliorating impact in indices thresholds under the SSP5-8.5 scenario has been presented in Table S2 in the Supplement. The mitigating effects of G6sulfur and G6solar with SSP2-4.5 are shown in Tables S3 and S4, respectively.
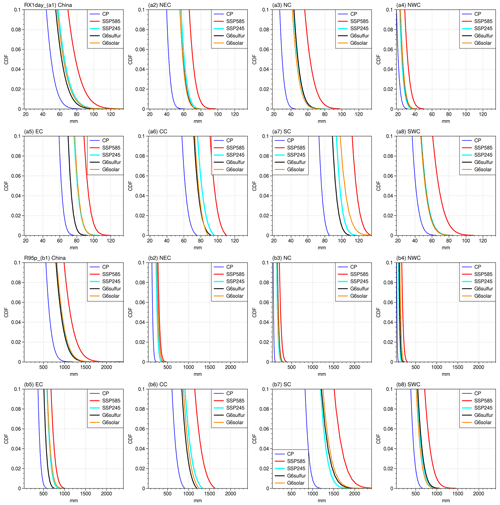
Figure 5Cumulative distribution functions of RX1day (a1–a8) and R95p (b1–b8) in China and seven subregions for different scenarios. The same processing was applied to all CDF figures.
RX1day (Fig. 5a) and R95p (Fig. 5b) show consistent increases in the future relative to the CP (the blue line). For RX1day, the CDFs for precipitation SSP5-8.5 surpass those from all other scenarios, as might be expected from the spatial analyses presented in Fig. 3. Additionally, southeastern China (EC, CC, and SC) shows higher values than the northern and western inland regions (NEC, NC, NWC).
The tail of the RX1day CDFs in experiment G6sulfur (black) is close to that of the SSP2-4.5 scenario (cyan) in NEC, NC, NWC, and SWC (Fig. 5). Combined with the small and evenly distributed magnitudes shown in Fig. 4b, this shows that the SAI simulations are approximately successful in these regions. In EC, SC, and CC, the RX1day CDF is reduced from that of SSP2-4.5 by between 5–10 mm and moves further away from the values seen in the high-end SSP5-8.5 scenarios towards those seen in the CP simulations. The RX1day CDFs for G6solar are indistinguishable from those for SSP2-4.5 in many regions, but for CC, the RX1day lies to the left of the SSP2-4.5 curve but not as far as that for G6sulfur, indicating less abatement of RX1day extremes. Interestingly, for SC, the G6solar CDF curve lies to the left of the SSP5-8.5 curve. Combining the negative value for the SC region in Table S1 reveals that the maximum value of RX1day under G6solar is even further from that of the CP compared to SSP5-8.5, suggesting that while G6solar mitigates the overall RX1day, it exacerbates the maximum RX1day values beyond SSP5-8.5 in the SC region. In addition to these findings, combining the information from Tables S3 and S4, it is evident that the RX1day maximum values for G6sulfur are lower than those for SSP2-4.5 across all regions in China. Conversely, G6solar results in a higher RX1day threshold in the SC region than SSP2-4.5. Since the global temperatures achieved by all three simulations are the same, these differences imply that even if different geoengineering methods achieve the same global cooling, their impacts on extreme precipitation events can vary significantly. This variation is likely due to the different ways these methods influence regional climate responses.
The tail of RX5day CDFs across all regions suggests a future increase in RX5day under four simulations (Fig. S6), with a more pronounced rise under the high SSP5-8.5 scenario. This phenomenon is consistent with the spatial distribution change observed in Fig. S4a–d. In the NEC and CC regions, G6sulfur closely aligns with the SSP2-4.5 scenario (Fig. S6). Additionally, in the NC region, G6solar closely mirrors the conditions of the SSP2-4.5 scenario. Combined with the differences in RX5day of spatial distribution in Fig. S5, it is evident that G6sulfur yields results of RX5day, resembling the SSP2-4.5 scenario, in NEC and CC regions. Simultaneously, G6solar shows RX5day in the NC region, resembling the conditions of the SSP2-4.5 scenario.
For R95p, the CDFs of G6sulfur and SSP2-4.5 show no apparent differences for SC, SWC, and NWC; however, in EC and CC, there are decreases of more than 100 mm, whereas in NEC and NC, there are some increases of about 50 mm. For example, for the SWC region, Fig. 4f reveals that R95p for G6sulfur-SSP2-4.5 shows statistically significant negative values centred at around 30° N, 100° E and shows statistically significant positive values west of 90° E. Because these regions are aggregated together in the SWC region, there is not a discernible influence on the CDFs of R95p.
In summary, by the late 21st century, eastern China is projected to experience an increase in heavy rain events and a heightened risk of flooding under the high-emission SSP5-8.5 scenario, with UKESM1 simulations indicating a strengthening of both RX1day and R95p, signalling more stronger precipitation events driven by elevated GHG emissions. The SRM results are encouraging, showing a reduction in the detrimental extreme events, similar to the lower emissions target of SSP2-4.5, particularly in east China and the QTP region.
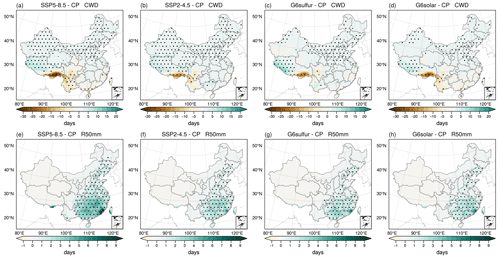
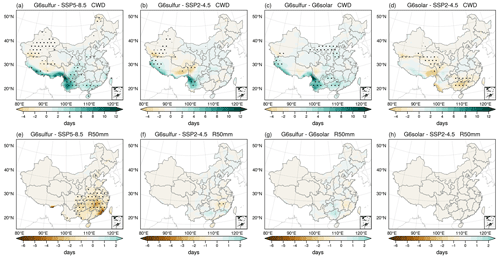
The frequency extreme index change in consecutive wet days (CWDs) has been calculated and shown in Fig. 6. For the SSP5-8.5 scenario (2071–2100) relative to the CP (1981–2010), the ensemble mean of UKESM1 predicts a significant decrease in southwest China (Fig. 6a), particularly in the south SWC (QTP), with up to 30 d reduction. This reduction could be influenced by the east Asian and south Asian monsoons under the complex terrain of QTP (Wang et al., 2018). The daily extreme precipitation intensity may rise in southern areas of China in the future (Zhu et al., 2018). The increased CWDs occur in midlatitudes (mostly north of 30° N latitudes) but to a lesser extent (fewer than 20 d). A similar pattern of change is seen under SSP2-4.5 but with smaller magnitudes (Fig. 6b). The experiments G6sulfur (Fig. 6c) and G6solar (Fig. 6d) exhibit generally mitigated changes compared to SSP5-8.5, although the brown areas shown in Fig. 6c are larger than in Fig. 6a in NWC. Additionally, a similar pattern of change is seen under the experiments G6sulfur (Fig. 6c) and G6solar (Fig. 6d) compared to SSP2-4.5. This indicates that the SRM of CWDs in UKESM1 is approximately successful in China by the end of the 21st century.
The R50mm index is derived from the Rnnmm index, as suggested by ETCCDI. The Rnnmm index represents the count of precipitation above a user-chosen threshold. In this case, the threshold is set to 50 mm, as recommended by the China Meteorological Administration (CMA) (Sui et al., 2018). Under the SSP5-8.5 scenario (2071–2100) relative to the CP (1981–2010), the ensemble mean of UKESM1 projects a significant increase in populous southern and eastern China (Fig. 6e). This aligns with a prior study by Meng et al. (2021), which predicts an increase in R50mm in the lower reaches of the Yangtze River basin and the coastal areas in SC (Meng et al., 2021), indicating a rise in rainstorm events in these regions by the end of the 21st century. This increase in rainstorm events contributes to an elevation in precipitation levels (as shown in Fig. 2), exerting significant pressure on social economies and terrestrial ecosystems (as discussed by Peng et al., 2018). A similar pattern of change is observed under SSP2-4.5 (Fig. 6f) and in the experiments G6sulfur (Fig. 6g) and G6solar (Fig. 6h), albeit with smaller magnitudes, with increases of up to 5, 6, and 5 d, respectively. However, the magnitude under G6sulfur is slightly larger, which suggests the simulated SAI by G6sulfur will exacerbate the rainstorm.
Compared to SSP5-8.5 (Fig. 7a), G6sulfur significantly increases the CWDs in south SWC (by up to 12 d), indicating sensitivity to global warming within this region. Combined with Fig. 7, G6sulfur decrease in CWDs under SSP5-8.5 in southeast QTP (approximately 90–100° E). However, in southwest QTP and south China, G6sulfur exacerbates the increase in CWDs compared to SSP5-8.5, possibly linked to the weakening of the high-altitude westerly jet (driven by the reduced meridional thermal gradient under SAI) that induces an anomalous cyclonic flow dominating QTP (Liang and Haywood, 2023) as per the four-quadrant strait jet model (Uccellini and Johnson, 1979), which creates a precipitation-favouring environment. G6sulfur primarily ameliorates the increase in CWDs in midlatitudes (north of 30° N). G6sulfur, compared to SSP2-4.5 (Fig. 7b), shows a smaller increase effect than compared the SSP5-8.5, where the CWDs in south SWC are fewer than 10 d. However, the decrease in the west is slightly larger than compared to SSP5-8.5. For “G6sulfur-G6solar”, a similar pattern with a larger magnitude is observed in low latitudes as in Fig. 7c than in Fig. 7b, indicating that deploying SAI in the UKESM1 will increase the CWDs in southern China compared to G6solar. G6solar relative to SSP2-4.5 (Fig. 7d), mainly decreases CWDs, but the magnitude is less than 4 d, suggesting that solar constant reduction does not have a similar effect in CWDs compared to SSP2-4.5 and G6sulfur. For rainstorm (R50mm), G6sulfur leads to a decrease in most parts of China, with a significant decrease in southeastern coastal areas and south QTP, up to 6 d compared to SSP5-8.5. Compared to SSP2-4.5 (Fig. 7f), G6sulfur leads to a slight decrease in the CC region (fewer than 2 d) and a small increase in eastern China (less than 2 d). Compared to G6solar (Fig. 7g), the spatial distribution differences are similar to those in Fig. 7f, suggesting that G6solar yields nearly identical results to the SSP2-4.5 scenario. G6solar is almost identical to SSP2-4.5 in R50mm (Fig. 7h), suggesting that the solar constant reduction is statistically consistent with SSP2-4.5.
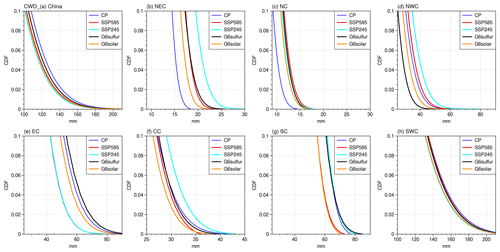
The maximum value of CWDs in SWC exceeds 200 d, as shown in Fig. 8, contributing to a general increase across China (Fig. 8a). Meanwhile, CWDs are projected to decrease, especially in SWC in Fig. 8h, and correspond to the shaded brown areas in SWC as depicted in Fig. 6a–d. In the regions projected to experience an increase in CWDs in NE and NWC, the positive value (in Table 2) indicates that SAI experiments produce results of the threshold that are closer to the CP conditions. However, the relative effect is not obvious due to the small magnitude of CWDs in these regions. It is notable that in NC and SC, G6sulfur (black) provides similar results to the SSP2-4.5. For EC, SSP2-4.5 yields almost identical statistics to SSP5-8.5, while both G6sulfur and G6solar show increases compared to the SSP scenarios. Precipitation in eastern China is primarily concentrated during the summer monsoon season. The pattern of summer precipitation changes in eastern China due to GHG forcing is largely influenced by shifts in atmospheric mean circulation and transient eddy flux. In contrast, the response to SAI is primarily governed by changes in atmospheric mean circulation, particularly by the presence of anomalous cyclones and anticyclones in the lower troposphere, which dominate the spatial pattern of SAI-induced summer precipitation response over eastern China (Liu et al., 2021). Considering the small magnitude of projected changes and the relatively minor differences in changes between G6sulfur and the other three simulations coupled with the statistical significance observed in only a few areas in the eastern part, the discussion regarding the CDFs of R50mm will be omitted.
In summary, CWDs under SSP5-8.5 and SSP2-4.5 scenarios do not consistently exhibit simultaneous increases or decreases across all regions. CWDs will significantly increase in QTP and decrease in north China (almost in midlatitudes and north of 30° N) but are not serious in the future. The maximum increase occurs in SWC, and SAI effectively ameliorates the decrease in CWDs under SSP5-8.5 in southeast QTP (from about 90–100° E). G6sulfur yields a statistically similar outcome to that of SSP2-4.5 in NC and SC. SRM strategies yield results in R50mm nearly identical to those of the SSP2-4.5 scenario. As the global mean temperature targets of G6sulfur, G6solar, and SSP2-4.5 are nominally identical, this suggests that it is the global mean temperature change that is the dominant factor in driving changes in extreme precipitation.
As for extreme wet indices, extreme dry conditions also occur in China, especially in northwestern regions (Wang et al., 2017). The focus is on DDs and CDDs to study these changes and explore the impact of SAI.
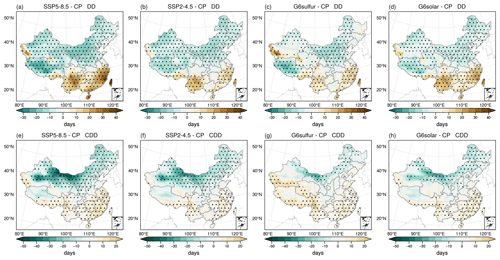
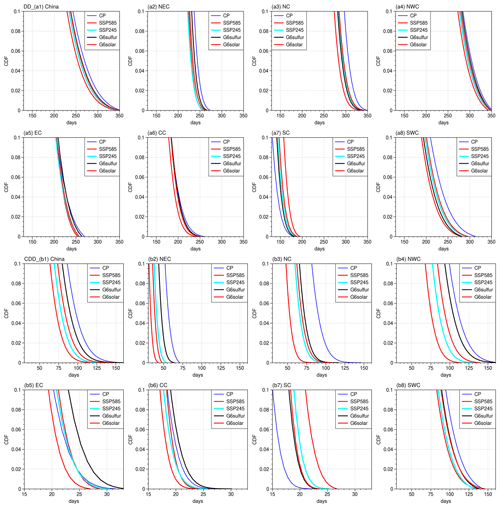
For DDs, the ensemble mean of UKESM simulations projects a significant increase in most of southern China (east of SWC and SC and south of CC and EC) and a small part of western Xinjiang province (Fig. 9a) for the SSP5-8.5 scenario (2071–2100) relative to the CP (1981–2010). The largest increase, reaching up to 40 d, is observed in Fuzhou and Taiwan (southeast SC, near 25° N, 120° E). Decreases in DDs are observed in northern and west China, including NEC, NC, NWC, west of SWC and north of CC, EC. Similar changes with smaller magnitudes are also observed under the SSP2-4.5 scenario (Fig. 9b) and G6solar (Fig. 9d). It is worth noting that, in comparison to the other three experiments, G6sulfur results in the most substantial increase in DDs in western NWC (Fig. 7c; Kunlun Mountains) in the future, indicating that G6sulfur exacerbates drought conditions in Kunlun Mountains. This may be related to topography and slope, both of which play important roles in glacier change in the Kunlun Mountains (Niu et al., 2023).
Under SSP5-8.5 warming conditions (Fig. 9e), there is a significant CDD decrease in northwestern and northern China, with the most significant decrease in NWC (up to 50 d), consistent with Xu et al. (2019). This implies that ignoring rising temperatures seems to mitigate dry conditions (Xu et al., 2022a). In line with prior studies, there are notable north–south CDD differences in China (Feng et al., 2011).
The figure shows increased CDDs in southern regions (along the middle and lower Yangtze River and to the south and parts of southwest China) but not significantly, hinting at potential increased droughts in southern China (Feng et al., 2011). These results also align with the predicted decrease in the north and increase in the south in CDDs by the RegCM4 (Ji and Kang, 2015) and PRECIS (Meng et al., 2021) models. Smaller CDD changes (fewer than 40 d) are observed in most regions under SSP2-4.5 (Fig. 9f), G6sulfur (Fig. 9g), and G6solar (Fig. 9h). It is worth noting that G6sulfur shows a slight future increase in western China (Tarim Basin).
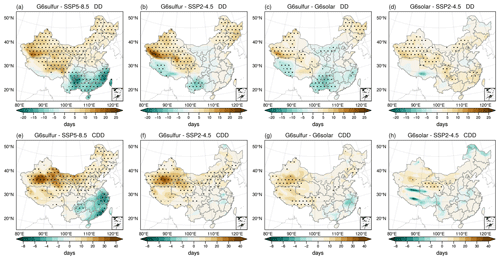
Figure 10 shows the impact of SAI on DD and CDD distribution in comparison to G6sulfur and other experiments. G6sulfur increases DDs in northern and northwest China compared to SSP5-8.5 (Fig. 10a), while mitigating the DDs in a warmer climate (Fig. 10c). Compared to SSP2-4.5 (Fig. 10b), G6sulfur leads to a further increase in western China near 35° N, up to 25 d. However, G6sulfur reduces dry climate in southern China compared to other experiments, despite an increased drought risk (as seen in Fig. 10a–d). G6solar exhibits an effect more similar to SSP2-4.5, with an increase in DDs by fewer than 10 d (Fig. 10d). Thus, relative to G6solar, the difference is similar but smaller than in Fig. 10b. Comparisons confirm that G6sulfur increases CDDs in most inland areas of China compared to SSP5-8.5 (Fig. 10e) by up to 40 d. Only a few coastal areas show a reduction. G6sulfur increases the CDDs almost across the entire China when compared to SSP2-4.5 (Fig. 10f) and G6solar (Fig. 10g). Through the comparison between G6sulfur and G6solar (Fig. 10g), G6sulfur leads to an increase in CDDs in most China. In contrast to Fig. 10f, G6solar shows a slight decrease in southwestern China compared to SSP2-4.5 (Fig. 10h), but the magnitude is less than 8 d.
The tail of the DD CDFs in the CP (blue) is consistently shifts to the right compared to the other lines in NEC, NC, and NWC (Fig. 11a2–a4), which corresponds to the declining trend (shaded green areas) in northern China, as shown in Fig. 9a–d. As shown in Table 2, the DDs are positive in the SC region, meaning G6sulfur effectively lowers the threshold for extreme DD events compared to SSP5-8.5. This suggests that the SAI is more effective for the DD maximum in the humid region. The black line surpasses the other three experiments in NWC, which explains the maximum increase value along the Kunlun Mountains in NWC in Figs. 9a–d and 10a–c.
The blue line surpasses the other four lines in NEC, NC, and NWC, clarifying the decrease in CDDs in the northern regions, as evident in Fig. 9e–h, signifying a reduced drought risk in northern China in the future. Conversely, the red line consistently stays to the left, while the black line is positioned to the right compared to the other lines. This suggests that G6sulfur and G6solar increase the drought risk when compared to the SSP5-8.5 scenario in northern regions, and the effect of G6sulfur is more pronounced than that of G6solar. However, the distance between black and other lines is wider in NWC than in other regions, indicating the maximum increase in CDDs under G6sulfur in NWC. This corresponds to the maximum differences in NWC in Fig. 10e–g. The positive value of the CDD index in the SC and SWC regions in Table 2 indicates that G6sulfur notably brings the threshold closer to the CP extreme CDD events compared to SSP5-8.5, thereby approaching drought extremes of CP in these regions. This suggests that G6sulfur has the potential to mitigate the CDD extremes. The ameliorating effect of DDs and CDDs compared to SSP5-8.5 in the SC region under G6sulfur may be related to the strengthening of the anti-cyclonic circulation associated with the subtropical gyre, which appears to increase under G6 compared to SSP5-8.5 (Liang and Haywood, 2023). This intensification results in an increased inflow of moist air from the ocean at 850 hPa and a greater supply of moisture to the southern region of the area. The differing effects of G6sulfur and G6solar on CDD thresholds, as compared to SSP5-8.5 (Tables 2 and S1) and SSP2-4.5 (Tables S3 and S4), especially in the EC, CC, and SWC regions, highlight the side effects of SAI on CDDs.
In summary, both DDs and CDDs projected increases in south and southeast China but a decrease in the north and northwest regions by the end of the 21st century in the four scenarios. This reflects a potential decrease in drought risk in northwest regions and an increase in extreme drought events in low-latitude southeast coastal areas in the future, according to four simulations. Changes in precipitation will affect soil moisture, thereby influencing evapotranspiration (ET) and ultimately precipitation patterns. Assessing whether changes in DDs and CDDs affect drought risk also requires consideration of variations in ET and soil moisture (Cheng et al., 2019; Dagon and Schrag, 2016). Furthermore, solar radiation management (SRM) may increase drought risk in northern regions (NEC, NC, and NWC).
In this study, based on simulations of the UKESM1, the effects of SAI on precipitation and the related extreme metrics are assessed over different sub-regions in China by comparing the results among different scenarios. We found that, under future emission scenarios (SSP5-8.5 and SSP2-4.5), most of the sub-regions in China are projected to experience increased precipitation and extreme wet climate events by the end of the 21st century, compared to the CP (1981–2010), particularly in the eastern and southeastern coastal areas. Both the G6sulfur and G6solar show remarkable ameliorated changes in extreme precipitation intensity and frequency and may abate most of the detrimental extremes that are evident under the SSP5-8.5 scenario. In general, the effects of the SRM experiments are similar to that of SSP2-4.5. This suggests that the effects of SAI are encouraging and can be seen as an effective option for mitigating flooding events, especially in the populated southeast areas. However, extreme drought events show an increase in some regions such as north and northwest China compared with SSP5-8.5, implying that the SRM may not be suitable for addressing drought risk in these regions. All the findings in our paper extend the current understating of extreme hydrological responses to climate change and SAI in China. The regional analysis presents new insights into identifying the vulnerable areas under hydrological changes and how they may benefit from the SRM.
As this study is solely focused on the precipitation and relevant extreme events based on the models, we cannot take socio-economic, biological, and other factors into account. Although many studies have also focused on areas such as crops (Cheng et al., 2019) and important modes of natural variability (Jones et al., 2021), they are mostly targeted on a wider and global scale; thus, more regional analysis on China still requires future research. Also, the climate models and data remain uncertain, indicating that continuous improvements are needed in models for simulations in deterring the future pathways of climate change and SRM. In addition, it should be noted that owing to the second-order nature of the changes in climate extremes when compared to SSP2-4.5 (i.e. a relatively small signal-to-noise ratio when compared to those from SSP5-8.5), the analysis is very dependent on the model used in the analysis (UKESM1); other models may produce significantly different results. Additionally, reducing the solar constant within climate models also triggers a dynamic reaction in the stratosphere (Bednarz et al., 2022). It is therefore crucial to perform similar analyses with other state-of-the-art climate models to elucidate the robustness of the results and to inform policymakers of any potential detrimental influences of SRM.
While the general amelioration of precipitation changes under SAI might seem a somewhat obvious conclusion owing to the spin-down of the hydrological cycle under cooler temperatures (e.g. Tilmes et al., 2013), other studies have shown large-scale climatic shifts in key modes of climate variability that impact precipitations. For example, Haywood et al. (2013) and Jones et al. (2017) have modelled significant detrimental impacts on Sahelian precipitation and North Atlantic hurricane frequency under non-judicious SAI implementation, owing to large-scale shifts in the Inter-Tropical Convergence Zone. Multi-model SAI simulations (Jones et al., 2021) have shown detrimental impacts on the North Atlantic Oscillation, leading to rainfall deficits over the Iberian Peninsula above and beyond those evident in SSP5-8.5. Similarly, recent simulations of non-judicious deployment of an alternate SRM technique that of marine cloud brightening, locked the climate into an extremely strong permanent La-Niña-like phase, with the associated detrimental impacts on sea level rise over low-lying South Pacific islands (Haywood et al., 2023). It appears that, over large areas of China, any changes in detrimental extremes in precipitation are second-order changes when compared to the benefits associated with reducing global mean temperatures.
To conclude, it appears that changes in precipitation extremes related to flooding over the bulk of China that are induced under climate change may be abated by SRM, but changes in dry days relating to drought are likely to be enhanced. Large-scale shifts in precipitation patterns associated with changes in atmospheric dynamics noted in other SRM studies using climate models developed by the Hadley Centre (e.g. HadGEM2, UKESM1; Haywood et al., 2013, 2023; Jones et al., 2017, 2021) do not appear to impact the bulk of China. Based on the same set of simulations as this paper, the study by Liang and Haywood (2023) demonstrated apparent side-effects of SRM, as the simulated SAI scenario exacerbates the weakening the subtropical westerly jet and further enhances the midlatitude precipitation over China by modulating atmospheric rivers over east Asia. Of course, we stress that the results from these simulations are model-specific, and further work with other models needs to be performed to understand the robustness of these conclusions more generally.
All the UKESM1 model data for the SSP5-8.5, SSP2-4.5, GeoMIP G6sulfur, and GeoMIP G6solar scenarios used in this work are available from the Earth System Grid Federation (https://esgf-node.llnl.gov/projects/cmip6/, WCRP, 2022). The APHRODITE data have been downloaded from their official website, which is managed by the Data Integration and Analysis System (https://search.diasjp.net/en/dataset/APHRO_MA, DIAS, 2022).
The supplement related to this article is available online at: https://doi.org/10.5194/acp-24-12355-2024-supplement.
The majority of this work was completed when OW was visiting the University of Exeter in the UK under a scholarship from the China Scholarship Council. JL and JMH devised the experiment and led the analysis. OW wrote the paper with contributions from all the co-authors.
The contact author has declared that none of the authors has any competing interests.
Publisher's note: Copernicus Publications remains neutral with regard to jurisdictional claims made in the text, published maps, institutional affiliations, or any other geographical representation in this paper. While Copernicus Publications makes every effort to include appropriate place names, the final responsibility lies with the authors. Regarding the maps used in this paper, please note that Figs. 1–4, 6, 7, 9, and 10 contain disputed territories.
We are grateful to the University of Exeter for providing the academic platform for this study and the Met Office for doing the numerical calculations in this work. The authors thank Andy Jones for help with running the G6sulfur and G6solar experiments.
This paper was edited by Simone Tilmes and reviewed by three anonymous referees.
Apurv, T., Mehrotra, R., Sharma, A., Goyal, M. K., and Dutta, S.: Impact of climate change on floods in the Brahmaputra basin using CMIP5 decadal predictions, J. Hydrol., 527, 281–291, https://doi.org/10.1016/j.jHydrol.2015.04.056, 2015.
Archibald, A. T., O'Connor, F. M., Abraham, N. L., Archer-Nicholls, S., Chipperfield, M. P., Dalvi, M., Folberth, G. A., Dennison, F., Dhomse, S. S., Griffiths, P. T., Hardacre, C., Hewitt, A. J., Hill, R. S., Johnson, C. E., Keeble, J., Köhler, M. O., Morgenstern, O., Mulcahy, J. P., Ordóñez, C., Pope, R. J., Rumbold, S. T., Russo, M. R., Savage, N. H., Sellar, A., Stringer, M., Turnock, S. T., Wild, O., and Zeng, G.: Description and evaluation of the UKCA stratosphere–troposphere chemistry scheme (StratTrop vn 1.0) implemented in UKESM1, Geosci. Model Dev., 13, 1223–1266, https://doi.org/10.5194/gmd-13-1223-2020, 2020.
Bednarz, E. M., Visioni, D., Banerjee, A., Braesicke, P., Kravitz, B., and MacMartin, D. G.: The Overlooked Role of the Stratosphere Under a Solar Constant Reduction, Geophys. Res. Lett., 49, e2022GL098773, https://doi.org/10.1029/2022GL098773, 2022.
Cheng, W., MacMartin, D. G., Dagon, K., Kravitz, B., Tilmes, S., Richter, J. H., Mills, M. J., and Simpson, I. R.: Soil moisture and other hydrological changes in a stratospheric aerosol geoengineering large ensemble, J. Geophys. Res.-Atmos., 124, 12773–12793, https://doi.org/10.1029/2018JD030237, 2019.
Data Integration and Analysis System (DIAS): APHRODITE monsoon Asia Precipitation data, DIAS Dataset Search and Discovery [data set], https://search.diasjp.net/en/dataset/APHRO_MA (last access: 12 September 2022), 2022.
Donat, M. G., Lowry, A. L., Alexander, L. V., O'Gorman, P. A., and Maher, N.: More extreme precipitation in the world’s dry and wet regions, Nat. Clim. Change, 6, 508–513, https://doi.org/10.1038/nclimate2941, 2016.
Dong, B., Xia, J., Li, Q., and Zhou, M.: Risk assessment for people and vehicles in an extreme urban flood: Case study of the “7.20” flood event in Zhengzhou, China, Int. J. Disast. Risk Re., 80, 103205, https://doi.org/10.1016/j.ijdrr.2022.103205, 2022.
Eyring, V., Bony, S., Meehl, G. A., Senior, C. A., Stevens, B., Stouffer, R. J., and Taylor, K. E.: Overview of the Coupled Model Intercomparison Project Phase 6 (CMIP6) experimental design and organization, Geosci. Model Dev., 9, 1937–1958, https://doi.org/10.5194/gmd-9-1937-2016, 2016.
Feng, L., Zhou, T., Wu, B., Li, T., and Luo, J.-J.: Projection of future precipitation change over China with a high-resolution global atmospheric model, Adv. Atmos. Sci., 28, 464–476, https://doi.org/10.1007/s00376-010-0016-1, 2011.
Frich, P., Alexander, L. V., Della-Marta, P., Gleason, B., Haylock, M., Tank, A. K., and Peterson, T.: Observed coherent changes in climatic extremes during the second half of the twentieth century, Clim. Res., 19, 193–212, https://doi.org/10.3354/cr019193, 2002.
Haywood, J. M., Jones, A., Bellouin, N., and Stephenson, D.: Asymmetric forcing from stratospheric aerosols impacts Sahelian rainfall, Nat. Clim. Change, 3, 660–665, https://doi.org/10.1038/nclimate1857, 2013.
Haywood, J. M., Jones, A., Johnson, B. T., and McFarlane Smith, W.: Assessing the consequences of including aerosol absorption in potential stratospheric aerosol injection climate intervention strategies, Atmos. Chem. Phys., 22, 6135–6150, https://doi.org/10.5194/acp-22-6135-2022, 2022.
Haywood, J. M., Jones, A., Jones, A. C., Halloran, P., and Rasch, P. J.: Climate intervention using marine cloud brightening (MCB) compared with stratospheric aerosol injection (SAI) in the UKESM1 climate model, Atmos. Chem. Phys., 23, 15305–15324, https://doi.org/10.5194/acp-23-15305-2023, 2023.
Huang, R., Chen, J., and Huang, G.: Characteristics and variations of the East Asian monsoon system and its impacts on climate disasters in China, Adv. Atmos. Sci., 24, 993–1023, https://doi.org/10.1007/s00376-007-0993-x, 2007.
Imai, Y., Meyer, K. J., Iinishi, A., Favre-Godal, Q., Green, R., Manuse, S., Caboni, M., Mori, M., Niles, S., and Ghiglieri, M.: A pause in Southern Hemisphere circulation trends due to the Montreal Protocol, Nature, 579, 544–548, https://doi.org/10.1038/s41586-020-2120-4, 2020.
IPCC: Climate Change 2021: The Physical Science Basis. Contribution of Working Group I to the Sixth Assessment Report of the Intergovernmental Panel on Climate Change, edited by: Masson-Delmotte, V., Zhai, P., Pirani, A., Connors, S. L., Péan, C., Berger, S., Caud, N., Chen, Y., Goldfarb, L., Gomis, M. I., Huang, M., Leitzell, K., Lonnoy, E., Matthews, J. B. R., Maycock, T. K., Waterfield, T., Yelekçi, O., Yu, R., and Zhou, B., Cambridge University Press, p. 959, https://doi.org/10.1017/9781009157896, 2021.
Ji, D., Fang, S., Curry, C. L., Kashimura, H., Watanabe, S., Cole, J. N. S., Lenton, A., Muri, H., Kravitz, B., and Moore, J. C.: Extreme temperature and precipitation response to solar dimming and stratospheric aerosol geoengineering, Atmos. Chem. Phys., 18, 10133–10156, https://doi.org/10.5194/acp-18-10133-2018, 2018.
Ji, Z. and Kang, S.: Evaluation of extreme climate events using a regional climate model for China, Int. J. Climatol., 35, 888–902, https://doi.org/10.1002/joc.4024, 2015.
Jia, H., Chen, F., Pan, D., Du, E., Wang, L., Wang, N., and Yang, A.: Flood risk management in the Yangtze River basin – Comparison of 1998 and 2020 events, Int. J. Disast. Risk Re., 68, 102724, https://doi.org/10.1016/j.ijdrr.2021.102724, 2022.
Jones, A., Haywood, J. M., Jones, A. C., Tilmes, S., Kravitz, B., and Robock, A.: North Atlantic Oscillation response in GeoMIP experiments G6solar and G6sulfur: why detailed modelling is needed for understanding regional implications of solar radiation management, Atmos. Chem. Phys., 21, 1287–1304, https://doi.org/10.5194/acp-21-1287-2021, 2021.
Jones, A., Haywood, J. M., Scaife, A. A., Boucher, O., Henry, M., Kravitz, B., Lurton, T., Nabat, P., Niemeier, U., Séférian, R., Tilmes, S., and Visioni, D.: The impact of stratospheric aerosol intervention on the North Atlantic and Quasi-Biennial Oscillations in the Geoengineering Model Intercomparison Project (GeoMIP) G6sulfur experiment, Atmos. Chem. Phys., 22, 2999–3016, https://doi.org/10.5194/acp-22-2999-2022, 2022.
Jones, A. C., Haywood, J. M., Dunstone, N., Emanuel, K., Hawcroft, M. K., Hodges, K. I., and Jones, A.: Impacts of hemispheric solar geoengineering on tropical cyclone frequency, Nat. Commun., 8, 1382, https://doi.org/10.1038/s41467-017-01606-0, 2017.
Jones, A. C., Hawcroft, M. K., Haywood, J. M., Jones, A., Guo, X., and Moore, J. C.: Regional climate impacts of stabilizing global warming at 1.5 K using solar geoengineering, Earths Future, 6, 230–251, https://doi.org/10.1002/2017EF000720, 2018.
Klein, D., Carazo, M. P., Doelle, M., Bulmer, J., and Higham, A.: The Paris Agreement on climate change: Analysis and commentary, Oxford University Press, ISBN 978-0-19-878933-8(hbk), ISBN 978-0-19-880376-8(pbk), 2017.
Klein Tank, A. M. G., Zwiers, F. W., and Zhang, X.: Guidelines on analysis of extremes in a changing climate in support of informed decisions for adaptationm WMO-TD No. 1500, World Meteorological Organization, https://www.ecad.eu/documents/WCDMP_72_TD_1500_en_1.pdf (last access: 1 November 2024), 2009.
Kravitz, B., Robock, A., Boucher, O., Schmidt, H., Taylor, K. E., Stenchikov, G., and Schulz, M.: The geoengineering model intercomparison project (GeoMIP), Atmos. Sci. Lett., 12, 162–167, 2011.
Kravitz, B., Caldeira, K., Boucher, O., Robock, A., Rasch, P. J., Alterskjaer, K., Karam, D. B., Cole, J. N., Curry, C. L., and Haywood, J. M.: Climate model response from the geoengineering model intercomparison project (GeoMIP), J. Geophys. Res.-Atmos., 118, 8320–8332, https://doi.org/10.1002/jgrd.50646, 2013.
Kravitz, B., Robock, A., Tilmes, S., Boucher, O., English, J. M., Irvine, P. J., Jones, A., Lawrence, M. G., MacCracken, M., Muri, H., Moore, J. C., Niemeier, U., Phipps, S. J., Sillmann, J., Storelvmo, T., Wang, H., and Watanabe, S.: The Geoengineering Model Intercomparison Project Phase 6 (GeoMIP6): simulation design and preliminary results, Geosci. Model Dev., 8, 3379–3392, https://doi.org/10.5194/gmd-8-3379-2015, 2015.
Lai, S., Xie, Z., Bueh, C., and Gong, Y.: Fidelity of the APHRODITE dataset in representing extreme precipitation over Central Asia, Adv. Atmos. Sci., 37, 1405–1416, https://doi.org/10.1007/s00376-020-0098-3, 2020.
Lee, H., Muri, H., Ekici, A., Tjiputra, J., and Schwinger, J.: The response of terrestrial ecosystem carbon cycling under different aerosol-based radiation management geoengineering, Earth Syst. Dynam., 12, 313–326, https://doi.org/10.5194/esd-12-313-2021, 2021.
Li, S., Jiang, D., Lian, Y., and Yao, Y.: Interdecadal variations of cold air activities in Northeast China during springtime, J. Meteorol. Res., 30, 645–661, https://doi.org/10.1007/s13351-016-5912-6, 2016.
Liang, J. and Haywood, J.: Future changes in atmospheric rivers over East Asia under stratospheric aerosol intervention, Atmos. Chem. Phys., 23, 1687–1703, https://doi.org/10.5194/acp-23-1687-2023, 2023.
Liang, J., Meng, C., Wang, J., Pan, X., and Pan, Z.: Projections of mean and extreme precipitation over China and their resolution dependence in the HighResMIP experiments, Atmos. Res., 293, 106932, https://doi.org/10.1016/j.atmosres.2023.106932, 2023.
Liu, Z., Lang, X., and Jiang, D.: Impact of stratospheric aerosol injection geoengineering on the summer climate over East Asia, J. Geophys. Res.-Atmos., 126, e2021JD035049, https://doi.org/10.1029/2021JD035049, 2021.
Liu, Z., Lang, X., Miao, J., and Jiang, D.: Impact of Stratospheric Aerosol Injection on the East Asian Winter Monsoon, Geophys. Res. Lett., 50, e2022GL102109, https://doi.org/10.1029/2022GL102109, 2023.
McLandress, C., Shepherd, T. G., Scinocca, J. F., Plummer, D. A., Sigmond, M., Jonsson, A. I., and Reader, M. C.: Separating the dynamical effects of climate change and ozone depletion. Part II: Southern Hemisphere troposphere, J. Climate., 24, 1850–1868, https://doi.org/10.1175/2010JCLI3958.1, 2011.
Meinshausen, M., Nicholls, Z. R. J., Lewis, J., Gidden, M. J., Vogel, E., Freund, M., Beyerle, U., Gessner, C., Nauels, A., Bauer, N., Canadell, J. G., Daniel, J. S., John, A., Krummel, P. B., Luderer, G., Meinshausen, N., Montzka, S. A., Rayner, P. J., Reimann, S., Smith, S. J., van den Berg, M., Velders, G. J. M., Vollmer, M. K., and Wang, R. H. J.: The shared socio-economic pathway (SSP) greenhouse gas concentrations and their extensions to 2500, Geosci. Model Dev., 13, 3571–3605, https://doi.org/10.5194/gmd-13-3571-2020, 2020.
Meng, C., Zhang, L., Gou, P., Huang, Q., Ma, Y., Miao, S., Ma, W., and Xu, Y.: Assessments of future climate extremes in China by using high-resolution PRECIS 2.0 simulations, Theor. Appl. Climatol., 145, 295–311, https://doi.org/10.1007/s00704-021-03618-9, 2021.
Mulcahy, J. P., Jones, C., Sellar, A., Johnson, B., Boutle, I. A., Jones, A., Andrews, T., Rumbold, S. T., Mollard, J., Bellouin, N., Johnson, C. E., Williams, K. D., Grosvenor, D. P., and McCoy, D. T.: Improved Aerosol Processes and Effective Radiative Forcing in HadGEM3 and UKESM1, J. Adv. Model. Earth Sy., 10, 2786–2805, https://doi.org/10.1029/2018MS001464, 2018.
Niemeier, U., Schmidt, H., Alterskjær, K., and Kristjánsson, J.: Solar irradiance reduction via climate engineering: Impact of different techniques on the energy balance and the hydrological cycle, J. Geophys. Res.-Atmos., 118, 11905–11917, https://doi.org/10.1002/2013JD020445, 2013.
Niu, S., Sun, M., Wang, G., Wang, W., Yao, X., and Zhang, C.: Glacier Change and Its Influencing Factors in the Northern Part of the Kunlun Mountains, Remote Sens., 15, 3986, https://doi.org/10.3390/rs15163986, 2023.
O'Neill, B. C., Tebaldi, C., van Vuuren, D. P., Eyring, V., Friedlingstein, P., Hurtt, G., Knutti, R., Kriegler, E., Lamarque, J.-F., Lowe, J., Meehl, G. A., Moss, R., Riahi, K., and Sanderson, B. M.: The Scenario Model Intercomparison Project (ScenarioMIP) for CMIP6, Geosci. Model Dev., 9, 3461–3482, https://doi.org/10.5194/gmd-9-3461-2016, 2016.
Pendergrass, A. G. and Knutti, R.: The uneven nature of daily precipitation and its change, Geophys. Res. Lett., 45, 11980–11988, https://doi.org/10.1029/2018GL080298, 2018.
Peng, Y., Zhao, X., Wu, D., Tang, B., Xu, P., Du, X., and Wang, H.: Spatiotemporal variability in extreme precipitation in China from observations and projections, Water, 10, 1089, https://doi.org/10.3390/w10081089, 2018.
Pinto, I., Jack, C., Lennard, C., Tilmes, S., and Odoulami, R. C.: Africa's climate response to solar radiation management with stratospheric aerosol, Geophys. Res. Lett., 47, e2019GL086047, https://doi.org/10.1029/2019GL086047, 2020.
Plazzotta, M., Séférian, R., and Douville, H.: Impact of Solar Radiation Modification on Allowable CO2 Emissions: What Can We Learn From Multimodel Simulations?, Earths Future, 7, 664–676, https://doi.org/10.1029/2019EF001165, 2019.
Qi, Y., Yu, H., Fu, Q., Chen, Q., Ran, J., and Yang, Z.: Future changes in drought frequency due to changes in the mean and shape of the PDSI probability density function under RCP4.5 scenario, Front. Earth Sci., 10, 386, https://doi.org/10.3389/feart.2022.857885, 2022.
Qin, P. and Xie, Z.: Detecting changes in future precipitation extremes over eight river basins in China using RegCM4 downscaling, J. Geophys. Res.-Atmos., 121, 6802–6821, https://doi.org/10.1002/2016JD024776, 2016.
Rana, A., Madan, S., and Bengtsson, L.: Performance evaluation of regional climate models (RCMs) in determining precipitation characteristics for Gothenburg, Sweden, Hydrol. Res., 45, 703–714, https://doi.org/10.2166/nh.2013.160, 2014.
Rhodes, C. J.: The 2015 Paris climate change conference: COP21, Sci. Prog., 99, 97–104, 2016.
Robock, A., Jerch, K., and Bunzl, M.: 20 reasons why geoengineering may be a bad idea, Bull. Atom. Sci., 64, 14–18, https://doi.org/10.1080/00963402.2008.11461140, 2008.
Sellar, A., Jones, C. G., Mulcahy, J. P., Tang, Y., Yool, A., Wiltshire, A., O'Connor, F. M., Stringer, M., Hill, R., Palmieri, J., Woodward, S., de Mora, L., Kuhlbrodt, T., Rumbold, S., Kelley, D. I., Ellis, R., Johnson, C. E., Walton, J., Abraham, N. L., Andrews, M. B., Andrews, T., Archibald, A. T., Berthou, S., Burke, E., Blockley, E., Carslaw, K., Dalvi, M., Edwards, J., Folberth, G. A., Gedney, N., Griffiths, P. T., Harper, A. B., Hendry, M. A., Hewitt, A. J., Johnson, B., Jones, A., Jones, C. D., Keeble, J., Liddicoat, S., Morgenstern, O., Parker, R. J., Predoi, V., Robertson, E., Siahaan, A., Smith, R. S., Swaminathan, R., Woodhouse, M., Zeng, G., and Zerroukat, M.: UKESM1: Description and evaluation of the UK Earth System Model, J. Adv. Model. Earth Sy., 11, 4513–4558, https://doi.org/10.1029/2019MS001739, 2019.
Simpson, I. S., Tilmes, S., Richter, J. H., Kravitz, B., MacMartin, D. G., Mills, M. J., Fasullo, J. T., and Pendergrass, A. G.: The regional hydroclimate response to stratospheric sulfate geoengineering and the role of stratospheric heating, J. Geophys. Res.-Atmos., 124, 12587–12616, 2019.
Storkey, D., Blaker, A. T., Mathiot, P., Megann, A., Aksenov, Y., Blockley, E. W., Calvert, D., Graham, T., Hewitt, H. T., Hyder, P., Kuhlbrodt, T., Rae, J. G. L., and Sinha, B.: UK Global Ocean GO6 and GO7: a traceable hierarchy of model resolutions, Geosci. Model Dev., 11, 3187–3213, https://doi.org/10.5194/gmd-11-3187-2018, 2018.
Sui, Y., Lang, X., and Jiang, D.: Projected signals in climate extremes over China associated with a 2 C global warming under two RCP scenarios, Int. J. Climatol., 38, e678–e697, https://doi.org/10.1002/joc.5399, 2018.
Sunilkumar, K., Yatagai, A., and Masuda, M.: Preliminary evaluation of GPM-IMERG rainfall estimates over three distinct climate zones with APHRODITE, Earth. Sp. Sci., 6, 1321–1335, https://doi.org/10.1029/2018EA000503, 2019.
Tabari, H.: Climate change impact on flood and extreme precipitation increases with water availability, Sci. Rep., 10, 13768, https://doi.org/10.1038/s41598-020-70816-2, 2020.
Tang, B., Hu, W., and Duan, A.: Future projection of extreme precipitation indices over the Indochina Peninsula and South China in CMIP6 models, J. Climate., 34, 8793–8811, https://doi.org/10.1175/JCLI-D-20-0946.1, 2021.
Tew, Y. L., Tan, M. L., Liew, J., Chang, C. K., and Muhamad, N.: A review of the effects of solar radiation management on hydrological extremes, Earth Environ., 1238, 012030, https://doi.org/10.1088/1755-1315/1238/1/012030, 2023.
Tilmes, S., Fasullo, J., Lamarque, J. F., Marsh, D. R., Mills, M., Alterskjaer, K., Muri, H., Kristjánsson, J. E., Boucher, O., and Schulz, M.: The hydrological impact of geoengineering in the Geoengineering Model Intercomparison Project (GeoMIP), J. Geophys. Res.-Atmos., 118, 11036–11058, https://doi.org/10.1002/jgrd.50868, 2013.
Tilmes, S., Visioni, D., Jones, A., Haywood, J., Séférian, R., Nabat, P., Boucher, O., Bednarz, E. M., and Niemeier, U.: Stratospheric ozone response to sulfate aerosol and solar dimming climate interventions based on the G6 Geoengineering Model Intercomparison Project (GeoMIP) simulations, Atmos. Chem. Phys., 22, 4557–4579, https://doi.org/10.5194/acp-22-4557-2022, 2022.
Trisos, C. H., Amatulli, G., Gurevitch, J., Robock, A., Xia, L., and Zambri, B.: Potentially dangerous consequences for biodiversity of solar geoengineering implementation and termination, Nat. Ecol. Evol., 2, 475–482, https://doi.org/10.1038/s41559-017-0431-0, 2018.
Tung, Y.-S., Wang, C.-Y., Weng, S.-P., and Yang, C.-D.: Extreme index trends of daily gridded rainfall dataset (1960–2017) in Taiwan, Terr. Atmos. Ocean. Sci., 33, 8, https://doi.org/10.1007/s44195-022-00009-z, 2022.
Tye, M. R., Dagon, K., Molina, M. J., Richter, J. H., Visioni, D., Kravitz, B., and Tilmes, S.: Indices of extremes: geographic patterns of change in extremes and associated vegetation impacts under climate intervention, Earth Syst. Dynam., 13, 1233–1257, https://doi.org/10.5194/esd-13-1233-2022, 2022.
Uccellini, L. W. and Johnson, D. R.: The coupling of upper and lower tropospheric jet streaks and implications for the development of severe convective storms, Mon. Weather Rev., 107, 682–703, https://doi.org/10.1175/1520-0493(1979)107<0682:TCOUAL>2.0.CO;2, 1979.
Visioni, D., MacMartin, D. G., Kravitz, B., Richter, J. H., Tilmes, S., and Mills, M. J.: Seasonally modulated stratospheric aerosol geoengineering alters the climate outcomes, Geophys. Res. Lett., 47, e2020GL088337, https://doi.org/10.1029/2020GL088337, 2020.
Visioni, D., MacMartin, D. G., Kravitz, B., Boucher, O., Jones, A., Lurton, T., Martine, M., Mills, M. J., Nabat, P., Niemeier, U., Séférian, R., and Tilmes, S.: Identifying the sources of uncertainty in climate model simulations of solar radiation modification with the G6sulfur and G6solar Geoengineering Model Intercomparison Project (GeoMIP) simulations, Atmos. Chem. Phys., 21, 10039–10063, https://doi.org/10.5194/acp-21-10039-2021, 2021.
Walters, D., Baran, A. J., Boutle, I., Brooks, M., Earnshaw, P., Edwards, J., Furtado, K., Hill, P., Lock, A., Manners, J., Morcrette, C., Mulcahy, J., Sanchez, C., Smith, C., Stratton, R., Tennant, W., Tomassini, L., Van Weverberg, K., Vosper, S., Willett, M., Browse, J., Bushell, A., Carslaw, K., Dalvi, M., Essery, R., Gedney, N., Hardiman, S., Johnson, B., Johnson, C., Jones, A., Jones, C., Mann, G., Milton, S., Rumbold, H., Sellar, A., Ujiie, M., Whitall, M., Williams, K., and Zerroukat, M.: The Met Office Unified Model Global Atmosphere 7.0/7.1 and JULES Global Land 7.0 configurations, Geosci. Model Dev., 12, 1909–1963, https://doi.org/10.5194/gmd-12-1909-2019, 2019.
Wang, X., Pang, G., and Yang, M.: Precipitation over the Tibetan Plateau during recent decades: a review based on observations and simulations, Int. J. Climatol., 38, 1116–1131, https://doi.org/10.1002/joc.5246, 2018.
Wang, Y., Zhou, B., Qin, D., Wu, J., Gao, R., and Song, L.: Changes in mean and extreme temperature and precipitation over the arid region of northwestern China: Observation and projection, Adv. Atmos. Sci., 34, 289–305, https://doi.org/10.1007/s00376-016-6160-5, 2017.
Wang, Z., Lin, L., Yang, M., and Xu, Y.: The effect of future reduction in aerosol emissions on climate extremes in China, Clim. Dynam., 47, 2885–2899, https://doi.org/10.1007/s00382-016-3003-0, 2016.
Wells, A. F., Henry, M., Bednarz, E. M., MacMartin, D. G., Jones, A., Dalvi, M., and Haywood, J. M.: Identifying climate impacts from different Stratospheric Aerosol Injection strategies in UKESM1, Earths Future, 12, e2023EF004358, https://doi.org/10.1029/2023EF004358, 2024.
Wilks, D. S.: Statistical methods in the atmospheric sciences, Academic Press, vol. 100, ISBN 9780123850225, 2011.
WMO: Significant Weather & Climate Events 2023, World Meteorological Organization, https://wmo.int/sites/default/files/2024-03/Supplement_2023%20-%20Layout_v1.pdf (last access: 1 November 2024), 2024.
World Climate Research Programme (WCRP): CMIP6 project data, Earth System Grid Federation (ESGF) [data set], https://esgf-node.llnl.gov/projects/cmip6/, last access: 9 June 2022.
Xiong, L., Yan, L., Du, T., Yan, P., Li, L., and Xu, W.: Impacts of climate change on urban extreme rainfall and drainage infrastructure performance: a case study in Wuhan City, China, Irrig. Drain., 68, 152–164, https://doi.org/10.1002/ird.2316, 2019.
Xu, H., Chen, H., and Wang, H.: Future changes in precipitation extremes across China based on CMIP6 models, Int. J. Climatol., 42, 635–651, https://doi.org/10.1002/joc.7264, 2022a.
Xu, K., Xu, B., Ju, J., Wu, C., Dai, H., and Hu, B. X.: Projection and uncertainty of precipitation extremes in the CMIP5 multimodel ensembles over nine major basins in China, Atmos. Res., 226, 122–137, https://doi.org/10.1016/j.atmosres.2019.04.018, 2019.
Yang, X., Zhou, B., Xu, Y., and Han, Z.: CMIP6 evaluation and projection of temperature and precipitation over China, Adv. Atmos. Sci., 38, 817–830, https://doi.org/10.1007/s00376-021-0351-4, 2021.
Yatagai, A., Kamiguchi, K., Arakawa, O., Hamada, A., Yasutomi, N., and Kitoh, A.: APHRODITE: Constructing a long-term daily gridded precipitation dataset for Asia based on a dense network of rain gauges, B. Am. Meteorol. Soc., 93, 1401–1415, https://doi.org/10.1175/BAMS-D-11-00122.1, 2012.
Ying, X., Bing, Z., Bo-Tao, Z., Si-Yan, D., Li, Y., and Rou-Ke, L.: Projected flood risks in China based on CMIP5, Adv. Clim. Change Res., 5, 57–65, https://doi.org/10.3724/SP.J.1248.2014.057, 2014.
Zarnetske, P. L., Gurevitch, J., Franklin, J., Groffman, P. M., Harrison, C. S., Hellmann, J. J., Hoffman, F. M., Kothari, S., Robock, A., and Tilmes, S.: Potential ecological impacts of climate intervention by reflecting sunlight to cool Earth, P. Natl. Acad. Sci. USA, 118, e1921854118, https://doi.org/10.1073/pnas.1921854118, 2021.
Zhang, W. and Zhou, T.: Increasing impacts from extreme precipitation on population over China with global warming, Sci. Bull., 65, 243–252, https://doi.org/10.1016/j.scib.2019.12.002, 2020.
Zhao, X., Li, H., and Qi, Y.: Are Chinese cities prepared to manage the risks of extreme weather events? Evidence from the 2021.07.20 Zhengzhou Flood in Henan Province, SSRN Elect. J., 4, 3303, https://doi.org/10.2139/ssrn.4043303, 2021.
Zhu, J., Huang, G., Wang, X., Cheng, G., and Wu, Y.: High-resolution projections of mean and extreme precipitations over China through PRECIS under RCPs, Clim. Dynam., 50, 4037–4060, https://doi.org/10.1007/s00382-017-3860-1, 2018.


