the Creative Commons Attribution 4.0 License.
the Creative Commons Attribution 4.0 License.
Tropospheric ozone precursors: global and regional distributions, trends, and variability
Jerald R. Ziemke
Sarah Strode
Hervé Petetin
Kazuyuki Miyazaki
Isabelle De Smedt
Kenneth Pickering
Rodrigo J. Seguel
Helen Worden
Tamara Emmerichs
Domenico Taraborrelli
Maria Cazorla
Suvarna Fadnavis
Rebecca R. Buchholz
Benjamin Gaubert
Néstor Y. Rojas
Thiago Nogueira
Thérèse Salameh
Min Huang
Tropospheric ozone results from in situ chemical formation and stratosphere–troposphere exchange (STE), with the latter being more important in the middle and upper troposphere than in the lower troposphere. Ozone photochemical formation is nonlinear and results from the oxidation of methane and non-methane hydrocarbons (NMHCs) in the presence of nitrogen oxide (NOx=NO+NO2). Previous studies showed that O3 short- and long-term trends are nonlinearly controlled by near-surface anthropogenic emissions of carbon monoxide (CO), volatile organic compounds (VOCs), and nitrogen oxides, which may also be impacted by the long-range transport (LRT) of O3 and its precursors. In addition, several studies have demonstrated the important role of STE in enhancing ozone levels, especially in the midlatitudes. In this article, we investigate tropospheric ozone spatial variability and trends from 2005 to 2019 and relate those to ozone precursors on global and regional scales. We also investigate the spatiotemporal characteristics of the ozone formation regime in relation to ozone chemical sources and sinks. Our analysis is based on remote sensing products of the tropospheric column of ozone (TrC-O3) and its precursors, nitrogen dioxide (TrC-NO2), formaldehyde (TrC-HCHO), and total column CO (TC-CO), as well as ozonesonde data and model simulations. Our results indicate a complex relationship between tropospheric ozone column levels, surface ozone levels, and ozone precursors. While the increasing trends of near-surface ozone concentrations can largely be explained by variations in VOC and NOx concentration under different regimes, TrC-O3 may also be affected by other variables such as tropopause height and STE as well as LRT. Decreasing or increasing trends in TrC-NO2 have varying effects on TrC-O3, which is related to the different local chemistry in each region. We also shed light on the contribution of NOx lightning and soil NO and nitrous acid (HONO) emissions to trends of tropospheric ozone on regional and global scales.
- Article
(20104 KB) - Full-text XML
-
Supplement
(5808 KB) - BibTeX
- EndNote
Tropospheric ozone (O3) is an important air pollutant due to its diverse effects on air quality, ecosystems (Mills et al., 2018), health (Lefohn et al., 2018; Fleming et al., 2018), and climate (Boucher et al., 2013; Myhre et al., 2013; Zanis et al., 2022). O3 is a photochemical product that results from the oxidation of methane (CH4) and non-methane hydrocarbons (NMHCs) in the presence of nitrogen oxides (NOx). Tropospheric ozone burdens can also be affected by stratosphere–troposphere exchange (STE) (Stohl et al., 2003; Zeng et al., 2010; Trickl et al., 2011; Li et al., 2024) and long-range transport (LRT) of ozone (e.g., Hov et al., 1978; Ravetta et al., 2007; Itahashi et al., 2020). O3 is considered a short-lived climate forcer (SLCF) and is the third-most important greenhouse gas, with an effective radiative forcing of () W m−2; Forster et al., 2021). Since the mid-1990s, free-tropospheric ozone trends based on in situ measurement and satellite retrievals have increased with high confidence (HC) by 1–4 nmol mol−1 decade−1 across the northern midlatitudes and 1–5 nmol mol−1 decade−1 within the tropics (Gulev et al., 2021). In the Southern Hemisphere, with more limited observational coverage compared with the Northern Hemisphere, the tropospheric column ozone shows an increase since the mid-1990s by less than 1 nmol mol−1 decade−1, with medium confidence at southern midlatitudes (Gulev et al., 2021; Cooper at al., 2020). Tropospheric O3 short- and long-term trends are nonlinearly controlled by anthropogenic emissions of carbon monoxide (CO), volatile organic compounds (VOCs), and nitrogen oxides (NOx=NO+NO2), as well as STE, especially in the midlatitudes (Li et al., 2024). Meteorological parameters such as wind speed and wind direction may also enhance the LRT of O3, affecting regional ozone burdens, especially in the free troposphere (e.g., Glotfelty et al., 2014; Itahashi et al., 2020). Methane, with an assessed total atmospheric lifetime of 9.1±0.9 years (Szopa et al., 2021), is also a crucial driver of tropospheric ozone (Fiore et al., 2002; Isaksen et al., 2014). Its accelerated growth rate of 7.6±2.7 nmol mol−1 yr−1 between 2010 and 2019 (Canadell et al., 2021) is largely driven by anthropogenic activities (Szopa et al., 2021). NOAA Global Monitoring Laboratory (GML) observations of methane (NOAA, 2024) show that methane concentrations in the atmosphere have increased sharply since 2005 (an 8 % increase from 2005 to 2023). Future scenarios show that emission control measures can influence future changes to air pollutants. Although the global increases in CH4 abundance may offset benefits to surface O3 from local emission reductions (Fiore et al., 2002; Shindell et al., 2012; Wild et al., 2012; Szopa et al., 2021), recent reports (e.g., Itahashi et al., 2020; Zanis et al., 2022) showed the dominant role of precursor emission changes in projecting surface ozone concentrations under future climate change scenarios. In this study, we investigate the relation between ozone trends and the trends of its precursors, with a focus on NO2, CO, and HCHO.
Coupled Model Intercomparison Project Phase 6 (CMIP6) overestimates observed surface O3 concentrations in most regions, with larger variability over Northern Hemisphere (NH) continental regions (e.g., Tarasick et al., 2019; Turnock et al., 2020). CMIP6 models simulate large increasing trends of surface concentrations of O3 and PM2.5 in East and South Asia, with an annual mean increase of up to 40 ppb and 12 µg m−3, respectively, over the historical periods (1850–2014; Turnock et al., 2020). However, studies also found that CMIP6 models consistently underestimate PM2.5 concentrations in the NH, especially during the winter months, with larger variability near natural source regions, indicating missing sources (e.g., HONO) of O3 (e.g., Elshorbany et al., 2014).
Satellite observations have the advantage of large spatial and consistent temporal coverage. Tropospheric columns of ozone (TrC-O3), in Dobson units (1 DU = 2.69×10²⁰ molecules m−2), are usually used to represent tropospheric ozone levels. The tropospheric column of a species is the species' concentration integrated from the surface to the top of the troposphere, the tropopause. The tropopause height is dynamically changing, and it varies over time, increasing or decreasing as a function of several factors, including tropospheric and stratospheric temperature (warming or cooling). Steinbrecht et al. (1998) found that observed tropospheric warming of 0.7±0.3 K decade−1 leads to an increase in the tropopause high and a decrease (at a rate of 16 DUv) in the observed column ozone levels. Similarly, after removing the variations related to major natural forcings, including volcanic eruptions, ENSO (El Niño–Southern Oscillation), and QBO (Quasi–Biennial Oscillation), Meng et al. (2021) concluded that a continuous rise of the tropopause in the Northern Hemisphere (NH) from 1980 to 2020 is evident, which they related mainly to tropospheric warming caused by anthropogenic emissions. Steinbrecht et al. (1998) and Meng et al. (2021) calculate the same rate of tropopause increase for the periods 1980–2000 and 1980–2020, respectively. We investigate the trends in TrC-O3 and ozone precursors at different column depths and determine their relationships.
Global models play a vital role in interpreting the observed trends in ozone precursors, verifying the consistency of emission inventories with observed precursor concentrations, and relating trends in ozone precursor emissions to ozone trends. Because satellite measurements are often sensitive to species concentrations above the surface, models provide additional information on the vertical distribution of ozone precursors needed to relate emissions or surface trends to a column or free-tropospheric observations. For example, chemical transport models are used to relate Ozone Monitoring Instrument (OMI) NO2 columns to surface NO2 concentrations and their trends over the United States (e.g., Lamsal et al., 2008, 2015; Kharol et al., 2015) since they provide vertical information on the NO2 distribution. Models are also used to infer NOx emission trends from observations (e.g., Richter et al., 2005; Stavrakou et al., 2008; Miyazaki et al., 2016) or to examine whether simulations driven by state-of-the-art emissions inventories can reproduce observed changes in NOx (Itahashi et al., 2015; Godowitch et al., 2010). Models also provide insight into the role of background NO2 versus local sources in relating satellite-observed NO2 columns to NOx emissions changes (Silvern et al., 2019). Similarly, global models are vital for understanding trends in CO, since the lifetime of CO allows local emissions and long-range transport as well as the global background to influence regional trends of CO and O3. Duncan and Logan (2008) attributed the decreasing CO in the NH from 1998–1997 to decreasing European emissions and highlighted the role of Indonesian fires in driving interannual variability. Numerical models can also be used to assimilate satellite CO observations to invert for CO emission fluxes, often highlighting differences between bottom-up and top-down inventories (e.g., Kopacz et al., 2010; Fortems-Cheiney et al., 2011; Elguindi et al., 2020; Gaubert et al., 2020). For instance, several modeling studies found that the increasing emissions from China in recent years in some emission inventories were inconsistent with the negative trends observed by MOPITT (Yin et al., 2015; Strode et al., 2016; Zheng et al., 2019), while the decreases over the United States and Europe are supported by the observed decrease in CO. Jiang et al. (2017) and Zheng et al. (2019) also found that a decrease in biomass burning contributes to the negative CO trend in the NH. The mean calculated O3 burden using CMIP6 simulation (Griffiths et al., 2021) revealed an increase of 44 % from 1850 to the mean of the period of 2005–2014 and another 17 % until 2100 using the SSP370 experiments. Other sources of NOx such as lightning and soil emissions play an important role in controlling the O3 budget, especially in low-NOx regions. We investigate these sources and the role they play in determining O3 trends and variability on regional and global scales, as well as their determining factors.
Previous literature demonstrates the importance of controlling the emissions of ozone precursors to effectively reduce surface O3 levels. Therefore, a thorough and rigorous understanding of the trends and variability for O3 precursors is of paramount importance for a global abatement strategy of O3 levels. In this study, we use ozonesonde, remote sensing, and global models to evaluate tropospheric O3 and O3 precursor trends of CO, HCHO, and NO2 on regional and global scales.
2.1 Trend analysis
We analyze the historical trends of tropospheric ozone and its precursors CO, NO2, and HCHO from 2005 to 2019. For trend analysis, we use two methods, the quantile regression (QR) method (Chang et al., 2023) and weighted least squares (WLS). For NO2, CO, and HCHO trends are calculated based on the QR method (Chang et al., 2023), as follows: (1) we first compute the deseasonalized monthly time series of NO2 and HCHO tropospheric columns (hereafter referred to as TrC-NO2 and TrC-HCHO) and the CO atmospheric column (TC_CO); (2) we use the quantile regression method for computing the trend, focusing here on the median; and (3) uncertainties at a 95 % confidence level are estimated using the block bootstrapping approach through 1000 iterations with blocks size of N0.25, with N the number of monthly values. They are calculated over a 1° ×1 ° grid and only in cells where at least 75 % of the monthly values are available. TC_CO column (see Sec. 2.2.1) time series trends are also calculated as weighted least squares (WLS) of the monthly anomaly, weighted by the monthly regional standard deviation (for comparison with the QR method). The tropospheric ozone column (TrC-O3) trends are calculated based on the WLS method. Tropospheric columns of satellite observations are calculated based on the World Meteorological Organization (WMO) thermal definition of the tropopause. To account for varying tropospheric column definitions used in previous literature, we also evaluate the trends at varying column depths.
2.2 Data resources
In this section, we present the different data repositories and their characteristics.
2.2.1 Satellite data
A list of the applied satellite data products and their resolution is shown in Table 1. For tropospheric ozone data, we use the Ozone Monitoring Instrument/Microwave Limb Sounder (OMI/MLS) product (Ziemke et al., 2006). The OMI/MLS product is the residual of the OMI total ozone column and the MLS stratospheric ozone column, available as gridded monthly means. The OMI/MLS tropospheric column ozone product applies all necessary data quality flags to both OMI total ozone and the MLS profile ozone; the OMI/MLS product further includes cloud filtering by omitting all scenes with OMI reflectivity greater than 0.30. The tropospheric NO2 column retrievals used were from the QA4ECV project (http://www.qa4ecv.eu/ecvs, last access: 18 October 2024) version 1.1 Level 2 (L2) product for OMI (Boersma et al., 2017a), GOME-2 (Boersma et al., 2017b), and SCIAMACHY (Boersma et al., 2017c). The ground pixel sizes of the OMI, GOME-2, and SCIAMACHY retrievals are 13 km × 24 km, 80 km × 40 km, and 60 km × 30 km, with local Equator overpass times of 13:45, 09:30, and 10:00 LT, respectively. We also use HCHO tropospheric columns retrieved from OMI (De Smedt et al. 2018) from the QA4ECV project. Atmospheric total column CO daytime observations were obtained from the MOPITT instrument aboard the Terra satellite (Barret et al., 2003; Buchholz et al., 2017). Monthly daytime L3 data were obtained at 1° gridded horizontal resolution from the NASA Langley Research Center Atmospheric Science Data Center (ASDC, 2024), using version 9 (V9) retrievals, and the joint near-infrared–thermal infrared product (Deeter et al., 2022). Low-quality data were excluded by applying the provided quality flag.
2.2.2 Ozonesonde data
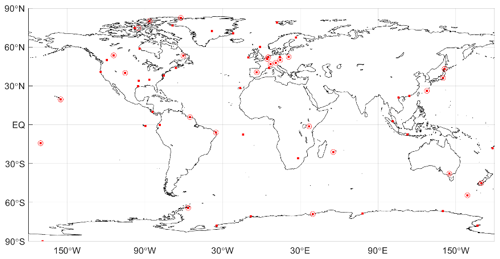
Direct sampling of ozone throughout the atmospheric column by ozonesondes on board high-altitude balloons is a primary source of information of the ozone abundance and changes in the free troposphere. Ozonesonde data have been used extensively for satellite ozone product validations, trend analyses, and as a priori climatology profiles for satellite retrieval algorithms (McPeters and Labow, 2012; Labow et al., 2015; Hubert et al., 2021; Christiansen et al., 2022; Newton et al., 2016). Ozonesonde networks around the globe have been providing the ozone community with accurate in situ measurements of high vertical resolution (100 m) for the last 5 decades in the Northern Hemisphere (Krizan and Lastovicka, 2005) and nearly 3 decades at stations in the tropics (Thompson et al., 2017), and in the last decade new efforts have been contributing with data from undersampled regions such as the tropical Andes (Cazorla and Herrera, 2022). Other important contributions include dedicated campaigns for regional studies (e.g., Newton et al., 2016; Fadnavis et al., 2023). Figure 1 shows a map with ozonesonde stations around the globe whose data are publicly available from data providers (station names, coordinates, and links for data access in Table S1 in the Supplement). In this work, we present a review of ozonesonde trends calculated and published in previous studies (Wang et al., 2022; Christiansen et al., 2022).
2.2.3 Model simulations of ozone precursors and their vertical distribution
Model simulations provide information on the vertical distribution of trace gases that can help interpret the observed columns. Here, we use a Goddard Earth Observing System (GEOS) Earth system model (Molod et al., 2015) simulation run with the Global Modeling Initiative (GMI) chemistry mechanism (Duncan et al., 2007; Strahan et al., 2007; Nielsen et al., 2017) to simulate the contributions of the lower, middle, and upper troposphere to the tropospheric columns of ozone and its precursors. The model configuration is described in Fisher et al. (2024) and summarized here. The MERRA-2 reanalysis (Gelaro et al., 2017) constrains the GEOS-GMI meteorology. The GEOS-GMI meteorology is replayed to the MERRA-2 meteorology as described in Orbe et al. (2017). Anthropogenic emissions of NO2, CO, and VOCs are based on the MACCity inventory (Granier et al., 2011) through 2010 and the RCP8.5 emissions afterward, with NO2 emissions scaled based on OMI. The emissions are downscaled to higher resolution using the EDGAR 4.2 emission inventory (Janssens-Maenhout et al., 2013). Biomass burning emissions for the analysis period come from the Fire Energetics and Emissions Research (FEER) product (Ichoku and Ellison, 2014). Liu et al. (2022) evaluated another GEOS simulation with GMI chemistry with satellite observations of TrC-O3, TrC-NO2, TrC-HCHO, and TC-CO.
3.1 TrC-O3 sensitivity to tropopause
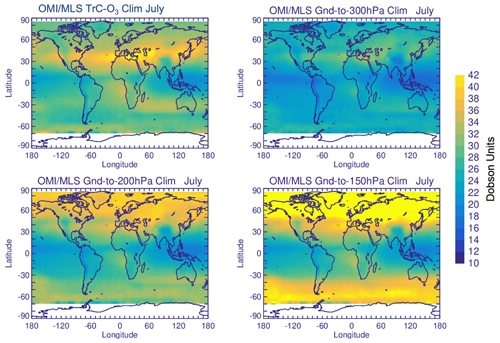
Calculated TrC-O3 depends on several factors such as tropospheric ozone levels, atmospheric warming (e.g., due to greenhouse gas emissions) or cooling (stratospheric or tropospheric (e.g., after major volcanic eruptions), and tropopause height (TH). Atmospheric warming or cooling can lead to a decrease or an increase, respectively, in TrC-O3 due to the respective change in the TH. Several methods are used to determine the TH. The WMO thermal definition for the first TH is the lowest altitude level at which the lapse rate decreases to 2 ° K km−1 or less, provided that the average lapse rate between this level and all higher levels within 2 km does not exceed 2 ° K km−1. A second tropopause may be also found if the lapse rate above the first tropopause exceeds 3 ° K km−1 (WMO, 1992; Hoffmann and Spang (2022). Other studies define the TH based on fixed pressure levels (from the ground to 150, 200, 300, and 400 hPa). Mean OMI/MLS TrC-O3 values in July (2005–2019) calculated based on the WMO thermal definition are shown in Fig. 2. TrC-O3 values are comparable to previously reported CMIP6 and satellite measurements (Griffiths et al., 2021). Partial ozone columns (OCs) calculated from the ground to different pressure levels of 150, 200, and 300 hPa show increasing OC values with increasing column depth, with calculated OC at 150 and 200 hPa being the closest to the TrC-O3 WMO values, still overestimating OC in the Northern Hemisphere (50–90° N), especially for 150 hPa OC; see Fig. 2.
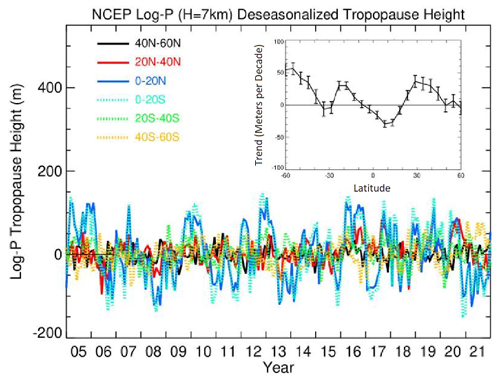
Steinbrecht et al. (1998) found that observed tropospheric warming of 0.7 ± 0.3 K decade−1 leads to an increase in the TH and a decrease in total ozone. They also calculated a decrease of 16 DU per kilometer increase in TH. These results indicate the importance of TH for calculated long-term ozone trends. This could also affect comparisons between trends calculated based on different TrC-O3 definitions and near-surface ozone levels. The time series of deseasonalized TH from 2004 to 2021 are shown in Fig. 3 together with their zonal mean trends. Trends in TH are positive, reaching 60 m decade−1 except in a narrow band in the tropics from 10° S to 20° N and at 30° S, where TH decreases at a rate up to 30 m decade−1. TH in the tropical regions is also characterized by high variability (see Fig. 3). These results are also consistent with recent reports showing a positive trend of TH from 20–80° N at a rate of 50–60 m decade−1 (Meng et al., 2021). This increase has been primarily related to tropospheric warming. These results show that using a fixed pressure level for the tropopause may not be accurate given the change in TH over time. In the following sections, tropospheric columns will be calculated based on the WMO tropopause definition.
3.2 Spatial distribution of O3 and its precursors
Tropospheric O3 results from in situ photochemical formation and STE. In situ O3 results from the photolysis of NO2. Therefore, the sources and fate of NO2 in the atmosphere determine O3 burden and distribution. NO2 is formed from the reaction of hydrogen peroxyl (HO2) and alkyl peroxyl (RO2) radicals with NO (Reaction R1). While photolysis of NO2 is the main source of ozone, high NO2 levels can suppress O3 levels as NO2 reacts with the OH radical, forming HNO3 (Reactions R2–R4), thus reducing the oxidation rate of hydrocarbons as well as HO2 and RO2 levels, leading to a net loss of O3 (e.g., Finlayson-Pitts and Pitts, 2000; Elshorbany et al., 2010; Archibald et al., 2020). Ozone production efficiency is calculated as the ratio of the number of NO2 molecules photolyzed to form O3 to that lost due to the reaction with OH forming HNO3. Under NO-sensitive conditions, the decrease in NOx leads to a reduction in OH, HCHO, and O3. However, under high NO conditions, a reduction in NOx could lead to an increase in photochemical products, OH, HCHO, and O3 because a reduction in NO2 leads to a decrease in OH loss rate and thus higher HO2 and RO2 production (Elshorbany et al., 2012; Archibald et al., 2020).
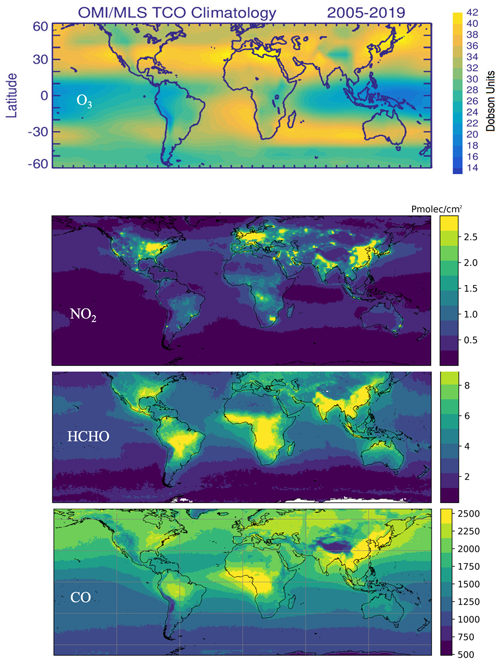
The observed mean tropospheric columns of O3, NO2, and HCHO and the atmospheric column of CO from 2005 to 2019 are shown in Fig. 4. The unit for column number density is Pmolec. cm−2 (×1015 molecules per square centimeter), except for TrC-O3, which is Dobson units. The NO2 concentration has decreased since 2005 in North America, Europe, and Australia, mainly due to strict measures to reduce air pollution (Lamsal et al., 2015). Since O3 is a photochemical product that is formed based on nonlinear chemistry, a reduction in NO2 may lead to an increase or decrease in tropospheric O3 levels based on the dominant photochemical regime in the respective region. In addition, tropospheric ozone levels may be affected by STE, especially in the middle and upper troposphere (Li et al., 2024), as well as LRT, especially in the free troposphere (e.g., Glotfelty et al., 2014; Itahashi et al., 2020). The highest values of the NO2 tropospheric column are in the Northern Hemisphere between 10 and 50° N, especially over the eastern US, northern Europe, and eastern and southern Asia, with elevated levels in the Southern Hemisphere (SH) between 10 and 30° S, especially in sub-Saharan Africa and Brazil. TrC-O3 is also highest over the band of 20–50° N, especially over the eastern coast of the US, southern Europe, and eastern Asia. Some differences exist between TrC-O3 and TrC-NO2 spatial patterns, which is due to factors including different lifetime, photochemical sensitivity (see Sect. 3.4), and STE. On average, the Northern Hemisphere has higher TC-CO than the Southern Hemisphere due to a larger number of sources (Buchholz et al., 2021). Additionally, high amounts of CO are found in regions with large anthropogenic sources (e.g., eastern China) or in regions with large and regular fire seasons (e.g., central Africa) (Buchholz et al., 2021). HCHO and CO show a similar spatial pattern over western Africa due to emissions from biomass burning (Marais et al., 2012; Buchholz et al., 2021). In the following sections, global and regional trends of TrC-O3 are investigated along with tropospheric ozone precursors.
3.3 Simulated O3 precursors
Ozone and its precursors differ in their vertical distribution through the troposphere. In this section, we use the GEOS simulations to show how the lower, middle, and upper troposphere contribute to the simulated columns of O3 and its precursors to complement the column information from satellites. Figure 5 shows the simulated mean (2005–2019) contributions to tropospheric columns of O3, NO2, formaldehyde, and CO, partitioned into the lower (up to 700 hPa), middle (700–400 hPa), and upper (400 hPa to tropopause) portions of the troposphere for the tropical band (30° S: 30° N) and the global mean. The middle troposphere and upper troposphere make large contributions to the simulated TrC-O3 and its variability (Fig. 5). The lower troposphere makes the largest contribution to TrC-HCHO since it is mainly a photochemical product (e.g., Elshorbany et al., 2009), and all three levels make substantial contributions to the CO column. Globally, the relative contributions for TrC-O3, TrC-HCHO, and CO are similar to those of the tropics. However, for TrC-NO2 the lower troposphere makes a smaller contribution in the tropics than globally.
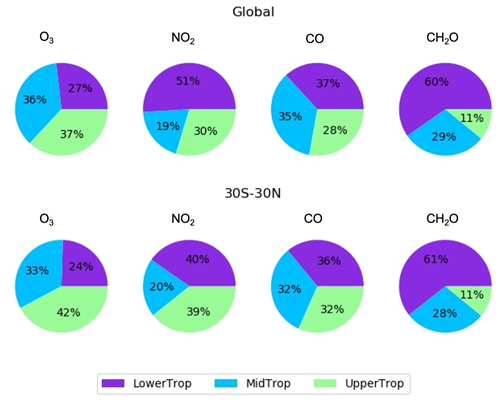
Figure 5Simulated average (2005–2019) contributions to the tropospheric columns of O3, NO2, formaldehyde, and CO from the lower (surface to 700 hPa), middle (700–400 hPa), and upper troposphere (400 hPa to the tropopause) using NASA GEOS-GMI. The top row is for the global mean, while the bottom row is averaged from 30° S–30° N.
3.4 Tropospheric trends
3.4.1 Global tropospheric ozone
Global TrC-O3 trends calculated for different column depths are shown in Fig. 6. Compared to TrC-O3, OC trends up to 150 hPa seem to be the closest despite OC values being much higher than that of the TrC-O3 (Fig. 2). All trends with high confidence, HC (at 95 % confidence), are positive, indicating increasing trends of ozone columns, regardless of the tropopause height. Low-confidence, LC (at 2σ levels), decreasing TrC-O3 trends were also found in some locations, e.g., South Australia, southern Africa, and the northeastern coast of the US. Increasing trends in the northern midlatitudes may also be partially related to STE (Williams et al., 2019; Li et al., 2024). While the annual trends provide information about overall trends, seasonal trends provide insights into local chemistry and meteorology. For example, during the boreal summer months of June, July, and August (JJA), TrC-O3 HC trends are similar to the annual trends except for HC decreasing trends over South America and southern Africa and HC increasing trends over western and central Africa and Central America (Fig. S7). During the boreal winter months, HC trends are also similar to the annual trends (Fig. 6) except for HC increasing trends over Europe, North America, South America, and southern Africa (Fig. S7).
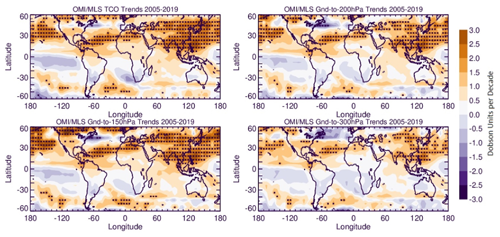
Figure 6Trends in tropospheric column ozone, based on the WMO thermal definition, and the trends in ozone columns (from the ground to 150, 200, and 300 hPa). Trends are calculated based on deseasonalized monthly data from 2005 to 2019. Asterisks denote 95 % confidence trends.
The time series of OMI/MLS TrC-O3 averaged over several latitudinal bands and at different column depths are shown in Fig. 7. Zonal mean TrC-O3 compares well with partial ozone columns in the tropics (from 30° S to 30° N), with the OC up to 300 hPa differing by about 10 DU from TrC-O3 (Fig. 7b). The lowest TrC-O3 trends are located in the Northern Hemisphere (30–60° N) at 0.78±1.16 DU decade−1, followed by the Southern Hemisphere (30–60° S (0.95±0.75 DU decade−1) and the tropical band (30–30° N (1.06±0.40 DU decade−1). In addition, the continental trends over Australia, southern Africa, and South America in the 30–60° S band are essentially negative, and the positive trends in this band are contributed mainly by oceanic regions (see Fig. 6). The positive trends in the 30–60° N band are slightly offset by the negative trends over the northeastern US and western Europe (see Fig. 6).
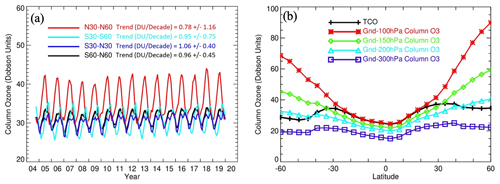
Figure 7Time series and zonal mean trends of OMI/MLS TrC-O3 in different latitudinal bands (a) and the zonal mean of different column depths (b) from 2005–2019.
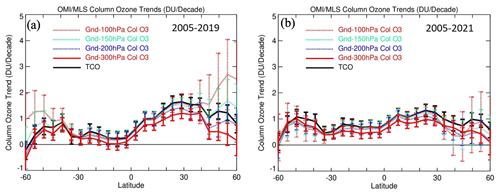
Observed trends for the time period before COVID-19 (2005–2019) show that OC trends were highest in the northern latitudes (0–30° N), reaching about 1.5 DU decade−1, followed by the northern midlatitudes 30–60° N (Fig. 8). The high trends in the 30–60° N band are dominated by trans-Pacific impacts as well as some impacts from East Asia. The positive trends in the Southern Hemisphere (0–30° S) are mainly over Amazonia and Southeast Asia, being offset by small negative trends over Western Australia and southern Africa. The trends during the time period (2005–2021) show a decline in O3 column trends in the Northern Hemisphere but a slightly increasing trend in the Southern Hemisphere (Fig. 8b). The decreasing trends in the Northern Hemisphere during COVID-19 are consistent with previous literature showing a decrease in several pollutants including NO2 and O3 due to the extended lockdown periods imposed during the pandemic (e.g., Bauwens et al., 2020; Elshorbany et al., 2021; Steinbrecht et al., 2021; Putero et al., 2023). The decrease in NO2 in some parts of Europe and the northeastern USA led to a decrease in tropospheric O3.
Zonal mean trends (Fig. 8) show that OC up to 150 hPa is almost identical to that of TrC-O3 except for the high latitudes at 45–60° S and 45–60° N. The decreasing trends above 30° N and 30° S are due to the offsetting impact of negative trends over the northeastern US and western Europe in the north and Australia and southern Africa in the south, respectively. This impact is less apparent in the 150 hPa OC due to the lower positive trends in that band compared to TrC-O3. The 200 hPa OC comes next, with very good agreement from 60° S to 10° N, followed by 100 hPa, which is only in good agreement from 30° S to 30° N, while the 300 hPa OC was the farthest from the TrC-O3. The decrease in O3 in the northeastern US and western Europe is consistent with decreasing NO2 trends and NO-sensitive conditions dominating these regions. The decreasing trends of NO2 (see below) are due to the successful measures applied since 2004 to mitigate air pollution in these regions. The increase in O3 in the western US may be due to LRT from eastern Asia (e.g., Itahashi et al., 2020).
3.4.2 Free-tropospheric trends
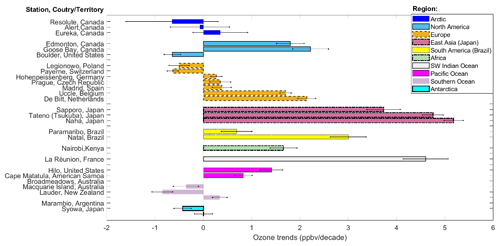
Trends of ozone in the free troposphere presented here are based on previous work published in the literature. Despite the high stability of ozonesonde measurements across the global networks over several decades (Stauffer et al., 2022), the spatial sparsity of sounding stations and nonuniform sampling frequency among sites are limitations to using these data to produce trends. These shortcomings have constrained the ability to include data from many stations in previously published analyses. For example, Chang et al. (2020) estimated that at least 18 profiles per month are needed at a single station to calculate accurate long-term trends, while uncertainty increases at lower sampling rates (Chang et al., 2024). However, such high sampling frequency is only achieved at three European stations (Hohenpeissenberg, Germany; Payerne, Switzerland; and Uccle, Belgium), while the rest of the global stations work at lower sampling rates. Nonetheless, high-quality ozonesonde observations continue to be the gold standard against which satellite measurements are validated. Likewise, ozonesonde data continue to provide spaceborne observations with climatological feedback. Thus, recent studies have softened the sampling frequency criteria in order to take advantage of the valuable dataset collected by the global ozonesonde networks. For example, the latest trend studies establish a minimum frequency requirement to calculate trends of at least three profiles per month (Wang et al., 2022; Christiansen et al., 2022) with at least 8 months of sampling in a year and at least 15 annual means for an analysis of about 2 decades (Wang et al., 2022). With these criteria, recent ozonesonde trend analyses indicate that the ozone concentration has increased globally by 1.8 ± 1.3 ppbv decade−1 in the free troposphere within 800 to 400 hPa (Christiansen et al., 2022). However, there is high regional variability, as illustrated in Fig. 9 where ozone trends published by Wang et al. (2022) (1995–2017 data between 950–250 hPa) are organized by region and station. For example, ozone in East Asia (Japan) has been increasing at a rate of 3.5 to 5 ppbv decade−1, particularly since 2010 (Christiansen et al., 2022), which may lead to trans-Pacific LRT of O3 to the western US (e.g., Itahashi et al., 2020). Over the southwestern Indian Ocean (La Réunion), trends are of similar magnitude (> 4.5 ppbv decade−1). In tropical South America, over the Atlantic basin region (Paramaribo and Natal), sounding measurements also show that ozone increases by almost 3 ppbv decade−1 (Natal), but other regions in South America continue to lack sufficient measurements to produce trends. At tropical stations in Africa (Nairobi) and the Pacific Ocean (Hilo and American Samoa) trends are also positive, although of lower magnitudes (0.83–1.7 ppbv decade−1). In contrast, polar stations in both the Arctic and Antarctica as well as the Southern Ocean show overall decreasing ozone concentrations to low-confidence trends. Exceptions are the Eureka station in Canada and Lauder station in Aotearoa / New Zealand, which both show slight ozone increases (less than 0.5 ppbv decade−1). The direction of regional trends by Wang et al. (2022) is consistent with regional trends presented in similar independent research (Christiansen et al., 2022). As atmospheric composition continues to become modified under the current regime of climate change, building consistent and longer time series of ozonesonde measurements for other regions will continue to be an important source of firsthand information to assess tropospheric ozone changes and trends.
3.4.3 Regional ozone trends
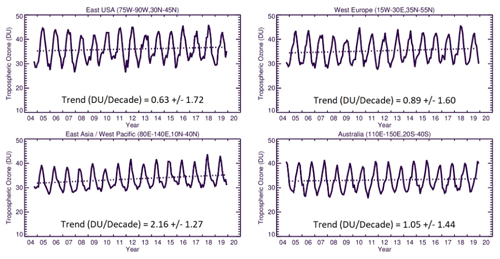
As shown in Fig. 10, the highest OMI/MLS regional trend is observed over East Asia (2.16±1.27 DU decade−1), while the lowest trend is calculated over the eastern USA (0.63±1.72), followed by western Europe (0.89±1.60) and Australia (1.05±1.44) DU decade−1. We next calculate the monthly trends from the GEOS-GMI simulation to investigate how the simulated trends vary through the tropospheric column.
The simulated trends in partial columns (lower, middle, and upper troposphere), as well as TrC-O3, TrC-NO2, TrC-HCHO, and TC-CO from 2005 to 2019, are shown in Fig. 11. The simulated tropospheric columns of TrC-O3 and TrC-HCHO show a positive trend in most regions (Fig. 11), consistent with the results of Liu et al (2022) using a different GEOS-CCM simulation (CCM: chemistry climate model). Liu et al. (2022) highlighted the importance of formaldehyde trends for analyzing the simulated trends in tropospheric ozone. Considering different latitude bands, the highest trends are simulated between 30° S and 60° N, consistent with calculated trends based on satellite observations (see Sect. 3.4). In contrast, the simulated NO2 and CO trends are mostly negative, although positive trends are simulated over East Asia. The largest NO2 negative trends are in the Northern Hemisphere between 30 and 60° N. The decrease in NO2 trends is consistent with the successful measures to curb pollution emissions in the US and Europe. The increased trends in TrC-O3 but decreased trends in TrC-NO2 and TC-CO might indicate STE contribution (Trickl et al., 2020; Li et al., 2024) in addition to the local chemistry.
The GEOS-GMI simulation provides an estimate of the relative contribution from different portions of the tropospheric column to the column trends and shows that this contribution varies by region and constituent. The middle troposphere and upper troposphere make the largest contributions to the simulated TrC-O3 trend globally, with large contributions from the upper troposphere driving the simulated TrC-O3 trend at 30° S–30° N (Fig. 11). The middle troposphere and upper troposphere contribute most of the simulated positive TrC-O3 trend over the eastern USA, while all three levels contribute over western Europe and East Asia. The upper troposphere makes the primary contribution to the simulated trend over Australia. Simulated TrC-O3 trends are also quite comparable to those observed by OMI/MLS within the measurement model uncertainty (see Figs. 10 and 7). Over Australia, the OMI/MLS trend of 1.05±1.44 DU decade−1 is higher than the model trend of about 0.18±0.308 DU decade−1 (see Fig. 11). However, since the OMI/MLS trend has a calculated uncertainty (2σ) of 1.44 DU decade−1, both the model and OMI/MLS for Australia are not statistically different.
While the upper troposphere is a major driver of the simulated TrC-O3 trends, the lower troposphere is the largest contributor to the simulated trends in tropospheric NO2, CO, and HCHO globally and over many regions (Fig. 11). Exceptions include the simulated NO2 in the tropics (30° S–30° N), which is dominated by the upper troposphere; the simulated HCHO column over the eastern USA, which is driven by the middle and upper troposphere; an important role for upper-tropospheric CO over East Asia; and the CO trend over Australia driven by the middle-tropospheric contribution. Figure 11 also shows that in some regions, such as the eastern USA for all three precursors, the upper- and lower-tropospheric trends counteract each other, reducing the magnitude of the column trend. In the following sections, we investigate trends and variability in O3 precursors, NO2, CO, and HCHO.
3.4.4 NO2 trends
The TrC-NO2 trends over 2005–2019 are shown in Fig. 12, with a regional summary in Fig. 13. On a global scale, there is strong spatial variability in the TrC-NO2 trends. About a third of the oceans show an HC increase in TrC-NO2 trends (at 95 % confidence level), especially at midlatitudes, with trends up to +0.01 Pmolec. cm−2 yr−1, while only a few cells in the equatorial Pacific show an HC decrease.
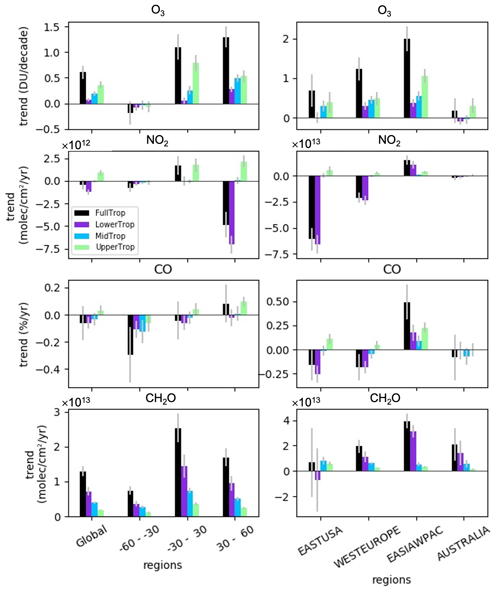
Figure 11Global and regional trends in O3, NO2, CO, and HCHO calculated from the GEOS-GMI simulation for the tropospheric column (black), lower troposphere (purple), middle troposphere (blue), and upper troposphere (green) from 2005 to 2019. The lower troposphere, middle troposphere, and upper troposphere are defined as in Fig. 5.
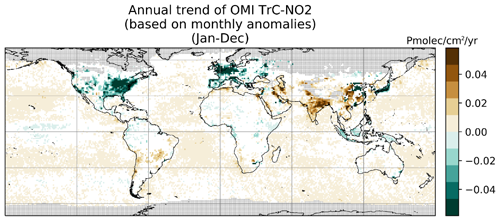
Figure 12Global trends of the OMI NO2 tropospheric column (TrC-NO2) over 2005–2019 (see text for details on the calculation of the trends). Gray areas correspond to areas without enough data, and white areas correspond to regions where the trends remain at low confidence (at a 95 % confidence level).
Regional trends are shown in Fig. 13. For high-confidence trends in a given region, the numbers correspond to percentiles 5, 50, and 95 of trends among the different cells of the region where trends are considered high-confidence. Each region is tagged with a circle whose size is proportional to the p50 of the high-confidence trends (red for positive and green for negative), which allows us to quickly see regions where the trend is strong. For instance, for eastern Asia (this region includes 1442 1° × 1° grid cells) about 15 % of the grid cells (about 216 grid cells) in this region show a high-confidence decrease in TrC-NO2. Over these specific 216 cells with a high-confidence decrease in TrC-NO2, the 5th and 95th percentile of the trend is −0.34 and −0.01 Pmolec. cm−2 yr−1, respectively. About 28 % of the grid cells in this region show a high-confidence increase in TrC-NO2 (which means about 403 grid cells). Over these specific 403 cells with a high-confidence increase in TrC-NO2, the 5th (95th) percentile of the trend is +0.01 (0.05) Pmolec. cm−2 yr−1. Therefore, the eastern Asia region shows subregions with high-confidence decreasing TrC-NO2, others with high-confidence increasing TrC-NO2, and the rest with low-confidence (positive and negative) trends. This figure allows us to quickly understand the distribution of the trends within a given region, while the overall regional trend is given by the 50th percentile and the circles tagging each region. It is a regional summary of what is shown in the global trend map. In eastern Asia, the area where trends are high-confidence positive is more extended than for the high-confidence decrease (28 % versus 15 %), but the trend values tend to be smaller (at least when comparing the 50th percentiles: −0.05 versus +0.01 Pmolec. cm−2 yr−1). The map of regions is included in the Supplement. Canada is included in northern America, but as shown in the trend map, most of Canada does not have OMI data.
Over continental areas, high-confidence positive and negative trends are found in about 15 %–20 % of the grid cells (Fig. 12). Regions with predominantly decreasing TrC-NO2 include western and southern Europe (where about 50 %–60 % of cells show a high-confidence decrease), northern America (40 % of cells show a high-confidence decrease, mostly located in the eastern United States), Japan, and Indonesia. In absolute terms, these negative trends reach values of about −0.03 Pmolec. cm−2 yr−1. Specific eastern regions of China also show similar high-confidence TrC-NO2 decreases, but overall, a larger part of the country faces increasing trends up to +0.03 Pmolec. cm−2 yr−1. Similar positive trends are observed over most of India, as well as in specific parts of southeastern Asia (mainly Vietnam) and the Middle East (mainly Iran and Iraq). Conversely, TrC-NO2 trends in Africa and South America remain mainly low-confidence, except in a few specific regions with high-confidence increases (e.g., southern Africa, Morocco, Chile, and parts of Brazil).
The trends in NO2 have varying effects on the tropospheric ozone column, which is related to the different local chemistry in each region. The concomitant decrease in TrC-O3 and TrC-NO2 trends over some parts of the eastern US and western Europe is consistent with the strict NOx control measures applied over the last 2 decades. STE can also contribute to increased TrC-O3 trends, especially in the midlatitudes. A decreasing trend of TrC-NO2, but an increasing trend of TrC-O3, is present in some other regions such as in the central US, which might be due to local chemistry and STE.
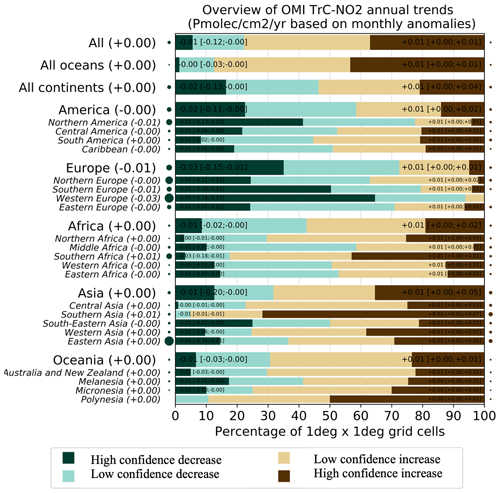
Figure 13Summary of the high-and low-confidence regional trends of the OMI NO2 tropospheric column (TrC-NO2) over 2005–2019 at a 95 % confidence level (see text for details on the calculation of the trends). For each region, the trend on the bars is in the following format: p50 (p5; p95), which represents the 50th (5th and 95th) percentiles of the trends.
Figure 14 shows the time series of regional mean tropospheric NO2 concentrations from three satellite instruments, OMI for 2005–2020, GOME-2 for 2007–2018, and SCIAMACHY for 2005–2012. All the instruments exhibit common large seasonal and year-to-year variations over both industrial regions and biomass burning areas. Slight systematic differences among the instruments can mainly be attributed to the different overpass times. The satellite observations show positive trends over China by 2010, followed by a continued decrease. Over the USA and Europe, all the retrievals show a downward trend over the analysis period. Over the US, the observed TrC-NO2 levels decreased rapidly during 2005–2009 and subsequently show weaker reductions, as discussed by Jiang et al. (2018). A similar slowdown trend is found in Europe. Over India, the OMI observations show positive trends over the 14 years (+1.6 % yr−1). The seasonal and year-to-year variations over Southeast Asia and northern and central Africa are associated with changes in biomass burning activity (Ghude et al., 2009).
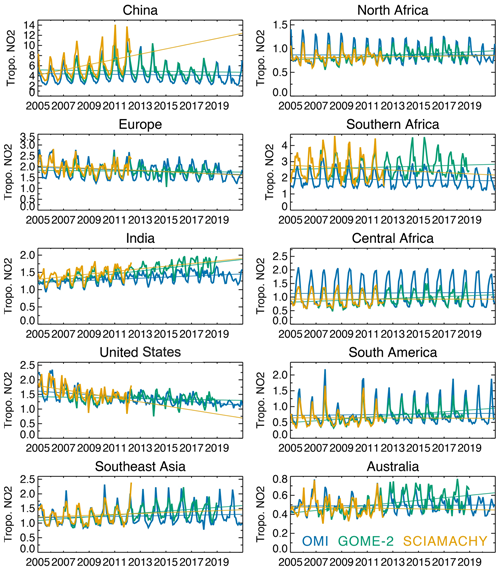
Figure 14Time series of regional monthly mean tropospheric NO2 columns (in 1015 molec. cm−2) averaged over China (110–123° E, 30–40° N), Europe (10° W–30° E, 35–60° N), the US (70–125° W, 28–50° N), India (68–89° E, 8–33° N), South America (50–70° W, 20° S–Equator), northern Africa (20° W–40° E, Equator–20° N), central Africa (10–40° E, Equator–20∘ S), southern Africa (25–34° E, 22–31° S), southeastern Asia (96–105° E, 10–20° N), and Australia (113–155° E, 11–44° S) obtained from OMI (black), GOME-2 (blue), and SCIAMACHY (red).
3.4.5 CO trends
CO trends are calculated based on MOPITT v9 products; see Sect. 2.2.1. Observed CO trends below show a slowing in the trend compared to a previous analysis (Buchholz et al., 2021). In the Northern Hemisphere, CO trends are largely negative over the US and Europe, which is consistent with improvements in combustion efficiency and policies implemented to reduce air pollution since 2004. Except for small sporadic positive trends, no HC trends can be calculated over central Asia (India and China), while there is a strong negative trend in eastern China due to the recent strong focus on air quality improvement, and there is no HC trend in the SH.
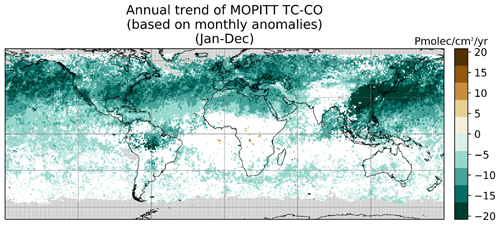
Figure 15Trends in TC-CO from MOPITT V9J data for 2005–2019 (see text for details on the calculation of the trends). Gray areas correspond to areas without enough data, and white areas correspond to regions where the trends remain statistically low-confidence at a 95 % confidence level.
A regional summary of the trends in the global map is shown in Fig. 16. CO trends are predominantly negative everywhere except for some sporadic positive trends over middle Africa. Decreasing TC-CO trends are highest in Europe, followed by Asia and America with about 86 %, 75 %, and 69 % of their cells being negative, respectively. The 50th percentiles of the trends in these cells are −12.01, −10.21, and −10.16 Pmolec. cm−2 yr−1, respectively. Africa shows the lowest decreasing trends as the negative trends in North Africa are being offset by small increasing trends in middle Africa. Overall, about 41 % of the cells in Africa show decreasing trends, and 50 % of the trends in these cells account for −8.71 Pmolec. cm−2 yr−1. Thus, even though the NH accounts for most CO emissions, decreasing trends of TC-CO are evident in these regions.
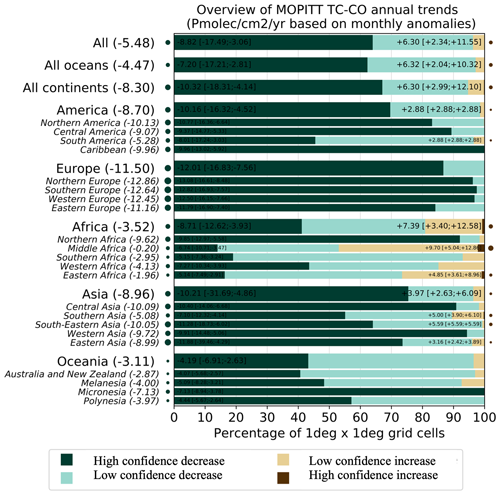
Figure 16Summary of the statistically high- and low-confidence regional trends of MOPITT TC-CO over 2005–2019 at a 95 % confidence level (see text for details on the calculation of the trends). For each region, the trends reported on the left (right) represent the 50th (5th and 95th) percentiles of the trends calculated over the different grid cells showing a high-confidence TC-CO increase or decrease.
Also shown below are the trends in the MOPITT column average volume mixing ratio (VMR) anomalies from 2005 to 2019 (Fig. 17) using QR as well as weighted least squares (WLS) as in Buchholz et al. (2021). The region boundaries are the same as used in Figs. 10 and 11. Results show an HC decreasing trend in the NH ( % annually), a smaller decreasing trend in the midlatitudes ( % annually), and an LC trend in the SH ( % annually). The three anthropogenic regions investigated in the NH all show strong decreases in CO. The larger negative trend over Australia ( % annually) than the average SH suggests that sources from the other two land regions (southern Africa and South America) may be counteracting negative trends in CO for the SH.
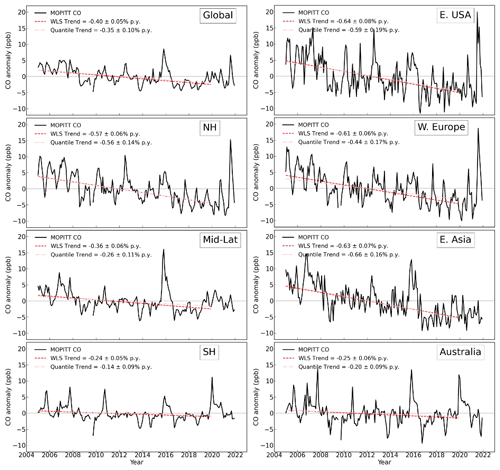
Figure 17MOPITT monthly average CO anomalies in the column average volume mixing ratio (VMR, ppb) for 2005–2021 (black). Updated dataset based on Buchholz et al. (2021). Data are Level 3 monthly average daytime observations using version 9 joint NIR–TIR retrievals (V9J). Regions are defined in Figs. 10 and 11. Trends are calculated based on anomalies for 2005–2019. The weighted least-squares trend (red) is weighted by the monthly regional standard deviation. The quantile regression trend is also shown (pink). Dashed gray lines indicate a zero trend.
We also compare CO trends with Community Earth System Model (CESM) simulations (Fig. S1). While the magnitude of modeled CO tends to be underestimated relative to observations, the anomalies between the model and measurements are comparable, indicating the model reproduces interannual variability well. The negative trends in the NH are also reproduced by CESM, although to a smaller degree than observations, suggesting that the trends in sources or loss processes (such as OH oxidation) are underestimated in the model. These processes will impact the feedback into modeled ozone and the resulting interpretation of driving factors for ozone abundance and variability. Interestingly, CESM correctly represents a negative trend in CO for the NH and East Asia, while GEOS-GMI has a positive CO trend in those regions (Fig. 11), likely due to the well-known misrepresentation of East Asian air quality improvements in emission inventories (Yin et al., 2015; Strode et al., 2016; Zheng et al., 2019). In the SH, CESM does not predict HC trends.
3.4.6 HCHO trends
HCHO, mainly a photochemical product, results from hydrocarbon oxidation. HCHO is itself a source of OH and ozone through its photolysis, producing HO2, which can be recycled back to OH if sufficient NO levels are present.
Unlike higher aldehydes, the OH reaction with HCHO also leads to the formation of a formyl radical (HCO), which ultimately forms HO2 (Reaction R5).
Due to its solubility, the variability of HCHO also depends on the presence of clouds, and wet deposition ultimately represents another important sink for HCHO (Lelieveld and Crutzen, 1991). Overall, HCHO plays a key role in the O3 budget in both polluted and remote regions.
Trends of the OMI HCHO tropospheric columns (hereafter referred to as TrC-HCHO) are computed as described for OMI TrC-NO2. TrC-HCHO trends over 2005–2019 are shown in Fig. 18, with a regional summary in Fig. 19. The first global feature to highlight on the global trend map is the presence of stripes along the OMI orbits. The number of rows affected by the OMI row anomaly has increased over the years (Boersma et al., 2018). The affected rows are filtered out in the HCHO data, but the change in the sampling and the related increase in the noise impact the trend analysis. Along-orbit stripes in the trend analysis should be ignored, but zonal trends are still valid (Fig. 18).
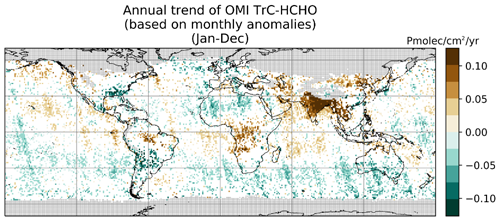
Figure 18Global trends of the OMI HCHO tropospheric column (TrC-HCHO) over 2005–2019 (see text for details on the calculation of the trends). Gray areas correspond to areas without enough data, and white areas correspond to regions where the trends remain statistically low-confidence at a 95 % confidence level.
Despite the fact that TrC-HCHO trends remain LC over a large part of the globe, specific regions do highlight clear trends. The region with the clearest changes is unambiguously southern Asia, where about 65 % of the cells show increasing trends with a median of +0.09 Pmolec. cm−2 yr−1. The other regions with a large portion (25 %–30 % of the cells) of increasing trends include the rest of Asia and central Africa, with median TrC-HCHO trends ranging between +0.05 and +0.08 Pmolec. cm−2 yr−1, as well as some parts of central Brazil (Amazonia). Conversely, some HC decreases in TrC-HCHO are observed in the southeastern US, the southern half of South America, North Africa and western Africa, and southern Australia, although some of them overlap with the aforementioned stripes and thus might not be real.
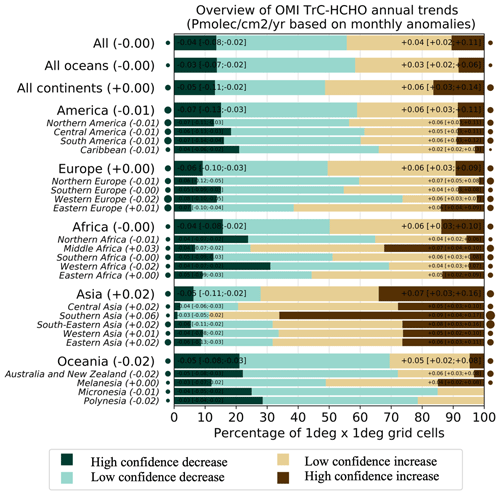
Figure 19Summary of the statistically high- and low-confidence regional trends of the OMI HCHO tropospheric column (TrC-HCHO) over 2005–2019 at a 95% confidence level (see text for details on the calculation of the trends). For each region, the trends reported on the left (right) represent the 50th (5th and 95th) percentiles of the trends calculated over the different grid cells showing an HC TrC-HCHO increase or decrease.
The HCHO trend varies with that of O3 (Sect. 3.4.1), which might be due to several factors, such as their different sensitivity to NOx and hydrocarbons (Luecken et al., 2018) but also possible STE contribution to tropospheric ozone levels, especially in midlatitudes (Williams et al., 2019; Li et al., 2024). For example, while TrC-O3 is increasing in the southeastern US, TrC-NO2, TC-CO, and TrC-HCHO are decreasing, which, in addition to the local chemistry, might indicate an STE signal. TrC-NO2 trends are decreasing over the northern coast of Australia, while those of TrC-O3 and TrC-HCHO are increasing. While the increase in HCHO NO2 might indicate a trend toward NO-limited conditions (see below), the increase in TrC-O3 trends in this region might also indicate increasing trends of STE contribution (Li et al., 2024). However, TrC-HCHO trends are consistent with that of TrC-O3 in other regions, e.g., over the northeastern US and Europe. Similarly, while NO2 trends are slightly increasing over central and southern Australia, trends of TrC-O3 and TrC-HCHO are decreasing, which indicates a trend toward VOC-limited conditions (see below).
3.4.7 HCHO NO2
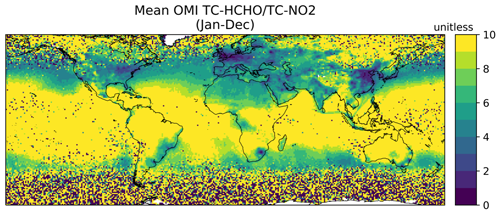
The ratio of TrC-HCHO TrC-NO2 observed from space (e.g., Martin et al., 2004) has been used in a number of studies to give insights on the O3 chemical regime; higher (lower) TrC-HCHO TrC-NO2 ratios indicate NOx-limited (ROx-limited) regimes. Although imperfect (e.g., Souri et al., 2023), this indicator provides some qualitative information on the evolution of the O3 regime over the last years (Nussbaumer et al., 2023). We note that this analysis does not consider variations in the ratios and their trends with respect to season or altitude. The mean TrC-HCHO TrC-NO2 ratios over 2005–2019 are shown in Fig. 20, and the trend results are in Fig. 21, with a regional summary in Fig. 22. The highest ratios are observed in the tropical regions due to strong TrC-HCHO from biogenic sources and fire NMVOC emissions in tropical South America and Africa combined with relatively low TrC-NO2. Conversely, lower TrC-HCHO TrC-NO2 ratios are observed across western Europe, northeastern Asia, and to a lesser extent the northeastern US.
At a global scale, the HC changes in TrC-HCHO TrC-NO2 trends (Figs. 21, 22) mostly go in the direction of a reduction, with about 25 % of the grid cells showing a median trend of −0.52 yr−1. (while only 5 % of the cells show an HC increase of +0.03 yr−1) as shown in Fig. 22. This suggests that these areas are evolving toward VOC-sensitive conditions (which does not necessarily imply that they are already in this regime). This situation is observed over a large part of Oceania (especially Polynesia) and specific parts of Africa, Asia, and South America. The opposite HC trends, toward more NO-sensitive conditions, are mainly observed over Europe and northern America, as well as South Asia. We note that the mean TrC-HCHO TrC-NO2 indicates the mean status of the chemical regime over this period of time (2005–2019). However, the trends of the TrC-HCHO TrC-NO2 ratio show the changing sensitivity of the chemical regime over this period of time. For example, while the ratio in the eastern US indicates VOC-sensitive conditions, the trends of TrC-HCHO TrC-NO2 indicate a direction toward NO-sensitive conditions.
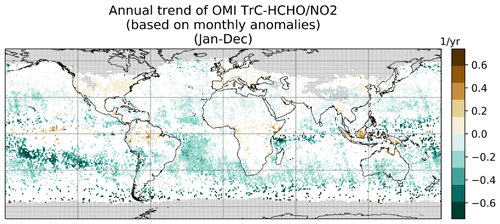
Figure 21Global trends of the OMI HCHO NO2 tropospheric column ratio over 2005–2019 (see text for details on the calculation of the trends). Gray areas correspond to areas without enough data, and white areas correspond to regions where the trends remain statistically low-confidence at a 95 % confidence level.
The trends in the TrC-HCHO TrC-NO2 ratio are mainly driven by specific trends in TrC-HCHO and/or TrC-NO2, depending on the region. The ratio increase in southern and western Europe and Southeast Asia appears to be primarily due to decreasing TrC-NO2, since TrC-HCHO does not change with HC. Over North America, observed TrC-HCHO values decrease but less than TrC-NO2, which thus drives the ratio toward an increase. Conversely, the increase in TrC-HCHO TrC-NO2 in equatorial Africa and Amazonia appears to be mainly driven by increasing TrC-HCHO. The regions with an HC decreasing TrC-HCHO TrC-NO2 ratio include Chile and Australia, due to both decreasing TrC-HCHO and increasing TrC-NO2 (Fig. 22), indicating a trend towards a VOC-limited regime. Note that over the US, Jin et al. (2020) demonstrated the reasonable ability of the OMI-based TrC-HCHO TrC-NO2 trends to capture the transition from ROx-limited to NOx-limited regimes over main US cities and found relatively good consistency between observed changes in the surface O3 and space-based HCHO NO2 increasing trends.
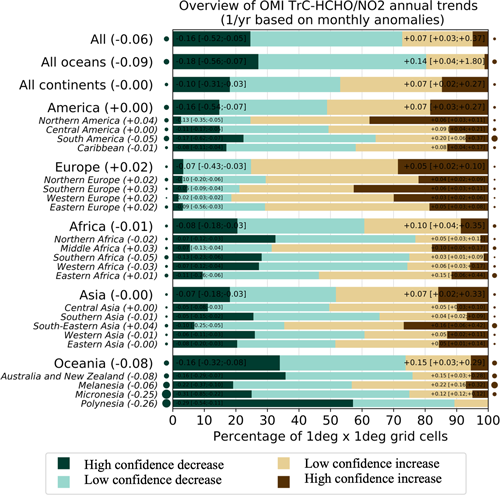
Figure 22Summary of the statistically high- and low-confidence regional trends of the OMI TrC-HCHO TrC-NO2 tropospheric column ratio over 2005–2019 at a 95 % confidence level (see text for details on the calculation of the trends). For each region, the trends reported on the left (right) represent the 50th (5th and 95th) percentiles of the trends calculated over the different grid cells showing a high-confidence TrC-HCHO TrC-NO2 increase or decrease.
3.5 Lightning NOx and its effects on tropospheric NOx and O3
Nitric oxide (NO) is produced in lightning flash channels and quickly comes into equilibrium with NO2. Cloud-scale simulations of thunderstorms indicate that 55 %–75 % of lightning NOx (LNOx) is detrained above 8 km (Pickering et al., 1998) where it enhances upper-tropospheric NOy, OH, and O3 (Labrador et al., 2005; Allen et al., 2010; Liaskos et al., 2015) and contributes to enhanced longwave radiative absorption by O3 (Lacis et al., 1990; Finney et al., 2018). Enhanced OH leads to a decrease in CH4 lifetime and decreased longwave radiative absorption (Fiore et al., 2006; Finney et al., 2018). The lifetime of NOx in the upper troposphere is controlled by the chemical cycling of NOx with reservoir species and is 10–20 d without from deep convection (Prather and Jacob, 1997) but only 2–12 h in the vicinity of convection (Nault et al., 2016, 2017). This chemical recycling provides a source of NOx downwind of thunderstorms, which causes the ozone production efficiency of emitted NOx to be 4–20 times higher in the upper troposphere than at the surface. Thus, LNOx has a disproportionate impact on the tropospheric O3 budget (Pickering et al., 1990; Grewe et al., 2001; Sauvage et al., 2007).
The distribution of lightning is fairly well known over much of the Earth due to remote sensing observations and an increase in the number and capability of ground-based lightning networks. However, the LNOx production efficiency (PE, mol fl−1) is a continued source of uncertainty. Schumann and Huntrieser (2007) reviewed the literature on LNOx production, finding a best estimate of 250 mol fl−1, with uncertainty factors ranging from 0.13 to 2.7. The PE can be estimated from theoretical and laboratory considerations (Price et al., 1997; Koshak et al., 2014), using thunderstorm anvil observations by aircraft (Ridley et al., 2004; Huntrieser et al., 2008, 2011; Pollack et al., 2016; Nault et al., 2017; Allen et al., 2021a), based on satellite data (Bucsela et al., 2010, 2019; Beirle et al., 2010; Pickering et al., 2016; Lapierre et al., 2020; Zhang et al., 2020; Allen et al., 2019, 2021b), or using cloud-resolved (e.g., DeCaria et al., 2000, 2005; Fehr et al., 2004; Ott et al., 2007, 2010; Cummings et al., 2013; Pickering et al., 2024) or global model simulations with chemistry (e.g., Martin, et al., 2007; Murray et al., 2012; Miyazaki et al., 2014; Marais et al., 2018). These various techniques have yielded PE estimates ranging from < 50 to > 1000 mol fl−1, with most estimates in the 100–400 mol fl−1 range. Miyazaki et al. (2014) assimilated OMI NO2, MLS and TES (Tropospheric Emission Spectrometer on NASA/Aura) O3, and MOPITT CO into a chemical transport model to provide comprehensive constraints on the global LNOx source, resulting in an estimate of mean PE of 310 moles per flash. Marais et al. (2018) used cloud-sliced upper-tropospheric NO2 from OMI together with the GEOS-Chem model to estimate a mean LNOx PE of 280 moles per flash. Lightning is the dominant source of NOx in the tropical upper troposphere year-round and in the northern midlatitudes in summer. Lightning is responsible for 10 %–15 % of NOx emissions globally. Assuming 100–400 mol fl−1, the global LNOx production is likely 2–8 Tg N a−1 (Schumann and Huntrieser, 2007; Verma et al., 2021). LNOx impacts air quality and deposition (Kaynak et al., 2008; Allen et al., 2012). On average LNOx adds 1–2 ppbv to surface O3 (Kang et al., 2019), although contributions as large as 18 ppbv have been seen for individual events (Murray, 2016). Allen et al. (2019) found that the addition of LNOx to the Community Multiscale Air Quality (CMAQ) model increased wet deposition of oxidized nitrogen at National Atmospheric Deposition Program (NADP) sites by 43 %, reducing low biases from 33 % to near zero. Kang et al. (2019) found similar improvements for wet deposition and also found that including LNOx resulted in smaller biases with respect to ozonesondes and aircraft profiles taken during the NASA DISCOVER-AQ field campaign (Flynn et al., 2016). Thus, to accurately assess its impacts on air quality, it is critical that LNOx-producing deep convection is accurately simulated.
Only in recent years with the advent of satellite observations of lightning flashes and improved coverage by ground-based lightning networks has there been sufficient data to make estimates of trends in the occurrence of lightning. However, it is unknown whether trends in LNOx production are similar to those of lightning itself. Lightning characteristics such as the ratio of intracloud (IC) flashes to cloud-to-ground (CG) flashes, the multiplicity (i.e., the number of strokes per flash), and the peak current or energy associated with flashes may vary over time. All of these lightning characteristics may have effects on the magnitude of LNOx production. We have insufficient data to take into account these possible effects on LNOx production over large spatial domains or over sufficiently long periods of time.
3.5.1 Global historical trends of lightning
The first attempts at an examination of trends in thunderstorm activity were conducted in terms of thunder days (in Japan by Kitagawa, 1989; in Brazil by Pinto et al., 2013). A more recent global analysis was conducted by Lavigne et al. (2019), who analyzed trends in thunder days (number of days with audible thunder at weather observation stations) over 43 years and in flashes recorded by the Lightning Imaging Sensor (LIS) on the Tropical Rainfall Measuring Mission (TRMM) for 16 years. Thunder days have increased since the 1970s in the Amazon Basin, the Maritime Continent, India, Congo, Central America, and Argentina. Decreases in thunder days were found in China, Australia, and the Sahel region of Africa. Lavigne et al. (2019) do not provide a global trend in thunder days, but an average trend computed over the nine primary lightning regions that they considered, weighted by the mean annual thunder days in each region, yields a near-global estimate of +3.8 % decade−1. How well do thunder days represent the lightning flash rate? Lavigne et al. (2019) found a positive correlation between thunder days and LIS flash rates in China, the Maritime Continent, southern Africa, and Argentina but disagreement on the trend in India and West Africa.
Large-scale (±38° latitude) trends in lightning flashes have been examined in the data collected by the LIS on the TRMM satellite (January 1998–December 2014) and on the International Space Station (February 2017–December 2021). Füllekrug et al. (2022; see Fig. SB2.1b) demonstrate that the annual mean deviations from the 1998–2021 mean are no more than ∼ 5% except for ∼ −10 % in 2020 and ∼ −8 % in 2021. However, no long-term trend is evident from the LIS data. The possibility that these larger negative deviations in 2020 and 2021 are due to COVID-19 lockdowns and general declines in economic activity has been speculated. The link may be provided by changes in aerosol optical depth (AOD) as suggested by Liu et al. (2021), who demonstrated 10 %–20 % flash reductions in March–May 2020 relative to the 2018–2021 mean for those months from the GLD360 ground-based lightning network and World Wide Lightning Location Network (WWLLN). Regional lightning reductions were consistent with AOD reductions noted by Sanap (2021). Larger reductions in lightning were noted over Africa and Europe as well as Asia and the Maritime Continent, with lesser reductions over the Americas.
3.5.2 Regional historical trends of lightning
Widely varying trends in lightning over China have been reported in the literature. To some extent, whether the trend in lightning is upward or downward depends on the particular region studied and on the period of time considered. Yang and Li (2014) were the first to report on lightning trends in China. They used lightning data from the TRMM/LIS sensor and human-observed thunderstorm day occurrence over the period 1990 to 2012 in southeastern China. Thunderstorms and lightning occurrence increased over the period, as did LIS precipitation radar echo tops heights. These increases were accompanied by decreases in visibility, indicating increases in pollution aerosol. Detailed work on lightning trends in China has been performed in relation to aerosols. Shi et al. (2020) correlated flashes from the TRMM/LIS low-resolution monthly time series (2.5° resolution) with AOD from MODIS-Terra V6.1 Level 3 over the period 2001 to 2014. For AOD < 1.0, r=0.64, indicating a likely microphysical effect on the lightning flash rate. For AOD > 1.0, , which could indicate that with a higher aerosol concentration there is a radiation effect stabilizing the atmosphere and/or a decrease in the number of graupel particles in the mixed-phase region of the storms that is important for charging. Flashes were also correlated with surface relative humidity and convective available potential energy (CAPE). As AOD generally increased over much of the early portion of this time period and then decreased, lightning flash rates followed similar trends. Wang et al. (2021) examined a 9-year record (2010–2018) of CG lightning from the China Lightning Detection Network in three polluted urban areas of China (Chengdu, Wuhan, and Jinan). They found decreasing trends (see Wang et al., 2021) in CG lightning and total AOD (from the MERRA-2 reanalysis). Annual mean lightning density in these three regions decreased by 50 %–75 % as annual mean AOD fell from 0.70–0.75 to 0.53 to 0.62.
Qie et al. (2022) analyzed the Optical Transient Detector (OTD)/Lightning Imaging Sensor (LIS) record from 1996 through 2013 and found that lightning increased over the eastern Tibetan Plateau by 0.072±.069 fl km2 yr−1. Over the 18 years, this increase amounted to a total of 1.3 fl km2 yr−1 compared with a climatological value of 7.7 fl km2 yr−1, thereby indicating an HC increase. The ground-based World Wide Lightning Location Network (WWLLN) also showed increased strokes in this region. The increase in lightning frequency in this region was found to be due to an increase in thunderstorm frequency, not increased storm intensity.
Koshak et al. (2015) analyzed National Lightning Detection Network (NLDN) CG flashes over the contiguous United States (CONUS) from 2003 to 2012. The 5-year mean flashes over 2008 to 2012 decreased by 12.8 % from the 5-year mean for 2003 to 2007 (Table 1). The CONUS average wet-bulb temperature also trended downward during this period, which may have led to lesser or weaker storms. However, US Environmental Protection Agency air quality trends show an 18 % decrease in PM2.5 concentrations over CONUS between the two subperiods, which could have also had an influence on the flash rates. A recent effort to update the Koshak et al. (2015) analysis is underway. NLDN flashes have been reprocessed (Kenneth Cummins, personal communication, 2022) from 2015 through 2021 to ensure that the classification of IC and CG flashes is done consistently with data prior to 2015. Trend analysis of NLDN CG flashes from 2003 (a major upgrade of the NLDN hardware) through 2022 (William Koshak, personal communication) shows an HC reduction in CG flashes over CONUS when comparing the mean CG flashes over 2003–2004 with the mean over 2021–2022. Within this period a major decrease (∼ 25 %) in CONUS CG flashes occurred from 2011 to 2012. Flashes in 2013 remained low but recovered by 2014–2015. A major decrease (∼ 27 %) occurred from 2019 to 2020, with a small increase in 2021 (William Koshak, personal communication, 2021). These results have been obtained from ongoing efforts by Dr. William Koshak of the NASA Marshall Space Flight Center and are presently part of a draft paper by lead author Koshak that extends and refines the earlier work in Koshak et al. (2015).
A possible contributing factor to the CONUS decline in CG flashes over 2003 to 2021 is the substantial decrease in aerosol. Surface annual average PM2.5 concentrations averaged over CONUS decreased by 37 % from 2000 to 2021 according to the EPA National Air Quality Trends Report (https://www.epa.gov/air-trends/air-quality-national-summary, last access: 18 October 2024). However, no decrease in CONUS annual average PM2.5 was seen from 2019 to 2020. As mentioned previously, AOD may be a better indicator of the aerosol amount that may become incorporated into thunderstorm clouds. Sanap (2021) showed negative anomalies of AOD of ∼ 0.1 in portions of CONUS in March and April 2020 and 0.1 to 0.2 in May 2020. The major decrease in CONUS CG flashes from 2011 to 2012 has been related to drought conditions during summer 2012 over the south–central and southeastern US (Koshak et al., 2015). The reason for the number of CONUS flashes remaining lower in 2013 is uncertain. Koehler (2020) analyzed 26 years (1993–2018) of NLDN CG lightning data to construct a thunder-day climatology for CONUS. Positive anomalies from the 26-year mean were found from Texas to Colorado during 2003 to 2007, with negative anomalies in this region during 2008 to 2012. These anomalies were consistent with precipitation anomalies associated with ENSO.
Holzworth et al. (2021) analyzed primarily CG lightning data from WWLLN for June, July, and August for the years 2010 through 2020. The ratio of lightning strokes north of 65° N latitude to the total global strokes increased by a factor of 3 over this period. This increase occurred as the surface temperature anomaly in this region increased by 0.3 °C (see Holzworth et al., 2021). These results suggest a substantial increase in upper-tropospheric NOx and subsequent ozone production at high northern latitudes.
3.5.3 Future lightning trends
Parameterizations in global chemistry and climate models have been developed for lightning flash rate. These schemes typically use kinematic, thermodynamic, or microphysical variables from the model as predictors. In some studies such predictors have simply been applied to output from multiple climate models. This is the case with the Romps et al. (2014) work, which showed that when a lightning parameterization scheme using CAPE multiplied by the precipitation rate is applied to 11 climate models an increase in CG lightning by 12±5 % per degree Celsius of climate warming was computed. This work simply used the 12 h resolution time series of the spatial means of these variables over CONUS as input. Changes in IC lightning flashes were not considered. IC flashes typically outnumber CG flashes by a factor of 3 averaged over CONUS. Therefore, the result of this work is unknown with respect to the amount of change in LNOx emission. Romps et al. (2018) updated their analysis using CAPE from 3-hourly North American Regional Reanalysis (NARR) data and hourly precipitation from the NOAA River Forecast Centers, finding that CAPE multiplied by the precipitation rate captures the spatial, seasonal, and diurnal variations of NLDN CG flash rate over land but does not predict the pronounced land–ocean contrast in flash rates. Therefore, these analyses are of limited value in estimating trends of LNOx over broader-scale regions. Romps et al. (2019) tested four lightning proxies in a cloud-resolved 4 km resolution simulation over CONUS with the Weather Research and Forecasting (WRF) model and over the tropical oceans with a radiative convective equilibrium model. The proxies were CAPE multiplied by the precipitation rate, precipitation with vertical velocity > 10 m s−1, vertical ice flux at the 260 K isotherm, and the vertical integral of cloud ice and graupel product. The fractional change in proxy values per degree Celsius of warming over CONUS was +8 % to +16 %. Over the tropical oceans the changes in proxy values per degree ranged from +12 % for CAPE multiplied by the precipitation rate to −1 % for ice flux and −3 % for the cloud ice and graupel product. Therefore, over broad regions of the Earth, there is great uncertainty in future trends in lightning.
Finney et al. (2016, 2018) compared lightning projections for 2100 using vertical ice flux (Finney et al., 2014) and cloud-top height parameterizations for flash rate in the UK Chemistry and Aerosols Model. They obtained a −15 % global change in total flash rate with ice flux under a strong global warming scenario (see Finney et al., 2018), which was composed of a greater decrease in the tropics and small increases in midlatitudes. In terms of LNOx emissions, using the ice flux scheme produced a −0.15 TgN K−1 change over the years from 2000 to 2100, implying less O3 production. With the cloud-top height scheme they obtained a +0.44 TgN K−1 LNOx change, implying increased O3 production. However, the ice flux scheme provided a more realistic representation of global lightning for the present day. Therefore, the negative LNOx emissions change from this scheme may be more realistic. If indeed the ice flux scheme better represents the current distribution of lightning, both the Romps et al. (2018) and Finney et al. (2018) results suggest no significant increase in LNOx emissions in the future climate and possibly a small global decrease. Murray (2018) points out that the ice flux scheme is a closer representation of the underlying charging mechanism, but this scheme needs to be tested in multiple global chemistry and climate models.
3.5.4 Recent findings concerning LNOx PE
Recent satellite-based estimates of LNOx production (Fig. 23) have suggested a possible flash rate dependence of LNOx production per flash (Bucsela et al., 2019; Allen et al., 2019, 2021). Smaller values of LNOx PE in these studies were found to be associated with high flash rates, likely due to smaller flashes in these conditions (Bruning and Thomas, 2015). Allen et al. (2021a) noted positive correlations (Fig. 23) of LNOx PE with flash energy and with flash multiplicity (number of strokes per flash). Laboratory studies by Wang et al. (1998) found a positive correlation between peak current and LNOx production. Koshak et al. (2015) found an 8 % increase in peak current from the 2003–2007 period to the 2008–2012 period that accompanied the 12. 8% decrease in CG flashes. These findings make it difficult to project future LNOx production given only a prediction of future lightning flashes.
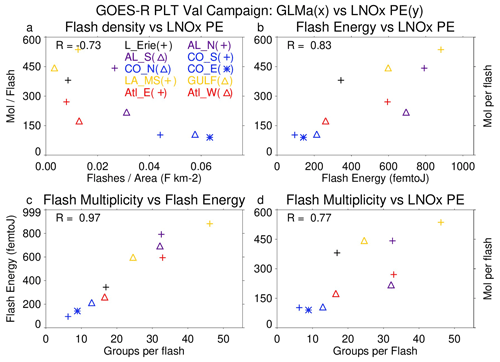
Figure 23Scatterplots showing the GLMa-derived relationship between (a) LNOx PE (moles per flash) and flash density (flashes km−2), (b) LNOx PE and flash energy (fJ), (c) flash energy and flash multiplicity, and (d) LNOx PE and flash multiplicity. Colors are used to separate flight days, while symbols are used to separate systems within each flight day. Correlations are shown in the upper right. LNOx PE derived from an airborne remote sensor, the Geo-CAPE Airborne Simulator (GCAS), during the GOES-R post-launch test field campaign. GLMa indicates Geostationary Lightning Mapper data adjusted for missing data. From Allen et al. (2021a).
3.5.5 Impacts of LNOx on upper-tropospheric O3
The literature concerning the effects of lightning NOx production on upper-tropospheric ozone focuses on photochemical ozone production in storm outflow. The STERAO-A storm simulation by DeCaria et al. (2005) indicated that additional ozone production attributable to lightning NO within the storm cloud during the lifetime of the storm was very small (∼ 2 ppbv). However, simulation of the photochemistry over the 24 h following the storm showed that an additional 10 ppbv of ozone production in the upper troposphere can be attributed to lightning NO production. Convective transport of HOx precursors led to the generation of a HOx plume, which substantially aided the downstream ozone production. Ott et al. (2007) simulated the 21 July 1998 EULINOX thunderstorm. During the storm, the inclusion of lightning NOx in the model combined with convectively transported boundary layer NOx from the Munich, Germany, region resulted in sufficiently large NOx mixing ratios to cause a small titration loss of ozone (on average less than 4 ppbv) at all model levels. Simulations of the chemical environment in the 24 h following the storm show on average a small increase in the net production of ozone at most levels resulting from lightning NOx, maximizing at approximately 5 ppbv per day at 5.5 km. Between 8 and 10.5 km, lightning NOx caused decreased net ozone production. Ren et al. (2008) found that net tropospheric ozone production proceeded at a median rate of ∼ 11 ppbv per day above 9 km in the Intercontinental Transport Experiment (INTEX-A), in which the effects of frequent deep convection over the United States dominated the upper troposphere. Apel et al. (2012) noted that a box model calculation indicated a net ozone increase of ∼ 10 ppbv over a few hours following observed convection with lightning over Canada in the Arctic Research of the Composition of the Troposphere from Aircraft and Satellite (ARCTAS) experiment. Apel et al. (2015) performed box modeling of the chemistry downwind of two DC3 storms in northeast Colorado on 22 June 2012, finding greater ozone production over 2 d (14 ppbv) in the southern storm with more LNOx than in the northern storm (11 ppbv). Brune et al. (2018) studied ozone production in the outflow of the 21 June 2012 DC3 mesoscale convective system. Their box model calculations yielded a 13 ppbv increase in ozone over 5 h, similar to the observed 14 ppbv increase. This rate of increase is larger than others in the literature, perhaps because for a portion of the 5 h the outflow was in cirrus cloud, in which photolysis rates may have been larger than clear-sky values due to multiple scattering. Using a regional chemistry model, Pickering et al. (2024) estimated that net ozone production in the upper-tropospheric outflow of a severe high-flash-rate storm observed over Oklahoma proceeded at a rate of 10–11 ppbv d−1 during the first 24 h of downwind transport. Downwind photochemical production of ozone due to LNOx accounted for much of the recovery of upper-tropospheric ozone following large reductions due to convective transport of lower-ozone boundary layer air.
3.5.6 Summary of LNOx
LNOx is responsible for the largest fraction of upper-tropospheric ozone in the tropics year-round and in the midlatitudes in summer. Effects on longwave radiation due to ozone are most sensitive due to the ozone near the tropopause. Therefore, it is of great importance to have knowledge of the trends in ozone in this region that are due to changes in the frequency and characteristics of lightning flashes. Considerable uncertainty remains concerning trends in global thunder days. No long-term trend in global flash rates has been found. However, regionally important trends have been noted in CONUS and in China, which tend to be correlated with the decreasing atmospheric aerosol content. An increasing trend at Arctic latitudes has been noted, as that region rapidly warms. Future trends in flash rate are also uncertain, with conflicting predictions coming from models with differing flash rate parameterizations. Flash characteristics (e.g., flash rate, flash extent, flash energy or peak current, intracloud fraction) have been found to have important implications for LNOx production per flash. Insufficient knowledge of these characteristics on a global scale makes it highly uncertain to estimate changes in LNOx production, even with knowledge of flash rate trends.

Figure 24Time series of soil HONO and soil NO emissions and their trends (left) as well as the mean global distribution of the soil HONO emission trend for 2005–2019 based on monthly anomalies (right).
3.6 Soil NO and HONO emissions and their impacts on O3
Nitrous acid (HONO) is produced from microbial activity in soils with a similar mechanism and strength as NO (Oswald et al., 2013). This emission source may partially account for the current mismatch between observed and simulated HONO levels in the lower troposphere (Su et al., 2011; Yang et al., 2020). Zhang et al. (2016) estimate a 29 % contribution of soil HONO to the HONO sources in China. This may also substantially contribute to OH production, with important implications for the HOx and O3 budget. To account for this emission source and assess the global potential for atmospheric pollution, soil HONO emissions have been parameterized based on the HONO to NO emission ratio measured in multiple field samples (taken from different regions of the world) and upscaled to the four major land cover types applied to the whole globe. The study estimates global emissions of 7 TgN yr−1 from soil HONO in 2009 (Emmerichs et al., 2023). This is at the lower end of the estimated range of 7.4–12 TgN yr−1 presented by Wu et al. (2022) for 2017, who employ an empirical and statistical model in combination with observations. Due to the importance of NO and HONO soil emissions for the O3 budget, their variability and historical and future trends are described here and linked to O3. Additionally, we discuss a modification of the soil NO emission scheme.
3.6.1 Global modeling of reactive nitrogen emissions from soil
In this section, we present a short overview of the soil NO emission algorithms and estimates for regional and global emissions. The emission of nitrogen oxides (NO) from the soil is the major source of NOx in unpolluted regions, accounting for 15 %–25 % of global emissions (Weng et al., 2020; Vinken et al., 2014). Thereby, NO is produced from the nitrification in soil (microbial activity) and depends nonlinearly on soil properties like pH, carbon and nutrient content, temperature, and soil moisture (Gödde and Conrad, 2000; Oswald et al., 2013). Model algorithms estimate soil NO emissions with a function dependent on biological and meteorological drivers. The common empirical approach by Yienger and Levy (1995), which is used in the current CMIP6 simulations (Szopa et al., 2021), is based on a biome-specific emission factor, soil temperature, precipitation, and the canopy uptake reduction factor. The resulting global estimate is in the range of 3.3–7.7 TgN yr−1, which is only at the lower end of the more recent model and observation-based estimates. The Yienge and Levy (1995) approach generally underestimates soil NO for all land cover types except tundra and rainforest due to the pulsing parameterization, which describes a large NOx release at the wetting of very dry soil and the subsequent rapid decay (Steinkamp et al., 2009). This is accounted for in the more mechanistic approach by Hudman et al. (2012), representing pulsing of the emissions following dry spells and N inputs from chemical fertilizer and atmospheric N deposition. This approach calculates spatial and temporal patterns of soil moisture, temperature, pulsing, fertilizer, manure and atmospheric N deposition, and overall biome, replacing the emission factors by Yienger and Levy (1995), which yields in comparison 34 % more annual global soil emissions of nitrogen oxide (10.7 TgN yr−1). Satellite top-down estimates range from 7.9 TgN yr−1 (Miyazaki et al., 2017: 2005–2014, assimilation of satellite datasets) to 16.7 TgN yr−1 (Vinken et al., 2014; GEOS-Chem and OMI). The emission of soil NO varies regionally, with small sources in Australia (∼ 0.5 TgN yr−1), Europe, Russia and Southern Hemisphere (SH) Africa (0.7 TgN yr−1, 0.8 TgN yr−1), and America (0.9–1 TgN yr−1) and high values in SE Asia and Northern Hemisphere (NH) Africa (2–2.1 TgN yr−1). The emission estimates (here for 0.25° lat. ×0.3125° long.) increase with resolution in some regions like Europe by 38 % (Weng et al., 2020).
Nitrous acid (HONO), a major OH source, is also produced from microbial activity in soils with a similar mechanism and strength as NO (Oswald et al., 2013). This additional emission source may account for the current mismatch between models and measurements representing HONO levels in the lower troposphere (Su et al., 2011; Yang et al., 2020). Soil emissions of HONO play a major role in the daytime HONO concentrations in rural areas (in the lowest layers) where traffic emissions and NO2 heterogeneous reactions occur less than in urban areas (Wu et al., 2022). HONO photolysis is a main OH source and impacts the oxidation capacity of the atmosphere (Zhang et al., 2016, 2019). Therefore, this may also significantly contribute to OH production, with important implications for the HOx and O3 budget.
3.6.2 Variability and trends of soil emissions of NO and HONO in the last 15 years
The magnitude of soil emissions varies strongly with season; the emissions rise from January and July by a factor of 2.5 (Weng et al., 2020). This follows the meteorological variability as, for instance, heavy rainfall over dry grasslands and forests causes a pulse of soil NO emissions coupled with the usage of fertilizer (Hudman et al., 2012). According to the CCMI simulations by Jöckel et al. (2016) (following the future “medium–high” climate scenario, RCP6.0) the soil NO emissions show a positive trend since pre-industrial times, with a steeper increase of up to 0.3 TgN decade−1 from the year 2000. As soil emissions of HONO rely on the same biogeochemical process with similar dependencies on temperature and water content as NO, they also increased from 2000 to 2019.
For soil HONO, however, the trend over 2005–2019 is much smaller and most pronounced in central Africa (Fig. 25). Thereby, the highest positive monthly anomalies occur mainly in the 5 most recent years, which is likely due to the more frequent heat wave occurrence, e.g., in Europe and North America. Overall, Africa relates the most (∼ 30 %) to the global anomaly (Figs. 24–25).
3.6.3 Canopy reduction factor
Most NO soil emission models (Yienger and Levy, 1995; Hudman et al., 2012) rely on an empirical canopy reduction scheme which represents loss processes in plants as the diffusion of NO2 through the stomata and direct deposition to the cuticle. In particular, a large fraction of NOx (and peroxyacyl nitrate) loss during the night may only be explainable by non-stomatal processes (Delaria et al., 2020b). Mechanistically, the canopy reduction can be described by efficient NOx deposition to plants. Thus, Delaria et al. (2020a) point out that models already represent the uptake by vegetation and do not need to use a canopy reduction scheme. The potential change in NO soil emissions is shown by employing the global model ECHAM/MESSy (1° × 1°) with an explicit trace gas uptake at the stomata and cuticle (Emmerichs et al., 2021) for two different seasons in 2005 and 2006. Removing the canopy reduction factor in the model leads to an HC increase in soil NO emissions that is the highest over tropical forests (Fig. 26). The temporal variation follows the vegetational growth, as in the Northern Hemisphere summer 50 % higher emissions occur. These findings are reasonable as Hudman et al. (2012) estimated that the canopy reduction scheme overall lowers the NO emissions by 10 %–15 % in grasslands and up to 85 % over forests (GEOS-Chem at 2° × 2.5° in 2006). Consequently, improper accounting for the canopy reduction factor may imply a strong underestimation of the soil N in densely forested regions and globally by about 31 % (2005–2006).
3.6.4 Projections of soil NO and variability in different climates
Future land use is predicted to change as a consequence of the growing demand for nutrition and biofuels, which implies increasing use of fertilizer. Consequently, NO soil emissions are estimated to rise by ∼ 28 % during the century to 11.5 TgN yr−1 at the end of 2100 (Fowler et al., 2015). Similarly, Liu et al. (2021) estimate an increasing soil NO emission of 8.9 TgN yr−1 by the year 2050 due to intensive nitrification processes.
An increase in leaf area index (LAI) by 10 %, in contrast, would lead to 1 % lower emissions. In addition, several responses are expected from the changing climate. In fact, the 1 °C higher temperature would cause ∼ 5 % increase in emissions (Weng et al., 2020). Following the future (medium–high) climate scenario RCP6.0 (Representative Concentration Pathway; 6 W m−2 radiative forcing until 2500, stabilization after 2150) used for the CMIP5 (Climate Model Intercomparison Project) simulations, Jöckel et al. (2016) suggest an increase of ∼ 15 % in soil NO emissions due to increasing soil temperature (an increase in soil microbes) from the present day (2010) until 2100. However, the most significant implications for large-scale denitrification activity are changing rainfall and the regional hydrological cycles (Fowler et al., 2015). In general, soil NOx will play a more important role in the global budget in the troposphere due to decreasing anthropogenic emissions in the future. Therefore, increasing NOx soil emissions may slow down the decrease in O3 in response to declining anthropogenic emissions (Wu et al., 2022).
3.6.5 Next steps with biogeochemical models implemented in Earth system models
Uncertainties of modeling soil nitrogen emissions are associated with the model input and parameters (Wang and Chen, 2012). Process-based biogeochemical models which also consider the complexity of soil emission processes such as DNDC (denitrification–decomposition) are needed (Li et al., 2011). The capability to represent interactive biogeochemical cycles allows, for instance, for the online calculation of crop nutrition from soil. Also, a model like CLM5 distinguishes between natural and agricultural soils, which more accurately predicts the fertilizer usage (Fung et al., 2022). Resolving the soil and litter biogeochemical dynamics vertically, in addition, leads to more efficient retainment and recycling of N by the ecosystem (Koven et al., 2013). However, these models should be calibrated to multiple sites (Wang et al., 2019), which is limited by the availability of measurement data, especially when it comes to global modeling.
In this article, we investigate temporal and spatial trends and variability of tropospheric ozone in relation to its precursors using satellite products, ozonesonde measurements, and model simulations. Our results show that ozone has positive trends at all latitudes and column depths regardless of the tropopause height within ±100 hPa. The positive trends in the 30–60° N band are due to increasing trends over Canada and Alaska and are slightly offset by the small negative trends over the northeastern US and Europe. The lower trends in the bands 30–60° N and 30–60° S are due to the offsetting impact of negative trends over the eastern US and Europe in the north and Australia and southern Africa in the south, respectively. The decreasing trends of TrC-O3 over parts of the northeastern US and Europe are likely due to the decreasing trend of TrC-NO2, which is due to the effective measures applied over the last 2 decades to mitigate air pollution in these regions. TrC-HCHO trends are decreasing in the eastern US, some parts of northern and western Africa, and western and northern Europe and increasing in South Asia, central Africa, northern Australia, and Brazil. TrC-HCHO trends are consistent with that of TrC-O3 over the northeastern US and Europe. Simulated O3 and its precursors are in good agreement with satellite measurements. Considering different latitude bands, the highest TrC-O3 trends are simulated between 30° S and 60° N, consistent with calculated trends based on satellite observations. The middle troposphere and upper troposphere make the largest contributions to the simulated TrC-O3 trend globally, with large contributions from the upper troposphere driving the simulated TrC-O3 trend at 30° S–30° N and counteracting the negative TrC-O3 trend in the southern midlatitudes.
We have also shed light on NOX lightning and its relation to ozone trends. LNOx is responsible for the largest fraction of upper-tropospheric ozone in the tropics year-round and in the midlatitudes in summer. Ozone radiative forcing is due to the ozone near the tropopause. An increasing trend of LNOx at Arctic latitudes has been noted, as that region rapidly warms. However, future trends in flash rate are uncertain, with conflicting predictions coming from models with differing flash rate parameterizations. Soil HONO emissions had their highest positive monthly anomalies mainly in the 5 most recent years, which is likely due to the more frequent heat wave occurrence, e.g., in Europe and North America. Soil HONO trends are highest in Africa, accounting for ∼ 30 % of the global anomaly. Soil NOx emissions could play an important role in the tropospheric NOx global budget due to decreasing anthropogenic emissions in the future. Therefore, the expected increase in NOx soil emissions may slow down the decrease in O3 in response to declining anthropogenic emissions. Overall, this study presented a comprehensive overview of tropospheric ozone trends in relation to its precursors at different spatial and temporal scales.
No new datasets were generated from this study. All data resources used in this study are listed in Sect. 2.2 (“Data resources”). Satellite datasets are listed in Table 1 with references. Any literature-based data are cited accordingly.
The supplement related to this article is available online at: https://doi.org/10.5194/acp-24-12225-2024-supplement.
YE led the conceptualization, writing, and review of the article. JZ led the OMI ozone satellite product and data analysis. SS led the GEOS-5-GMI data analysis. HP led the sections on HCHO, NO2, and HCHO NO2 data analysis and contributed to the CO analyses. KM led the comparison of different satellite products. KP led the lightning NOx section. HW and RB contributed to the CO analysis. DT and TE led the section on HONO soil emission, and all authors contributed to the writing and review of the article.
At least one of the (co-)authors is a member of the editorial board of Atmospheric Chemistry and Physics. The peer-review process was guided by an independent editor, and the authors also have no other competing interests to declare.
Publisher's note: Copernicus Publications remains neutral with regard to jurisdictional claims made in the text, published maps, institutional affiliations, or any other geographical representation in this paper. While Copernicus Publications makes every effort to include appropriate place names, the final responsibility lies with the authors.
This article is part of the special issue “Tropospheric Ozone Assessment Report Phase II (TOAR-II) Community Special Issue (ACP/AMT/BG/GMD inter-journal SI)”. It is a result of the Tropospheric Ozone Assessment Report, Phase II (TOAR-II, 2020–2024).
This study was partially funded by the NSF AGS (grant no. 1900795) and the USF Creative Scholarship (grant no. 2022). Part of the research was conducted at the Jet Propulsion Laboratory, California Institute of Technology, under a contract with NASA. Hervé Petetin has received funding from the Ministerio de Ciencia e Innovación through the MITIGATE project (grant no. PID2020-113840RA-I00 funded by MCIN/AEI/10.13039/501100011033) and the Ramon y Cajal grant (grant nos. RYC2021-034511-I and MCIN/AEI/10.13039/501100011033, as well as the European Union NextGenerationEU/PRTR). The GEOS-GMI simulation was supported by NASA's Making Earth System Data Records for Use in Research Environments (MEaSURESs) program, and the high-performance computing resources for GEOS-GMI were provided by the NASA Center for Climate Simulation (NCCS). Part of the research was supported by the NSF National Center for Atmospheric Research, which is a major facility sponsored by the US National Science Foundation under cooperative agreement no. 1852977. We acknowledge the support of the National Aeronautics and Space Administration (NASA) Atmospheric Composition Aura Science Team Program (grant no. 19-AURAST19-0044), the Atmospheric Composition Modeling and Analysis Program (grant no. 22-ACMAP22-0013), and the NASA Earth Science US Participating Investigator program (grant no. 22-EUSPI22-0005).
This paper was edited by Anoop Mahajan and reviewed by two anonymous referees.
Allen, D., Pickering, K., Duncan, B., and Damon, M.: Impact of lightning NO emissions on North American photochemistry as determined using the Global Modeling Initiative (GMI) model, J. Geophys. Res., 115, D22301, https://doi.org/10.1029/2010JD014062, 2010.
Allen, D. J., Pickering, K. E., Pinder, R. W., Henderson, B. H., Appel, K. W., and Prados, A.: Impact of lightning-NO on eastern United States photochemistry during the summer of 2006 as determined using the CMAQ model, Atmos. Chem. Phys., 12, 1737–1758, https://doi.org/10.5194/acp-12-1737-2012, 2012.
Allen, D., J., Pickering, K. E., Bucsela, E., Krotkov, N., and Holzworth, R.: Lightning NOx Production in the Tropics as Determined Using OMI NO2 Retrievals and WWLLN Stroke Data, J. Geophys. Res., 124, 13498–13518, https://doi.org/10.1029/2018JD029824, 2019.
Allen, D. J., Pickering, K. E., Lamsal, L., Mach, D., Quick, M. G., Lapierre, J., Janz, S., Koshak, W., Kowalewski, M., and Blakeslee, R.: Observations of Lightning NOx production from GOES-R Post Launch Test Field Campaign Flights, J. Geophys. Res., 126, e2020JD033769, https://doi.org/10.1029/2020JD033769, 2021a.
Allen, D. J., Pickering, K. E., Bucsela, E., van Geffen, J., Lapierre, J., Koshak, W., and Eskes, H.: Observations of Lightning NOx production from Tropospheric Ozone Monitoring Instrument Case Studies over the United States, J. Geophys. Res., 126, e2020JD034174, https://doi.org/10.1029/2020JD034174, 2021b.
Apel, E. C., Olson, J. R., Crawford, J. H., Hornbrook, R. S., Hills, A. J., Cantrell, C. A., Emmons, L. K., Knapp, D. J., Hall, S., Mauldin III, R. L., Weinheimer, A. J., Fried, A., Blake, D. R., Crounse, J. D., Clair, J. M. St., Wennberg, P. O., Diskin, G. S., Fuelberg, H. E., Wisthaler, A., Mikoviny, T., Brune, W., and Riemer, D. D.: Impact of the deep convection of isoprene and other reactive trace species on radicals and ozone in the upper troposphere, Atmos. Chem. Phys., 12, 1135–1150, https://doi.org/10.5194/acp-12-1135-2012, 2012.
Apel, E. C., Hornbrook, R. S., Hills, A. J., Blake, N. J., Barth, M. C., Weinheimer, A., Cantrell, C., Rutledge, S. A., Basarab, B., Crawford, J., Diskin, G., Homeyer, C. R., Campos, T., Flocke, F., Fried, A., Blake, D. R., Brune, W., Pollack, I., Peischl, J., Ryerson, T., Wennberg, P. O., Crounse, J. D., Wisthaler, A., Mikoviny, T., Huey, G., Heikes, B., O'Sullivan, D., and Riemer, D. D. : Upper tropospheric ozone production from lightning NOx-impacted convection: Smoke ingestion case study from the DC3 campaign, J. Geophys. Res.-Atmos., 120, 2505–2523, https://doi.org/10.1002/2014JD022121, 2015.
Archibald, A. T., Neu, J. L., Elshorbany, Y. F., Cooper, O. R., Young, P. J., Akiyoshi, H., Cox, R. A., Coyle, M., Derwent, R. G., Deushi, M., Finco, A., Frost, G. J., Galbally, I. E., Gerosa, G., Granier, C., Griffiths, P. T., Hossaini, R., Hu, L., Jöckel, P., Josse, B., Lin, M. Y., Mertens, M., Morgenstern, O., Naja, M., Naik, V., Oltmans, S., Plummer, D. A., Revell, L. E., Saiz-Lopez, A., Saxena, P., Shin, Y. M., Shahid, I., Shallcross, D., Tilmes, S., Trickl, T., Wallington, T. J., Wang, T., Worden, H. M., and Zeng, G. : Tropospheric Ozone Assessment Report: A critical review of changes in the tropospheric ozone burden and budget from 1850 to 2100, Elem. Sci. Anth., 8, 034, https://doi.org/10.1525/elementa.2020.034, 2020.
ASDC: MOPITT CO gridded monthly means (Near and Thermal Infrared Radiances) V009 [data set], NASA Langley Atmospheric Science Data Center DAAC, https://doi.org/10.5067/TERRA/MOPITT/MOP03JM.009, 2024.
Barret, B., De Mazière, M., and Mahieu, E.: Ground-based FTIR measurements of CO from the Jungfraujoch: characterisation and comparison with in situ surface and MOPITT data, Atmos. Chem. Phys., 3, 2217–2223, https://doi.org/10.5194/acp-3-2217-2003, 2003.
Bauwens, M., Compernolle, S., Stavrakou, T., Müller, J.-F., vanGent, J., Eskes, H., Levelt, P. F., van der A, R., Veefkind, J. P., Vlietinck, J., Yu, H., and Zehner, C.: Impact of Coronavirus Outbreak on NO2 Pollution Assessed Using TROPOMI and OMI Observations. Geophys. Res. Lett., 47, e2020GL087978, 2020.
Beirle, S., Huntrieser, H., and Wagner, T.: Direct satellite observation of lightning-produced NOx, Atmos. Chem. Phys., 10, 10965–10986, https://doi.org/10.5194/acp-10-10965-2010, 2010.
Boersma, K., Eskes, H., Richter, A., De Smedt, I., Lorente, A., Beirle, S., Van Geffen, J., Peters, E., Van Roozendael, M., and Wagner, T.: QA4ECV NO2 tropospheric and stratospheric vertical column data from OMI (Version 1.1) [data set], Royal Netherlands Meteorological Institute (KNMI), https://doi.org/10.21944/qa4ecv-no2-omi-v1.1, 2017a.
Boersma, K., Eskes, H., Richter, A., De Smedt, I., Lorente, A., Beirle, S., Van Geffen, J., Peters, E., Van Roozendael, M., and Wagner, T.: QA4ECV NO2 tropospheric and stratospheric vertical column data from GOME-2 (Version 1.1) [data set], Royal Netherlands Meteorological Institute (KNMI), https://doi.org/10.21944/qa4ecv-no2-gome2a-v1.1, 2017b.
Boersma, K., Eskes, H., Richter, A., De Smedt, I., Lorente, A., Beirle, S., Van Geffen, J., Peters, E., Van Roozendael, M., and Wagner, T.: QA4ECV NO2 tropospheric and stratospheric vertical column data from SCIAMACHY (Version 1.1) [data set], Royal Netherlands Meteorological Institute (KNMI), https://doi.org/10.21944/qa4ecv-no2-scia-v1.1, 2017c.
Boersma, K. F., Eskes, H. J., Richter, A., De Smedt, I., Lorente, A., Beirle, S., van Geffen, J. H. G. M., Zara, M., Peters, E., Van Roozendael, M., Wagner, T., Maasakkers, J. D., van der A, R. J., Nightingale, J., De Rudder, A., Irie, H., Pinardi, G., Lambert, J.-C., and Compernolle, S. C.: Improving algorithms and uncertainty estimates for satellite NO2 retrievals: results from the quality assurance for the essential climate variables (QA4ECV) project, Atmos. Meas. Tech., 11, 6651–6678, https://doi.org/10.5194/amt-11-6651-2018, 2018.
Boucher, O., Randall, D., Artaxo, P., Bretherton, C., Feingold, G., Forster, P., Kerminen, V.-M., Kondo, Y., Liao, H., Lohmann, U., Rasch, P., Satheesh, S. K., Sherwood, S., Stevens, B., and Zhang, X. Y.: Clouds and aerosols. In Climate Change 2013: The Physical Science Basis, Contribution of Working Group I to the Fifth Assessment Report of the Intergovernmental Panel on Climate Change, edited by: Stocker, T. F., Qin, D., Plattner, G.-K., Tignor, M., Allen, S. K., Doschung, J., Nauels, A., Xia, Y., Bex, V., and Midgley, P. M., Cambridge University Press, 571–657 pp., https://doi.org/10.1017/CBO9781107415324.016, 2013.
Brune, W. H., Ren, X., Zhang, L., Mao, J., Miller, D. O., Anderson, B. E., Blake, D. R., Cohen, R. C., Diskin, G. S., Hall, S. R., Hanisco, T. F., Huey, L. G., Nault, B. A., Peischl, J., Pollack, I., Ryerson, T. B., Shingler, T., Sorooshian, A., Ullmann, K., Wisthaler, A., and Wooldridge, P. J.: Atmospheric oxidation in the presence of clouds during the Deep Convective Clouds and Chemistry (DC3) study, Atmos. Chem. Phys., 18, 14493–14510, https://doi.org/10.5194/acp-18-14493-2018, 2018.
Bruning, E. C. and Thomas, R. J.: Lightning channel length and flash energy determined from moments of the flash area distribution, J. Geophys. Res.-Atmos., 120, 8925–8940, https://doi.org/10.1002/2015JD023766, 2015.
Buchholz, R. R., Deeter, M. N., Worden, H. M., Gille, J., Edwards, D. P., Hannigan, J. W., Jones, N. B., Paton-Walsh, C., Griffith, D. W. T., Smale, D., Robinson, J., Strong, K., Conway, S., Sussmann, R., Hase, F., Blumenstock, T., Mahieu, E., and Langerock, B.: Validation of MOPITT carbon monoxide using ground-based Fourier transform infrared spectrometer data from NDACC, Atmos. Meas. Tech., 10, 1927–1956, https://doi.org/10.5194/amt-10-1927-2017, 2017.
Buchholz, R. R., Worden, H. M., Park, M., Francis, G., Deeter, M. N., Edwards, D. P., Emmons, L. K., Gaubert, B., Gille, J., Martinez-Alonso, S., Tang, W., Kumar, R., Drummond, J. R., Clerbaux, C., George, M., Coheur, P.-F., Hurtmans, D., Bowman, K. W., Luo, M., Payne, V. H., Worden, J. R., Chin, M., Levy, R. C., Warner, J., Wei, Z., and Kulawik, S. S.: Air pollution trends measured from Terra: CO and AOD over industrial, fire-prone, and background regions, Remote Sens. Environ., 256, 112275, https://doi.org/10.1016/j.rse.2020.112275, 2021.
Bucsela, E., Pickering, K. E., Allen, D., Holzworth, R., and Krotkov, N.: Midlatitude lightning NOx Production Efficiency Inferred from OMI and WWLLN Data, J. Geophys. Res., 124, 13475–13497, https://doi.org/10.1029/2019JD030561, 2019.
Bucsela, E. J., Pickering, K. E., Huntemann, T. L., Cohen, R. C., Perring, A., Gleason, J. F., Blakeslee, R. J., Albrecht, R. I., Holzworth, R., Cipriani, J. P., Vargas-Navarro, D., Mora-Segura, I., Pacheco-Hernández, A., and Laporte-Molina, S.: Lightning-generated NOx seen by OMI during NASA's TC4 experiment, J. Geophys. Res., 115, D00J10, https://doi.org/10.1029/2009JD013118, 2010.
Canadell, J. G., Monteiro, P. M. S., Costa, M. H., Cotrim da Cunha, L., Cox, P. M., Eliseev, A. V., Henson, S., Ishii, M., Jaccard, S., Koven, C., Lohila, A., Patra, P. K., Piao, S., Rogelj, J., Syampungani, S., Zaehle, S., and Zickfeld, K.: Global Carbon and other Biogeochemical Cycles and Feedbacks. In Climate Change 2021: The Physical Science Basism Contribution of Working Group I to the Sixth Assessment Report of the Intergovernmental Panel on Climate Changem, edited by: Masson-Delmotte, V., Zhai, P., Pirani, A., Connors, S. L., Péan, C., Berger, S., Caud, N., Chen, Y., Goldfarb, L., Gomis, M. I., Huang, M., Leitzell, K., Lonnoy, E., Matthews, J. B. R., Maycock, T. K., Waterfield, T., Yelekçi, O., Yu, R., and Zhou, B., Cambridge University Press, Cambridge, United Kingdom and New York, NY, USA, 673–816 pp., https://doi.org/10.1017/9781009157896.007, 2021.
Cazorla, M. and Herrera, E.: An ozonesonde evaluation of spaceborne observations in the Andean tropics, Sci. Rep., 12, 15942, https://doi.org/10.1038/s41598-022-20303-7, 2022.
Chang, K.-L., Cooper, O. R., Gaudel, A., Petropavlovskikh, I., and Thouret, V.: Statistical regularization for trend detection: an integrated approach for detecting long-term trends from sparse tropospheric ozone profiles, Atmos. Chem. Phys., 20, 9915–9938, https://doi.org/10.5194/acp-20-9915-2020, 2020.
Chang, K.-L., Cooper, O. R., Gaudel, A., Allaart, M., Ancellet, G., Clark, H., Godin-Beekmann, So., Leblanc, T., Van Malderen, R., Nédélec, P., Petropavlovskikh, I., Steinbrecht, W., Stübi, R., Tarasick, D. W., and Torres, C: Impact of the COVID-19 economic downturn on tropospheric ozone trends: An uncertainty weighted data synthesis for quantifying regional anomalies above western North America and Europe, AGU Advances, 3, e2021AV000542, https://doi.org/10.1029/2021AV000542, 2022.
Chang, K.-L., Martin, G., Schultz, G. K., and Selke, N.: Guidance note on best statistical practices for TOAR analyses, Cornell University, https://doi.org/10.48550/arXiv.2304.14236, 2023.
Chang, K.-L., Cooper, O. R., Gaudel, A., Petropavlovskikh, I., Effertz, P., Morris, G., and McDonald, B. C.: Technical note: Challenges of detecting free tropospheric ozone trends in a sparsely sampled environment, EGUsphere [preprint], https://doi.org/10.5194/egusphere-2023-2739, 2024.
Christiansen, A., Mickley, L. J., Liu, J., Oman, L. D., and Hu, L.: Multidecadal increases in global tropospheric ozone derived from ozonesonde and surface site observations: can models reproduce ozone trends?, Atmos. Chem. Phys., 22, 14751–14782, https://doi.org/10.5194/acp-22-14751-2022, 2022.
Cooper, O. R., Schultz, M. G., Schröder, S., Chang, K. L., Gaudel, A., Benítez, G. C., Cuevas, E., Fröhlich, M., Galbally, I. E., Molloy, S., Kubistin, D., Lu, X., McClure-Begley, A., Nédélec, P., O'Brien, J., Oltmans, S. J., Petropavlovskikh, I., Ries, L., Senik, I., Sjöberg, K., Solberg, S., Spain, G. T., Spangl, W., Steinbacher, M., Tarasick, D., Thouret, V., and Xu, X.: Multi-decadal surface ozone trends at globally distributed remote locations, Elementa, 8, 23, https://doi.org/10.1525/elementa.420, 2020.
Cummings, K. A., Huntemann, T. L., Pickering, K. E., Barth, M. C., Skamarock, W. C., Höller, H., Betz, H.-D., Volz-Thomas, A., and Schlager, H.: Cloud-resolving chemistry simulation of a Hector thunderstorm, Atmos. Chem. Phys., 13, 2757–2777, https://doi.org/10.5194/acp-13-2757-2013, 2013.
DeCaria, A., K. Pickering, G. Stenchikov, J. Scala, J. Stith, J. Dye, B. Ridley, and Laroche, P.: A cloud-scale model study of lightning-generated NOx in an individual thunderstorm during STERAO-A, J. Geophys. Res., 105, 11601–11616, 2000.
DeCaria, A. J., Pickering, K. E., Stenchikov, G. L., and Ott E., L.: Lightning-generated NOx and its impact on tropospheric ozone production: A three-dimensional modeling study of a STERAO-A thunderstorm, J. Geophys. Res., 110, D14303, https://doi.org/10.1029/2004JD005556, 2005.
Deeter, M., Francis, G., Gille, J., Mao, D., Martínez-Alonso, S., Worden, H., Ziskin, D., Drummond, J., Commane, R., Diskin, G., and McKain, K.: The MOPITT Version 9 CO product: sampling enhancements and validation, Atmos. Meas. Tech., 15, 2325–2344, https://doi.org/10.5194/amt-15-2325-2022, 2022.
Delaria, E. R. and Cohen, R. C.: A model-based analysis of foliar NOx deposition, Atmos. Chem. Phys., 20, 2123–2141, https://doi.org/10.5194/acp-20-2123-2020, 2020.
Delaria, E. R., Place, B. K., Liu, A. X., and Cohen, R. C.: Laboratory measurements of stomatal NO2 deposition to native California trees and the role of forests in the NOx cycle, Atmos. Chem. Phys., 20, 14023–14041, https://doi.org/10.5194/acp-20-14023-2020, 2020.
De Smedt, I., Theys, N., Yu, H., Danckaert, T., Lerot, C., Compernolle, S., Van Roozendael, M., Richter, A., Hilboll, A., Peters, E., Pedergnana, M., Loyola, D., Beirle, S., Wagner, T., Eskes, H., van Geffen, J., Boersma, K. F., and Veefkind, P.: Algorithm theoretical baseline for formaldehyde retrievals from S5P TROPOMI and from the QA4ECV project, Atmos. Meas. Tech., 11, 2395–2426, https://doi.org/10.5194/amt-11-2395-2018, 2018.
Duncan, B. N. and Logan, J. A.: Model analysis of the factors regulating the trends and variability of carbon monoxide between 1988 and 1997, Atmos. Chem. Phys., 8, 7389–7403, https://doi.org/10.5194/acp-8-7389-2008, 2008.
Duncan, B. N., Strahan, S. E., Yoshida, Y., Steenrod, S. D., and Livesey, N.: Model study of the cross-tropopause transport of biomass burning pollution, Atmos. Chem. Phys., 7, 3713–3736, https://doi.org/10.5194/acp-7-3713-2007, 2007.
Elguindi, N., Granier, C., Stavrakou, T., Darras, S., Bauwens, M., Cao, H., Chen, C., Denier van der Gon, H. A. C., Dubovik, O., Fu, T. M., Henze, D. K., Jiang, Z., Keita, S., Kuenen, J. J. P., Kurokawa, J., Liousse, C., Miyazaki, K., Müller, J. F., Qu, Z., Solmon, F., and Zheng, B.: Intercomparison of Magnitudes and Trends in Anthropogenic Surface Emissions From Bottom-Up Inventories, Top-Down Estimates, and Emission Scenarios, Earths Fut., 8, e2020EF001520, https://doi.org/10.1029/2020EF001520, 2020.
Elshorbany, Y. F., Kurtenbach, R., Wiesen, P., Lissi, E., Rubio, M., Villena, G., Gramsch, E., Rickard, A. R., Pilling, M. J., and Kleffmann, J.: Oxidation capacity of the city air of Santiago, Chile, Atmos. Chem. Phys., 9, 2257–2273, https://doi.org/10.5194/acp-9-2257-2009, 2009.
Elshorbany, Y. F, Barnes, I., Becker, K. H, Kleffmann, J., and Wiesen, P.: Sources and Cycling of Tropospheric Hydroxyl Radicals-An Overview, Z. Phys. Chem., 224, 967–987, https://doi.org/10.1524/zpch.2010.6136, 2010.
Elshorbany, Y. F., Kleffmann, J., Hofzumahaus, A., Kurtenbach, R., Wiesen, P., Dorn,H.-P., Schlosser, E., Brauers, T., Fuchs, H., Rohrer, F., Wahner, A., Kanaya, Y., Yoshino, A., Nishida, S., Kajii, Y., Martinez, M., Rudolf, M., Harder, H., Lelieveld, J., Elste, T., Plass-Dülmer, C., Stange, G., and Berresheim, H.: HOx Budgets during HOxComp: a Case Study of HOx Chemistry under NOx limited Conditions, J. Geoophys. Res., 117, D03307, https://doi.org/10.1029/2011JD017008, 2012.
Elshorbany, Y. F., Crutzen, P. J., Steil, B., Pozzer, A., Tost, H., and Lelieveld, J.: Global and regional impacts of HONO on the chemical composition of clouds and aerosols, Atmos. Chem. Phys., 14, 1167–1184, https://doi.org/10.5194/acp-14-1167-2014, 2014.
Elshorbany, Y. F., Kapper, H. C., Ziemke, J. R., and Parr, A. S.: The Status of Air Quality in the United States During the COVID-19 Pandemic: A Remote Sensing Perspective, Remote Sens., 13, 369, https://doi.org/10.3390/rs13030369, 2021.
Emmerichs, T., Franco, B., Wespes, C., Kumar, V., Pozzer, A., Rosanka, S., and Taraborrelli, D.: The influence of weather-driven processes on tropospheric ozone, Atmos. Chem. Phys. Discuss. [preprint], https://doi.org/10.5194/acp-2021-584, 2021.
Emmerichs, T., Lu, Y.-S., and Taraborrelli, D.: The influence of plant water stress on vegetation–atmosphere exchanges: implications for ozone modelling, Biogeosciences, 21, 3251–3269, https://doi.org/10.5194/bg-21-3251-2024, 2024.
Fadnavis, S., Sagalgile, A., Sonbawne, S., Vogel, B., Peter, T., Wienhold, F. G., Dirksen, R., Oelsner, P., Naja, M., and Müller, R.: Comparison of ozonesonde measurements in the upper troposphere and lower Stratosphere in Northern India with reanalysis and chemistry-climate-model data, Sci. Rep., 13, 7133, https://doi.org/10.1038/s41598-023-34330-5, 2023.
Fehr, T., Höller, H., and Huntrieser, H.: Model study on production and transport of lightning-produced NOx in a EULINOX supercell storm, J. Geophys. Res., 109, D09102, https://doi.org/10.1029/2003JD003935, 2004.
Finlayson-Pitts, B. J. and Pitts, Jr., J. N.: Chemistry of the Upper and Lower Atmosphere, Academic Press, 2000.
Finney, D. L., Doherty, R. M., Wild, O., Huntrieser, H., Pumphrey, H. C., and Blyth, A. M.: Using cloud ice flux to parametrise large-scale lightning, Atmos. Chem. Phys., 14, 12665–12682, https://doi.org/10.5194/acp-14-12665-2014, 2014.
Finney, D. L., Doherty, R. M., Wild, O., Young, P. J., and Butler, A.: Response of lightning NOx emissions and ozone production to climate change: Insights from the Atmospheric Chemistry and Climate Model Intercomparison Project, Geophys. Res. Lett., 43, 5492–5500, https://doi.org/10.1002/2016GL068825, 2016.
Finney, D. L., Doherty, R. M., Wild, O., Stevenson, D. S., MacKenzie, I. A., and M. Blyth, A.: A projected decrease in lightning under climate change, Nat. Clim. Change, 8, 210–213, 2018.
Fiore, A. M., Jacob, D. J., Field, B. D., Streets, D. G., Fernandes, S. D., and Jang, C.: Linking air pollution and climate change: The case for controlling methane, Geophys. Res. Lett., 29, 1919, https://doi.org/10.1029/2002GL015601, 2002.
Fiore, A. M., Horowitz, L. W., Dlugokencky, E. J., and West, J.: Impact of meteorology and emissions on methane trends, 1990–2004, Geophys. Res. Lett., 33, L12809, https://doi.org/10.1029/2006GL026199, 2006.
Fisher, B. L., Lamsal, L. N., Fasnacht, Z., Oman, L. D., Joiner, J., Krotkov, N. A., Choi, S., Qin, W., and Yang, E. S.: Revised estimates of NO2 reductions during the COVID-19 lockdowns using updated TROPOMI NO2 retrievals and model simulations, Atmos. Environ., 326, 120459, https://doi.org/10.1016/j.atmosenv.2024.120459, 2024.
Fleming, Z. L., Doherty, R. M., von Schneidemesser, E., Malley, C. S., Cooper, O. R., Pinto, J. P., Colette, A., Xu, X., Simpson, D., Schultz, M. G., Lefohn, A. S., Hamad, S., Moolla, R., Solberg, S., and Feng, Z.: Tropospheric Ozone Assessment Report: Present-day ozone distribution and trends relevant to human health, Elem. Sci. Anth., 6, 12, https://doi.org/10.1525/elementa.73, 2018.
Flynn, C. M., Pickering, K. E., Crawford, J. H., Weinheimer, A., Thornhill, K. L., Loughner, C., and Lee, P.: Variability of O3 and NO2 profile shapes during DISCOVER-AQ: Implications for satellite observations and comparisons to model-simulated profiles, Atmos. Environ., 147, 133–156, 2016.
Forster, P., Storelvmo, T., Armour, K., Collins, W., Dufresne, J.-L., Frame, D., Lunt, D. J., Mauritsen, T., Palmer, M. D., Watanabe, M., Wild, M., and Zhang, H.: The Earth's Energy Budget, Climate Feedbacks, and Climate Sensitivity. In Climate Change 2021: The Physical Science Basis. Contribution of Working Group I to the Sixth Assessment Report of the Intergovernmental Panel on Climate Change, edited by: Masson-Delmotte, V., Zhai, P., Pirani, A., Connors, S. L., Péan, C., Berger, S., Caud, N., Chen, Y., Goldfarb, L., Gomis, M. I., Huang, M., Leitzell, K., Lonnoy, E., Matthews, J. B. R., Maycock, T. K., Waterfield, T., Yelekçi, O., Yu, R., and Zhou, B., Cambridge University Press, 923 Cambridge, United Kingdom and New York, NY, USA, 923–1054 pp., https://doi.org/10.1017/9781009157896.009, 2021.
Fortems-Cheiney, A., Chevallier, F., Pison, I., Bousquet, P., Szopa, S., Deeter, M. N., and Clerbaux, C.: Ten years of CO emissions as seen from Measurements of Pollution in the Troposphere (MOPITT), J. Geophys. Res., 116, D05304, https://doi.org/10.1029/2010JD014416, 2011.
Fullekrug, M., Williams, E., Price, C., Goodman, S., Holzworth, R., Virts, K., and Buechler, D.: Lightning, in State of the Climate: 2021, B. Am. Meteor. Soc., 108, S79–S81, https://doi.org/10.1175/BAMS-D-22-0092.1, 2022
Fung, K. M., Val Martin, M., and Tai, A. P. K.: Modeling the interinfluence of fertilizer-induced NH3 emission, nitrogen deposition, and aerosol radiative effects using modified CESM2, Biogeosciences, 19, 1635–1655, https://doi.org/10.5194/bg-19-1635-2022, 2022.
Gaubert, B., Emmons, L. K., Raeder, K., Tilmes, S., Miyazaki, K., Arellano Jr., A. F., Elguindi, N., Granier, C., Tang, W., Barré, J., Worden, H. M., Buchholz, R. R., Edwards, D. P., Franke, P., Anderson, J. L., Saunois, M., Schroeder, J., Woo, J.-H., Simpson, I. J., Blake, D. R., Meinardi, S., Wennberg, P. O., Crounse, J., Teng, A., Kim, M., Dickerson, R. R., He, H., Ren, X., Pusede, S. E., and Diskin, G. S.: Correcting model biases of CO in East Asia: impact on oxidant distributions during KORUS-AQ, Atmos. Chem. Phys., 20, 14617–14647, https://doi.org/10.5194/acp-20-14617-2020, 2020.
Gelaro, R., McCarty, W., Suárez, M. J., Todling, R., Molod, A., Takacs, L., Randles, C. A., Darmenov, A., Bosilovich, M. G., Reichle, R., Wargan, K., Coy, L., Cullather, R., Draper, C., Akella, S., Buchard, V., Conaty, A., da Silva, A. M., Gu, W., Kim, G., Koster, R., Lucchesi, R., Merkova, D., Nielsen, J. E., Partyka, G., Pawson, S., Putman, W., Rienecker, M., Schubert, S. D., Sienkiewicz, M., and Zhao, B.: The modern-era retrospective analysis for research and applications, version 2 (MERRA-2), J. Climate, 30.14, 5419–5454, https://doi.org/10.1175/JCLI-D-16-0758.1, 2017.
Ghude, S. D., Van der A, R. J., Beig, G., Fadnavis, S., and Polade, S. D.: Satellite derived trends in NO2 over the major global hotspot regions during the past decade and their inter-comparison, Environ. Pollut., 157, 1873–1878, https://doi.org/10.1016/j.envpol.2009.01.013, 2009.
Glotfelty, T., Zhang, Y., Karamchandani, P., and Streets, D. G.: Will the role of intercontinental transport change in a changing climate?, Atmos. Chem. Phys., 14, 9379–9402, https://doi.org/10.5194/acp-14-9379-2014, 2014.
Gödde, M. and Conrad, R.: Influence of soil properties on the turnover of nitric oxide and nitrous oxide by nitrification and denitrification at constant temperature and moisture, Biol. Fertil. Soils., 32, 120–128, https://doi.org/10.1007/s003740000247, 2000.
Granier, C., Bessagnet, B., Bond, T., D'Angiola, A., van der Gon, H. D., Frost, G. J., Heil, A., Kaiser, J. W., and Kinne, S., Klimont, Z., Kloster, S., Lamarque, J.-F., Liousse, C., Masui, T., Meleux, F., Mieville, A., Ohara, T., Raut, J.-C., Riahi, K., Schultz, M. G., Smith, S. J., Thompson, A., van Aardenne, J., van der Werf, G. R., and van Vuuren, D. P.: Evolution of anthropogenic and biomass burning emissions of air pollutants at global and regional scales during the 1980–2010 period, Clim. Change, 109, 163–190, 2011.
Grewe, V., Brunner, D., Dameris, M., Grenfell, J. L., Hein, R., Shindell, D., and Staehelin, J.: Origin and variability of upper tropospheric nitrogen oxides and ozone at northern mid-latitudes, Atmos. Environ., 35, 3421–3433, 2001.
Griffiths, P. T., Murray, L. T., Zeng, G., Shin, Y. M., Abraham, N. L., Archibald, A. T., Deushi, M., Emmons, L. K., Galbally, I. E., Hassler, B., Horowitz, L. W., Keeble, J., Liu, J., Moeini, O., Naik, V., O'Connor, F. M., Oshima, N., Tarasick, D., Tilmes, S., Turnock, S. T., Wild, O., Young, P. J., and Zanis, P.: Tropospheric ozone in CMIP6 simulations, Atmos. Chem. Phys., 21, 4187–4218, https://doi.org/10.5194/acp-21-4187-2021, 2021.
Gulev, S. K., Thorne, P. W., Ahn, J., Dentener, F. J., Domingues, C. M., Gerland, S., Gong, D., Kaufman, D. S., Nnamchi, H. C., Quaas, J., Rivera, J. A., Sathyendranath, S., Smith, S. L., Trewin, B., von Schuckmann, K., and Vose, R. S.: Changing State of the Climate System, in: Climate Change 2021: The Physical Science Basis. Contribution of Working Group I to the Sixth Assessment Report of the Intergovernmental Panel on Climate Change, edited by: Masson-Delmotte, V., Zhai, P., Pirani, A., Connors, S. L., Péan, C., Berger, S., Caud, N., Chen, Y., Goldfarb, L., Gomis, M. I., Huang, M., Leitzell, K., Lonnoy, E., J. Matthews, B. R., Maycock, T. K., Waterfield, T., Yelekçi, O., Yu, R., and Zhou, B., Cambridge University Press, Cambridge, United Kingdom and New York, NY, USA, 287–422 pp., https://doi.org/10.1017/9781009157896.004, 2021.
Hoffmann, L. and Spang, R.: An assessment of tropopause characteristics of the ERA5 and ERA-Interim meteorological reanalyses, Atmos. Chem. Phys., 22, 4019–4046, https://doi.org/10.5194/acp-22-4019-2022, 2022.
Holzworth, R. H., Brundell, J. B., McCarthy, M. P., Jacobson, A. R., Rodger, C. J., and Anderson, T. S.: Lightning in the Arctic, Geophys. Res. Lett., 48, e2020GL091366, https://doi.org/10.1029/2020GL091366, 2021.
Hov, Ö., Hesstvedt, E.and Isaksen, I.: Long-range transport of tropospheric ozone, Nature, 273, 341–344, https://doi.org/10.1038/273341a0, 1978.
Hubert, D., Heue, K.-P., Lambert, J.-C., Verhoelst, T., Allaart, M., Compernolle, S., Cullis, P. D., Dehn, A., Félix, C., Johnson, B. J., Keppens, A., Kollonige, D. E., Lerot, C., Loyola, D., Maata, M., Mitro, S., Mohamad, M., Piters, A., Romahn, F., Selkirk, H. B., da Silva, F. R., Stauffer, R. M., Thompson, A. M., Veefkind, J. P., Vömel, H., Witte, J. C., and Zehner, C.: TROPOMI tropospheric ozone column data: geophysical assessment and comparison to ozonesondes, GOME-2B and OMI, Atmos. Meas. Tech., 14, 7405–7433, https://doi.org/10.5194/amt-14-7405-2021, 2021.
Hudman, R. C., Moore, N. E., Mebust, A. K., Martin, R. V., Russell, A. R., Valin, L. C., and Cohen, R. C.: Steps towards a mechanistic model of global soil nitric oxide emissions: implementation and space based-constraints, Atmos. Chem. Phys., 12, 7779–7795, https://doi.org/10.5194/acp-12-7779-2012, 2012.
Huntrieser, H., Schumann, U., Schlager, H., Höller, H., Giez, A., Betz, H.-D., Brunner, D., Forster, C., Pinto Jr., O., and Calheiros, R.: Lightning activity in Brazilian thunderstorms during TROCCINOX: implications for NOx production, Atmos. Chem. Phys., 8, 921–953, https://doi.org/10.5194/acp-8-921-2008, 2008.
Huntrieser, H., Schlager, H., Lichtenstern, M., Stock, P., Hamburger, T., Höller, H., Schmidt, K., Betz, H.-D., Ulanovsky, A., and Ravegnani, F.: Mesoscale convective systems observed during AMMA and their impact on the NOx and O3 budget over West Africa, Atmos. Chem. Phys., 11, 2503–2536, https://doi.org/10.5194/acp-11-2503-2011, 2011.
Ichoku, C. and Ellison, L.: Global top-down smoke-aerosol emissions estimation using satellite fire radiative power measurements, Atmos. Chem. Phys., 14, 6643–6667, https://doi.org/10.5194/acp-14-6643-2014, 2014.
Isaksen, I. S. A., Berntsen, T. K., Dalsøren, S. B., Eleftheratos, K., Orsolini, Y., Rognerud, B., Stordal, F., Søvde, O. A., Zerefos, C., and Holmes, C. D.: Atmospheric Ozone and Methane in a Changing Climate, Atmosphere, 5, 518–535, https://doi.org/10.3390/atmos5030518, 2014.
Itahashi, S., Hayami, H., and Uno, I.: Comprehensive study of emission source contributions for tropospheric ozone formation over East Asia, J. Geophys. Res.-Atmos., 120, 331–358, https://doi.org/10.1002/2014JD022117, 2015.
Itahashi, S., Mathur, R., Hogrefe, C., Napelenok, S. L., and Zhang, Y.: Modeling stratospheric intrusion and trans-Pacific transport on tropospheric ozone using hemispheric CMAQ during April 2010 – Part 2: Examination of emission impacts based on the higher-order decoupled direct method, Atmos. Chem. Phys., 20, 3397–3413, https://doi.org/10.5194/acp-20-3397-2020, 2020.
Janssens-Maenhout, G., Pagliari, V., Guizzardi, D., and Muntean, M.: Global emission inventories in the emission database for global atmospheric research (EDGAR)–Manual (I). Gridding: EDGAR emissions distribution on global gridmaps, Publications Office of the European Union, Luxembourg, 775, https://doi.org/10.2788/81454, 2013.
Jiang, Z., McDonald, B. C., Worden, H., Worden, J. R., Miyazaki, K., Qu, Z., Henze, D. K., Jones, D. B. A., Arellano, A. F., Fischer, E. V., Zhu, L., and Boersma, F.: Unexpected slowdown of US pollutant emission reduction in the past decade, P. Natl. Acad. Sci. USA, 115, 5099–5104, https://doi.org/10.1073/pnas.1801191115, 2018.
Jöckel, P., Tost, H., Pozzer, A., Kunze, M., Kirner, O., Brenninkmeijer, C. A. M., Brinkop, S., Cai, D. S., Dyroff, C., Eckstein, J., Frank, F., Garny, H., Gottschaldt, K.-D., Graf, P., Grewe, V., Kerkweg, A., Kern, B., Matthes, S., Mertens, M., Meul, S., Neumaier, M., Nützel, M., Oberländer-Hayn, S., Ruhnke, R., Runde, T., Sander, R., Scharffe, D., and Zahn, A.: Earth System Chemistry integrated Modelling (ESCiMo) with the Modular Earth Submodel System (MESSy) version 2.51, Geosci. Model Dev., 9, 1153–1200, https://doi.org/10.5194/gmd-9-1153-2016, 2016.
Jin, X., Fiore, A., Boersma, K. F., Smedt, I. D., and Valin, L.: Inferring Changes in Summertime Surface Ozone–NOx –VOC Chemistry over U.S. Urban Areas from Two Decades of Satellite and Ground-Based Observations, Environ. Sci. Technol., 54, 6518–6529, https://doi.org/10.1021/acs.est.9b07785, 2020.
Kang, D., Foley, K. M., Mathur, R., Roselle, S. J., Pickering, K. E., and Allen, D. J.: Simulating lightning NO production in CMAQv5.2: performance evaluations, Geosci. Model Dev., 12, 4409–4424, https://doi.org/10.5194/gmd-12-4409-2019, 2019.
Kaynak, B., Hu, Y., Martin, R. V., Russell, A. G., Choi, Y., and Wang, Y.: The effect of lightning NOx production on surface ozone in the continental United States, Atmos. Chem. Phys., 8, 5151–5159, https://doi.org/10.5194/acp-8-5151-2008, 2008.
Kharol, S. K., Martin, R. V., Philip, S., Boys, B., Lamsal, L. N., Jerrett, M., Brauer, M., Crouse, D. L., Mclinden, C., and Burnett, R. T.: Assessment of the magnitude and recent trends in satellite-derived ground-level nitrogen dioxide over North America, Atmos. Environ., 118, 236–245, 2015.
Kitagawa, N.: Long-term variations in thunder-day frequencies in Japan, J. Geophys. Res., 94, 13183–13189, https://doi.org/10.1029/JD094iD11p13183, 1989.
Koehler, T. L.: Cloud-to-Ground Lightning Flash Density and Thunderstorm Day Distributions over the Contiguous United States Derived from NLDN Measurements: 1993–2018, Mon. Weather Rev., 148, 313–332, https://doi.org/10.1175/MWR-D-19-0211.1, 2020
Kopacz, M., Jacob, D. J., Fisher, J. A., Logan, J. A., Zhang, L., Megretskaia, I. A., Yantosca, R. M., Singh, K., Henze, D. K., Burrows, J. P., Buchwitz, M., Khlystova, I., McMillan, W. W., Gille, J. C., Edwards, D. P., Eldering, A., Thouret, V., and Nedelec, P.: Global estimates of CO sources with high resolution by adjoint inversion of multiple satellite datasets (MOPITT, AIRS, SCIAMACHY, TES), Atmos. Chem. Phys., 10, 855–876, https://doi.org/10.5194/acp-10-855-2010, 2010.
Koshak, W., Peterson, H., Biazar, A., Khan, M., and Wang, L.: The NASA Lightning Nitrogen Oxides Model (LNOM): application to air quality modeling, Atmos. Res., 135, 363–369, 2014.
Koshak, W. J., Cummins, K. L., Buechler, D. E., Vant-Hull, B., Blakeslee, R. J., Williams, E. R., and Peterson, H. S.: Variability of CONUS lightning in 2003–12 and associated impacts, J. Appl. Meteorol. Climatol., 54, 15–41, https://doi.org/10.1175/JAMC-D-14-0072.1, 2015.
Koven, C. D., Riley, W. J., Subin, Z. M., Tang, J. Y., Torn, M. S., Collins, W. D., Bonan, G. B., Lawrence, D. M., and Swenson, S. C.: The effect of vertically resolved soil biogeochemistry and alternate soil C and N models on C dynamics of CLM4, Biogeosciences, 10, 7109–7131, https://doi.org/10.5194/bg-10-7109-2013, 2013.
Krizan, P. and Lastovicka, J.: Trends in positive and negative ozone laminae in the Northern Hemisphere, J. Geophys. Res.-Atmos., 110, D10, https://doi.org/10.1029/2004JD005477, 2005.
Labow, G. J., Ziemke, J. R., McPeters, R. D., Haffner, D. P., and Bhartia, P. K.: A total ozone-dependent ozone profile climatology based on ozonesondes and Aura MLS data, J. Geophys. Res.-Atmos., 120, 2537–2545, https://doi.org/10.1002/2014JD022634, 2015.
Labrador, L. J., von Kuhlmann, R., and Lawrence, M. G.: The effects of lightning-produced NOx and its vertical distribution on atmospheric chemistry: sensitivity simulations with MATCH-MPIC, Atmos. Chem. Phys., 5, 1815–1834, https://doi.org/10.5194/acp-5-1815-2005, 2005.
Lacis, A. A., Wuebbles, D. J., and Logan, J. A.: Radiative forcing of climate by changes in the vertical distribution of ozone, J. Geophys. Res., 95, 9971–9982, 1990.
Lamsal, L. N., Martin, R. V., van Donkelaar, A., Steinbacher, M., Celarier, E. A., Bucsela, E., Dunlea, E. J., and Pinto, J. P.: Ground-level nitrogen dioxide concentrations inferred from the satellite-borne Ozone Monitoring Instrument, J. Geophys. Res.-Atmos., 113, 1–15, https://doi.org/10.1029/2007JD009235, 2008.
Lamsal, L. N, Duncan, B. N., Yoshida, Y., Krotkov, N. A., Pickering, K. E., Streets, D. G., and Zifeng Lu, Z.: U.S. NO2 trends (2005–2013): EPA Air Quality System (AQS) data versus improved observations from the Ozone Monitoring Instrument (OMI), Atmos. Environ., 110, 130–143, https://doi.org/10.1016/j.atmosenv.2015.03.055, 2015.
Lapierre, J. L., Laughner, J. L., Geddes, J. A., Koshak, W. J., Cohen, R. C., and Pusede, S. E.: Observing U.S. regional variability in lightning NO2 production rates, J. Geophys. Res., 125, e2019JD031362, https://doi.org/10.1029/2019JD031362, 2020.
Lavigne, T., C. Liu, and Liu, N.: How does the trend in thunder days relate to the variation of lightning flash density? J. Geophys. Res.-Atmos., 124, 4955–4974, https://doi.org/10.1029/2018JD029920, 2019.
Lefohn, A. S., Malley, C. S., Smith, L., Wells, B., Hazucha, M., Simon, H., Naik, V., Mills, G., Schultz, M. G., Paoletti, E., De Marco, A., Xu, X., Zhang, L., Wang, T., Neufeld, H. S., Musselman, R. C., Tarasick, D., Brauer, M., Feng, Z., Tang, H., Kobayashi, K., Sicard, P., Solberg, S., and Gerosa, G.: Tropospheric ozone assessment report: Global ozone metrics for climate change, human health, and crop/ecosystem research, Elem. Sci. Anth., 6, 28, https://doi.org/10.1525/elementa.279, 2018.
Lelieveld, J. and Crutzen, P. J.: The role of clouds in tropospheric photochemistry, J. Atmos. Chem., 12, 229–267, https://doi.org/10.1007/bf00048075, 1991.
Hu, L., Jianjun, Q., Ligang, W., and Li, Y.,: Advance in a terrestrial biogeochemical model – DNDC model, Acta Ecol. Sin., 31, 2, https://doi.org/10.1016/j.chnaes.2010.11.006, 2011.
Li, Y., Xia, Y., Xie, F., and Yan, Y.: Influence of stratosphere-troposphere exchange on long-term trends of surface ozone in CMIP6, Atmos. Res., 297, 107086, https://doi.org/10.1016/j.atmosres.2023.107086, 2024.
Liaskos, C. E., Allen, D. J., and Pickering, K. E.: Sensitivity of tropical tropospheric composition to lightning NOx production as determined by replay simulations with GEOS-5, J. Geophys. Res.-Atmos., 120, 8512–8534, https://doi.org/10.1002/2014JD022987, 2015.
Liu, J., Strode, S. A., Liang, Q., Oman, L. D., Colarco, P. R., Fleming, E. L., Manyin, M. E., Douglass, A. R., Ziemke, J. R., Lamsal, L. N., and Li, C.: Change in tropospheric ozone in the recent decades and its contribution to global total ozone, J. Geophys. Res.-Atmos., 127, e2022JD037170, https://doi.org/10.1029/2022JD037170, 2022.
Liu, X., Tai, A. P. K., and Fung, K. M.: Responses of surface ozone to future agricultural ammonia emissions and subsequent nitrogen deposition through terrestrial ecosystem changes, Atmos. Chem. Phys., 21, 17743–17758, https://doi.org/10.5194/acp-21-17743-2021, 2021.
Luecken, D. J., Napelenok, S. L., Strum, M., Scheffe, R., and Phillips, S.: Sensitivity of ambient atmospheric formaldehyde and ozone to precursor species and source types across the united states, Environ. Sci. Technol., 52, 4668–4675, https://doi.org/10.1021/acs.est.7b05509, 2018
Marais, E. A., Jacob, D. J., Kurosu, T. P., Chance, K., Murphy, J. G., Reeves, C., Mills, G., Casadio, S., Millet, D. B., Barkley, M. P., Paulot, F., and Mao, J.: Isoprene emissions in Africa inferred from OMI observations of formaldehyde columns, Atmos. Chem. Phys., 12, 6219–6235, https://doi.org/10.5194/acp-12-6219-2012, 2012.
Marais, E. A., Jacob, D. J., Choi, S., Joiner, J., Belmonte-Rivas, M., Cohen, R. C., Beirle, S., Murray, L. T., Schiferl, L. D., Shah, V., and Jaeglé, L.: Nitrogen oxides in the global upper troposphere: interpreting cloud-sliced NO2 observations from the OMI satellite instrument, Atmos. Chem. Phys., 18, 17017–17027, https://doi.org/10.5194/acp-18-17017-2018, 2018.
Martin, R. V., Fiore, A. M., and Van Donkelaar, A.: Space-based diagnosis of surface ozone sensitivity to anthropogenic emissions, Geophys. Res. Lett., 31, L06120, https://doi.org/10.1029/2004GL019416, 2004.
Martin, R. V., Sauvage, B., Folkins, I., Sioris, C. E., Boone, Bernath, C. P., and Ziemke, J.: Space-based constraints on the production of nitric oxide by lightning, J. Geophys. Res., 112, D09309, https://doi.org/10.1029/2006JD007831, 2007.
Meng, L., Liu, J., Tarasick, D. W., Randel, W. J., Steiner, A. K., Wilhelmsen, H., Wang, L., and Haimberger, L.: Continuous rise of the tropopause in the Northern Hemisphere over 1980–2020, Sci. Adv., 7, 45, https://doi.org/10.1126/sciadv.abi8065, 2021.
Mills, G., Pleijel, H., Malley, C. S., Sinha, B., Cooper, O. R., Schultz, M. G., Neufeld, H. S., Simpson, D., Sharps, K., Feng, Z., Gerosa, G., Harmens, H., Kobayashi, K., Saxena, P., Paoletti, E., Sinha, V., and Xu, X.: Tropospheric Ozone Assessment Report: Present-day tropospheric ozone distribution and trends relevant to vegetation, Elem. Sci. Anth., 6, 47, https://doi.org/10.1525/elementa.302, 2018.
Miyazaki, K., Eskes, H. J., Sudo, K., and Zhang, C.: Global lightning NOx production estimated by an assimilation of multiple satellite data sets, Atmos. Chem. Phys., 14, 3277–3305, https://doi.org/10.5194/acp-14-3277-2014, 2014.
McPeters, R. D. and Labow, G. J.: Climatology 2011: An MLS and sonde derived ozone climatology for satellite retrieval algorithms, J. Geophys. Res.-Atmos., 117, D10, https://doi.org/10.1029/2011JD017006, 2012.
Molod, A., Takacs, L., Suarez, M., and Bacmeister, J.: Development of the GEOS-5 atmospheric general circulation model: evolution from MERRA to MERRA2, Geosci. Model Dev., 8, 1339–1356, https://doi.org/10.5194/gmd-8-1339-2015, 2015.
Murray, L. T.: Lightning NOx and Impacts on Air Quality, Curr. Pollut. Rep., 2, 115–133, https://doi.org/10.1007/s40726-016-0031-7, 2016.
Murray, L. T.: An uncertain future for lightning, Nat. Clim. Change, 8, 191–192, https://doi.org/10.1038/s41558-018-0094-0, 2018.
Murray, L. T., Jacob, D. J., Logan, J. A., Hudman, R. C., and Koshak, J. W.: Optimized regional and interannual variability of lightning in a global chemical transport model constrained by LIS/OTD satellite data, J. Geophys. Res., 117, D20307, https://doi.org/10.1029/2012JD017934, 2012.
Myhre, G., Shindell, D., Bréon, F.-M., Collins, W., Fuglestvedt, J., Huang, J., Koch, D., Lamarque, J.-F., Lee, D., Mendoza, B., Nakajima, T., A. Robock, G. Stephens, T. Takemura, and H. Zhang: Anthropogenic and Natural Radiative Forcing, in: Climate Change 2013: The Physical Science Basis. Contribution of Working Group I to the Fifth Assessment Report of the Intergovernmental Panel on Climate Change, edited by: Stocker, T. F., Qin, D., Plattner, G.-K., Tignor, M., Allen, S. K., Boschung, J., Nauels, A., Xia, Y., Bex, V., and Midgley, P. M., Cambridge University Press, Cambridge, United Kingdom and New York, NY, USA, 659–740 pp., https://doi.org/10.1017/cbo9781107415324.018, 2013.
Nault, B. A., Garland, C., Wooldridge, P. J., Brune, W. H., Campuzano-Jost, P., Crounse, J. D., Day, D. A., Dibb, J., Hall, S. R., Huey, L. G., Jimenez, J. L., Liu, X., Mao, J., Mikoviny, T., Peischl, J., Pollack, I. B., Ren, X., Ryerson, T. B., Scheuer, E., Ullmann, K., Wennberg, P. O., Wisthaler, A., Zhang, L., and Cohen, R. C.: Observational Constraints on the Oxidation of NOx in the Upper Troposphere, The J. Phys. Chem. A, 120, 1468–1478, https://doi.org/10.1021/acs.jpca.5b07824, 2016.
Nault, B. A., Laughner, J. L., Wooldridge, P. J., Crounse, J. D., Dibb, J., Diskin, G., Peischl, J., Podolske, J. R., Pollack, I. B., Ryerson, T. B.,Scheuer, E., Wennberg, P. O., and Cohen, R. C.: Lightning NOx emissions: reconciling measured and modeled estimates with updated NOx chemistry, Geophys. Res. Lett., 44, 9479–9488, 2017.
Newton, R., Vaughan, G., Ricketts, H. M. A., Pan, L. L., Weinheimer, A. J., and Chemel, C.: Ozonesonde profiles from the West Pacific Warm Pool: measurements and validation, Atmos. Chem. Phys., 16, 619–634, https://doi.org/10.5194/acp-16-619-2016, 2016.
Nielsen, J. E., Pawson, S., Molod, A., Auer, B., da Silva, A. M., Douglass, A. R., Duncan, B., Liang Q., Manyin, M., Oman, L. D., Putman, W., Strahan, S., and Wargan, K.: Chemical mechanisms and their applications in the Goddard Earth Observing System (GEOS) earth system model, J. Adv. Model. Earth Syst. 9.8, 3019–3044, 2017.
NOAA: Global Monitoring Laboratory, Trends in Atmospheric Methane (CH4), https://gml.noaa.gov/ccgg/trends_ch4/ (last access: 2 August 2024), 2024.
Nussbaumer, C. M., Fischer, H., Lelieveld, J., and Pozzer, A.: What controls ozone sensitivity in the upper tropical troposphere?, Atmos. Chem. Phys., 23, 12651–12669, https://doi.org/10.5194/acp-23-12651-2023, 2023.
Orbe, C., Oman, L. D., Strahan, S. E., Waugh, D. W., Pawson, S., Takacs, L. L., and Molod, A. M.: Large-scale atmospheric transport in GEOS replay simulations, J. Adv. Model. Earth Syst., 9, 2545–2560, https://doi.org/10.1002/2017MS001053, 2017.
Oswald, R., Behrendt, T., Ermel, M., Wu, D., Su, H., Cheng, Y., Breuninger, C., Moravek, A., Mougin, E., Delon, C., Loubet, B., Pommerening-Röser, A., Sörgel, M., Pöschl, U., Hoffmann, T., Andreae, M. O., Meixner, F. X., and Trebs, I.: HONO Emissions from Soil Bacteria as a Major Source of Atmospheric Reactive Nitrogen, Science, 341, 1233–1235, https://doi.org/10.1126/science.1242266, 2013.
Ott, L. E., Pickering, K. E., Stenchikov, G. L., Huntrieser, H., and Schumann, U.: Effects of lightning NOx production during the 21 July European Lightning Nitrogen Oxides Project storm studied with a three-dimensional cloud-scale chemical transport model, J. Geophys. Res., 112, D05307, https://doi.org/10.1029/2006JD007365, 2007.
Ott, L. E., Pickering, K. E., Stenchikov, G. L., Allen, D. J., DeCaria, A. J., Ridley, B., Lin, R.-F., Lang, S., and Tao, W.-K.: Production of lightning NOx and its vertical distribution calculated from three-dimensional cloud-scale chemical transport model simulations, J. Geophys. Res., 115, D04301, https://doi.org/10.1029/2009JD011880, 2010.
Pickering, K. E., Thompson, A. M., Dickerson, R. R., Luke, W. T., McNamara, D. P., Greenberg, J. P., and Zimmerman, R. P.: Model calculations of tropospheric ozone production potential following observed convective events, J. Geophys. Res., 95, 14049–14062, 1990.
Pickering, K. E., Wang, Y., Tao, W.-K., Price, C., and Mueller, J.-F.: Vertical distributions of lightning NOx for use in regional and global chemical transport models, J. Geophys. Res., 103, 31203–31216, 1998.
Pickering, K. E., Bucsela, E., Allen, D., Ring, A., Holzworth, R., and Krotkov, N.: Estimates of lightning NOx production based on OMI NO2 observations over the Gulf of Mexico, J. Geophys. Res.-Atmos., 121, https://doi.org/10.1002/2015JD024179, 2016.
Pickering, K., Li, Y., Cummings, K. A., Brock, M., Allen, D., Bruning, E. C., and Pollack, B. I.: Lightning NOx in the 29–30 May 2012 Deep Convective Clouds and Chemistry (DC3) Severe Storm and Its Downwind Chemical Consequences, J. Geophys. Res., 129, e2023JD039439, https://doi.org/10.1029/2023JD039439, 2024.
Pinto Jr., O., Naccarato, K. P., and Pinto, I. R. C. A.: Thunderstorm incidence in southeastern Brazil estimated from different data sources, Ann. Geophys., 31, 1213–1219, https://doi.org/10.5194/angeo-31-1213-2013, 2013.
Pollack, I. B., Homeyer, C. R., Ryerson, T. B., Aikin, K. C., Peischl, J., Apel, E. C., Campos, T., Flocke, F., Hornbrook, R. S., Knapp, D. J., Montzka, D. D., Weinheimer, A. J., Riemer, D., Diskin, G., Sachse, G., Mikoviny, T., Wisthaler, A., Bruning, E., MacGorman, D., Cummings, K. A., Pickering, K. E., Huntrieser, H., Lichtenstern, M., Schlager, H., and Barth, M. C.: Airborne quantification of upper tropospheric NOx production from lightning in deep convective storms over the United States Great Plains, J. Geophys. Res.-Atmos., 121, 2002–2028, https://doi.org/10.1002/2015JD023941, 2016.
Prather, M. J. and Jacob, J. D.: A persistent imbalance in HOx and NOx photochemistry of the upper troposphere driven by deep tropical convection, Geophys. Res. Lett., 24, 3189–3192, 1997.
Price, C., Penner, J., and Prather, M.: NOx from lightning 1. Global distribution based on lightning physics, J. Geophys. Res., 102, 5929–5941, 1997.
Putero, D., Cristofanelli, P., Chang, K.-L., Dufour, G., Beachley, G., Couret, C., Effertz, P., Jaffe, D. A., Kubistin, D., Lynch, J., Petropavlovskikh, I., Puchalski, M., Sharac, T., Sive, B. C., Steinbacher, M., Torres, C., and Cooper, O. R.: Fingerprints of the COVID-19 economic downturn and recovery on ozone anomalies at high-elevation sites in North America and western Europe, Atmos. Chem. Phys., 23, 15693–15709, https://doi.org/10.5194/acp-23-15693-2023, 2023.
Qie, X., Qie, K., Wei, L., Zhu, K., Sun, Z., Yuan, S., Jiang, R., Zhang, H., and Xu, C.: Significantly increased lightning activity over the Tibetan Plateau and its relation to thunderstorm genesis, Geophys. Res. Lett., 49, e2022GL099894, https://doi.org/10.1029/2022GL099894, 2022.
Ravetta, F., Ancellet, G., Colette, A., and Schlager, H. H.: Long-range transport and tropospheric ozone variability in the western Mediterranean region during the Intercontinental Transport of Ozone and Precursors (ITOP-2004) campaign, J. Geophys. Res., 112, D10S46, https://doi.org/10.1029/2006JD007724, 2007.
Ren, X., Olson, J. R., Crawford, J. H., Brune, W. H., Mao, J., Long, R. B., Chen, G., Avery, M. A., Sachse, G. W., Barrick, J. D., Diskin, G. S., Huey, L. G., Fried, A., Cohen, R. C., Heikes, B., Wennberg, P., Singh, H. B., Blake, D. R., Shetter, E. R.: HOx Chemistry during INTEX–A 2004: Observation, Model Calculations and comparison with previous studies, J. Geophys. Res., 113, D05310, https://doi.org/10.1029/2007JD009166, 2008.
Richter, A., Burrows, J. P., Nusz, H., Granier, C., and Niemeier, U.: Increase in tropospheric nitrogen dioxide over China observed from space, Nature, 437, 129–132, https://doi.org/10.1038/nature04092, 2005.
Ridley, B., Ott, L., Pickering, K., Emmons, L., Montzka, D., Weinheimer, A., Knapp, D., Grahek, F., Li, L., Heymsfield, G., McGill, M., Kucera, P., Mahoney, M. J., Baumgardner, D., Schultz, M., and Brasseur, G.: Florida thunderstorms: A faucet of reactive nitrogen to the upper troposphere, J. Geophys. Res., 109, D17, https://doi.org/10.1029/2004JD004769, 2004.
Romps, D. M., Seeley, J. T., Vollaro, D., and Molinar, J.: Projected increase in lightning strikes in the United States due to global warming, Science, 851–854, https://doi.org/ 10.1126/science.1259100, 2014.
Romps, D. M., Charn, A. B., Holzworth, R. H., Lawrence, W. E., Molinari, J., and Vollaro, D.: CAPE times P explains lightning over land but not the land-ocean contrast, Geophys. Res. Lett., 45, 12623–12630, https://doi.org/10.1029/2018GL080267, 2018.
Romps, D. M.: Evaluating the future of lightning in cloud-resolving models, Geophys. Res. Lett., 46, 14863–14871, https://doi.org/10.1029/2019GL085748, 2019.
Sanap, S. D.: Global and regional variations in aerosol loading during COVID-19 imposed lockdown, Atmos. Environ., 246, 118132, https://doi.org/10.1016/j.atmosenv.2020.118132, 2021
Sauvage, B., Martin, R. V., van Donkelaar, A., and Ziemke, R. J.: Quantification of the factors controlling tropical tropospheric ozone and the South Atlantic maximum, J. Geophys. Res., 112, D11309, https://doi.org/10.1029/2006JD008008, 2007.
Schumann, U. and Huntrieser, H.: The global lightning-induced nitrogen oxides source, Atmos. Chem. Phys., 7, 3823–3907, https://doi.org/10.5194/acp-7-3823-2007, 2007.
Shi, Z., Wang, H., Tan, Y., Li, L., and Li, C.: Influence of aerosols on lightning activities in central eastern parts of China, Atmos. Sci. Lett., 21, e957, https://doi.org/10.1002/asl.957, 2020.
Shindell, D. T., Kuylenstierna, J. C. I., Vignati, E., van Dingenen, R., Amann, M., Klimont, Z., Anenberg, S. C., Muller, N., Janssens-Maenhout, G., Raes, F., Schwartz, J., Faluvegi, G., Pozzoli, L., Kupiainen, K., Höglund-Isaksson, L., Emberson, L., Streets, D., Ramanathan, V., Hicks, K., Oanh, N. T. K., Milly, G., Williams, M., Demkine, V., and Fowler, D.: Simultaneously mitigating near-term climate change and improving human health and food security, Science, 335, 183–189, https://doi.org/10.1126/science.1210026, 2012.
Silvern, R. F., Jacob, D. J., Mickley, L. J., Sulprizio, M. P., Travis, K. R., Marais, E. A., Cohen, R. C., Laughner, J. L., Choi, S., Joiner, J., and Lamsal, L. N.: Using satellite observations of tropospheric NO2 columns to infer long-term trends in US NOx emissions: the importance of accounting for the free tropospheric NO2 background, Atmos. Chem. Phys., 19, 8863–8878, https://doi.org/10.5194/acp-19-8863-2019, 2019.
Souri, A. H., Johnson, M. S., Wolfe, G. M., Crawford, J. H., Fried, A., Wisthaler, A., Brune, W. H., Blake, D. R., Weinheimer, A. J., Verhoelst, T., Compernolle, S., Pinardi, G., Vigouroux, C., Langerock, B., Choi, S., Lamsal, L., Zhu, L., Sun, S., Cohen, R. C., Min, K.-E., Cho, C., Philip, S., Liu, X., and Chance, K.: Characterization of errors in satellite-based HCHO ∕ NO2 tropospheric column ratios with respect to chemistry, column-to-PBL translation, spatial representation, and retrieval uncertainties, Atmos. Chem. Phys., 23, 1963–1986, https://doi.org/10.5194/acp-23-1963-2023, 2023.
Stauffer, R. M., Thompson, A. M., Kollonige, D., Tarasick, D., Van Malderen, R., Smit, H. G. J., Vömel, H., Morris, G., Johnson, B. J., Cullis, P., Stübi, R., Davies, J., and Yan, M. M: An Examination of the Recent Stability of Ozonesonde Global Network Data, Earth Space Sci. Arch., 9, e2022EA002459, https://doi.org/10.1002/essoar.10511590.1, 2022.
Stavrakou, T., Müller, J.-F., Boersma, K. F., De Smedt, I., and van der A., R. J.: Assessing the distribution and growth rates of NOx emission sources by inverting a 10-year record of NO2 satellite columns, Geophys. Res. Lett., 35, L10801, https://doi.org/10.1029/2008GL033521, 2008.
Steinbrecht, W., Claude, H., Köhler, U., and Hoinka, K. P.: Correlations between tropopause height and total ozone: Implications for long-term changes, J. Geophys. Res., 103, 19183–19192, https://doi.org/10.1029/98JD01929, 1998.
Steinkamp, J., Ganzeveld, L. N., Wilcke, W., and Lawrence, M. G.: Influence of modelled soil biogenic NO emissions on related trace gases and the atmospheric oxidizing efficiency, Atmos. Chem. Phys., 9, 2663–2677, https://doi.org/10.5194/acp-9-2663-2009, 2009.
Steinbrecht, W., Kubistin, D., Plass-Dülmer, C., Davies, J., Tarasick, D. W., von der Gathen, P., Deckelmann, H., Jepsen, N., Kivi, R., Lyall, N., Palm, M., Notholt, J., Kois, B., Oelsner, P., Allaart, M., Piters, A., Gill, M., Van Malderen, R., Delcloo, A. W., Sussmann, R., Mahieu, E., Servais, C., Romanens, G., Stübi, R., Ancellet, G., Godin-Beekmann, S., Yamanouchi, S., Strong, K., Johnson, B., Cullis, P., Petropavlovskikh, I., Hannigan, J. W., Hernandez, J.-L., Diaz Rodriguez, A., Nakano, T., Chouza, F., Leblanc, T., Torres, C., Garcia, O., Röhling, A. N., Schneider, M., Blumenstock, T., Tully, M., Paton-Walsh, C., Jones, N., Querel, R., Strahan, S., Stauffer, R. M., Thompson, A. M., Inness, A., Engelen, R., Chang, K.-L., and Cooper, O. R.: COVID-19 crisis reduces free tropospheric ozone across the Northern Hemisphere, Geophys. Res. Lett., 48, e2020GL091987, https://doi.org/10.1029/2020GL091987, 2021.
Stohl, A., Bonasoni, P., Cristofanelli, P., Collins, W., Feichter, J., Frank, A., Forster, C., Gerasopoulos, E., Gäggeler, H., James, P., Kentarchos, T., Kromp-Kolb, H., Krüger, B., Land, C., Meloen, J., Papayannis, A., Priller, A., Seibert, P., Sprenger, M., Roelofs, G. J., Scheel, H. E., Schnabel, C., Siegmund, P., Tobler, L., Trickl, T., Wernli, H., Wirth, V., Zanis, P., and Zerefos, C.: Stratosphere-troposphere exchange: A review, and what we have learned from STACCATO, J. Geophys. Res., 108, 8516, https://doi.org/10.1029/2002JD002490, 2003.
Strahan, S. E., Duncan, B. N., and Hoor, P.: Observationally derived transport diagnostics for the lowermost stratosphere and their application to the GMI chemistry and transport model, Atmos. Chem. Phys., 7, 2435–2445, https://doi.org/10.5194/acp-7-2435-2007, 2007.
Strode, S. A., Worden, H. M., Damon, M., Douglass, A. R., Duncan, B. N., Emmons, L. K., Lamarque, J.-F., Manyin, M., Oman, L. D., Rodriguez, J. M., Strahan, S. E., and Tilmes, S.: Interpreting space-based trends in carbon monoxide with multiple models, Atmos. Chem. Phys., 16, 7285–7294, https://doi.org/10.5194/acp-16-7285-2016, 2016.
Su, H., Cheng, Y., Oswald, R., Behrendt, T., Trebs, I., Meixner, F. X., Andreae, M. O., Cheng, P., Zhang, Y., and Pöschl, U.: Soil Nitrite as a Source of Atmospheric HONO and OH Radicals, Science, 333, 1616–1618, https://doi.org/10.1126/science.1207687, 2011.
Szopa, S., Naik, V., Adhikary, B., Artaxo, P., Berntsen, T., Collins, W.D., Fuzzi, S., Gallardo, L., Kiendler-Scharr, A., Klimont, Z., Liao, H., Unger, N., and Zanis, P.: Short-Lived Climate Forcers, in: Climate Change 2021: The Physical Science Basis, Contribution of Working Group I to the Sixth Assessment Report of the Intergovernmental Panel on Climate Change, edited by: Masson-Delmotte, V., Zhai, P., Pirani, A., Connors, S. L., Péan, C., Berger, S., Caud, N., Chen, Y., Goldfarb, L., Gomis, M. I., Huang, M., Leitzell, K., Lonnoy, E., Matthews, J. B. R., Maycock, T. K., Waterfield, T., Yelekçi, O., Yu, R., and Zhou, B., Cambridge University Press, Cambridge, United Kingdom and New York, NY, USA, 817–922 pp., https://doi.org/10.1017/9781009157896.008, 2021.
Tarasick, D., Galbally, I. E., Cooper, O. R., Schultz, M.G., Ancellet, G., Leblanc, T., Wallington, T.J., Ziemke, J., Liu, X., Steinbacher, M., Staehelin, J., Vigouroux, C., Hannigan, J. W., García, O., Foret, G., Zanis, P., Weatherhead, E., Petropavlovskikh, I., Worden, H., Osman, M., Liu, J., Chang, K.-L., Gaudel, A., Lin, M., Granados-Muñoz, M., Thompson, A. M., Oltmans, S. J., Cuesta, J., Dufour, G., Thouret, V., Hassler, B., Trickl, T., and Neu, J. L.: Tropospheric Ozone Assessment Report: Tropospheric ozone from 1877 to 2016, observed levels, trends and uncertainties. Tropospheric Ozone Assessment Report: Tropospheric ozone from 1877 to 2016, observed levels, trends and uncertainties, Elem. Sci. Anth., 7, p. 39, https://doi.org/10.1525/elementa.376, 2019.
Thompson, A. M., Witte, J. C., Sterling, C., Jordan, A., Johnson, B. J., Oltmans, S. J., Fujiwara, M., Vömel, H., Allaart, M., Piters, A., Coetzee, G. J. R., Posny, F., Corrales, E., Diaz, J. A., Félix, C., Komala, N., Lai, N., Ahn Nguyen, H. T., Maata, M., Mani, F., Zainal, Z., Ogino, S., Paredes, F., Penha, T. L. B., Silva, F. R., Sallons-Mitro, S., Selkirk, H. B., Schmidlin, F. J., Stübi, R., and Thiongo, K.: First Reprocessing of Southern Hemisphere Additional Ozonesondes (SHADOZ) Ozone Profiles (1998–2016): 2. Comparisons With Satellites and Ground-Based Instruments, J. Geophys. Res.-Atmos., 122, 13000–13025, https://doi.org/10.1002/2017JD027406, 2017.
Trickl, T., Bärtsch-Ritter, N., Eisele, H., Furger, M., Mücke, R., Sprenger, M., and Stohl, A.: High-ozone layers in the middle and upper troposphere above Central Europe: potential import from the stratosphere along the subtropical jet stream, Atmos. Chem. Phys., 11, 9343–9366, https://doi.org/10.5194/acp-11-9343-2011, 2011.
Trickl, T., Giehl, H., Neidl, F., Perfahl, M., and Vogelmann, H.: Three decades of tropospheric ozone lidar development at Garmisch-Partenkirchen, Germany, Atmos. Meas. Tech., 13, 6357–6390, https://doi.org/10.5194/amt-13-6357-2020, 2020.
Turnock, S. T., Allen, R. J., Andrews, M., Bauer, S. E., Deushi, M., Emmons, L., Good, P., Horowitz, L., John, J. G., Michou, M., Nabat, P., Naik, V., Neubauer, D., O'Connor, F. M., Olivié, D., Oshima, N., Schulz, M., Sellar, A., Shim, S., Takemura, T., Tilmes, S., Tsigaridis, K., Wu, T., and Zhang, J.: Historical and future changes in air pollutants from CMIP6 models, Atmos. Chem. Phys., 20, 14547–14579, https://doi.org/10.5194/acp-20-14547-2020, 2020.
Verma, S., Yadava, P. K., Lal, D. M., Mall, R. K., Harshbardhan, K., and Payra, S.: Role of Lightning NOx in ozone formation: A review, Pure Appl. Geophys., 178, 1425–1443, 2021.
Vinken, G. C. M., Boersma, K. F., Maasakkers, J. D., Adon, M., and Martin, R. V.: Worldwide biogenic soil NOx emissions inferred from OMI NO2 observations, Atmos. Chem. Phys., 14, 10363–10381, https://doi.org/10.5194/acp-14-10363-2014, 2014.
Wang, H., Shi, Z., Wang, X., Tan, Y., Wang, H., Li, L., and Lin, X.: Cloud-to-Ground Lightning Response to Aerosol over Air-Polluted Urban Areas in China, Remote Sens. 13, 2600, https://doi.org/10.3390/rs13132600, 2021.
Wang, H., Lu, X., Jacob, D. J., Cooper, O. R., Chang, K.-L., Li, K., Gao, M., Liu, Y., Sheng, B., Wu, K., Wu, T., Zhang, J., Sauvage, B., Nédélec, P., Blot, R., and Fan, S.: Global tropospheric ozone trends, attributions, and radiative impacts in 1995–2017: an integrated analysis using aircraft (IAGOS) observations, ozonesonde, and multi-decadal chemical model simulations, Atmos. Chem. Phys., 22, 13753–13782, https://doi.org/10.5194/acp-22-13753-2022, 2022.
Wang, G. and Chen, S.: A review on parameterization and uncertainty in modeling greenhouse gas emissions from soil, Geoderma, 170, https://doi.org/10.1016/j.geoderma.2011.11.009, 2012.
Wang, Y., DeSilva, A. W., Goldenbaum, G. C., and Dickerson, R. R.: Nitric oxide production by simulated lightning: Dependence on current, energy, and pressure, J. Geophys. Res., 103, 19149–19159, 1998.
Weng, H., Lin, J., Martin, R. , Millet, D., Jaegle, L., Ridley, D., Keller, Li, C., C., Du, M., Meng, J.: Global high-resolution emissions of soil NOx, sea salt aerosols, and biogenic volatile organic compounds, Sci. Data, 7, 148, https://doi.org/10.1038/s41597-020-0488-5, 2020.
Wild, O., Fiore, A. M., Shindell, D. T., Doherty, R. M., Collins, W. J., Dentener, F. J., Schultz, M. G., Gong, S., MacKenzie, I. A., Zeng, G., Hess, P., Duncan, B. N., Bergmann, D. J., Szopa, S., Jonson, J. E., Keating, T. J., and Zuber, A.: Modelling future changes in surface ozone: a parameterized approach, Atmos. Chem. Phys., 12, 2037–2054, https://doi.org/10.5194/acp-12-2037-2012, 2012.
Williams, R. S., Hegglin, M. I., Kerridge, B. J., Jöckel, P., Latter, B. G., and Plummer, D. A.: Characterising the seasonal and geographical variability in tropospheric ozone, stratospheric influence and recent changes, Atmos. Chem. Phys., 19, 3589–3620, https://doi.org/10.5194/acp-19-3589-2019, 2019.
WMO: International Meteorological Vocabulary (2nd Ed.), Geneva: Secretariat of the World Meteorological Organization. 1992. p. 636, ISBN 978-92-63-02182-3, 1992.
Wu, D., Zhang, J., Wang, M., An, J., Wang, R., Haider, H., Xu-Ri. Huang, Y., Zhang, Q., Zhou, F., Tian, H., Zhang, X., Deng, L., Pan, Y., Chen, X., Yu, Y., Hu, C., Wang, R., Song, Y., Gao, Z., Wang, Y., Hou, L., and Liu, M.: Global and regional patterns of soil nitrous acid emissions and their acceleration of rural photochemical reactions, J. Geophys. Res.-Atmos., 127, e2021JD036379, https://doi.org/10.1029/2021JD036379, 2022.
Yang, X., and Li, Z.: Increases in thunderstorm activity and relationships with air pollution in southeast China, J. Geophys. Res.-Atmos., 119, 1835–1844, https://doi.org/10.1002/2013JD021224, 2014.
Yang, W., Yuan, H., Han, C., Yang, H. and Xue, X.: Photochemical emissions of HONO, NO2 and NO from the soil surface under simulated sunlight, Atmos. Environ., 234, 117596, https://doi.org/10.1016/j.atmosenv.2020.117596, 2020.
Yienger, J. J. and Levy II, H.: Empirical model of global soil-biogenic NOx emissions, J. Geophys. Res., 100, 11447–11464, https://doi.org/10.1029/95JD00370, 1995.
Yin, Y., Chevallier, F., Ciais, P., Broquet, G., Fortems-Cheiney, A., Pison, I., and Saunois, M.: Decadal trends in global CO emissions as seen by MOPITT, Atmos. Chem. Phys., 15, 13433–13451, https://doi.org/10.5194/acp-15-13433-2015, 2015.
Zanis, P., Akritidis, D., Turnock, S., Naik, V., Szopa, S., Georgoulias, A. K., Bauer, S. E., Deushi, M., Horowitz, L. W., and Keeble, J.: Climate change penalty and benefit on surface ozone: a global perspective based on CMIP6 earth system models, Environ. Res. Lett., 17, 2, https://doi.org/10.1088/1748-9326/ac4a34, 2022.
Zeng, G., Morgenstern, O., Braesicke, P., and Pyle, J. A.: Impact of stratospheric ozone recovery on trozone results from in situ chemical formationopospheric ozone and its budget: impact of ozone recovery on tropospheric ozone, Geophys. Res. Lett., 37, 9, https://doi.org/10.1029/2010GL042812, 2010.
Zhang, L., Wang, T., Zhang, Q., Zheng, J., Xu, Z., and Lv, M.: Potential sources of nitrous acid (HONO) and their impacts on ozone: A WRF-Chem study in a polluted subtropical region, J. Geophys. Res.-Atmos., 121, 3645–3662, https://doi.org/10.1002/2015JD024468, 2016.
Zhang, X., Yin, Y., van der A, R., Lapierre, J. L., Chen, Q., Kuang, X., Yan, S., Chen, J., He, C., and Shi, R.: Estimates of lightning NOx production based on high-resolution OMI NO2 retrievals over the continental US, Atmos. Meas. Tech., 13, 1709–1734, https://doi.org/10.5194/amt-13-1709-2020, 2020.
Zheng, B., Chevallier, F., Yin, Y., Ciais, P., Fortems-Cheiney, A., Deeter, M. N., Parker, R. J., Wang, Y., Worden, H. M., and Zhao, Y.: Global atmospheric carbon monoxide budget 2000–2017 inferred from multi-species atmospheric inversions, Earth Syst. Sci. Data, 11, 1411–1436, https://doi.org/10.5194/essd-11-1411-2019, 2019.
Ziemke, J. R., Chandra, S., Duncan, B. N., Froidevaux, L., Bhartia, P. K., Levelt, P. F., and Waters, J. W.: Tropospheric ozone determined from Aura OMI and MLS: Evaluation of measurements and comparison with the Global Modeling Initiative's Chemical Transport Model, J. Geophys. Res., 111, D19303, https://doi.org/10.1029/2006JD007089, 2006.


