the Creative Commons Attribution 4.0 License.
the Creative Commons Attribution 4.0 License.
 | 29 Jan 2024
Source apportionment of PM2.5 in Montréal, Canada, and health risk assessment for potentially toxic elements
Nansi Fakhri
Robin Stevens
Arnold Downey
Konstantina Oikonomou
Jean Sciare
Charbel Afif
Patrick L. Hayes
Source apportionment of PM2.5 was performed using positive matrix factorization (PMF) based on detailed chemical composition data from 24 h filter samples collected over a 3-month period (August–November 2020) at an urban site in Montréal, a Canadian city with a population of approximately 4×10⁶ people. This source apportionment study, which examined the main contributing sources to PM2.5 using a larger suite of organic molecular markers than other Canadian studies, is the first of its sort in Canada. A focus of this study was on quantifying previously unresolved sources of PM2.5 through the inclusion in the PMF analysis of additional organic molecular markers beyond those measured typically by the Canadian government's National Air Pollution Surveillance Program (NAPS). The organic species included in the PMF model were comprised of six n-alkanes, two fatty acids, one dicarboxylic acid, two biogenic secondary organic aerosol (SOA) tracers, and hopane. Secondary inorganic aerosols (SIAs) and SOAs were the dominant components and constituted 39 % of the measured PM2.5 mass, while the local primary anthropogenic sources, namely traffic exhaust, road dust, industrial, and cooking emissions, contributed 23 %. The chemical transport model GEOS-Chem revealed that ammonium sulfate concentrations in Montréal are strongly influenced by both local sources in Quebec and transboundary input from the United States, with the transboundary input exceeding the local emissions for SOA. Co and Cr(VI) presented an elevated cancer risk, highlighting that more attention should be given to these trace metals, which were associated with industrial emissions by the PMF analysis. Furthermore, the results showed that industrial emissions were minor contributors to the total PM2.5 mass concentration but were the largest contributors to Co and Cr(VI) concentrations. Thus, the health hazards associated with this source cannot be entirely established by the PM2.5 mass concentration alone. This study highlights that, when evaluating air quality in Montréal and other urban regions, the prioritization of sources for mitigation strategies will diverge if one considers total PM2.5 mass concentration or the concentration of individual particulate-bound contaminants. Furthermore, the large transboundary contribution from the United States to total PM2.5 levels suggests that future municipal, provincial, and federal monitoring and regulations would be more effective if they focus on specific high-risk contaminants (e.g., Co and Cr(VI) rather than total PM2.5).
- Article
(1516 KB) - Full-text XML
-
Supplement
(1363 KB) - BibTeX
- EndNote


Outdoor air pollution is a serious threat to human health and is responsible for over 4×10⁶ premature deaths worldwide annually (Nansai et al., 2021). Among the various air pollutants, particulate matter (PM) is one of the most problematic and has been classified within group 1 “carcinogenic to humans” by the International Agency for Research on Cancer (IARC). Particle size is a critical parameter for assessing health impacts, and PM with an aerodynamic diameter less than 2.5 µm (PM2.5) represents a greater threat to health than coarser particles as these fine particles can penetrate deeply into the respiratory tract and induce adverse health effects such as respiratory and cardiovascular diseases (Lelieveld et al., 2019).
Outdoor air pollution continues to have serious health consequences in Canada (EAR, 2019; Jeong et al., 2011; Bari and Kindzierski, 2016). The government of Canada estimates that approximately 15 300 premature deaths per year are linked to air pollution (Health Canada, 2021). Montréal, a Canadian city in the province of Quebec, is the largest city in the province and the second largest in Canada, with a population of approximately 4×10⁶ people. The city maintains a network of 14 air quality monitoring stations that continuously measure the concentrations of major pollutants (PM, ozone, sulfur dioxide (SO2), nitrogen oxides (NOX), ozone, among others). These municipal monitoring stations also belongs to Environment and Climate Change Canada's National Air Pollution Surveillance (NAPS) program, which is the principal source of ambient air quality data in Canada (EAR, 2020) and provides also speciated PM composition measurements via offline analyses at a limited number of sites. The resulting data enable a portrait to be drawn of the evolution of pollutant concentrations in Montréal over the years. The concentrations of PM2.5 in Montréal's ambient air have been decreasing since 2011. The 3-year average concentration of PM2.5 decreased from 9.7 µg m−3 (2011–2013) to 7.3 µg m−3 (2018–2020) (EAR, 2017, 2018, 2019, 2020). However, in September 2021, the World Health Organization (WHO) released revised global air quality guidelines with a recommended PM2.5 concentration of 5 µg m−3, meaning that the PM2.5 concentrations in Montréal exceed WHO recommendations (WHO, 2021). Thus, it is important to continue to improve air quality in the city.
To effectively reduce PM emissions in the metropolitan area and design effective local PM control strategies, it is necessary to have a better understanding of the dominant emission sources and associated health risk. Over the years several efforts have been made to improve the knowledge about the sources of atmospheric particles in Canada using the receptor-based source apportionment model positive matrix factorization (PMF) and NAPS PM2.5 chemical speciation datasets as inputs (Bari and Kindzierski, 2016; Dabek-Zlotorzynska et al., 2011; Jeong et al., 2011; Celo et al., 2021). In Quebec, there are six NAPS sites that provide speciated PM2.5 measurements, three of which are in the Montréal area, namely Châteauneuf (NAPS ID: S50124), Molson (NAPS ID: S50134), and Rivière des Prairies (NAPS ID: S50129). However, samples are collected once every 3 or 6 d, and operating on this sampling frequency does not allow reliable quantification of the concentration distribution's extremes because this sampling schedule may exclude days of very high or low concentrations from a given source. Another limitation is the lack of data on organic compounds, which can be valuable tracers for certain PM2.5 sources (Fadel et al., 2021; Fakhri et al., 2023a). To date, investigations of PM concentrations and chemical composition from NAPS sites in Canada have generally focused on determining the elemental carbon (EC) and organic carbon (OC) concentrations as well as the elemental and ionic content of PM.
In this work, PM2.5 chemical composition and emission sources as well as potential human health risk associated with trace elements in PM2.5 are investigated for an urban site in Montréal over a 3-month period (August–November). In addition to water-soluble ions, elements, EC, and OC, the measurements of PM2.5 composition included a large suite of organic molecular markers. This study uses these measurements to explore qualitatively potential sources (e.g., via correlations of elements) before proceeding to a more quantitative approach to source apportionment using PMF. Source apportionment of PM2.5 was performed using simultaneously organic and inorganic species in the PMF model. One objective of this work is to investigate previously unresolved PM sources in Montréal by using some selected organic markers, namely six n-alkanes, hopane, two fatty acids, one dicarboxylic acid, two biogenic secondary organic aerosols tracers, and hopane, in the PMF model. To our knowledge, this study represents the first time that such extensive composition measurements were included in a source apportionment study in Montréal. Furthermore, the GEOS-Chem chemical transport model was used to evaluate local and long-range contributions to the most significant PM components, providing more information on the origin of PM. Lastly, a health risk assessment model was used to determine the associated risk of the elemental components from the sources identified using the PMF model.
2.1 PM2.5 sampling
Sampling was conducted at an urban site in Montréal from 13 August to 11 November 2020. The sampling site, labeled as MTL, was located on the rooftop of campus MIL (12 m above ground level) at the University of Montréal (45∘31 N, 73∘37 W) in the neighborhood of Outremont. The site is characterized by a high density of residential and commercial premises.
A total of 80 PM2.5 filter samples (150 mm quartz-fiber filters, PALL) were collected with a 24 h resolution using a high-volume sampler (CAV-A/MSb, MCV S.A., Spain) operating at 30 m3 h−1. Filters were baked at 550 ∘C for 12 h before sampling to eliminate the organic impurities and kept at −20 ∘C until sampling. Collected filters were also stored at −20 ∘C until analysis. Organic species and elements were immediately quantified following the field campaign (i.e., within 3 months). Analyses of the water-soluble ions, sugars, OC, and EC were performed a year after the field campaign. Field blank samples were collected by loading filters into the sampler but without operating the sampler's pump. A total number of eight field blank samples were also analyzed with the same techniques as the sample filters. The concentrations of the species in the PM2.5 samples were corrected by subtracting the average field blank values. Additional QA/QC (quality assurance/quality control) procedures were applied on the different analysis techniques/protocols used (e.g., determination of detection limits and recovery, as well as validation using certified reference material) (Fakhri et al., 2023b). PM2.5 mass concentration was determined by weighing the filters before and after sampling using a VWR microbalance with a 1 µg readability (Abdallah et al., 2018; Fadel et al., 2022b).
2.2 Chemical analysis
The chemical analyses are detailed in Fakhri et al. (2023b) and will only be briefly presented here. Elemental carbon (EC) and organic carbon (OC) were analyzed using the thermo-optical transmission method on a Sunset Laboratory analyzer following the EUSAAR2 (European Supersites for Atmospheric Aerosol Research) protocol (Cavalli et al., 2010).
Major (Al, Fe, K, Mg, Na) and trace (Zn, Ni, Sr, Cu, Ti, Co, Cr, V, Mn, Cd, Mo, Sb, Pb) metals and metalloids were analyzed using an inductively coupled plasma mass spectrometer (ICP-MS) (PerkinElmer NexION 300x). In brief, a punch (18 mm2) was taken from the quartz filters and digested in a mixture of ultrapure HNO3 (4 mL of 67 %–70 % (w/w), Baker ARISTAR ULTRA supplied by VWR International), and HCl (1 mL of 35 %–38 % (w/w), TraceMetal Grade, Fisher Chemical) in a microwave reaction system (CEM MARSXpress MARS 230/60). The oven program was set to an initial temperature ramp reaching 180 ∘C in 5.5 min with a subsequent holding period of 9.5 min. Matrix-matched ICP-MS calibration standards were prepared using IV-ICPMS-71A (Inorganic Ventures), and quality control standards were prepared using QCS-27 (High Purity Standards). Two external calibration methods were used for sample analysis: one for trace metals and metalloids, where the calibration range was between 0.05 and 10 µg L−1, and the other for the analysis of major metals, where the calibration range was between 3 and 500 µg L−1. The calibration curves showed good linearity with R2 greater than 0.999. An internal standard solution comprised of Sc, Y, In, and Bi was analyzed along with the samples, with recovery ranging from 90 %–130 %. The analytical procedure was validated by considering a certified reference material NIST SRM 1648a (urban particulate matter, National Institute of Standards and Technology, United States of America). Data for a given metal were accepted as quantitative if NIST SRM 1648 recovery was 80 %–110 %.
Soluble anions and cations were analyzed by ionic chromatography after extracting a punch (20 mm) of each quartz filter by ultrasonic agitation in 6 mL of MilliQ water (ELGA LabWater Purelab Chorus 1, 18.2 MΩ at 25 ∘C) for 45 min, by means of a Dionex ICS-5000+ instrument. For anion analysis, a Dionex IonPac AS11-HC anion column (2×250 mm), a Dionex IonPac AG11-HC (2×50 mm) pre-column, and a Dionex AERS 500 suppressor were used. Thermo Scientific Dionex KOH with a gradient of 1–45 mM was used as the eluent in the anion analysis with a flow rate of 0.5 mL min−1. For cation analysis, a Dionex IonPac CS12 cation column (2×250 mm), a Dionex IonPac CG12 (2×50 mm) pre-column, and a Dionex CSRS 300 4 mm suppressor were used during the cation analysis. Thermo Scientific Dionex 12 mM methanesulfonic acid with a flow rate of 0.3 mL min−1 was used as eluent in the cation analysis.
Sugar alcohols were analyzed by ion chromatography with pulsed amperometric detection (IC-PAD) by means of a Dionex ICS-5000+ instrument using a Dionex CarboPac MA1 column (4×250 mm) and a Dionex CarboPac MA1 (4×50 mm) pre-column. Thermo Scientific Dionex 0.35 M NaOH with a flow rate of 0.6 mL min−1 was used as eluent in the sugar analysis.
The method used for the organic compound analysis was described elsewhere (Fadel et al., 2021; Fakhri et al., 2023b; El Haddad et al., 2011). Briefly, a punch of the sample filter (73 cm2) was spiked with two internal standards (D50-tetracosane and D6-cholesterol obtained from Sigma Aldrich) followed by an extraction using an accelerated pressurized solvent extraction device at 100 ∘C and 100 bar (Dionex ASE 350) and an acetone / dichloromethane mixture (, ). After extraction, samples were concentrated to a volume of 200 µL using a constant gentle flow of nitrogen gas. A total of 50 µL of the extracts was then derivatized with the addition of 50 µL of N,O-bis(trimethylsilyl)trifluoroacetamide (BSTFA) (99 %, Sigma Aldrich) with 10 µL of pyridine (catalyst) (99 %, Sigma Aldrich) at 70 ∘C for 2 h. Aliquots of 2 µL of the derivatized extracts were immediately analyzed using gas chromatography–mass spectrometry (GC-MS) in split mode. In addition, aliquots of 2 µL of the non-derivatized fraction were also analyzed using the GC-MS in split mode. The gas chromatograph (Agilent 6890N) was equipped with a HP-5MS UI fused silica capillary column (5 %-phenyl, 95 %-methylpolysiloxane, 0.25 µm film thickness, and 30 m × 0.25 mm) and interfaced to an ion trap MS with an external electron ionization (EI) source (200 ∘C, 70 eV). Full scan mode was used in the mass range of 50–550 .
2.3 Chemical mass closure
The term “chemical mass closure” refers to the reconstruction of the measured weighed mass using just the chemical composition. It is done by comparing the combined masses of the chemical species to the gravimetric particulate matter mass (mgrav), wherein the reconstructed PM2.5 mass (mchem) is defined as the sum of organic matter (OM), EC, crustal matter, sea salt, secondary inorganic aerosol (SIA), and other elements that are not taken into account as minerals (Chow et al., 2015).
A chemical mass closure study was performed using the chemical composition measurements to estimate the contributions of the different components to the total PM2.5 mass concentration following the method reported by Fakhri et al. (2023b). Briefly, the contribution of sea salt is calculated by summing the six major ions (Sciare et al., 2005):
Ionic constituents such as K+, Ca2+, Mg2+, and SO are derived from both marine and non-marine sources. Therefore, it is necessary to discriminate sea salt (ss) from non-sea-salt (nss) contributions. Assuming that all sodium ions are of marine origin, the sea salt contribution can be calculated based on sea water composition as shown in Eqs. (2)–(5) (Genga et al., 2017; Sciare et al., 2005). Furthermore, non-sea-salt potassium, calcium, magnesium, and sulfate (nss-K+, nss-Ca2+, nss-Mg2+, and nss-SO are calculated by subtracting the sea salt fraction (ss-K+, ss-Ca2+, ss-Mg2+, and ss-SO, respectively) from the total concentration of the ions (K+, Ca2+, Mg2+, and SO, respectively).
In the chemical mass closure calculation, we assume that Na+ originates from sea salt, and the ratios between Na+ and other ions (SO, Ca2+, K+, and Mg2+) in sea salt aerosol are the same as those for seawater. However, it is possible that some Na+ originates from road salt, which is principally composed of NaCl, with a small amount of CaCl2 (Charbonneau, 2006). In this case, the contributions of SO, K+, and Mg2+ would be overestimated, and the true concentration of the road/sea salt component would be less than that calculated. In the extreme case of the component being derived entirely from road salt, the overestimation in the concentration of this component would be approximately 20 %, given the preceding equations. This error is relatively small because SO, K+, and Mg2+ have relatively small concentrations in sea salt.
In addition, secondary inorganic aerosol (SIA) is represented by the sum of nss-SO, NH, and NO. To take bound water into account a hydration multiplication factor of 1.29 was applied to convert the dry inorganic concentrations (SIA and sea salt) into hydrated species (Sciare et al., 2005; Genga et al., 2017).
The contribution of crustal matter (CM) (Eq. 6) was estimated by summing the concentrations of aluminum, silicon, calcium, iron, and titanium in their oxide forms (Huang et al., 2014). The coefficients in front of the elements correspond to the additional mass due to oxygen in the minerals. Silicon was not measured in this study and was indirectly determined by multiplying the measured aluminum concentration by a factor of 3.41 (Esmaeilirad et al., 2020). This factor is obtained from the ratio of Si and Al in the Earth's crust following Mason and Moore (1982).
To account for unmeasured O, N, S, and H atoms in OM, the conversion factor (CF) from OC to OM was derived using the equation OM = CF × OC. The method used to calculate the CF sums all the PM components while systematically varying the conversion (Genga et al., 2017). To find the optimal CF to calculate OM from OC, the factor was varied from 1.2 to 2.1. The Pearson correlation (R) calculated between the reconstructed PM2.5 and the measured mass did not change significantly (0.978–0.979), but the highest correlation and the slope closest to 1 was obtained with CF = 1.6. The results of the chemical mass closure study are shown in Fig. S5.
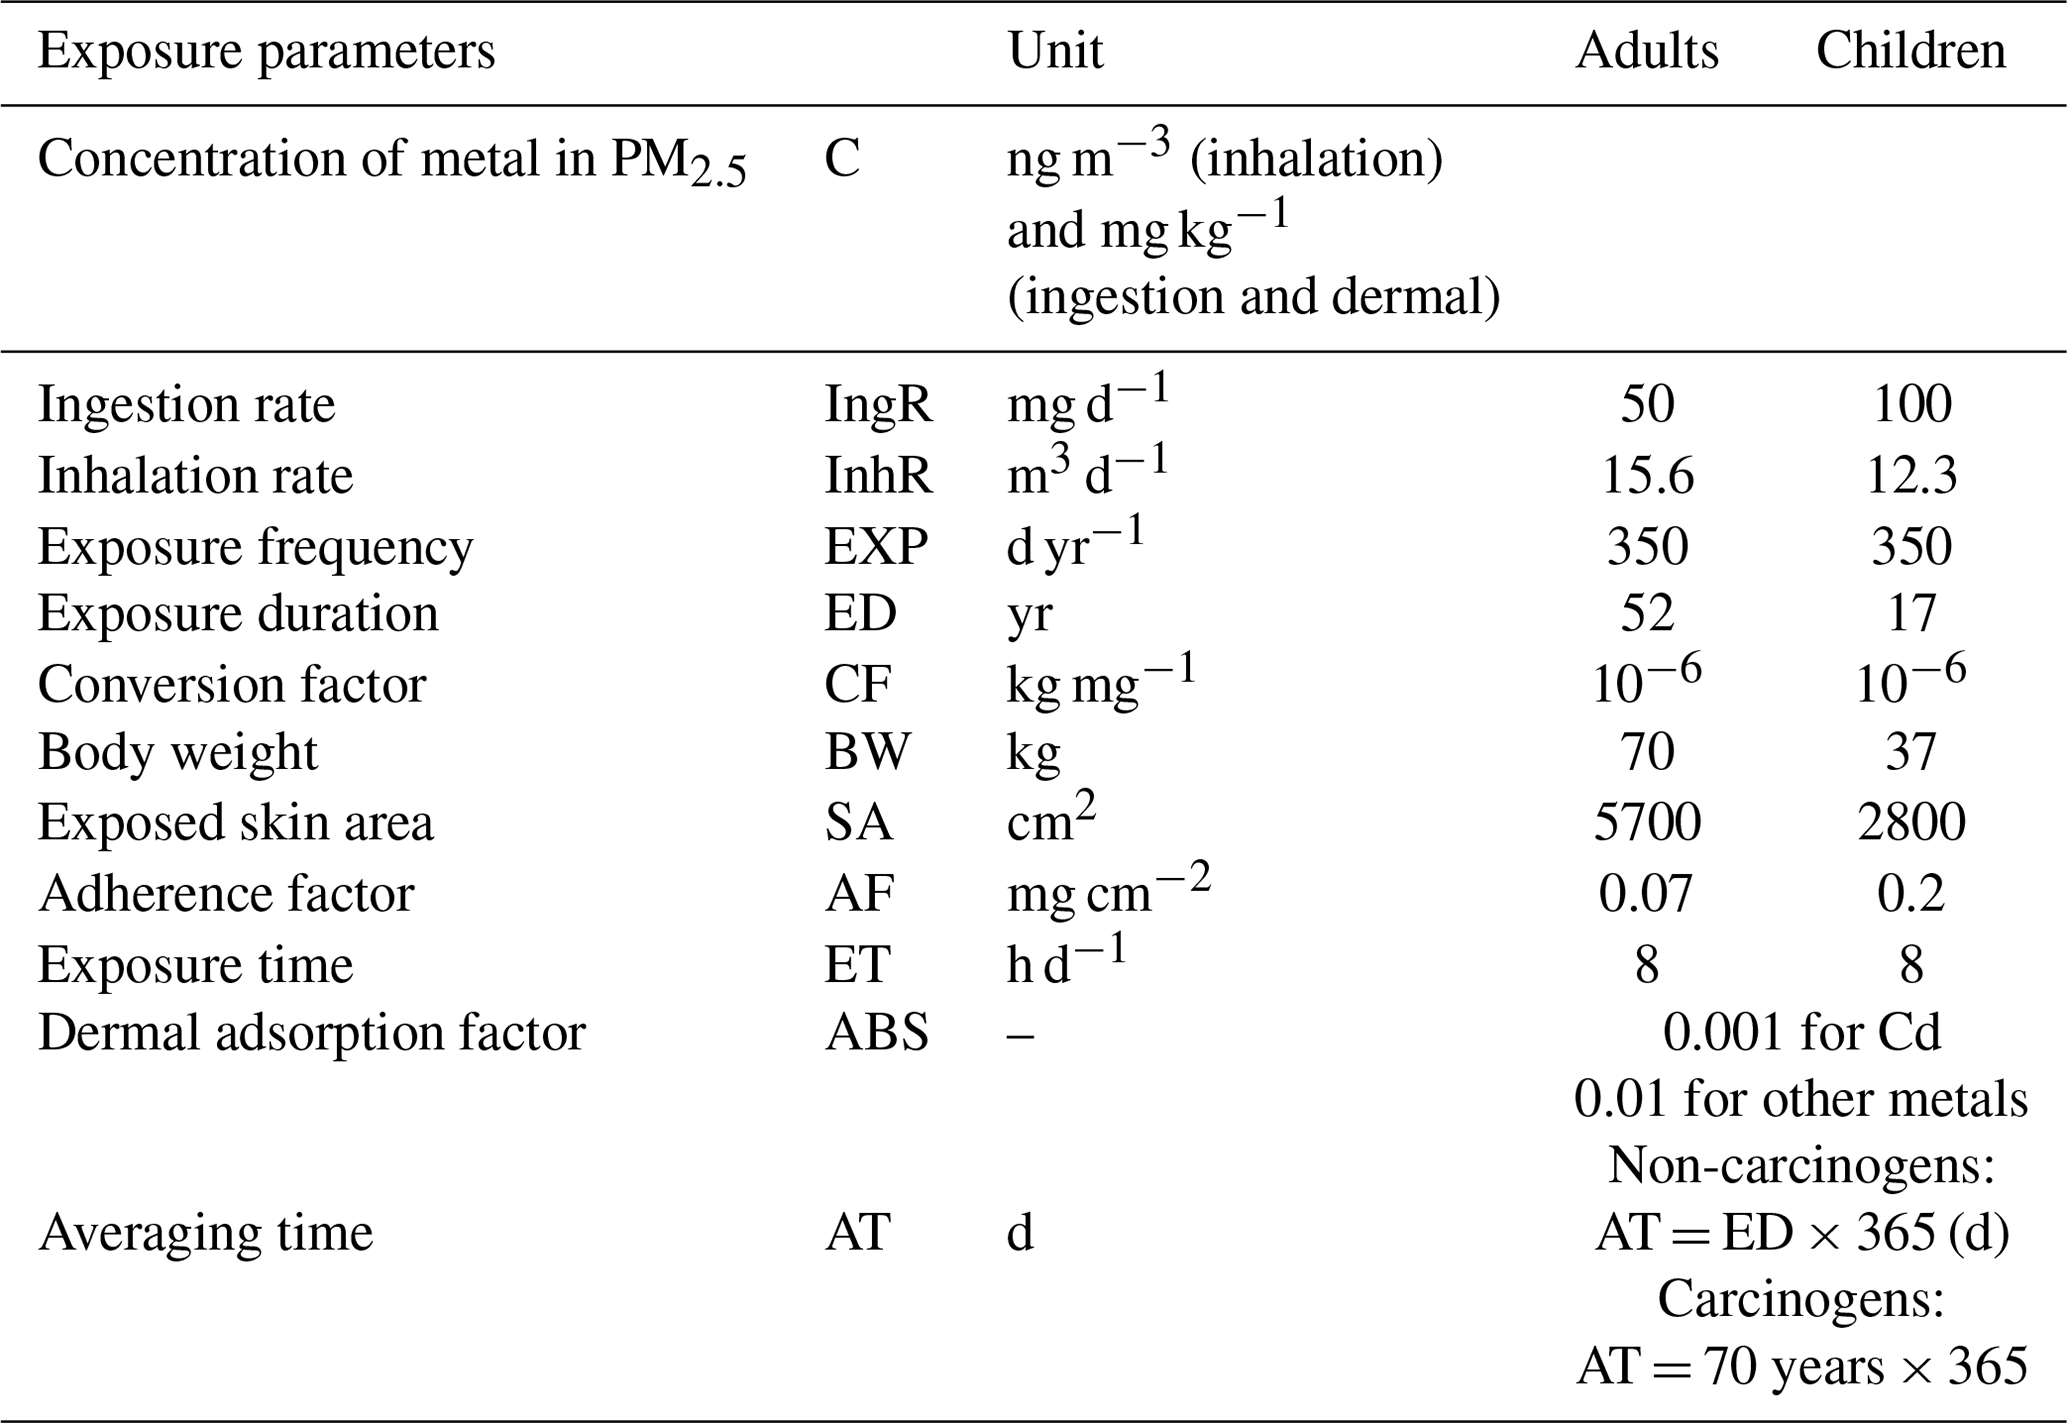
2.4 Health risk assessment
The United States Environmental Protection Agency (USEPA) recommends using a health risk assessment model to determine the health risks from airborne elements. For each of the three exposure pathways, namely inhalation, ingestion, and dermal contact, the carcinogenic and non-carcinogenic health risks were evaluated for children and adults using the measurements taken at the MTL site. This study analyzes the non-carcinogenic risks of Al, Fe, Cu, Zn, Sb, Co, Cr(VI), Ni, V, Cd, Pb, and Mn as well as the carcinogenic risk of Cr(VI), Co, Ni, V, Cd, and Pb. The average daily dose (ADD in mg kg−1 d−1) for children (0–17 years) and adults (18–70 years) for the three exposure pathways and the exposure concentration through inhalation (ECinhalation in mg m−3) were calculated following Eqs. (7)–(10) (Fadel et al., 2022a, b; Roy et al., 2019). Each of the parameters used in the various formulas are listed in Table 1 and were retrieved from USEPA reports (USEPA, 2004, 2011). Moreover, since chromium toxicity is attributed to its hexavalent state, Cr(VI) concentration was determined as one-seventh of total Cr (Dahmardeh Behrooz et al., 2021; Hao et al., 2020; Fadel et al., 2022b).
The hazard quotient (HQ), which is determined by dividing the ADD from each exposure pathway by a specified reference dose (RfD) (mg kg−1 d−1) for the same exposure route, can be used to measure the non-carcinogenic health risk effects from metals as presented in Eq. (11) (Fadel et al., 2022a, b; Hao et al., 2020). The non-cancer risk refers to the likelihood of developing health issues other than cancer as a result of exposure to chemical pollutants such as asthma, nervous system disorders, and cardiovascular and respiratory disorders (Fadel et al., 2022a).
To assess the overall potential for non-carcinogenic consequences produced by multi-element exposure for one exposure pathway, the hazard index (HIi) was calculated as the sum of the HQij (i is the exposure pathway which is either inhalation, ingestion, or dermal contact, and j is the targeted compound) (Eq. 12). HItotal represents the total hazard index . An HI value higher than 1 implies that the non-cancer risk merits attention and indicates that adverse health effects are likely to occur (Dahmardeh Behrooz et al., 2021).
The carcinogenic risks (CRs) are estimated using Eqs. (13)–(15), which refers to the probability that a person might develop a cancer over a lifetime because of exposure to a carcinogenic chemical (Dahmardeh Behrooz et al., 2021; Fadel et al., 2022a, b). According to the USEPA, a cancer risk value between 10−6 (1 additional case per 1×10⁶ people) and 10−4 (1 in 10 000) indicates that the carcinogenic risk is considered tolerable, while a value higher than 10−4 indicates that a serious risk of cancer exists (Bari and Kindzierski, 2016; Dahmardeh Behrooz et al., 2021). CRtotal represents the total carcinogenic risk .
In the equations above, CSF is the cancer slope factor for a chemical in a specific exposure pathway (mg kg−1 d−1) and IUR is the inhalation unit risk (m3 mg−1) (Table S1 in the Supplement).
2.5 Source apportionment
The USEPA PMF v5.0 software was used to identify and quantify the major emission sources in Montréal. PMF is a multivariate factor analysis tool that decomposes a data matrix X (n×m) into two matrices: source contributions G (n×p) and source profiles F (p×m), where n is the number of samples, m is the number of species, and p is the number of factors or sources. The PMF model requires the concentration dataset of the samples and associated uncertainty as inputs. The goal is to solve the chemical mass balance (Eq. 16) between the measured species concentrations and source profiles:
where xij is the concentration of the species j in the ith sample, gik is the contribution of the kth source in the ith sample, fkj is the relative concentration of species j from the source k, and eij is the residual of species j in the ith sample. The values of gik and fkj are adjusted until a minimum value of Q (Eq. 17) for a given number of factors p is found:
where e is the residual value and u is the uncertainty in a measurement. The residual value is the difference between the measured value and the PMF-modeled concentration of each compound. In the present work, samples below the detection limit (DL) were replaced by half of the DL and were given an uncertainty of 5/6 times the detection limit (Polissar et al., 1998). Missing samples were replaced by the median value of that species and were given an uncertainty of 4 times the median value (Polissar et al., 1998). When the concentration was greater than the DL, the uncertainty was calculated according to the USEPA guidelines (USEPA, 2014; Lee et al., 2022; Park et al., 2019): . After screening the integrity of the input data, 27 species were included in the PMF model. The overall number of samples (80 samples) and the number of species complies with the ratio of at least 3:1, as proposed by Belis et al. (2019). The species included were OC and EC, major water-soluble ions (Na+, Cl−, NH, NO, and SO, and a selection of elements (Al, Fe, Ti, Cu, Sb, Cd, and Co). Levoglucosan was included as a tracer for biomass burning, 17α[H]-21β[H]-Hopane as a tracer for vehicular emissions, fatty acids (hexadecanoic acid and octadecanoic acid) for cooking activities, a set of n-alkanes for biogenic (C27, C29) and anthropogenic emissions (C20, C21, C24, C25), and finally a dicarboxylic acid (oxalic acid) and α-pinene oxidation products (pinic acid and cis-pinonic acid) as tracers for SOA.
All the included species were defined from weak to strong in the PMF model based on their signal-to-noise ratio (). The PM species were classified as “bad” when the ratio was less than 0.2, “weak” when the ratio was between 0.2 and 2, and “strong” when the ratio was greater than 2 (Esmaeilirad et al., 2020). The bad species are excluded from the analysis, while the uncertainty for the weak species is tripled. PM2.5 was designated as a “total variable” and was automatically classified as “weak”. All the included species were successfully modeled by PMF with their concentrations reconstructed accurately and were qualified as “strong” except for nitrate, which presented a ratio of 0.9 and was defined as “weak”.
The final solution was selected based on several criteria such as (1) comparison of the resulting source profiles against the literature, (2) lack of correlation between the resolved factors, (3) correlation between the predicted vs. measured PM2.5 concentrations, (4) correlation between the modeled and measured species concentrations (R2 higher than 0.8), and (5) maximum individual mean (IM) and maximum individual standard deviation (IS) (Fig. S1). The R2 between the reconstructed and measured PM2.5 mass was 0.87 (slope = 0.90) (Fig. S2). The robustness of the PMF solution was tested by the two-error estimation method (bootstrap and displacement) as instructed in the PMF manual to ensure the solution was stable (Table S2) (USEPA, 2014).
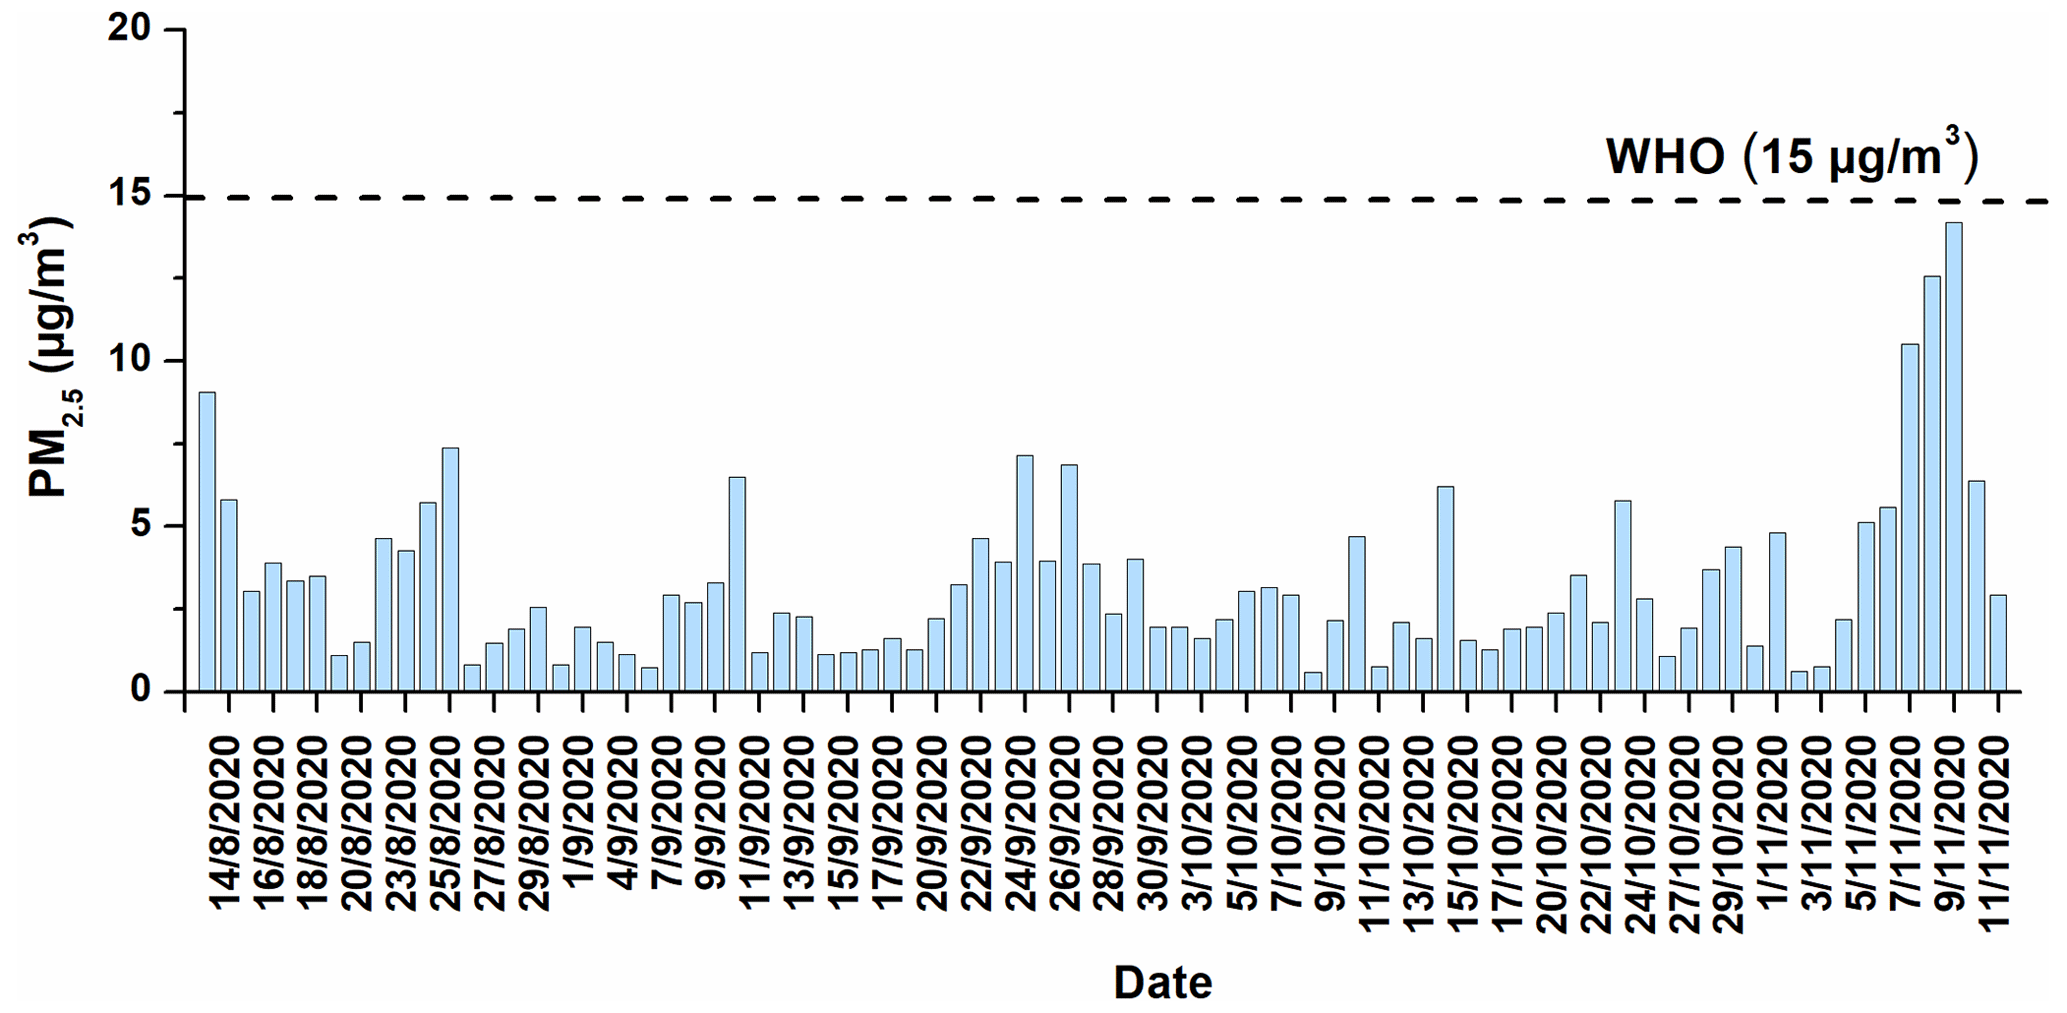
Figure 1The temporal variation of PM2.5 concentrations for the sampling period (13 August to 11 November 2020).
2.6 GEOS-Chem simulations
Simulations were performed using the GEOS-Chem chemical transport model (version 14.0.1, doi:10.5281/zenodo.7271960) (Bey et al., 2001; Park et al., 2004). GEOS-Chem is driven by assimilated meteorology from the Modern-Era Retrospective analysis for Research and Applications, Version 2 (MERRA-2), at the NASA Global Modeling and Assimilation Office (GMAO). The atmosphere was resolved using 47 vertical layers from the surface to 0.01 hPa. The vertical resolution of the model is about 100 m near the surface, but it becomes coarser at higher altitudes. Boundary conditions were generated using a global simulation at 2∘ latitude × 2.5∘ longitude resolution. A nested grid is then used with 0.5∘ latitude × 0.625∘ longitude resolution, spanning 35 to 65∘ N, 90 to 50∘ W (Fig. S3) in order to include the full province of Quebec as well as the strong source regions of the Great Lakes region and the northeastern US. We use the recently developed treatment of wet scavenging described by Luo et al. (2020, 2019), which has been previously shown to yield better agreement for nitrate and ammonium concentrations over eastern North America.
Biomass burning emissions were simulated from the Copernicus Atmosphere Monitoring Service Global Fire Assimilation System (GFAS, Kaiser et al., 2012). We used global emissions from the Community Emissions Data System version 2 (CEDS v2, O'Rourke et al., 2021; Hoesly et al., 2018), except where overwritten by regional emissions inventories, as described in Keller et al. (2014). These regional emissions inventories included anthropogenic emissions from the US and most of Canada up to 54∘ N, provided by the National Emissions Inventory for 2016 (EPA, 2021a), with annual scaling factors to account for changes in emissions since 2016 (EPA, 2021b). Shipping emissions were provided by CEDS v2, and aircraft emissions were provided by the Aviation Emissions Inventory Code (AEIC, Stettler et al., 2011; Simone et al., 2013). Anthropogenic emissions of fine dust aerosols were from the Anthropogenic Fugitive, Combustion, and Industrial Dust (AFCID) inventory (Philip et al., 2017), while natural dust emissions were calculated according to the Mineral Dust Entrainment and Deposition (DEAD) parameterization (Zender, 2003). Formation of SOA was parameterized using the “simple” SOA scheme that treats all organic aerosol as non-volatile, as described in Pai et al. (2020). It has been shown to reproduce observed organic aerosol concentrations with similar skill to a more complex scheme. GEOS-Chem resolves mineral dust in four size bins spanning radii of 0.1–1.0, 1.0–1.8, 1.8–3.0, and 3.0–6.0 µm. In this study, the concentration of dust in particles smaller than 2.5 µm in diameter is estimated by adding 38 % of the concentration of dust in the 1.0–1.8 µm size bin to the concentration of dust in the 0.1–1.0 µm size bin (Fairlie et al., 2010; Zhang et al., 2013).
GEOS-Chem has previously been evaluated against NO2 concentrations from the USEPA Air Quality System sites (Silvern et al., 2019); satellite observations of aerosol optical depth, speciated aerosol concentrations from aircraft measurements over the United States (US), speciated surface observations from the USEPA Chemical Speciation Network (CSN), Interagency Monitoring of Protected Visual Environments (IMPROVE), and the Southeastern Aerosol Research and Characterization (SEARCH) network (Kim et al., 2015); and ozone concentrations from the Clean Air Status and Trends Network (CASTNET, Reidmiller et al., 2009). In all cases, GEOS-Chem has been shown to adequately resolve emissions, atmospheric processes, and large-scale transport. The model performance was evaluated against the observations presented in this study, and good correlation with the observed values was obtained (R=0.24–0.76) (Table S3). Some of the indicators are not within the acceptable limits (Abdallah et al., 2018), and this is likely because of the vertical and horizontal resolution of the model. Thus, the PMF results and the model outputs will be compared qualitatively. Furthermore, GEOS-Chem results have been previously used for source contribution analysis similar to the analysis presented in this study (Meng et al., 2019).
In order to examine the sensitivity of air pollutant concentrations to contributions from source regions, a base-case simulation is performed along with three sensitivity simulations, each with anthropogenic emissions from a geographic region turned off: noQC, noCA, and noUS. In the noQC simulation, anthropogenic emissions within the borders of the province of Quebec are not allowed. In the noCA simulation, anthropogenic emissions within the borders of Canada are not allowed, except for emissions from the province of Quebec (rest of Canada, RoC). In the noUS simulation, anthropogenic emissions within the borders of the contiguous US are not allowed. Emissions from shipping and aircraft are removed within the boundaries of the specified region, but emissions from biomass burning or natural sources are not changed. We note that for the purposes of masking emissions, each model grid cell is considered to be entirely within one province or country; the resolution of the provincial or national masks is the same as the model resolution. By calculating the differences in the concentrations of PM components in the sensitivity simulations compared to the base-case simulation, we qualitatively evaluate the proportions of air pollutants in Quebec due to sources within Quebec, sources in the RoC, and sources in the contiguous US.
3.1 PM2.5 concentrations
The average PM2.5 concentration (and standard deviation) at the MTL site was 4±3 µg m−3. The concentration of PM2.5 in all samples collected at the MTL site was lower than the daily standard set by the WHO (15 µg m−3) (WHO, 2021) and the Canadian daily standard of 27 µg m−3 (EAR, 2019) (Fig. 1). The PM2.5 levels at the MTL site can be compared against nearby government monitoring stations to understand if there are large differences in concentrations and how concentrations have changed over recent years in this area of Montréal. The average concentrations at the MTL site were lower than that reported during the same sampling period at the Décarie station (6.6 µg m−3) located ∼ 5 km southwest of the MTL site near an intersection of two major highways (Fig. 2). Given that the Décarie station is strongly impacted by vehicle emissions, this difference is not surprising. In contrast, the average PM2.5 concentration at the MTL site is similar to that recorded at the Molson station (NAPS ID: S50134; ∼ 4 km northeast of MTL) (4.7 µg m−3), which is located in a mixed residential and industrial zone for the same sampling period. Furthermore, there is a general decreasing trend between 2017 and 2020 in PM2.5 levels at the government monitoring stations. Since the concentration of PM2.5 in 2020 was not too different in comparison with the previous years (2018 and 2019), the sources of PM2.5 identified in this study are likely to be similar to other years. It is important to mention that during our sampling period, Montréal was in partial lockdown, and public spaces (e.g., bars, gyms, cinemas, museums, libraries, and casinos) were closed due to the possibility of a second wave of the COVID-19 pandemic. Primary schools and some secondary schools were opened during that period. While these considerations suggest that the results presented here are also applicable to pre- and post-pandemic conditions, further studies are needed before generalizing the results of this study to other periods.
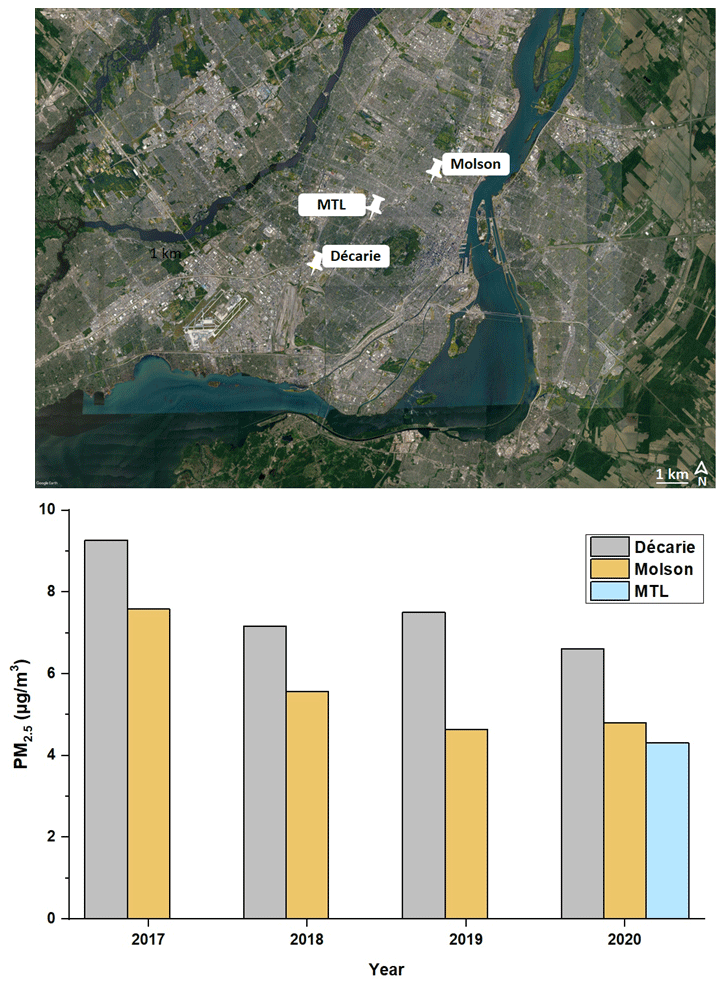
Figure 2PM2.5 concentrations for the sampling period (13 August to 11 November 2020) at the MTL site and for the Décarie and Molson sites between 2017 and 2020 along with the location of the sampling sites (©Google Earth). For the Décarie and Molson sites, the data correspond to the same dates of the year (13 August to 11 November).
3.2 Carbonaceous matter
The average OC and EC concentrations (± standard deviation) were 1.31±0.76 µg m−3 and 0.17±0.15 µg m−3, respectively (Table 2). While EC originates from combustion sources and has a primary origin, OC can be directly emitted from combustion of fossil fuels, biomass burning, and cooking activities, and it can also be formed in the atmosphere through chemical reactions (Hallquist et al., 2009). The ratio is a useful diagnostic ratio that provides information on the sources in PM2.5. An ratio ranging between 0.3 and 1 was reported for diesel vehicles, a ratio between 1.4 and 5 was reported for gasoline operated vehicles, and a larger ratio ranging between 4.1 and 14.5 was reported for biomass burning (Khan et al., 2021; Salameh et al., 2015). In this study, the ratio of was 7.4±3.1, which is larger than those associated with vehicular emissions and consistent with the presence of biomass burning. Indeed, wood burning may be an important source of air pollutants in Quebec, and wood-burning stoves and fireplaces are used in both residential and businesses settings (e.g., pizzerias and bagel factories). The production of secondary organic carbon will also increase ratios beyond values measured for primary sources. Indirect methods have been developed for identifying primary organic carbon (POC) or secondary organic carbon (SOC) (Shivani et al., 2019; Calvo et al., 2008; Joseph et al., 2012).
One such method is summarized in Eq. (18), OCtotal is the measured OC and ()min is the minimum ratio observed in the samples. Additional information on the calculation method is included in the Supplement. Using this method, the average contribution of SOC to the total OC and the standard deviation was 61±15 % at the MTL site, indicating a strong SOC contribution.
3.3 Organic species
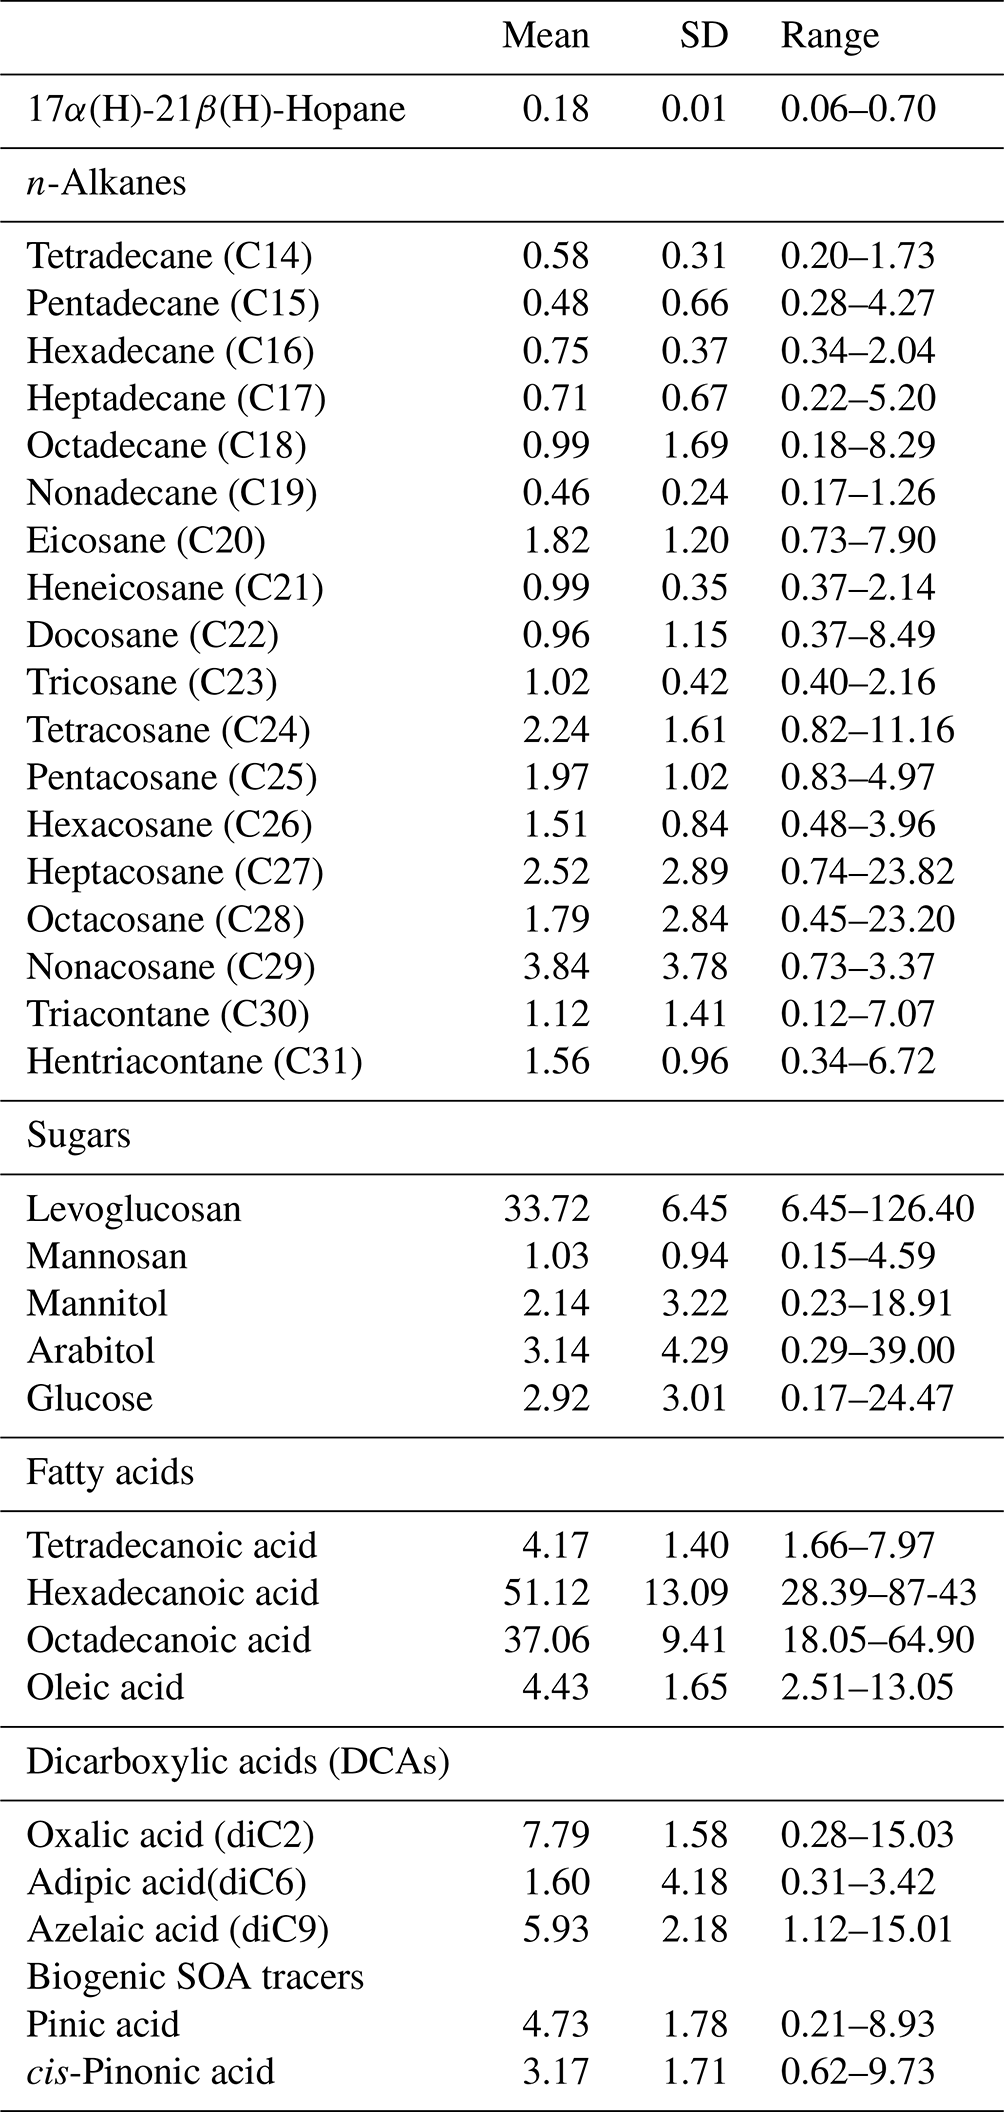
Some organic compounds are specific to a certain source and have been used in source apportionment studies as molecular markers. The average concentrations of selected organic compounds in PM2.5 measured at the MTL site are summarized in Table 3. Levoglucosan, generated by the pyrolysis of cellulose and often utilized as a particular marker of biomass burning (Simoneit, 2002), was the most abundant compound among the organic tracers examined. Due to its presence in lubrication oil used in both gasoline and diesel vehicles, 17α(H)-21β(H)-Hopane is a specific marker of traffic emissions, and it was the least prevalent measured organic species in the PM2.5 (El Haddad et al., 2009; Fadel et al., 2021). Arabitol and mannitol were well correlated (R=0.98; p<0.001) and are commonly described as markers for primary biogenic emissions, more specifically with fungal spores (Petit et al., 2019). Alkanes, specifically acyclic saturated hydrocarbons, can originate from both biogenic and anthropogenic sources. The n-alkane with the highest concentration was C29. In the literature, low-molecular-weight n-alkanes (< C27) are primarily associated with traffic emissions, whereas high-molecular-weight n-alkanes (C27, C29, C31) are associated with plant detritus because they are abundant in the epicuticular wax of plants (Rogge et al., 1993a, b).
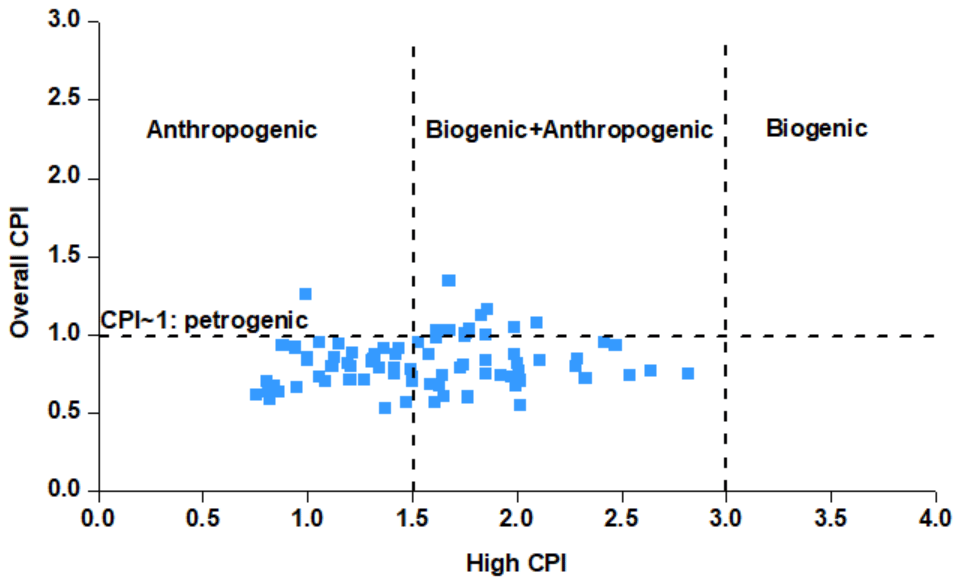
To further evaluate the contribution of the anthropogenic and the biogenic sources to n-alkanes, the carbon preference index (CPI) was calculated (Fadel et al., 2021; Esmaeilirad et al., 2020). Two CPI parameters were adopted: the “overall CPI” for the whole range of n-alkanes (C15–C30) and the “high CPI” for the higher-molecular-weight n-alkanes (C25–C30). The detailed description of the calculation method is included in the Supplement. The average “overall CPI” value was 0.86±0.21, indicating the contribution of petrogenic sources. The “high CPI” values during the entire campaign were between 0.74 and 2.81, with a majority of the measurements in the anthropogenic range and the rest in the mixed anthropogenic–biogenic range (Fig. 3). The average “high CPI” was 1.56±0.48, indicating that larger n-alkanes at the MTL site are predominately anthropogenic with a lesser biogenic contribution.
Table 2Concentrations of major and trace components of PM2.5 measured at the MTL site.
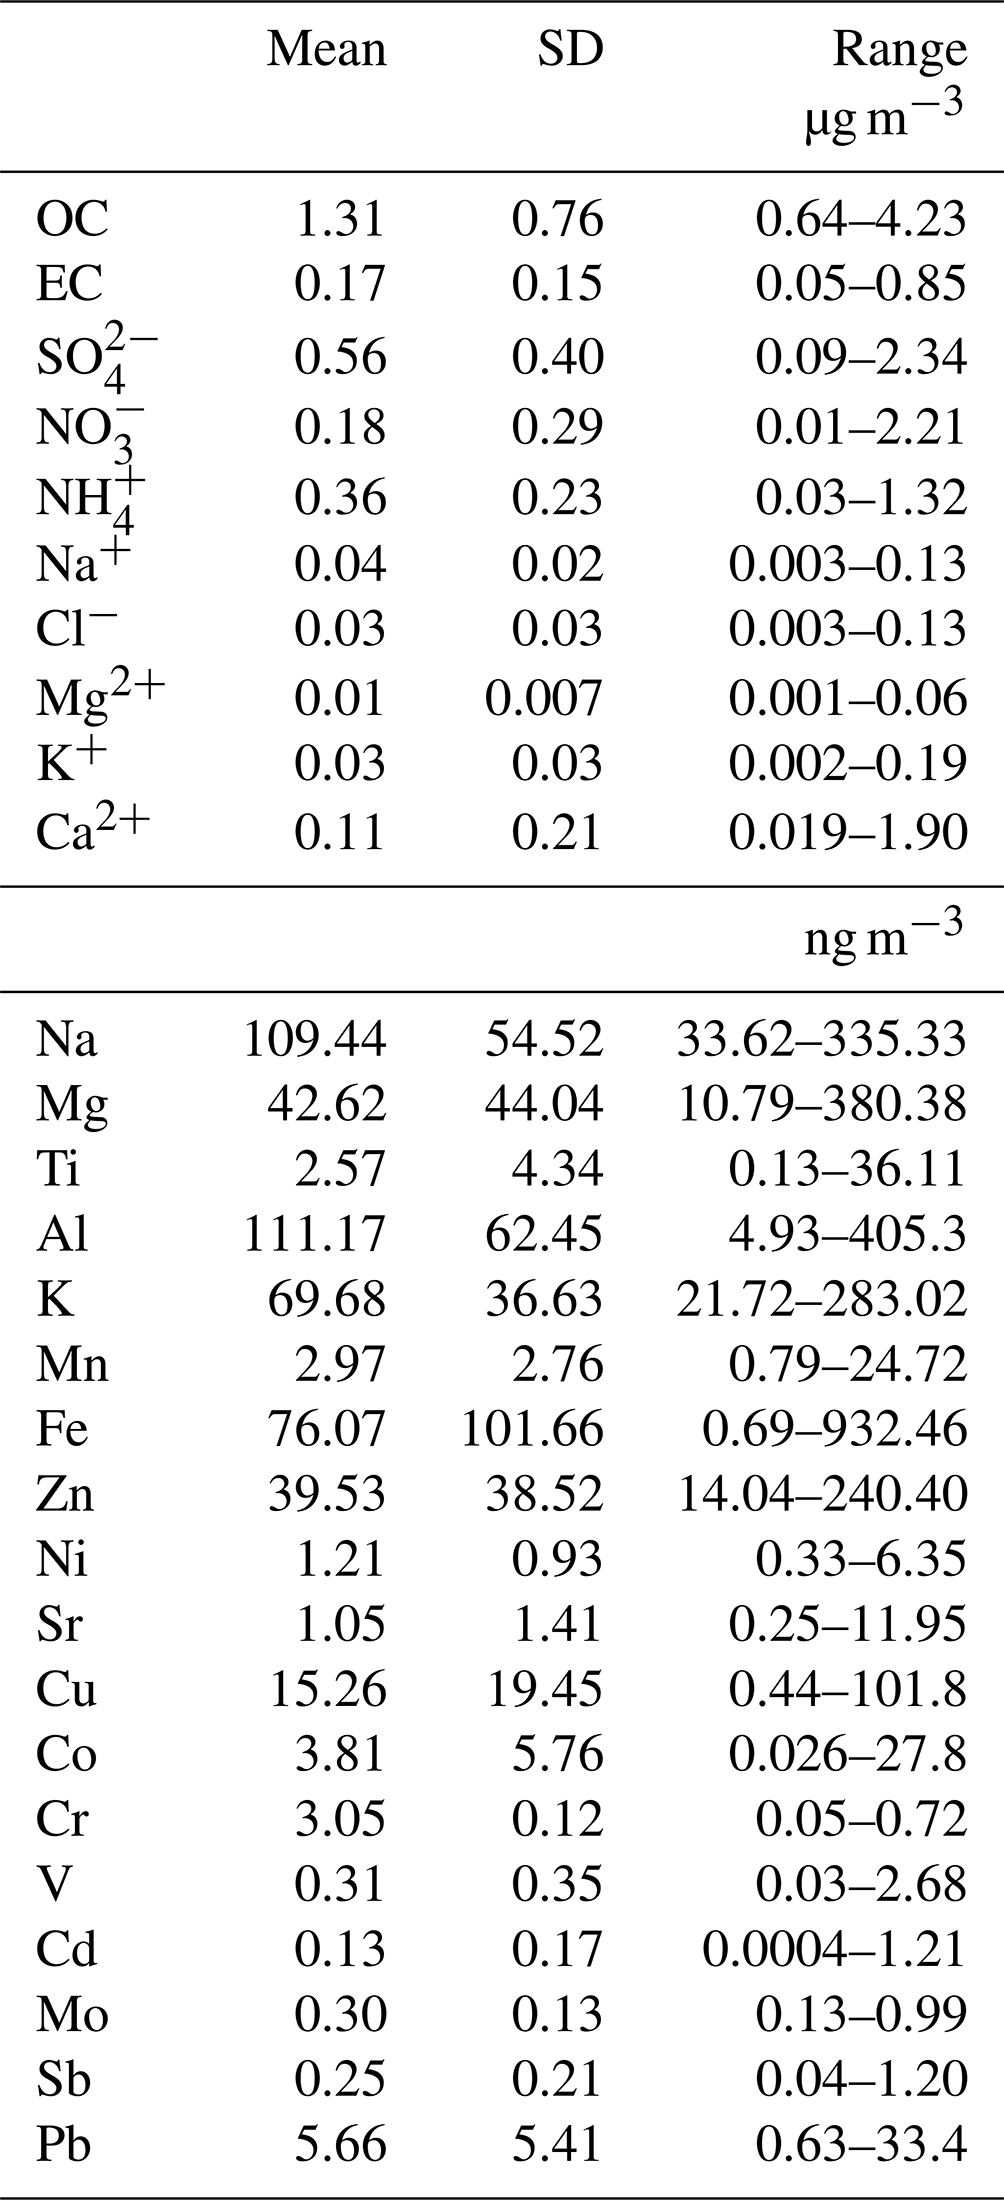
Table 3Average concentrations (ng m−3) of organic compounds in PM2.5.
3.4 Elemental composition
The relationship between trace metals provides qualitative information on the sources of the measured elements. A significant correlation (R>0.95, p<0.05) was observed among Ti, Fe, Mg, V, K, Mn, and Na, indicating a common crustal source. Numerous studies have analyzed the chemical composition of traffic-related PM and have reported that Cu, Sb, and Cd are linked to non-exhaust emissions, more precisely from vehicular brake wear (Thorpe and Harrison, 2008; Lin et al., 2015; Pio et al., 2013; Mancilla and Mendoza; Pant and Harrison, 2013). In this study, a correlation of R=0.82 (p<0.05) was found between Sb and Cd, indicating that Sb and Cd originate from the same sources, most probably brake wear. Studies in other Canadian cities, namely Toronto and Vancouver, have also associated the elements Sb and Cd with non-exhaust emissions from road traffic (Celo et al., 2021). No correlation was found between Cu and the elements Cd and Sb (R<0.01, p<0.05), indicating that brake-wear debris was not an important source of Cu in Montréal.
Additionally, Co was correlated with Cr (R=0.79, p<0.01) and Cu (R=0.86, p<0.05), suggesting a common source from industrial emissions, similar to observations in Edmonton, Canada (Bari and Kindzierski, 2016). The Canadian Copper Refinery and Suncor Energy refinery can be identified as potential sources of Cr and Co in the Montréal region based on the National Pollutant Release Inventory (NPRI) data published by the Government of Canada (NPRID, 2022). It is important to mention that Cu, Cr, and Co could also originate from other sources such as traffic-related emissions and coal combustion (Riffault et al., 2015; Bari and Kindzierski, 2016; Thorpe and Harrison, 2008; Celo et al., 2021). However, these possibilities seem less important given the correlations between the elements as well as the lack of coal combustion in the province of Quebec. Lastly, no correlation was found between Zn, Pb, and Sb with Cl− (R<0.09, p<0.05), revealing that incinerators are not a potential source of these trace elements (Riffault et al., 2015; Rahn and Huang, 1999).
3.5 Water-soluble ions
Among the water-soluble ions, SO presented the highest concentration followed by NH, NO, Ca2+, Na+, Cl−, and K+, and the species with the lowest concentration was Mg2+. The secondary inorganic aerosol components (sulfate, ammonium, and nitrate) accounted for 83 % of the total water-soluble ions and 32 % of the total PM2.5 mass (Fig. S5). The presence of secondary sulfate is supported by the strong correlation between sulfate and ammonium with a Pearson coefficient of 0.90 (p<0.005). This result, and the weak correlation between ammonium and nitrate (R=0.27, p<0.002), suggests that a significant fraction of ammonium in PM2.5 was associated with ammonium sulfate with a limited amount of ammonium nitrate. Nitrate concentrations were higher in the end of October and November in comparison with the warmer months (Fig. S6), consistent with a shift in equilibrium partitioning from gas-phase nitric acid to the particle-phase nitrate due to colder temperatures (Geng et al., 2013; Mantas et al., 2014). The total ammonium/total sulfate () molar ratio was used to evaluate if the site conditions were ammonia-rich (> 2) or ammonia-poor (< 2) (Joseph et al., 2012; Remoundaki et al., 2013). The molar ratio was 1.24, highlighting that the concentrations of ammonium are not sufficient to neutralize the concentrations of sulfate and nitrate. Therefore, the latter anions could be associated with different cations such as Na+, Mg2+, K+, and Ca2+ and the formation of salts with these cations (e.g., NaNO3, MgSO4). Moreover, when considering the neutralization of all the cations (Na+, Mg2+, NH, K+, Ca2+) by all the anions (SO, NO, Cl−), the scatter plot (Fig. S7) presented a slope of 0.98, indicating a charge balance between the anions and cations.
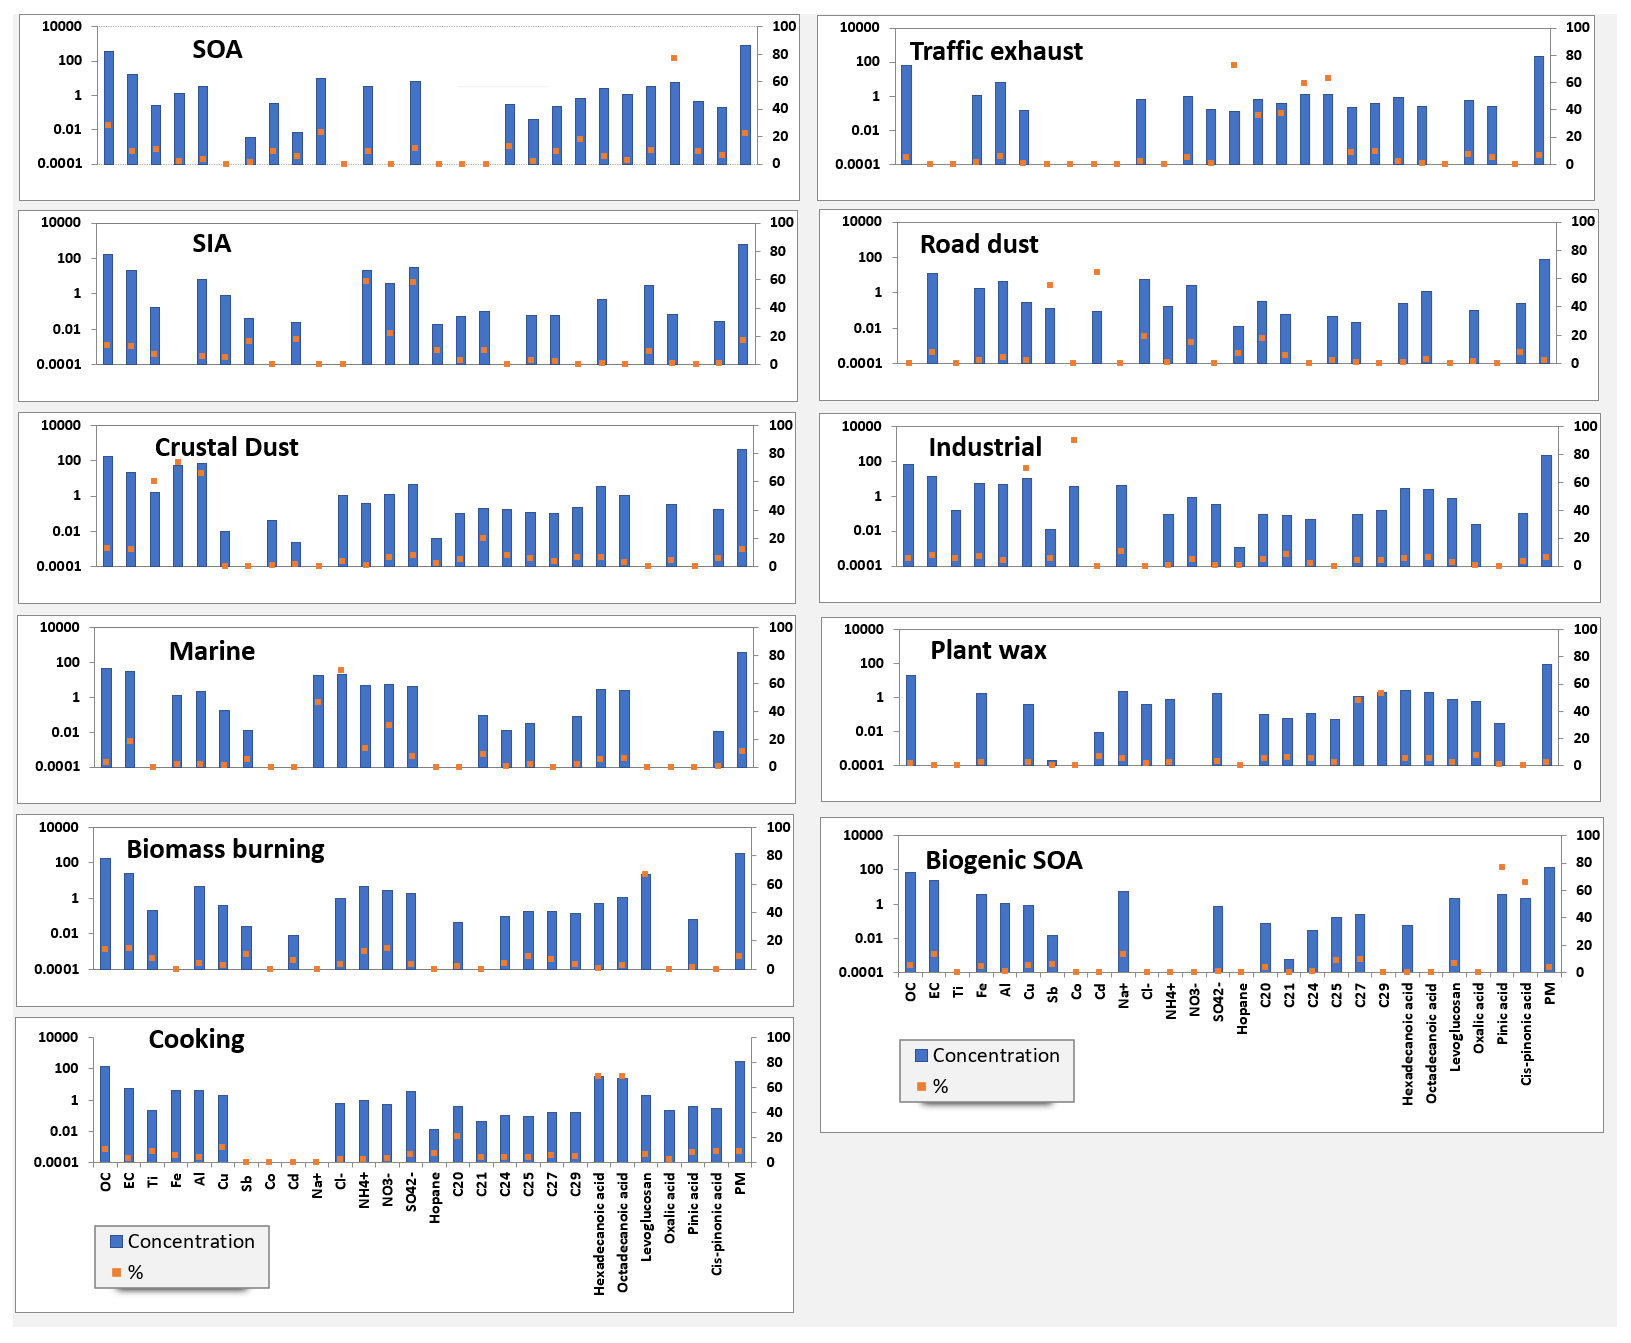
Figure 4Profiles of the 11 factors identified from the PMF model. The left axis corresponds to the concentration of each species (blue bars), and the right axis corresponds to the percentage of each species (orange markers). Units of concentration are nanograms per cubic meter (ng m−3).
3.6 Source apportionment of PM2.5
3.6.1 Source identification
The source profiles obtained from the PMF model are presented in Fig. 4. Eleven sources were identified at the MTL site, namely SOA, secondary inorganic aerosol, crustal dust, marine, biomass burning, cooking, traffic exhaust, road dust, industrial, plant wax, and biogenic SOA. The species with the highest loadings were used to identify each factor, and comparison to source profiles found in the literature served as confirmation.
The SOA factor was distinguished with high loading of oxalic acid (75 % of the total concentration of oxalic acid) and contributed to 22 % of the PM2.5 mass concentration (Petit et al., 2019). Oxalic acid is a byproduct of oxidation from various precursors including biogenic (e.g., isoprene) and anthropogenic (e.g., cycloalkanes) compounds, and it is also generated from the photochemical oxidation of larger acid homologues (Srivastava et al., 2019).
The secondary inorganic aerosol (SIA) factor was distinguished by the presence of the water-soluble ions SO (58 %) and NH (59 %). This factor accounted for 17 % of the total PM2.5. No trend was observed in the time series of this factor, and this source can originate from both local emissions and long-range transport (LRT) originating from the rest of Canada (e.g., Ontario) and the United States (Seinfeld and Pandis, 2016; NPRID, 2022). Aluminum production and industrial processes related to metallurgy and all other minor sources contributed to ∼ 90 000 t of SO2 in Quebec in 2020, which consists of 15 % of the total Canadian emissions (583 008 t) (NPRID, 2022). However, based on the weak correlation between sulfate and Al and strong correlation of Al with crustal elements, we believe that aluminum production is not an important source of particulate aluminum at our site.
The crustal dust factor was identified by high loadings of Al (68 %), Fe (76 %), and Ti (63 %). This factor accounted for 12 % of the total PM2.5 and is likely associated with crustal dust sources such as wind-driven resuspension, construction, and agricultural activities (Bari and Kindzierski, 2016). All of these crustal dust sources are plausible given that construction is omnipresent in Montréal, and the surrounding St. Lawrence Valley has a large amount of agriculture.
A marine factor was characterized by the ions Na+ (46%), Cl− (69 %), and NO (30 %), contributing to 11 % of the PM2.5. The calculated for this factor was 0.95, which is lower than the ratio of 1.80 reported for fresh sea salt and is indicative of aged sea salt (Petit et al., 2019; Seinfeld and Pandis, 2016). The presence of high nitrate loading in the profile further confirms the presence of aged marine salt. The observed chloride depletion is due to the reaction of nitric and sulfuric acid with NaCl particles (Seinfeld and Pandis, 2016). While the factor has been tentatively identified as “marine”, there is some evidence that this factor may originate, at least partially, from road salt. The marine factor exhibits relatively high concentrations for multiple wind directions, including from the west and southwest (Fig. S10), and thus the marine factor pollution rose resembles to some extent that of road dust. It is also notable that the marine factor exhibits its highest concentrations in November when minimum temperatures were below freezing and some snowfall occurred. Based on these findings, we suggest that further work is needed to evaluate the contribution of road salt to PM2.5 in Montréal. Biomass burning was identified by high loadings of levoglucosan (70 %) (Fadel et al., 2023). The in this factor was 8.4, consistent with biomass burning (Khan et al., 2021). This source accounted for 9 % of the total PM2.5 mass. Levoglucosan is a major pyrolysis product of cellulose and hemicellulose (Simoneit, 2002) and has been used as a molecular marker of biomass burning aerosols in several source apportionment studies (Gadi et al., 2019; Shivani et al., 2019). No trend was observed in the time series of this factor with season or temperature, indicating that levoglucosan originates from both residential burning and forest fires.
A cooking emissions factor was identified based on the contribution of hexadecanoic (65 %) and octadecanoic acids (68 %) in the profile and accounted for 9 % of the total PM2.5 mass. These carboxylic acids have been used in source apportionment studies to distinguish cooking activities (Gadi et al., 2019; Lv et al., 2021; Shivani et al., 2019).
The traffic exhaust factor was identified by the presence of 17α[H]-21β[H]-Hopane and lower-molecular-weight n-alkanes (C20 to C25) and accounted for 6 % of total PM2.5 mass concentration. Hopanes are specific markers of traffic emissions due to their presence in lubrication oil (Rogge et al., 1993a; Schauer et al., 2002). Furthermore, dynamometer test results showed that the most abundant n-alkanes were C20 and C21 for diesel vehicle emissions and C24–C25 for gasoline-powered vehicle emissions (Rogge et al., 1993a), and these compounds are commonly associated with motor vehicle emissions. This traffic exhaust factor contributed around 72 % of the hopane mass in the model, 59 % of the C24 mass, and 62 % of the C25 mass. We suggest that the traffic emission factor is comprised principally of primary exhaust emissions given the lack of secondary tracers in the factor profile.
The road dust factor was characterized by high loadings of Cd (69 %) and Sb (58 %) and accounted for 2 % of PM2.5. These elements are linked to non-exhaust vehicle emissions, particularly from brake-wear debris (Thorpe and Harrison, 2008; Lin et al., 2015). Upon close examination of the PMF factor profiles, one notices some very small mixing of the traffic exhaust, road dust, and crustal dust factors, which is a limitation of this study. However, the amount of mixing is very minor and should not impact the conclusions drawn from these results. In this study, PMF allocated 76 % of Fe and 68 % of Al to the crustal dust factor. In comparison, only 2 % of Fe was allocated to the road dust factor, while the amount of Al was 4 %. Moreover, for the traffic exhaust factor, these values were 2 % and 6 % for Fe and Al, respectively. It is also possible that these metals are truly associated with the identified sources. Previous literature has found Fe- and Al-containing particles in vehicle exhaust (Golokhvast et al., 2015; Wang et al., 2021). It is also logical that road dust would contain some crustal elements. The industrial emissions factor was dominated by Cu and Co and contributed 70 % and 90 % of the mass of these elements, respectively, and accounted for 6 % of PM2.5. These elements are emitted from metal-industry-related sources and coal combustion (Riffault et al., 2015; Bari and Kindzierski, 2016; Sharma and Mandal, 2017), but coal is not used for electricity generation in Quebec, and thus industrial sources seem more likely to be responsible for this factor.
The plant wax factor was characterized by high loadings of C27 and C29 with 55 % of the C27 and 58 % of the C29 apportioned to this factor (Fadel et al., 2023). These compounds have been previously linked to primary biogenic emissions (Rogge et al., 1993b). This factor contributed to 2 % of the total PM2.5.
Finally, the biogenic SOA factor accounted for 75 % of the measured pinic acid and 66 % of the measured pinonic acid and accounted for 4 % of PM2.5. α-Pinene is one of the most atmospherically important compounds in the monoterpene family, and pinic acid and pinonic acid are derived from the photooxidation of α-pinene with ozone (O3) and hydroxyl (OH) radicals (Fadel et al., 2021). Although it is uncommon to see these species included in PMF models, doing so provides insight into how much biogenic SOA contributes to PM2.5 mass concentration. A small percentage of Cu, Sb, and Fe are attributed to biogenic SOA. Specifically, Fe, Sb, and Cu were 5 %, 6 %, and 5 %, respectively. Fe was allocated in much higher proportion to the crustal dust factor, Sb to the road dust factor, and Cu to the industrial factor. Our PMF analysis is consistent with a study reported by Fadel et al. (2023). Fadel and coworkers also included biogenic SOA tracers in the PMF analysis, and in their biogenic SOA profile one also notices small amounts of metals/elements.
3.6.2 Source contribution to PM2.5
One of the originalities of the present study relies on the identification of primary and secondary biogenic and anthropogenic sources based on the inclusion of selected organic markers in the PMF model, namely n-alkanes, anhydrosugars, a hopane, fatty acids, dicarboxylic acids, and biogenic secondary organic aerosol tracers. Of a total of 11 sources, the addition of organic markers allowed the identification of 4 of them, namely SOA, cooking, plant wax, and biogenic SOA.
When the PM2.5 sources identified in this study were compared to other source apportionment studies conducted in major urban areas in Canada (Bari and Kindzierski, 2016; Jeong et al., 2011; Celo et al., 2021) where NAPS PM2.5 chemical speciation datasets were used as inputs, this work resolved additional primary and secondary biogenic and anthropogenic sources due to the inclusion of a large suite of organic markers in the PMF model that were not available previously. The additional sources identified, namely SOA, BSOA, plant wax, and cooking emissions, are also rarely apportioned in the literature (Gadi et al., 2019; Lv et al., 2021).
There are also important differences between the source profiles for vehicular emissions in this study versus previous source apportionment studies conducted in Canada. In Montréal, for example, Jeong et al. (2011) identified a traffic emission factor based on the contributions of OC, EC, and oxalate. On the other hand, the traffic factor was identified in Edmonton based on the contribution of Ba, Sb, EC, Cu, and Co (Bari and Kindzierski, 2016). Since trace elements and carbonaceous matter could be emitted from a variety of sources, this study refined the evaluation of vehicular sources by incorporating two source-specific organic tracers in the PMF model, namely n-alkanes and a hopane. This allowed the differentiation of exhaust and non-exhaust emissions.
The PMF results indicate that SOA and SIA were the largest contributors to fine PM and together constituted 39 % (1.68 µg m−3) of the measured PM2.5 mass (Fig. 5). The primary local urban anthropogenic sources, namely traffic exhaust, road dust, and industrial and cooking emissions, contributed to 23 % (0.99 µg m−3) of the measured PM2.5 mass. These sources along with crustal dust, biomass burning, and plant wax comprise the primary aerosol fraction that is 44 % (1.94 µg m−3) of the measured PM2.5 mass. It should also be noted that residential burning likely contributes to the biomass burning factor, but this factor is not included with the primary local urban anthropogenic sources listed above since it is not possible to distinguish residential burning from wildfires in our PMF analysis. Pollution rose plots (Fig. S10) were used to analyze the correlations between wind direction and factor concentrations by plotting in a polar graph the frequency of different concentrations of a factor as a function of wind direction. Such analyses provided information on the potential local origin of the factors. Additional information is included in the Supplement.
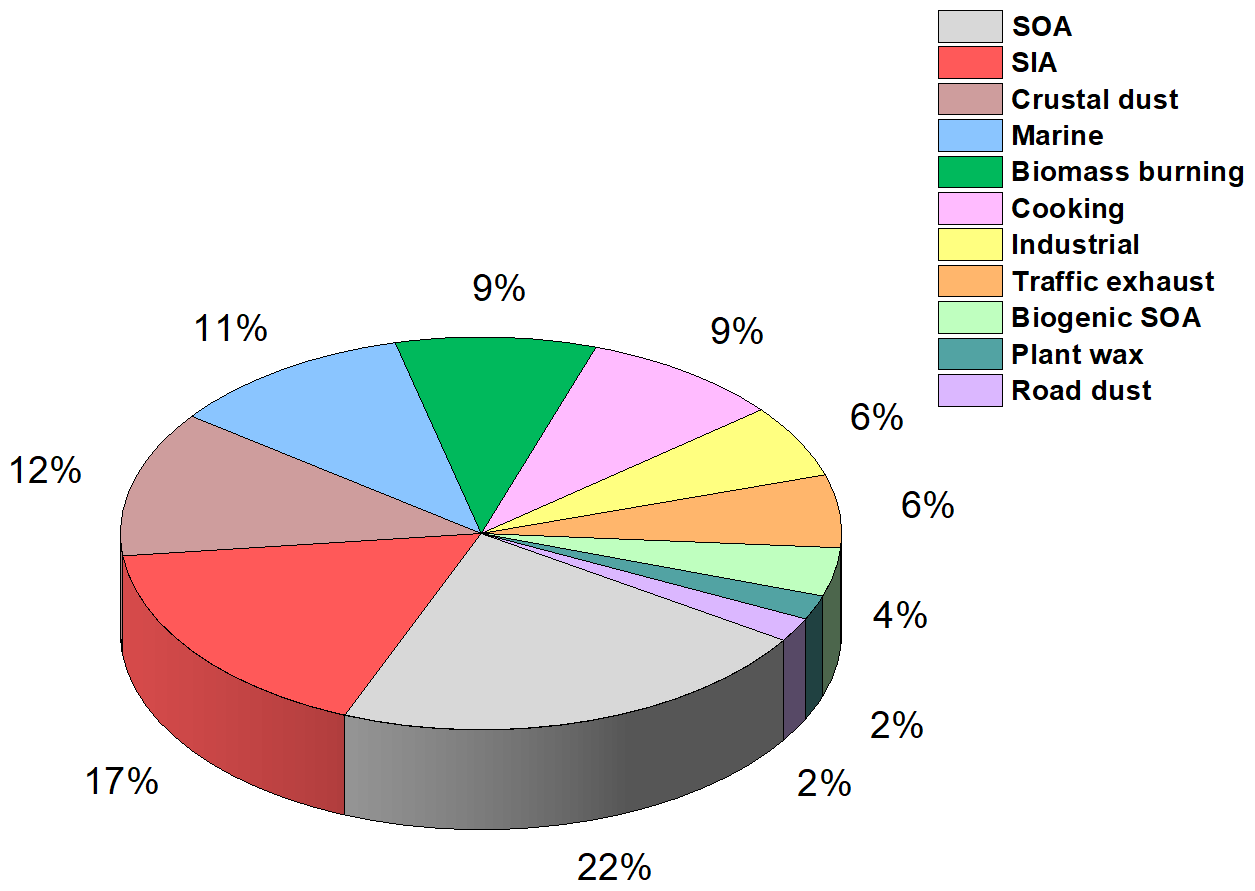
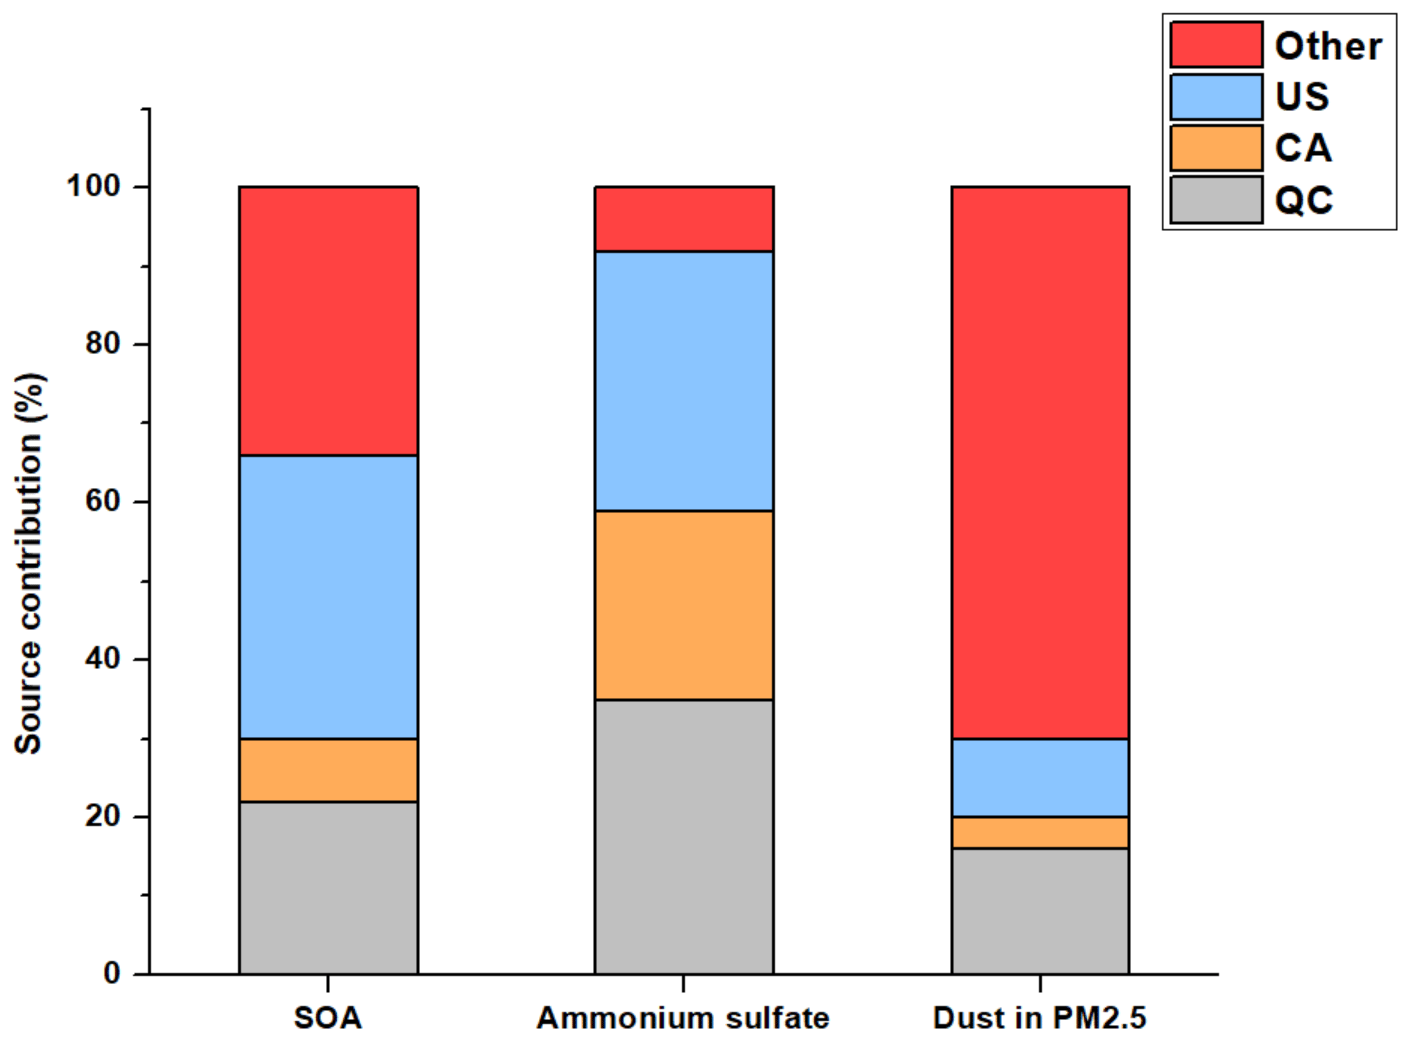
Figure 6Contribution of anthropogenic emissions from three different source regions, namely Quebec (QC), the United States (US), and the rest of Canada (CA), to concentrations of SOA, ammonium sulfate, and dust in PM2.5 between August and November 2020, as predicted by GEOS-Chem.
The chemical transport model GEOS-Chem was used to qualitatively evaluate the relative contributions from three different source regions, namely Quebec, RoC, and the United States, to the sources (Fig. S4). To link the modeling results to the PMF factors, we focus on modeled concentrations of SOA, of dust in particles smaller than 2.5 µm in diameter, and of the sum of NH4 and SO4. As most of the NH and SO was observed to be in the SIA PMF factor, we expect the sum of the simulated concentrations of NH4 and SO4 from GEOS-Chem has sources similar to the SIA PMF factor. Similarly, the concentrations of SOA from GEOS-Chem would be analogous to the sum of the SOA and biogenic SOA factors, although we note that only anthropogenic sources were altered in the sensitivity simulations. The dust species in GEOS-Chem comprises not only road dust and crustal dust, but all elements not included in the other model aerosol species (primary and secondary organic aerosol, elemental carbon, sulfate, nitrate, ammonium, and sea spray aerosol). It is therefore most comparable to the sum of the crustal dust, road dust, and industrial PMF factors. Together, the SIA, SOA, biogenic SOA, crustal dust, road dust, and industrial PMF factors comprise 61 % of the total observed PM2.5 mass.
According to the findings of the chemical transport modeling, Montréal air pollution concentrations are influenced by all three of the regions that were considered. As presented in Fig. 6, the US makes an important contribution to SOA and ammonium sulfate concentrations. The concentrations of SOA dropped by 22 % between the base case and the sensitivity simulation without Quebec emissions and by 36 % when the US emissions were not included. The concentrations of ammonium sulfate decreased by 33 % when US emissions were excluded and by 35 % when emissions from Quebec were excluded. Thus, GEOS-Chem simulations reveal an important contribution from US emissions to ammonium sulfate and SOA concentrations. Regarding the sources of sulfate in Quebec, it is somewhat surprising that the contributions from the province and the US are essentially the same (35 % vs. 33 %) given that there are no coal-fired powerplants in Quebec, while coal is still used at some powerplants in the US. This finding indicates that it is important to consider other sources that contribute to sulfate regionally. Specifically, aluminum production is a major industry in Quebec that emits large amounts of SO2 (NPRID, 2022). Nearly 70 % of North American aluminum is produced in Quebec. In addition, other industries involving smelting and metallurgy in Quebec emit SO2. When also considering the recent decreased use of coal in the US (USEIA, 2022), these alternate sources of sulfate appear to be relatively important in Quebec.
On the other hand, anthropogenic dust emissions from Quebec presented the highest apportioned contribution to total dust concentrations among the three regions studied, and the concentrations dropped by 16 % when emissions from Quebec were excluded and by 10 % when US emissions were excluded. The sum of the anthropogenic fractions is 30 % for dust in GEOS-Chem, which is close to the ratio of the PM2.5 mass in the industrial and road dust PMF factors to the sum of the industrial, road dust, and soil dust factors (40 %). The similarity in the two approaches (modeling versus PMF) increases confidence that the dust sources are being correctly apportioned in our study. In general, emissions from the RoC for all pollutants presented a smaller contribution to local concentrations than Quebec or US emissions (Fig. 6). Therefore, GEOS-Chem emphasized the important role of transboundary input from the US during our sampling period. PM2.5 can be reduced through local mitigation strategies, but the effectiveness of such strategies will be limited without updating international agreements to further reduce transboundary pollution.
3.7 Health risk assessment of PM2.5 elements
The non-carcinogenic health risks from airborne elements through inhalation, ingestion and dermal contact were estimated. The HI exhibited the same trend for both children and adults and followed a decreasing order of Co > Mn > Pb > Cu > Cd > Ni > Cr(VI) > Sb > Zn > Al > Fe > V. Among the three exposure pathways, inhalation contributed the most to the total non-carcinogenic risk (HItotal). Overall, inhalation contributed 98 % for adults and 97 % for children to HItotal, ingestion contributed 1 % (adults) and 2 % (children), and dermal absorption was the remainder. Co was the largest contributor to the HIinhalation, with a contribution of 61 % for both adults and children. An HI value higher than 1 implies that adverse effects other than cancer such as cardiovascular and respiratory diseases are expected (Fadel et al., 2022a). In this study, HI and HItotal (HItotal=0.24 for adults and 0.36 for children) were below the level of 1, highlighting limited non-carcinogenic health hazards from PM2.5 metals.
The carcinogenic risk of each carcinogenic metal (i.e., Cr(VI), Co, Ni, V, Cd, and Pb) from the three exposures pathways was also calculated. Inhalation was the exposure pathway with the highest cancer risk to which 99 % and 98 % of the overall carcinogenic risk (CRtotal) for adults and children was ascribed, respectively. According to the USEPA, a cancer risk value between 10−6 (1 additional case per 1×10⁶ people) and 10−4 (1 in 10 000) indicates that the carcinogenic risk is considered tolerable, while a value higher than 10−4 indicates that a serious risk of cancer exists (Bari and Kindzierski, 2016; Dahmardeh Behrooz et al., 2021).
In this study, the carcinogenic risk of V, Ni, Cd, and Pb was between and , which is lower than 10−6. However, Co and Cr(VI) presented a cancer risk higher than 10−6 (Fig. 7), highlighting that more attention should be given to these trace metals. Based on PMF analysis, Co was associated with industrial emissions, and the correlation between Co and Cr (R=0.79, p<0.01) (Sect. 3.4) suggests a common source from industrial emissions for these two trace elements (Cr was not added in the PMF analysis because it was not well modeled). The sum of the risk levels posed by the six metals was and for adults and children, respectively, which is between the range of 10−6–10−4, indicating that the carcinogenic risk is considered tolerable.
These results show that even though industrial emissions presented a very small contribution in term of mass (0.26 µg m−3), the health risks associated with this source cannot be fully determined by the PM2.5 mass concentration alone, and the trace elements emitted from industrial sources source were found to have a potential health risk. Thus, this study highlights that mitigation strategies should also prioritize reduction in metals in addition to PM.
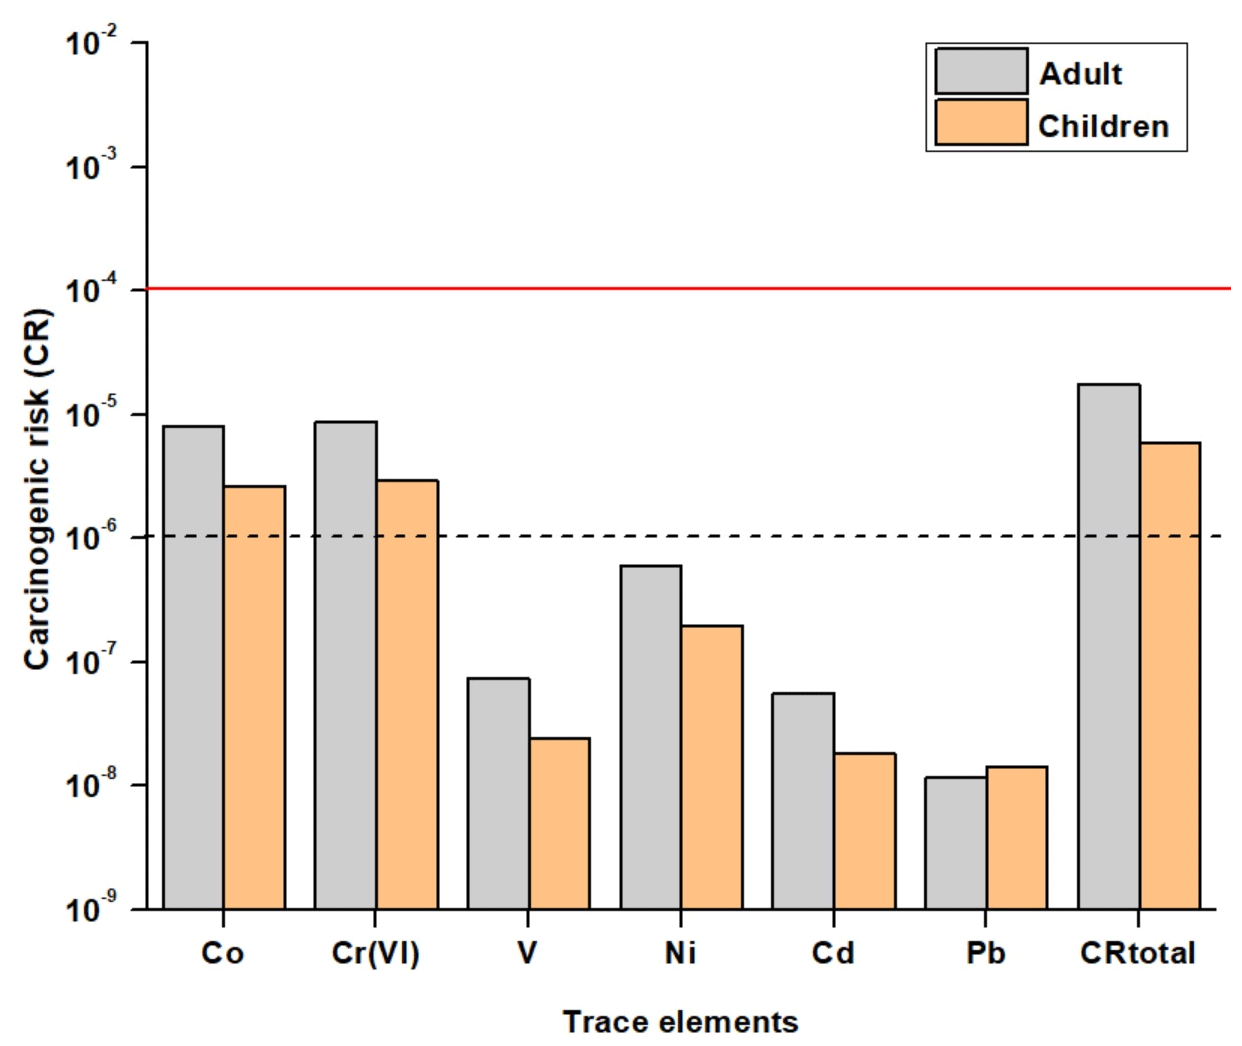
Figure 7The carcinogenic risk (CRtotal) from trace metals in PM2.5. A cancer risk value between 10−6 and 10−4 indicates that the CR is considered tolerable, while a value higher than 10−4 indicates that a serious risk of cancer exists.
This work examines PM2.5 sources in Montréal using detailed chemical speciation data collected over a 3-month period (August–November 2020). The chemical composition data included concentrations of the major components of PM2.5 such as OC, EC, water-soluble ions, and elements. These species, along with a large suite of organic tracers, were used as inputs in a source apportionment model (PMF) to identify and quantify the sources of PM2.5. In Canada, the NAPS program only provides data on organic compounds that can be measured by ion chromatography, which limits the available measurements to a small subset of polar organic compounds. Performing PMF analysis without organic species, or only a few polar organics, not only overestimates and underestimates some sources but also neglects some sources (Fakhri et al., 2023a). On the other hand, performing PMF analysis with only organic species is valuable for understanding organic aerosol chemistry, but it neglects important sources that contribute to the PM mass such as secondary sulfate, secondary nitrate, sea salt, and crustal dust. This source apportionment study, which examined the main contributing sources to PM2.5 using a larger suite of organic molecular markers than other Canadian source apportionment studies, is the first of its sort in Canada. Furthermore, a focus was on quantifying previously unresolved sources of PM2.5 through the inclusion in the PMF analysis of additional organic molecular markers beyond those measured typically by the Canadian government's National Air Pollution Surveillance Program (NAPS). The organic species included in the PMF model from the GC-MS analyses were six n-alkanes, two fatty acids, one dicarboxylic acid, two biogenic secondary organic aerosol (SOA) tracers, and hopane. This study demonstrates that having a small set of speciated organic tracers included in PMF input matrices is beneficial for understanding the sources of PM2.5 in Canada.
SOA and SIA were major sources and constituted 39 % of the measured PM2.5 mass. The local primary anthropogenic sources, namely traffic exhaust, road dust, and industrial and cooking emissions, contributed to 23 % of the measured PM2.5 mass. These sources along with crustal dust and biomass burning represented the total primary aerosol and accounted altogether for 44 % of PM2.5. According to the chemical transport model GEOS-Chem, both local (from Quebec) and transboundary pollution (from the United States) contribute to the observed concentrations of SOA and SIA in Montréal, but the transboundary contribution is greater than the local contribution, indicating the need to update international agreements to further limit transboundary pollution.
One of the novel aspects of the present study was the inclusion of specific organic tracers which allowed the identification of four sources in addition to those that are usually identified using chemical speciation datasets from government monitoring alone. Specifically, these sources (tracers) are plant wax (high MW n-alkanes), BSOA (α-pinene oxidation products), secondary organic aerosols (dicarboxylic acids), and cooking emissions (fatty acids). Moreover, the distinction between exhaust and non-exhaust vehicular emissions was achieved by incorporating two source-specific organic tracers in the PMF model, namely n-alkanes and hopane.
Evaluation of the health risk associated with exposure to metals revealed that Co and Cr(VI) presented a cancer risk (CR) higher than 10−6, highlighting that more attention should be given to these trace metals, which originate principally from industrial emissions according to the PMF analysis. While industrial emissions are the dominant source of Co and Cr(VI), they only contribute a small amount to the total PM2.5 (6 %), indicating that the prioritization of sources and sectors for mitigation strategies will be different when considering the concentrations of individual contaminants or total PM2.5 concentration.
Data used in this study can be accessed at https://doi.org/10.5683/SP3/96IVPX (Fakhri, 2023). More details on the analyses are available upon request to the contact author Nansi Fakhri (nansi.fakhri@umontreal.ca).
The supplement related to this article is available online at: https://doi.org/10.5194/acp-24-1193-2024-supplement.
NF: field campaign and collection of the filters; chemical characterization of the collected filters; analysis of the data and writing of the manuscript. RS: application of GEOS-Chem software; review and editing of the manuscript. AD: chemical characterization of the collected filters by ICP-MS. KO: resources acquisition. JS: resource acquisition; review and editing of the manuscript. PLH: supervision; review and editing of the manuscript; project administration and resource acquisition. CA: supervision; review and editing of the manuscript.
The contact author has declared that none of the authors has any competing interests.
Publisher’s note: Copernicus Publications remains neutral with regard to jurisdictional claims made in the text, published maps, institutional affiliations, or any other geographical representation in this paper. While Copernicus Publications makes every effort to include appropriate place names, the final responsibility lies with the authors.
Nansi Fakhri acknowledges a scholarship from the Centre de recherche en écotoxicologie du Québec (EcotoQ), a strategic cluster funded by the Fonds de recherche du Québec – Nature et technologies. This publication has been produced within the framework of the EMME-CARE project, which has received funding from the European Union Horizon 2020 Research and Innovation Program (under grant agreement no. 856612) and the Cyprus Government. The research was also enabled in part by support provided by Calcul Québec (https://www.calculquebec.ca/, last access: 5 March 2023) and the Digital Research Alliance of Canada (https://alliancecan.ca/en, last access: 10 February 2023). This work contains modified Copernicus Atmosphere Monitoring Service Information (2020). Neither the European Commission nor ECMWF is responsible for any use that may be made of the information it contains.
Patrick L. Hayes and Nansi Fakhri were supported by the Ministère de l'Environnement, de la Lutte contre les changements climatiques, de la Faune et des Parcs (MELCCFP). This research has been supported by the Canada Foundation for Innovation (grant no. 32277), the Natural Sciences and Engineering Research Council of Canada (grant no. RGPIN/05002-0214), and Horizon 2020 (grant no. 856612).
This paper was edited by Eleanor Browne and reviewed by two anonymous referees.
Abdallah, C., Afif, C., El Masri, N., Öztürk, F., Keleş, M., and Sartelet, K. A.: first annual assessment of air quality modeling over Lebanon using WRF/Polyphemus, Atmos. Pollut. Res., 9, 643–654, https://doi.org/10.1016/j.apr.2018.01.003, 2018.
Bari, M. A. and Kindzierski, W. B.: Fine particulate matter (PM2.5) in Edmonton, Canada: Source apportionment and potential risk for human health, Environ. Pollut., 218, 219–229, https://doi.org/10.1016/j.envpol.2016.06.014, 2016.
Belis, C., Larsen, B. R., Amato, F., Haddad, I. El, Favez, O., Harrison, R. M., Hopke, P. K., Nava, S., Paatero, P., Prévôt, A., Quass, U., Vecchi, R., and Viana, M.: European Guide on Air Pollution Source Apportionment with Receptor Models, JRC References Report, March, 88, 1–170, https://doi.org/10.2788/9307, 2019.
Bey, I., Jacob, D. J., Yantosca, R. M., Logan, J. A., Field, B. D., Fiore, A. M., Li, Q., Liu, H. Y., Mickley, L. J., and Schultz, M. G.: Global modeling of tropospheric chemistry with assimilated meteorology: Model description and evaluation, J. Geophys. Res.-Atmos., 106, 23073–23095, https://doi.org/10.1029/2001JD000807, 2001.
Cavalli, F., Viana, M., Yttri, K. E., Genberg, J., and Putaud, J.-P.: Toward a standardised thermal-optical protocol for measuring atmospheric organic and elemental carbon: the EUSAAR protocol, Atmos. Meas. Tech., 3, 79–89, https://doi.org/10.5194/amt-3-79-2010, 2010.
Calvo, A. I., Pont, V., Liousse, C., Dupré, B., Mariscal, A., Zouiten, C., Gardrat, E., Castera, P., Lacaux, C. G., Castro, A., and Fraile, R.: Chemical composition of urban aerosols in Toulouse, France during CAPITOUL experiment, Meteorol. Atmos. Phys. 102, 307–323, https://doi.org/10.1007/s00703-008-0319-2, 2008.
Celo, V., Yassine, M. M., and Dabek-Zlotorzynska, E.: Insights into elemental composition and sources of fine and coarse particulate matter in dense traffic areas in Toronto and Vancouver, Canada, Toxics, 9, 1–18, https://doi.org/10.3390/toxics9100264, 2021.
Chow, J. C., Lowenthal, D. H., Chen, L. W. A., Wang, X., and Watson, J. G.: Mass reconstruction methods for PM2.5: a review, Air Qual. Atmos. Heal. 8, 243–263. https://doi.org/10.1007/s11869-015-0338-3, 2015.
Charbonneau, P.: Sels de voirie: une utilisation nécessaire mais lourde de consequences, Le Naturaliste Canadien, 130, 75–81, 2006.
Dabek-Zlotorzynska, E., Dann, T. F., Kalyani Martinelango, P., Celo, V., Brook, J. R., Mathieu, D., Ding, L., and Austin, C. C.: Canadian National Air Pollution Surveillance (NAPS) PM2.5 speciation program: Methodology and PM2.5 chemical composition for the years 2003–2008, Atmos. Environ. 45, 673–686, https://doi.org/10.1016/j.atmosenv.2010.10.024, 2011.
Dahmardeh Behrooz, R., Kaskaoutis, D. G., Grivas, G., and Mihalopoulos, N.: Human health risk assessment for toxic elements in the extreme ambient dust conditions observed in Sistan, Iran, Chemosphere, 262, 127835, https://doi.org/10.1016/j.chemosphere.2020.127835, 2021.
Environmental Assessment Report (EAR): 2017, Air Quality in Montréal, Ville de Montréal Service de l'environnement, Division de la planification et du suivi environnemental, 1–6, https://ville.montreal.qc.ca/pls/portal/docs/page/enviro_fr/media/documents/vdm_bilanqualiteair_2017_en.pdf (last access: 5 November 2021), 2017.
Environmental Assessment Report (EAR): 2018, Air Quality in Montréal, Ville de Montréal Service de l'environnement, Division de la planification et du suivi environnemental, 1–6, https://ville.montreal.qc.ca/pls/portal/docs/page/enviro_fr/media/documents/vdm_reportrsqa_2018_vf.pdf (last access: 10 November 2021), 2018.
Environmental Assessment Report (EAR): 2019, Air Quality in Montréal, Ville de Montréal Service de l'environnement, Division de la planification et du suivi environnemental, 1–16, https://www.ville.montreal.qc.ca/pls/portal/docs/PAGE/ENVIRO_FR/MEDIA/DOCUMENTS/BILANQUALITDEL'AIR(FR).pdf (last access: 20 November 2021), 2019.
Environmental Assessment Report (EAR): 2020, Air Quality in Montréal, Ville de Montréal Service de l'environnement, Division de la planification et du suivi environnemental, 1–19, https://ville.montreal.qc.ca/pls/portal/docs/page/enviro_fr/media/documents/vdm_reportrsqa_2020_vf.pdf (last access: 20 November 2021), 2020.
El Haddad, I., Marchand, N., Dron, J., Temime-Roussel, B., Quivet, E., Wortham, H., Jaffrezo, J. L., Baduel, C., Voisin, D., Besombes, J. L., and Gille, G.: Comprehensive primary particulate organic characterization of vehicular exhaust emissions in France, Atmos. Environ., 43, 6190–6198, https://doi.org/10.1016/j.atmosenv.2009.09.001, 2009.
El Haddad, I., Marchand, N., Temime-Roussel, B., Wortham, H., Piot, C., Besombes, J.-L., Baduel, C., Voisin, D., Armengaud, A., and Jaffrezo, J.-L.: Insights into the secondary fraction of the organic aerosol in a Mediterranean urban area: Marseille, Atmos. Chem. Phys., 11, 2059–2079, https://doi.org/10.5194/acp-11-2059-2011, 2011.
Environmental Protection Agency (EPA): Air Emissions Modeling 2016v1 Platform, https://www.epa.gov/air-emissions-modeling/2016v1-platform (last access: 10 September 2021), 2021a.
Environmental Protection Agency (EPA): Air Pollutant Emissions Trends Data, https://www.epa.gov/air-emissions-inventories/air-pollutant-emissions-trends-data (last access: 21 September 2021), 2021b.
Esmaeilirad, S., Lai, A., Abbaszade, G., Schnelle-Kreis, J., Zimmermann, R., Uzu, G., Daellenbach, K., Canonaco, F., Hassankhany, H., Arhami, M., Baltensperger, U., Prévôt, A.S.H., Schauer, J. J., Jaffrezo, J. L., Hosseini, V., and El Haddad, I.: Source apportionment of fine particulate matter in a Middle Eastern Metropolis, Tehran-Iran, using PMF with organic and inorganic markers, Sci. Total Environ., 705, 135330, https://doi.org/10.1016/j.scitotenv.2019.135330, 2020.
Fadel, M., Courcot, D., Afif, C., and Ledoux, F.: Methods for the assessment of health risk induced by contaminants in atmospheric particulate matter: a review, Environ. Chem. Lett., 20, 3289–3311, https://doi.org/10.1007/s10311-022-01461-6, 2022a.
Fadel, M., Ledoux, F., Afif, C., and Courcot, D.: Human health risk assessment for PAHs, phthalates, elements, PCDD/Fs, and DL-PCBs in PM2.5 and for NMVOCs in two East-Mediterranean urban sites under industrial influence, Atmos. Pollut. Res., 13, 101261, https://doi.org/10.1016/j.apr.2021.101261, 2022b.
Fadel, M., Ledoux, F., Farhat, M., Kfoury, A., Courcot, D., and Afif, C.: PM2.5 characterization of primary and secondary organic aerosols in two urban-industrial areas in the East Mediterranean, J. Environ. Sci. (China), 101, 98–116, https://doi.org/10.1016/j.jes.2020.07.030, 2021.
Fadel, M., Courcot, D., Seigneur, M., Kfoury, A., Oikonomou, K., Sciare, J., and Afif, C.: Identification and apportionment of local and long-range sources of PM2.5 in two East-Mediterranean sites, Atmos. Pollut. Res., 14, 101622, https://doi.org/10.1016/j.apr.2022.101622, 2023.
Fairlie, T. D., Jacob, D. J., Dibb, J. E., Alexander, B., Avery, M. A., van Donkelaar, A., and Zhang, L.: Impact of mineral dust on nitrate, sulfate, and ozone in transpacific Asian pollution plumes, Atmos. Chem. Phys., 10, 3999–4012, https://doi.org/10.5194/acp-10-3999-2010, 2010.
Fakhri, N., Fadel, M., Pikridas, M., Sciare, J., Hayes, P. L., and Afif, C.: Source apportionment of PM2.5 using organic/inorganic markers and emission inventory evaluation in the East Mediterranean-Middle East city of Beirut, Environ. Res., 223, 115446, https://doi.org/10.1016/j.envres.2023.115446, 2023a.
Fakhri, N., Fadel, M., Öztürk, F., Keleş, M., Iakovides, M., Pikridas, M., Abdallah, C., Karam, C., Sciare, J., Hayes, P. L., and Afif, C.: Comprehensive chemical characterization of PM2.5 in the large East Mediterranean-Middle East city of Beirut, Lebanon, J. Environ. Sci., 133, 118–137, https://doi.org/10.1016/j.jes.2022.07.010, 2023b.
Gadi, R., Shivani, Sharma, S. K., and Mandal, T. K.: Source apportionment and health risk assessment of organic constituents in fine ambient aerosols (PM2.5): A complete year study over National Capital Region of India, Chemosphere, 221, 583–596, https://doi.org/10.1016/j.chemosphere.2019.01.067, 2019.
Geng, N., Wang, J., Xu, Y., Zhang, W., Chen, C., and Zhang, R.: PM2.5 in an industrial district of Zhengzhou, China: Chemical composition and source apportionment, Particuology, 11, 99–109, https://doi.org/10.1016/j.partic.2012.08.004, 2013.
Genga, A., Ielpo, P., Siciliano, T., and Siciliano, M.: Carbonaceous particles and aerosol mass closure in PM2.5 collected in a port city, Atmos. Res., 183, 245–254, https://doi.org/10.1016/j.atmosres.2016.08.022, 2017.
Golokhvast, K. S., Chernyshev, V. V., Chaika, V. V., Ugay, S. M., Zelinskaya, E. V., Tsatsakis, A. M., Karakitsios, S. P., and Sarigiannis, D. A.: Size-segregated emissions and metal content of vehicle-emitted particles as a function of mileage: Implications to population exposure, Environ. Res., 142, 479–485, https://doi.org/10.1016/j.envres.2015.07.018, 2015.
Government of Québec: Impact of COVID-19 on air quality in Québec, https://www.quebec.ca/en/agriculture-environment-and-natural-resources/environment-covid-19/impact-air-quality-quebec-covid-19 (last access: 26 September 2022), 2022.
Hallquist, M., Wenger, J. C., Baltensperger, U., Rudich, Y., Simpson, D., Claeys, M., Dommen, J., Donahue, N. M., George, C., Goldstein, A. H., Hamilton, J. F., Herrmann, H., Hoffmann, T., Iinuma, Y., Jang, M., Jenkin, M. E., Jimenez, J. L., Kiendler-Scharr, A., Maenhaut, W., McFiggans, G., Mentel, Th. F., Monod, A., Prévôt, A. S. H., Seinfeld, J. H., Surratt, J. D., Szmigielski, R., and Wildt, J.: The formation, properties and impact of secondary organic aerosol: current and emerging issues, Atmos. Chem. Phys., 9, 5155–5236, https://doi.org/10.5194/acp-9-5155-2009, 2009.
Hao, Y., Luo, B., Simayi, M., Zhang, W., Jiang, Y., He, J., and Xie, S.: Spatiotemporal patterns of PM2.5 elemental composition over China and associated health risks, Environ. Pollut., 265, 114910, https://doi.org/10.1016/j.envpol.2020.114910, 2020.
Health Canada: Health Impacts of Air Pollution in Canada, Estimates of Premature Deaths and Nonfatal Outcomes, 2021 Report, 1–56, https://www.canada.ca/content/dam/hc-sc/documents/services/publications/healthy-living/2021-health-effects-indoor-air-pollution/hia-report-eng.pdf (last access: 5 September 2022), 2021.
Huang, X. H. H., Bian, Q., Ng, W. M., Louie, P. K. K., and Yu, J. Z.: Characterization of PM2.5 major components and source investigation in suburban Hong Kong: A one year monitoring study, Aerosol Air Qual. Res., 14, 237–250, https://doi.org/10.4209/aaqr.2013.01.0020, 2014.
Hoesly, R. M., Smith, S. J., Feng, L., Klimont, Z., Janssens-Maenhout, G., Pitkanen, T., Seibert, J. J., Vu, L., Andres, R. J., Bolt, R. M., Bond, T. C., Dawidowski, L., Kholod, N., Kurokawa, J.-I., Li, M., Liu, L., Lu, Z., Moura, M. C. P., O'Rourke, P. R., and Zhang, Q.: Historical (1750–2014) anthropogenic emissions of reactive gases and aerosols from the Community Emissions Data System (CEDS), Geosci. Model Dev., 11, 369–408, https://doi.org/10.5194/gmd-11-369-2018, 2018.
Jeong, C. H., McGuire, M. L., Herod, D., Dann, T., Dabek-Zlotorzynska, E., Wang, D., Ding, L., Celo, V., Mathieu, D., and Evans, G.: Receptor model-based identification of PM2.5 sources in Canadian cities, Atmos. Pollut. Res., 2, 158–171, https://doi.org/10.5094/APR.2011.021, 2011.
Joseph, A. E., Unnikrishnan, S., and Kumar, R.: Chemical characterization and mass closure of fine aerosol for different land use patterns in Mumbai city, Aerosol Air Qual. Res., 12, 61–72, https://doi.org/10.4209/aaqr.2011.04.0049, 2012.
Kaiser, J. W., Heil, A., Andreae, M. O., Benedetti, A., Chubarova, N., Jones, L., Morcrette, J.-J., Razinger, M., Schultz, M. G., Suttie, M., and van der Werf, G. R.: Biomass burning emissions estimated with a global fire assimilation system based on observed fire radiative power, Biogeosciences, 9, 527–554, https://doi.org/10.5194/bg-9-527-2012, 2012.
Keller, C. A., Long, M. S., Yantosca, R. M., Da Silva, A. M., Pawson, S., and Jacob, D. J.: HEMCO v1.0: a versatile, ESMF-compliant component for calculating emissions in atmospheric models, Geosci. Model Dev., 7, 1409–1417, https://doi.org/10.5194/gmd-7-1409-2014, 2014.
Khan, J. Z., Sun, L., Tian, Y., Shi, G., and Feng, Y.: Chemical characterization and source apportionment of PM1 and PM2.5 in Tianjin, China: Impacts of biomass burning and primary biogenic sources, J. Environ. Sci. (China), 99, 196–209, https://doi.org/10.1016/j.jes.2020.06.027, 2021.
Kim, P. S., Jacob, D. J., Fisher, J. A., Travis, K., Yu, K., Zhu, L., Yantosca, R. M., Sulprizio, M. P., Jimenez, J. L., Campuzano-Jost, P., Froyd, K. D., Liao, J., Hair, J. W., Fenn, M. A., Butler, C. F., Wagner, N. L., Gordon, T. D., Welti, A., Wennberg, P. O., Crounse, J. D., St. Clair, J. M., Teng, A. P., Millet, D. B., Schwarz, J. P., Markovic, M. Z., and Perring, A. E.: Sources, seasonality, and trends of southeast US aerosol: an integrated analysis of surface, aircraft, and satellite observations with the GEOS-Chem chemical transport model, Atmos. Chem. Phys., 15, 10411–10433, https://doi.org/10.5194/acp-15-10411-2015, 2015.
Lelieveld, J., Klingmüller, K., Pozzer, A., Pöschl, U., Fnais, M., Daiber, A., and Münzel, T.: Cardiovascular disease burden from ambient air pollution in Europe reassessed using novel hazard ratio functions, Eur. Heart J., 40, 1590–1596, https://doi.org/10.1093/eurheartj/ehz135, 2019.
Lee, Y. S., Kim, Y. K., Choi, E., Jo, H., Hyun, H., Yi, S. M., and Kim, J. Y.: Health risk assessment and source apportionment of PM2.5-bound toxic elements in the industrial city of Siheung, Korea, Environ. Sci. Pollut. Res., 29, 66591–66604, https://doi.org/10.1007/s11356-022-20462-0, 2022.
Lin, Y.-C., Tsai, C.-J., Wu, Y.-C., Zhang, R., Chi, K.-H., Huang, Y.-T., Lin, S.-H., and Hsu, S.-C.: Characteristics of trace metals in traffic-derived particles in Hsuehshan Tunnel, Taiwan: size distribution, potential source, and fingerprinting metal ratio, Atmos. Chem. Phys., 15, 4117–4130, https://doi.org/10.5194/acp-15-4117-2015, 2015.
Luo, G., Yu, F., and Schwab, J.: Revised treatment of wet scavenging processes dramatically improves GEOS-Chem 12.0.0 simulations of surface nitric acid, nitrate, and ammonium over the United States, Geosci. Model Dev., 12, 3439–3447, https://doi.org/10.5194/gmd-12-3439-2019, 2019.
Luo, G., Yu, F., and Moch, J. M.: Further improvement of wet process treatments in GEOS-Chem v12.6.0: impact on global distributions of aerosols and aerosol precursors, Geosci. Model Dev., 13, 2879–2903, https://doi.org/10.5194/gmd-13-2879-2020, 2020.
Lv, L., Chen, Y., Han, Y., Cui, M., Wei, P., Zheng, M., and Hu, J.: High-time-resolution PM2.5 source apportionment based on multi-model with organic tracers in Beijing during haze episodes, Sci. Total Environ., 772, 144766, https://doi.org/10.1016/j.scitotenv.2020.144766, 2021.
Mason, B. and Moore, C. B.: Principles of Geochemistry, 4th Edition, Wiley, 344 pp., 1982.
Mancilla, Y. and Mendoza, A.: A tunnel study to characterize PM2.5 emissions from gasoline-powered vehicles in Monterrey, Mexico, Atmos. Environ., 59, 449–460, https://doi.org/10.1016/j.atmosenv.2012.05.025, 2012.
Mantas, E., Remoundaki, E., Halari, I., Kassomenos, P., Theodosi, C., Hatzikioseyian, A., and Mihalopoulos, N.: Mass closure and source apportionment of PM2.5 by Positive Matrix Factorization analysis in urban Mediterranean environment, Atmos. Environ., 94, 154–163, https://doi.org/10.1016/j.atmosenv.2014.05.002, 2014.
Meng, J., Martin, R. V., Li, C., van Donkelaar, A., Tzompa-Sosa, Z. A., Yue, X., Xu, J.-W., Weagle, C. L., and Burnett, R. T.: Source Contributions to Ambient Fine Particulate Matter for Canada, Environ. Sci. Technol., 53, 10269–10278, https://doi.org/10.1021/acs.est.9b02461, 2019.
Nansai, K., Tohno, S., Chatani, S., Kanemoto, K., Kagawa, S., Kondo, Y., Takayanagi, W., and Lenzen, M.: Consumption in the G20 nations causes particulate air pollution resulting in two million premature deaths annually, Nat. Commun., 12, 1–6, https://doi.org/10.1038/s41467-021-26348-y, 2021.
NPRID: National Pollutant Release Inventory Dashboard, Government of Canada, https://www.canada.ca/en/environment-climate-change/services/national-pollutant-release-inventory/tools-resources-data/all-year-dashboard.html (last access: 30 August 2022), 2022.
O'Rourke, P., Smith, S., Mott, A., Ahsan, H., Mcduffie, E., Crippa, M., Klimont, Z., Mcdonald, B., Wang, S., Nicholson, M., Hoesly, R., and Feng, L.: CEDS v_2021_04_21 Gridded emissions data, https://doi.org/10.25584/PNNLDATAHUB/1779095, 2021.
Pant, P. and Harrison, R. M.: Estimation of the contribution of road traffic emissions to particulate matter concentrations from field measurements: A review, Atmos. Environ., 77, 78–97, https://doi.org/10.1016/j.atmosenv.2013.04.028, 2013.
Park, R. J., Jacob, D. J., Field, B. D., Yantosca, R. M., and Chin, M.: Natural and transboundary pollution influences on sulfate-nitrate-ammonium aerosols in the United States: Implications for policy, J. Geophys. Res., 109, 1–20, https://doi.org/10.1029/2003jd004473, 2004.
Park, M.-B., Lee, T. J., Lee, E. S., and Kim, D. S.: Enhancing source identification of hourly PM2.5 data in Seoul based on a dataset segmentation scheme by positive matrix factorization (PMF), Atmos. Pollut. Res., 10, 1042–1059, https://doi.org/10.1016/j.apr.2019.01.013, 2019.
Pai, S. J., Heald, C. L., Pierce, J. R., Farina, S. C., Marais, E. A., Jimenez, J. L., Campuzano-Jost, P., Nault, B. A., Middlebrook, A. M., Coe, H., Shilling, J. E., Bahreini, R., Dingle, J. H., and Vu, K.: An evaluation of global organic aerosol schemes using airborne observations, Atmos. Chem. Phys., 20, 2637–2665, https://doi.org/10.5194/acp-20-2637-2020, 2020.
Petit, J. E., Pallarès, C., Favez, O., Alleman, L. Y., Bonnaire, N., and Rivière, E.: Sources and geographical origins of PM10 in Metz (France) using oxalate as a marker of secondary organic aerosols by positive matrix factorization analysis, Atmosphere (Basel), 10, 1–17, https://doi.org/10.3390/atmos10070370, 2019.
Philip, S., Martin, R. V., Snider, G., Weagle, C. L., van Donkelaar, A., Brauer, M., Henze, D. K., Klimont, Z., Venkataraman, C., Guttikunda, S. K., and Zhang, Q.: Anthropogenic fugitive, combustion and industrial dust is a significant, underrepresented fine particulate matter source in global atmospheric models, Environ. Res. Lett., 12, 044018, https://doi.org/10.1088/1748-9326/aa65a4, 2017.
Pio, C., Mirante, F., Oliveira, César, Matos, M., Caseiro, A., Oliveira, Cristina, Querol, X., Alves, C., Martins, N., Cerqueira, M., Camões, F., Silva, H., and Plana, F.: Size-segregated chemical composition of aerosol emissions in an urban road tunnel in Portugal, Atmos. Environ., 71, 15–25, https://doi.org/10.1016/j.atmosenv.2013.01.037, 2013.
Polissar, A. V., Hopke, P. K., Paatero, P., Malm, W. C., and Sisler, J. F.: Atmospheric aerosol over Alaska. 2. Elemental composition and sources, J. Geophys. Res.-Atmos., 103, 19045–19057, https://doi.org/10.1029/98JD01212, 1998.
Rahn, K. A. and Huang, S.: A graphical technique for distinguishing soil and atmospheric deposition in biomonitors from the plant material, Sci. Total Environ., 232, 79–104, https://doi.org/10.1016/S0048-9697(99)00112-6, 1999.
Reidmiller, D. R., Fiore, A. M., Jaffe, D. A., Bergmann, D., Cuvelier, C., Dentener, F. J., Duncan, B. N., Folberth, G., Gauss, M., Gong, S., Hess, P., Jonson, J. E., Keating, T., Lupu, A., Marmer, E., Park, R., Schultz, M. G., Shindell, D. T., Szopa, S., Vivanco, M. G., Wild, O., and Zuber, A.: The influence of foreign vs. North American emissions on surface ozone in the US, Atmos. Chem. Phys., 9, 5027–5042, https://doi.org/10.5194/acp-9-5027-2009, 2009.
Remoundaki, E., Kassomenos, P., Mantas, E., Mihalopoulos, N., and Tsezos, M.: Composition and mass closure of PM2.5 in urban environment (Athens, Greece), Aerosol Air Qual. Res., 13, 72–82, https://doi.org/10.4209/aaqr.2012.03.0054, 2013.
Riffault, V., Arndt, J., Marris, H., Mbengue, S., Setyan, A., Alleman, L.Y., Deboudt, K., Flament, P., Augustin, P., Delbarre, H., and Wenger, J.: Fine and ultrafine particles in the vicinity of industrial activities: A review, Crit. Rev. Environ. Sci. Technol., 45, 2305–2356, https://doi.org/10.1080/10643389.2015.1025636, 2015.
Rogge, W. F., Hildemann, L. M., Mazurek, M. A., Cass, G. R., and Simoneit, B. R. T.: Sources of Fine Organic Aerosol. 2. Noncatalyst and Catalyst-Equipped Automobiles and Heavy-Duty Diesel Trucks, Environ. Sci. Technol., 27, 636–651, https://doi.org/10.1021/es00041a007, 1993a.
Rogge, W. F., Hildemann, L. M., Mazurek, M. A., Cass, G. R., and Simonelt, B. R. T.: Sources of Fine Organic Aerosol. 4. Particulate Abrasion Products from Leaf Surfaces of Urban Plants, Environ. Sci. Technol., 27, 2700–2711, https://doi.org/10.1021/es00049a008, 1993b.
Roy, D., Singh, G., and Seo, Y.: Carcinogenic and non-carcinogenic risks from PM10 -and PM2.5 -Bound metals in a critically polluted coal mining area, Atmos. Pollut. Res., 10, 1964–1975, https://doi.org/10.1016/j.apr.2019.09.002, 2019.
Salameh, D., Detournay, A., Pey, J., Pérez, N., Liguori, F., Saraga, D., Bove, M. C., Brotto, P., Cassola, F., Massabò, D., Latella, A., Pillon, S., Formenton, G., Patti, S., Armengaud, A., Piga, D., Jaffrezo, J. L., Bartzis, J., Tolis, E., Prati, P., Querol, X., Wortham, H., and Marchand, N.: PM2.5 chemical composition in five European Mediterranean cities: A 1-year study, Atmos. Res., 155, 102–117, https://doi.org/10.1016/j.atmosres.2014.12.001, 2015.
Seinfeld, J. H. and Pandis, S. N.: Atmospheric Chemistry and Physics: From air pollution to climate change, 1360 pp., John Wiley and Sons, New York, 2016.
Schauer, J. J., Kleeman, M. J., Cass, G. R., and Simoneit, B. R. T.: Measurement of emissions from air pollution sources. 5. C1 – C32 organic compounds from gasoline-powered motor vehicles, Environ. Sci. Technol., 36, 1169–1180, https://doi.org/10.1021/es0108077, 2002.
Sciare, J., Oikonomou, K., Cachier, H., Mihalopoulos, N., Andreae, M. O., Maenhaut, W., and Sarda-Estève, R.: Aerosol mass closure and reconstruction of the light scattering coefficient over the Eastern Mediterranean Sea during the MINOS campaign, Atmos. Chem. Phys., 5, 2253–2265, https://doi.org/10.5194/acp-5-2253-2005, 2005.
Simone, N. W., Stettler, M. E. J., and Barrett, S. R. H.: Rapid estimation of global civil aviation emissions with uncertainty quantification, Transp. Res. Part D Transp. Environ., 25, 33–41, https://doi.org/10.1016/j.trd.2013.07.001, 2013.
Sharma, S. K. and Mandal, T. K.: Chemical composition of fine mode particulate matter (PM2.5) in an urban area of Delhi, India and its source apportionment, Urban Clim., 21, 106–122, https://doi.org/10.1016/j.uclim.2017.05.009, 2017.
Shivani, G., R., Sharma, S. K., and Mandal, T. K.: Seasonal variation, source apportionment and source attributed health risk of fine carbonaceous aerosols over National Capital Region, India, Chemosphere, 237, 124500, https://doi.org/10.1016/j.chemosphere.2019.124500, 2019.
Silvern, R. F., Jacob, D. J., Mickley, L. J., Sulprizio, M. P., Travis, K. R., Marais, E. A., Cohen, R. C., Laughner, J. L., Choi, S., Joiner, J., and Lamsal, L. N.: Using satellite observations of tropospheric NO2 columns to infer long-term trends in US NOx emissions: the importance of accounting for the free tropospheric NO2 background, Atmos. Chem. Phys., 19, 8863–8878, https://doi.org/10.5194/acp-19-8863-2019, 2019.
Simoneit, B. R. T.: Biomass burning – A review of organic tracers for smoke from incomplete combustion, Appl. Geochem., 17, 129–162, https://doi.org/10.1016/S0883-2927(01)00061-0, 2002.
Srivastava, D., Favez, O., Petit, J. E., Zhang, Y., Sofowote, U. M., Hopke, P. K., Bonnaire, N., Perraudin, E., Gros, V., Villenave, E., and Albinet, A.: Speciation of organic fractions does matter for aerosol source apportionment. Part 3: Combining off-line and on-line measurements, Sci. Total Environ., 690, 944–955, https://doi.org/10.1016/j.scitotenv.2019.06.378, 2019.
Stettler, M. E. J., Eastham, S., and Barrett, S. R. H.: Air quality and public health impacts of UK airports. Part I: Emissions, Atmos. Environ., 45, 5415–5424, https://doi.org/10.1016/j.atmosenv.2011.07.012, 2011.
Thorpe, A. and Harrison, R. M.: Sources and properties of non-exhaust particulate matter from road traffic: A review, Sci. Total Environ., 400, 270–282, https://doi.org/10.1016/j.scitotenv.2008.06.007, 2008.
USATODAY: COVID-19 restrictions, Map of COVID-19 case trends and restrictions, https://www.usatoday.com/storytelling/coronavirus-reopening-america-map/ (last access: 27 September 2022), 2022.
USEPA: Users' guide and background technical document for US EPA region 9's preliminary remediation goals (PRG) table, 1–30, https://semspub.epa.gov/work/02/103453.pdf (last access: 5 February 2023), 2004.
USEPA: Exposure Factors Handbook: 2011 Edition. National Center for Environmental Assessment, Washington, DC; EPA/600/R-09/052F. Available from the National Technical Information Service, Springfield, VA, and online at http://www.epa.gov/ncea/efh (last access: 5 May 2023), 2011.
USEPA: EPA Positive Matrix Factorization (PMF) 5.0 Fundamentals and User Guide. U.S. Environmental Protection Agency Office of Research and Development Washington, DC 20460, 1–136, https://www.epa.gov/sites/default/files/2015-02/documents/pmf_5.0_user_guide.pdf (last access: 10 February 2023), 2014.
USEIA: U.S. energy facts explained, https://www.eia.gov/energyexplained/us-energy-facts/ (last access: 15 March 2023), 2022.
Wang, J. M., Jeong, C.-H., Hilker, N., Healy, R. M., Sofowote, U., Debosz, J., Su, Y., Munoz, A., and Evans. G. J.: Quantifying metal emissions from vehicular traffic using real world emission factors, Environ. Poll., 268, 115805, https://doi.org/10.1016/j.envpol.2020.115805, 2021.
WHO: WHO global air quality guidelines: particulate matter (PM2.5 and PM10), ozone, nitrogen dioxide, sulfur dioxide and carbon monoxide, Geneva: World Health Organization, https://apps.who.int/iris/handle/10665/345329 (last access: 27 July 2022), 2021.
Zender, C. S.: Mineral Dust Entrainment and Deposition (DEAD) model: Description and 1990s dust climatology, J. Geophys. Res., 108, 4416, https://doi.org/10.1029/2002JD002775, 2003.
Zhang, L., Kok, J. F., Henze, D. K., Li, Q., and Zhao, C.: Improving simulations of fine dust surface concentrations over the western United States by optimizing the particle size distribution, Geophys. Res. Lett., 40, 3270–3275, https://doi.org/10.1002/grl.50591, 2013.