the Creative Commons Attribution 4.0 License.
the Creative Commons Attribution 4.0 License.
 | 22 Oct 2024
Ice-nucleating particles active below −24 °C in a Finnish boreal forest and their relationship to bioaerosols
Michael P. Adams
Larissa Lacher
Polly B. Foster
Grace C. E. Porter
Barbara Bertozzi
Kristina Höhler
Julia Schneider
Tobias Schorr
Nsikanabasi S. Umo
Jens Nadolny
Zoé Brasseur
Paavo Heikkilä
Erik S. Thomson
Nicole Büttner
Martin I. Daily
Romy Fösig
Alexander D. Harrison
Jorma Keskinen
Ulrike Proske
Jonathan Duplissy
Markku Kulmala
Tuukka Petäjä
Ottmar Möhler
Benjamin J. Murray
Cloud properties are strongly influenced by ice formation; hence, we need to understand the sources of ice-nucleating particles (INPs) around the globe. Boreal forests are known as sources of bioaerosol, and recent work indicates that these dominate the INP spectra above −24 °C. To quantify the INP population at temperatures below −24 °C, we deployed a portable cloud expansion chamber (PINE) in a Finnish boreal forest from 13 March 2018 to 11 May 2018. Using the 6 min time resolution PINE data, we present several lines of evidence that INPs below −24 °C in this location are also from biological sources: (i) an INP parameterization developed for a pine forest site in Colorado, where many INPs were shown to be biological, produced a good fit to our measurements; a moderate correlation of INPs with aerosol concentration larger than 0.5 µm and the fluorescent bioaerosol concentration; (ii) a negative correlation with relative humidity that may relate to enhanced release of bioaerosol at low humidity from local sources such as the prolific lichen population in boreal forests; and (iii) the absence of correlation with ultra-fine particles (3.5 to 50 nm), indicating that new particle formation events are not sources of INPs. This study should motivate further work to establish whether the commonality in bioaerosol ice-nucleating properties between spring in Finland and summer in Colorado is more generally applicable to different coniferous forest locations and times and also to determine to what extent these bioaerosols are transported to locations where they may affect clouds.
- Article
(2863 KB) - Full-text XML
- BibTeX
- EndNote


The cloud phase (liquid, ice or mixed-phase) is a crucial property affecting the amount of incoming solar radiation that reaches the Earth's surface (Boucher et al., 2013; Matus and L'Ecuyer, 2017). Thus, clouds have an important role in the radiative budget of the Earth, and responses of clouds to a changing climate feedback are highly uncertain (Ceppi et al., 2017; Storelvmo, 2017; Murray et al., 2021). Cloud phase is strongly influenced by the presence of aerosol particles, specifically if these aerosol particles act as ice-nucleating particles (INPs) (Hoose and Möhler, 2012; Murray et al., 2012; Kanji et al., 2017).
INPs initiate heterogeneous ice nucleation in supercooled liquid cloud droplets, which could otherwise freeze homogeneously at a temperature of approximately −36 °C (Pruppacher and Klett, 2010; Herbert et al., 2015) or trigger ice formation from the vapour phase via deposition nucleation (Vali et al., 2015). Heterogeneous ice nucleation is of high relevance in the atmosphere. For example, modelling studies have shown that the reflectivity of cold boundary layer marine clouds is strongly dependent on the INP concentration, with more INPs leading to a dramatically reduced cloud albedo (Vergara-Temprado et al., 2018). Clouds resulting from deep convection are also strongly sensitive to INPs. In this case, the INP spectrum is important, where INPs at around −5 °C trigger the Hallett–Mossop process, whereas INPs active below ≈ −25 °C are key in defining how much liquid water reaches homogeneous freezing (≈ −36 °C) and therefore the microphysical properties of anvil cirrus (Takeishi and Storelvmo, 2018; Hawker et al., 2021a, b). Measurements using ground- and space-based remote sensing tools also indicate a relationship between cloud phase and aerosol (Choi et al., 2010; Kanitz et al., 2011; Villanueva et al., 2021), and there are many cases where cloud glaciation occurs at much higher temperatures than can be accounted for by homogeneous freezing or overseeding (Radenz et al., 2021).
Given the dependence of clouds on primary ice formation and the variability of INP concentrations around the globe, cloud phase in global climate models should be tied to the INP population in the atmosphere (Murray et al., 2021). However, our ability to do this is limited by our understanding of the sources, transport, and interaction with clouds and sinks of the various aerosol species that have the capacity to nucleate ice (Hoose et al., 2010; Vergara-Temprado et al., 2017; Schill et al., 2020a).
To date there has been no robust predictor to provide information on how ice-active an aerosol particle is, so we rely on measurements that quantify which and how many atmospheric aerosol particles serve as an INP. The most discussed INP types in literature are mineral dust from low-latitude deserts (Chou et al., 2011; Niemand et al., 2012; Atkinson et al., 2013) and high-latitude dust (Tobo et al., 2019; Sanchez-Marroquin et al., 2020; Barr et al., 2023), marine organics and sea spray aerosol (Wilson et al., 2015; DeMott et al., 2016; Irish et al., 2017; Wilbourn et al., 2020), volcanic ash (Mangan et al., 2017; Fahy et al., 2022), and some anthropogenic emissions such as combustion ashes (Umo et al., 2015; Grawe et al., 2016) and agricultural emissions (O'Sullivan et al., 2014; Steinke et al., 2016; Hiranuma et al., 2021). The general picture is that biological INPs, including primary biological particles and biogenic aerosols, are thought to be important at temperatures above approx. −20 °C, whereas mineral dust is thought to be important at lower temperatures (Tobo et al., 2013; Hill et al., 2016; O'Sullivan et al., 2018; Schneider et al., 2021; Maki et al., 2023). However, our understanding of the specific sources of these biological INPs is poor; hence, field measurements in locations where there is a potential for biological INPs to be released are needed in order to try to understand and ultimately represent these sources in models. In this study, we focus on conducting INP measurements in the boreal forest environment, making use of the well-established Station for Measuring Ecosystem-Atmosphere Relations (SMEAR) II, located in Hyytiälä, Finland (Hari et al., 2013). Boreal forests are a known source of bioaerosols (Schumacher et al., 2013), but they have not been extensively characterized in terms of their potential to produce INPs. SMEAR II has been in operation since 1995, performing atmospheric and ecosystem measurements, and is well-known for frequent new particle formation events (Kulmala et al., 2001). This field site is set in a boreal forest made up of coniferous trees and is many kilometres from large urban centres or other anthropogenic aerosol sources. The HyICE-2018 campaign was launched in early 2018, a collaboration between 13 universities and institutions across 5 countries, with the aim of making ice-nucleating particle measurements in a boreal environment (Brasseur et al., 2022). The campaign was characterized by the transition period from winter to spring/summer, during which the snow, with an initial depth of up to 60 cm, melted between the end of March and mid-April. In the present paper we report INP measurements between −24 and −32 °C under mixed-phase cloud conditions (i.e. at water saturation) using the Portable Ice Nucleation Experiment (PINE) chamber (Möhler et al., 2021). This was PINE's first field deployment. The study on the same campaign presented by Schneider et al. (2021) focused on the temperature range higher than −25 °C and seasonality, while here we present measurements at temperatures below −24 °C and investigate the hourly variability. Paramonov et al. (2020) performed measurements in the same temperature range but over a different time period. Their measurements were from the end of February 2018 to the beginning of April 2018, whereas ours were from mid-March until mid-May, including the time of snowmelt and early spring. Only 4 d of our measurements is included in the measurement report from Brasseur et al. (2022), challenging several literature parameterizations. In our present article, we extend this analysis for the full 2 months to better understand the variability of the dataset. The focus here is on using PINE for high-temporal-resolution INP measurements to determine the variability of the INP concentration below −24 °C and which aerosol types contribute to the INP spectra at these low temperatures in this boreal forest environment.
2.1 The PINE chamber
PINE is a mobile cloud expansion chamber, which was developed in 2017 and commercialized in 2019 (Möhler et al., 2021). PINE has been used for both field measurements of INPs (the first example of which is presented here) and in laboratory-based studies (Ponsonby et al., 2024). In this study, the first prototype version, PINE-1A, was deployed; therefore, the following description is specified for PINE-1A and its configuration during the HyICE-2018 campaign.
PINE-1A consists of five interconnected parts: the inlet system, the cloud expansion chamber, the cooling system, the particle detection system and the control system. The inlet system contains a sampling tube connecting the ambient air inlet with two parallel mounted Nafion drying columns (Perma Pure, MD-700-24S-1). They are a crucial part of the inlet system, because they remove humidity from the sampled air in order to prevent the inlet to the chamber to become blocked with ice. Behind the dryers, a dew point sensor (dew point mirror MBW 973) monitors the humidity of the dried sampling air. For background measurements sampling particle-free air, an aerosol filter is manually installed between the ambient air inlet and the dryers. The core of PINE is the cloud expansion chamber, which has a cylindrical shape with conical end caps and a volume of approximately 7 L. Inside the chamber are three thermocouples, mounted 5 cm from the wall, measuring the gas temperature at the top, in the middle and at the bottom of the chamber. On the same levels are another set of temperature sensors glued to the wall to measure the temperature there. To cool the cloud expansion chamber to mixed-phase cloud temperatures, a chiller (Lauda RP 855; Lauda-Königshofen, Germany) is used, where cooled ethanol flows through pipes wrapped around the cloud expansion chamber. It can either hold the chamber at a constant temperature or perform a predefined temperature ramp given the temperature to attain and the time to hold this temperature. Mounted on the bottom of the cloud expansion chamber is an optical particle counter (OPC), which is, in this study, a combination of a welas® 2500 sensor and a Promo® 2000 control unit (Palas GmbH). The OPC detects larger aerosol particles, liquid cloud droplets and ice crystals as single particles, based on the size- and shape-dependent scattering signal. Due to their spherical shape, liquid cloud droplets are detected with their actual size, while the aspheric ice crystals show a higher scattering signal and are thus detected a larger diameter than cloud droplets. Aerosol particles have been proven to be detected at smaller diameters than cloud droplets and can thus be differentiated from ice crystals. A detailed discussion can be found in Möhler et al. (2021). During the HyICE-2018, the OPC was set to measure particles with a diameter between 0.6 and 40 µm. The welas® 2500 sensor only analyses 10 % of the particles crossing the sensor, which leads to a detection limit of approximately 5 L−1. The control system, made of multiple flow controllers and a LabVIEW software, ensures a smooth operation of PINE, bringing all the components together.
PINE operates in a continuous way, where sequences composed of the three modes named “flush mode”, “expansion mode” and “refill mode” are repeated constantly. During the flush mode the chamber is filled with air containing the aerosol under investigation, and the pressure and the gas and wall temperature are held constant. When the aerosol population inside the chamber is renewed, the expansion mode is started by closing the PINE inlet while continuing to pump out air with a designated flow rate. By pumping out air, the pressure inside the chamber decreases adiabatically and with that also the gas temperature. Consequently, the saturation with respect to water and ice increases, allowing liquid cloud droplets and ice crystals to form once they exceed supersaturation. The expansion mode ends when the pressure reaches a pre-set value. The expansion mode is followed by the refill mode, where the chamber is slowly filled up with particle-free air to the initial pressure. At the end of the refill mode, the chamber is reopened and the next flush mode begins. For each individual expansion mode, an INP concentration is calculated by combining the number of ice crystal counts and the volume of analysed air and corrected for standard conditions (i.e. all ice-particle concentrations are reported at standard temperature and pressure). The INP concentration is assigned to the lowest temperature measured during the expansion mode with the gas temperature sensor at the bottom of the chamber. The uncertainty for the INP concentration is given as 20 % (Möhler et al., 2021) and is not displayed in the following figures to keep them clear.
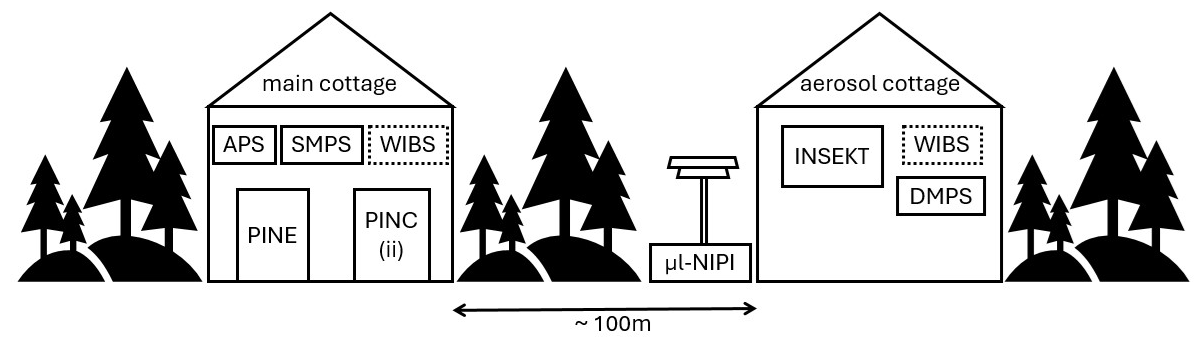
Figure 1Overview of the instruments' measurement locations at the SMEAR II station. Both the main cottage and the aerosol cottage are located inside the forest. The dashed line around WIBS indicates that this instrument measured in both locations and was moved on 3 April from the main cottage to the aerosol cottage. All other instruments stayed at the same sampling location throughout the whole campaign.
2.2 Installation and operation of PINE at SMEAR II
At the SMEAR II station, PINE was placed in the main cottage (Fig. 1), situated in the forest (Brasseur et al., 2022). The other online INP counters, Portable Ice Nucleation Chamber (PINC, operated by ETH Zurich; Kanji et al., 2013) and Portable Ice Nucleation Chamber ii (PINCii, operated by University of Helsinki and University of Gothenburg; Castarède et al., 2023), were also installed in the main cottage. Results from these complementary instruments are presented in Paramonov et al. (2020) and Brasseur et al. (2022). All instruments sampled from a heated total aerosol inlet positioned 6 m above ground level. Due to the setup of the PINE chamber in the cottage, the inlet line contained some bends that resulted in the loss of larger aerosol particles. An additional impactor was not installed. The PINE inlet was characterized on site using an OPC (MetOne, GT 526S) directly at the aerosol inlet and at the entrance of PINE to compare the number concentration in five different size bins of particles behind the inlet with those entering PINE. With that the transmission efficiency was calculated, which showed a 50 % cut-off for particles between 5 and 10 µm in diameter. In the size range between 3 and 5 µm, 80 % of the particles were still able to enter the PINE chamber.
PINE was continuously operated from 13 March 2018 until 11 May 2018 in the temperature range of mixed-phase cloud conditions between −24 and −32 °C. Most days PINE ran at a constant temperature between −28 and −30 °C, and measurements at the higher and lower ends of the broader temperature range were mainly reached while performing temperature ramps. Temperature ramps were programmed to last approximately 3 h, in which the temperature was decreased every hour by 2 to 3 °C. The cooling times to attain the temperatures were in the range of a few minutes.
In this campaign we operated PINE under mixed-phase cloud conditions, so we always generated a liquid cloud and counted the number of ice crystals that grew out of the liquid cloud. During an expansion, the temperature inside the cloud chamber is lowered around 6 °C within 40 s. It is evident that water-saturated conditions are reached with the formation of a liquid cloud. Any ice crystals that form during the expansion grow rapidly in the strongly ice-supersaturated environment. In contrast to other instruments, the relative humidity during the expansion was not directly measured since the appearance of droplets defines the RH in the chamber.
Each morning a background test was performed, to ensure that no frost artefacts are seen in the OPC signal, in order to avoid miscounting ice crystals. For background tests, an aerosol particle filter is mounted between the ambient air inlet and the dryers, and the cloud expansion chamber is filled with particle-free air. In this configuration, five expansions are conducted, after which no ice crystals and almost no cloud droplets are counted by the OPC, showing that the chamber is fully clean.
Throughout the campaign, PINE was operated with the same settings for the flush, expansion and refill mode, which were as follows:
-
flush mode, flow of 3 L min−1 for a duration of 4 min;
-
expansion mode, flow of 4 L min−1 until the pressure inside the chamber reaches 700 mbar;
-
refill mode, flow of 3 L min−1 until the chamber is filled;
Given these settings, the total duration of one sequence of flush mode, expansion mode and refill mode was approximately 6 min.
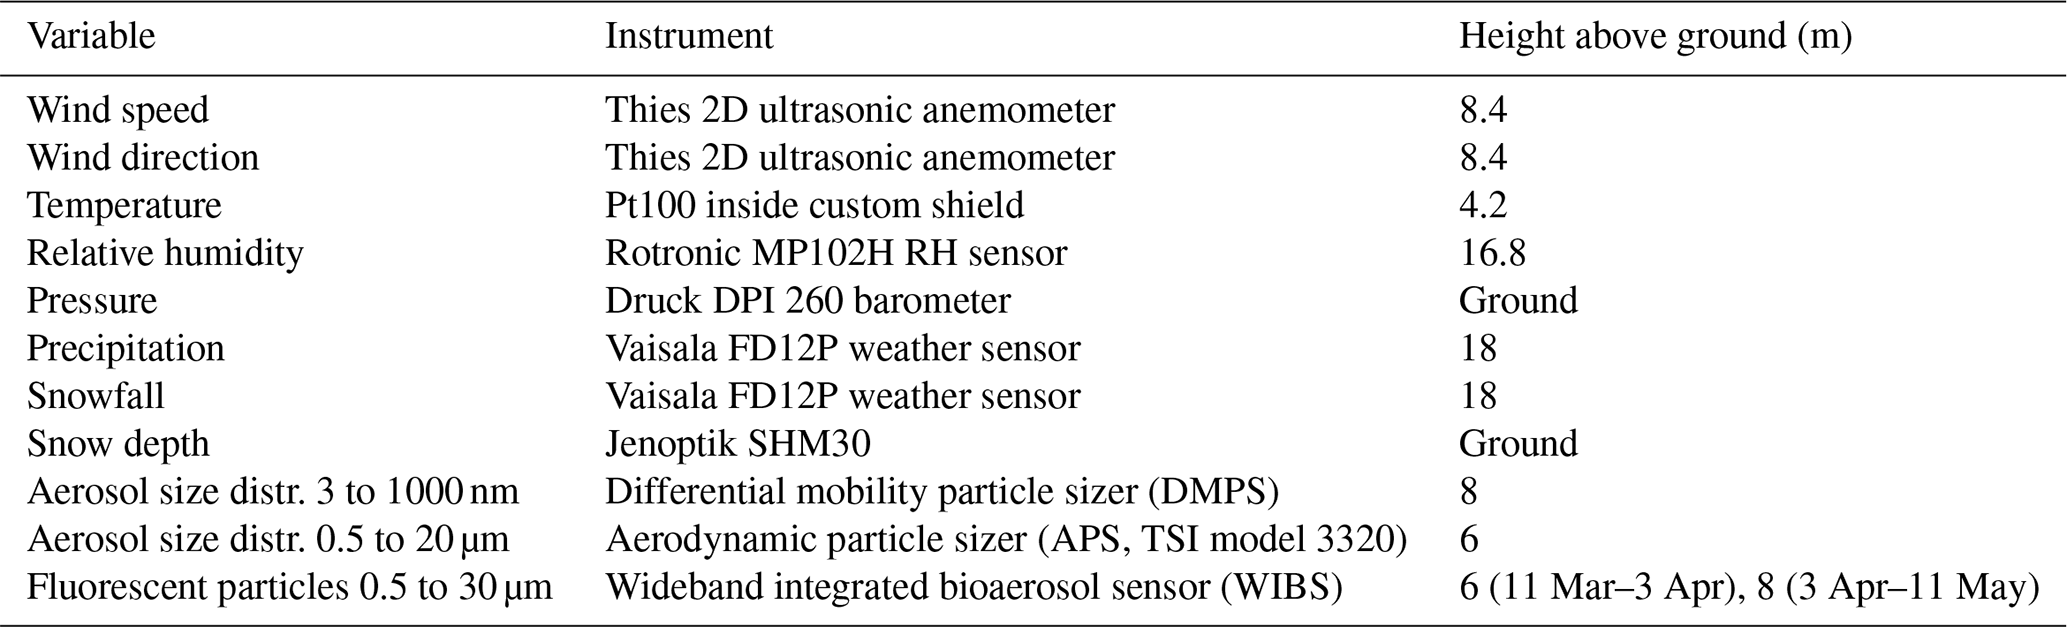
Table 1Overview of variables measured at SMEAR II and used here for data analysis. The information is divided into the measured variable, the instrument and the sampling height above ground level.
2.3 Offline INP measurements
The online INP measurements of PINE are compared to two different offline INP methods, namely INSEKT (Ice Nucleation Spectrometer of the Karlsruhe Institute of Technology) and µL-NIPI (µL Nucleation by Immersed Particles Instrument). Those freezing assay techniques are described in detail in Schneider et al. (2021) and O'Sullivan et al. (2018), and only a short explanation is given here. The specific methodology employed in HyICE-2018 is also described in Brasseur et al. (2022), and the associated data are publicly available in databases (https://doi.org/10.5281/zenodo.10469663 and https://doi.org/10.5445/IR/1000120666). For both methods, aerosol particles are collected on 0.4 or 0.2 µm nuclepore filters using a defined flow for a given time. The INSEKT filters used for comparison were sampled for 24 h in the aerosol cottage, about 100 m from the main cottage, and µL-NIPI filters sampled for between 4 and 18 h using commercial samplers with PM10 inlet heads (BGI PQ100, Mesa Laboratories Inc.). For the offline INP analysis, the aerosol loaded filters are washed into 8 mL of NanoPure™ (conductivity of approximately 0.056–0.057 µS cm−1) water (Vsol) to create a suspension containing the sampled aerosol. For INSEKT filter analysis, the original suspension is diluted 15 and 225 or 10 and 100 times, which allows the resulting INP–temperature spectrum to be extended towards temperatures as low as −25 °C. The suspension is placed in 50 µL volumes in the wells (Vwell) of a PCR plate. As a freezing reference, a subset of wells are filled with NanoPure™ water. The PCR plates are placed in an aluminium block, which is cooled at a rate of 0.33 °C min−1 to a temperature at which all solution droplets inside the wells freeze. A camera records the freezing of the droplets, and together with the temperature at which they froze an INP–temperature spectrum is obtained. The resulting INP concentration is calculated per standard litre of air following Eq. (1):
d is the dilution factor, Vair is the volume of the sampled air that passed the filter and fliq is the fraction of liquid wells at a certain temperature of the measurement.
For µL-NIPI filter analysis, the suspension is pipetted to form an array of droplets of 1 µL volume on a hydrophobic glass slide. The glass slide is cooled with a rate of 1 °C min−1, until all droplets freeze. As with INSEKT, a camera records the freezing of the droplets. The obtained INP concentrations are given per standard litre of air.
2.4 Additional aerosol and meteorological measurements
SMEAR II is an aerosol and trace gas measurement site equipped with a large set of instrumentation measuring meteorological variables and aerosol properties (Hari et al., 2013; Junninen et al., 2009; Neefjes et al., 2022). Extended descriptions of the instruments can be found in Schneider et al. (2021) and Brasseur et al. (2022), so here we briefly mention the instruments and measured variables utilized in this study.
Meteorological variables are measured at different heights above ground level on a 150 m meteorological mast. If possible, data closest to the inlet height of 6 m are utilized; however, some variables are only available at somewhat higher or lower levels. Table 1 summarizes the instrumentation and height at which the measurements are taken. Aerosol particle size distributions are measured with a differential mobility particle sizer (DMPS), for diameters between 3 and 1000 nm and with an aerodynamic particle sizer (APS) the particles between 0.5 µm and 20 µm in diameter. The data are merged during analysis. For consistency, we work with the DMPS and APS data from Schneider et al. (2021) and for further information refer to their work. A WIBS (wideband integrated bioaerosol sensor) measures particle fluorescence with two excitation lasers (wavelength of 280 and 370 nm), and emission is monitored in two detection bands (310 to 400 nm and 420 to 650 nm). A fluorescence threshold is applied to differentiate highly fluorescent biological particles from weakly fluorescent particles like dust. The two lasers and the two detection bands allow detailed differentiation of particle types (Cornwell et al., 2023). WIBS detected particles with an optical diameter larger than 0.5 µm. During the campaign a WIBS-NEO (Droplet Measurement Technology) was operated. From 11 March to 3 April, it was installed in the main cottage and thereafter moved to the aerosol cottage. The cottages have inlets with a different size cut-off, specifically 5 µm in the main cottage and 10 µm in the aerosol cottage. The concentrations of the large particles measured with WIBS show no significant increase after the change of the location, so we use the data without applying a correction. More detailed information can be found in Schneider et al. (2021) and Brasseur et al. (2022).
For 2 months, PINE measured the INP concentration continuously in a boreal forest for temperatures between −24 and −32 °C, the lower temperature regime of mixed-phase cloud conditions.
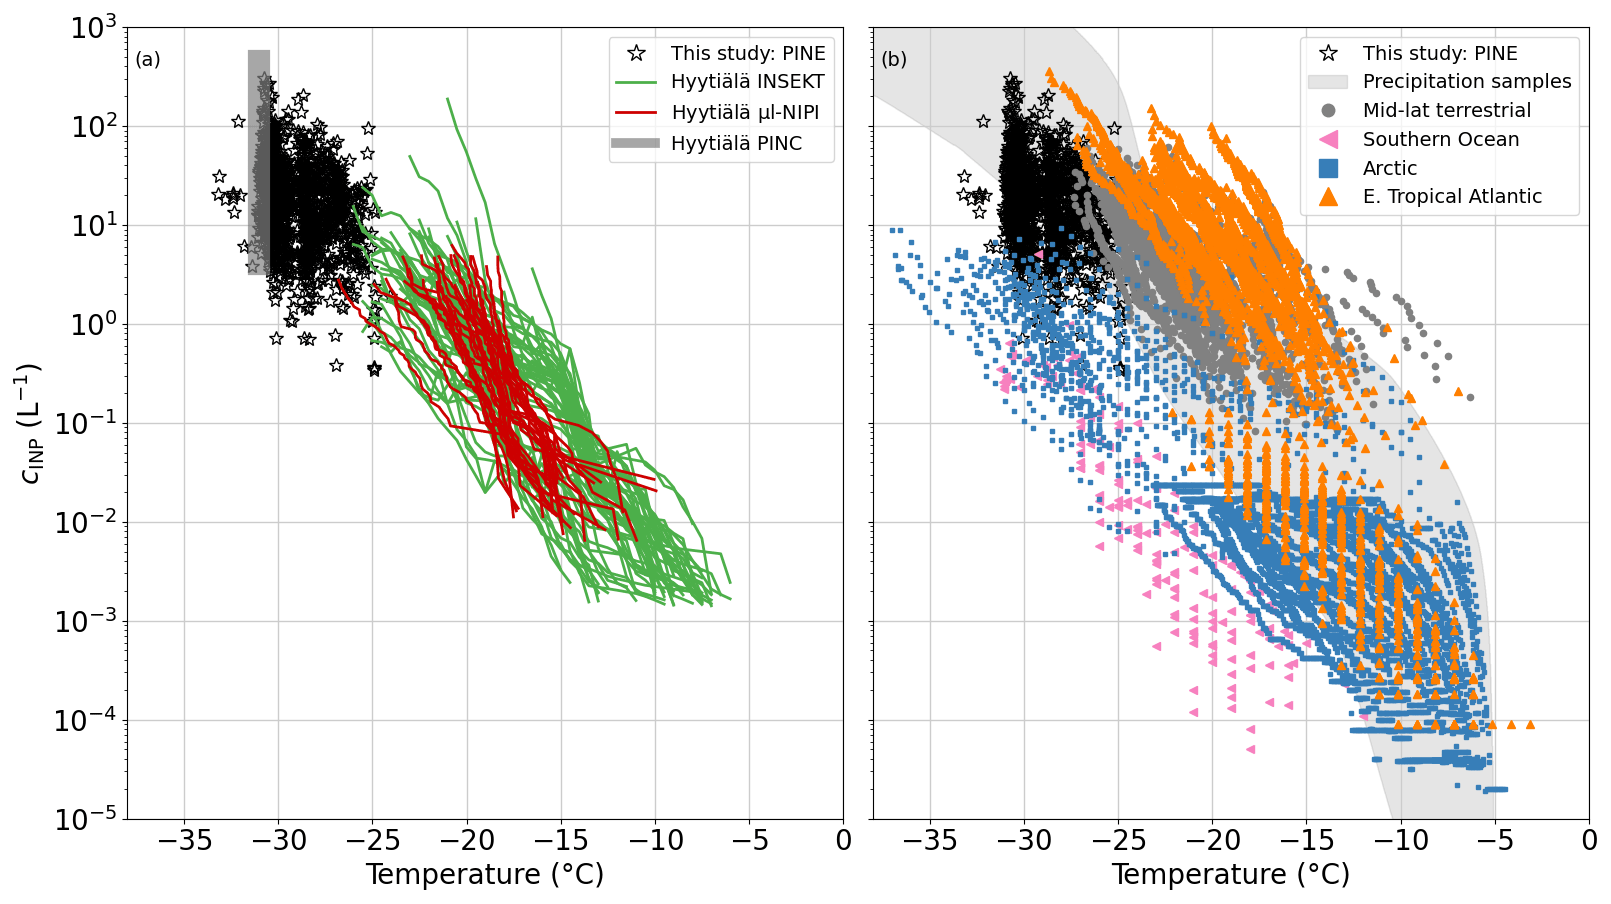
Figure 2(a) Comparison of INP concentrations (cINP) measured with PINE (black stars), INSEKT (green lines), µL-NIPI (red lines) and PINC (grey box) during HyICE-2018 and (b) with INP measurements from a variety of locations around the world. The precipitation samples collected around the world (grey shading) originate from Petters and Wright (2015), the Arctic measurements (blue squares) are from Irish et al. (2019); Wex et al. (2019); Porter et al. (2022), those from the eastern tropical Atlantic (orange triangles) are from Price et al. (2018); Welti et al. (2018), the mid-latitude terrestrial data (grey dots) are from O'Sullivan et al. (2018) and data from the Southern Ocean (pink triangles) are from McCluskey et al. (2018).
Figure 2 provides an overview of how the 1 h time-averaged PINE data from this monitoring (black stars) compare to the filter-based measurements and CFDC (continuous flow diffusion chamber) measurements of PINC from the same campaign (Fig. 2a) and measurements from various locations and source regions around the world (Fig. 2b) acquired from filter samples, precipitation samples and continuous-flow diffusion chamber measurements. For the given temperatures, the PINE INP measurements span 2 orders of magnitude from a minimum INP concentration of approximately 0.5 to 500 L−1. The PINE data mainly extend the INP spectra of INSEKT and µL-NIPI towards lower temperatures. An overlap with INSEKT is only found at temperatures near −25 °C. PINE and PINC data overlap at the lower end of the covered temperature range and fully agree in the span of measured INP concentrations. Therefore, once combined, data from HyICE-2018 provide INP data from the Finnish boreal forest between −6 and −32 °C and thus cover almost the full mixed-phase cloud regime. In comparison to other locations, the PINE INP data compare best with INPs from mid-latitude terrestrial sources (grey dots). INP concentrations measured in the Arctic (blue squares) and Southern Ocean (pink triangles) are mainly lower, whereas INP measurements from the eastern tropical Atlantic (orange triangles) are mainly higher than what was measured in the boreal forest. So the INP concentration measured with PINE in Hyytiälä falls within the middle range of INP concentrations in comparison to a more global overview.
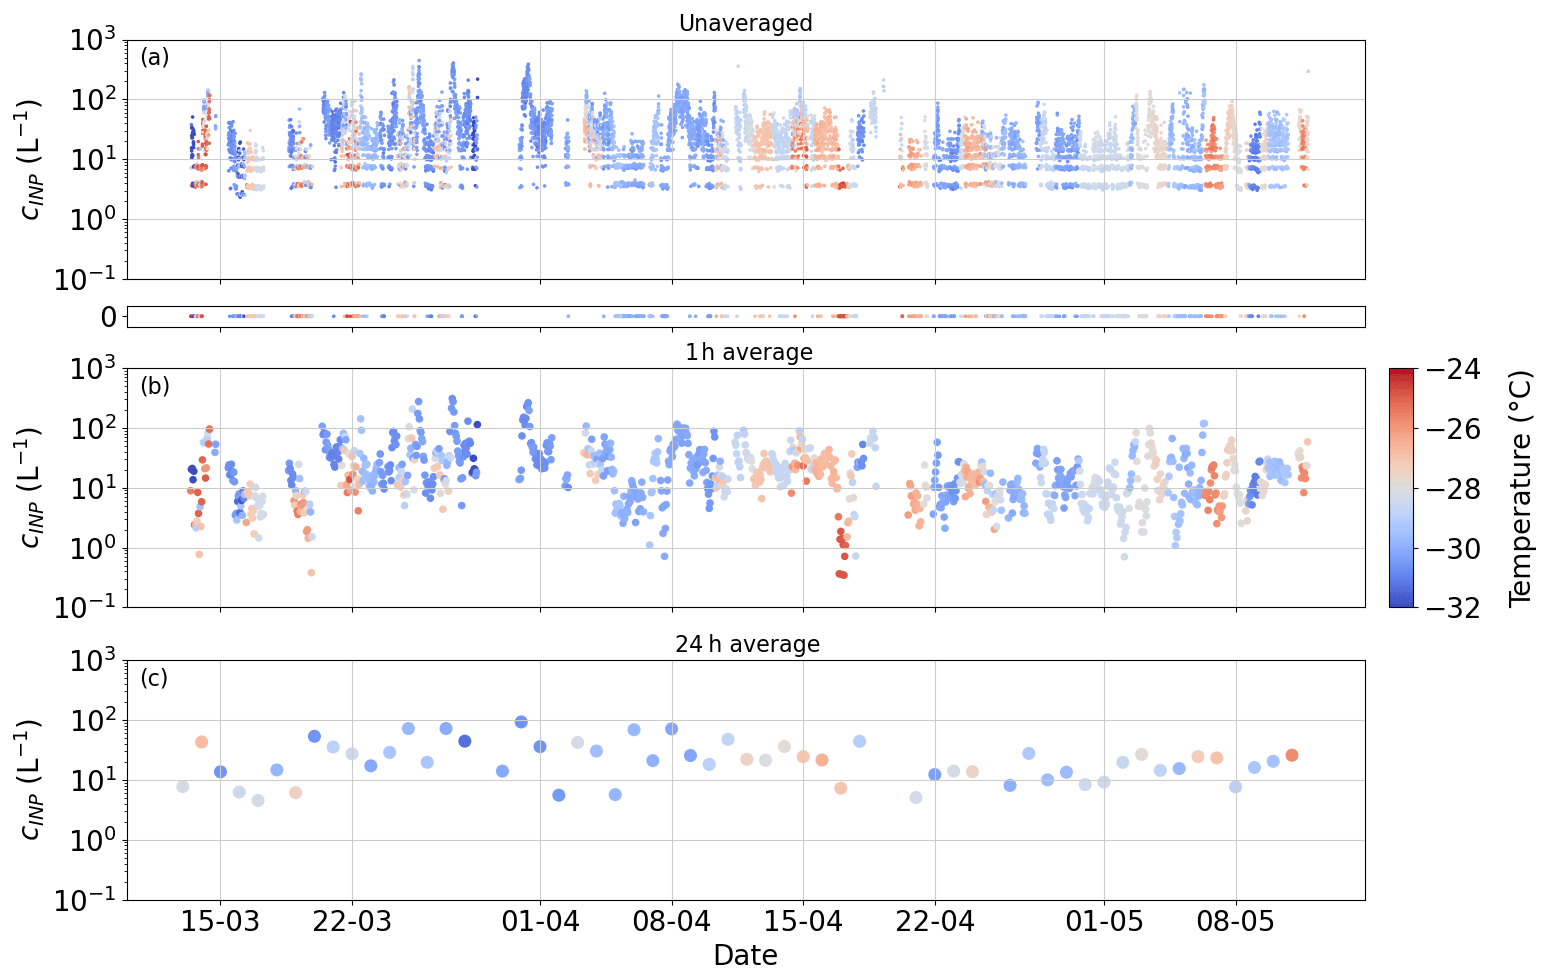
Figure 3Time-averaged PINE INP data over different periods. The measurements cover freezing temperatures between −24 and −32 °C. Panel (a) shows the unaveraged PINE data, where each data point represents one expansion. The small panel below indicates the expansions in which no ice crystals were counted. Panels (b) and (c) contain the 1 and 24 h time averages, respectively.
3.1 Time-averaging PINE data
PINE measured INP concentrations with a time resolution of approximately 6 min, where from each expansion one data point was obtained (Fig. 3a). The range of the unaveraged measured INP concentrations spreads over 2 orders of magnitude between 5 L−1 and approximately 500 L−1. These single expansion data show the same variation over the entire 2 months of the campaign, where very high and very low INP concentrations were measured within a few hours or days. Among all the performed expansions, about 10 % had 0 ice crystal counts and are therefore represented as an INP concentration of 0 L−1. These 0 ice crystal runs occurred throughout the campaign and over almost the entire temperature range between −24 and −32 °C, emphasizing the observed variation in the overall INP concentration. A quantization of the data is visible, when only 1, 2 or 3 ice crystals were counted during an expansion as stripes of data points at around 5, 8 and 10 L−1, respectively, carrying a large counting error of . However, the daily background tests ensured that these low ice counts are associated with INPs, rather than frost artefacts from the chamber walls or other artefacts such as electrical noise. A detailed discussion of the background measurements is given in Möhler et al. (2021). The non-averaged high-time-resolution data illustrate short-term INP variability, but to improve counting statistics and compare with other data, some time averaging is needed. To improve the counting statistics, we average over several expansions, thus also reducing the influence of instances where there are zero or very few ice crystals observed per expansion. With 1 h averages, all zeros and quantized values are removed, while information on the temporal evolution of the INP concentration is preserved (Fig. 3b). In addition, 1 h averages lead to an order of magnitude increase in the lowest detectable INP concentration. To compare the PINE measurements with offline INP methods such as INSEKT and µL-NIPI, even longer time averaging, in this case 24 h, is needed (Fig. 3c). By averaging such highly time-resolved data over 1 d, information about the short-term variation on a timescale of hours gets lost, and only trends on a longer timescale of days to weeks are pictured. This highlights that INP measurements with a high time resolution, as done with PINE, over a long time period are important. Various time averages can be applied later, depending on the goal of the analysis.
3.2 Comparison of temperature ramps of PINE with INSEKT and µL-NIPI
The consequences of the time averaging and the loss of short-term variations in the INP concentration can also be seen by comparing PINE measurements to INSEKT and µL-NIPI (Fig. 4). An INSEKT filter was typically sampled for 24 h, while µL-NIPI filters were sampled for 12 h (day and night) and PINE performed in the same time period six temperature ramps, where one ramp lasts approximately 3.5 h. In this case three temperatures were set during the ramp, resulting in data points scattered by ±2 °C around the set temperature. To obtain a continuous spectrum, the data were binned in 1 °C steps. The overlap in temperature for INSEKT and PINE is only at −24 °C, while PINE and µL-NIPI do not overlap. However, PINE nicely extends the INP–temperature spectrum towards lower temperatures. µL-NIPI measurements overlap with INSEKT for the entire temperature range. Comparing the day and night filters from µL-NIPI, one can see that the day filter is fully in the range of the INSEKT filter for temperatures higher than −18 °C, and the night filter shows up to 1 order of magnitude lower INP concentrations for temperatures between −18 and −20 °C. During the same sampling period, PINE performed six temperature ramps, which show a variation of a factor of 5 over the captured temperature range. The PINE data at −24 °C are consistent with the INSEKT data at that temperature. On average, the PINE measurements (black upside-down triangles) align well with the INSEKT INP–temperature spectrum and extend these measurements towards lower temperatures. This comparison is another illustration that PINE is able to capture a short-term variability which would otherwise be missed with the filter-based measurements or when averaging data.
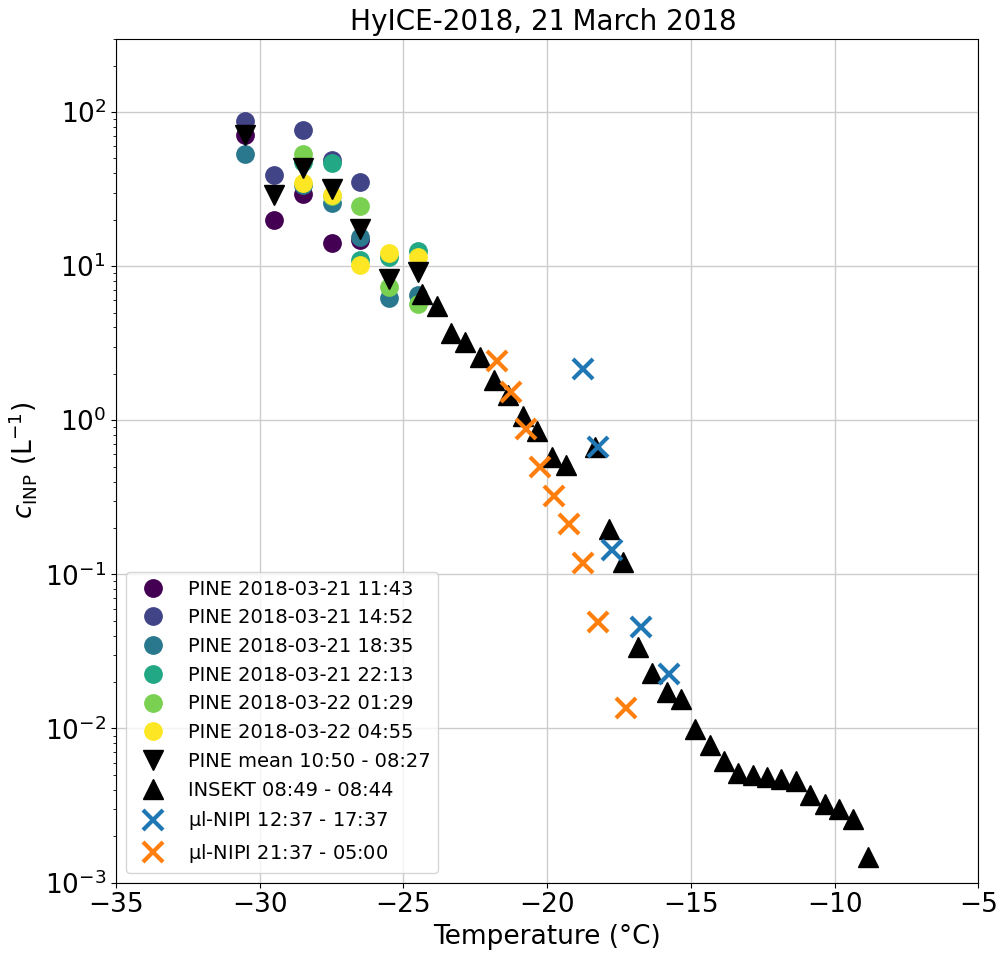
Figure 4Comparison of the INP concentration of PINE temperature ramps with INSEKT and µL-NIPI data in the sampling period of 21 March. For the sampling period of the INSEKT filter (black triangles), the start and stop times are given, with the start day on 21 March and the stop day on 22 March. The µL-NIPI filters are divided into a day (orange cross) and a night (blue cross) filter. PINE measurements are split into the individual temperature ramps (coloured dots) and an average of the full sampling period of PINE (black upside-down triangles). The times of the individual PINE temperature ramps are the times when half the ramp is over.
3.3 Comparison of measured INP concentrations to those predicted with literature parameterizations
To represent primary ice formation in the atmosphere in models, a number of parameterizations have been developed and relate the INP concentration to various properties of the aerosol population or to meteorological variables. Here, we compare our PINE INP measurements with four parameterizations that we consider the most suitable for the measurement location. Those are from DeMott et al. (2010), based on measurements in various locations and different aerosol types, Tobo et al. (2013), who used data acquired in a conifer forest in summertime to present two different parameterizations, and Schneider et al. (2021) making use of measurements during the same campaign using INSEKT data. Hereafter, the four parameterizations are referred to as DeMott 2010, Tobo 2013 (1), Tobo 2013 (2) and Schneider 2021. DeMott 2010 and Tobo 2013 (1) base their INP concentration predictions on the concentration of aerosol particles larger than 0.5 µm in diameter, Tobo 2013 (2) uses the concentration of fluorescent particles with a diameter larger than 0.5 µm measured with a UV APS with an excitation wavelength of 355 nm and an emission wavelength range between 420 and 575 nm, and Schneider 2021 found the ambient air temperature to be a predictive parameter. The valid temperature ranges for DeMott 2010 and Tobo 2013 (1) and (2) are given from −15 to −35 °C and from −5 to −35 °C, respectively, covering the full temperature range of the PINE measurements. Even though fluorescent particle measurements to develop the Tobo 2013 (2) parameterization were done with a different instrument, it is interesting to apply this parameterization on our data due to the similarity of the measurement environments. Due to the setup of WIBS it provides measurements of seven different combinations of excitation wavelength and detection band wavelength, whereas the UV APS provides only one channel. With that, the WIBS can capture more various bioaerosols, and the INP concentrations predicted by Tobo 2013 (2) should be seen as an upper estimation. Schneider 2021 is limited to temperatures between −5 and −25 °C, which is mainly outside the range of the PINE measurements. However, since it is based on measurements in the same location and during the same time period, it is still valuable to apply this parameterization to our data.
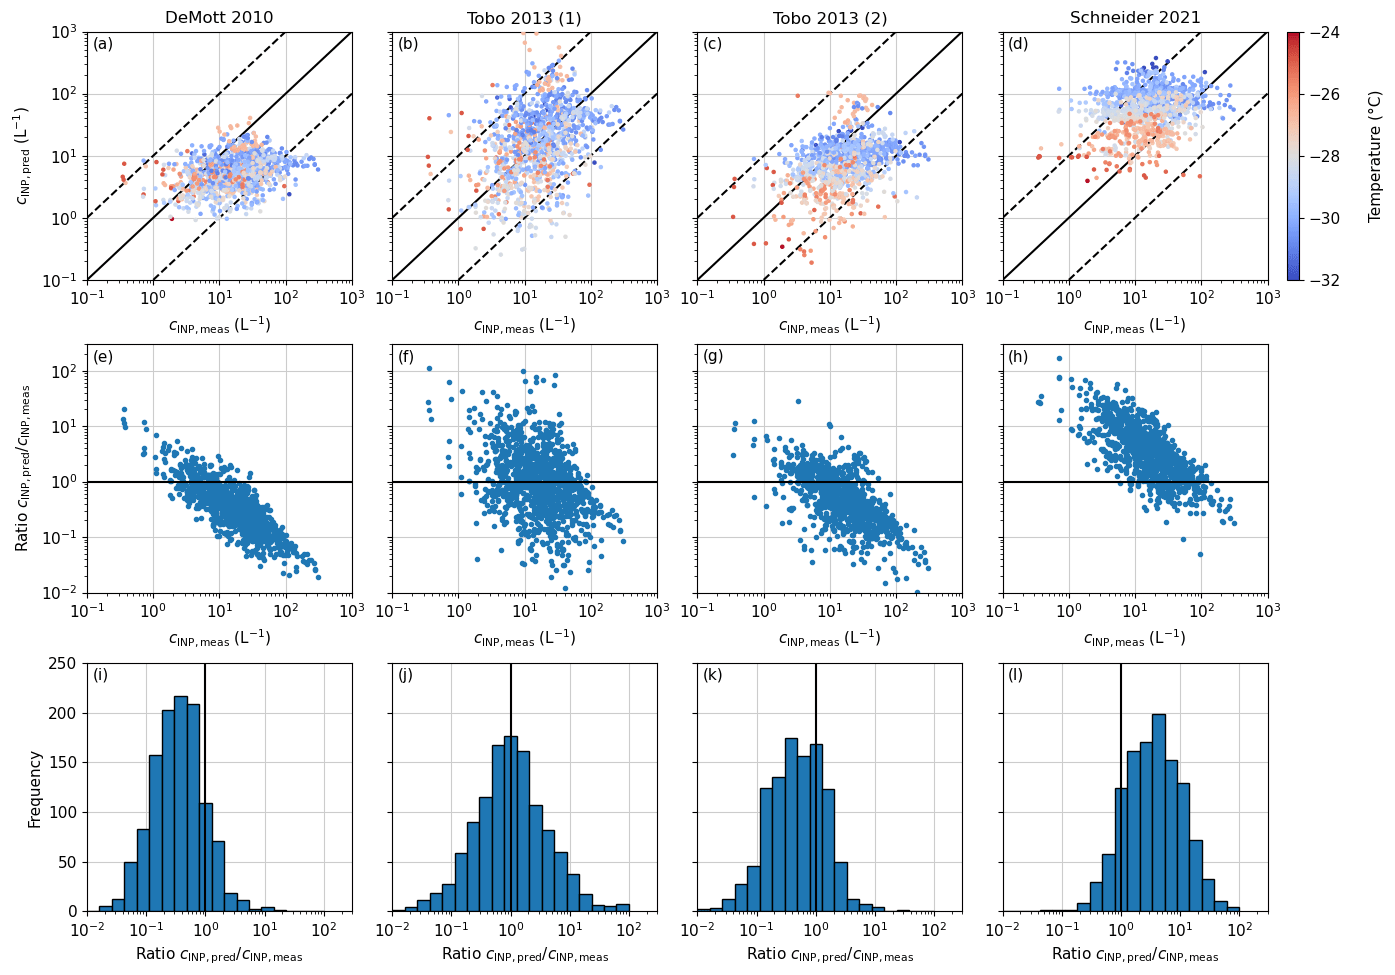
Figure 5Predictions for PINE INP concentration using the parameterizations of DeMott 2010 (a), Tobo 2013 (1) (b), Tobo 2013 (2) (c) and Schneider 2021 (d). The solid line represents the 1:1 line, and the dashed lines are a factor of 10 lower and higher than the 1:1 line. The plots in the second row (e–h) represent the evolution of the ratio of the predicted INP concentration (cINP,pred) to the measured INP concentration (cINP,meas) with an increasing measured INP concentration. The solid line is unity, where the prediction matches exactly the measured value. Panels (i)–(l) are histogram representations of the ratio , where the solid line is again unity.
Applying DeMott 2010, Tobo 2013 (1) and (2), and Schneider 2021 to our PINE data to test them for their predictive capability, 1 h time-averaged data were used to align the INP data with the aerosol data from the SMEAR II APS. DeMott 2010 tends to underpredict the majority of the data by a factor of 5 to 10 (Fig. 5a). In order to highlight the offset from the 1:1 line, the ratio of the predicted to the measured INP concentration () was calculated, where 1 is a perfect prediction. Values larger than 1 indicate an overprediction of the parameterization and smaller values an underprediction. In the case of DeMott 2010, a clear trend from overprediction to underprediction is visible for increasing INP concentrations (Fig. 5e). This corresponds to the temperature dependence of the parameterization being too shallow. The corresponding frequency histogram in Fig. 5i peaks between 0.5 and 0.7, showing that a majority of the data points remain within a factor of 10. Moreover, DeMott 2010 gives a variation in the INP concentration of generally less than 2 orders of magnitude, whereas the measured INP concentrations vary by almost 3 orders of magnitude.
Comparing our PINE INP data with Tobo 2013 (1) predictions, the data are scattered around the 1:1 line with the majority of data within a factor of 10 (Fig. 5b). For Tobo 2013 (1), the cINP,pred-to-cINP,meas ratio indicates a slight trend towards an underprediction for higher INP concentrations (Fig. 5f) but less pronounced than for DeMott 2010. The frequency histogram in Fig. 5j shows a symmetric distribution around unity, underlining that overall Tobo 2013 (1) predicts the INP concentration well, which could be because it is based on measurements in a coniferous forest with similar biological INP sources to those in the boreal forest in Finland.
When using the concentration of fluorescent particles as a predictive parameter in Tobo 2013 (2), the INP concentration tends to be underpredicted by about a factor of 2 (Fig. 5c). As discussed before, this is the upper estimate of the INP concentration due to the differences in UV APS and WIBS, and the predicted INP concentrations can be even lower. As for DeMott 2010, low INP concentrations were more overpredicted than higher INP concentrations (Fig. 5g). The histogram (Fig. 5k) has a wide peak between 0.5 and 1. This means that the measured INP concentration from the boreal forest in Finland cannot be predicted by biogenic particles (as measured by the WIBS) only but is rather a combination of biogenic particles and larger aerosol particles from different sources.
In contrast to DeMott 2010 and Tobo 2013 (2), Schneider 2021 overpredicts the INP measurements, with larger deviations at lower temperatures (about 1 order of magnitude below −28 °C; Fig. 5d). At temperatures that overlap with the INSEKT data (−24 to −25 °C), the agreement between the parameterization and PINE measurements is much better. Compared to DeMott 2010 and Tobo 2013, Schneider 2021 links the INP concentration to the ambient air temperature to represent the seasonality in the INP concentration. The ratio of predicted to measured INP concentration in Fig. 5g shows a clear overprediction for lower INP concentrations and an underprediction for the higher measured INP concentrations. Also the frequency plot in Fig. 5l shows a symmetric distribution with a peak between 5 and 7. The discrepancies applying the Schneider 2021 parameterization may originate from the valid temperature range, which is above −25 °C. Furthermore, the INP data measured with PINE have a less pronounced temperature dependence compared to those measured with INSEKT, which could be due to a different portion of the aerosol particle population serving as INPs in the respective temperature regimes. Moreover, freezing assays like INSEKT measure only INPs from the immersion freezing mode, while PINE can also capture deposition and condensation nucleation. At temperatures higher than −36 °C, the temperature at which water freezes homogeneously, the contribution of deposition and condensation nucleation is thought to be low (Westbrook and Illingworth, 2011) but may still explain some of the discrepancies.
3.4 Correlation of INP concentration with aerosol and meteorological variables
Driving factors for changes in the INP concentration can vary, as is hinted at in the application of the different predictive parameters used for the DeMott 2010, Tobo 2013 (1) and (2), and Schneider 2021 parameterizations. Only the Tobo 2013 (1) parameterization predicted the measured INP concentration within 1 order of magnitude. To further investigate potential connections between ice nucleation activity and meteorological variables and aerosol properties at temperatures between −27 and −30 °C, correlation coefficients are calculated. The correlations are calculated using the Spearman correlation coefficient. Here, we also present the p value connected to each correlation coefficient, indicating whether a correlation is statistically significant (p < 0.05) or not (p > 0.05). Correlations for all meteorological variables listed in Table 1, as well as some aerosol properties and “time over land” and the INP concentration, are displayed in Fig. 6. The time over land is a parameter determined from back-trajectory analysis and corresponds to the time an air mass spends over the boreal forest environment before being measured at the SMEAR II station. For the correlation analysis, only air masses from the corridor between north and west of Hyytiälä, the so-called clean sector, are considered to eliminate potential continental aerosol sources. More information concerning this parameter and the way it is calculated can be found in Petäjä et al. (2022). To limit biases in the correlations due to the wide temperature range of the PINE measurements, only data points between −27 and −30 °C are considered, which includes the majority of all data and covers the entire time range. In Fig. 6, we show the correlation coefficients for 1 h averaged data as well as the 24 h averaged data. The correlation coefficients are generally not significantly different between the two time averages. However, the p value gives more statistical significance to the 1 h averages, so we focus the discussion on that data.
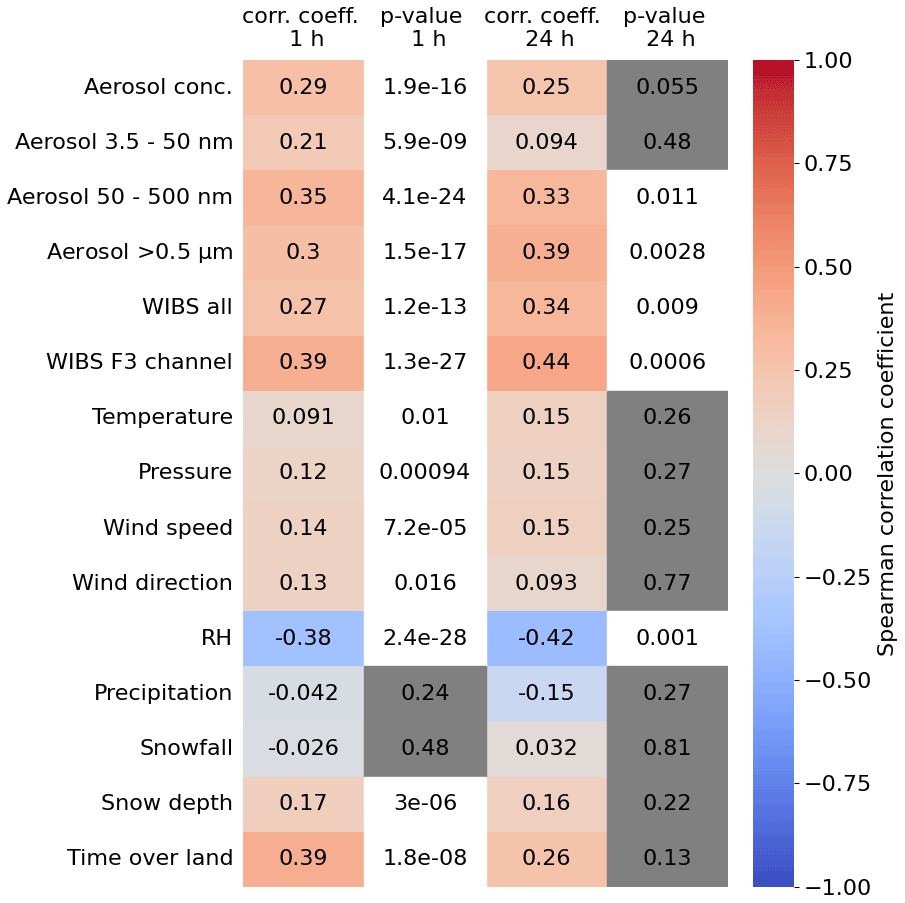
Figure 6Spearman correlation coefficient calculated for full campaign period using 1 and 24 h time averages of the PINE INP data. The temperature range of PINE measurements was limited to temperatures between −27 and −30 °C. Red colours represent a positive correlation, whereas blue colours indicate a negative correlation. The p values marked with grey boxes indicate p > 0.05; i.e. the correlation is not considered to be statistically significant.
The highest positive correlations, albeit still weak, are found between INP concentration and the WIBS F3 channel (0.39) and the time over land (0.39). The p values indicate that these correlations are significant. An aerosol particle entering WIBS gets excited by two lasers with a different wavelength and can be detected in two different detection bands. Depending on its composition, fluorescence is detected in only one or more laser detection band channels. The F3 channel is fluorescence-triggered by the 370 nm laser and detected in the 420 to 650 nm band. Particles detected only in this channel can be assigned to NAD(P)H, which is a tracer for the viable biological fraction (Savage et al., 2017). Also, the correlation between particles larger than 0.5 µm in diameter and the total concentration of fluorescent particles show enhanced positive correlations (0.3 and 0.27). These weak correlations indicate that aerosol particles larger than 0.5 µm that are biological may preferentially serve as INPs. This is consistent with the heat test data reported by Schneider et al. (2021) for the same location where they observed a substantial decrease in the INP concentration after heating, indicating the presence of a population of protein-based ice-nucleating entities (Daily et al., 2022). This is also consistent with the size-resolved INP measurements reported by Porter et al. (2022), who demonstrated that below −23 °C, the 2.5 to 10 µm size category was more important than smaller-sized aerosol to the INP population. The correlation with aerosol concentrations between 3.5 and 50 nm is much weaker (0.2). There were new particle formation (NPF) events during the HyICE-2018 campaign (Brasseur et al., 2022) that created high concentrations of aerosol particles smaller than 50 nm; hence, the lack of correlation with those aerosol particles indicates that they do not serve as INPs. The total aerosol concentration and the aerosol concentration of particles with diameters between 50 and 500 nm have values of 0.29 and 0.35, respectively, meaning that besides the bioaerosol particles from the coarse mode, there may also be INPs in the population of aerosol particles smaller than 500 nm.
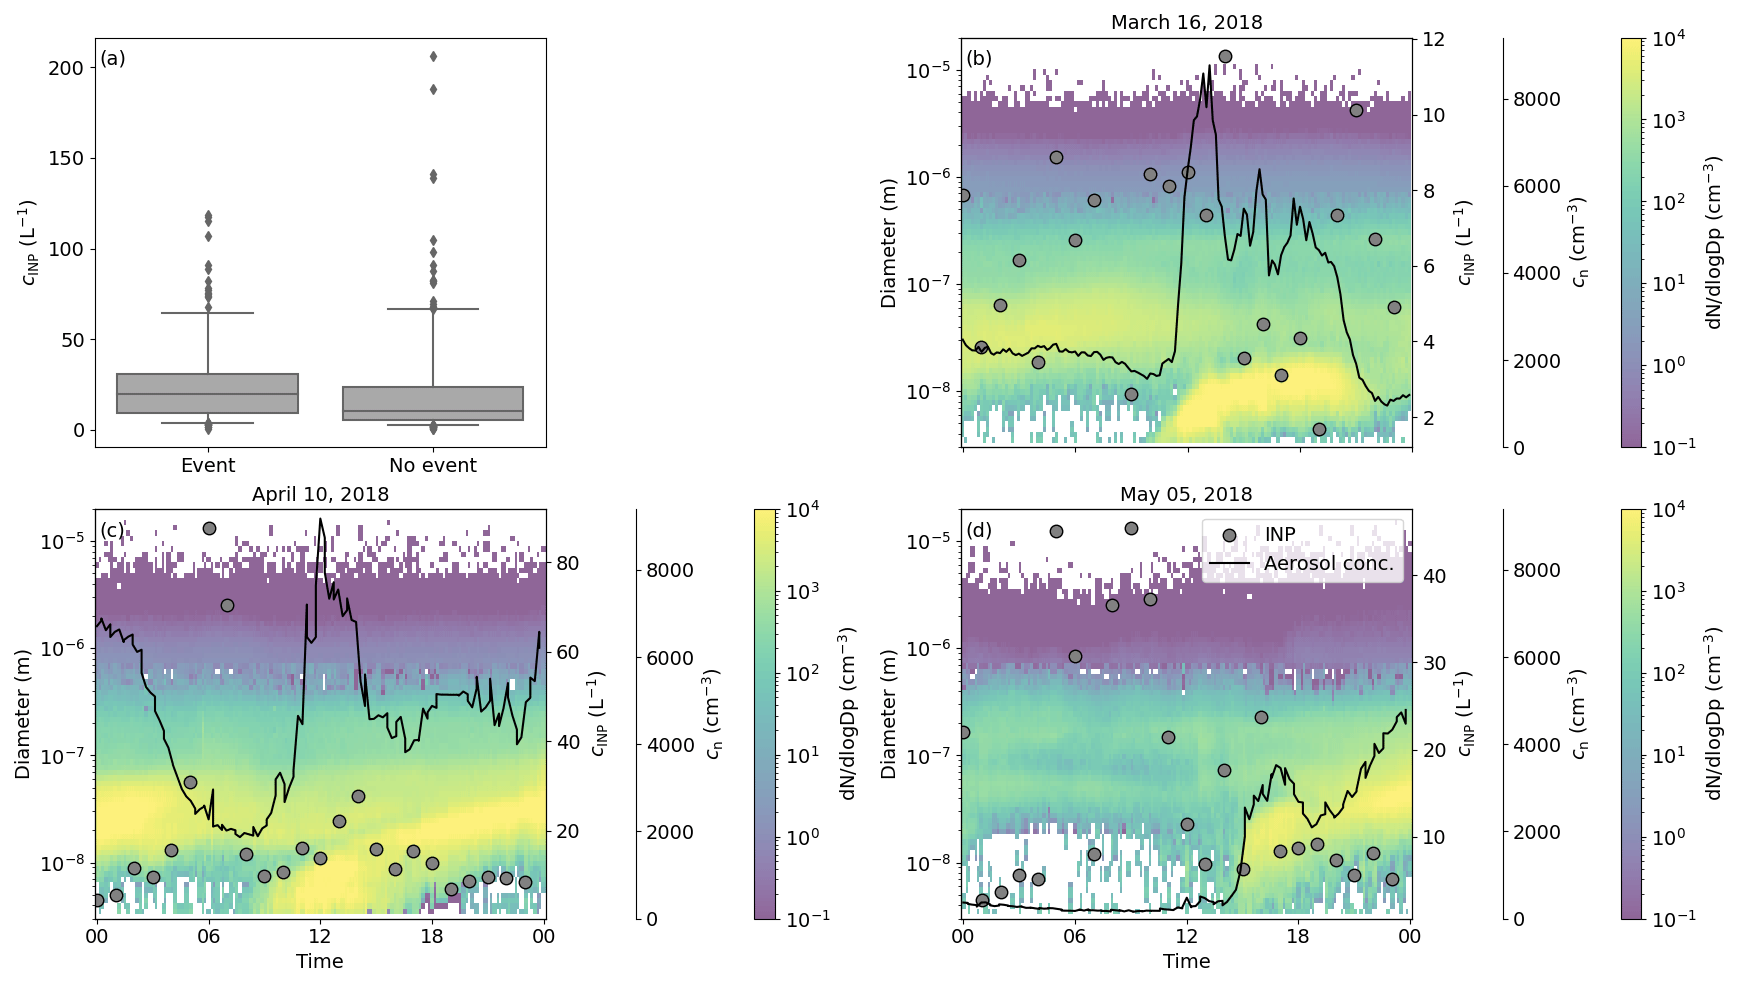
Figure 7Overall comparison of the INP concentration during NPF events and outside NPF events together with three case studies. (a) Boxplot of the INP concentration on days flagged as NPF event days and days without an NPF event. The borders of the box represent the 25th and 75th percentiles, the horizontal line inside the box the median, the whiskers the 5th and 95th percentiles, and the single points all the data outside of that. Panels (b)–(d) are three cases (16 March, 10 April and 5 May) of NPF events of category Ib, where the background of each panel shows the particle number size distribution, with the diameter on the left y axis and as the colour bar. The first right y axis is the INP concentration and the second right y axis the aerosol number concentration measured by the DMPS and APS. Please note that the y axis of the INP concentration varies, due to the high variability of INPs.
The correlations with meteorological variables are generally low (correlation coefficients of < 0.17), with the exception of a moderate negative correlation with relative humidity (−0.38). This means that at low relative humidity, the INP concentration was generally greater and vice versa. This might be explained by the known mechanisms of bioaerosol release at low RH (Marshall, 1996; Tormo et al., 2001). Studies of the ice-nucleating ability of lichens from Hyytiälä and elsewhere in the world show that several common lichen species harbour large quantities of very active ice-nucleating entities (Moffett et al., 2015; Eufemio et al., 2023; Proske et al., 2024). It is also thought that bioaerosol released from lichens is enhanced at low RH (Armstrong, 1991; Tormo et al., 2001). Another study suggests the surface of Scots pine trees, the predominant tree species in Hyytiälä (Kokkila et al., 2002), as a potential source of INPs (Seifried et al., 2023). Since lichens and the bark and branches of trees are one of the few biological entities not covered in snow, they should be considered a candidate source of bioaerosol in the boreal forest. The evidence from the correlation with both aerosol properties and relative humidity is consistent with a biological contribution of INPs to the INP population active at temperatures between −27 and −30 °C.
3.4.1 INP concentrations during new particle formation events
The low correlation between INPs and the concentration of small particles (Fig. 6) suggests that particles formed during new particle formation (NPF) events do not contribute to the INP population. During NPF events, gaseous species nucleate to form a critical cluster, which then grows via gas-to-particle conversion to particles of tens of nanometres in diameter over the course of hours (Kulmala et al., 2001). These newly formed particles are very high in number concentration and can be detected based on the aerosol size distribution and the increase in aerosol number concentration. SMEAR II is known for its NPF events, and the analysis and categorization of these events are based on Dal Maso et al. (2005), who introduced category Ia, Ib and II events, which designate the intensity of an event. The occurrence of NPF days during HyICE-2018 was already presented in Brasseur et al. (2022), where individual days were flagged as NPF days, independent of their category. To investigate the connection between NPF events and INPs, we flagged the hourly INP data measured with PINE at a freezing temperature between −27 and −30 °C with the different NPF event categories. In case none of the three NPF categories were detected, we set the flag to no NPF event. By comparing the INP concentration on NPF event days (independent of the category) and non-NPF event days (Fig.7a), a similar median and variability of the INP concentration are seen in the two boxes. This indicates that NPF events have no effect on the INP population.
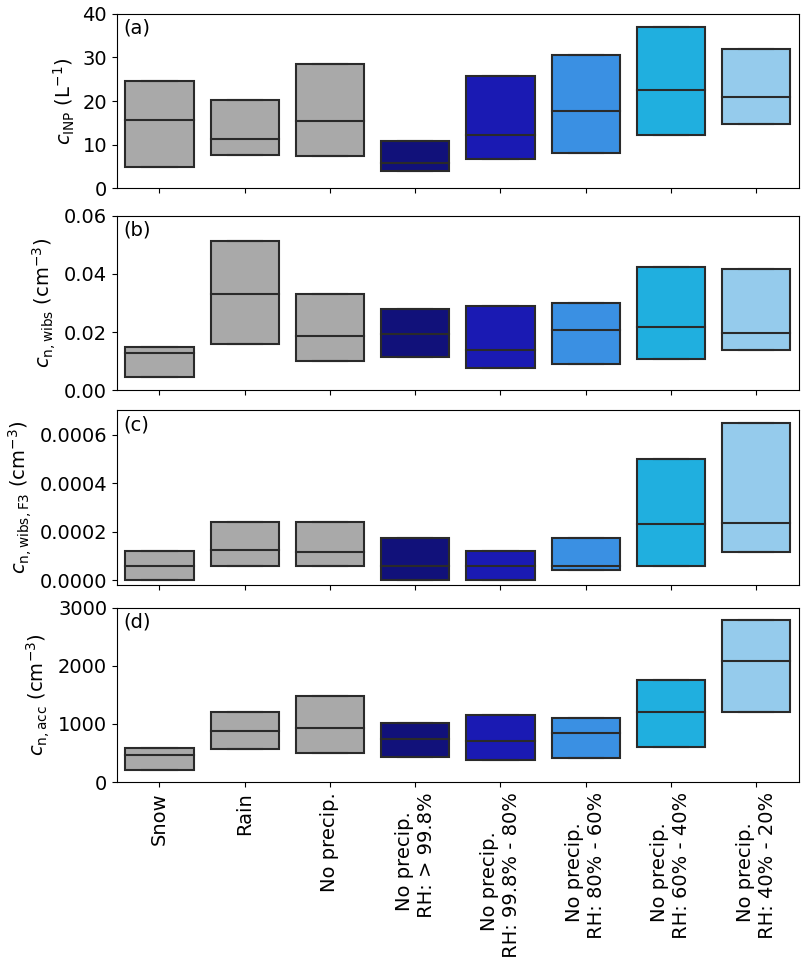
Figure 8The relationship between aerosol, precipitation and humidity. (a) The INP concentration, (b) fluorescent particle concentration measured by WIBS, (c) fluorescent particle concentration measured in the F3 channel of WIBS and (d) the particle concentration in the accumulation mode are divided into several precipitation and relative humidity categories. The precipitation is split into cases of snowfall, rainfall and no precipitation (also including no snowfall). The data of the “no precip.” category were again divided into different relative humidity (RH) classes, which are RH > 99.8 % (saturated conditions, considering some uncertainty of the measurements), 99.8 % > RH > 80 %, 80 % > RH > 60 %, 60 % > RH > 40 % and 40 % > RH > 20 %. The boundaries of the boxes are the 25th and 75th percentiles. For clarity, whiskers and outliers are not shown.
In order to explore the NPF events in more detail, we plot time series of PINE INP measurements alongside aerosol concentrations and the particle number size distribution on 3 d, one from each month of the campaign. The case on 16 March (Fig.7b) shows a steep increase in the aerosol number concentration at 12:00 LT from about 2000 cm−3 to approximately 8500 cm−3, which characterizes the start of a NPF event and is also visible in the high concentration of small particles at the same time. The aerosol concentration decreases to the initial value at 23:00 LT. During the whole day the INP concentration is scattered between 2 and 12 L−1 without showing a distinct pattern. In the other two cases on 10 April and 5 May (Fig.7c and d), the aerosol concentration also shows a steep increase when NPF sets in and there is lower aerosol concentration outside the NPF event. In these two cases the INP concentration reaches higher values during phases of lower aerosol concentrations and drops when NPF is initiated. This may be because NPF events are favoured when the aerosol surface area concentration is low, which is also when the INP concentrations would generally be expected to be lower. These findings are consistent with literature reports that found no observable nucleation of ice from secondary organic aerosol particles in the mixed-phase cloud regime (Prenni et al., 2009; Frey et al., 2018). Hence, this analysis strengthens the conclusion that particles formed during NPF events in the size range up to 50 nm in diameter do not contribute to the INP population.
3.4.2 The link between high INP concentrations and low relative humidity
In Sect. 3.4 we discuss the observation of a negative correlation between the INP concentration and the relative humidity (RH), which is potentially linked to an increased release of bioaerosol from lichens (Armstrong, 1991; Tormo et al., 2001). To better understand potential connections between the INP concentration, relative humidity and aerosol sources, the data are grouped based on precipitation into the three categories snowfall, rainfall and no precipitation (snowfall and rainfall). The data of the last category are further split into five different RH ranges: > 99.8 % (which considers saturated conditions including the uncertainty of measurement), 99.8 % > RH > 80 %, 80 % > RH > 60 %, 60 % > RH > 40 % and 40 % > RH > 20 % (Fig.8a).
Figure 8a reveals no substantial change in the INP concentration between snowfall, rainfall and no precipitation. However, when dividing the data points without precipitation into the RH categories, the lowest INP concentrations with a median of 5 L−1 are measured for the highest RH. For the following groups the median INP concentration increases until it reaches 20 L−1 at a RH of 60 % and lower. A similar trend with RH is observed for the aerosol concentration in the accumulation mode and the WIBS F3 channel. The WIBS F3 channel can point to increased concentration in NAD(P)H (Savage et al., 2017), a co-enzyme linked to energy metabolism in cells, and is an indication for living biological organisms. In contrast, the total fluorescent particle concentration of WIBS showed no clear increase in the mean concentration with decreasing RH (Fig. 8b). In other locations fluorescent bioaerosol concentrations were found to increase markedly with increasing RH, which may be related to RH-dependent fungal-spore release mechanisms (Toprak and Schnaiter, 2013; Gabey et al., 2010; Timothy P. Wright and Petters, 2014). Hence, the bioaerosol released in the boreal forest of southern Finland appears to be different to that in other locations.
The WIBS results and the correlation with RH are consistent with the release of bioaerosol particles from lichens. Lichens can reproduce asexually through the production of diaspores. These diaspores contain living components of lichens, the mycobiont and photobiont, that can then colonize new locations (Hale, 1974). These diaspores would therefore contain NAD(P)H since they are metabolically active. In addition, as mentioned above, release of diaspores has been shown to be negatively correlated with RH (Armstrong, 1991; Tormo et al., 2001). Hence, the hypothesis that lichen-derived bioaerosol contributes to the INP population is consistent with both the F3 channel (NAD(P)H) of WIBS and the negative RH dependence.
A remarkable feature of Fig.8 is that for the fluorescent particle concentration, the WIBS F3 concentration and the aerosol concentration in the accumulation mode, the lowest values are detected during snowfall, while for the INP concentration this is not the case. This implies that many aerosol types are preferentially removed during snowfall events, but the INP concentration is not affected to the same extent. During a snowfall event, the ambient RH would be expected to be well below 100 % (with respect to water). For example, if the air were at ice saturation, the RH would be about 90 % at −10 °C, conditions under which we might expect to start to see lichens producing aerosol. However, the low bioaerosol concentration from the WIBS is inconsistent with this idea.
During rainfall, an enhanced concentration of fluorescent particles is measured by WIBS; however, it is not reflected in the INP concentration. Previous studies reported an increase of INPs during and after rain events during measurements in Colorado in summer. The highest increases in fluorescent particle and INP concentrations were observed during intense rain events with rain rates more than 3 mm in 5 min (Tobo et al., 2013). Less pronounced increases were observed during less intense events and at lower measurement temperatures, which are equal to our covered temperature range (Huffman et al., 2013; Prenni et al., 2013). The overall rain rate during our measurement period was about 0.03 mm in 5 min, 2 orders of magnitude lower than during the measurements in Huffman et al. (2013); Prenni et al. (2013); Tobo et al. (2013). Moreover, they report measurements in summer, when rain fell on dry soil, which released the biological particles. During the HyICE-2018 campaign, the soil was always covered by snow or was wet; hence, the release of biological particles might have been hindered.
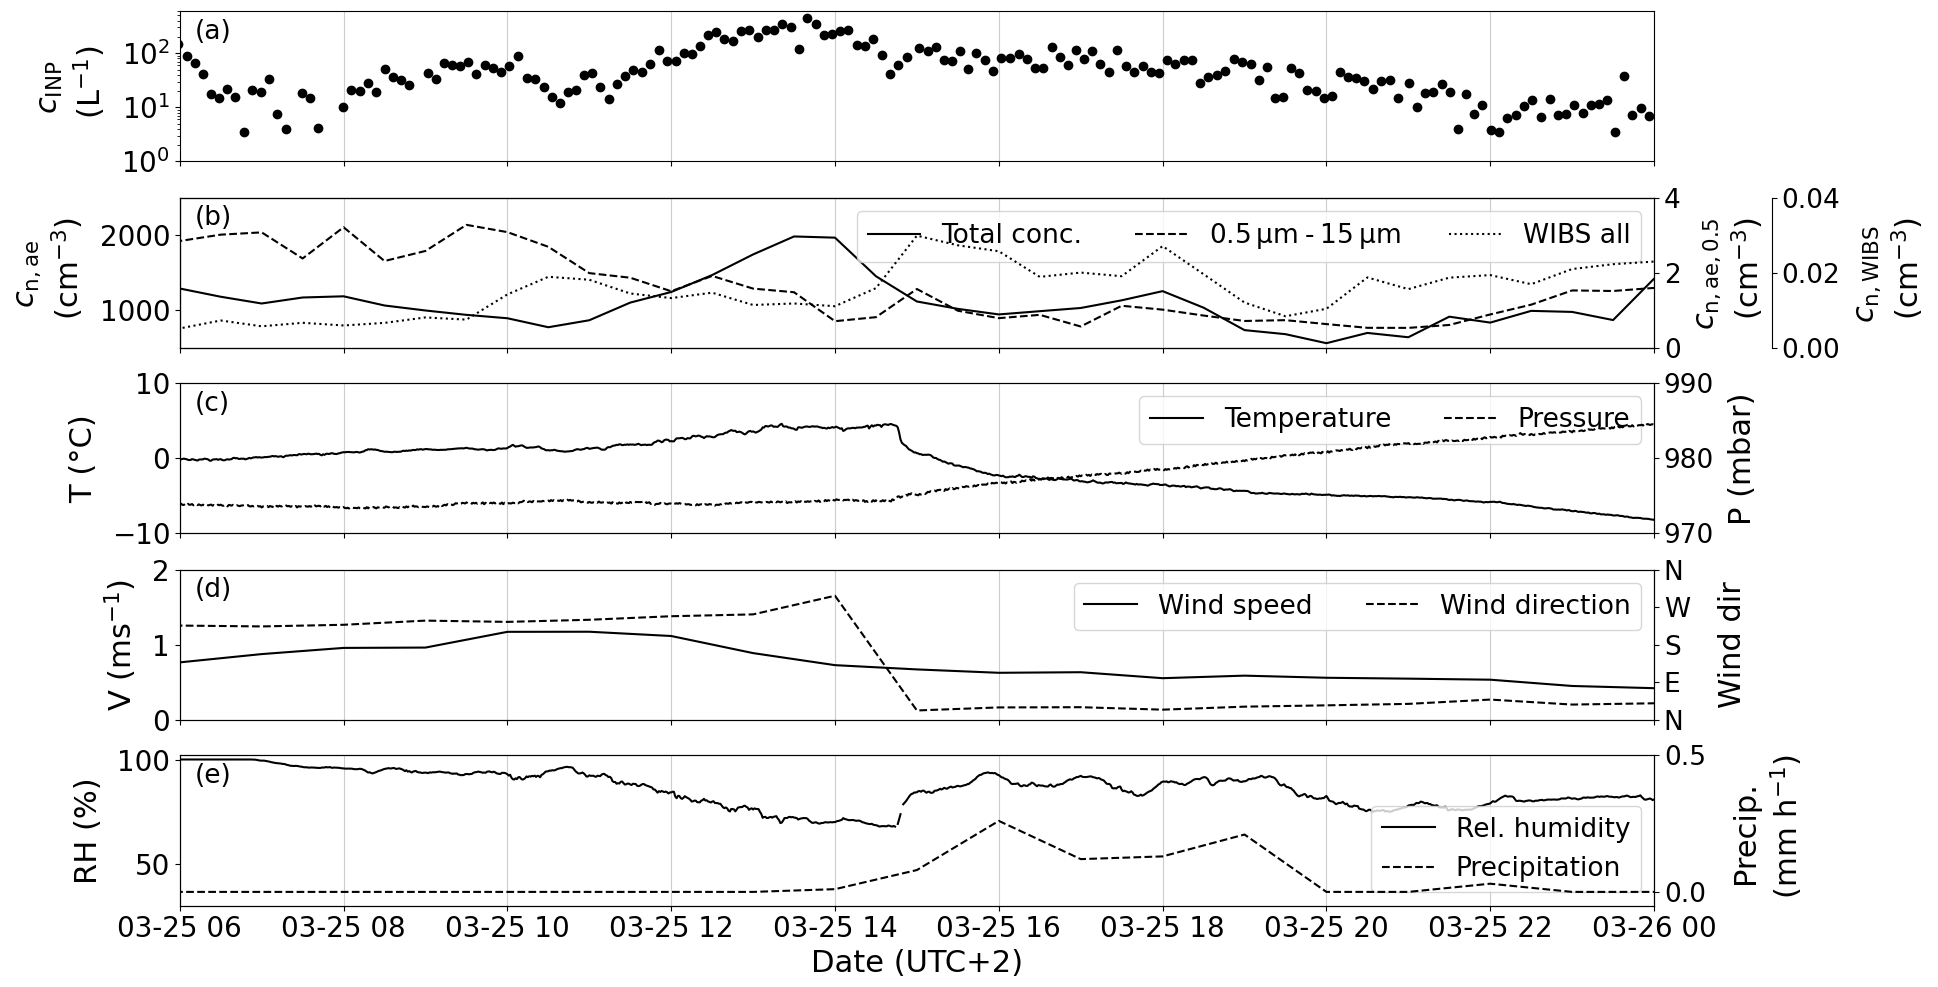
Figure 9The case on 25 March during which a cold front passed over Hyytiälä in the early afternoon. (a) Measured PINE INP concentration. (b) The total aerosol number concentration (solid line, left axis), the number concentration of aerosol particles larger than 0.5 µm in diameter (dashed line, right axis) and the total fluorescent particles measured with WIBS (dotted line, secondary right axis). The ambient air temperature T (solid line, left axis) and pressure p (dashed line, right axis) are plotted in (c). (d) Wind speed v (solid line, left axis) and the wind direction (dashed line, right axis). (e) Relative humidity RH (solid line, left axis) and the accumulated snowfall (dashed line, right axis).
3.5 Response of the INP concentration to changing ambient conditions
In this section we present two independent case studies to examine how the measured INP concentration varied with a range of parameters. In the following section all times refer to UTC+2, the local time in Finland. During the first case (18 h from 25 March at 06:00 to 26 March at 00:00), there was a synoptic air mass change associated with a weather front, whereas during the second case (22 h from 2 May at 00:00 to 2 May at 22:00) there was no major air mass change.
The first case (Fig. 9) is characterized by a change in the overall synoptic situation induced by a cold front passing over Hyytiälä at around 14:00. Cold-front passages are characterized by a drop in temperature, an increase in pressure (Fig. 9c), a prompt change in wind direction (Fig. 9d) and precipitation typically beginning after the change in wind direction (Fig. 9e). In the hours prior to the passage of the front, the INP concentration increased by approximately 2 orders of magnitude from 5 L−1 to almost 400 L−1, falling back to lower values (≈ 100 L−1) after the front passed (Fig. 9a). The INP concentration continued to decrease steadily through the afternoon and evening, perhaps due to scavenging by the snow that fell during this period. A similar behaviour of the INP concentration was observed in the 30 min time-resolved PINC data (Paramonov et al., 2020). The total particle concentration peaks at the same time as the INP concentration (Fig. 9b), while the concentration of particles larger than 0.5 µm is more constant with higher values in the morning hours. The fact that the increase in INP concentration mirrors the peak in total aerosol concentration suggests that the additional INPs are less than 0.5 µm. The total concentration of fluorescent particles measured with WIBS shows a small increase in concentration between 15:00 and 18:00 and with that has a profile independent of the INPs, indicating that the additional biogenic aerosol detected by the WIBS does not contribute to the INP concentration in this occasion. Inspection of Fig. 9e reveals that the relative humidity decreased from approx. 90 % to approx. 70 % during the period of elevated INP concentrations. The increase in the INP concentration is perhaps related to a release of aerosol particles at decreased relative humidity, perhaps consistent with the release of sub-500 nm aerosol from lichen sources, where it was observed that here there was a significant negative correlation between relative humidity and INPs.
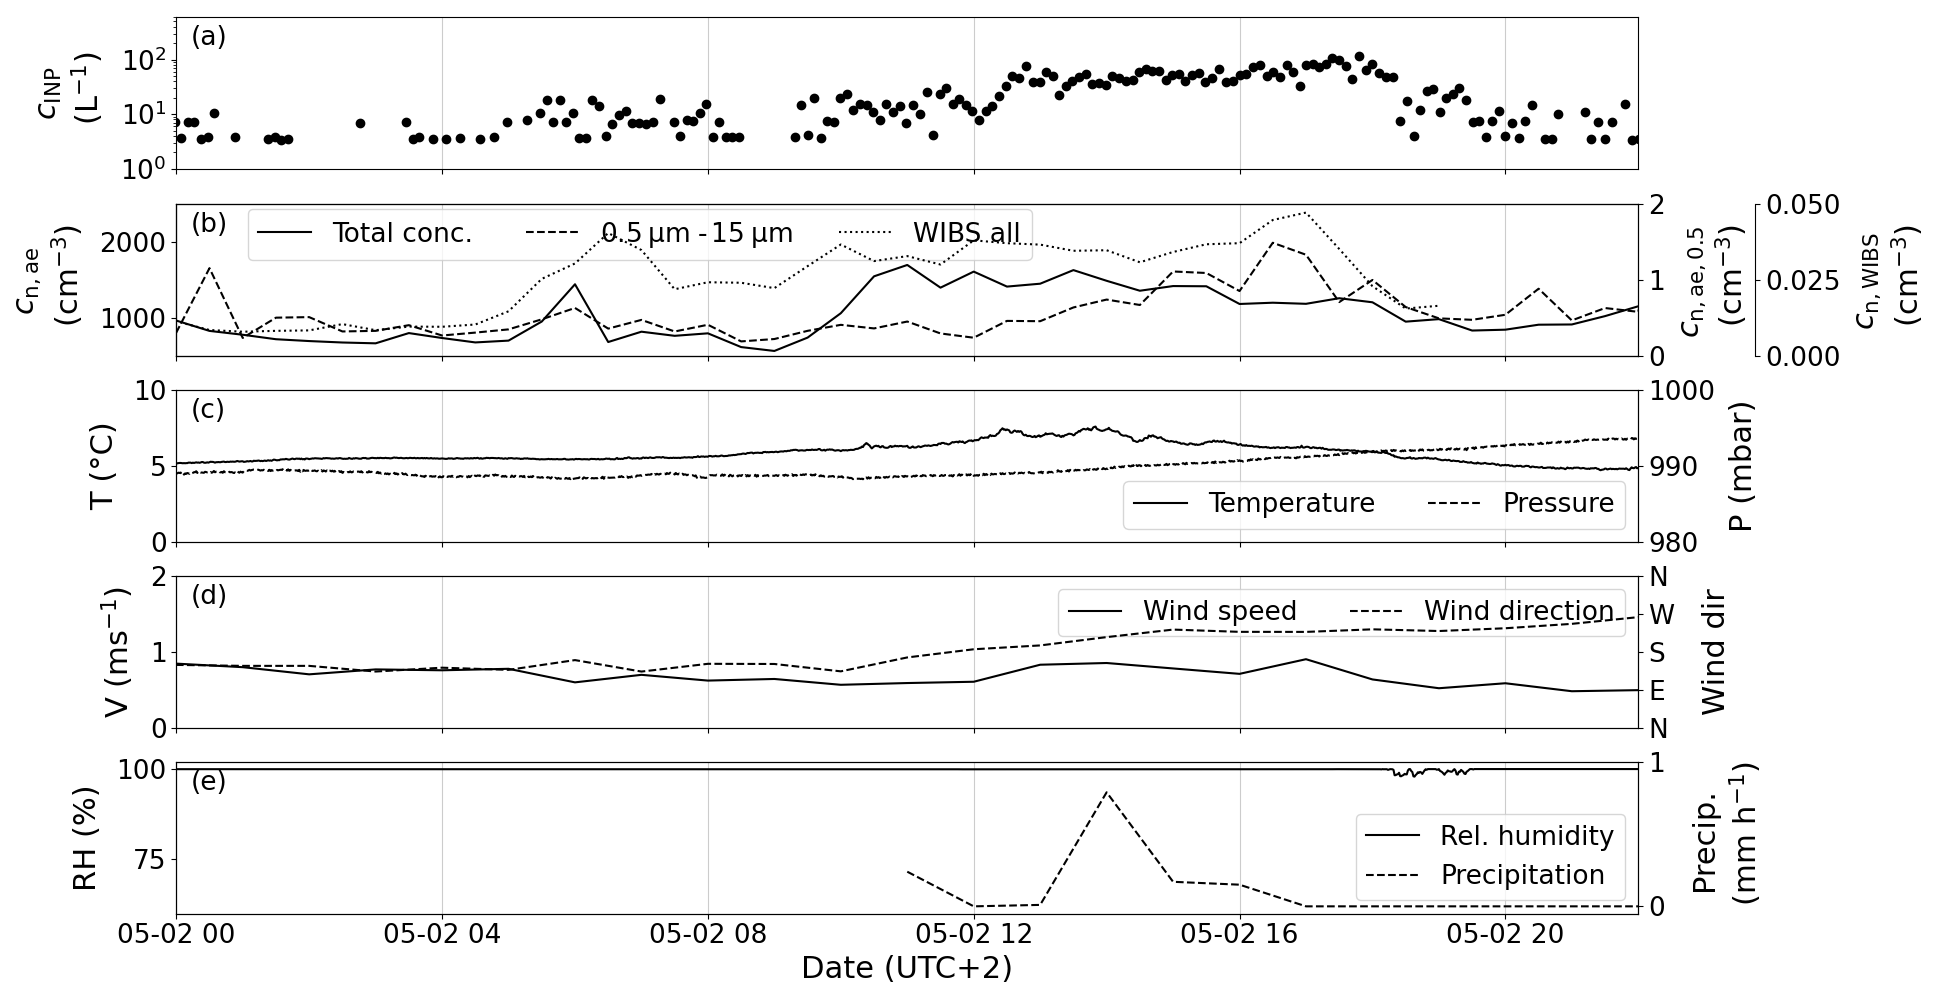
Figure 10The case study of 2 May. (a) Measured PINE INP concentration. (b) The total aerosol number concentration (solid line, left axis), the number concentration of aerosol particles larger than 0.5 µm in diameter (dashed line, right axis) and the total fluorescent particles measured with WIBS (dotted line, secondary right axis). The ambient air temperature T (solid line, left axis) and pressure p (dashed line, right axis) are plotted in (c). (d) Wind speed v (solid line, left axis) and the wind direction (dashed line, right axis). (e) Relative humidity (RH) (solid line, left axis) and the accumulated snowfall (dashed line, right axis).
In the second case, on 2 May, the INP concentration varied by approximately 2 orders of magnitude between 5 and 100 L−1 (Fig. 10a), without any abrupt changes in ambient air temperature, pressure or wind direction that might be associated with a front (Fig. 10c and d). The number concentration of particles larger than 0.5 µm in diameter (Fig. 10b) increases from approximately 0.5 cm−3 in the night and morning hours to 1.5 cm−3 in the afternoon at 17:00. In comparison to the first case, the WIBS particle concentration increases during the day, mirroring the INP concentration. Thus, changes in the measured INP concentration may be explained by the enhanced release of biogenic aerosol. However, the relative humidity was nearly 100 % for most of the day.
The case studies presenting two selected time periods of 18 and 22 h show a response of the INP concentration to different variables: case 1 more to meteorology and case 2 more to the ambient aerosol. This points out that on short timescales the INP concentrations can be driven by different factors, which leads to the correlation coefficients associated with the full time period being rather low.
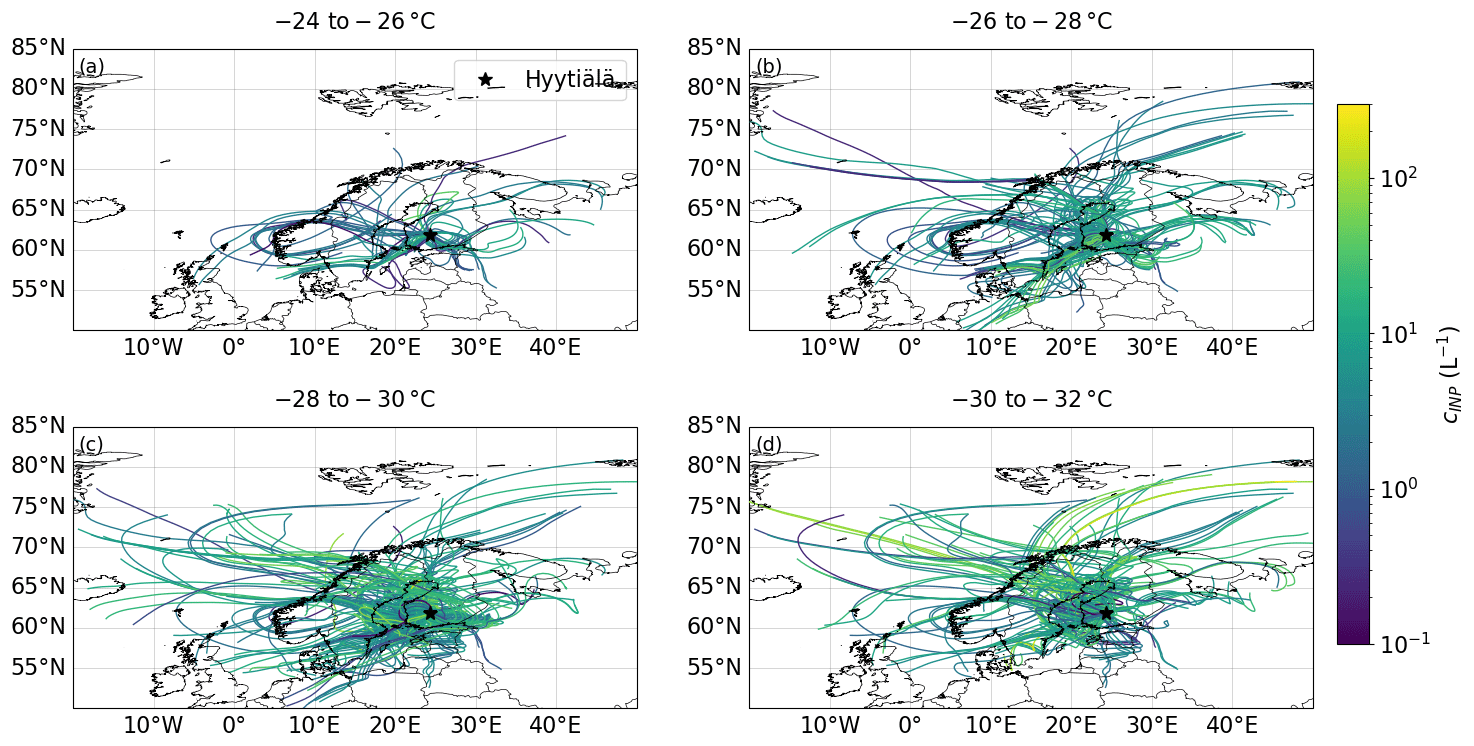
Figure 11HYSPLIT 72 h backward trajectories calculated every 3 h. The colours represent the measured PINE INP concentration averaged over 3 h and then linked to the start time of the trajectory. The measurements are divided into four temperature ranges: panels (a) to (d) covering 2 °C each.
3.6 Backward trajectory analysis
Backward trajectory analysis has been used in the past to identify scenarios that lead to enhanced INP concentrations or specific locations or processes that serve as sources of INPs. For example, in a dataset of INP concentrations at the North Pole, Porter et al. (2022) used backward trajectory analysis to show that the periods of high INP concentrations corresponded to transport of air from the Russian coastline, whereas the lowest INP concentrations corresponded to air that had spent the preceding week circulating around the pack ice. For the PINE dataset presented here, we calculated backward trajectories using the HYSPLIT (Hybrid Single-Particle Lagrangian Integrated Trajectory) model (Stein et al., 2015), where one 72 h backward trajectory was calculated every 3 h. Each of the trajectories is colour-coded with the INP concentration that was measured at the start time of the trajectory. In order to extinguish a temperature dependency, the trajectories are divided into four temperature regimes, namely −24 to −26 °C, −26 to −28 °C, −28 to −30 °C and −30 to −32 °C (Fig. 11). None of the four temperature bins shows a distinct pattern; i.e. air containing higher INP concentrations does not clearly differ from air masses containing lower INP concentrations. The seemingly random distribution is consistent with the idea that sources of bioaerosol local to the measurement site control the INP population.
PINE is an instrument used to measure ice-nucleating particles in an automated manner with a high time resolution and can be applied for both field and laboratory studies. In this paper, we used PINE to quantify the INP population in a Finnish boreal forest during spring alongside an array of other INP and aerosol measurements. This is the first field deployment of PINE, and we pay special attention to how PINE data can be analysed and interpreted. This includes different time-averaging methods, allowing us to quantify low INP concentrations and average over many expansions with confidence. The results show that the INP concentrations reported by PINE are consistent with other INP measurements. Overall, these measurements show that the INP concentration in this location is up to 3 orders of magnitude greater than in remote ocean environments but is generally lower or overlapping with other terrestrial environments, like the United Kingdom and the tropical eastern Atlantic.
We use the high-time-resolution INP data and aerosol measurements to challenge a number of parameterizations from the literature. We found that the Tobo 2013 (1) parameterization, based on measurements in a ponderosa pine forest in Colorado at 2370 m above sea level in summer, using the aerosol number concentration of particles larger than 0.5 µm in diameter as a predictive parameter, is the most suitable predictor for our INP measurements. The fact that a parameterization based on measurements in a conifer forest in Colorado can predict the mean INP concentrations in a boreal forest in Finland implies some commonality between the two environments. Indeed, Tobo et al. (2013) concluded that biological particles contributed to the INP population in Colorado, and we note that there is a moderate correlation between the fluorescent bioaerosol population and the INP concentration during HyICE-2018. The INP populations in Colorado and Finland were also similar in that the DeMott 2010 parameterization produced a temperature dependence that is too shallow when compared to the respective datasets. However, a second parameterization proposed by Tobo et al. (2013), linking INPs to fluorescent bioaerosol concentration, underpredicted our mean INP concentrations by about a factor of 2. This indicates that the atmospheres of both environments have biological INPs that may have some commonality, but they are not identical.
Further evidence for the predominance of biological INPs during HyICE-2018 across the full mixed-phase temperature regime comes from the study of Schneider et al. (2021), who found that INPs at all temperatures (down to −25 °C in their study) were removed with heat treatments. This sensitivity to heat indicates the presence of protein-based INPs consistent with those found in lichens, bacteria and fungi (Daily et al., 2022). The evidence presented here suggests that INPs in this boreal forest that are active below −24 °C can also be biological. In a previously published study from HyICE-2018 (Paramonov et al., 2020), using data from a thermal gradient diffusion chamber, it is suggested that INPs were from distant sources. However, the positive correlation with time over land and the connection of the INP concentration to fluorescent particles detected in the F3 channel of WIBS, which can be assigned to NAD(P)H, a co-enzyme connected to the energy metabolism of cells, suggest that the boreal forest serves as a source of biogenic INPs. It should also be borne in mind that Paramonov et al. (2020) made measurements from the end of February until beginning of April at a temperature of −30 °C, hence only overlapping with our measurements by 3 weeks. In the future we should aim to make INP measurements over a full annual cycle with PINE as the sources of INPs will likely change with season.
Given that many surfaces were covered in snow during the first half of the HyICE-2018 campaign, including the tree canopy and the ground, several potential INP sources are not available. The snowmelt did not bring any significant change in the INP concentration in the PINE dataset, suggesting that local INP sources are available independent of the snow. Potential reservoirs of INPs that were exposed to air during HyICE-2018, despite the snow cover, are tree-dwelling lichens (Proske et al., 2024) and the surface of Scots pine trees. It has been argued that lichens might produce atmospheric ice-nucleating bioaerosol (Moffett et al., 2015), and it is known that the effect of humidity on bioaerosol production is complex, with high humidity leading to production of structures on lichens that can become aerosolized later if the humidity decreases (Marshall, 1996; Armstrong, 1991; Proske et al., 2024). Biological INPs on the surface of Scots pine trees, the dominant tree species at SMEAR II (Kokkila et al., 2002), were also found to nucleate ice below a freezing temperature of −25 °C and could contribute to the INP population if there were an emission mechanism (Seifried et al., 2023). More work is clearly needed to understand the potential role lichens and other bioaerosol sources may play in the INP population in boreal forests and perhaps further afield.
The INP data of PINE and NIPI are available at https://doi.org/10.5281/zenodo.10469663 (Brasseur et al., 2024). The INP data of INSEKT and the aerosol measurements from WIBS, APS and DMPS are available at https://doi.org/10.5445/IR/1000120666 (Schneider et al., 2020b). The aerosol, trace gas and meteorological data are available in the SmartSMEAR data repository (https://avaa.tdata.fi/web/smart, Junninen et al., 2009).
FV, MPA and BJM wrote the paper. FV, MPA, LL, KH, JS, TS, BB and NSU conducted the measurements during the campaign. FV, JN, NB and RF supported the data treatment of the PINE measurements. MPA, PF, ADH, UP and GCEP contributed the results of the µL-NIPI data. PH and JK performed the WIBS measurements and analysed the data. FV, MPA, LL, JS, ZB, EST, JD, TP, OM and BJM contributed to the discussion and interpretation of the results. OM, MK, TP and JD planned the HyICE-2018 campaign.
At least one of the (co-)authors is a member of the editorial board of Atmospheric Chemistry and Physics. The peer-review process was guided by an independent editor, and the authors also have no other competing interests to declare.
Publisher's note: Copernicus Publications remains neutral with regard to jurisdictional claims made in the text, published maps, institutional affiliations, or any other geographical representation in this paper. While Copernicus Publications makes every effort to include appropriate place names, the final responsibility lies with the authors.
This article is part of the special issue “Ice nucleation in the boreal atmosphere”. It is not associated with a conference.
The authors gratefully acknowledge the technical staff of the Hyytiälä Forestry Field Station for their help and support during the HyICE-2018 campaign. Meri Räty is gratefully acknowledged for producing and sharing the time-over-land dataset.
This research has been supported by the EU Horizon 2020 (grant nos. ACTRIS-2 654109, ACTRIS PPP 739530, ACTRIS IMP 871115, 328616, ACTRIS-HY, ERA-PLANET 689443 and ACTRIS-CF 329274), the Helmholtz Association (grant no. 120101), the KIT Technology Transfer (grant no. N059), the Academy of Finland (grant nos. 307331, 307537 and 286558), the European Research Council (grant no. MarineIce 648661), the Engineering and Physical Science Research Council (grant no. EP/S023593/1), the Natural Environment Research Council (grant nos. NE/M010473/1 and NE/L002574/1), the University of Leeds International Strategy Fund, the Maj ja Tor Nesslingin Säätiö (grant no. 201900390), the Swedish Research Council (grant nos. 2013-05153 and 2017-00564) and the Alexander von Humboldt-Stiftung (grant no. 1188375). Erik S. Thomson is supported by the Swedish Research Council VR (grant no. 2020-03497).
This paper was edited by Hinrich Grothe and reviewed by three anonymous referees.
Armstrong, R.: The influence of climate on the dispersal of lichen soredia, Environ. Exp. Bot., 31, 239–245, https://doi.org/10.1016/0098-8472(91)90076-Z, 1991. a, b, c, d
Atkinson, J. D., Murray, B. J., Woodhouse, M. T., Whale, T. F., Baustian, K. J., Carslaw, K. S., Dobbie, S., O'Sullivan, D., and Malkin, T. L.: The importance of feldspar for ice nucleation by mineral dust in mixed-phase clouds, Nature, 498, 355–358, https://doi.org/10.1038/nature12278, 2013. a
Barr, S. L., Wyld, B., McQuaid, J. B., Neely III, R. R., and Murray, B. J.: Southern Alaska as a source of atmospheric mineral dust and ice-nucleating particles, Science Advances, 9, eadg3708, https://doi.org/10.1126/sciadv.adg3708, 2023. a
Boucher, O., Randall, D., Artaxo, P., Bretherton, C., Feingold, G., Forster, P., Kerminen, V.-M., Kondo, Y., Liao, H., Lohmann, U., Rasch, P., Satheesh, S. K., Sherwood, S., Stevens, B., and Zhang, X. Y.: Clouds and Aerosols, in: Climate Change 2013: The Physical Science Basis. Contribution of Working Group I to the Fifth Assessment Report of the Intergovernmental Panel on Climate Change, Cambridge University Press, Cambridge, United Kingdom and New York, NY, USA, 571–658, https://doi.org/10.1017/CBO9781107415324.016, 2013. a
Brasseur, Z., Castarède, D., Thomson, E. S., Adams, M. P., Drossaart van Dusseldorp, S., Heikkilä, P., Korhonen, K., Lampilahti, J., Paramonov, M., Schneider, J., Vogel, F., Wu, Y., Abbatt, J. P. D., Atanasova, N. S., Bamford, D. H., Bertozzi, B., Boyer, M., Brus, D., Daily, M. I., Fösig, R., Gute, E., Harrison, A. D., Hietala, P., Höhler, K., Kanji, Z. A., Keskinen, J., Lacher, L., Lampimäki, M., Levula, J., Manninen, A., Nadolny, J., Peltola, M., Porter, G. C. E., Poutanen, P., Proske, U., Schorr, T., Silas Umo, N., Stenszky, J., Virtanen, A., Moisseev, D., Kulmala, M., Murray, B. J., Petäjä, T., Möhler, O., and Duplissy, J.: Measurement report: Introduction to the HyICE-2018 campaign for measurements of ice-nucleating particles and instrument inter-comparison in the Hyytiälä boreal forest, Atmos. Chem. Phys., 22, 5117–5145, https://doi.org/10.5194/acp-22-5117-2022, 2022. a, b, c, d, e, f, g, h, i
Brasseur, Z., Castarède, D., Thomson, E. S., Adams, M. P., Drossaart van Dusseldorp, S., Heikkilä, P., Korhonen, K., Lampilahti, J., Paramonov, M., Schneider, J., Vogel, F., Wu, Y., Abbatt, J. P. D., Atanasova, N. S., Bamford, D. H., Bertozzi, B., Boyer, M., Brus, D., Daily, M. I., Fösig, R., Gute, E., Harrison, A. D., Hietala, P., Höhler, K., Kanji, Z. A., Keskinen, J., Lacher, L., Lampimäki, M., Levula, J., Manninen, A., Nadolny, J., Peltola, M., Porter, G. C. E., Poutanen, P., Proske, U., Schorr, T., Umo, N. S., Stenszky, J., Virtanen, A., Moisseev, D., Kulmala, M., Murray, B. J., Petäjä, T., Möhler, O., and Duplissy, J.: Datasets to: Measurement report: Introduction to the HyICE-2018 campaign for the measurements of ice nucleating particles in the boreal forest of Hyytiälä, Zenodo [data set], https://doi.org/10.5281/zenodo.10469663, 2024. a
Castarède, D., Brasseur, Z., Wu, Y., Kanji, Z. A., Hartmann, M., Ahonen, L., Bilde, M., Kulmala, M., Petäjä, T., Pettersson, J. B. C., Sierau, B., Stetzer, O., Stratmann, F., Svenningsson, B., Swietlicki, E., Thu Nguyen, Q., Duplissy, J., and Thomson, E. S.: Development and characterization of the Portable Ice Nucleation Chamber 2 (PINCii), Atmos. Meas. Tech., 16, 3881–3899, https://doi.org/10.5194/amt-16-3881-2023, 2023. a
Ceppi, P., Brient, F., Zelinka, M. D., and Hartmann, D. L.: Cloud feedback mechanisms and their representation in global climate models, WIREs Clim. Change, 8, e465, https://doi.org/10.1002/wcc.465, 2017. a
Choi, Y.-S., Lindzen, R. S., Ho, C.-H., and Kim, J.: Space observations of cold-cloud phase change, P. Natl. Acad. Sci. USA, 107, 11211–11216, https://doi.org/10.1073/pnas.1006241107, 2010. a
Chou, C., Stetzer, O., Weingartner, E., Jurányi, Z., Kanji, Z. A., and Lohmann, U.: Ice nuclei properties within a Saharan dust event at the Jungfraujoch in the Swiss Alps, Atmos. Chem. Phys., 11, 4725–4738, https://doi.org/10.5194/acp-11-4725-2011, 2011. a
Cornwell, G. C., McCluskey, C. S., Hill, T. C., Levin, E. T., Rothfuss, N. E., Tai, S.-L., Petters, M. D., DeMott, P. J., Kreidenweis, S., Prather, K. A., and Burrows, S.: Bioaerosols are the dominant source of warm-temperature immersion-mode INPs and drive uncertainties in INP predictability, Science Advances, 9, eadg3715, https://doi.org/10.1126/sciadv.adg3715, 2023. a
Daily, M. I., Tarn, M. D., Whale, T. F., and Murray, B. J.: An evaluation of the heat test for the ice-nucleating ability of minerals and biological material, Atmos. Meas. Tech., 15, 2635–2665, https://doi.org/10.5194/amt-15-2635-2022, 2022. a, b
Dal Maso, M., Kulmala, M., Riipinen, I., Wagner, R., Hussein, T., Aalto, P. P., and Lehtinen, K. E.: Formation and growth of fresh atmospheric aerosols: eight years of aerosol size distribution data from SMEAR II, Hyytiälä, Finland, Boreal Environ. Res., 10, 323–336, 2005. a
DeMott, P. J., Prenni, A. J., Liu, X., Kreidenweis, S. M., Petters, M. D., Twohy, C. H., Richardson, M. S., Eidhammer, T., and Rogers, D. C.: Predicting global atmospheric ice nuclei distributions and their impacts on climate, P. Natl. Acad. Sci. USA, 107, 11217–11222, https://doi.org/10.1073/pnas.0910818107, 2010. a
DeMott, P. J., Hill, T. C. J., McCluskey, C. S., Prather, K. A., Collins, D. B., Sullivan, R. C., Ruppel, M. J., Mason, R. H., Irish, V. E., Lee, T., Hwang, C. Y., Rhee, T. S., Snider, J. R., McMeeking, G. R., Dhaniyala, S., Lewis, E. R., Wentzell, J. J. B., Abbatt, J., Lee, C., Sultana, C. M., Ault, A. P., Axson, J. L., Diaz Martinez, M., Venero, I., Santos-Figueroa, G., Stokes, M. D., Deane, G. B., Mayol-Bracero, O. L., Grassian, V. H., Bertram, T. H., Bertram, A. K., Moffett, B. F., and Franc, G. D.: Sea spray aerosol as a unique source of ice nucleating particles, P. Natl. Acad. Sci. USA, 113, 5797–5803, https://doi.org/10.1073/pnas.1514034112, 2016. a
Eufemio, R. J., de Almeida Ribeiro, I., Sformo, T. L., Laursen, G. A., Molinero, V., Fröhlich-Nowoisky, J., Bonn, M., and Meister, K.: Lichen species across Alaska produce highly active and stable ice nucleators, Biogeosciences, 20, 2805–2812, https://doi.org/10.5194/bg-20-2805-2023, 2023. a
Fahy, W. D., Maters, E. C., Miranda, R. G., Adams, M. P., Jahn, L. G., Sullivan, R. C., and Murray, B. J.: Volcanic ash ice nucleation activity is variably reduced by aging in water and sulfuric acid: the effects of leaching, dissolution, and precipitation, Environmental Science: Atmospheres, 2, 85–99, 2022. a
Frey, W., Hu, D., Dorsey, J., Alfarra, M. R., Pajunoja, A., Virtanen, A., Connolly, P., and McFiggans, G.: The efficiency of secondary organic aerosol particles acting as ice-nucleating particles under mixed-phase cloud conditions, Atmos. Chem. Phys., 18, 9393–9409, https://doi.org/10.5194/acp-18-9393-2018, 2018. a
Gabey, A. M., Gallagher, M. W., Whitehead, J., Dorsey, J. R., Kaye, P. H., and Stanley, W. R.: Measurements and comparison of primary biological aerosol above and below a tropical forest canopy using a dual channel fluorescence spectrometer, Atmos. Chem. Phys., 10, 4453–4466, https://doi.org/10.5194/acp-10-4453-2010, 2010. a
Grawe, S., Augustin-Bauditz, S., Hartmann, S., Hellner, L., Pettersson, J. B. C., Prager, A., Stratmann, F., and Wex, H.: The immersion freezing behavior of ash particles from wood and brown coal burning, Atmos. Chem. Phys., 16, 13911–13928, https://doi.org/10.5194/acp-16-13911-2016, 2016. a
Hale, M. E.: The Biology of Lichens, Contemporary Biology, 2nd ed edn., Edward Arnold, London, ISBN 978-0-7131-2456-9, 1974. a
Hari, P., Nikinmaa, E., Pohja, T., Siivola, E., Bäck, J., Vesala, T., and Kulmala, M.: Station for Measuring Ecosystem-Atmosphere Relations: SMEAR, Springer Netherlands, Dordrecht, 471–487, https://doi.org/10.1007/978-94-007-5603-8_9, 2013. a, b
Hawker, R. E., Miltenberger, A. K., Johnson, J. S., Wilkinson, J. M., Hill, A. A., Shipway, B. J., Field, P. R., Murray, B. J., and Carslaw, K. S.: Model emulation to understand the joint effects of ice-nucleating particles and secondary ice production on deep convective anvil cirrus, Atmos. Chem. Phys., 21, 17315–17343, https://doi.org/10.5194/acp-21-17315-2021, 2021a. a
Hawker, R. E., Miltenberger, A. K., Wilkinson, J. M., Hill, A. A., Shipway, B. J., Cui, Z., Cotton, R. J., Carslaw, K. S., Field, P. R., and Murray, B. J.: The temperature dependence of ice-nucleating particle concentrations affects the radiative properties of tropical convective cloud systems, Atmos. Chem. Phys., 21, 5439–5461, https://doi.org/10.5194/acp-21-5439-2021, 2021b. a
Herbert, R. J., Murray, B. J., Dobbie, S. J., and Koop, T.: Sensitivity of liquid clouds to homogenous freezing parameterizations, Geophys. Res. Lett., 42, 1599–1605, https://doi.org/10.1002/2014GL062729, 2015. a
Hill, T. C. J., DeMott, P. J., Tobo, Y., Fröhlich-Nowoisky, J., Moffett, B. F., Franc, G. D., and Kreidenweis, S. M.: Sources of organic ice nucleating particles in soils, Atmos. Chem. Phys., 16, 7195–7211, https://doi.org/10.5194/acp-16-7195-2016, 2016. a
Hiranuma, N., Auvermann, B. W., Belosi, F., Bush, J., Cory, K. M., Georgakopoulos, D. G., Höhler, K., Hou, Y., Lacher, L., Saathoff, H., Santachiara, G., Shen, X., Steinke, I., Ullrich, R., Umo, N. S., Vepuri, H. S. K., Vogel, F., and Möhler, O.: Laboratory and field studies of ice-nucleating particles from open-lot livestock facilities in Texas, Atmos. Chem. Phys., 21, 14215–14234, https://doi.org/10.5194/acp-21-14215-2021, 2021. a
Hoose, C. and Möhler, O.: Heterogeneous ice nucleation on atmospheric aerosols: a review of results from laboratory experiments, Atmos. Chem. Phys., 12, 9817–9854, https://doi.org/10.5194/acp-12-9817-2012, 2012. a
Hoose, C., Kristjánsson, J. E., and Burrows, S. M.: How important is biological ice nucleation in clouds on a global scale?, Environ. Res. Lett., 5, 024009, https://doi.org/10.1088/1748-9326/5/2/024009, 2010. a
Huffman, J. A., Prenni, A. J., DeMott, P. J., Pöhlker, C., Mason, R. H., Robinson, N. H., Fröhlich-Nowoisky, J., Tobo, Y., Després, V. R., Garcia, E., Gochis, D. J., Harris, E., Müller-Germann, I., Ruzene, C., Schmer, B., Sinha, B., Day, D. A., Andreae, M. O., Jimenez, J. L., Gallagher, M., Kreidenweis, S. M., Bertram, A. K., and Pöschl, U.: High concentrations of biological aerosol particles and ice nuclei during and after rain, Atmos. Chem. Phys., 13, 6151–6164, https://doi.org/10.5194/acp-13-6151-2013, 2013. a, b
Irish, V. E., Elizondo, P., Chen, J., Chou, C., Charette, J., Lizotte, M., Ladino, L. A., Wilson, T. W., Gosselin, M., Murray, B. J., Polishchuk, E., Abbatt, J. P. D., Miller, L. A., and Bertram, A. K.: Ice-nucleating particles in Canadian Arctic sea-surface microlayer and bulk seawater, Atmos. Chem. Phys., 17, 10583–10595, https://doi.org/10.5194/acp-17-10583-2017, 2017. a
Irish, V. E., Hanna, S. J., Xi, Y., Boyer, M., Polishchuk, E., Ahmed, M., Chen, J., Abbatt, J. P. D., Gosselin, M., Chang, R., Miller, L. A., and Bertram, A. K.: Revisiting properties and concentrations of ice-nucleating particles in the sea surface microlayer and bulk seawater in the Canadian Arctic during summer, Atmos. Chem. Phys., 19, 7775–7787, https://doi.org/10.5194/acp-19-7775-2019, 2019. a
Junninen, H., Lauri, A., Keronen, P., Aalto, P., Hiltunen, V., Hari, P., and Kulmala, M.: Smart-SMEAR: On-line data exploration and visualization tool for SMEAR stations, Boreal Environ. Res., 14, 447–457, 2009 (data available at: https://avaa.tdata.fi/web/smart, last access: 9 October 2024). a, b
Kanitz, T., Seifert, P., Ansmann, A., Engelmann, R., Althausen, D., Casiccia, C., and Rohwer, E. G.: Contrasting the impact of aerosols at northern and southern midlatitudes on heterogeneous ice formation: AEROSOL EFFECT ON ICE FORMATION, Geophys. Res. Lett., 38, L17802, https://doi.org/10.1029/2011GL048532, 2011. a
Kanji, Z. A., Welti, A., Chou, C., Stetzer, O., and Lohmann, U.: Laboratory studies of immersion and deposition mode ice nucleation of ozone aged mineral dust particles, Atmos. Chem. Phys., 13, 9097–9118, https://doi.org/10.5194/acp-13-9097-2013, 2013. a
Kanji, Z. A., Ladino, L. A., Wex, H., Boose, Y., Burkert-Kohn, M., Cziczo, D. J., and Krämer, M.: Overview of Ice Nucleating Particles, Meteorol. Mon., 58, 1.1–1.33, https://doi.org/10.1175/AMSMONOGRAPHS-D-16-0006.1, 2017. a
Kokkila, T., Makela, A., and Nikinmaa, E.: A method for generating stand structures using Gibbs marked point process, Silva Fenn., 36, 265–277, 2002. a, b
Kulmala, M., Hameri, K., Aalto, P. P., Makela, J. M., Pirjola, L., Nilsson, E. D., Buzorius, G., Rannik, U., Maso, M. D., Seidl, W., Hoffman, T., Janson, R., Hansson, H.-C., Viisanen, Y., Laaksonen, A., and O'Dowd, C. D.: Overview of the international project on biogenic aerosol formation in the boreal forest (BIOFOR), Tellus B, 53, 324–343, https://doi.org/10.1034/j.1600-0889.2001.530402.x, 2001. a, b
Maki, T., Hosaka, K., Lee, K. C., Kawabata, Y., Kajino, M., Uto, M., Kita, K., and Igarashi, Y.: Vertical distribution of airborne microorganisms over forest environments: A potential source of ice-nucleating bioaerosols, Atmos. Environ., 302, 119726, https://doi.org/10.1016/j.atmosenv.2023.119726, 2023. a
Mangan, T. P., Atkinson, J. D., Neuberg, J. W., O'Sullivan, D., Wilson, T. W., Whale, T. F., Neve, L., Umo, N. S., Malkin, T. L., and Murray, B. J.: Heterogeneous Ice Nucleation by Soufriere Hills Volcanic Ash Immersed in Water Droplets, PLOS ONE, 12, e0169720, https://doi.org/10.1371/journal.pone.0169720, 2017. a
Marshall, W. A.: Aerial dispersal of lichen soredia in the maritime Antarctic, New Phytol., 134, 523–530, https://doi.org/10.1111/j.1469-8137.1996.tb04370.x, 1996. a, b
Matus, A. V. and L'Ecuyer, T. S.: The role of cloud phase in Earth's radiation budget: CLOUD PHASE IN EARTH'S RADIATION BUDGET, J. Geophys. Res.-Atmos., 122, 2559–2578, https://doi.org/10.1002/2016JD025951, 2017. a
McCluskey, C. S., Hill, T. C. J., Humphries, R. S., Rauker, A. M., Moreau, S., Strutton, P. G., Chambers, S. D., Williams, A. G., McRobert, I., Ward, J., Keywood, M. D., Harnwell, J., Ponsonby, W., Loh, Z. M., Krummel, P. B., Protat, A., Kreidenweis, S. M., and DeMott, P. J.: Observations of Ice Nucleating Particles Over Southern Ocean Waters, Geophys. Res. Lett., 45, 11,989–11,997, https://doi.org/10.1029/2018GL079981, 2018. a
Moffett, B. F., Getti, G., Henderson-Begg, S. K., and Hill, T. C. J.: Ubiquity of ice nucleation in lichen – possible atmospheric implications, Lindbergia, 38, 39–43, https://doi.org/10.25227/linbg.01070, 2015. a, b
Murray, B. J., O'Sullivan, D., Atkinson, J. D., and Webb, M. E.: Ice nucleation by particles immersed in supercooled cloud droplets, Chem. Soc. Rev., 41, 6519, https://doi.org/10.1039/c2cs35200a, 2012. a
Murray, B. J., Carslaw, K. S., and Field, P. R.: Opinion: Cloud-phase climate feedback and the importance of ice-nucleating particles, Atmos. Chem. Phys., 21, 665–679, https://doi.org/10.5194/acp-21-665-2021, 2021. a, b
Möhler, O., Adams, M., Lacher, L., Vogel, F., Nadolny, J., Ullrich, R., Boffo, C., Pfeuffer, T., Hobl, A., Weiß, M., Vepuri, H. S. K., Hiranuma, N., and Murray, B. J.: The Portable Ice Nucleation Experiment (PINE): a new online instrument for laboratory studies and automated long-term field observations of ice-nucleating particles, Atmos. Meas. Tech., 14, 1143–1166, https://doi.org/10.5194/amt-14-1143-2021, 2021. a, b, c, d, e
Neefjes, I., Laapas, M., Liu, Y., Médus, E., Miettunen, E., Ahonen, L., Quéléver, L., Aalto, J., Bäck, J., Kerminen, V., Lampilahti, J., Luoma, K., Mäki, M., Mammarella, I., Petäjä, T., Räty, M., Sarnela, N., Ylivinkka, I., Hakala, S., Kulmala, M., Nieminen., T., and Lintunen, A.: 25 years of atmospheric and ecosystem measurements in a boreal forest – Seasonal variation and responses to warm and dry years, Boreal Environ. Res., 27, 1–31, 2022. a
Niemand, M., Möhler, O., Vogel, B., Vogel, H., Hoose, C., Connolly, P., Klein, H., Bingemer, H., DeMott, P., Skrotzki, J., and Leisner, T.: A Particle-Surface-Area-Based Parameterization of Immersion Freezing on Desert Dust Particles, J. Atmos. Sci., 69, 3077–3092, https://doi.org/10.1175/JAS-D-11-0249.1, 2012. a
O'Sullivan, D., Murray, B. J., Malkin, T. L., Whale, T. F., Umo, N. S., Atkinson, J. D., Price, H. C., Baustian, K. J., Browse, J., and Webb, M. E.: Ice nucleation by fertile soil dusts: relative importance of mineral and biogenic components, Atmos. Chem. Phys., 14, 1853–1867, https://doi.org/10.5194/acp-14-1853-2014, 2014. a
O'Sullivan, D., Adams, M. P., Tarn, M. D., Harrison, A. D., Vergara-Temprado, J., Porter, G. C. E., Holden, M. A., Sanchez-Marroquin, A., Carotenuto, F., Whale, T. F., McQuaid, J. B., Walshaw, R., Hedges, D. H. P., Burke, I. T., Cui, Z., and Murray, B. J.: Contributions of biogenic material to the atmospheric ice-nucleating particle population in North Western Europe, Sci. Rep.-UK, 8, 13821, https://doi.org/10.1038/s41598-018-31981-7, 2018. a, b, c
Paramonov, M., Drossaart van Dusseldorp, S., Gute, E., Abbatt, J. P. D., Heikkilä, P., Keskinen, J., Chen, X., Luoma, K., Heikkinen, L., Hao, L., Petäjä, T., and Kanji, Z. A.: Condensation/immersion mode ice-nucleating particles in a boreal environment, Atmos. Chem. Phys., 20, 6687–6706, https://doi.org/10.5194/acp-20-6687-2020, 2020. a, b, c, d, e
Petäjä, T., Tabakova, K., Manninen, A., Ezhova, E., O'Connor, E., Moisseev, D., Sinclair, V. A., Backman, J., Levula, J., Luoma, K., Virkkula, A., Paramonov, M., Räty, M., Äijälä, M.,Heikkinen, L., Ehn, M., Sipilä, M., Yli-Juuti, T., Virtanen, A., Ritsche, M., Hickmon, N., Pulik, G., Rosenfeld, D., Worsnop, D. R., Bäck, J., Kulmala, M., and Kerminen, V.-M.: Influence of biogenic emissions from boreal forests on aerosol–cloud interactions, Nat. Geosci., 15, 42–47, 2022. a
Petters, M. D. and Wright, T. P.: Revisiting ice nucleation from precipitation samples: ICE NUCLEATION FROM PRECIPITATION, Geophys. Res. Lett., 42, 8758–8766, https://doi.org/10.1002/2015GL065733, 2015. a
Ponsonby, J., King, L., Murray, B. J., and Stettler, M. E. J.: Jet aircraft lubrication oil droplets as contrail ice-forming particles, Atmos. Chem. Phys., 24, 2045–2058, https://doi.org/10.5194/acp-24-2045-2024, 2024. a
Porter, G. C. E., Adams, M. P., Brooks, I. M., Ickes, L., Karlsson, L., Leck, C., Salter, M. E., Schmale, J., Siegel, K., Sikora, S. N. F., Tarn, M. D., Vüllers, J., Wernli, H., Zieger, P., Zinke, J., and Murray, B. J.: Highly Active Ice-Nucleating Particles at the Summer North Pole, J. Geophys. Res.-Atmos., 127, e2021JD036059, https://doi.org/10.1029/2021JD036059, 2022. a, b, c
Prenni, A., Tobo, Y., Garcia, E., DeMott, P., Huffman, J., McCluskey, C., Kreidenweis, S., Prenni, J., Pöhlker, C., and Pöschl, U.: The impact of rain on ice nuclei populations at a forested site in Colorado, Geophys. Res. Lett., 40, 227–231, 2013. a, b
Prenni, A. J., Petters, M. D., Faulhaber, A., Carrico, C. M., Ziemann, P. J., Kreidenweis, S. M., and DeMott, P. J.: Heterogeneous ice nucleation measurements of secondary organic aerosol generated from ozonolysis of alkenes, Geophys. Res. Lett., 36, L06808, https://doi.org/10.1029/2008GL036957, 2009. a
Price, H. C., Baustian, K. J., McQuaid, J. B., Blyth, A., Bower, K. N., Choularton, T., Cotton, R. J., Cui, Z., Field, P. R., Gallagher, M., Hawker, R., Merrington, A., Miltenberger, A., Neely III, R. R., Parker, S. T., Rosenberg, P. D., Taylor, J. W., Trembath, J., Vergara-Temprado, J., Whale, T. F., Wilson, T. W., Young, G., and Murray, B. J.: Atmospheric Ice-Nucleating Particles in the Dusty Tropical Atlantic, J. Geophys. Res.-Atmos., 123, 2175–2193, https://doi.org/10.1002/2017JD027560, 2018. a
Proske, U., Adams, M. P., Porter, G. C. E., Holden, M., Bäck, J., and Murray, B. J.: Measurement report: The ice-nucleating activity of lichen sampled in a northern European boreal forest, EGUsphere [preprint], https://doi.org/10.5194/egusphere-2023-2780, 2024. a, b, c
Pruppacher, H. and Klett, J.: Microphysics of Clouds and Precipitation, Atmospheric and Oceanographic Sciences Library, Springer Netherlands, https://doi.org/10.1007/978-0-306-48100-0, 2010. a
Radenz, M., Bühl, J., Seifert, P., Baars, H., Engelmann, R., Barja González, B., Mamouri, R.-E., Zamorano, F., and Ansmann, A.: Hemispheric contrasts in ice formation in stratiform mixed-phase clouds: disentangling the role of aerosol and dynamics with ground-based remote sensing, Atmos. Chem. Phys., 21, 17969–17994, https://doi.org/10.5194/acp-21-17969-2021, 2021. a
Sanchez-Marroquin, A., Arnalds, O., Baustian-Dorsi, K. J., Browse, J., Dagsson-Waldhauserova, P., Harrison, A. D., Maters, E. C., Pringle, K. J., Vergara-Temprado, J., Burke, I. T., McQuaid, J. B., Carslaw, K. S., and Murray, B. J.: Iceland is an episodic source of atmospheric ice-nucleating particles relevant for mixed-phase clouds, Science Advances, 6, eaba8137, https://doi.org/10.1126/sciadv.aba8137, 2020. a
Savage, N. J., Krentz, C. E., Könemann, T., Han, T. T., Mainelis, G., Pöhlker, C., and Huffman, J. A.: Systematic characterization and fluorescence threshold strategies for the wideband integrated bioaerosol sensor (WIBS) using size-resolved biological and interfering particles, Atmos. Meas. Tech., 10, 4279–4302, https://doi.org/10.5194/amt-10-4279-2017, 2017. a, b
Schill, G. P., DeMott, P. J., Emerson, E. W., Rauker, A. M. C., Kodros, J. K., Suski, K. J., Hill, T. C. J., Levin, E. J. T., Pierce, J. R., Farmer, D. K., and Kreidenweis, S. M.: The contribution of black carbon to global ice nucleating particle concentrations relevant to mixed-phase clouds, P. Natl. Acad. Sci. USA, 117, 22705–22711, https://doi.org/10.1073/pnas.2001674117, 2020a. a
Schneider, J., Höhler, K., Heikkilä, P., Keskinen, J., Bertozzi, B., Bogert, P., Schorr, T., Umo, N. S., Vogel, F., Brasseur, Z., Wu, Y., Hakala,700 S., Duplissy, J., Moisseev, D., Kulmala, M., Adams, M. P., Murray, B. J., Korhonen, K., Hao, L., Thomson, E. S., Castarède, D., Leisner, T., Petäjä, T., and Möhler, O.: Datasets to: The seasonal cycle of ice-nucleating particles linked to the abundance of biogenic aerosol in boreal forests, KIT [data set], https://doi.org/10.5445/IR/1000120666, 2020b. a
Schneider, J., Höhler, K., Heikkilä, P., Keskinen, J., Bertozzi, B., Bogert, P., Schorr, T., Umo, N. S., Vogel, F., Brasseur, Z., Wu, Y., Hakala, S., Duplissy, J., Moisseev, D., Kulmala, M., Adams, M. P., Murray, B. J., Korhonen, K., Hao, L., Thomson, E. S., Castarède, D., Leisner, T., Petäjä, T., and Möhler, O.: The seasonal cycle of ice-nucleating particles linked to the abundance of biogenic aerosol in boreal forests, Atmos. Chem. Phys., 21, 3899–3918, https://doi.org/10.5194/acp-21-3899-2021, 2021. a, b, c, d, e, f, g, h, i
Schumacher, C. J., Pöhlker, C., Aalto, P., Hiltunen, V., Petäjä, T., Kulmala, M., Pöschl, U., and Huffman, J. A.: Seasonal cycles of fluorescent biological aerosol particles in boreal and semi-arid forests of Finland and Colorado, Atmos. Chem. Phys., 13, 11987–12001, https://doi.org/10.5194/acp-13-11987-2013, 2013. a
Seifried, T. M., Reyzek, F., Bieber, P., and Grothe, H.: Scots Pines (Pinus sylvestris) as Sources of Biological Ice-Nucleating Macromolecules (INMs), Atmosphere, 14, 266, https://doi.org/10.3390/atmos14020266, 2023. a, b
Stein, A. F., Draxler, R. R., Rolph, G. D., Stunder, B. J. B., Cohen, M. D., and Ngan, F.: NOAA's HYSPLIT Atmospheric Transport and Dispersion Modeling System, B. Am. Meteorol. Soc., 96, 2059–2077, https://doi.org/10.1175/BAMS-D-14-00110.1, 2015. a
Steinke, I., Funk, R., Busse, J., Iturri, A., Kirchen, S., Leue, M., Möhler, O., Schwartz, T., Schnaiter, M., Sierau, B., Toprak, E., Ullrich, R., Ulrich, A., Hoose, C., and Leisner, T.: Ice nucleation activity of agricultural soil dust aerosols from Mongolia, Argentina, and Germany: Ice Nucleation Activity of Soil Dust, J. Geophys. Res.-Atmos., 121, 13559–13576, https://doi.org/10.1002/2016JD025160, 2016. a
Storelvmo, T.: Aerosol Effects on Climate via Mixed-Phase and Ice Clouds, Annu. Rev. Earth Pl. Sc., 45, 199–222, https://doi.org/10.1146/annurev-earth-060115-012240, 2017. a
Takeishi, A. and Storelvmo, T.: A Study of Enhanced Heterogeneous Ice Nucleation in Simulated Deep Convective Clouds Observed During DC3, J. Geophys. Res.-Atmos., 123, 13,396–13,420, https://doi.org/10.1029/2018JD028889, 2018. a
Timothy P. Wright, John D. Hader, G. R. M. and Petters, M. D.: High Relative Humidity as a Trigger for Widespread Release of Ice Nuclei, Aerosol Sci. Tech., 48, i–v, https://doi.org/10.1080/02786826.2014.968244, 2014. a
Tobo, Y., Prenni, A. J., DeMott, P. J., Huffman, J. A., McCluskey, C. S., Tian, G., Pöhlker, C., Pöschl, U., and Kreidenweis, S. M.: Biological aerosol particles as a key determinant of ice nuclei populations in a forest ecosystem: BIOLOGICAL ICE NUCLEI IN FOREST, J. Geophys. Res.-Atmos., 118, 10100–10110, https://doi.org/10.1002/jgrd.50801, 2013. a, b, c, d
Tobo, Y., Adachi, K., DeMott, P. J., Hill, T. C., Hamilton, D. S., Mahowald, N. M., Nagatsuka, N., Ohata, S., Uetake, J., Kondo, Y., and Koike, M.: Glacially sourced dust as a potentially significant source of ice nucleating particles, Nat. Geosci., 12, 253–258, 2019. a
Toprak, E. and Schnaiter, M.: Fluorescent biological aerosol particles measured with the Waveband Integrated Bioaerosol Sensor WIBS-4: laboratory tests combined with a one year field study, Atmos. Chem. Phys., 13, 225–243, https://doi.org/10.5194/acp-13-225-2013, 2013. a
Tormo, R., Recio, D., Silva, I., and Muñoz, A.: A quantitative investigation of airborne algae and lichen soredia obtained from pollen traps in south-west Spain, Eur. J. Phycol., 36, 385–390, 2001. a, b, c, d
Umo, N. S., Murray, B. J., Baeza-Romero, M. T., Jones, J. M., Lea-Langton, A. R., Malkin, T. L., O'Sullivan, D., Neve, L., Plane, J. M. C., and Williams, A.: Ice nucleation by combustion ash particles at conditions relevant to mixed-phase clouds, Atmos. Chem. Phys., 15, 5195–5210, https://doi.org/10.5194/acp-15-5195-2015, 2015. a
Vali, G., DeMott, P. J., Möhler, O., and Whale, T. F.: Technical Note: A proposal for ice nucleation terminology, Atmos. Chem. Phys., 15, 10263–10270, https://doi.org/10.5194/acp-15-10263-2015, 2015. a
Vergara-Temprado, J., Murray, B. J., Wilson, T. W., O'Sullivan, D., Browse, J., Pringle, K. J., Ardon-Dryer, K., Bertram, A. K., Burrows, S. M., Ceburnis, D., DeMott, P. J., Mason, R. H., O'Dowd, C. D., Rinaldi, M., and Carslaw, K. S.: Contribution of feldspar and marine organic aerosols to global ice nucleating particle concentrations, Atmos. Chem. Phys., 17, 3637–3658, https://doi.org/10.5194/acp-17-3637-2017, 2017. a
Vergara-Temprado, J., Miltenberger, A. K., Furtado, K., Grosvenor, D. P., Shipway, B. J., Hill, A. A., Wilkinson, J. M., Field, P. R., Murray, B. J., and Carslaw, K. S.: Strong control of Southern Ocean cloud reflectivity by ice-nucleating particles, P. Natl. Acad. Sci. USA, 115, 2687–2692, https://doi.org/10.1073/pnas.1721627115, 2018. a
Villanueva, D., Senf, F., and Tegen, I.: Hemispheric and Seasonal Contrast in Cloud Thermodynamic Phase From A-Train Spaceborne Instruments, J. Geophys. Res.-Atmos., 126, e2020JD034322, https://doi.org/10.1029/2020JD034322, 2021. a
Welti, A., Müller, K., Fleming, Z. L., and Stratmann, F.: Concentration and variability of ice nuclei in the subtropical maritime boundary layer, Atmos. Chem. Phys., 18, 5307–5320, https://doi.org/10.5194/acp-18-5307-2018, 2018. a
Westbrook, C. D. and Illingworth, A. J.: Evidence that ice forms primarily in supercooled liquid clouds at temperatures > −27 °C, Geophys. Res. Lett., 38, L14808, https://doi.org/10.1029/2011GL048021, 2011. a
Wex, H., Huang, L., Zhang, W., Hung, H., Traversi, R., Becagli, S., Sheesley, R. J., Moffett, C. E., Barrett, T. E., Bossi, R., Skov, H., Hünerbein, A., Lubitz, J., Löffler, M., Linke, O., Hartmann, M., Herenz, P., and Stratmann, F.: Annual variability of ice-nucleating particle concentrations at different Arctic locations, Atmos. Chem. Phys., 19, 5293–5311, https://doi.org/10.5194/acp-19-5293-2019, 2019. a
Wilbourn, E. K., Thornton, D. C., Ott, C., Graff, J., Quinn, P. K., Bates, T. S., Betha, R., Russell, L. M., Behrenfeld, M. J., and Brooks, S. D.: Ice Nucleation by Marine Aerosols Over the North Atlantic Ocean in Late Spring, J. Geophys. Res.-Atmos., 125, e2019JD030913, https://doi.org/10.1029/2019JD030913, e2019JD030913 2019JD030913, 2020. a
Wilson, T. W., Ladino, L. A., Alpert, P. A., Breckels, M. N., Brooks, I. M., Browse, J., Burrows, S. M., Carslaw, K. S., Huffman, J. A., Judd, C., Kilthau, W. P., Mason, R. H., McFiggans, G., Miller, L. A., Nájera, J. J., Polishchuk, E., Rae, S., Schiller, C. L., Si, M., Temprado, J. V., Whale, T. F., Wong, J. P. S., Wurl, O., Yakobi-Hancock, J. D., Abbatt, J. P. D., Aller, J. Y., Bertram, A. K., Knopf, D. A., and Murray, B. J.: A marine biogenic source of atmospheric ice-nucleating particles, Nature, 525, 234–238, https://doi.org/10.1038/nature14986, 2015. a