the Creative Commons Attribution 4.0 License.
the Creative Commons Attribution 4.0 License.
 | 14 Oct 2024
Long-term (2010–2021) lidar observations of stratospheric aerosols in Wuhan, China
Dongzhe Jing
Zhenping Yin
Kevin Ohneiser
This study analyzes the vertical distribution, optical properties, radiative forcing, and several perturbation events of stratospheric aerosols using observations from a ground-based polarization lidar in Wuhan (30.5° N, 114.4° E) from 2010 to 2021. The background stratospheric aerosol optical depth (sAOD) was 0.0044 ± 0.0019 at 532 nm, as calculated during a stratosphere-quiescent period from January 2013 to August 2017. In addition, several cases of volcanic aerosol and wildfire-induced smoke were observed. Volcanic aerosols from the Nabro (2011) and Raikoke (2019) eruptions (both in boreal summer) increased the sAOD to 2.9 times the background level. Tracers of smoke from the Canadian wildfire in the summer of 2017 were observed twice, at 19–21 km on 14–17 September and at 20–23 km on 28–31 October, with a plume-isolated aerosol optical depth (AOD) of 0.002–0.010 and a particle linear depolarization ratio δp of 0.14–0.18, indicating the dominance of non-aged smoke particles. During these summertime events, the injected stratospheric aerosols were captured by the large-scale Asian monsoon anticyclone (AMA), confining the transport pathway to mid-latitude Asia. On 8–9 November 2020, smoke plumes originating from the California wildfire in October 2020 appeared at 16–17 km, with a mean δp of 0.13. Regarding seasonal variation, the sAOD in the cold half-year (0.0054) is 69 % larger than in the warm half-year (0.0032) due to stronger meridional transport of stratospheric aerosols from the tropics to middle latitudes. The stratospheric radiative forcing was −0.11 W m−2 during the stratosphere-quiescent period and increased to −0.31 W m−2 when volcanic aerosols were largely injected. These findings contribute to our understanding of the sources and transport patterns of stratospheric aerosols over mid-latitude Asia and serve as an important database for the validation of model outputs.
- Article
(7042 KB) - Full-text XML
- BibTeX
- EndNote


The stratospheric aerosol layer (SAL) extends from the tropopause up to approximately 30 km height and is long-lasting, with a residence time of several months to years (Junge, 1960; Junge and Manson, 1961; Hitchman et al., 1994; Kremser et al., 2016). Stratospheric aerosols play a critical role in the global radiation budget by scattering incoming solar radiation back to space during periods of strong loading, resulting in the cooling of the near-surface and lower atmosphere (Thompson and Solomon, 2009; Solomon et al., 2011). In addition, stratospheric aerosols can activate heterogeneous chemistry by serving as a reaction surface, leading to stratospheric ozone depletion (Hofmann and Solomon, 1989; Jäger and Wege, 1990; Ohneiser et al., 2022).

Figure 1The locations of ground-based lidar sites with long-term stratospheric aerosol observations (solid dots) and two main volcanic eruptions, i.e., Nabro 2011 and Raikoke 2019 (solid triangles), as reported by Kremser et al. (2016), Hofer et al. (2024), and Trickl et al. (2024).
The SAL mainly consists of sulfate aerosols, which are formed from SO2 and ash emitted by volcanic eruptions via oxidation and condensation (Gorkavyi et al., 2021). Moreover, other sources also contribute to the SAL, including smoke particles emitted from wildfires, carbonyl sulfide and dimethyl sulfide from the sea, SO2 from anthropogenic activities, emissions from air traffic, and dust aerosols from Asia and Africa (Peterson et al., 2018; Trickl et al., 2024). In general, the long-term characteristics of stratospheric aerosols intermittently show the stratospheric background level (i.e., during the stratosphere-quiescent period) and the SAL perturbations caused by significant volcanic eruptions. Therefore, it is of great importance to evaluate the background level of stratospheric aerosols by taking advantage of the occasional stratosphere-quiescent periods.
Deshler et al. (2006) found no significant change in background stratospheric aerosol levels from the 1970s to 2004. Similarly, with observations in France, Khaykin et al. (2017) reported a stratospheric aerosol optical depth (sAOD; integrating altitudes of 17–30 km) of 2.37 × 10⁻³ at 532 nm during 1997–2003, the lowest since 1970, which can be considered a reference for background levels. Trickl et al. (2013, 2024) calculated the integrated backscatter coefficient (IBC) starting at 1 km above the tropopause since 2000, which is lower than the other groups. It is important to note that this differing definition of the lower boundary may result in a negative offset of IBC or sAOD. In contrast, stratospheric aerosols showed an increasing trend in the first decade of the 21st century due to several intense volcanic eruptions (Hofmann et al., 2009; Solomon et al., 2011; Vernier et al., 2011). Another volcanic-eruption-quiescent period was 2013–2019, between the eruptions of Nabro in 2011 and Raikoke in 2019. Meanwhile, intense wildfire events became more frequent, such as the Canadian wildfire in 2017 and 2019; the Siberian wildfire in 2019; the Australian wildfire in 2019; and the California wildfire in 2020 (Ansmann et al., 2022; Mamouri et al., 2023; Ohneiser et al., 2020, 2022; Shang et al., 2021; Veselovskii et al., 2023), which injected a mass of smoke particles into the stratosphere via pyrocumulonimbus clouds. Smoke particles can increase the particle number and surface area concentration of polar stratospheric clouds (PSCs), resulting in ozone depletion by halogen activation reactions on the surface of liquid PSC particles (Ansmann et al., 2022). Additionally, previous studies have speculated that the increasing Asian SO2 emissions may also contribute to the stratospheric aerosol levels (Vernier et al., 2015), which should be further examined with observations (Kremser et al., 2016). In consequence, continuous observations in the second decade of the 21st century provide a valuable opportunity to estimate the contributors to stratospheric aerosol levels aside from strong volcanic activities.
Table 1Specifications of the polarization lidar system at Wuhan University.

The long-term characteristics of the SAL can be monitored mainly using ground-based lidar observations, balloon-borne in situ measurements, and space-borne detection (Kremser et al., 2016; Bingen et al., 2017; Chouza et al., 2020; Trickl et al., 2024). Lidar is considered a great approach for vertically resolved observation of SALs, providing high spatiotemporal resolution. Long-term ground-based lidar observations are crucial for ensuring the continuity of stratospheric aerosol measurements. There are several long-term (exceeding 1 decade) datasets of stratospheric aerosols observed by lidar at various locations, including Mauna Loa in Hawaii, USA (19.5° N, 156° W; Chouza et al., 2020); NASA Langley Research Center in Hampton, USA (37.1° N, 76.3° W; Woods et al., 2003); Garmisch-Partenkirchen in Germany (47.5° N, 11.1° E; Trickl et al., 2013, 2024); São José dos Campos in Brazil (23.2° S, 45.9° W; Clemesha et al., 1997); Tsukuba in Japan (36.1° N, 140.1° E; Sakai et al., 2016); Lauder in Aotearoa / New Zealand (45.0° S, 169.7° E; Sakai et al., 2016); Tomsk in Russia (56.48° N, 85.05° E; Zuev et al., 2017); and the Observatoire de Haute-Provence in France (43.9° N, 5.7° E; Khaykin et al., 2017) (see Fig. 1). Since 2010, we have also conducted long-term lidar observations of stratospheric aerosols in Wuhan (30.5° N, 114.4° E), central China, which can be a good supplementation to the geographical coverage of the mid-latitude East Asian region.
Wuhan is a central Chinese city located in a transitional region between the tropics and mid-latitudes of the Northern Hemisphere, significantly impacted by the Asian monsoon in summer. The Asian monsoon anticyclone (AMA) emerges in response to persistent deep convection over India and southeast Asia during the boreal summer (Garny and Randel, 2016), controlling the transport patterns of aerosol plumes in the upper troposphere and lower stratosphere (UTLS) over East Asia. The AMA captures volcanic-emitted stratospheric aerosols to retain and transport at mid-latitudes in Asia (Zhuang and Yi, 2016; Jing et al., 2023). Moreover, the AMA facilitates efficient vertical transport of tropospheric aerosols to the UTLS (Garny and Randel, 2016; Yu et al., 2017), forming the so-called “Asian tropopause aerosol layer” (ATAL), which may also contribute to stratospheric aerosol levels. Therefore, conducting long-term lidar observations in such a location is highly valuable.
In this study, we analyze the long-term characteristics of stratospheric aerosols over Wuhan using persistent observations from a ground-based polarization lidar together with data from several spaceborne instruments during 2010–2021. This paper is organized as follows. Section 2 provides a brief description of the instruments used and the data processing methods. In Sect. 3, we present the statistical characteristics and significant injection events of stratospheric aerosols. Last, a summary and conclusions are presented.
2.1 Ground-based polarization lidar in Wuhan
The vertically resolved optical properties of stratospheric aerosols have been observed with a 532 nm polarization lidar in Wuhan (30.5° N, 114.4° E) since October 2010 (He et al., 2021, 2022; Yin et al., 2021). A detailed description of the lidar system can be found in previous studies (Kong and Yi, 2015; He and Yi, 2015). Specifications of the polarization lidar system are listed in Table 1. Benefiting from the installation of a transparent waterproof window in 2017, the lidar system can perform continuously regardless of rainy or snowy conditions (Yi et al., 2021) from then on except for the necessary maintenance.
Table 2Estimated uncertainties of the lidar-derived parameters.

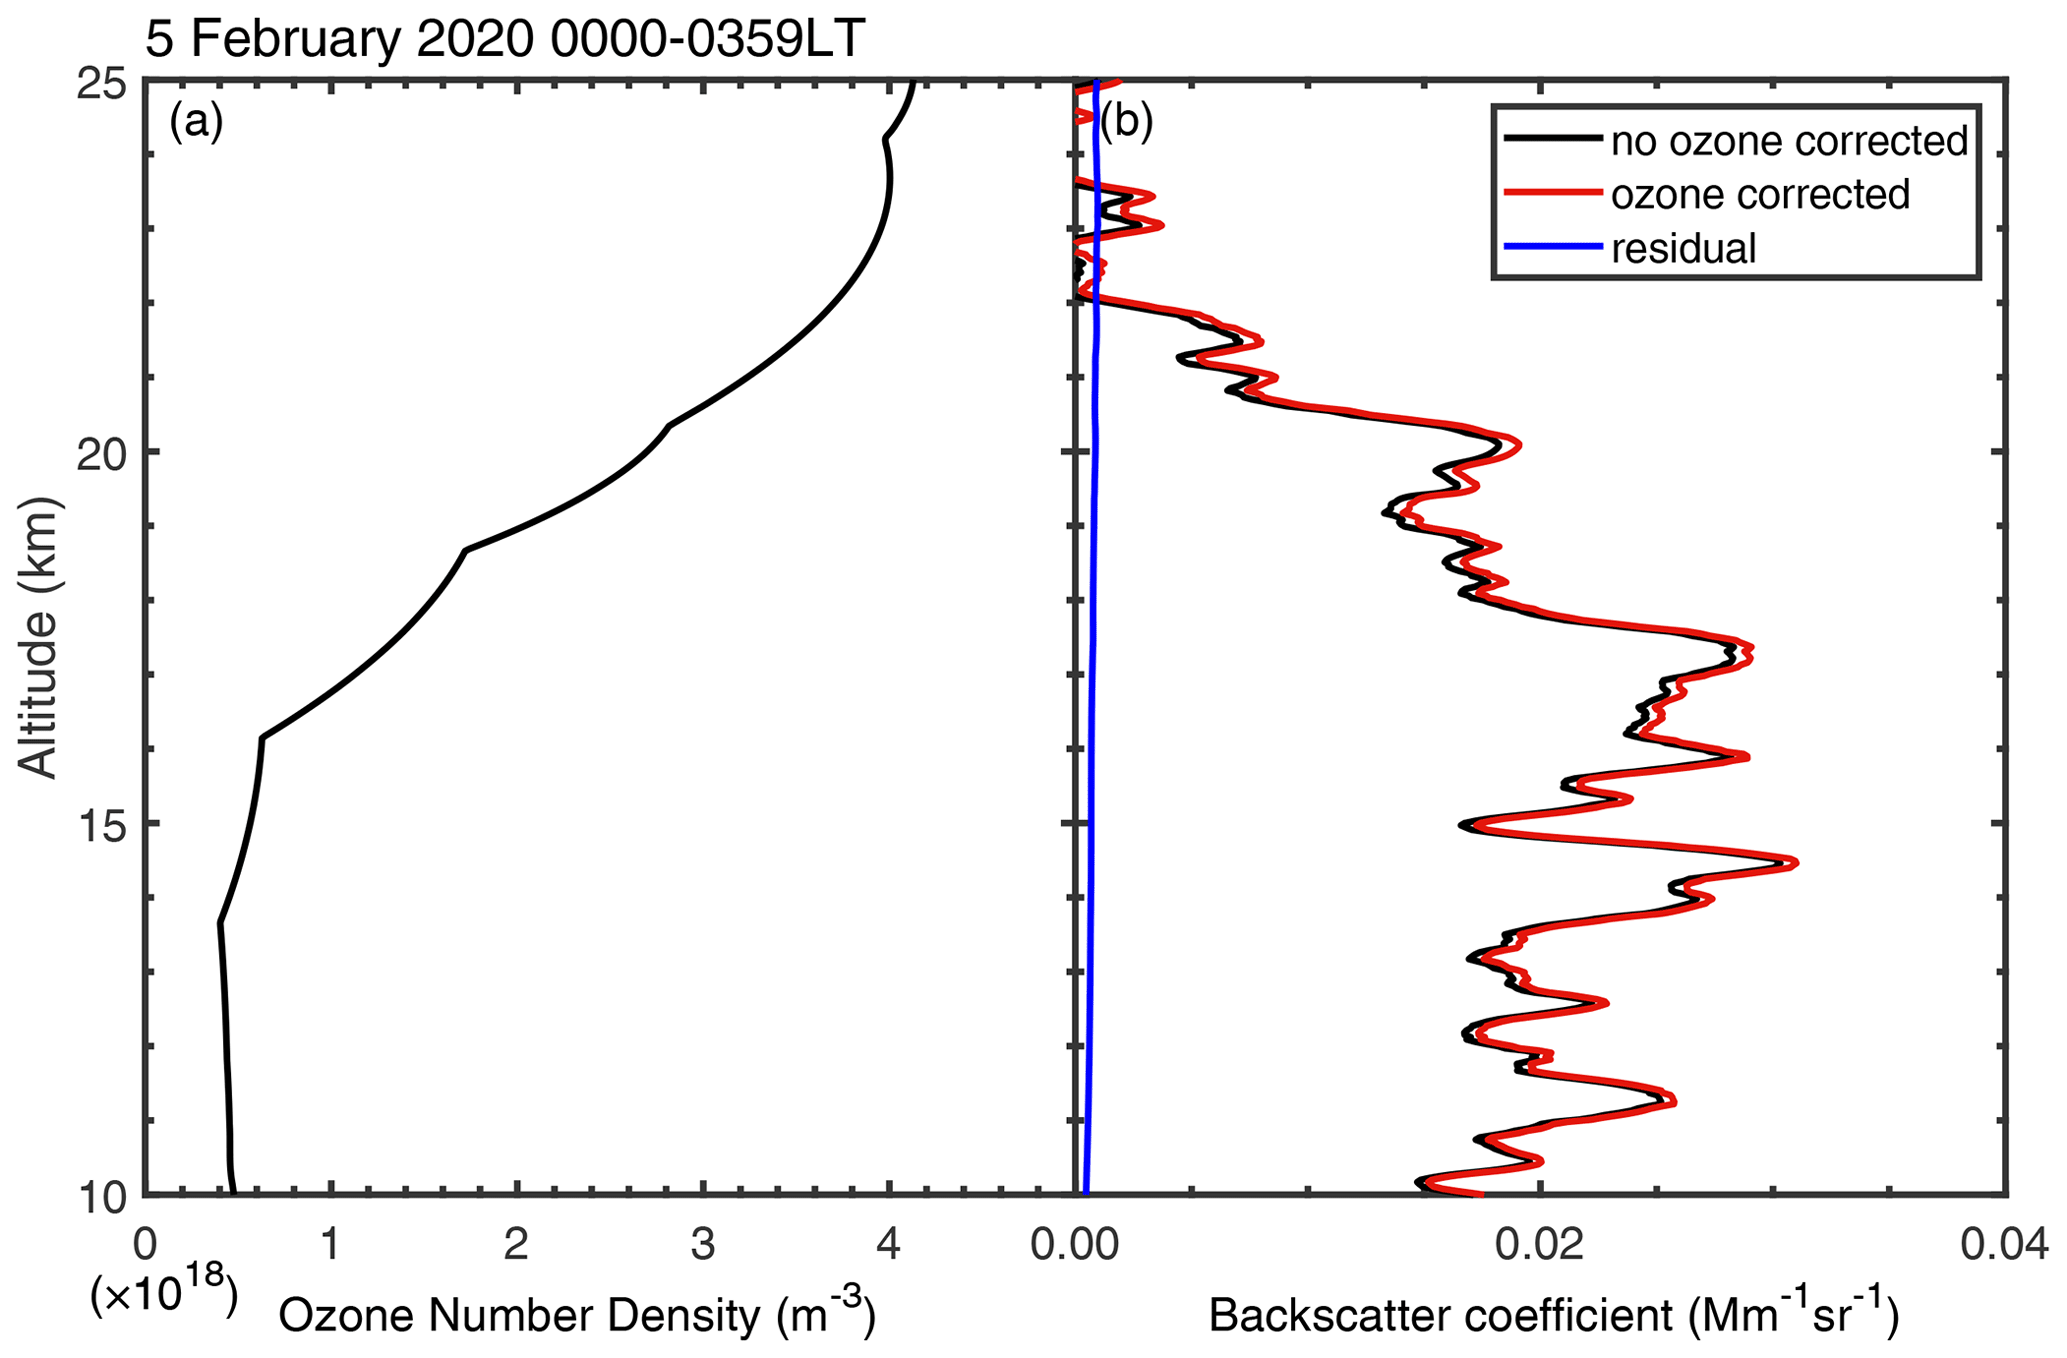
Figure 2(a) The ozone number density and (b) the backscatter coefficient that is ozone-corrected (red line) and not ozone-corrected (black line) over Wuhan at 00:00–03:59 LT (local time) on 5 February 2020. The blue line represents the residual of the backscatter coefficient after ozone correction.
Raw data are stored with resolutions of 1 min and 30 m. The Fernald method (Fernald, 1984) was used to retrieve the backscatter coefficient βp and aerosol extinction coefficient αp, using a fixed aerosol lidar ratio of 50 sr for the long-term (2010–2021) and 70 sr for smoke events (Canadian wildfire in 2017 and California wildfire in 2020) (Haarig et al., 2018). The volume depolarization ratio δv is calculated as the ratio of perpendicular- to parallel-oriented signals, multiplied by the gain ratio, and then converted into the particle depolarization ratio (PDR) δp (Freudenthaler et al., 2009). The same as Trickl et al. (2024), we use 1 km above the tropopause as the lower limit for sAOD calculation to avoid the influence of tropospheric aerosols and to incorporate the stratospheric aerosols as much as possible. Therefore, the stratospheric aerosol optical depth (sAOD) is calculated by integrating the aerosol extinction coefficient from 1 km above the tropopause to 30 km to minimize disturbances from the troposphere and ensure a sufficient signal-to-noise ratio (SNR). The uncertainties in the derived parameters, as well as the corresponding references, are listed in Table 2.
In addition, an algorithm developed by Yin et al. (2021) was used to screen out all the cloud-free profiles, utilizing a height resolution of 30 m and a time resolution of 4 h to ensure a sufficient SNR, with a sliding average of 300 m for height. The Rayleigh fit method was used to find the reference altitude between 5 and 20 km, with a width of 1.5 km, which the signal is close to the molecular signal derived from meteorological data provided by the Global Data Assimilation System (GDAS) (Baars et al., 2016). The reference value was set to 0.018 (corresponding to an extinction coefficient of 0.9 Mm−1). The molecule backscatter coefficient and extinction coefficient are calculated based on the method presented by Bucholtz (1995), with an uncertainty of < 2 %. Fernald forward inversion was then applied up to an altitude of 30 km to calculate the profiles of the backscatter coefficient and extinction coefficient. Due to the weak signal of stratospheric aerosols, different data processing methods can lead to significant variations in the specific values of the results. From October 2010 to September 2021, 775 nighttime cloud-free profiles were selected for long-term statistical analysis.
Absorption by ozone in the stratosphere was also taken into account. The ozone absorption coefficient is given by
where = 2.72 × 10⁻²¹ cm2 is the ozone absorption cross-section (Gorshelev et al., 2014), and is the ozone number density (Fig. 1a). We utilized profiles from the Copernicus Atmosphere Monitoring Service (CAMS) reanalysis data within latitudes of 28.0–31.8° N and longitudes of 113.0–114.5° E. To correct aerosol extinction by considering ozone absorption, the seasonal average profiles from 2015 were employed as the representative ozone levels for each season through our measurement period, i.e., March–April–May for spring, June–July–August for summer, September–October–November for autumn, and December–January–February for winter. The relative uncertainty of the backscatter coefficient profile was less than 5 %. As an example, Fig. 2b shows the backscatter coefficient profile with and without correction for ozone absorption on 5 February 2020. The mean residual between 15 and 25 km is approximately 8 × 10⁻⁴ , which cannot be ignored.
2.2 CALIOP spaceborne lidar
The spaceborne lidar CALIOP, carried on the Cloud-Aerosol Lidar and Infrared Pathfinder Satellite Observation (CALIPSO) satellite, has been widely used to observe the vertically resolved optical and microphysical properties of aerosols and clouds since 2006 (Winker et al., 2007). It is capable of measuring the elastic backscatter at both 532 and 1064 nm, as well as the depolarization ratio at 532 nm near the nadir.
In this study, CALIOP version 4.10 Level-1B data were used to track smoke plumes from September to October 2017 and from October to November 2020, illustrating their vertical distributions and optical properties. In addition, the CALIOP Level-3 stratospheric aerosol profile product (Kar et al., 2019) provides monthly mean aerosol optical properties on a spatial grid of 5° in latitude and 20° in longitude. It should be mentioned that the CALIOP Level-3 product consistently exhibits a bit higher aerosol extinction compared with the other satellite-based datasets (Chouza et al., 2020). Moreover, monthly mean tropopause altitudes from MERRA-2 (Modern-Era Retrospective analysis for Research and Applications, Version 2) reanalysis were provided in the CALIOP Level-3 stratospheric aerosol profile product.
2.3 OMPS
The Ozone Mapping and Profiler Suite (OMPS) is installed on the joint NASA/NOAA (National Aeronautics and Space Administration and National Oceanic and Atmospheric Administration) Suomi National Polar-orbiting Partnership (Suomi NPP) satellite, launched in October 2011 (Jaross et al., 2014). OMPS comprises three spectrometers: a downward-looking nadir mapper, a nadir profiler, and a limb profiler. The UV Aerosol Index (UVAI) is an effective indicator of UV-absorbing aerosols, discerning between aerosol absorption and Rayleigh scattering, which is provided by the nadir-mapper instrument on the Suomi-NPP satellite at a spatial resolution of 50 km × 50 km. The UVAI has been widely employed in detecting elevated aerosols with significant absorption in the atmosphere, such as smoke and dust (Penning de Vries et al., 2009; Lee et al., 2015; Tao et al., 2022). In this study, the UVAI provided by the OMPS-NPP Level-2 data product was used to show the horizontal spatial distribution of smoke plumes.
Additionally, OMPS-NPP Level-3 data provide aerosol extinction coefficients at a spatial resolution of 5° × 15° lat–long grid measured by a limb profiler sensor. The monthly mean sAOD at 510 nm at 32.5° N, 112.5° E, provided by OMPS-NPP Level-3 data product, was used to estimate the evolution of Canadian smoke aerosols over Asia from August to November 2017. Furthermore, the monthly mean tropopause altitudes from August 2020 to September 2021 were also presented.
2.4 HYSPLIT model
The NOAA/ARL (National Oceanic and Atmospheric Administration/Air Resources Laboratory) Hybrid Single Particle Lagrangian Integrated Trajectory (HYSPLIT) model (Draxler and Rolph., 2003; Stein et al., 2015) can simulate the forward and backward trajectories of an air mass by giving a starting time and an initial altitude and geographical location. The meteorological field from the GDAS archive (Kanamitsu, 1989) was used to drive the model in the calculation. In this study, the simulated backward trajectories were used to track the transport pathway and to confirm the source of smoke plumes.
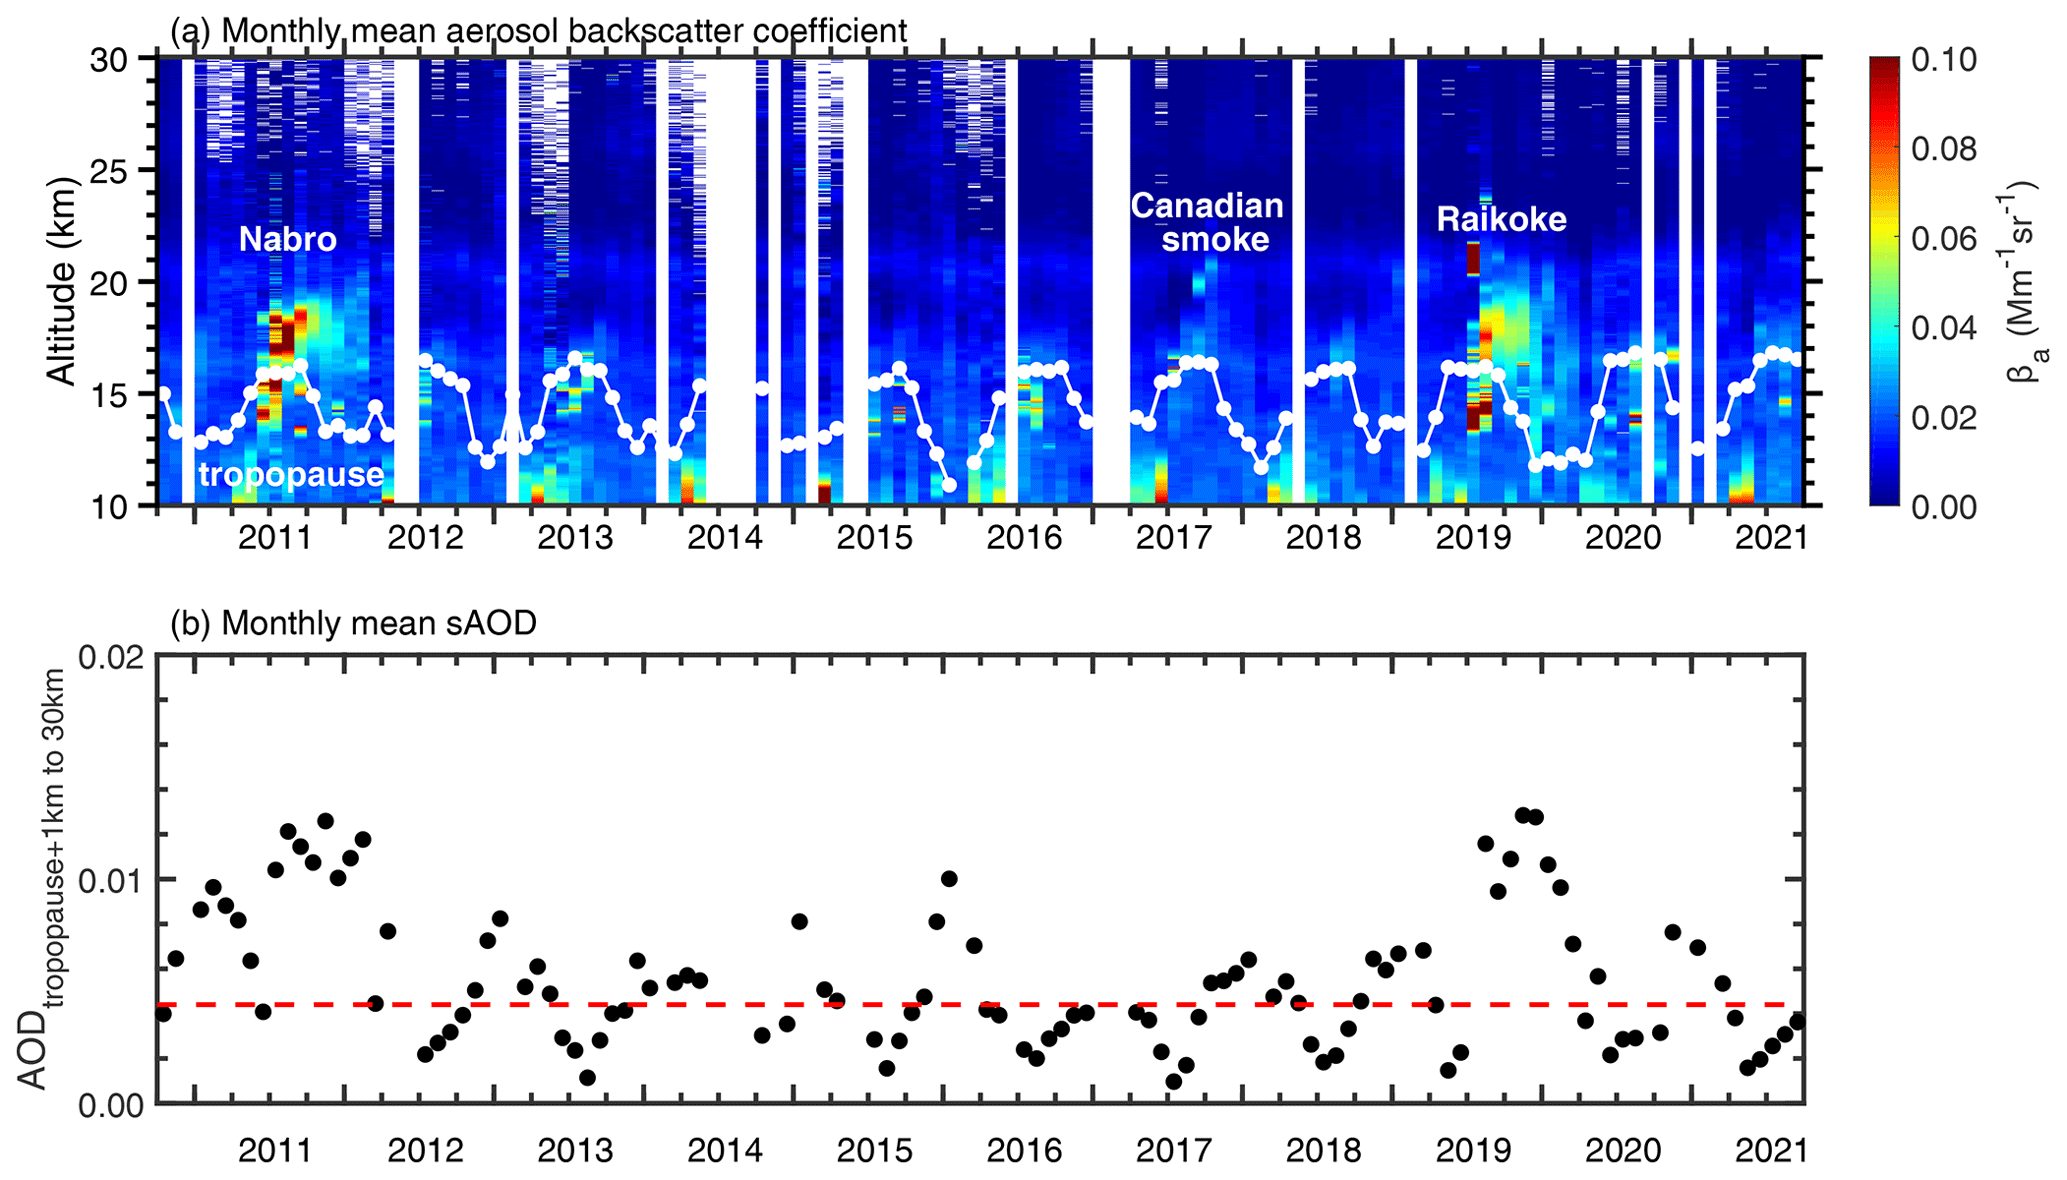
Figure 3(a) Time–height contour plots of the aerosol backscatter coefficient measured by 532 nm polarization lidar over Wuhan during 2010–2021; the white curve represents the monthly mean tropopause from CALIOP (October 2010 to July 2020) and OMPS (August 2020 to September 2021). (b) The evolution of monthly mean 532 nm sAOD from 1 km above the tropopause to 30 km derived from polarization lidar observation (black curve) in Wuhan. The dashed red line represents the background sAOD of 0.0044.
3.1 Overview of stratospheric aerosols
Figure 3 shows the long-term evolution of vertically resolved aerosol backscatter coefficient and sAOD over Wuhan from 2010 to 2021. The monthly mean tropopause altitudes are provided by the CALIOP (before August 2020) and OMPS (after August 2020) Level-3 data products (represented by the white curve). In Fig. 3a, the white pixels and stripes are due to a lack of observations or insufficient SNRs. A stratospheric background aerosol layer, known as the “Junge Layer”, consisting primarily of sulfate from the oxidation of tropospheric SO2 or OCS (carbonyl sulfide) (Junge, 1960; Junge and Manson, 1961; Kremser, et al., 2016), persistently appeared during that period at altitudes of 19.5–23.0 km, with an average extinction coefficient of 0.36 Mm−1. Three significant episodes with more abundant tropospheric aerosols injected are evident: volcanic aerosols from the 2011 Nabro eruption and the 2019 Raikoke eruption, as well as smoke aerosols from the 2017 Canadian wildfire event. Moreover, a weak aerosol plume from the 2020 California wildfire event was also observed.
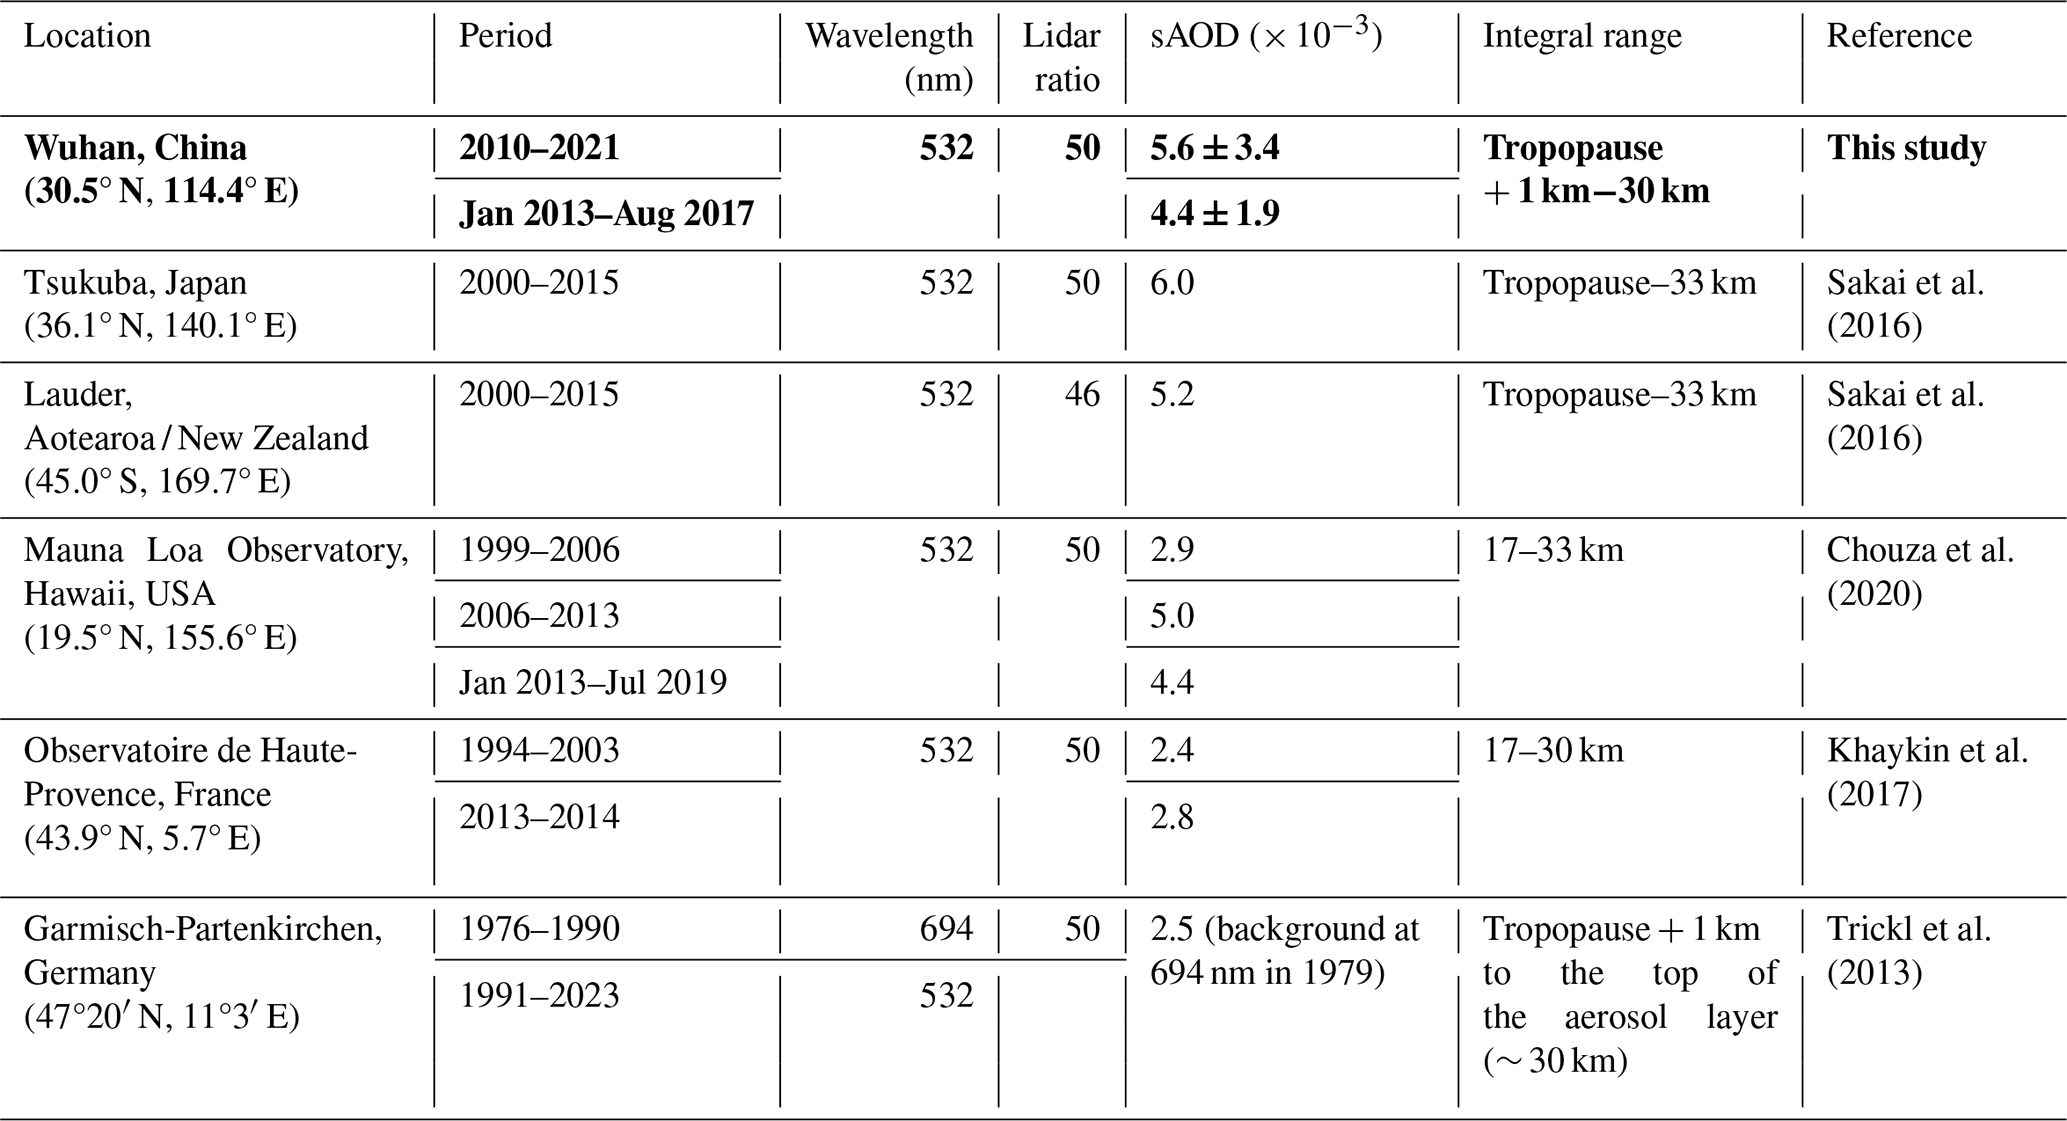
Table 3Stratospheric aerosol optical depths at different sites worldwide. The sAOD values at Tsukuba and Lauder are obtained by multiplying the integrated backscatter coefficients (IBCs) by a lidar ratio. In Wuhan, the period from 2010 to 2021 represents the entire lidar measurement period, while the period from January 2013 to August 2017 represents a local (only for Wuhan) stratosphere-quiescent period. Note that the Garmisch-Partenkirchen group did not provide the average values of IBC or sAOD; thus, only 694 nm sAOD in 1979, calculated from the IBC by multiplying it by a lidar ratio, is given here as a reference value of the stratospheric aerosol level. The results in this study are shown in bold font.
The stratosphere-quiescent period from January 2013 to August 2017 can be defined as reflecting the background level of stratospheric aerosols over Wuhan. The Volcanic Explosivity Index (VEI) is a general indicator of the explosive character of a volcanic eruption (Newhall and Self, 1982). It compositely estimates Walker's magnitude, intensity, destructiveness, dispersive power, and energy release rate and is assigned a value from 1 to 8. Two volcanoes with a VEI ≥ 4 erupted during this period: Kelud in Indonesia (7.9° S) in February 2014 and Wolf in the Galápagos Islands (0.0° N) in May 2015. Kelud volcanic aerosols were reported to be detected over high latitudes in Tomsk (56.5° N) (Zuev et al., 2017) and the Observatoire de Haute-Provence (OHP) (43.9° N) (Khaykin et al. 2017) in January 2015 due to the meridional aerosol transport. However, no aerosol plumes were observed by our lidar over Wuhan in the first quarter of 2015, and the increase in sAOD during this period cannot be attributed to a significant influence of Kelud. Several reasons are considered. First, it cannot be completely ruled out that a few Kelud aerosol plumes passed over Wuhan but were not observed due to weather conditions or hardware maintenance. Second, aerosol meridional transport from tropical into extratropical (middle) latitudes generally intensifies during the cold half of the year (October to March of the following year) (Niwano et al., 2009), causing an increase in aerosol optical properties in winter (Sakai et al., 2016; Zuev et al., 2017). An increase in sAOD at the turn of the year might be largely attributed to the seasonal variation of tropopause height (Fig. 1b). A detailed discussion of seasonal characteristics will be presented in Sect. 3.4. Therefore, it cannot be determined whether the increase in sAOD at the beginning of 2015 was due to the influence of Kelud or the seasonal meridional transport of tropical aerosols.
Table 3 lists the lidar-derived sAOD at different sites worldwide. Note that the sAOD values at Tsukuba, Lauder, and Garmisch-Partenkirchen are obtained by multiplying the integrated backscatter coefficients (IBCs) by a lidar ratio of 50 or 46 sr. The mean background sAOD (1 km above the tropopause to 30 km) over Wuhan was 0.0044 (± 0.0019), as obtained from January 2013 to August 2017. Due to the weak signal of stratospheric aerosols, different data processing methods can lead to variations in the exact sAOD values. Furthermore, it is noteworthy that the sAOD during the stratosphere-quiescent period over OHP increased from 0.0024 during 1997–2003 to 0.0028 during 2013–2014, suggesting the contribution of volcanic aerosols in the first decade of the 21st century. It is interesting to note that before 2006, volcanic eruptions with VEI ≥ 4 mainly occurred in the tropics (Chouza et al., 2020) and did not cause a noticeable enhancement of sAOD (or IBC) at mid-latitude sites in the Northern Hemisphere, revealing that tropical volcanic aerosols emitted during these events were not significantly transported northward.
The volcanic aerosol layers from the Nabro and Raikoke eruptions can be observed above Wuhan at altitudes 15–25 km during the second half of 2011 and 2019, respectively (Zhuang and Yi, 2016; Jing et al., 2023). An enhanced sAOD of 0.013 was observed during both the Nabro and Raikoke events, which was 2.9 times the background sAOD (0.0044). Another enhancement of the backscatter coefficient appeared around 20 km after September 2017, caused by the smoke aerosol injection from the Canadian wildfire event in August 2017. The intense pyrocumulonimbus (PyroCb) released approximately 0.1–0.3 Tg aerosols into the low stratosphere, comparable in quantity to those emitted from a moderate volcanic eruption (Peterson et al., 2018). The smoke plumes over Wuhan will be analyzed further in Sect. 3.3.
In addition, stratospheric aerosols are contributed by other tropospheric sources. Periodic increases in the backscatter coefficient were observed below an altitude of 18 km during the summer. The majority of these aerosol layers existed below the tropopause and are known as the ATAL (Vernier et al., 2015; Yu et al., 2015). The AMA emerges in response to persistent deep convection over India and southeast Asia during the boreal summer (Garny and Randel, 2016), leading to efficient vertical transport from the surface to the UTLS (Baker et al., 2011). Due to extensive human activities and the influence of the AMA, the ATAL forms and exists in the UTLS at altitudes of 13–18 km over megacities, consisting mainly of sulfate and carbonaceous aerosols (Vernier et al., 2015). The observation of the ATAL confirmed that anthropogenic aerosols and/or their gas-phase precursors can be transported to the UTLS, although they are generally removed effectively through precipitation, according to previous understanding (Mari et al., 2010).

Figure 4(a) The nighttime backscatter coefficient of volcanic aerosols of Nabro from June to October 2011. White stripes represent that data are unavailable due to unfavorable weather conditions or hardware maintenance. (b) The backscatter coefficient βp profiles of Nabro aerosol plume derived from polarization lidar observations over Wuhan.
3.2 Volcanic aerosol plumes
3.2.1 Nabro volcanic aerosols in 2011
The Nabro volcano (13.4° N, 41.7° E) erupted on 12 June 2011, and the emitted volcanic aerosols were transported eastward to Wuhan from 19 June onward (Zhuang and Yi, 2016), as shown in Fig. 4. The volcanic aerosols persistently appeared over Wuhan at altitudes of 16–20 km until October 2011. During the initial stage, the Nabro aerosol plume exhibited a mean βp of 0.33 at 16.0–19.3 km on 8 July and 0.07 at 17.0–19.0 km on 12 July. Such strong variability in both the backscatter coefficient and vertical distribution suggests an inhomogeneous spatial density of the aerosol plume. After August 2011, the Nabro aerosol plume generally diffused over a wider altitude range of 15–20 km, with a smaller mean βp of < 0.06 . Moreover, the integrated backscatter coefficient steadily decreased from mid-August to December, yielding an e-folding decay time of approximately 130 d, as reported by Zhuang and Yi (2016).

Figure 5(a) The nighttime backscatter coefficient of volcanic aerosols of Raikoke from July to November 2019. White stripes represent that data are unavailable due to weather conditions or hardware maintenance. The backscatter coefficient βp profiles of (b) the main aerosol plume and (c) CCC derived from polarization lidar observations over Wuhan.
3.2.2 Raikoke volcanic aerosols in 2019
Raikoke volcano (48.3° N, 153.3° E) erupted on 21–22 June 2019, resulting in two types of volcanic aerosol plumes, i.e., the main aerosol plume and a small but impacted aerosol cloud known as “coherent circular cloud” (CCC), as shown in Fig. 5. Jing et al. (2023) studied the transport pathway of the Raikoke volcanic aerosols and their optical properties over Wuhan. The main aerosol plume was initially transported eastward across North America, the Atlantic, and Europe before mid-July, eventually reaching south of Sakhalin Island on 22 July. Driven by the AMA, the transport pathway then turned southwestward, arriving in Wuhan on 25 July, having a mean βp of 0.04 . This main aerosol plume intermittently diffused at 15–20 km over Wuhan in the following months. Observations showed a decrease in layer-mean βp from 0.16 on 2 August to 0.04 on 23 September over Wuhan. Note that an intense Siberian wildfire took place meanwhile in the summer of 2019 (19 July to 14 August). Ohneiser et al. (2021) and Ansmann et al. (2024) found that large amounts of the smoke were transported into the central Arctic and were trapped by the polar vortex; thus, less smoke was transported to the low latitudes. Moreover, Jing et al. (2023) have discussed that the stratospheric aerosol plumes observed over Wuhan are probably only from the Raikoke eruption because the plume-isolated 532 nm AODs for Siberian smoke are approximately 0.1, as observed in Leipzig (Ansmann et al., 2021) and in the Arctic (Ohneiser et al., 2021), which are much larger than those for Raikoke volcanic aerosol layers observed in Wuhan (0.001–0.017, Jing et al., 2023), Leipzig (0.010–0.015; Ansmann et al., 2021), and Capel Dewi Atmospheric Observatory in the UK (0.01–0.05, Vaughan et al., 2021).

Figure 6The 4 h integrated nighttime (a) particle backscatter coefficient βp and (b) volume depolarization ratio δv measured by polarization lidar over Wuhan from September to October 2017. White stripes represent that data are unavailable due to weather conditions or hardware maintenance. The white curve represents the altitudes of the tropopause. The aerosol backscatter coefficient (c) and particle depolarization ratio (d) profiles derived from polarization lidar observations.
In addition, another impacted volcanic aerosol plume with a narrow horizontal extent of approximately 300 km, known as CCC, first appeared at 19–20 km near Kamchatka, Russia, on 18 July. It then moved southward to latitudes between 20 and 30° N, completing three full-circle transport cycles around the Earth over the following 2 months (Chouza et al., 2020; Gorkavyi et al., 2021). Interestingly, as shown in Fig. 5a, the first two circles were observed by our polarization lidar when the CCC passed over Wuhan, at approximately 21 km on 30 July and at around 24 km on 24 August. The peak βp of CCC was measured to be 6.5 on 30 July and 2.0 on 24 August, an order of magnitude larger than that of the main aerosol plume.
3.3 Smoke aerosol plumes
3.3.1 Canadian wildfire smoke in 2017
In August 2017, severe wildfires occurred in western Canada and the northwestern USA (Peterson et al., 2018). Large amounts of smoke were rapidly lifted to the UTLS (within less than an hour) through the formation of pyrocumulonimbus clouds. A portion of the smoke plume that separated from the initial emission was transported to mid-latitudes and later was observed over Wuhan in September 2017. The detail of the transport of this smoke plume to Wuhan is described in Appendix A. Figure 6 shows the backscatter coefficient and depolarization ratio derived from polarization lidar observations over Wuhan from September to October 2017. The white curve represents the altitude of the tropopause. Smoke aerosol plumes were first observed on 14–17 September at altitudes of 19.0–21.0 km, with a mean βp of 0.05–0.10 . The δp values of 0.14–0.18 were relatively large, suggesting that the smoke layer was composed of irregularly shaped, dry, and non-coated soot particles (Ansmann et al., 2018; Ohneiser et al., 2020). A period of 1.5 months later, two distinct smoke layers appeared at altitudes of 20.3–21.5 and 22.1–23.0 km, with a mean βp of 0.04 and δp of 0.16. Compared with the mid-September measurements, the smaller βp indicates the dissipation of smoke plumes over time. However, δp remained almost unchanged, confirming that the aging process of smoke particles is rather slow in the stratosphere compared with that in the troposphere. Chemical interactions with trace gases in the troposphere are more likely to alter the shape of smoke particles (China et al., 2015). The plume-isolated aerosol optical depth (AOD) from September to October was 0.002–0.010, at least an order of magnitude larger than the background sAOD (0.0044) over Wuhan.
As a comparison, Canadian wildfire smoke measured over OHP, France, from 24 August to 26 September showed a similar (to Wuhan) δp of approximately 0.15 (Khaykin et al., 2018). However, the plume-insolated AOD for this smoke event is much larger in Europe. A plume-isolated AOD of up to 0.7 was measured over OHP, France, on 29 August, which was 2 orders of magnitude larger than that of 0.002–0.010 over Wuhan (Khaykin et al., 2018). Similarly, the layer-integrated AOD of the smoke plume reached 0.3 in the free troposphere and 0.6 in the stratosphere over Košetice, Czech Republic, on 22 August (Ansmann et al., 2018). Measurements of smoke aerosols over Europe based on the European Aerosol Research Lidar Network (EARLINET) showed larger sAOD values from > 0.25 on 21–23 August to 0.005–0.030 on 5–10 September (Baars et al., 2019). This is because the Canadian smoke mainly remained and was transported at high latitudes in the first 2 months after the wildfire event.
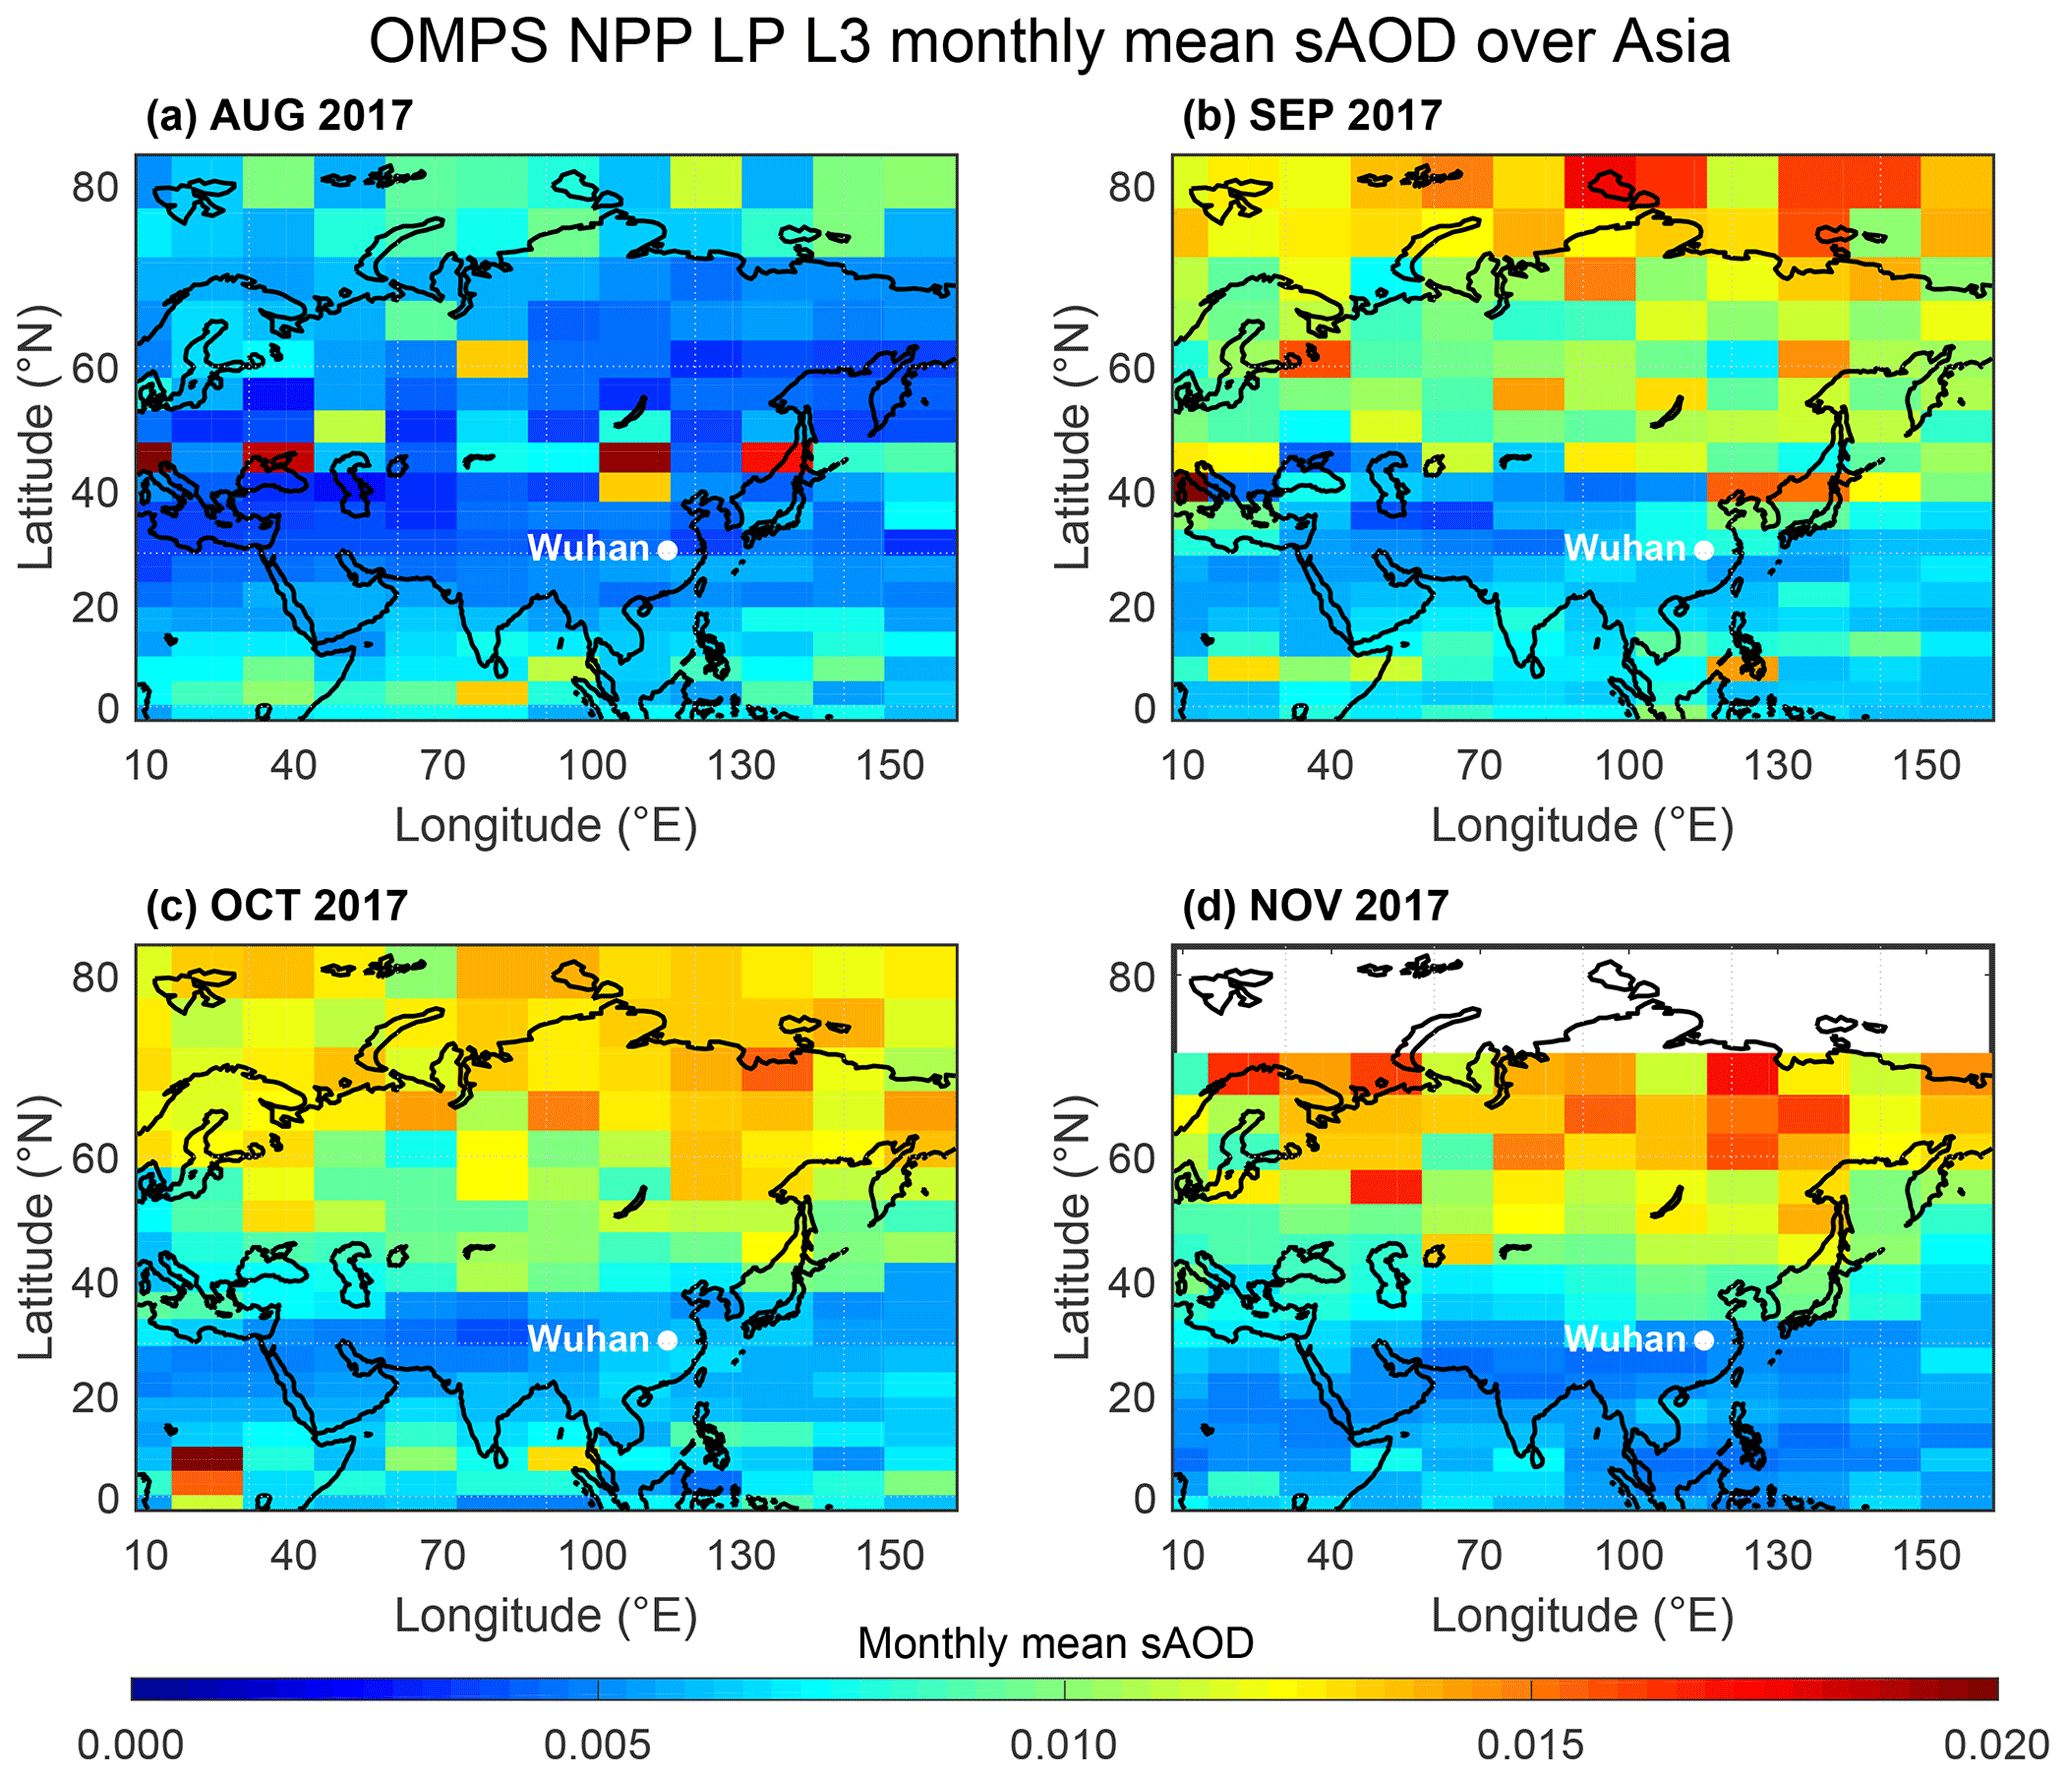
Figure 7OMPS-NPP Level-3 monthly mean sAOD from August to November 2017.
Using the Chemical Lagrangian Model of the Stratosphere (CLaMS), Kloss et al. (2019) found that the fire plume initialized on 12–14 August over western Canada and was transported eastward at latitudes north of 40° N. The plumes passed over Europe in early August to mid-August and reached the Asian monsoon area at the end of August, with a fraction moving to low latitudes along the eastern flank of the AMA. When the AMA broke down in September, the smoke plume had spread throughout the Northern Hemisphere. Previous studies have shown that stratospheric aerosols at high latitudes in the Northern Hemisphere can be transported to the middle and low latitudes via the AMA (Kloss et al., 2021; Jing et al., 2023). In Fig. 7, the OMPS monthly mean sAOD generally increased from a background level of 0.004 to > 0.010 to the north of 40° N and 0.007 near Wuhan (30.5° N) in September. Subsequently, the sAOD near Wuhan decreased to 0.006 in October and 0.005 in November. However, the spatial distribution of sAOD confirms that the smoke aerosols mainly remained at high latitudes with sAOD values exceeding 0.010.

Figure 8The 1 h integrated nighttime (a) particle backscatter coefficient βp and (b) volume depolarization ratio δv derived from polarization lidar over Wuhan on 8–9 November 2020. White stripes represent that data are unavailable due to weather conditions or hardware maintenance. The white curve represents the altitudes of the tropopause. The profiles of the (c) aerosol backscatter coefficient and (d) particle depolarization ratio derived from polarization lidar observations are also provided.
3.3.2 Californian wildfire smoke in 2020
In October 2020, record-breaking wildfires occurred in California, emitting a significant amount of smoke into the UTLS, which was then transported eastward (Safford et al., 2022). Figure 8 shows the polarization lidar observation over Wuhan on 8–9 November 2020. A thin aerosol layer was observed above the tropopause at 16–17 km, with a mean βp of 0.11 and a mean δp of 0.13, indicating that the aerosol layer mainly consisted of non-spherical smoke particles. Rapid lofting into the dry upper troposphere prevents the aging of the smoke particles (Baars et al., 2019). In Cyprus, smoke aerosols from this Californian wildfire were observed earlier on 27 October at 11–13 km, with βp values of 1–3 (Mamouri et al., 2023), an order of magnitude larger than that observed in Wuhan. The δp measured in Cyprus was 0.10–0.15, consistent with that over Wuhan (0.13), indicating the slow aging process of smoke aerosols in the stratosphere. The detail of smoke plume transport to Wuhan is described in Appendix B.

Figure 9Profiles of seasonal mean aerosol backscatter coefficient βp during (a) the stratosphere-quiescent period from January 2013 to August 2017 and (b) the entire period from 2010 to 2021. The dashed lines represent the tropopause for each season. The shadings represent the standard deviations.
3.4 Seasonal variation
Understanding the seasonal variations in stratospheric aerosol patterns is crucial for gaining deeper insights into their feedback on weather and climate. Figure 9a shows the profiles of the seasonal mean backscatter coefficient βp over Wuhan for each season during the stratosphere-quiescent period from January 2013 to August 2017 as well as during the whole measurement period. Here, the four seasons are defined as follows: spring (March–April–May), summer (June–July–August), autumn (September–October–November), and winter (December–January–February). The seasonal mean tropopause heights were 13.7 km in spring, 16.1 km in summer, 15.0 km in autumn, and 13.2 km in winter. At altitudes of 19.5–23.0 km, an enhancement of aerosol extinction was observed in all seasons, with a mean βp of 7.6 × 10⁻³ . This non-seasonal background is interpreted as the Junge layer, a global-wide stratospheric aerosol layer at around 20 km altitude (Junge, 1960; Junge and Manson, 1961).
In summer, another distinct aerosol layer was observed at 13–18 km, with a mean βp of 0.023 , approximately 1.4–1.6 times larger than the βp values in other seasons. This layer was contributed by ATAL. The AOD of ATAL at 13–18 km over Wuhan was 0.0057, consistent with an increasing AOD of 0.002–0.006 at 13–18 km in the entire ATAL region (15–45° N, 5–105° E) during 1995–2013 (Vernier et al., 2015). The AMA facilitates efficient vertical transport from the surface to the UTLS, serving as a primary source of young air in the lower stratosphere (Randel et al., 2010) and bringing anthropogenic aerosols and/or their gas-phase precursors from the lower troposphere to the UTLS. Furthermore, injections of aerosols from volcanic eruptions and wildfires caused the larger βp of 0.019 at 16–22 km in summer and autumn (compared with 0.016 in winter and 0.012 in spring) because Wuhan was generally affected by those events during the summer and autumn months by the summer monsoon circulation, which promotes effective mixing between the extratropics and tropics and influences the tropical seasonal cycle of different atmospheric components (Abalos et al., 2013).
In Fig. 10, we present the differences in the mean sAOD between the cold half-year (October–next March) and warm half-year (April–September). The mean sAOD in the cold half-year was 0.0054, approximately 69 % larger than that of 0.0032 in the warm half-year because the lower tropopause height in winter leads to a wider integration range of sAOD compared with summer. In addition, aerosols transported meridionally from the tropics to middle and high latitudes generally intensified the cold half-year in the Northern Hemisphere (Niwano et al., 2009). This process provides additional aerosol mass from the stratospheric tropical aerosol reservoir. The winter backscatter above 24 km was also larger than that of summer (Fig. 9). Similarly, Zuev et al. (2017) found that the integrated backscatter coefficient was larger over Tomsk, Russia, during the cold half-year from 2000 to 2016. This pattern was also observed in Tsukuba, Japan, where the stratospheric aerosol backscatter ratio was 40 % larger in winter than in summer at 22–23 km from 1997 to 2004 (Sakai et al., 2016).

Figure 10Monthly mean sAOD integrated from 1 km above the tropopause to 30 km in the cold half-year (October–next March) and warm half-year (April–September). For each box, the center line represents the median value, and the bottom and top edges of the box represent the 25th and 75th percentiles, respectively. The whiskers were set to be 1.5.
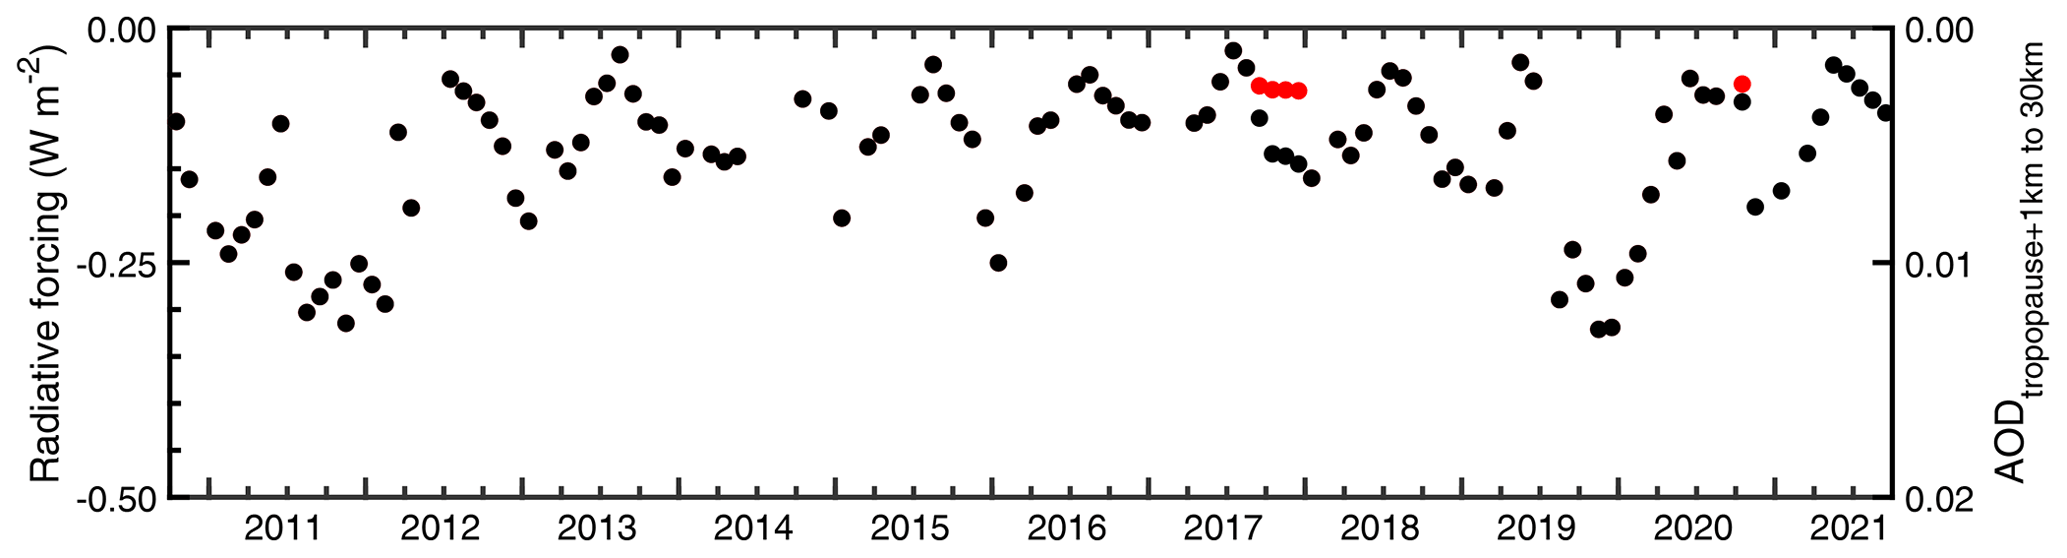
Figure 11Temporal variations of stratospheric aerosol radiative forcing and sAOD over Wuhan. The red points represent the corrected radiative forcing caused by smoke aerosols.
3.5 Radiative forcing by stratospheric aerosols
Stratospheric aerosols modify radiative fluxes by scattering and absorbing solar radiation. Hence amounts of aerosols emitted from those great volcanic eruptions, such as the 1815 Tambora eruption and 1991 Pinatubo eruption, can significantly cool the global climate (Solomon et al., 2011). Figure 11 shows the estimated radiative forcing (RF) induced by stratospheric aerosols and sAOD over Wuhan from 2010 to 2021. Radiative forcing was calculated by multiplying the sAOD by a conversion factor of −25 W m−2 (black points) (Hansen et al., 2005; Solomon et al., 2011).
The radiative forcing of smoke is very complicated, depending on the surface albedo as well as the composition (Heinold et al., 2022). Black carbon (BC) in wildfire smoke generally exhibits strong absorption of solar radiation, unlike sulfate aerosols that reflect solar energy back to space, leading to different climate responses. Therefore, the conversion factor from sAOD to RF should be re-estimated to obtain a more reliable RF. The organic carbon (OC) and BC emissions from biomass burning are generally proportional. According to Koch (2001), the organic matter (OM) to BC mass ratio () is set to be 7.9 and the OC to OM mass ratio () is assumed to be 1.3. As estimated by Hansen et al. (2005), the conversion factors from AOD to RF are −13 W m−2 for OC and 60 W m−2 for BC. As a result, the contribution of sAOD to RF can be divided into three parts: background sAOD (sAODbackground), OC sAOD (sAODOC), and BC sAOD (sAODBC). The RF during the smoke injection period can be calculated as follows:
where the sAODbackground is 0.0044, as given in Sect. 3.1. The corrected RF during the smoke intrusion period is presented (red points) in Fig. 11. After the correction, smoke RF becomes slightly weaker.
The RF values mainly range from −0.03 to −0.31 W m−2, with a mean of −0.14 W m−2. The 2011 Nabro and 2019 Raikoke eruptions caused remarkable cooling effects as the RF of −0.31 W m−2. The stratosphere-quiescent period shows a stable trend of RF around −0.11 W m−2, representing the stratospheric background aerosol level over Wuhan. On the contrary, Solomon et al. (2011) found that global stratospheric aerosols have been increasing by ∼ 7 % yr−1 based on satellite observations in the previous decade from 2000 to 2010. The abundant volcanic activities caused a significant increase in stratospheric aerosols. There were 12 eruptions with VEI ≥ 4 in the tropics and Northern Hemisphere before 2010 as reviewed by Chouza et al. (2020). By contrast, only three volcanos erupted with VEI ≥ 4 after 2010, i.e., the Nabro volcano in Eritrea in 2011, the Kelud volcano in Indonesia in 2014, and Wolf in the Galápagos Islands in 2015.
The mean RF during smoke observation periods was −0.06 W m−2, consistent with the conclusion drawn by Hansen et al. (2005) that biomass burning (BC + OC) shows a negative forcing. This value was close to the background level of stratospheric aerosols and resulted in weaker negative forcing compared with sulfate aerosols. This is due to the absorption of solar radiation by BC, which offsets a portion of solar radiation reflected by OC and background aerosols.
For comparison, Chouza et al. (2020) measured a close value of −0.11 W m−2 over Mauna Loa Observatory, Hawaii, during a volcanic-eruption-quiescent period in 2013–2019. Khaykin et al. (2017) measured the background value of −0.06 W m−2 over OHP, France, during 1997–2003. Meanwhile, different data processing methods can lead to significant variations in the specific values of the results due to the weakness of stratospheric aerosols.

Figure 12The conceptual diagram of the transport of stratospheric aerosols over East Asia.
This study analyzes the long-term characteristics of stratospheric aerosols over Wuhan from 2010 to 2021, mainly using ground-based polarization lidar observations in conjunction with several satellite observations. The eruptions of the volcanoes Nabro in 2011 and Raikoke in 2019 increased the sAOD by a factor of 2.9 compared to the stratosphere-quiescent period (January 2013 to August 2017). During this stratosphere-quiescent period, the sAOD integrated from 1 km above the tropopause to 30 km was 0.0044 (± 0.0019), reflecting the background level of stratospheric aerosols over Wuhan, consistent with previous studies during a similar period (Khaykin et al., 2017; Chouza et al., 2020).
We also presented observations of the volcanic aerosol layers from the Nabro eruption in 2011 and the Raikoke eruption in 2019 over Wuhan, which have been discussed in detail in our previous studies (Zhuang and Yi, 2016; Jing et al., 2023). In late August 2017, a historically severe wildfire in western Canada emitted large amounts of smoke to the UTLS; a portion of the smoke plume was transported to Wuhan in September 2017. Two layers with enhanced aerosol extinction were observed: the first with a mean βp of 0.05 at 19.0–20.5 km on 14 September and the second with a mean βp of 0.04 at 20.3–23.0 km on 28 October. The δp values were 0.14–0.18, suggesting the composition of irregularly shaped, dry, and non-coated soot particles. The plume-isolated AODs were 0.002–0.010. Additionally, smoke plumes from the Californian wildfire in October 2020 appeared over Wuhan at 16–17 km on 8–9 November 2020, with a mean βp of 0.11 and δp of 0.13.
Seasonal variations were also studied. The ATAL at 13–18 km showed a mean βp of 0.023 , 1.4–1.6 times larger than in other seasons during the stratosphere-quiescent period. The mean AOD of the ATAL was 0.0057, confirming that anthropogenic aerosols are an important source of UTLS aerosols. Volcanic aerosols primarily enhanced the mean stratospheric βp in both summer and autumn (0.019 ), which were relatively smaller in winter (0.016 ) and spring (0.012 ) as the volcanic aerosols dissipated. The mean sAOD during the cold half-year (0.0054) was 69 % higher than during the warm half-year (0.0032), indicating stronger meridional transport of stratospheric aerosols from the tropics to middle and high latitudes.
The long-term stratospheric aerosol radiative forcing over Wuhan is also presented, revealing the cooling effect caused by stratospheric aerosols. The mean radiative forcing was −0.14 W m−2 during the entire period and −0.11 W m−2 during the stratosphere-quiescent period. The 2011 Nabro and 2019 Raikoke eruptions resulted in a significant cooling effect of −0.31 W m−2, respectively.
Figure 12 shows the conceptual diagram of the transport of stratospheric aerosols over East Asia. Wuhan is located in a region significantly impacted by the Asian monsoon from June to September. The AMA captures long-range-transported stratospheric aerosols from volcanic eruptions at mid-latitudes. Stratospheric aerosols are then transported along the eastern flank of the AMA, increasing the sAOD over Wuhan (Zhuang and Yi, 2016; Jing et al., 2023). Additionally, the buildup of the ATAL is facilitated by the vertical transport of tropospheric aerosols to 13–18 km and sustained by the convective activity of the Asian monsoon (Garny and Randel, 2016; Yu et al., 2017). Canadian smoke was transported to Wuhan via a weakening AMA in September 2017. Due to the breakup of the AMA after September, smoke plumes can move directly to Wuhan (e.g., Californian wildfire smoke in November 2020).
Owing to the persistent operation of the polarization lidar from 2010 to 2021, we have developed a comprehensive sketch of the long-term characteristics of stratospheric aerosols over Wuhan, including the variations in sAOD, significant stratospheric injection events, seasonal variations, and radiative forcing. This study is an important supplement to stratospheric aerosol measurements in mid-latitude areas, particularly over East Asia, where human activities are abundant. Additionally, the analyses help us better understand how stratospheric aerosols respond to regional and global climate change (Solomon et al., 2011). However, there are some limitations to our study. Further long-term observation is necessary to achieve continuous monitoring during the stratosphere-quiescent period. The impact on ozone depletion during stratospheric aerosol injection events is also an essential topic (Ohneiser et al., 2022). In addition, more accurate aerosol extinction coefficients and lidar ratios can be obtained with a high spectral resolution lidar. The system with a larger telescope will also improve the signal-to-noise ratio (SNR) at higher altitudes, extending the extinction measurements to higher than 30 km altitude.
Figure A1 shows the main trajectories of smoke plumes transported in the Northern Hemisphere between 16 August and 21 October 2017 based on CALIOP observations. A large PyroCb plume, referred to as plume O, developed and reached the lower stratosphere on 12–13 August over Canada (Peterson et al., 2018; Hu et al., 2019; Sicard et al., 2019; Torres et al., 2020; Das et al., 2021; Lestrelin et al., 2021). Plume O was transported eastward crossing the Atlantic, reaching western Europe on 27 August (yellow line). It then split into three plumes due to the wind shear prevailing in the associated jet stream (Lestrelin et al., 2021). We identified their transport pathways using CALIOP observations, denoting them as plume I (dark red), plume II (blue), and plume III (green).
From September to mid-October, plume II (blue) and III (green) moved eastward between 40–60° N, completing a full circle. Plume I (dark red) moved eastward to Central Asia, turned south to the mid-latitudes in early September, and then moved westward generally along 30° N, completing three-quarters of a circle to the east coast of China by 21 October. In addition, plume IV (purple) was first observed over the central North Pacific by CALIOP on 3 October, moving westward and approaching plume I southeast of Japan on 19 October. However, tracking plume IV before 3 October was difficult. We speculate that plume IV separated from plume II in early October due to wind shear.
The sources of two periods of smoke plumes observed over Wuhan were tracked using CALIOP observations and the HYSPLIT model, as shown in Fig. A2. The September plume originated from plume II, observed at altitudes of 18–21 km with central coordinates at 59.5° N, 35.9° E on 4 September by CALIOP (Fig. A2a). Part of the plume II was transported southeastward to Wuhan on 15 September, based on a 13 d backward trajectory simulation (Fig. A2c and d). Meanwhile, an elongated aerosol layer at 20 km observed by CALIOP near Wuhan on 17 September (Fig. A2b) confirmed that smoke aerosols had been transported to mid-latitudes. The October plume came from plume I and plume IV, observed at 20.8 and 23.1 km, respectively, on 19 October south of Japan (Fig. A2e). They continued moving westward together and were observed over Wuhan at altitudes of 22.8 and 21.1 km, respectively.
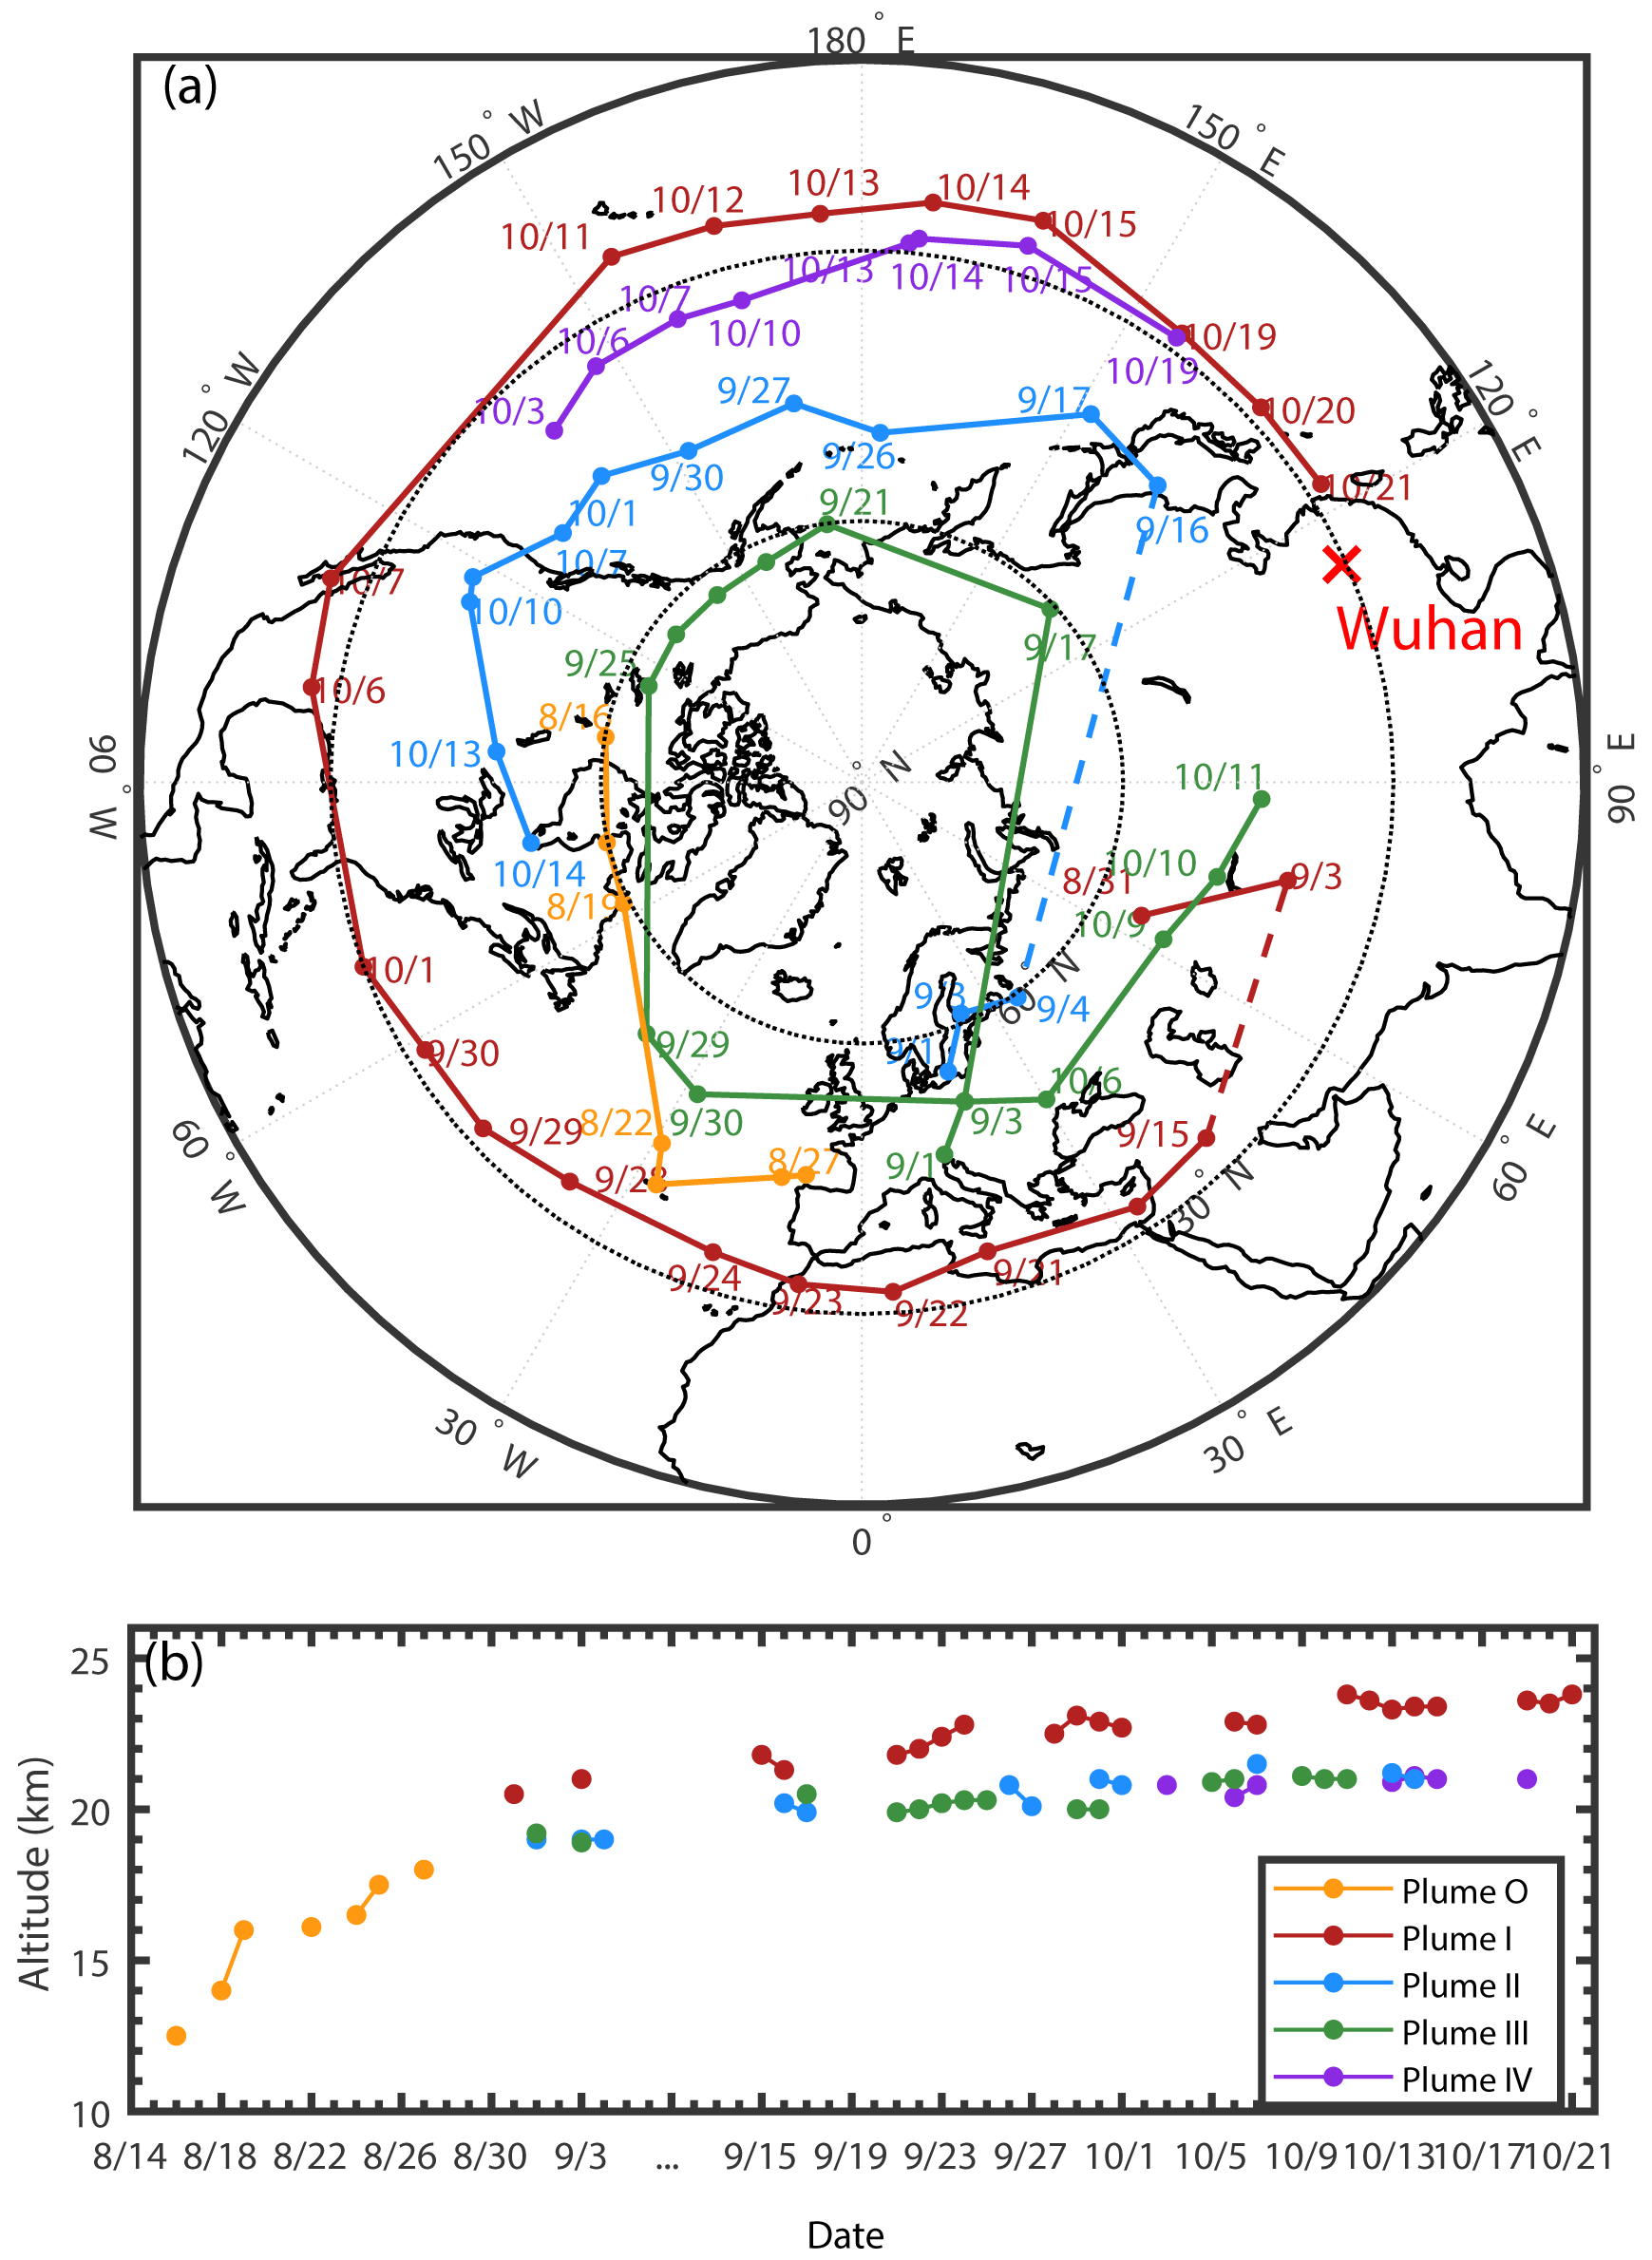
Figure A1(a) Transport pathways and (b) altitude evolution of smoke plumes between 16 August and 21 October 2017 based on CALIOP observations. CALIOP observations were unavailable on 5–14 September due to solar activity; thus, the potential vorticity tracking in Lestrelin et al. (2021) was shown instead with the dashed lines.

Figure A2CALIOP-observed 532 nm total attenuated backscatter coefficients on (a) 4 September, (b) 17 September, (e) 19 October, and (f) 20 October 2017. (c) The UVAI measured by OMPS on 4 September. The backward trajectories starting from Wuhan on 15 September and 16 October are shown in (c), (d), (g), and (h). The CALIOP footprints in (a) and (b) are shown in (c), and the CALIOP footprints in (e) and (f) are shown in (g), with the green lines highlighting the occurrence of smoke plumes. The crosses mark the location of Wuhan.
In mid-October 2020, a series of smoke plumes formed from wildfires in California (Safford et al., 2022; Mamouri et al., 2023). The smoke layer that appeared over Wuhan on 8–9 November originated from a thin smoke plume at altitudes of 12.5–14.0 km over the Mediterranean Sea on 27 October (see white rectangle in Fig. B1a). Several plumes were also observed at altitudes of 5–14 km, as shown by UVAI data. The thin smoke plume in Fig. B1a can be further tracked back to the wildfire region in the northwest of America on 19 October, which is highly consistent with the HYSPLIT trajectories presented by Mamouri et al. (2023).

Figure B1(a) CALIOP-observed 532 nm total attenuated backscatter coefficients on 27 October. (b) The UVAI measured by OMPS on 27 October 2020. The 13 d backward trajectory starting from Wuhan at 16.7 km on 8 September and the 8 d backward trajectory starting from 40.83° N, 26.36° E at 13.3 km on 27 October are presented in (b) and (c). The CALIOP footprints in (a) are shown in (b), with the green lines highlighting the occurrence of smoke plumes. The crosses mark the location of Wuhan.
CALIOP data can be obtained from https://subset.larc.nasa.gov/ (CALIPSO, 2024). OMPS data can be obtained from https://www.earthdata.nasa.gov/sensors/omps (OMPS, 2024). Copernicus Atmosphere Monitoring Service (CAMS) reanalysis data can be obtained from https://www.ecmwf.int/en/forecasts/dataset/cams-global-reanalysis (CAMS, 2024). The HYSPLIT model is available at https://www.arl.noaa.gov (HYSPLIT, 2024). Lidar data used to generate the results of this paper are available from the authors upon request (e-mail: yf@whu.edu.cn).
YH, DJ, and ZY analyzed the data and wrote the manuscript. ZY and KO participated in scientific discussions and reviewed and proofread the manuscript. YH and FY conceived the research and acquired the research funding. FY led the study.
The contact author has declared that none of the authors has any competing interests.
Publisher's note: Copernicus Publications remains neutral with regard to jurisdictional claims made in the text, published maps, institutional affiliations, or any other geographical representation in this paper. While Copernicus Publications makes every effort to include appropriate place names, the final responsibility lies with the authors.
The authors thank the colleagues who participated in the operation of the lidar system at our site. We also acknowledge the Atmospheric Science Data Central (ASDC) at the NASA Langley Research Center for providing the CALIPSO data, NASA/NOAA for the OMPS data, the European Centre for Medium-Range Weather Forecasts (ECMWF) for Copernicus Atmosphere Monitoring Service ozone reanalysis data, and the NOAA Air Resources Laboratory (ARL) for the HYSPLIT model.
This research has been supported by the National Natural Science Foundation of China (grant nos. 42005101, 41927804, and 42205130), the China Scholarship Council (grant no. 202206275006), and the Natural Science Foundation of Hubei Province (grant no. 2023AFB617).
This paper was edited by Matthias Tesche and reviewed by two anonymous referees.
Abalos, M., Ploeger, F., Konopka, P., Randel, W. J., and Serrano, E.: Ozone seasonality above the tropical tropopause: reconciling the Eulerian and Lagrangian perspectives of transport processes, Atmos. Chem. Phys., 13, 10787–10794, https://doi.org/10.5194/acp-13-10787-2013, 2013.
Ansmann, A., Baars, H., Chudnovsky, A., Mattis, I., Veselovskii, I., Haarig, M., Seifert, P., Engelmann, R., and Wandinger, U.: Extreme levels of Canadian wildfire smoke in the stratosphere over central Europe on 21–22 August 2017, Atmos. Chem. Phys., 18, 11831–11845, https://doi.org/10.5194/acp-18-11831-2018, 2018.
Ansmann, A., Ohneiser, K., Chudnovsky, A., Baars, H., and Engelmann, R.: CALIPSO aerosol-typing scheme misclassified stratospheric fire smoke: case study from the 2019 Siberian wildfire season, Front. Environ. Sci., 9, 769852 https://doi.org/10.3389/fenvs.2021.769852, 2021.
Ansmann, A., Ohneiser, K., Chudnovsky, A., Knopf, D. A., Eloranta, E. W., Villanueva, D., Seifert, P., Radenz, M., Barja, B., Zamorano, F., Jimenez, C., Engelmann, R., Baars, H., Griesche, H., Hofer, J., Althausen, D., and Wandinger, U.: Ozone depletion in the Arctic and Antarctic stratosphere induced by wildfire smoke, Atmos. Chem. Phys., 22, 11701–11726, https://doi.org/10.5194/acp-22-11701-2022, 2022.
Ansmann, A., Veselovskii, I., Ohneiser, K., and Chudnovsky, A.: Comment on “stratospheric aerosol composition observed by the atmospheric chemistry experiment following the 2019 Raikoke eruption” by Boone et al., J. Geophys. Res.-Atmos., 129, e2022JD038080, https://doi.org/10.1029/2022JD038080, 2024.
Baars, H., Kanitz, T., Engelmann, R., Althausen, D., Heese, B., Komppula, M., Preißler, J., Tesche, M., Ansmann, A., Wandinger, U., Lim, J.-H., Ahn, J. Y., Stachlewska, I. S., Amiridis, V., Marinou, E., Seifert, P., Hofer, J., Skupin, A., Schneider, F., Bohlmann, S., Foth, A., Bley, S., Pfüller, A., Giannakaki, E., Lihavainen, H., Viisanen, Y., Hooda, R. K., Pereira, S. N., Bortoli, D., Wagner, F., Mattis, I., Janicka, L., Markowicz, K. M., Achtert, P., Artaxo, P., Pauliquevis, T., Souza, R. A. F., Sharma, V. P., van Zyl, P. G., Beukes, J. P., Sun, J., Rohwer, E. G., Deng, R., Mamouri, R.-E., and Zamorano, F.: An overview of the first decade of PollyNET: an emerging network of automated Raman-polarization lidars for continuous aerosol profiling, Atmos. Chem. Phys., 16, 5111–5137, https://doi.org/10.5194/acp-16-5111-2016, 2016.
Baars, H., Ansmann, A., Ohneiser, K., Haarig, M., Engelmann, R., Althausen, D., Hanssen, I., Gausa, M., Pietruczuk, A., Szkop, A., Stachlewska, I. S., Wang, D., Reichardt, J., Skupin, A., Mattis, I., Trickl, T., Vogelmann, H., Navas-Guzmán, F., Haefele, A., Acheson, K., Ruth, A. A., Tatarov, B., Müller, D., Hu, Q., Podvin, T., Goloub, P., Veselovskii, I., Pietras, C., Haeffelin, M., Fréville, P., Sicard, M., Comerón, A., Fernández García, A. J., Molero Menéndez, F., Córdoba-Jabonero, C., Guerrero-Rascado, J. L., Alados-Arboledas, L., Bortoli, D., Costa, M. J., Dionisi, D., Liberti, G. L., Wang, X., Sannino, A., Papagiannopoulos, N., Boselli, A., Mona, L., D'Amico, G., Romano, S., Perrone, M. R., Belegante, L., Nicolae, D., Grigorov, I., Gialitaki, A., Amiridis, V., Soupiona, O., Papayannis, A., Mamouri, R.-E., Nisantzi, A., Heese, B., Hofer, J., Schechner, Y. Y., Wandinger, U., and Pappalardo, G.: The unprecedented 2017–2018 stratospheric smoke event: decay phase and aerosol properties observed with the EARLINET, Atmos. Chem. Phys., 19, 15183–15198, https://doi.org/10.5194/acp-19-15183-2019, 2019.
Baker, A. K., Schuck, T. J., Slemr, F., van Velthoven, P., Zahn, A., and Brenninkmeijer, C. A. M.: Characterization of non-methane hydrocarbons in Asian summer monsoon outflow observed by the CARIBIC aircraft, Atmos. Chem. Phys., 11, 503–518, https://doi.org/10.5194/acp-11-503-2011, 2011.
Bingen, C., Robert, C. E., Stebel, K., Brühl, C., Schallock, J., Vanhellemont, F., Mateshvili, N., Höpfner, M., Trickl, T., Barnes, J. E., Jumelet, J., Vernier, J.-P., Popp, T., De Leeuw, G., and Pinnock, S.: Stratospheric aerosol data records for the climate change initiative: Development, validation and application to chemistry-climate modelling, Remote Sens. Environ., 203, 296–321, https://doi.org/10.1016/j.rse.2017.06.002, 2017.
Bucholtz, A.: Rayleigh-scattering calculations for the terrestrial atmosphere, Appl. Optics, 34, 2765–2773, https://doi.org/10.1364/AO.34.002765, 1995.
CALIPSO: Cloud–Aerosol Lidar and Infared Pathfinder Satellite Observation data base, EarthData [data set], https://subset.larc.nasa.gov/, last access: 24 May 2024.
CAMS: Copernicus Atmosphere Monitoring Service reanalysis data, ECMWF [data set], https://www.ecmwf.int/en/forecasts/dataset/cams-global-reanalysis (last access: 24 May 2024).
China, S., Scarnato, B., Owen, R. C., Zhang, B., Ampadu, M. T., Kumar, S., Dzepina, K., Dziobak, M. P., Fialho, P., Perlinger, J. A., Hueber, J., Helmig, D., Mazzoleni, L. R., and Mazzoleni, C.: Morphology and mixing state of aged soot particles at a remote marine free troposphere site: Implications for optical properties, Geophys. Res. Lett., 42, 1243–1250, https://doi.org/10.1002/2014GL062404, 2015.
Chouza, F., Leblanc, T., Barnes, J., Brewer, M., Wang, P., and Koon, D.: Long-term (1999–2019) variability of stratospheric aerosol over Mauna Loa, Hawaii, as seen by two co-located lidars and satellite measurements, Atmos. Chem. Phys., 20, 6821–6839, https://doi.org/10.5194/acp-20-6821-2020, 2020.
Clemesha, B. R., Batista, P. P., and Simonich, D. M.: Long-term and solar cycle changes in the atmospheric sodium layer, J. Atmos. Sol-Terr. Phy., 59, 1673–1678, https://doi.org/10.1016/S1364-6826(96)00166-6, 1997.
Das, S., Colarco, P. R., Oman, L. D., Taha, G., and Torres, O.: The long-term transport and radiative impacts of the 2017 British Columbia pyrocumulonimbus smoke aerosols in the stratosphere, Atmos. Chem. Phys., 21, 12069–12090, https://doi.org/10.5194/acp-21-12069-2021, 2021.
Deshler, T., Anderson-Sprecher, R., Jager, H., Barnes, J., Hofmann, D. J., Clemesha, B., Simonich, D., Osborn, M., Grainger, R. G., and Godin-Beekmann, S.: Trends in the nonvolcanic component of stratospheric aerosol over the period 1971–2004, J. Geophys. Res., 111, D01201, https://doi.org/10.1029/2005JD006089, 2006.
Draxler, R. and Rolph, G.: HYSPLIT (Hybrid Single-Particle Lagrangian Integrated Trajectory) Model, Air Resources Laboratory, NOAA, Silver Spring, Md, USA, https://www.ready.noaa.gov/HYSPLIT.php (last access: 10 October 2024), 2003.
Fernald, F. G.: Analysis of atmospheric lidar observations: some comments, Appl. Optics, 23, 652–653, https://doi.org/10.1364/AO.23.000652, 1984.
Freudenthaler, V., Esselborn, M., Wiegner, M., Heese, B., Tesche, M., Ansmann, A., Müller, D., Althausen, D., Wirth, M., Fix, A., Ehret, G., Knippertz, P., Toledano, C., Gasteiger, J., Garhammer, M., and Seefeldner, M.: Depolarization ratio profiling at several wavelengths in pure Saharan dust during SAMUM2006, Tellus B, 61, 165–179, https://doi.org/10.1111/j.1600-0889.2008.00396.x, 2009.
Garny, H. and Randel, W. J.: Transport pathways from the Asian monsoon anticyclone to the stratosphere, Atmos. Chem. Phys., 16, 2703–2718, https://doi.org/10.5194/acp-16-2703-2016, 2016.
Gorkavyi, N., Krotkov, N., Li, C., Lait, L., Colarco, P., Carn, S., DeLand, M., Newman, P., Schoeberl, M., Taha, G., Torres, O., Vasilkov, A., and Joiner, J.: Tracking aerosols and SO2 clouds from the Raikoke eruption: 3D view from satellite observations, Atmos. Meas. Tech., 14, 7545–7563, https://doi.org/10.5194/amt-14-7545-2021, 2021.
Gorshelev, V., Serdyuchenko, A., Weber, M., Chehade, W., and Burrows, J. P.: High spectral resolution ozone absorption cross-sections – Part 1: Measurements, data analysis and comparison with previous measurements around 293 K, Atmos. Meas. Tech., 7, 609–624, https://doi.org/10.5194/amt-7-609-2014, 2014.
Haarig, M., Ansmann, A., Baars, H., Jimenez, C., Veselovskii, I., Engelmann, R., and Althausen, D.: Depolarization and lidar ratios at 355, 532, and 1064 nm and microphysical properties of aged tropospheric and stratospheric Canadian wildfire smoke, Atmos. Chem. Phys., 18, 11847–11861, https://doi.org/10.5194/acp-18-11847-2018, 2018.
Hansen, J., Sato, M. K. I., Ruedy, R., Nazarenko, L., Lacis, A., Schmidt, G. A., Russell, G., Aleinov, I., Bauer, M., Bauer, S., Bell, N., Cairns, B., Canuto, V., Chandler, M., Cheng, Y., Del Genio, A., Faluvegi, G., Fleming, E., Friend, A., Hall, T., Jackman, C., Kelley, M., Kiang, N., Koch, D., Lean, J., Lerner, J., Lo, S. Menon, K., Miller, R., Minnis, P., Novakov, T., Oinas, V., Perlwitz, Ja., Perlwitz, Ju., Rind, D., Romanou, A., Shindell, D., Stone, P., Sun, S., Tausnev, D. Thresher, N., Wielicki, B., Wong, T., Yao, M., Zhang, S.: Efficacy of climate forcings, J. Geophys. Res.-Atmos., 110, D18104, https://doi.org/10.1029/2005JD005776, 2005.
He, Y. and Yi, F.: Dust aerosols detected using a ground-based polarization lidar and CALIPSO over Wuhan (30.5° N, 114.4° E), China, Adv. Meteorol., 2015, 536762, https://doi.org/10.1155/2015/536762, 2015.
He, Y., Yi, F., Yi, Y., Liu, F., and Zhang, Y.: Heterogeneous nucleation of midlevel cloud layer influenced by transported Asian dust over Wuhan (30.5° N, 114.4° E), China, J. Geophys. Res.-Atmos., 126, e2020JD033394, https://doi.org/10.1029/2020JD033394, 2021.
He, Y., Yi, F., Yin, Z., Liu, F., Yi, Y., and Zhou, J.: Mega Asian dust event over China on 27–31 March 2021 observed with space-borne instruments and ground-based polarization lidar, Atmos. Environ., 285, 119238, https://doi.org/10.1016/j.atmosenv.2022.119238, 2022.
Heinold, B., Baars, H., Barja, B., Christensen, M., Kubin, A., Ohneiser, K., Schepanski, K., Schutgens, N., Senf, F., Schrödner, R., Villanueva, D., and Tegen, I.: Important role of stratospheric injection height for the distribution and radiative forcing of smoke aerosol from the 2019–2020 Australian wildfires, Atmos. Chem. Phys., 22, 9969–9985, https://doi.org/10.5194/acp-22-9969-2022, 2022.
Hitchman, M. H., McKay, M., and Trepte, C. R.: A climatology of stratospheric aerosol, J. Geophys. Res.-Atmos., 99, 20689–20700, https://doi.org/10.1029/94JD01525, 1994.
Hofer, J., Seifert, P., Liley, J. B., Radenz, M., Uchino, O., Morino, I., Sakai, T., Nagai, T., and Ansmann, A.: Aerosol-related effects on the occurrence of heterogeneous ice formation over Lauder, New Zealand/Aotearoa, Atmos. Chem. Phys., 24, 1265–1280, https://doi.org/10.5194/acp-24-1265-2024, 2024.
Hofmann, D. J. and Solomon, S.: Ozone destruction through heterogeneous chemistry following the eruption of El Chichon, J. Geophys. Res.-Atmos., 94, 5029–5041, https://doi.org/10.1029/JD094iD04p05029, 1989.
Hofmann, D., Barnes, J., O'Neill, M., Trudeau, M., and Neely, R.: Increase in background stratospheric aerosol observed with lidar at Mauna Loa Observatory and Boulder, Colorado, Geophys. Res. Lett., 36, L15808, https://doi.org/10.1029/2009GL039008, 2009.
Hu, Q., Goloub, P., Veselovskii, I., Bravo-Aranda, J.-A., Popovici, I. E., Podvin, T., Haeffelin, M., Lopatin, A., Dubovik, O., Pietras, C., Huang, X., Torres, B., and Chen, C.: Long-range-transported Canadian smoke plumes in the lower stratosphere over northern France, Atmos. Chem. Phys., 19, 1173–1193, https://doi.org/10.5194/acp-19-1173-2019, 2019.
HYSPLIT: Hybrid Single Particle Lagrangian Integrated Trajectory, NOAA [data set], https://www.arl.noaa.gov/ (last access: 20 May 2024).
Jäger, H. and Wege, K.: Stratospheric ozone depletion at northern midlatitudes after major volcanic eruptions, J. Atmos. Chem., 10, 273–287, 1990.
Jaross, G., Bhartia, P. K., Chen, G., Kowitt, M., Haken, M., Chen, Z., Xu P., Warner, J., and Kelly, T.: OMPS Limb Profiler instrument performance assessment. J. Geophys. Res.-Atmos., 119, 4399–4412, https://doi.org/10.1002/2013JD020482, 2014.
Jing, D., He, Y., Yin, Z., Liu, F., Yi, Y., and Yi, F.: Evolution of aerosol plumes from 2019 Raikoke volcanic eruption observed with polarization lidar over central China, Atmos. Environ., 309, 119880, https://doi.org/10.1016/j.atmosenv.2023.119880, 2023.
Junge, C. E.: Sulfur in the atmosphere, J. Geophys. Res., 65, 227–237, https://doi.org/10.1029/JZ065i001p00227, 1960.
Junge, C. E. and Manson, J. E.: Stratospheric aerosol studies, J. Geophys. Res., 66, 2163–2182, https://doi.org/10.1029/JZ066i007p02163, 1961.
Kafle, D. N. and Coulter, R. L.: Micropulse lidar-derived aerosol optical depth climatology at ARM sites worldwide, J. Geophys. Res.-Atmos., 118, 7293–7308, https://doi.org/10.1002/jgrd.50536, 2013.
Kanamitsu, M.: Description of the NMC global data assimilation and forecast system, Weather Forecast., 4, 335–342, https://doi.org/10.1175/1520-0434(1989)004<0335:DOTNGD>2.0.CO;2, 1989.
Kar, J., Lee, K.-P., Vaughan, M. A., Tackett, J. L., Trepte, C. R., Winker, D. M., Lucker, P. L., and Getzewich, B. J.: CALIPSO level 3 stratospheric aerosol profile product: version 1.00 algorithm description and initial assessment, Atmos. Meas. Tech., 12, 6173–6191, https://doi.org/10.5194/amt-12-6173-2019, 2019.
Khaykin, S. M., Godin-Beekmann, S., Keckhut, P., Hauchecorne, A., Jumelet, J., Vernier, J.-P., Bourassa, A., Degenstein, D. A., Rieger, L. A., Bingen, C., Vanhellemont, F., Robert, C., DeLand, M., and Bhartia, P. K.: Variability and evolution of the midlatitude stratospheric aerosol budget from 22 years of ground-based lidar and satellite observations, Atmos. Chem. Phys., 17, 1829–1845, https://doi.org/10.5194/acp-17-1829-2017, 2017.
Khaykin, S. M., Godin-Beekmann, S., Hauchecorne, A., Pelon, J., Ravetta, F., and Keckhut, P.: Stratospheric smoke with unprecedentedly high backscatter observed by lidars above southern France, Geophys. Res. Lett., 45, 1639–1646, https://doi.org/10.1002/2017GL076763, 2018.
Kloss, C., Berthet, G., Sellitto, P., Ploeger, F., Bucci, S., Khaykin, S., Jégou, F., Taha, G., Thomason, L. W., Barret, B., Le Flochmoen, E., von Hobe, M., Bossolasco, A., Bègue, N., and Legras, B.: Transport of the 2017 Canadian wildfire plume to the tropics via the Asian monsoon circulation, Atmos. Chem. Phys., 19, 13547–13567, https://doi.org/10.5194/acp-19-13547-2019, 2019.
Kloss, C., Berthet, G., Sellitto, P., Ploeger, F., Taha, G., Tidiga, M., Eremenko, M., Bossolasco, A., Jégou, F., Renard, J.-B., and Legras, B.: Stratospheric aerosol layer perturbation caused by the 2019 Raikoke and Ulawun eruptions and their radiative forcing, Atmos. Chem. Phys., 21, 535–560, https://doi.org/10.5194/acp-21-535-2021, 2021.
Koch, D.: Transport and direct radiative forcing of carbonaceous and sulfate aerosols in the GISS GCM, J. Geophys. Res., 106, 20311–20332, https://doi.org/10.1029/2001JD900038, 2001.
Kong, W. and Yi, F.: Convective boundary layer evolution from lidar backscatter and its relationship with surface aerosol concentration at a location of a central China megacity, J. Geophys. Res.-Atmos., 120, 7928–7940, https://doi.org/10.1002/2015JD023248, 2015.
Kremser, S., Thomason, L. W., von Hobe, M., Hermann, M., Deshler, T., Timmreck, C., Toohey, M., Stenke, A., Schwarz, J. P., Weigel, R., Fueglistaler, S., Prata, F. J., Vernier, J., Schlager, H., Barnes, J. E., Antu na-Marrero, J., Fairlie, D., Palm, M., Mahieu, E., Notholt, J., Rex, M., Bingen, C., Vanhellemont, F., Bourassa, A., Plane, J. M. C., Klocke, D., Carn, S. A., Clarisse, L., Trickl, T., Neely, R., James, A. D., Rieger, L., Wilson, J. C., and Meland, B.: Stratospheric aerosol—Observations, processes, and impact on climate, Rev. Geophys., 54, 278–335, https://doi.org/10.1002/2015RG000511, 2016.
Lee, J., Hsu, N. C., Bettenhausen, C., Sayer, A. M., Seftor, C. J., and Jeong, M. J.: Retrieving the height of smoke and dust aerosols by synergistic use of VIIRS, OMPS, and CALIOP observations, J. Geophys. Res.-Atmos., 120, 8372–8388, https://doi.org/10.1002/2015JD023567, 2015.
Lestrelin, H., Legras, B., Podglajen, A., and Salihoglu, M.: Smoke-charged vortices in the stratosphere generated by wildfires and their behaviour in both hemispheres: comparing Australia 2020 to Canada 2017, Atmos. Chem. Phys., 21, 7113–7134, https://doi.org/10.5194/acp-21-7113-2021, 2021.
Mamouri, R. E., Ansmann, A., Nisantzi, A., Kokkalis, P., Schwarz, A., and Hadjimitsis, D.: Low Arabian extinction-to-backscatter ratio, Geophys. Res. Lett., 40, 4762–4766, https://doi.org/10.1002/grl.50898, 2013.
Mamouri, R.-E., Ansmann, A., Ohneiser, K., Knopf, D. A., Nisantzi, A., Bühl, J., Engelmann, R., Skupin, A., Seifert, P., Baars, H., Ene, D., Wandinger, U., and Hadjimitsis, D.: Wildfire smoke triggers cirrus formation: lidar observations over the eastern Mediterranean, Atmos. Chem. Phys., 23, 14097–14114, https://doi.org/10.5194/acp-23-14097-2023, 2023.
Mari, C., Jacob, D. J., and Bechtold, P.: Transport and scavenging of soluble gases in a deep convective cloud, J. Geophys. Res.-Atmos., 105, 22255–22267, https://doi.org/10.1029/2000JD900211, 2010.
Newhall, C. G. and Self, S.: The volcanic explosivity index (VEI) an estimate of explosive magnitude for historical volcanism, J. Geophys. Res., 87, 1231–1238, https://doi.org/10.1029/jc087ic02p01231, 1982.
Niwano, M., Hayashida, S., Akiyoshi, H., and Takahashi, M.: Seasonal cycles of Stratospheric Aerosol and Gas Experiment II near-background aerosol in the lower stratosphere, J. Geophys. Res., 114, D14306, https://doi.org/10.1029/2008JD009842, 2009.
Ohneiser, K., Ansmann, A., Baars, H., Seifert, P., Barja, B., Jimenez, C., Radenz, M., Teisseire, A., Floutsi, A., Haarig, M., Foth, A., Chudnovsky, A., Engelmann, R., Zamorano, F., Bühl, J., and Wandinger, U.: Smoke of extreme Australian bushfires observed in the stratosphere over Punta Arenas, Chile, in January 2020: optical thickness, lidar ratios, and depolarization ratios at 355 and 532 nm, Atmos. Chem. Phys., 20, 8003–8015, https://doi.org/10.5194/acp-20-8003-2020, 2020.
Ohneiser, K., Ansmann, A., Chudnovsky, A., Engelmann, R., Ritter, C., Veselovskii, I., Baars, H., Gebauer, H., Griesche, H., Radenz, M., Hofer, J., Althausen, D., Dahlke, S., and Maturilli, M.: The unexpected smoke layer in the High Arctic winter stratosphere during MOSAiC 2019–2020 , Atmos. Chem. Phys., 21, 15783–15808, https://doi.org/10.5194/acp-21-15783-2021, 2021.
Ohneiser, K., Ansmann, A., Kaifler, B., Chudnovsky, A., Barja, B., Knopf, D. A., Kaifler, N., Baars, H., Seifert, P., Villanueva, D., Jimenez, C., Radenz, M., Engelmann, R., Veselovskii, I., and Zamorano, F.: Australian wildfire smoke in the stratosphere: the decay phase in 2020/2021 and impact on ozone depletion, Atmos. Chem. Phys., 22, 7417–7442, https://doi.org/10.5194/acp-22-7417-2022, 2022.
OMPS: Ozone Mapping and Profiler Suite, EarthData [data set], https://www.earthdata.nasa.gov/sensors/omps/ (last access: 6 May 2024).
Penning de Vries, M. J. M., Beirle, S., and Wagner, T.: UV Aerosol Indices from SCIAMACHY: introducing the SCattering Index (SCI), Atmos. Chem. Phys., 9, 9555–9567, https://doi.org/10.5194/acp-9-9555-2009, 2009.
Peterson, D. A., Campbell, J., Hyer, E., Fromm, M., Kablick, G., Cossuth, J., and DeLand, M.: Wildfire-driven thunderstorms cause a volcano-like stratospheric injection of smoke, npj Clim. Atmos. Sci., 1, 30, https://doi.org/10.1038/s41612-018-0039-3, 2018.
Randel, W. J., Park, M., Emmons, L., Kinnison, D., Bernath, P., Walker, K. A., Boone, C., and Pumphrey, H.: Asian monsoon transport of pollution to the stratosphere, Science, 328, 611–613, https://doi.org/10.1126/science.1182274, 2010.
Safford, H. D., Paulson, A. K., Steel, Z. L., Young, D. J. N., and Wayman, R. B.: The 2020 California fire season: A year like no other, a return to the past or a harbinger of the future?, Global Ecol. Biogeogr., 31, 2005–2025, https://doi.org/10.1111/geb.13498, 2022.
Sakai, T., Uchino, O., Nagai, T., Liley, B., Morino, I., and Fujimoto, T.: Long-term variation of stratospheric aerosols observed with lidars over Tsukuba, Japan, from 1982 and Lauder, New Zealand, from 1992 to 2015, J. Geophys. Res.-Atmos., 121, 10283–10293, https://doi.org/10.1002/2016JD025132, 2016.
Shang, X., Mielonen, T., Lipponen, A., Giannakaki, E., Leskinen, A., Buchard, V., Darmenov, A. S., Kukkurainen, A., Arola, A., O'Connor, E., Hirsikko, A., and Komppula, M.: Mass concentration estimates of long-range-transported Canadian biomass burning aerosols from a multi-wavelength Raman polarization lidar and a ceilometer in Finland, Atmos. Meas. Tech., 14, 6159–6179, https://doi.org/10.5194/amt-14-6159-2021, 2021.
Sicard, M., Granados-Mu noz, M. J., Alados-Arboledas, L., Barragán, R., Bedoya-Velásquez, A. E., Benavent-Oltra, J. A., Bortoli, D., Comerón, A., Córdoba-Jabonero, C., Costa, M. J., del Águila, A., Fernández, A. J., Guerrero-Rascado, J. L., Jorba, O., Molero, F., Mu noz-Porcar, C., Ortiz-Amezcua, P., Papagiannopoulos, N., Potes, M., Pujadas, M., Rocadenbosch, F., Rodríguez-Gómez, A., Román, R., Salgado, R., Salgueiro, V., Sola, Y., and Yela, M.: Ground/space, passive/active remote sensing observations coupled with particle dispersion modelling to understand the inter-continental transport of wildfire smoke plumes, Remote Sens. Environ., 232, 111294, https://doi.org/10.1016/j.rse.2019.111294, 2019.
Solomon, S., Daniel, J. S., Neely III, R. R., Vernier, J. P., Dutton, E. G., and Thomason, L. W.: The persistently variable “background” stratospheric aerosol layer and global climate change, Science, 333, 866–870, https://doi.org/10.1126/science.1206027, 2011.
Stein, A. F., Draxler, R. R., Rolph, G. D., Stunder, B. J., Cohen, M. D., and Ngan, F.: NOAA's HYSPLIT atmospheric transport and dispersion modeling system, B. Am. Meteorol. Soc., 96, 2059–2077, https://doi.org/10.1175/BAMS-D-14-00110.1, 2015.
Tao, M., Chen, L., Wang, J., Wang, L., Wang, W., Lin, C., Gui, L., Wang, L., Yu, C., and Wang, Y.: Characterization of dust activation and their prevailing transport over East Asia based on multi-satellite observations, Atmos. Res., 265, 105886, https://doi.org/10.1016/j.atmosres.2021.105886, 2022.
Thompson, D. W. and Solomon, S.: Understanding recent stratospheric climate change, J. Climate, 22, 1934–1943, https://doi.org/10.1175/2008JCLI2482.1, 2009.
Torres, O., Bhartia, P. K., Taha, G., Jethva, H., Das, S., Colarco, P., Krotkov, N., Omar, A., and Ahn, C.: Stratospheric injection of massive smoke plume from Canadian boreal fires in 2017 as seen by DSCOVR-EPIC, CALIOP, and OMPS-LP oobservations, J. Geophys. Res.-Atmos., 125, e2020JD032579, https://doi.org/10.1029/2020JD032579, 2020.
Trickl, T., Giehl, H., Jäger, H., and Vogelmann, H.: 35 yr of stratospheric aerosol measurements at Garmisch-Partenkirchen: from Fuego to Eyjafjallajökull, and beyond, Atmos. Chem. Phys., 13, 5205–5225, https://doi.org/10.5194/acp-13-5205-2013, 2013.
Trickl, T., Vogelmann, H., Fromm, M. D., Jäger, H., Perfahl, M., and Steinbrecht, W.: Measurement report: Violent biomass burning and volcanic eruptions – a new period of elevated stratospheric aerosol over central Europe (2017 to 2023) in a long series of observations, Atmos. Chem. Phys., 24, 1997–2021, https://doi.org/10.5194/acp-24-1997-2024, 2024.
Vaughan, G., Wareing, D., and Ricketts, H.: Measurement Report: Lidar measurements of stratospheric aerosol following the 2019 Raikoke and Ulawun volcanic eruptions, Atmos. Chem. Phys., 21, 5597–5604, https://doi.org/10.5194/acp-21-5597-2021, 2021.
Vernier, J. P., Thomason, L. W., Pommereau, J. P., Bourassa, A., Pelon, J., Garnier, A., Hauchecorne, A., Blanot, L., Trepte, C., Degenstein, D., and Vargas, F.: Major influence of tropical volcanic eruptions on the stratospheric aerosol layer during the last decade, Geophys. Res. Lett., 38, L12807, https://doi.org/10.1029/2011GL047563, 2011.
Vernier, J. P., Fairlie, T. D., Natarajan, M., Wienhold, F. G., Bian, J., Martinsson, B. G., Crumeyrolle, S., Thomason, L. W., and Bedka, K. M.: Increase in upper tropospheric and lower stratospheric aerosol levels and its potential connection with Asian pollution, J. Geophys. Res.-Atmos., 120, 1608–1619, https://doi.org/10.1002/2014JD022372, 2015.
Veselovskii, I., Kasianik, N., Korenskii, M., Hu, Q., Goloub, P., Podvin, T., and Liu, D.: Multiwavelength fluorescence lidar observations of smoke plumes, Atmos. Meas. Tech., 16, 2055–2065, https://doi.org/10.5194/amt-16-2055-2023, 2023.
Winker, D., Hunt, W., and McGill, M.: Initial performance assessment of CALIOP, Geophys. Res. Lett., 34, L19803, https://doi.org/10.1029/2007GL030135, 2007.
Woods, D. C., Osborn, M. T., and Lucker, P. L.: Lidar monitoring of stratospheric aerosols at Hampton, Virginia, in: Remote Sensing of Clouds and the Atmosphere VII, Vol. 4882, International Symposium on Remote Sensing, Crete, Greece, 24–27 September 2002, SPIE, https://doi.org/10.1117/12.463021, 474–480, 2003.
Yi, Y., Yi, F., Liu, F., Zhang, Y., Yu, C., and He, Y.: Microphysical process of precipitating hydrometeors from warm-front mid-level stratiform clouds revealed by ground-based lidar observations, Atmos. Chem. Phys., 21, 17649–17664, https://doi.org/10.5194/acp-21-17649-2021, 2021.
Yin, Z., Yi, F., Liu, F., He, Y., Zhang, Y., Yu, C., and Zhang, Y.: Long-term variations of aerosol optical properties over Wuhan with polarization lidar, Atmos. Environ., 259, 118508, https://doi.org/10.1016/j.atmosenv.2021.118508, 2021.
Yu, P., Toon, O. B., Neely, R. R., Martinsson, B. G., and Brenninkmeijer, C. A.: Composition and physical properties of the Asian tropopause aerosol layer and the North American tropospheric aerosol layer, Geophys. Res. Lett., 42, 2540–2546, https://doi.org/10.1002/2015GL063181, 2015.
Yu, P., Rosenlof, K. H., Liu, S., Telg, H., Thornberry, T. D., Rollins, A. W., Portmann, R. W., Bai, Z., Ray, E. A., Duan, Y., Pan, L. L., Toon, O. B., Bian, J and Gao, R. S.: Efficient transport of tropospheric aerosol into the stratosphere via the Asian summer monsoon anticyclone, P. Natl. Acad. Sci. USA, 114, 6972–6977, https://doi.org/10.1073/pnas.1701170114, 2017.
Zhuang, J. and Yi, F.: Nabro aerosol evolution observed jointly by lidars at a midlatitude site and CALIPSO, Atmos. Environ., 140, 106–116, https://doi.org/10.1016/j.atmosenv.2016.05.048, 2016.
Zuev, V. V., Burlakov, V. D., Nevzorov, A. V., Pravdin, V. L., Savelieva, E. S., and Gerasimov, V. V.: 30-year lidar observations of the stratospheric aerosol layer state over Tomsk (Western Siberia, Russia), Atmos. Chem. Phys., 17, 3067–3081, https://doi.org/10.5194/acp-17-3067-2017, 2017.