the Creative Commons Attribution 4.0 License.
the Creative Commons Attribution 4.0 License.
 | 24 Jan 2024
Significant human health co-benefits of mitigating African emissions
Christopher D. Wells
Matthew Kasoar
Majid Ezzati
Apostolos Voulgarakis
Future African aerosol emissions, and therefore air pollution levels and health outcomes, are uncertain and understudied. Understanding the future health impacts of pollutant emissions from this region is crucial. Here, this research gap is addressed by studying the range in the future health impacts of aerosol emissions from Africa in the Shared Socioeconomic Pathway (SSP) scenarios, using the UK Earth System Model version 1 (UKESM1), along with human health concentration–response functions. The effects of Africa following a high-pollution aerosol pathway are studied relative to a low-pollution control, with experiments varying aerosol emissions from industry and biomass burning. Using present-day demographics, annual deaths within Africa attributable to ambient particulate matter are estimated to be lower by 150 000 (5th–95th confidence interval of 67 000–234 000) under stronger African aerosol mitigation by 2090, while those attributable to O3 are lower by 15 000 (5th–95th confidence interval of 9000–21 000). The particulate matter health benefits are realised predominantly within Africa, with the O3-driven benefits being more widespread – though still concentrated in Africa – due to the longer atmospheric lifetime of O3. These results demonstrate the important health co-benefits from future emission mitigation in Africa.
- Article
(3212 KB) - Full-text XML
-
Supplement
(1934 KB) - BibTeX
- EndNote


Anthropogenic emissions of aerosols, their precursors, and reactive gases have substantial impacts on the climate. These impacts include a general aerosol cooling and, to a lesser extent, warming due to tropospheric O3 (Thornhill et al., 2021; Smith et al., 2020), as well as shifts in circulation patterns such as monsoons (Kasoar et al., 2018; Shawki et al., 2018; Wang et al., 2016; Liu et al., 2018). In addition to their climate effect, aerosols contribute to fine particulate matter air pollution, termed PM2.5 to denote particles with diameters less than 2.5 µm (Turnock et al., 2020). Reactive gases also modify concentrations of O3, which is another important climate forcer and air pollutant (von Schneidemesser et al., 2015). Due to their relatively short lifetimes, the effects of aerosols on the climate and human health depend on their emission location (Persad and Caldeira, 2018), with the health impact being particularly localised (Shindell et al., 2018). Since these species are co-emitted with greenhouse gas emissions, general climate change mitigation policies can lead to health co-benefits via reduced air pollution (Shindell et al., 2018).
The continent of Africa features a complex mix of air pollutant sources, both natural – such as dust from, for example, the Sahara – and anthropogenic, with continent-specific complexities such as imported second-hand high-emission vehicles (Abera et al., 2021). There is a broad range of possible future African pollutant emission pathways (Abera et al., 2021), some of which involve drastic increases in pollutants in key regions (Turnock et al., 2020). Recent and likely future dynamics of urbanisation can also be expected to drive enhanced exposure to air pollutants (Abera et al., 2021; Katoto et al., 2019). Reducing air pollution impacts in developing countries is a key component of the Sustainable Development Goals (Coker and Kizito, 2018).
The wide range of potential future African air pollutant emissions suggests concurrently disparate possible air pollution impacts over the continent. Despite this, studies assessing the human health impact of air pollution over Africa are sparse, especially those focused on outdoor air pollution (Abera et al., 2021), inhibiting the creation of appropriate concentration–response functions (CRFs) (Chen and Hoek, 2020; Abera et al., 2021; Katoto et al., 2019; Coker and Kizito, 2018). Observational data of air pollution in Africa are sparse (Coker and Kizito, 2018), with issues on data availability (Pinder et al., 2019) and structural barriers to reliable data collection (Pinder et al., 2019; Katoto et al., 2019). Strong intra-regional disparities in research persist, with two reviews finding over half of all studies measuring outdoor air pollution impacts in sub-Saharan Africa focusing on a single country (South Africa) and large areas entirely unstudied (Katoto et al., 2019; Coker and Kizito, 2018).
This study, while recognising the inadequacy of extant exposure research to effectively assess the effect of air pollutants in Africa, utilises recent CRFs for PM2.5 (GBD 2019 Risk Factors Collaborators, 2020), which incorporated high-air-pollution cohort studies from the Global South. This allows for a more accurate investigation of the effect of air pollution on human health in Africa than previously possible.
Global annual average PM2.5 concentrations have increased 15 %–20 % since the pre-industrial era to 6.9 ± 1.5 µg m−3 (Turnock et al., 2020) and are thought to still be slightly increasing in recent decades by 0.2 % yr−1, particularly over Asia and southern Africa (Gliß et al., 2021). The average concentration experienced by humans is much higher than this global average, due to the co-location of anthropogenic sources with population centres; 69 % of people are estimated to be exposed to PM2.5 concentrations higher than 10 µg m−3 (Lelieveld et al., 2013), with an average population-weighted PM2.5 exposure of 38 µg m−3, reducing to just 11 µg m−3 when excluding fossil fuel emissions (Vohra et al., 2021). The World Health Organisation recommends limiting long-term exposure to less than 5 µg m−3 (World Health Organisation, 2021), lowered in 2021 from their previous threshold of 10 µg m−3, though there is no known safe level of PM2.5 concentrations (Silva et al., 2013). Present-day human health impacts of PM2.5 are substantial but uncertain, with estimates varying from 2.37 (1.33–2.93) million deaths yr−1 (Partanen et al., 2018) to the more recent finding of 8.7 (−1.8 to 14.0) million deaths yr−1 (Vohra et al., 2021). In other studies, 3.61 (2.96–4.21) million deaths yr−1 have been attributed to fossil fuel PM2.5 alone (Lelieveld et al., 2019), and the Global Burden of Disease 2019 (hereafter GBD2019) estimated PM2.5-attributable deaths to be 4.14 (3.55–4.80) million deaths yr−1 (GBD 2019 Risk Factors Collaborators, 2020).
Anthropogenic activity has also increased annual average surface concentrations of O3, by 11.7 ppb (parts per billion) to the present-day levels of 29.9 ppb (Turnock et al., 2020). The lifetime of O3 is longer than that of PM2.5, but its effects are still strongly co-located with anthropogenic activity, with a population-weighted maximum 6-month average 1 h daily maximum concentration of around 57 ppb (Anenberg et al., 2010). Impacts of O3 on premature mortality have been estimated to be 0.7 ± 0.3 million deaths yr−1 (Anenberg et al., 2010) and 0.38 (0.12–0.73) million deaths yr−1 (Silva et al., 2016), using the same CRFs (Jerrett et al., 2009). Using more recent CRFs (Turner et al., 2016) 0.6 ± 0.1 million deaths yr−1 were attributed to O3-linked respiratory causes (Shindell et al., 2018), and GBD2019 attributed 0.365 (0.175–0.504) million deaths yr−1 to O3, purely from chronic obstructive pulmonary disease (COPD) (GBD 2019 Risk Factors Collaborators, 2020). Note that O3 concentrations presented in this study are annual average of the daily maximum 8 h mean concentration to be consistent with the CRFs used.
Future impacts of air pollutants will depend on both emissions and demographic changes. The reduced air pollution from measures targeting the direct lowering of carbon emissions rather than relying on negative emission technologies would prevent 93 ± 41 million deaths from PM2.5 and 60 ± 18 million deaths from O3 over the 21st century (Shindell et al., 2018). Measures compatible with 2 ∘C warming are projected to reduce life years lost due to PM2.5 by 0.7 million years per year in Europe by 2050 compared to a business-as-usual scenario, despite population increases (Schucht et al., 2015). Air pollutant emission decrease into the future in all the CMIP5-era Representative Concentration Pathway (RCP) scenarios, with reduced future air-pollution-linked mortality (Silva et al., 2016). However, the range in aerosol emissions between the different RCP scenarios is far smaller than that covered by the newer Shared Socioeconomic Pathways (SSPs) (Gidden et al., 2019), which extend the RCP framework to include different socioeconomic and demographic trends and are projected to have substantially different air pollution impacts on human health (Im et al., 2023). Thus, the future range of possible human health impacts of air pollution is larger under more recent, less explored, scenarios.
Several previous studies have investigated the human health impacts of changes in global emissions but predominantly consider the global response. The effect of the newer SSPs on human health has also yet to be studied in detail with the latest CRFs.
The current study addresses these gaps using the SSPs to investigate the potential future impacts of African emissions on air pollution, both within and beyond the continent. Using the UK Earth System Model version 1 (UKESM1), a strong mitigation scenario was compared to three alternative emission scenarios, each substituting a subset of pollutant emissions over Africa for a weak mitigation equivalent.
2.1 Earth system model
This study uses the UK Earth System Model version 1 (UKESM1), a fully coupled global climate model used in the CMIP6 (Coupled Model Intercomparison Project phase 6) exercise. UKESM1 couples the ocean module NEMO (Nucleus for European Modelling of the Ocean) to its atmospheric module GA7.1 (Global Atmosphere 7.1) and the land module GL7 (Global Land version 7), with further couplings to Earth system components such as the biogeochemical scheme (Sellar et al., 2019). Its horizontal resolution is 1.875∘ × 1.25∘, with 85 vertical levels. The atmospheric scheme features interactive chemistry, with 291 reactions and 84 species (Archibald et al., 2020). This is coupled to the Global Model of Aerosol Processes (GLOMAP)-mode aerosol scheme, which simulates the concentrations of black carbon (BC), organic carbon (OC), sulfate, sea salt, primary marine organic aerosol (PMOA), and secondary organic aerosol (SOA) in five lognormal modes in total, with four soluble and one insoluble (Bellouin et al., 2013; Mulcahy et al., 2020). The GLOMAP mode is a two-moment scheme, calculating both aerosol mass and number concentration, allowing different processes to impact these independently; it simulates both aerosol direct and indirect effects (Mann et al., 2010), with broader semi-direct effects enabled via the coupling to the dynamical atmosphere. Dust is treated separately within UKESM1 via the older one-moment (mass only) CLASSIC scheme (Bellouin et al., 2011).
UKESM1's representation of surface PM2.5 and O3 has been evaluated in relation to observations and other models (Turnock et al., 2020; in particular, their Figs. 3–8). In areas that are well sampled with surface PM2.5 measurements, UKESM1 is consistent with other CMIP6 models, exhibiting a low bias in PM2.5 in Eastern Europe and North America by around 2–10 µg m−3. Over oceans, PM2.5 is also systematically low, but the picture over other land areas is mixed when compared to MERRA (Modern-Era Retrospective Analysis for Research and Applications) reanalysis. In the multi-model mean, PM2.5 concentrations over northwest Africa are too low (Turnock et al., 2020), while those over eastern and southern Africa are too high by around 2–15 µg m−3 between models. Concentrations over Asia are also generally too high, with all bias patterns roughly similar between December to February (DJF) and June to August (JJA). UKESM1 is typical in its PM2.5 bias across most regions, including northern Africa. In sub-Saharan Africa, however, it exhibits a stronger seasonal cycle than other models, with the main biomass burning seasons featuring substantially higher PM2.5 concentrations than other models and the observational best estimate. Simulated PM2.5 concentrations are up to 50 % higher than the multi-model and observational means in July and January, though they still lie close to the wide observational range. The areas of high biases in CMIP6 are areas with high background PM2.5 and large ranges in simulated concentrations across CMIP6, with inter-model standard deviations of over 20 µg m−3 in the most polluted areas of northern and central Africa.
CMIP6 models generally exhibit high biases in surface O3, overestimating North American, European, and East Asian concentrations by around 10 ppb in DJF and JJA compared to surface observations (Turnock et al., 2020). UKESM1 has typical biases in JJA (i.e. high) but overestimates the amplitude of the seasonal cycle, becoming the only one of five CMIP6 models studied by Turnock et al. (2020) to exhibit a low bias over northern hemispheric land. As for PM2.5, the areas with the largest concentrations and inter-model standard deviations are the high-emission regions in Africa and Asia. UKESM1's representation of O3 over sub-Saharan Africa is much closer to the multi-model mean; the lack of local surface observations precludes a full evaluation, though the sole observational station in South Africa closely tracks the model's regional averages (Fig. 4 in Turnock et al., 2020). Aerosol optical depth (AOD) in UKESM1 is consistent with satellite observations in low-AOD areas but is biased low over some areas with strong aerosol emissions such as West Africa (Mulcahy et al., 2020).
2.2 Experiments
This study uses the Shared Socioeconomic Pathway (SSP) emission trajectories to estimate the future health impact of different African emission pathways. The SSPs are denoted SSPx−y, with x being an integer referring to one of five socioeconomic narrative pathways to explore different non-climate societal evolutions, and y denoting the top-of-atmosphere (TOA) radiative forcing in 2100 under a particular mitigation scenario (O'Neill et al., 2017). The SSPs therefore explore a range of future possible trajectories covering both socioeconomic and mitigation trends. This project uses SSP119 as a control scenario. Designed to be roughly consistent with strong mitigation under the Paris Agreement, this follows socioeconomic trajectory 1 – “sustainability” (van Vuuren et al., 2017) – along with broad emission reductions to approximately reach 1.9 W m−2 radiative forcing in 2100. To test the effect of weaker mitigation in Africa for different sets of emissions, three experiments are simulated, switching out the SSP119 aerosol and reactive gases emissions over Africa for their SSP370 equivalent. SSP370 follows the socioeconomic trends in narrative 3 – “regional rivalry” (Fujimori et al., 2017) – coupled with weak mitigation, leading to a TOA radiative forcing of around 7 W m−2 in 2100. The three experiments performed are named after the SSP370 emission subset which is substituted over Africa; the full set of experiments is as follows:
-
Control, with SSP119 globally;
-
AerAll, which is the control with African aerosol emissions from SSP370;
-
AerNonBB, which is the control with African non-biomass burning aerosol emissions from SSP370;
-
AerBB, which is the control with African biomass burning aerosol emissions from SSP370.
AerAll indicates that all aerosol and reactive gas emissions over Africa are substituted with SSP370, while emissions over all other areas, and for other climate forcers such as well-mixed greenhouse gases (GHGs) over Africa, are kept at their SSP119 values as in the control. AerBB then switches out just the biomass burning (BB) components of aerosols and reactive gases, and AerNonBB changes only the non-BB emissions (i.e. fossil fuel and biofuel) over Africa. Note that the terminology of non-BB is used in this paper to refer to the non-biomass-burning emissions themselves (i.e. those from fossil fuels and biofuels), which are changed in both AerAll and AerNonBB, and so the effects of changed non-BB emissions are found under both experiments. BB, similarly, refers to biomass burning emissions that changed in both AerAll and AerBB. Non-BB emissions are purely anthropogenic, while those from biomass burning are complexly related to human activity, particularly over Africa (Bauer et al., 2019), driving the counter-intuitive increase in BB emissions in the stronger mitigation scenario. Pollutant concentrations are not bias-corrected here, in order to determine the specific estimation in UKESM1 and due to the sparse observations over Africa. The focus is therefore on the relative impact of the scenarios, while also contextualising the magnitudes in relation to prior studies.
The control scenario thus depicts a global future with strong climate mitigation policies, leading to relatively low greenhouse gas emissions and consequently low-air-pollutant levels. Each of the alternative scenarios represents a future in which Africa instead follows a more “pessimistic” scenario in its emissions of air pollutant precursors, allowing for an exploration of the health impacts of such a range in future trajectories.
The aerosol emissions changed are BC and OC, and the reactive gases are C2H6, C3H8, CO, dimethyl sulfide (DMS), HCHO, Me2CO, MeCHO, NH3, NO, lumped non-methane volatile organic compounds (NVOCs), and SO2. In UKESM1, all of these emission species have both BB and non-BB components, except for SO2, which has only a non-BB component. All are emitted from the surface, except a subset of BB BC and OC representing large fires, which are injected vertically and uniformly from the surface to 3 km, and aircraft NO emissions, which are injected in a 3D grid. It should be noted that, since the aerosol and O3 precursors are co-emitted with greenhouse gases, these scenarios changing emission subsets are not realistic future scenarios. Instead, the purpose is to investigate the range of plausible human health impacts between scenarios, which are driven by the species altered in these experiments.
Multiple ensemble members were simulated for each experiment; each was initiated in 2015 with slightly different atmospheric and ocean conditions to explore the internal climate variability. There are 10 ensemble members of SSP119 used for the control – five simulated for this study and five taken from the UKESM1 CMIP6 experiments (Tebaldi et al., 2021) – and seven of each of the other experiments are simulated. All simulations run the length of the SSP scenarios, i.e. 2015–2100. The analysis of the health impacts here focuses on the effects in 2090. For the O3 impacts, the five UKESM1 CMIP6 control members did not output the concentrations hourly, so only the five control experiments simulated for this project were used for the control concentrations. The local and remote climate impacts of these emission scenarios, plus additional scenarios changing CO2 emissions in a similar manner, are explored in a separate paper (Wells et al., 2023).
Figure S1 in the Supplement indicates the time evolution of the aerosol and SO2 emissions over Africa and globally in the control (black) and experiments (red), with the total and BB carbonaceous aerosol shown. Also shown is maps of the emission differences for carbonaceous aerosol and SO2. Total carbonaceous aerosol emissions over Africa decline quickly in the SSP119 control, consistent with general emission mitigation, whereas they remain roughly flat in SSP370. This acts to dampen the general global decrease in emissions, though they still almost halve at the global level through the 21st century as the rest of the world follows SSP119. The BB emission subset, however, shows the opposite (and weaker) trend, with emissions remaining approximately constant in SSP119 but declining in SSP370, while global emission decline in each case. This is inconsistent with the general emission reductions in SSP119 and is reflective of the more complex link between anthropogenic activity and BB emissions than between human actions and non-BB emissions. Different IAMs (integrated assessment models) were used to produce the emission pathways for the different scenarios (IMAGE for SSP1 and AIM/CGE for SSP3; Fujimori et al., 2017; van Vuuren et al., 2017); this makes a clear understanding of the differences between complex emission sources difficult, but it likely relates to different land use activity in the scenarios. Non-BB emissions still dominate the carbonaceous aerosol emission change, as indicated by the larger overall carbonaceous emissions in SSP370 than SSP119 over Africa. The SO2 emission change features a complex pattern, with emissions higher across most of the continent in SSP370 than SSP119 but relatively lower over southern Africa (except South Africa). In both cases, emissions drop substantially overall, and the differing spatial changes over Africa approximately cancel, resulting in little overall emission difference between the scenarios. As with the BB aerosol changes, the specific cause of the differing trends in SO2 emissions is hard to discern, though it is driven by stronger industrial SO2 emissions in SSP119 (Gidden et al., 2018), indicating a projected faster industrialisation in SSP119 than SSP370 in southern Africa.
2.3 Health impact analysis
Many studies utilise a common methodology to estimate the human health impact of a given concentration, or change in concentration, of pollutants (e.g. Anenberg et al., 2010; Shindell et al., 2018). Cohort studies, tracking a large population over many years, are used to produce empirically determined concentration response functions (CRFs), linking background air pollutant concentrations to the change in the relative risk (RR) of dying from a particular cause of death (COD). The RR at 0 concentration is 1 by definition and increases monotonically above a low-concentration threshold (LCT). The form of RR is constrained by the fit used to derive the function. Early studies used exponential fits (Pope et al., 2002), while others use linear relationships or power laws (Pope et al., 2009; Ezzati et al., 2004), while more recent studies use more complex functional forms (Burnett et al., 2014, 2018).
While various co-founding factors are controlled for – such as lifestyle and income level – it is not necessarily valid to generalise a RR from a single cohort to the global scale. This issue especially applies to the extrapolation of pollutant concentrations to levels outside those experienced by the cohort population. In particular, a large American Cancer Society cohort study was used to generate earlier RR curves, but the highest PM2.5 concentrations that this cohort was exposed to were less than 30 µg m−3, lower than the global population-weighted average of 38 µg m−3, as found by Vohra et al. (2021). This gap can be bridged using data from active smoking, but this assumes that a short, high-exposure burst – from smoking individual cigarettes – has the same health effect as a lower, continuous background concentration (Smith and Peel, 2010; Pope et al., 2009). More recent studies use multiple cohort studies across a range of ambient exposures, significantly mitigating this issue (Burnett et al., 2018; GBD 2019 Risk Factors Collaborators, 2020) and rendering such CRFs more applicable to highly polluted regions than prior estimates. At the other end of the exposure range, the assumed LCT below which the RR is 1 (i.e. pollutant concentrations below this have no human health effect) has decreased in consecutive studies, as cohorts in ever-cleaner environments still exhibit significant effects of air pollution; there is no biological justification for a threshold, and more recent CRFs, including that used here, use a statistical distribution to represent the LCT (GBD 2019 Risk Factors Collaborators, 2020).
The attributable fraction (AF) estimates the fraction of deaths – of a particular COD – attributable to the air pollutant exposure as follows (Mansournia and Altman, 2018):
Given a COD-specific RR curve, and common grids of surface concentrations of the pollutant (either PM2.5 or O3), baseline population (Pop), and mortality for a specific COD (y0), the number of deaths attributable to the pollutant can be estimated as
Equation (2) is applied at each grid cell to determine the estimated annual deaths within the cell.
The concentration–response functions used in this study are taken from the Global Burden of Disease 2019 (hereafter GBD2019; GBD 2019 Risk Factors Collaborators, 2020) for PM2.5 and from Turner et al. (2016) for O3. While studies prior to GBD2019 imposed functional forms of varying complexity on their CRFs, GBD2019 uses a Bayesian meta-regression method to provide the fit, with only the assumption that the CRF should be monotonic. Due to the uncertainties regarding the existence and level of safe low concentrations of PM2.5, GBD2019 suggests the use of a uniform distribution from 2.4–5.9 µg m−3 for the LCT, representing the lowest and the 5th percentile concentrations found in the background concentrations; this threshold is used in this study. The GBD2019 dataset provides 1000 draws of the fit for each COD–age pair with no threshold; an LCT from the suggested uniform distribution was then randomly selected for each draw to complete the distribution. These 1000 draws represent the uncertainty in the CRF; the median, 5th, and 95th percentile impacts using these draws are calculated here to explore this uncertainty.
GBD2019 provides CRFs for six COD for PM2.5: lung cancer (LC), chronic obstructive pulmonary disease (COPD), lower respiratory infection (LRI), type-2 diabetes (T2DM), stroke, and ischemic heart disease (IHD). The latter two are age-dependent on 5-year brackets; T2DM applies only to populations over 25 years; and the other COD are applied to the total population. The CRFs for PM2.5 apply to annual average PM2.5 concentrations.
Following prior studies (Malley et al., 2017; Shindell et al., 2018; GBD 2019 Risk Factors Collaborators, 2020), the CRF for O3 in this study was taken from Turner et al. (2016) for respiratory mortality, which includes COPD, LRI, upper respiratory infections, asthma, pneumoconiosis, interstitial lung disease, pulmonary sarcoidosis, and other chronic respiratory diseases. This CRF applies to populations over 30 years of age and applies to the annual average of the daily maximum 8 h mean concentration. An LCT of 26.7 ppb, the minimum concentration found in the cohort studies used by Turner et al. (2016), is applied here, with a sensitivity test carried out applying an LCT of 31.1 ppb, representing the 5th percentile in the underlying cohort data.
This study uses the following approximation for PM2.5:
This means that all carbonaceous and sulfate aerosol contributes to PM2.5, but only 25 % of sea salt (SS) and 10 % of dust are assumed to be shorter than 2.5 µm in diameter. This approximation is used in AerChemMIP (Turnock et al., 2020) and other studies (e.g. Allen et al., 2021).
Single years of pollutant concentrations, averaged across the ensembles, were utilised in this study, namely 2015, 2050, and 2090. There are several reasons for the choice to use single years rather than, for example, averaging over a decade to smooth out interannual variability. The present-day value needed to be centred around 2015, at the start of the scenarios, since this is where the emissions start to diverge. All simulations were initialised from 2015, so it would not have been possible to use a larger window to average around 2015. If data past 2015 had been used, e.g. 2015–2025 for the present day, then this would have introduced other issues. Since the emission scenarios diverge from 2015, the choice of scenario to take the data from would affect the results, and this would not represent the present-day in the other scenarios; in addition, the rapid decrease in emissions from 2015 in all scenarios would mean the 2015–2025 average would be significantly lower than the concentrations in 2015 and therefore not closely represent the conditions experienced by the 2015 population distribution under present-day concentrations.
Population numbers from the SSPs in 2015 – equal between scenarios since the SSPs only diverge after 2015 – were used to ensure consistency across the methodology (Lutz et al., 2018). Equation (2) is applied in each model grid cell level, using the pollutant concentrations output from UKESM1, so the country level population data were re-gridded to the 1.875∘ × 1.25∘ UKESM1 grid. To approximately preserve present-day within-country population distributions, a high-resolution (0.25∘ × 0.25∘) present-day population file was used (CIESIN, 2018), and a country name was assigned to each cell within this grid using a global shapefile (Sandvik, 2008). The present-day population distribution within each country was then scaled to create the correct total for each age–year pair, and these distributions were then re-gridded to the UKESM1 grid resolution. Baseline mortality data for each COD–age pair were applied at the country level (IHME, 2020) and re-gridded to the UKESM1 grid using the global shapefile.
Present-day populations were used for the analysis for two reasons. First, this was done to isolate the effect of changes in emissions on human health. Second, while the SSPs include population projections, they do not include future baseline mortality estimates, and present-day mortality rates cannot be assumed constant while populations and other social factors change significantly and differently between scenarios.
3.1 Air pollution impact
Africa is a continent with a major presence of key pollutants compared to the global average, as seen in Fig. S2. Based on our UKESM1 simulations, the organic carbon (OC) contribution to PM2.5 is generally highest in the tropical biomass burning regions, peaking in Africa; this is also true for atmospheric dust. The distribution of O3 is smoother than that of PM2.5, owing to its longer lifetime, with the concentrations again being higher than average near the main emission regions in the low latitudes in Africa.
The changes in surface PM2.5 and O3 over Africa near the end of the century (2090) for all simulations, split into contributions from each component, are shown in Fig. 1. Figure S3 shows the corresponding time series of simulated pollutants for Africa, its sub-region West Africa, and the neighbouring region Europe, as well as for the whole globe. The simulations explore the change in pollution levels in scenarios where the whole globe follows a strong mitigation pathway, while Africa follows a more pessimistic policy pathway in terms of its biomass burning aerosols (AerBB simulation; though, as discussed in Sect. 2, these emissions are higher in the control), non-biomass burning aerosols (AerNonBB), and all aerosols combined (AerAll) (see Sect. 2). The carbonaceous aerosol increases under AerNonBB are near the main non-biomass burning emission regions, especially in West and East Africa, while reductions under AerBB are centred on the biomass burning regions north and south of the Equator. AerAll then exhibits features of both. Sulfate shows weaker changes, with the North African non-BB increased emissions, contrasting with the reduced emissions south of the Equator. Changes in dust are significant, with a substantial decrease in areas with high background dust emissions. This decrease in dust emissions is ultimately due to the impact of the aerosol emissions on local surface winds, which drives the emission of dust (see Fig. S4). O3 follows a similar pattern to the PM2.5 changes, as its concentration is modified by the reactive gases co-emitted with the anthropogenic aerosol species.
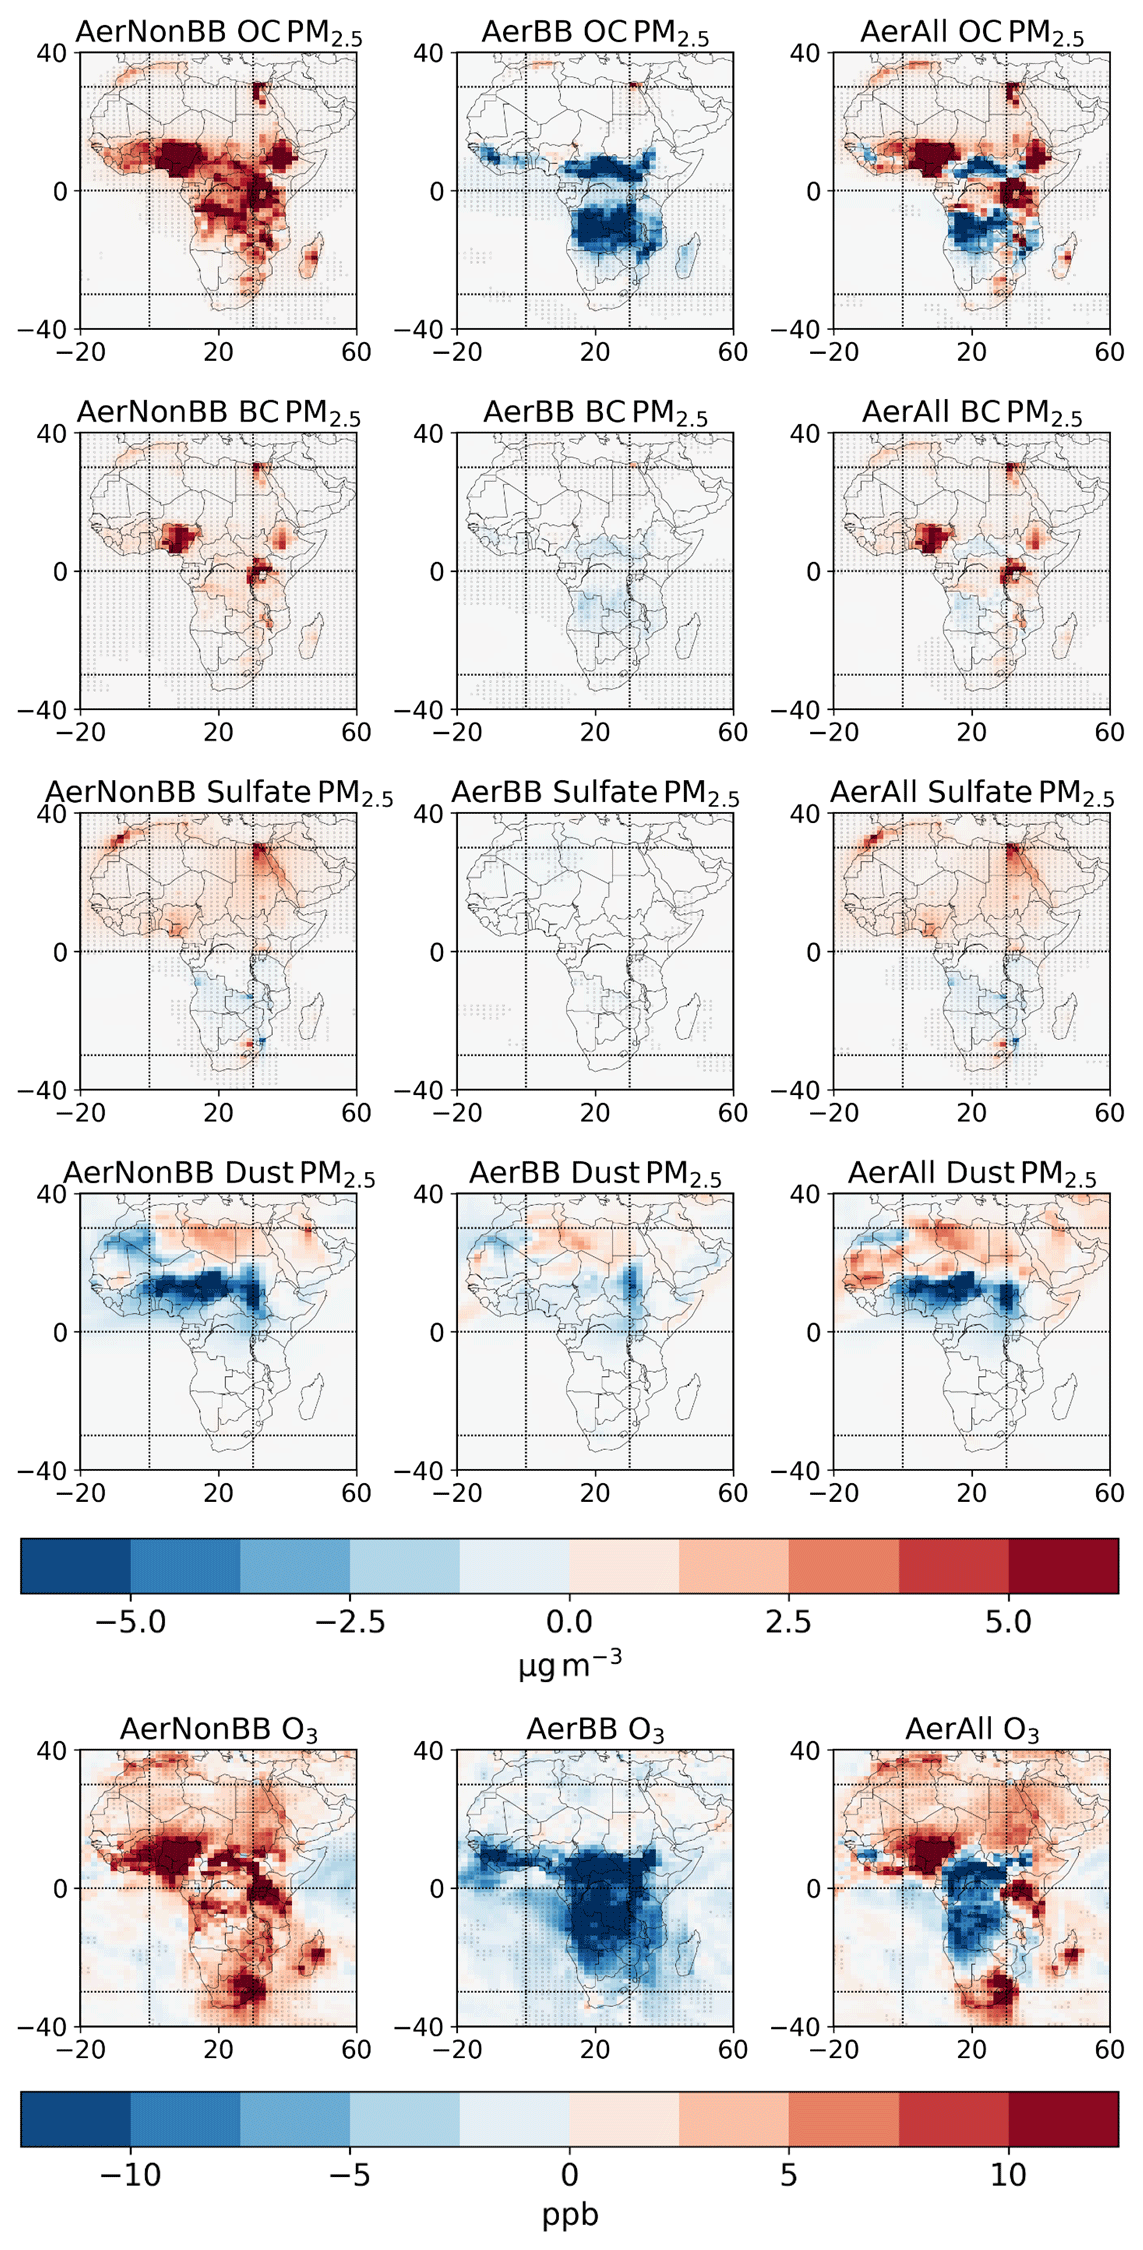
Figure 1The change in the organic carbon (OC), black carbon (BC), sulfate, and dust aerosol contributions to surface PM2.5, and O3, under each emission scenario relative to the SSP119 control in 2090 over Africa. Stippling indicates areas where the ensemble mean change is greater than 1 intra-ensemble standard deviation away from 0.
3.2 Health impact
The estimated deaths in 2015 from PM2.5 (six causes of death (COD); see Sect. 2) and O3 (respiratory illnesses only) per 1000 km2 are shown in the top row of Fig. 2. Table 1 indicates global and regional totals. The control SSP119 experiment is used for the air pollutant concentrations in 2015, which is an arbitrary choice as the SSP emissions diverge only after this year.
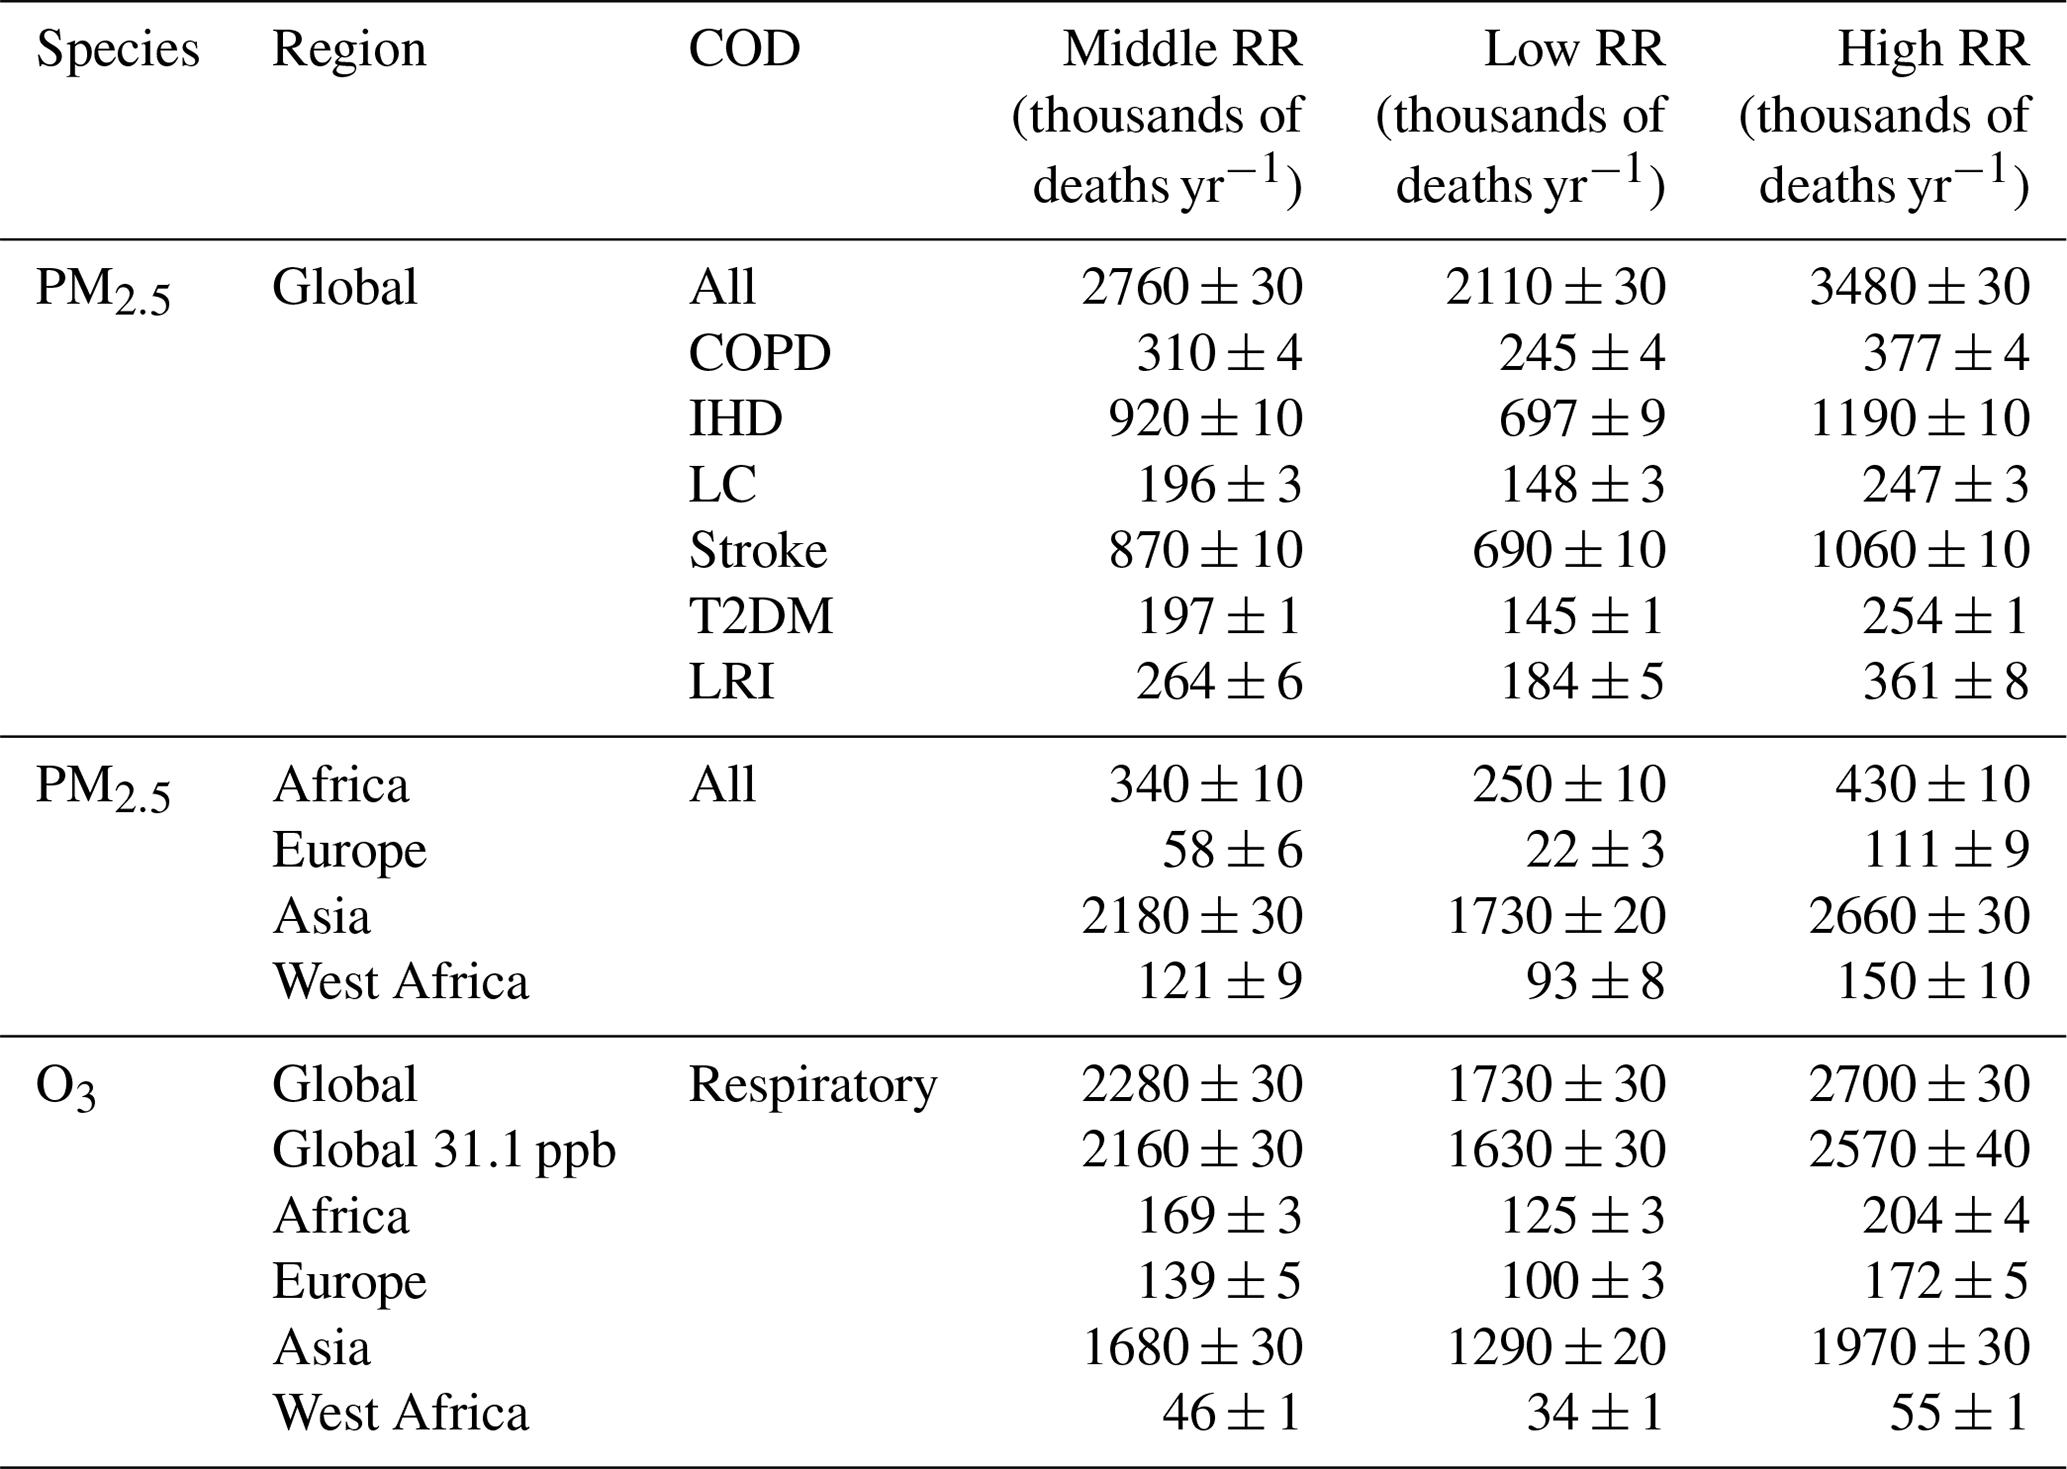
Globally, 2.76 (2.11–3.48) million annual deaths are attributed to PM2.5, with ischemic heart disease (IHD) being the largest COD, followed by stroke, and 2.28 (1.73–2.70) million to O3. Deaths are highest in areas where population densities and pollutant concentrations are high, namely in East and South Asia and in tropical Africa. The highest number of deaths attributable to PM2.5 and O3 exposure occur in Asia; Africa experiences large impacts too, with 12 % and 7.4 % of the global total for PM2.5 and O3, respectively.
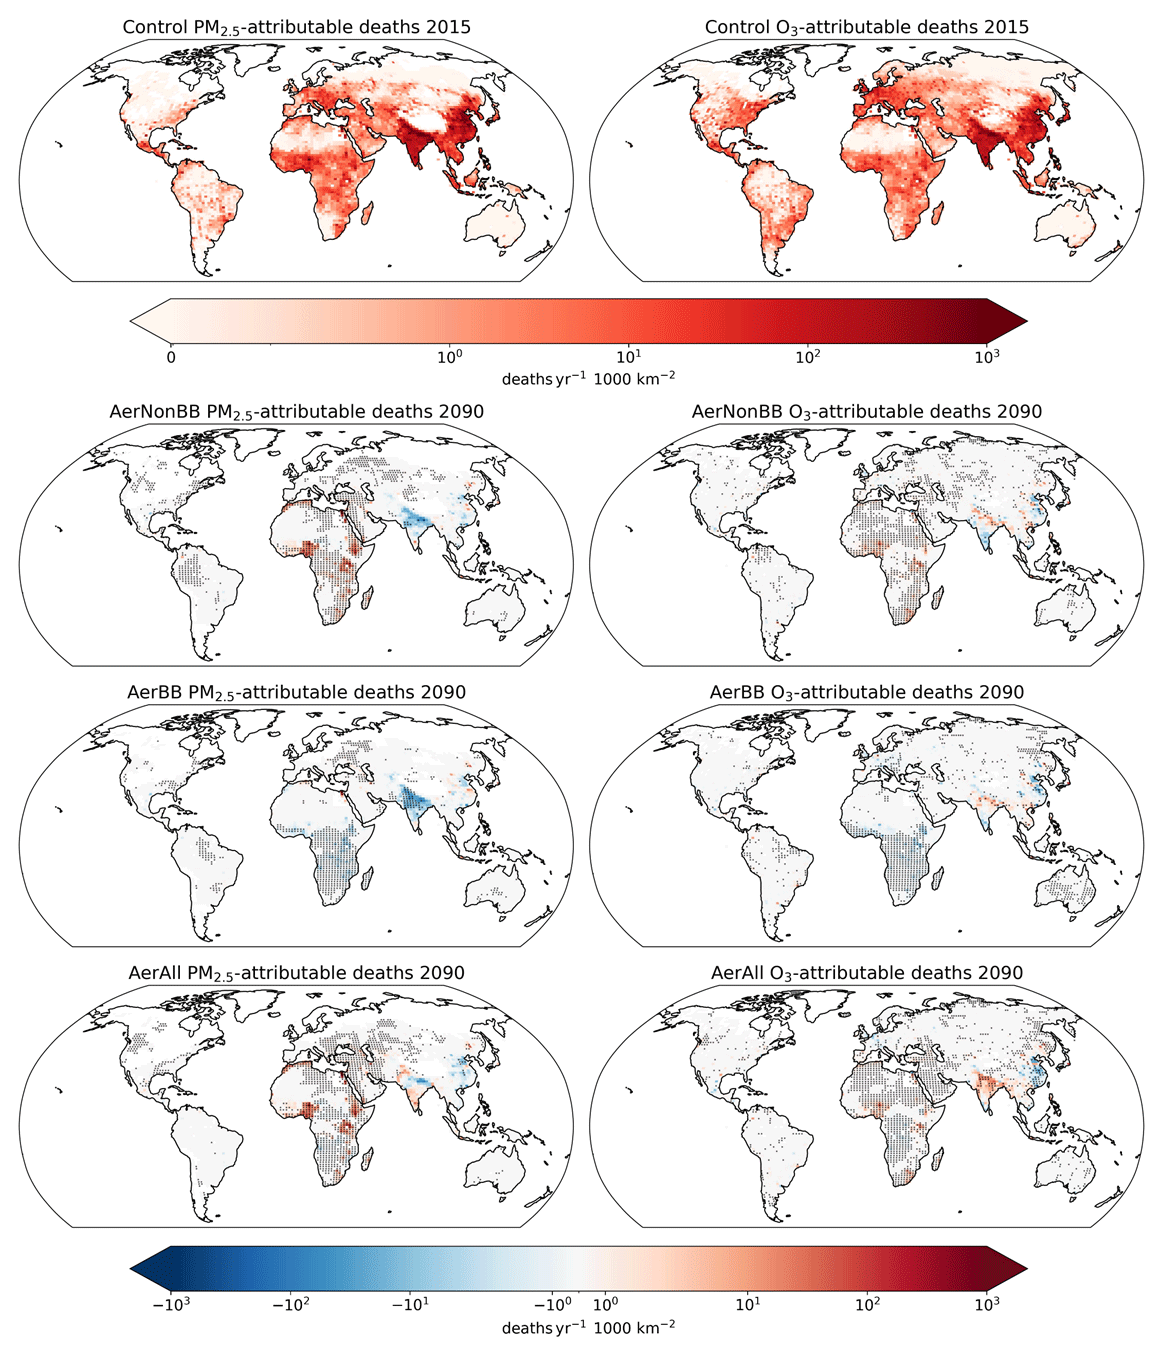
Figure 2Top row shows the annual deaths per 1000 km2 attributable to air pollution for all COD for PM2.5 and respiratory illnesses for O3 in 2015. Subsequent rows show the impact of each scenario on 2090 deaths per 1000 km2 attributable to PM2.5 and O3 exposure relative to the SSP119 control, using 2015 spatial and age-based population distributions. Stippling indicates areas where the change is greater than 1 intra-ensemble standard deviation away from 0.
Table 1Annual deaths (in thousands) in 2015 attributable to PM2.5, shown globally in total and for each COD separately, and the total across several regions (definitions in Fig. S2) and those attributable to respiratory illnesses caused by O3 exposure globally and in several regions. Also shown is the effect of using a low-concentration threshold (LCT, above which no harm is assumed; see Sect. 2) of 31.1 ppb on global deaths for O3, instead of the 26.7 ppb used for the main results. Values are shown using the central CRF estimate and the 5th and 95th percentile CRF estimates, all from GBD2019 for PM2.5 and Turner et al. (2016) for O3. The uncertainty given for each estimate is the estimated 5th–95th percentile range across the 10 control ensemble members, calculated as the standard deviation multiplied by 1.6449. The region definitions are shown in Fig. S2.
The second to fourth rows in Fig. 2 show the effect on annual deaths per 1000 km2 in 2090 of the different emission scenarios, relative to the SSP119 control scenario, for both PM2.5 and O3. Population distributions from 2015 are used here to isolate the effect of the changed pollutants. The spatial pattern of human health impacts is broadly consistent with the emission changes, modulated by the population distribution. AerNonBB features higher deaths across Africa than in the control, particularly in the highly populated west and east regions, due to future increases in fossil fuel emissions. The decrease in dust emissions in the southern Sahara leads to an overall reduction in PM2.5 – and therefore lower health impacts – in this region (see Fig. S4). This indicates that the indirect effects of pollutant emissions on atmospheric circulation – and therefore natural dust emissions – can have a substantial influence on their overall impact, as also noted by, for example, Bauer et al. (2019) and Yang et al. (2017). The lower future African biomass burning emissions in the AerBB experiment compared to the control result in significantly lower deaths across central and southern Africa. Still, the co-location of fossil fuel emissions with population centres causes these emissions to dominate the overall impact in AerAll.
Some remote impacts of the changed emissions are visible, with southern Europe and the Middle East exhibiting consistent changes with those found in North Africa. The impact in each scenario relative to the control on global and African PM2.5 and O3 annual deaths in 2090 is shown in Table 2, and the total deaths are shown in Fig. 3 over Africa and globally, with additional regions in the Supplement. Overall, Africa following SSP370 rather than SSP119 emissions leads to around 150 000 (5th–95th confidence interval of 67 000–234 000) additional annual deaths across Africa from PM2.5 and 15 000 (5th–95th confidence interval of 9000–21 000) from O3 when the background populations are held constant. In Africa, air pollutant trends are consistent with the impact changes (Fig. S3). O3 is projected to approximately match PM2.5 in its health impacts by 2090 in these scenarios, due to the weaker decline in O3 levels than in PM2.5 (Fig. 3). The short pollutant lifetime, coupled with internal variability, causes the impacts outside Africa to be noisier than those within the continent; note that only 1 year (2090) was used for the analysis, as discussed in Sect. 2.3.
Table 2Effect of each scenario, relative to the control, in thousands of annual PM2.5 and O3 deaths in 2090 globally and just over Africa, using 2015 populations and the central CRF. Values are bold when they are more than 1 intra-ensemble standard deviation away from 0. The African region definition is shown in Fig. S2.
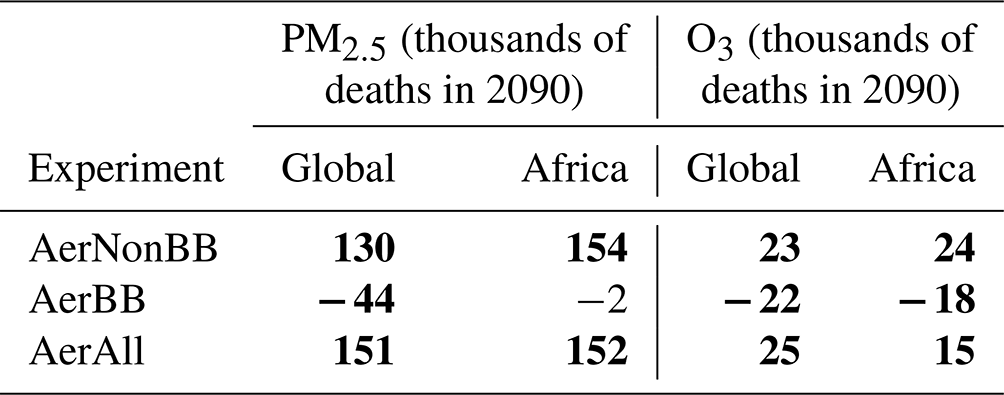
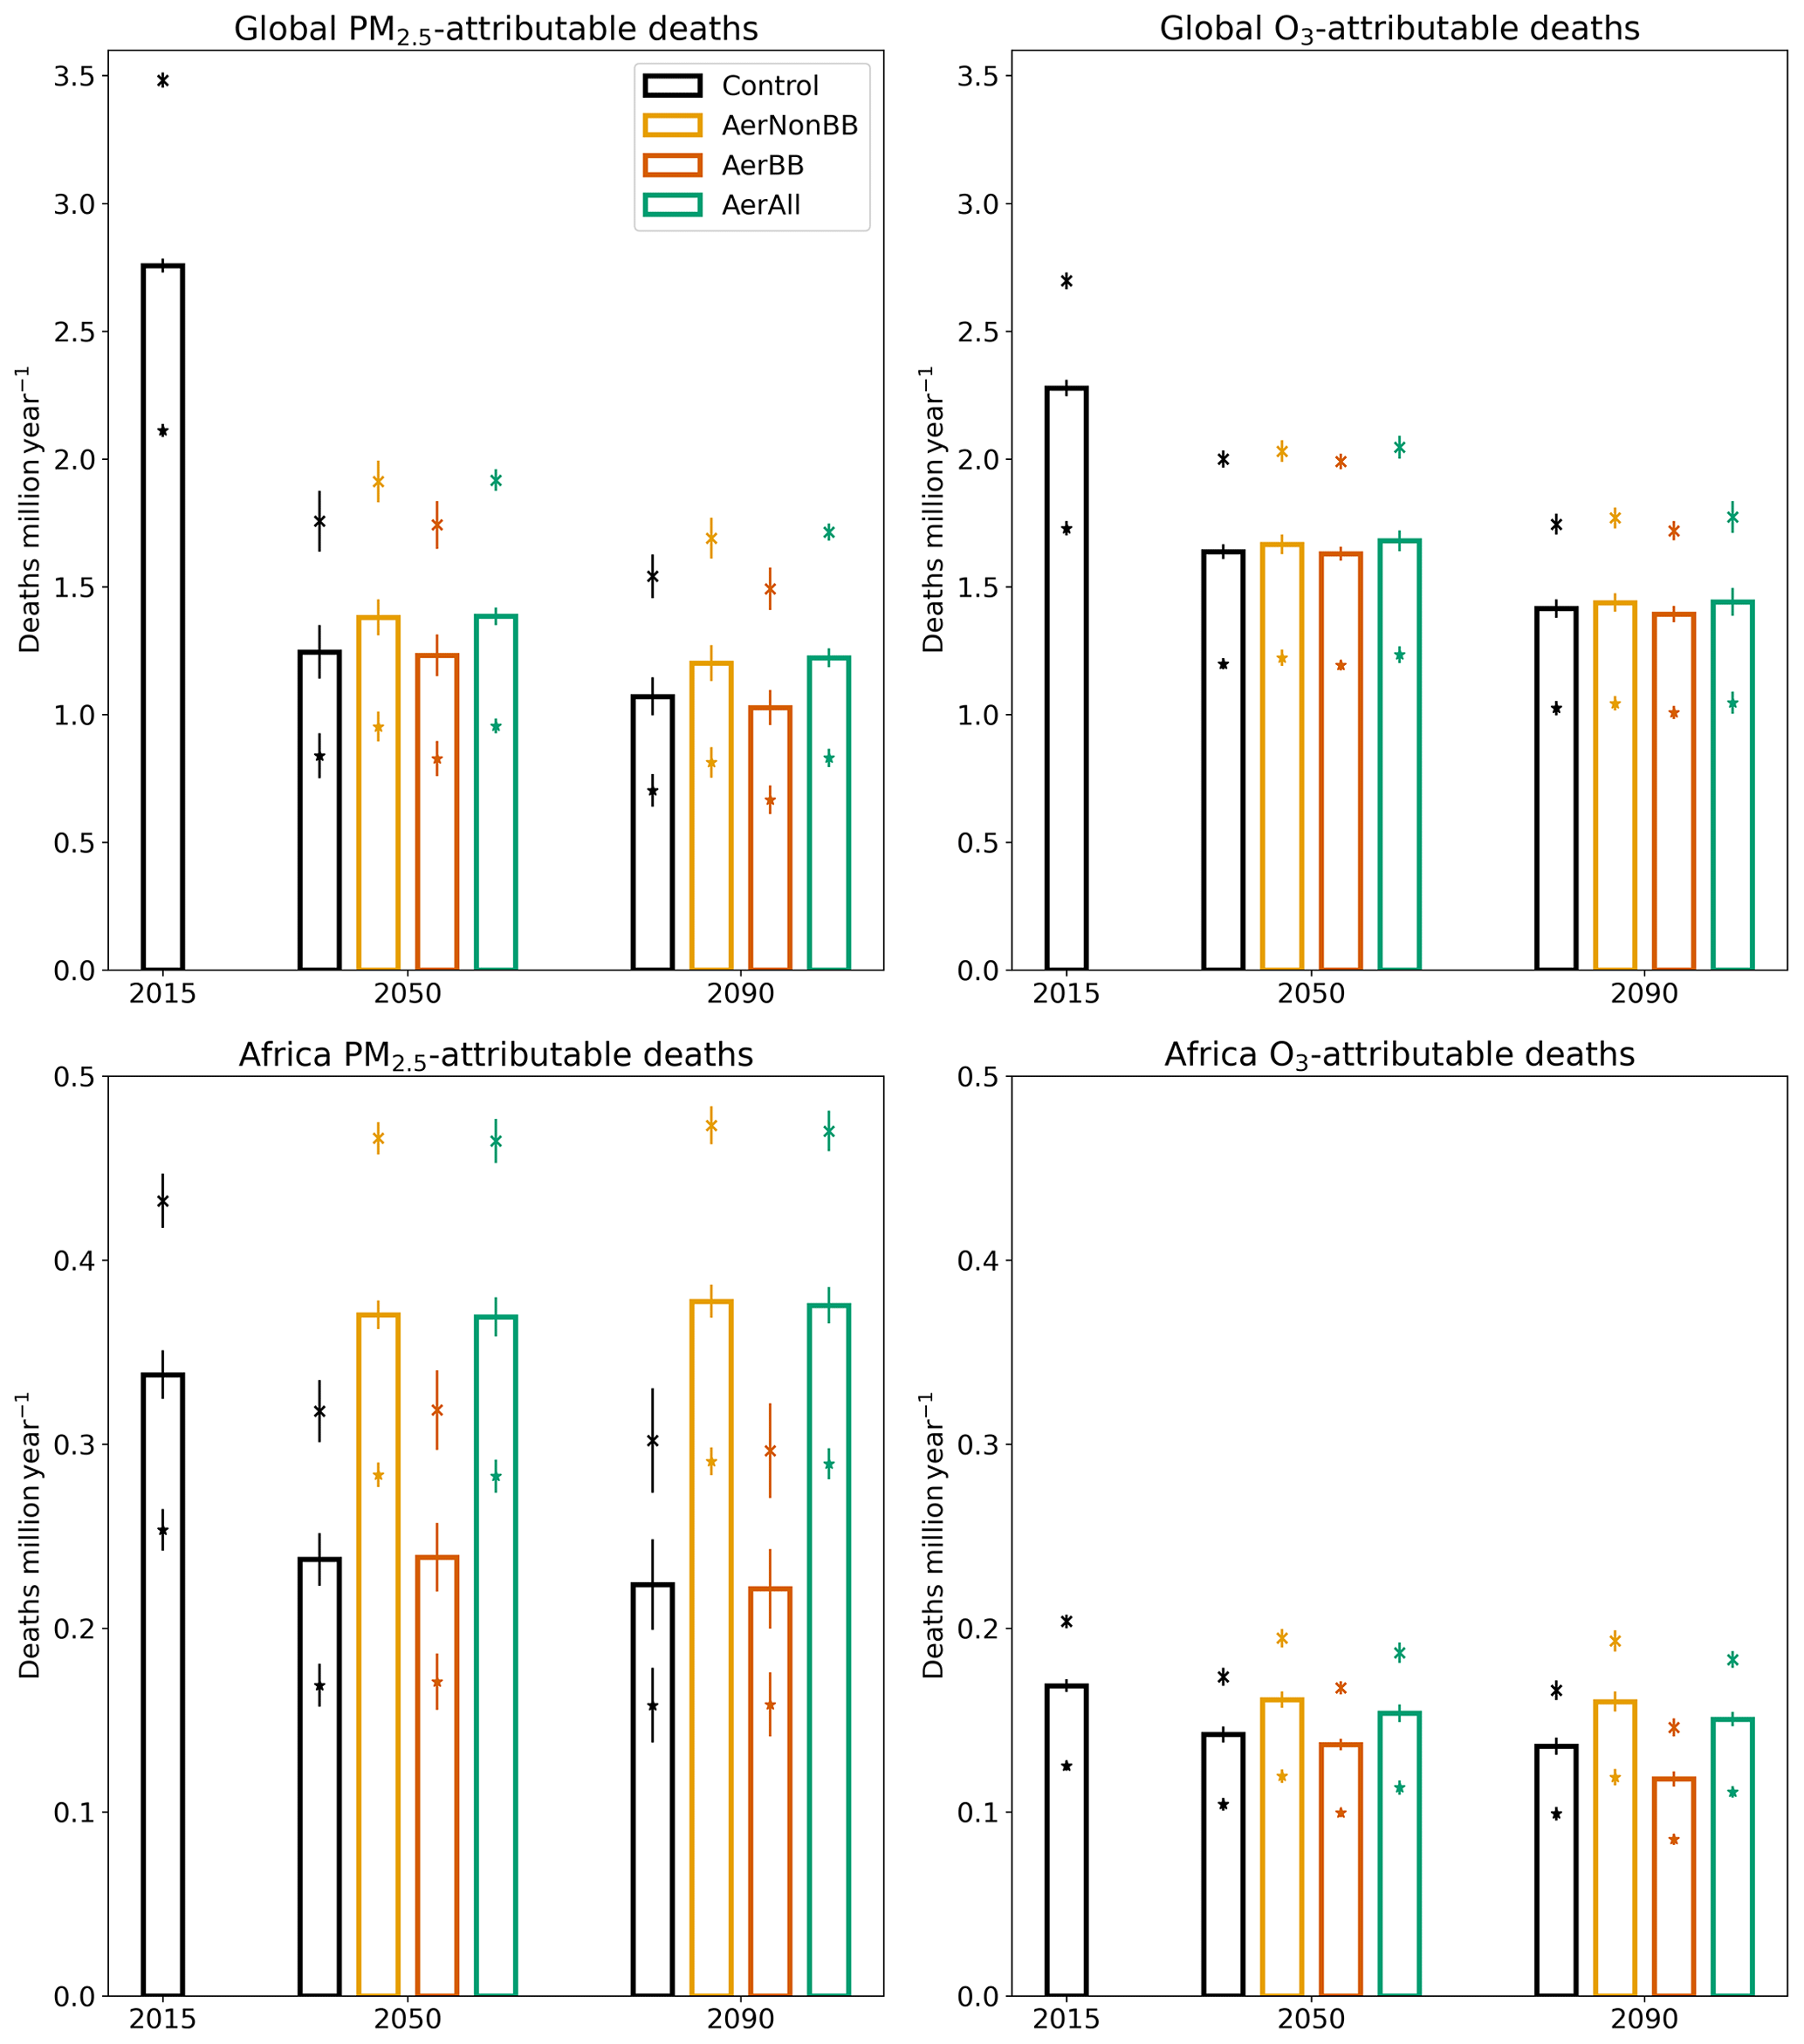
Figure 3Annual PM2.5- and O3-attributable deaths in the control in 2015 and each scenario in 2050 and 2090, globally and over Africa, using 2015 spatial and age-based population distributions. The bars indicate the estimated deaths using the central CRF estimates; the crosses and stars use the 95th and 5th percentile CRF values respectively. For each CRF value, the (much smaller) uncertainty due to intra-ensemble variation in pollutant concentrations is indicated with vertical error bars. This intra-ensemble variation is defined as the estimated 5th–95th percentile range across the 10 control ensemble members, calculated as the standard deviation multiplied by 1.6449. The African region definition is shown in Fig. S2.
This study used the Earth system model UKESM1 to explore the range of impacts from future African pollutant emissions on air quality and premature mortality. Compared to SSP119, SSP370 has much higher fossil fuel and biofuel emissions but lower African biomass burning emissions; the reasons for this are unclear and reflect methodological challenges within the SSP framework. The increase in non-biomass emissions far outweighs the decrease in biomass emissions, particularly over population centres. To evaluate the human health impacts of the future emissions, CRFs were used from the recent GBD2019 study (GBD 2019 Risk Factors Collaborators, 2020) for six COD for PM2.5 and Turner et al. (2016) for O3 respiratory impacts. Estimates were calculated using present-day demographics to isolate the effect of changes in pollutants on a given population.
The methodology of this study is not directly comparable to comprehensive estimates of the present-day impact of air pollution, since only one model with no bias correction is used here; the focus of the analysis is on the differences between scenarios instead. However, the magnitude of the estimated impacts can be contextualised against prior studies to explore the effect of these methodological differences. Our estimate for total PM2.5-related deaths in 2015, of 2.76 (2.11–3.48) million, is generally lower than prior studies; its central estimate is lower than some (Lelieveld et al., 2019; Vohra et al., 2021; IHME, 2020; Im et al., 2023; Bauer et al., 2019) and higher than at least one other (Partanen et al., 2018). GBD2019 found higher impacts than those found here, using the same CRFs but different PM2.5 concentrations, and also including neonatal deaths. The dominance of the uncertainties in CRF over those in PM2.5 concentrations is consistent with prior research (Shindell et al., 2018).
The number of present-day respiratory deaths attributed here to O3 exposure (2.28 (1.73–2.70) million) is generally higher than found in previous studies, e.g. Anenberg et al. (2010) and Silva et al. (2016), which both used an earlier CRF reflecting weaker associations between O3 and health impacts (Jerrett et al., 2009) than that used here. Studies utilising the CRFs used in this study (Turner et al., 2016) also find lower numbers of deaths than estimated here (Shindell et al., 2018; GBD 2019 Risk Factors Collaborators, 2020; Malley et al., 2017), likely due to higher O3 concentrations in UKESM1 (see Sect. 2.1), but sparse observations preclude a full evaluation. The estimated O3 impacts were not very sensitive to changes in the LCT. The uncertainty in deaths due to the uncertainty within each CRF (Table 1) is far larger than that from intra-ensemble pollutant variations for both PM2.5 and O3, consistent with prior studies determining the CRF to be the largest source of uncertainty (Turnock et al., 2016; Johnston et al., 2012; Li et al., 2016; Shindell et al., 2018).
The effect of Africa following SSP370 rather than SSP119 is estimated to result in 150 000 additional annual deaths from PM2.5 and 15 000 from O3, across Africa in 2090, when using 2015 populations. Due to the large decrease in aerosol emissions in SSP119, annual PM2.5 deaths could be similar to those due to O3 by the end of the century. However, this result may also be affected by the O3 biases.
Correcting for model biases in PM2.5 and O3 concentrations in a CMIP6 model with low-biased concentrations was found to substantially affect estimated health impacts (Im et al., 2023), though this effect was strongest over high-emission regions and dampened when using more recent non-linear CRFs. The results of the scenarios in this study should therefore be primarily interpreted relative to each other, as the substantial differences between scenarios are less affected by the model biases.
Present-day populations were used in this study to isolate the effect of changes in air pollutants alone and because of the difficulties in projecting changes in mortality rates. Increasing and ageing future populations will lead to higher estimated deaths and hence larger reductions in deaths upon emission mitigation. In SSP1, the present-day African population of 1 billion increases to around 1.7 bn by 2070, before declining slightly; in SSP3, it increases throughout the century, reaching 4 bn by 2090 (Lutz et al., 2018). Projected urbanisation (Jiang and O'Neill, 2017) will increase the co-location of population centres and emissions, increasing the human health impacts of air pollution (Silva et al., 2017). This co-location is already dampened by the coarse-model grid, which reduces the estimated impacts (Li et al., 2016; Likhvar et al., 2015), an effect which will be more pronounced for PM2.5 than for ozone (Malley et al., 2017). Prior work has found changes in populations play a comparable role to those in emissions in the SSPs (Im et al., 2023), though this estimate assumed the persistence of present-day baseline mortality rates.
Relatively higher non-BB aerosol south of the Sahara weakened the local surface circulation, reducing dust emissions sufficiently to reduce overall PM2.5 levels (and hence deaths) in some areas, demonstrating the importance of accounting for natural aerosols and circulation impacts when estimating the impacts of emission changes (Bauer et al., 2019; Yang et al., 2017). This effect will likely vary substantially between models, due to differing aerosol impacts and parameterisations of dust emissions.
The CRFs used in this study are generated by combining multiple cohort studies (GBD 2019 Risk Factors Collaborators, 2020). The more recent CRFs used here cover a wider range of air pollutant concentrations than those in earlier studies, but there are still limitations in the representativeness of the input data used to generate the CRFs, stemming from structural and historic challenges in air pollution research in Africa (Abera et al., 2021; Katoto et al., 2019; Coker and Kizito, 2018; Pinder et al., 2019). Further research characterising appropriate CRFs for use in disparate regions is essential to generate more reliable estimates of air pollution impacts. If BC has a higher toxicity (Lelieveld et al., 2015; Coker and Kizito, 2018), future air pollutant impacts per unit change in PM2.5 concentrations would be reduced as the BC share of PM2.5 declines and the effect of PM2.5 mitigation therefore enhanced.
UKESM1's horizontal resolution is coarser than the relevant scales for localised air pollutants from different sources, as the distinction between rural/urban and emissions from vehicles, factories, and domestic fuel is dampened by averaging across the model grid cells. Global models are incapable of resolving these distinctions, which are of relevance for policy and behavioural considerations. Models of this resolution still clearly resolve distinctions between high- and low-air-pollutant regions (Fig. 1), and this method has been applied in many prior studies, often at coarser resolutions, to generate understandings of the global mortality impact of air pollution (Shindell et al., 2018; Lelieveld et al., 2019, 2013; Vohra et al., 2021; Silva et al., 2016; Partanen et al., 2018; Anenberg et al., 2010; Silva et al., 2017).
Pollutant concentrations from single years were used to estimate the health impacts (see Sect. 2). While the intra-ensemble mean was used, the variation in the concentrations manifests in large variations in the projected impacts over heavily populated regions, which had no emission change in our experiments, such as in Asia.
The effect of different future African emission pathways on human health is large; reductions in the anthropogenic African aerosol emissions through climate mitigation within the range of the SSPs can reduce annual deaths by 150 000 for PM2.5 and 15 000 for O3, compared to a more polluted pathway, using present-day demographics. These values can be expected to be larger under future increasing and ageing populations. These results are focused on 2090, but the rapid emission drop in SSP119 suggests that significant benefits would occur much faster under such a scenario. Substantial near-term localised reductions in the impacts of air pollution could therefore be obtained as co-benefits of climate change mitigation in Africa.
Reasonable requests for model output and the data used for figures in this article can be made to the corresponding author.
The supplement related to this article is available online at: https://doi.org/10.5194/acp-24-1025-2024-supplement.
AV and CDW conceived and designed the experiments. CDW carried out the analysis, with assistance from MK and ME, and led the preparation of the paper. All authors provided discussion of the analysis and reviewed the paper.
The contact author has declared that none of the authors has any competing interests.
Publisher’s note: Copernicus Publications remains neutral with regard to jurisdictional claims made in the text, published maps, institutional affiliations, or any other geographical representation in this paper. While Copernicus Publications makes every effort to include appropriate place names, the final responsibility lies with the authors.
Simulations with UKESM1 were performed using the Monsoon2 system, a collaborative facility supplied under the Joint Weather and Climate Research Programme, which is a strategic partnership between the Met Office and the Natural Environment Research Council.
This work has been supported by the Natural Environment Research Council (grant no. NE/L002515/1). Apostolos Voulgarakis and Matthew Kasoar have received funding from the Leverhulme Trust (grant no. RC-2018-023) through the Leverhulme Centre for Wildfires, Environment and Society. Apostolos Voulgarakis has also been supported by the AXA Research Fund (project “AXA Chair in Wildfires and Climate”) and by the Hellenic Foundation for Research and Innovation (grant no. 3453).
This paper was edited by Bryan N. Duncan and reviewed by three anonymous referees.
Abera, A., Friberg, J., Isaxon, C., Jerrett, M., Malmqvist, E., Sjöström, C., Taj, T., and Vargas, A. M.: Air Quality in Africa: Public Health Implications, Annu. Rev. Publ. Health, 42, 193–210, https://doi.org/10.1146/annurev-publhealth-100119-113802, 2021.
Allen, R. J., Horowitz, L. W., Naik, V., Oshima, N., O'Connor, F. M., Turnock, S., Shim, S., le Sager, P., van Noije, T., Tsigaridis, K., Bauer, S. E., Sentman, L. T., John, J. G., Broderick, C., Deushi, M., Folberth, G. A., Fujimori, S., and Collins, W. J.: Significant climate benefits from near-term climate forcer mitigation in spite of aerosol reductions, Environ. Res. Lett., 16, 034010, https://doi.org/10.1088/1748-9326/abe06b, 2021.
Anenberg, S. C., Horowitz, L. W., Tong, D. Q., and West, J. J.: An estimate of the global burden of anthropogenic ozone and fine particulate matter on premature human mortality using atmospheric modeling, Environ. Health Persp., 118, 1189–1195, https://doi.org/10.1289/ehp.0901220, 2010.
Archibald, A. T., O'Connor, F. M., Abraham, N. L., Archer-Nicholls, S., Chipperfield, M. P., Dalvi, M., Folberth, G. A., Dennison, F., Dhomse, S. S., Griffiths, P. T., Hardacre, C., Hewitt, A. J., Hill, R. S., Johnson, C. E., Keeble, J., Köhler, M. O., Morgenstern, O., Mulcahy, J. P., Ordóñez, C., Pope, R. J., Rumbold, S. T., Russo, M. R., Savage, N. H., Sellar, A., Stringer, M., Turnock, S. T., Wild, O., and Zeng, G.: Description and evaluation of the UKCA stratosphere–troposphere chemistry scheme (StratTrop vn 1.0) implemented in UKESM1, Geosci. Model Dev., 13, 1223–1266, https://doi.org/10.5194/gmd-13-1223-2020, 2020.
Bauer, S. E., Im, U., Mezuman, K., and Gao, C. Y.: Desert Dust, Industrialization, and Agricultural Fires: Health Impacts of Outdoor Air Pollution in Africa, J. Geophys. Res.-Atmos., 124, 4104–4120, https://doi.org/10.1029/2018JD029336, 2019.
Bellouin, N., Rae, J., Jones, A., Johnson, C., Haywood, J., and Boucher, O.: Aerosol forcing in the Climate Model Intercomparison Project (CMIP5) simulations by HadGEM2-ES and the role of ammonium nitrate, J. Geophys. Res.-Atmos., 116, 20206, https://doi.org/10.1029/2011JD016074, 2011.
Bellouin, N., Mann, G. W., Woodhouse, M. T., Johnson, C., Carslaw, K. S., and Dalvi, M.: Impact of the modal aerosol scheme GLOMAP-mode on aerosol forcing in the Hadley Centre Global Environmental Model, Atmos. Chem. Phys., 13, 3027–3044, https://doi.org/10.5194/acp-13-3027-2013, 2013.
Burnett, R., Chen, H., Szyszkowicza, M., Fann, N., Hubbell, B., Pope III, C. A., Apte, J. S., Brauer, M., Cohen, A., Weichenthal, S., Coggins, J., Di, Q., Brunekreef, B., Frostad, J., Lim, S. S., Kan, H., Walker, K. D., Thurston, G. D., Hayes, R. B., Lim, C. C., Turner, M. C., Jerrett, M., Krewski, D., Gapstur, S. M., Diver, W. R., Ostro, B., Goldberg, D., Crouse, D. L., Martin, R. V., Peters, P., Pinault, L., Tjepkema, M., van Donkelaar, A., Villeneuve, P. J., Miller, A. B., Yin, P., Zhou, M., Wang, L., Janssen, N. A. H., Marra, M., Atkinson, R. W., Tsang, H., Quoc Thach, T., Cannon, J. B., Allen, R. T., Hart, J. E., Laden, F., Cesaroni, G., Forastiere, F., Weinmayr, G., Jaensch, A., Nagel, G., Concin, H., and Spadaro, J. V.: Global estimates of mortality associated with long-term exposure to outdoor fine particulate matter, P. Natl. Acad. Sci. USA, 115, 9592–9597, https://doi.org/10.1073/pnas.1803222115, 2018.
Burnett, R. T., Pope, C. A., Ezzati, M., Olives, C., Lim, S. S., Mehta, S., Shin, H. H., Singh, G., Hubbell, B., Brauer, M., Anderson, H. R., Smith, K. R., Balmes, J. R., Bruce, N. G., Kan, H., Laden, F., Prüss-Ustün, A., Turner, M. C., Gapstur, S. M., Diver, W. R., and Cohen, A.: An integrated risk function for estimating the global burden of disease attributable to ambient fine particulate matter exposure, Environ. Health Persp., 122, 397–403, https://doi.org/10.1289/ehp.1307049, 2014.
Chen, J. and Hoek, G.: Long-term exposure to PM and all-cause and cause-specific mortality: A systematic review and meta-analysis, Environ. Int., 143, 105974, https://doi.org/10.1016/j.envint.2020.105974, 2020.
CIESIN: Gridded Population of the World, Version 4 (GPWv4): Administrative Unit Center Points with Population Estimates, Revision 11, Center for International Earth Science Information Network (CIESIN), https://doi.org/10.7927/H4BC3WMT, 2018.
Coker, E. and Kizito, S.: A Narrative Review on the Human Health Effects of Ambient Air Pollution in Sub-Saharan Africa: An Urgent Need for Health Effects Studies, Int. J. Env. Res. Pub. He., 15, 427, https://doi.org/10.3390/ijerph15030427, 2018.
Ezzati, M., Lopez, A. D., Rogers, A., and Murray, C. J. L.: Comparative Quantification of Health Risks: Global and Regional Burden of Disease Attributable to Selected Major Risk Factors, World Health Organization, ISBN 9241580313, 2004.
Fujimori, S., Hasegawa, T., Masui, T., Takahashi, K., Herran, D. S., Dai, H., Hijioka, Y., and Kainuma, M.: SSP3: AIM implementation of Shared Socioeconomic Pathways, Global Environ. Change, 42, 268–283, https://doi.org/10.1016/j.gloenvcha.2016.06.009, 2017.
GBD 2019 Risk Factors Collaborators: Global burden of 87 risk factors in 204 countries and territories, 1990–2019: a systematic analysis for the Global Burden of Disease Study 2019, Lancet, 396, 1223–1249, https://doi.org/10.1016/S0140-6736(20)30752-2, 2020.
Gidden, M., Riahi, K., Smith, S., Fujimori, S., Luderer, G., Kriegler, E., van Vuuren, D., van den Berg, M., Feng, L., Klein, D., Calvin, K., Doelman, J., Frank, S., Fricko, O., Harmsen, M., Hasegawa, T., Havlik, P., Hilaire, J., Hoesly, R., Horing, J., Popp, A., Stehfest, E., and Takahashi, K.: input4MIPs.CMIP6.ScenarioMIP.IAMC.IAMC-IMAGE-ssp119-1-1, Earth System Grid Federation, https://doi.org/10.22033/ESGF/input4MIPs.2485, 2018.
Gidden, M. J., Riahi, K., Smith, S. J., Fujimori, S., Luderer, G., Kriegler, E., van Vuuren, D. P., van den Berg, M., Feng, L., Klein, D., Calvin, K., Doelman, J. C., Frank, S., Fricko, O., Harmsen, M., Hasegawa, T., Havlik, P., Hilaire, J., Hoesly, R., Horing, J., Popp, A., Stehfest, E., and Takahashi, K.: Global emissions pathways under different socioeconomic scenarios for use in CMIP6: a dataset of harmonized emissions trajectories through the end of the century, Geosci. Model Dev., 12, 1443–1475, https://doi.org/10.5194/gmd-12-1443-2019, 2019.
Gliß, J., Mortier, A., Schulz, M., Andrews, E., Balkanski, Y., Bauer, S. E., Benedictow, A. M. K., Bian, H., Checa-Garcia, R., Chin, M., Ginoux, P., Griesfeller, J. J., Heckel, A., Kipling, Z., Kirkevåg, A., Kokkola, H., Laj, P., Le Sager, P., Lund, M. T., Lund Myhre, C., Matsui, H., Myhre, G., Neubauer, D., van Noije, T., North, P., Olivié, D. J. L., Rémy, S., Sogacheva, L., Takemura, T., Tsigaridis, K., and Tsyro, S. G.: AeroCom phase III multi-model evaluation of the aerosol life cycle and optical properties using ground- and space-based remote sensing as well as surface in situ observations, Atmos. Chem. Phys., 21, 87–128, https://doi.org/10.5194/acp-21-87-2021, 2021.
IHME: GBD Compare Data Visualization, Institute for Health Metrics and Evaluation (IHME), http://vizhub.healthdata.org/gbd-compare (last access: 19 January 2024), 2020.
Im, U., Bauer, S. E., Frohn, L. M., Geels, C., Tsigaridis, K., and Brandt, J.: Present-day and future PM2.5 and O3-related global and regional premature mortality in the EVAv6.0 health impact assessment model, Environ. Res., 216, 114702, https://doi.org/10.1016/j.envres.2022.114702, 2023.
Jerrett, M., Burnett, R. T., Pope III, C. A., Ito, K., Thurston, G., Krewski, D., Shi, Y., Calle, E., and Thun, M.: Long-Term Ozone Exposure and Mortality, New Engl. J. Med., 360, 1085–1095, https://doi.org/10.1038/jid.2014.371, 2009.
Jiang, L. and O'Neill, B. C.: Global urbanization projections for the Shared Socioeconomic Pathways, Global Environ. Change, 42, 193–199, https://doi.org/10.1016/J.GLOENVCHA.2015.03.008, 2017.
Johnston, F. H., Henderson, S. B., Chen, Y., Randerson, J. T., Marlier, M., DeFries, R. S., Kinney, P., Bowman, D. M. J. S., and Brauer, M.: Estimated global mortality attributable to smoke from landscape fires, Environ. Health Persp., 120, 695–701, https://doi.org/10.1289/ehp.1104422, 2012.
Kasoar, M., Shawki, D., and Voulgarakis, A.: Similar spatial patterns of global climate response to aerosols from different regions, NPJ Clim. Atmos. Sci., 1, 12, https://doi.org/10.1038/s41612-018-0022-z, 2018.
Katoto, P. D. M. C., Byamungu, L., Brand, A. S., Mokaya, J., Strijdom, H., Goswami, N., De Boever, P., Nawrot, T. S., and Nemery, B.: Ambient air pollution and health in Sub-Saharan Africa: Current evidence, perspectives and a call to action, Environ. Res., 173, 174–188, https://doi.org/10.1016/j.envres.2019.03.029, 2019.
Lelieveld, J., Barlas, C., Giannadaki, D., and Pozzer, A.: Model calculated global, regional and megacity premature mortality due to air pollution, Atmos. Chem. Phys., 13, 7023–7037, https://doi.org/10.5194/acp-13-7023-2013, 2013.
Lelieveld, J., Evans, J. S., Fnais, M., Giannadaki, D., and Pozzer, A.: The contribution of outdoor air pollution sources to premature mortality on a global scale, Nature, 525, 367–371, https://doi.org/10.1038/nature15371, 2015.
Lelieveld, J., Klingmüller, K., Pozzer, A., Burnett, R. T., Haines, A., and Ramanathan, V.: Effects of fossil fuel and total anthropogenic emission removal on public health and climate, P. Natl. Acad. Sci. USA, 116, 7192–7197, https://doi.org/10.1073/pnas.1819989116, 2019.
Li, Y., Henze, D. K., Jack, D., and Kinney, P. L.: The influence of air quality model resolution on health impact assessment for fine particulate matter and its components, Air Qual. Atmos. Hlth., 9, 51–68, https://doi.org/10.1007/s11869-015-0321-z, 2016.
Likhvar, V. N., Pascal, M., Markakis, K., Colette, A., Hauglustaine, D., Valari, M., Klimont, Z., Medina, S., and Kinney, P.: A multi-scale health impact assessment of air pollution over the 21st century, Sci. Total Environ., 514, 439–449, https://doi.org/10.1016/j.scitotenv.2015.02.002, 2015.
Liu, L., Shawki, D., Voulgarakis, A., Kasoar, M., Samset, B. H., Myhre, G., Forster, P. M., Hodnebrog, Sillmann, J., Aalbergsjø, S. G., Boucher, O., Faluvegi, G., Iversen, T., Kirkevåg, A., Lamarque, J. F., Olivié, D., Richardson, T., Shindell, D., and Takemura, T.: A PDRMIP Multimodel study on the impacts of regional aerosol forcings on global and regional precipitation, J. Climate, 31, 4429–4447, https://doi.org/10.1175/JCLI-D-17-0439.1, 2018.
Lutz, W. , Goujon, A., Samir, K. C., Stonawski, M., and Stilianakis, N.: Demographic and Human Capital Scenarios for the 21st Century: 2018 assessment for 201 countries, Publications Office of the European Union, Luxembourg, https://doi.org/10.2760/41776, 2018.
Malley, C. S., Henze, D. K., Kuylenstierna, J. C. I., Vallack, H. W., Davila, Y., Anenberg, S. C., Turner, M. C., and Ashmore, M. R.: Updated global estimates of respiratory mortality in adults ≥30 years of age attributable to long-term ozone exposure, Environ. Health Persp., 125, 087021, https://doi.org/10.1289/EHP1390, 2017.
Mann, G. W., Carslaw, K. S., Spracklen, D. V., Ridley, D. A., Manktelow, P. T., Chipperfield, M. P., Pickering, S. J., and Johnson, C. E.: Description and evaluation of GLOMAP-mode: a modal global aerosol microphysics model for the UKCA composition-climate model, Geosci. Model Dev., 3, 519–551, https://doi.org/10.5194/gmd-3-519-2010, 2010.
Mansournia, M. A. and Altman, D. G.: Population attributable fraction, BMJ, 360, k757, https://doi.org/10.1136/BMJ.K757, 2018.
Mulcahy, J. P., Johnson, C., Jones, C. G., Povey, A. C., Scott, C. E., Sellar, A., Turnock, S. T., Woodhouse, M. T., Abraham, N. L., Andrews, M. B., Bellouin, N., Browse, J., Carslaw, K. S., Dalvi, M., Folberth, G. A., Glover, M., Grosvenor, D. P., Hardacre, C., Hill, R., Johnson, B., Jones, A., Kipling, Z., Mann, G., Mollard, J., O'Connor, F. M., Palmiéri, J., Reddington, C., Rumbold, S. T., Richardson, M., Schutgens, N. A. J., Stier, P., Stringer, M., Tang, Y., Walton, J., Woodward, S., and Yool, A.: Description and evaluation of aerosol in UKESM1 and HadGEM3-GC3.1 CMIP6 historical simulations, Geosci. Model Dev., 13, 6383–6423, https://doi.org/10.5194/gmd-13-6383-2020, 2020.
O'Neill, B. C., Kriegler, E., Ebi, K. L., Kemp-Benedict, E., Riahi, K., Rothman, D. S., van Ruijven, B. J., van Vuuren, D. P., Birkmann, J., Kok, K., Levy, M., and Solecki, W.: The roads ahead: Narratives for shared socioeconomic pathways describing world futures in the 21st century, Global Environ. Change, 42, 169–180, https://doi.org/10.1016/j.gloenvcha.2015.01.004, 2017.
Partanen, A.-I., Landry, J.-S., and Matthews, D.: Climate and health implications of future aerosol emission scenarios, Environ. Res. Lett., 13, 024028, https://doi.org/10.1088/1748-9326/aaa511, 2018.
Persad, G. G. and Caldeira, K.: Divergent global-scale temperature effects from identical aerosols emitted in different regions, Nat. Commun., 9, 3289, https://doi.org/10.1038/s41467-018-05838-6, 2018.
Pinder, R. W., Klopp, J. M., Kleiman, G., Hagler, G. S. W., Awe, Y., and Terry, S.: Opportunities and challenges for filling the air quality data gap in low- and middle-income countries, Atmos. Environ., 215, 116794, https://doi.org/10.1016/j.atmosenv.2019.06.032, 2019.
Pope III, C. A., Burnett, R. T., Thun, M. J., Calle, E. E., Krewski, D., Ito, K., and Thurston, G. D.: Lung Cancer, Cardiopulmonary Mortality, and Long-term Exposure to Fine Particulate Air Pollution, JAMA, 287, 1132–1141, https://doi.org/10.1001/jama.287.9.1132, 2002.
Pope III, C. A., Burnett, R. T., Krewski, D., Jerrett, M., Shi, Y., Calle, E. E., and Thun, M. J.: Cardiovascular Mortality and Exposure to Airborne Fine Particulate Matter and Cigarette Smoke, Circulation, 120, 941–948, https://doi.org/10.1161/circulationaha.109.857888, 2009.
Sandvik, B.: World Borders Dataset, Thematic Mapping, https://thematicmapping.org/downloads/world_borders.php (last access: 19 January 2024), 2008.
Schucht, S., Colette, A., Rao, S., Holland, M., Schöpp, W., Kolp, P., Klimont, Z., Bessagnet, B., Szopa, S., Vautard, R., Brignon, J.-M., and Rouïl, L.: Moving towards ambitious climate policies: Monetised health benefits from improved air quality could offset mitigation costs in Europe, Environ. Sci. Policy, 50, 252–269, https://doi.org/10.1016/j.envsci.2015.03.001, 2015.
Sellar, A. A., Jones, C. G., Mulcahy, J. P., Tang, Y., Yool, A., Wiltshire, A., O'Connor, F. M., Stringer, M., Hill, R., Palmieri, J., Woodward, S., de Mora, L., Kuhlbrodt, T., Rumbold, S. T., Kelley, D. I., Ellis, R., Johnson, C. E., Walton, J., Abraham, N. L., Andrews, M. B., Andrews, T., Archibald, A. T., Berthou, S., Burke, E., Blockley, E., Carslaw, K., Dalvi, M., Edwards, J., Folberth, G. A., Gedney, N., Griffiths, P. T., Harper, A. B., Hendry, M. A., Hewitt, A. J., Johnson, B., Jones, A., Jones, C. D., Keeble, J., Liddicoat, S., Morgenstern, O., Parker, R. J., Predoi, V., Robertson, E., Siahaan, A., Smith, R. S., Swaminathan, R., Woodhouse, M. T., Zeng, G., and Zerroukat, M.: UKESM1: Description and Evaluation of the U.K. Earth System Model, J. Adv. Model. Earth Sy., 11, 4513–4558, https://doi.org/10.1029/2019MS001739, 2019.
Shawki, D., Voulgarakis, A., Chakraborty, A., Kasoar, M., and Srinivasan, J.: The South Asian Monsoon Response to Remote Aerosols: Global and Regional Mechanisms, J. Geophys. Res.-Atmos., 123, 11511–11601, https://doi.org/10.1029/2018JD028623, 2018.
Shindell, D., Faluvegi, G., Seltzer, K., and Shindell, C.: Quantified, localized health benefits of accelerated carbon dioxide emissions reductions, Nat. Clim. Change, 8, 291–295, https://doi.org/10.1038/s41558-018-0108-y, 2018.
Silva, R. A., West, J. J., Zhang, Y., Anenberg, S. C., Lamarque, J. F., Shindell, D. T., Collins, W. J., Dalsoren, S., Faluvegi, G., Folberth, G., Horowitz, L. W., Nagashima, T., Naik, V., Rumbold, S., Skeie, R., Sudo, K., Takemura, T., Bergmann, D., Cameron-Smith, P., Cionni, I., Doherty, R. M., Eyring, V., Josse, B., Mackenzie, I. A., Plummer, D., Righi, M., Stevenson, D. S., Strode, S., Szopa, S., and Zeng, G.: Global premature mortality due to anthropogenic outdoor air pollution and the contribution of past climate change, Environ. Res. Lett., 8, 034005, https://doi.org/10.1088/1748-9326/8/3/034005, 2013.
Silva, R. A., West, J. J., Lamarque, J.-F., Shindell, D. T., Collins, W. J., Dalsoren, S., Faluvegi, G., Folberth, G., Horowitz, L. W., Nagashima, T., Naik, V., Rumbold, S. T., Sudo, K., Takemura, T., Bergmann, D., Cameron-Smith, P., Cionni, I., Doherty, R. M., Eyring, V., Josse, B., MacKenzie, I. A., Plummer, D., Righi, M., Stevenson, D. S., Strode, S., Szopa, S., and Zengast, G.: The effect of future ambient air pollution on human premature mortality to 2100 using output from the ACCMIP model ensemble, Atmos. Chem. Phys., 16, 9847–9862, https://doi.org/10.5194/acp-16-9847-2016, 2016.
Silva, R. A., West, J. J., Lamarque, J. F., Shindell, D. T., Collins, W. J., Faluvegi, G., Folberth, G. A., Horowitz, L. W., Nagashima, T., Naik, V., Rumbold, S. T., Sudo, K., Takemura, T., Bergmann, D., Cameron-Smith, P., Doherty, R. M., Josse, B., MacKenzie, I. A., Stevenson, D. S., and Zeng, G.: Future global mortality from changes in air pollution attributable to climate change, Nat. Clim. Change, 7, 647–651, https://doi.org/10.1038/nclimate3354, 2017.
Smith, C. J., Kramer, R. J., Myhre, G., Alterskjær, K., Collins, W., Sima, A., Boucher, O., Dufresne, J.-L., Nabat, P., Michou, M., Yukimoto, S., Cole, J., Paynter, D., Shiogama, H., O'Connor, F. M., Robertson, E., Wiltshire, A., Andrews, T., Hannay, C., Miller, R., Nazarenko, L., Kirkevåg, A., Olivié, D., Fiedler, S., Lewinschal, A., Mackallah, C., Dix, M., Pincus, R., and Forster, P. M.: Effective radiative forcing and adjustments in CMIP6 models, Atmos. Chem. Phys., 20, 9591–9618, https://doi.org/10.5194/acp-20-9591-2020, 2020.
Smith, K. R. and Peel, J. L.: Mind the gap, Environ. Health Persp., 118, 1643–1645, https://doi.org/10.1038/s41587-019-0141-z, 2010.
Tebaldi, C., Debeire, K., Eyring, V., Fischer, E., Fyfe, J., Friedlingstein, P., Knutti, R., Lowe, J., O'Neill, B., Sanderson, B., van Vuuren, D., Riahi, K., Meinshausen, M., Nicholls, Z., Tokarska, K. B., Hurtt, G., Kriegler, E., Lamarque, J.-F., Meehl, G., Moss, R., Bauer, S. E., Boucher, O., Brovkin, V., Byun, Y.-H., Dix, M., Gualdi, S., Guo, H., John, J. G., Kharin, S., Kim, Y., Koshiro, T., Ma, L., Olivié, D., Panickal, S., Qiao, F., Rong, X., Rosenbloom, N., Schupfner, M., Séférian, R., Sellar, A., Semmler, T., Shi, X., Song, Z., Steger, C., Stouffer, R., Swart, N., Tachiiri, K., Tang, Q., Tatebe, H., Voldoire, A., Volodin, E., Wyser, K., Xin, X., Yang, S., Yu, Y., and Ziehn, T.: Climate model projections from the Scenario Model Intercomparison Project (ScenarioMIP) of CMIP6, Earth Syst. Dynam., 12, 253–293, https://doi.org/10.5194/esd-12-253-2021, 2021.
Thornhill, G. D., Collins, W. J., Kramer, R. J., Olivié, D., Skeie, R. B., O'Connor, F. M., Abraham, N. L., Checa-Garcia, R., Bauer, S. E., Deushi, M., Emmons, L. K., Forster, P. M., Horowitz, L. W., Johnson, B., Keeble, J., Lamarque, J.-F., Michou, M., Mills, M. J., Mulcahy, J. P., Myhre, G., Nabat, P., Naik, V., Oshima, N., Schulz, M., Smith, C. J., Takemura, T., Tilmes, S., Wu, T., Zeng, G., and Zhang, J.: Effective radiative forcing from emissions of reactive gases and aerosols – a multi-model comparison, Atmos. Chem. Phys., 21, 853–874, https://doi.org/10.5194/acp-21-853-2021, 2021.
Turner, M. C., Jerrett, M., Pope, C. A., Krewski, D., Gapstur, S. M., Diver, W. R., Beckerman, B. S., Marshall, J. D., Su, J., Crouse, D. L., and Burnett, R. T.: Long-Term Ozone Exposure and Mortality in a Large Prospective Study, Am. J. Resp. Crit. Care, 193, 1134–1142, https://doi.org/10.1164/rccm.201508-1633OC, 2016.
Turnock, S. T., Butt, E. W., Richardson, T. B., Mann, G. W., Reddington, C. L., Forster, P. M., Haywood, J., Crippa, M., Janssens-Maenhout, G., Johnson, C. E., Bellouin, N., Carslaw, K. S., and Spracklen, D. V.: The impact of European legislative and technology measures to reduce air pollutants on air quality, human health and climate, Environ. Res. Lett., 11, 024010, https://doi.org/10.1088/1748-9326/11/2/024010, 2016.
Turnock, S. T., Allen, R. J., Andrews, M., Bauer, S. E., Deushi, M., Emmons, L., Good, P., Horowitz, L., John, J. G., Michou, M., Nabat, P., Naik, V., Neubauer, D., O'Connor, F. M., Olivié, D., Oshima, N., Schulz, M., Sellar, A., Shim, S., Takemura, T., Tilmes, S., Tsigaridis, K., Wu, T., and Zhang, J.: Historical and future changes in air pollutants from CMIP6 models, Atmos. Chem. Phys., 20, 14547–14579, https://doi.org/10.5194/acp-20-14547-2020, 2020.
van Vuuren, D. P., Stehfest, E., Gernaat, D. E. H. J., Doelman, J. C., van den Berg, M., Harmsen, M., de Boer, H. S., Bouwman, L. F., Daioglou, V., Edelenbosch, O. Y., Girod, B., Kram, T., Lassaletta, L., Lucas, P. L., van Meijl, H., Müller, C., van Ruijven, B. J., van der Sluis, S., and Tabeau, A.: Energy, land-use and greenhouse gas emissions trajectories under a green growth paradigm, Global Environ. Change, 42, 237–250, https://doi.org/10.1016/j.gloenvcha.2016.05.008, 2017.
Vohra, K., Vodonos, A., Schwartz, J., Marais, E. A., Sulprizio, M. P., and Mickley, L. J.: Global mortality from outdoor fine particle pollution generated by fossil fuel combustion: Results from GEOS-Chem, Environ. Res., 195, 110754, https://doi.org/10.1016/j.envres.2021.110754, 2021.
von Schneidemesser, E., Monks, P. S., Allan, J. D., Bruhwiler, L., Forster, P., Fowler, D., Lauer, A., Morgan, W. T., Paasonen, P., Righi, M., Sindelarova, K., and Sutton, M. A.: Chemistry and the Linkages between Air Quality and Climate Change, Chem. Rev., 115, 3856–3897, https://doi.org/10.1021/acs.chemrev.5b00089, 2015.
Wang, H., Xie, S. P., and Liu, Q.: Comparison of climate response to anthropogenic aerosol versus greenhouse gas forcing: Distinct patterns, J. Climate, 29, 5175–5188, https://doi.org/10.1175/JCLI-D-16-0106.1, 2016.
Wells, C. D., Kasoar, M., Bellouin, N., and Voulgarakis, A.: Local and remote climate impacts of future African aerosol emissions, Atmos. Chem. Phys., 23, 3575–3593, https://doi.org/10.5194/acp-23-3575-2023, 2023.
World Health Organisation: WHO global air quality guidelines: particulate matter (PM2.5 and PM10), ozone, nitrogen dioxide, sulfur dioxide and carbon monoxide, World Health Organization, ISBN 9789240034228, 2021.
Yang, Y., Russell, L. M., Lou, S., Liao, H., Guo, J., Liu, Y., Singh, B., and Ghan, S. J.: Dust-wind interactions can intensify aerosol pollution over eastern China, Nat. Commun., 8, 15333, https://doi.org/10.1038/ncomms15333, 2017.