the Creative Commons Attribution 4.0 License.
the Creative Commons Attribution 4.0 License.
 | 06 Sep 2023
Measuring and modeling investigation of the net photochemical ozone production rate via an improved dual-channel reaction chamber technique
Yixin Hao
Jie-Ping Zhou
Yan Wang
Suxia Yang
Yibo Huangfu
Xiao-Bing Li
Chunsheng Zhang
Aiming Liu
Yanfeng Wu
Yaqing Zhou
Shuchun Yang
Yuwen Peng
Jipeng Qi
Xianjun He
Yubin Chen
Min Shao
Current process-based research mainly uses box models to evaluate photochemical ozone production and destruction rates, and it is unclear to what extent the photochemical reaction mechanisms are elucidated. Here, we modified and improved a net photochemical ozone production rate (NPOPR, P(O3)net) detection system based on the current dual-channel reaction chamber technique, which makes the instrument applicable to different ambient environments, and its various operating indicators were characterized, i.e., “airtightness”, light transmittance, wall losses of the reaction and reference chambers, conversion rate of O3 to NO2, air residence time, and performance of the reaction and reference chambers. The limits of detection of the NPOPR detection system were determined to be 0.07, 1.4, and 2.3 ppbv h−1 at sampling flow rates of 1.3, 3, and 5 L min−1, respectively. We further applied the NPOPR detection system to field observations at an urban site in the Pearl River Delta (China). During the observation period, the maximum value of P(O3)net was 34.1 ppbv h−1, which was ∼ 0 ppbv h−1 at night within the system detection error and peaked at approximately noon local time. The daytime (from 06:00–18:00 LT) average value of P(O3)net was 12.8 (± 5.5) ppbv h−1. We investigated the detailed photochemical O3 formation mechanism in the reaction and reference chambers of the NPOPR detection system using a zero-dimensional box model. We found that the photochemical reactions in the reaction chamber were very close to those in ambient air, but there was not zero chemistry in the reference chamber because the reaction related to the production and destruction of RO2 (= HO2 + RO2) continued in the reference chamber, which led to a small amount of P(O3)net. Therefore, the P(O3)net measured here can be regarded as the lower limit of the real P(O3)net in the atmosphere; however, the measured P(O3)net was still ∼ 7.5 to 9.3 ppbv h−1 higher than the modeled P(O3)net value depending on different modeling methods, which may be due to the inaccurate estimation of HO2 RO2 radicals in the modeling study. Short-lived intermediate measurements coupled with direct P(O3)net measurements are needed in the future to better understand O3 photochemistry. Our results show that the NPOPR detection system can achieve high temporal resolution and continuous field observations, which helps us to better understand photochemical O3 formation and provides a key scientific basis for continuous improvement of air quality in China.
- Article
(3844 KB) - Full-text XML
-
Supplement
(4329 KB) - BibTeX
- EndNote


Surface O3 pollution has become a major challenge in air quality management in China (Shen et al., 2021). Elevated surface O3 mixing ratios exert severe adverse effects on public health, such as respiratory diseases, and the estimated annual mortality attributable to surface O3 exposure exceeds 150 000 deaths in China (Malley et al., 2017). O3 pollution is also detrimental to key staple crop yields, reducing the yields of wheat, soybean, and maize by up to 15 %, and is threatening global food security (Avnery et al., 2011; Mills et al., 2018; Karakatsani et al., 2010; Berman et al., 2012; O'Neill et al., 2003). As a greenhouse gas, O3 also contributes significantly to climate change (Bell et al., 2004). With the rapid economic development and urbanization in the Pearl River Delta (PRD) region in China, O3 pollution is pretty severe, especially in summer and autumn (Zou et al., 2015; Zhang et al., 2021).
The variation in O3 in the planetary boundary layer is predominantly influenced by deposition, advection transport, vertical mixing (i.e., entrainment from the stratosphere), meteorological factors, and chemical reactions. Therefore, the O3 budget in the boundary layer can be expressed as Eq. (1):
where SD, A, and STE represent the surface deposition, advection, and stratosphere–troposphere exchange (STE), respectively; [O3], P(O3), and D(O3) are the ambient O3 mixing ratios, photochemical O3 production and its loss rate, respectively; v, H, and ui represent the O3 deposition velocity, mixing layer height, and velocity in three directions, respectively; and A consists of ui times the O3 gradient in those three directions.
Tropospheric O3 is a key component of photochemical smog that is mainly formed by photochemical reactions of nitrogen oxides (NOx = NO + NO2) and volatile organic compounds (VOCs) (Lee et al., 2010). The specific process of the photochemical reaction is the photolysis of NO2 at < 420 nm to generate O(3P) atoms, thereby promoting the formation of O3 (Sadanaga et al., 2017). Simultaneously, there is a ROx (ROx = OH + HO2 + RO2) radical cycle in the troposphere, which continuously provides HO2 and RO2 to oxidize NO to NO2, resulting in the accumulation of O3 (Shen et al., 2021; Sadanaga et al., 2017; Cazorla and Brune, 2010).
Typical meteorological scenarios for the occurrence of O3 pollution episodes in polluted urban centers are usually characterized by weak winds, strong solar radiation, and high temperature (T). Under such conditions, local formation of O3 plays a crucial role in the rapid increase in surface O3 in daytime. In addition, in Eq. (1) the surface deposition and advection of O3 are proportional to ambient O3 mixing ratios, [O3], which is mainly generated by local photochemistry (Carzorla and Brune, 2010). If P(O3)net can be reduced by regulatory measures, overall O3 levels will decline proportionately over time (Cazorla and Brune, 2010); thus, the investigation of the P(O3)net formation mechanism is urgently needed.
Current studies on P(O3)net estimation mainly rely on modeling methods. The gas-phase chemical mechanisms were frequently used to identify key drivers of O3 pollution events and provide guidance for making effective O3 reduction strategies, such as the Master Chemical Mechanism (MCM), the Regional Atmospheric Chemistry Mechanism (RACM), the Carbon Bond Mechanisms (CBMs), and the Mainz Organic Mechanism (MOM) (Shen et al., 2021; Kanaya et al., 2016; Wang et al., 2014; Tadic et al., 2020; Ren et al., 2013; Lu et al., 2010; Zhou et al., 2014; Mazzuca et al., 2016). However, uncertainties in emission inventories, chemical mechanisms, and meteorology make it difficult to perfectly reproduce real atmospheric processes, which can lead some bias in modeling the P(O3)net. According to the existing field observations, researchers found that the mixing ratios of HO2 or RO2 obtained from the model simulation were inconsistent with those obtained from the direct measurement, leading to the deviation of P(O3)net between observation and model simulation results (Wang et al., 2014; Tadic et al., 2020; Ren et al., 2013; Martinez, 2003). Therefore, we urgently need a method that can directly measure the P(O3)net.
Recently, researchers have developed sensors that can directly measure P(O3)net in the atmosphere using the dual-channel chamber technique (Sadanaga et al., 2017; Cazorla and Brune, 2010; Baier et al., 2015, 2017; Sklaveniti et al., 2018), where ambient air is introduced into two chambers of identical size: one UV transparent chamber (reaction chamber) and one UV protection chamber (reference chamber). In the presence of solar UV light, O3 is produced by photochemical reactions in the reaction chamber but not in the reference chamber. The system does not directly measure O3 mixing ratios, it measures the combined mixing ratios of O3 and nitrogen dioxide (NO2). P(O3)net is determined by the difference in Ox (Ox = O3 + NO2) mixing ratios between the reaction and reference chambers. These studies have greatly helped us to understand the O3 photochemical formation mechanism, but defects still exist in current studies; for example, the sensors developed by Cazorla and Brune (2010) and Baier et al. (2015) both have an NO2-to-O3 converter unit and use a modified O3 monitor (Thermo Scientific, Model 49i, USA) to measure Ox, but the zero point of the O3 monitor is easy to drift, and together with the limitation in the conversion efficiency of NO2 to O3 (∼ 99.9 %) and the effects of the T and relative humidity (RH) to O3 monitor, this method can introduce large measurement uncertainties. Sklaveniti et al. (2018) have shortened the average residence time in the chambers to 4.5 min, which reduced the scattering and increased the time resolution of ΔOx measurement, but large wall loss still exists in their system at 5 % and 3 % for O3 and NO2, respectively. Sadanaga et al. (2017) passed the NO standard gas into the perfluoroalkoxy (PFA) tube to convert O3 into NO2 to detect Ox, which is easy to operate, but the laser-induced fluorescence (LIF) NO2 detector is less portable and maintainable. Furthermore, all the current sensors have different degrees of wall loss of NO2 and O3 that can even reach 15 %, which greatly affect the accuracy of the evaluation of P(O3)net.
In this study, we modified and improved a P(O3)net sensor based on the dual-channel technique as described above and named it the net photochemical ozone production rate (NPOPR) detection system. Section 2 discusses the improvement and characterization of the NPOPR detection system. Furthermore, we applied the NPOPR detection system to an observation campaign conducted at Shenzhen Meteorological Gradient Tower (SZMGT) in the Pearl River Delta (PRD) region in China. A zero-dimensional box model based on the Framework for 0-D Atmospheric Modeling (F0AM) v3.2 coupled with MCM v3.3.1 was used to simulate the photochemical reactions inside both the reaction and reference chambers in the NPOPR detection system, which allowed us to assess the ability of the current modeling method to model P(O3)net, as described in Sect. 3. The current research could help us study the source and formation mechanism of O3 and provide effective theoretical support for the prevention and control of O3 pollution. Because the system can directly obtain real-time P(O3)net under different environmental conditions, it can meet richer and more specific research needs.
2.1 Development of the NPOPR detection system
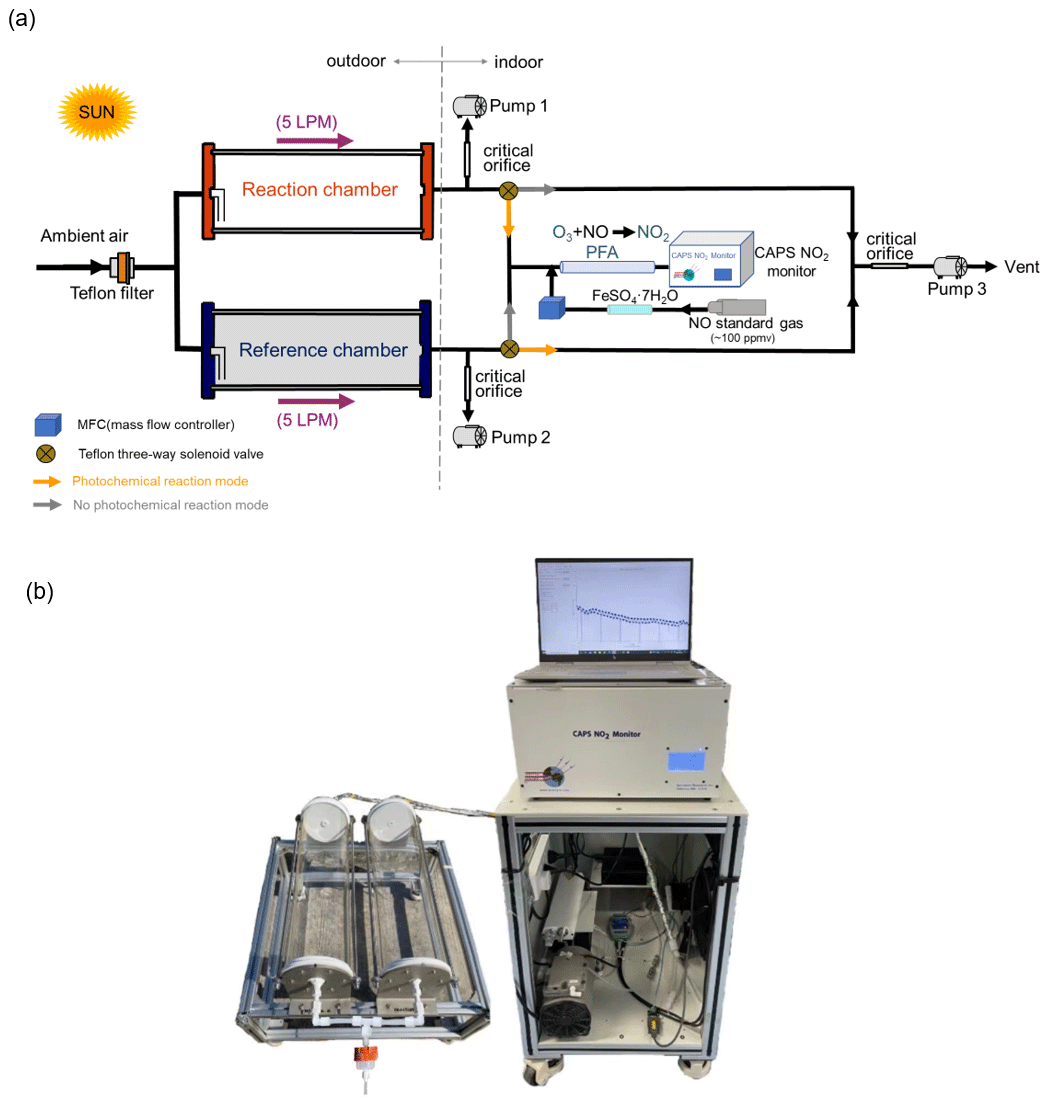
A schematic and an actual image of the NPOPR detection system are shown in Fig. 1. The integral construction is similar to the P-L(Ox) measurement system built by Sadanaga et al. (2017) and Sklaveniti et al. (2018), which mainly consists of reaction and reference chambers with the same geometry and made of quartz (190.5 mm inner diameter and 700 mm length; more details can be found in Fig. S1 in the Supplement). To prevent photochemical reactions inside the reference chamber, an ultraviolet (UV) protection Ultem film (SH2CLAR, 3 M, Japan) was used to cover the outer surface to block sunlight with wavelengths < 390 nm. During the experiment, both the reaction and reference chambers were located outdoors and exposed to sunlight directly to simulate genuine ambient photochemistry reactions. Ambient air was introduced into the reaction and reference chambers at the same flow rate, and a Teflon filter was mounted before the chamber inlet to remove fine particles. A stream of air from the two chambers was alternately introduced into an NO reaction chamber every 2 min to convert O3 in the air to NO2 in the presence of high mixing ratios of NO (O3 + NO = NO2), and the Ox mixing ratios from the outlet of the NO reaction chamber, i.e., the total NO2 mixing ratios including the inherent NO2 in the ambient air and that converted from O3, were measured by a cavity-attenuated phase shift (CAPS) NO2 monitor (Aerodyne research, Inc., Billerica MA, USA) to avoid other nitrogen oxide interference in the NO2 measurement (such as alkyl nitrates, peroxyacyl nitrates, peroxynitric acid, nitrogen pentoxide). Compared to previous studies that used a dual-channel UV absorption O3 monitor (Cazorla and Brune, 2010) or a laser-induced fluorescence (LIF) NO2 monitor (Sadanaga et al., 2017) for Ox measurements, our choice could make the NPOPR detection system have a more stable zero baseline and be more portable by assembling each part together, i.e., putting the CAPS NO2 monitor, the automatic sampling system, and the automatic data sampling system onto the indoor cabinets with the push–pull base and putting the dual chambers onto the outdoor shelf with the push–pull base. Additionally, we modified the air sampling system to adjust the total airflow rates freely from 1.3 to 5 L min−1 in the reaction and reference chambers, which enabled us to achieve different air residence times from 3.8 to 21 min. This time range covered all the residence times from previous studies using different Ox measurement techniques, which ranged from 4.5 to 20.5 min (Cazorla and Brune, 2010; Baier et al., 2015; Sadanaga et al., 2017; Sklaveniti et al., 2018). According to the simulation results described in Sect. 3, the reaction rates of O3 formation and destruction pathways and the radicals that play critical roles in photochemical O3 formation, such as HO2, RO2, and OH, reached quasi-steady states in approximately 3 min; thus, it was reasonable for us to set the airflow rate highest at 5 L min−1, where the sampled air has already reacted for 3.8 min in the reaction and reference chambers. On the other hand, this also demonstrated that it was reasonable to set the alternate sampling time for the reaction and reference chambers at 2 min, where the sampled air actually has already reacted for at least 3.8 min in the reaction and reference chambers. The switch system was controlled by two Teflon three-way solenoid valves (001-0028-900, Parker, GER) located before the NO reaction chamber (see Fig. 1). We used homemade circuit control software (four-channel valves boxed) and a solenoid valve (001-0028-900, Parker, GER) to automatically switch the sampling lines every 2 min. To keep the flow rates in the reaction and reference chambers the same and avoid gas flow accumulation in the chamber, a pump (pump 3) was connected to the Teflon three-way solenoid valves in parallel with the NO reaction chamber to evacuate the air that was not introduced into the NO reaction chamber. To reduce NO interference, the system used Ox to infer the amount of O3 generated by photochemical reactions (Liu, 1977; Pan et al., 2015; Lu et al., 2010). The difference between the Ox mixing ratios in the reaction and reference chambers, denoted by ΔOx, represents the amount of O3 generated by the photochemical reaction. P(O3)net was obtained by dividing ΔOx by the average residence time of air in the reaction chamber 〈τ〉:
Igor Pro version 6 was used to calculate P(O3)net through the following steps: (1) separate the data of the reaction and the reference chambers into two sets using the recorded valve number of 1 (reaction chamber) and 0 (reference chamber) during the sampling time; (2) for each 2 min period of data, delete the first 20 s and the last 20 s when the signal was not stable, then average the rest of the data and do the interpolation calculation for the reference chamber dataset; (3) calculate the difference between the Ox mixing ratios in the reaction and reference chambers (i.e., ΔOx) at the time when the reaction chamber measured Ox; and (4) divide ΔOx by the average residence time of air in the reaction chamber 〈τ〉 and obtain P(O3)net at a time resolution of 4 min.
The major improvements of the NPOPR detection system described here compared to previous studies to optimize P(O3)net measurements are as follows: (1) we improved the design of the reaction and reference chambers to ensure that they have good “airtightness”, which will increase the measurement accuracy of different species inside the chambers (more details can be found in Sect. 2.2 and Sect. S1 in the Supplement). (2) Two pumps (labeled pump 1 and pump 2 in Fig. 1) were added directly after the reaction and reference chambers to continuously draw ambient air through the two chambers (as the makeup flow) to adjust the total airflow rates freely from 1.3 to 5 L min−1 in the chambers. By doing this, we were able to achieve different limits of detection (LODs) of the NPOPR detection system (see Sect. 2.4), making the instrument applicable to different ambient environments, i.e., in highly polluted areas, we could use higher airflow rates to reduce the wall loss effects of the chambers, and in less polluted areas, we could use lower flow rates to increase the instrument LOD. (3) We characterized the NPOPR detection system at different airflow rates (including 1.3, 2, 3, 4, and 5 L min−1) and tested the conversion efficiency of O3 by NO to NO2 in the NO reaction chamber at different NO mixing ratios and NO reaction chamber lengths. These efforts enabled us to better understand the running parameters of the NPOPR detection system and perform data corrections under different airflow rates (see Sect. 2.2). (4) We tested the performance of both the reaction and reference chambers by combining the field measurements and MCM modeling, which indicated that reaction pathways of P(O3) and D(O3) and the radicals that play critical roles in photochemical O3 formation, such as HO2, RO2, and OH, reached quasi-steady states in approximately 3 min, thus ensuring that the lowest air residence time of 3.8 min (at an airflow rate of 5 L min−1) in the reaction and reference chambers was long enough to obtain accurate P(O3)net values (see Sect. 3.2). These efforts made the NPOPR detection system less prone to biases than other systems and increased its applicability.
2.2 Characterization of the NPOPR detection system
We characterized the NPOPR detection system following the same procedures as previous researchers, including the residence time of the air, the wall losses of NO2 and O3, the transmittance of light and temperature differences in the reaction and reference chambers, and the quantitative conversion efficiency of O3 to NO2 (α) in the NO reaction chamber. Additionally, we investigated the residence time of the air and the wall losses of NO2 and O3 in the reaction and reference chambers at different flow rates (including 1.3, 2, 3, 4, and 5 L min−1) and the conversion efficiency of O3 by NO to NO2 in the NO reaction chamber at different NO mixing ratios and NO reaction chamber lengths. The detailed experimental performances and data analysis are shown in Sect. S1, and the corresponding results are described as follows.
2.2.1 The residence time
We tested the residence time of air in both chambers under different airflow rates, including 1.3, 2, 3, 4, and 5 L min−1, and the obtained related residence time in the reaction chamber was 0.35, 0.16, 0.11, 0.07, and 0.06 h, respectively. By setting different airflow rates, we were able to obtain different residence times and thus different LODs of the NPOPR detection system, which make it applicable to different ambient environments. To make sure that the mean residence time of air is the same in the reaction and reference chambers, we also tested the residence time of air in the reference chamber in parallel, which were not much different to the values in the reaction chamber, as shown in Table S1. The experimental schematic diagram is shown in Fig. S2, and the related results of different airflow rates are shown in Fig. S3 and Table S1.
2.2.2 Wall losses of NO2 and O3
At airflow rates of 1.3, 2, 3, 4, and 5 L min−1, the wall losses of O3 in the reaction chamber were found to be approximately 2 %, 0 %, 0 %, 0 %, and 0 %, respectively, and the wall losses of O3 in the reference chamber were found to be approximately 2 %, 1 %, 1 %, 0 %, and 0.7 %, respectively. While the wall losses of NO2 in the reaction chamber at airflow rates of 1.3, 2, 3, 4, and 5 L min−1 were found to be approximately 4 %, 4 %, 2 %, 0 %, and 0.3 %, respectively, the wall losses of NO2 in the reference chamber were found to be approximately 2 %, 1 %, 0 %, 0 %, and 0.6 %, respectively. The experimental schematic diagram is shown in Fig. S4, and the related results of different airflow rates are shown in Figs. S5–S6 and Tables S2–S5. We further compared the wall losses of O3 and NO2 in the reaction and reference chambers at 5 L min−1 with previous studies (as shown in Table S6) and found that they were significantly smaller, but even with a flow rate of 1.3 L min−1, the wall losses were still smaller than 4 % and 2 % in the reaction chamber and the reference chambers, respectively. We also tested the wall losses of NO2 and O3 in the chamber at a 5 L min−1 flow rate at different humidities of 35 %–75 %; the detailed results are shown in Figs. S7 and S8, which shows that the variation in humidity changed the wall loss of NO2 and O3 by 0.03 %–0.12 % and 1.06 %–1.19 %, respectively, which is much smaller than the instrument detection error (which is 2 % at ambient NO2 mixing ratios of 0–100 ppb), indicating the small effect of Ox loss on P(O3)net measurements in our NPOPR detection system.
2.2.3 The light transmittance and temperature differences in the reaction and reference chambers
It is worth noting that there was still low transmittance of light ranging from 390 to 790 nm through the UV protection film, so the reference chamber could not be regarded as completely dark; thus, we tested the solar UV transmittance through the reaction and reference chambers of the NPOPR detection system in the laboratory using a sunlight simulation lamp (SERIC XG-500B, Japan) to provide different intensities of illumination. The photolysis frequencies of NO2, O3, HONO, H2O2, NO3_M (photolysis of NO3 generates NO + O2), NO3_R (photolysis of NO3 generates NO2 + O), HCHO_M (photolysis of HCHO generates H2 + CO), and HCHO_R (photolysis of HCHO generates H + HCO) inside and outside the reaction and reference chambers were measured using an actinic flux spectrometer (PFS-100; Focused Photonics Inc., China). Table 1 presents the J(NO2), J(O1D), and J(HONO) results for the outside and inside chambers from this study and from the literature. J(H2O2), J(NO3_M), J(NO3_R), J(HCHO_M), and J(HCHO_R) are shown in Table S7.
Table 1Transmissivities of photolysis frequencies J (s−1) of different species in the reaction and reference chambers. The normal and bold fonts correspond to the transmissivities of J in the reaction (clear) and reference (Ultem-coated) chambers, respectively. The “transmissivities” column shows the transmissivities of the tested species from the measurements conducted with the set photolysis frequencies using SERIC XG-500B sunlight (this study) and ambient values (literature). It should be noted that the errors listed here are relatively large and may not reliable due to a limited number of measurement points (three points for each species). The calculated transmittivity errors are 0.07 for all species based on the ±5 % measurement error of the instrument.
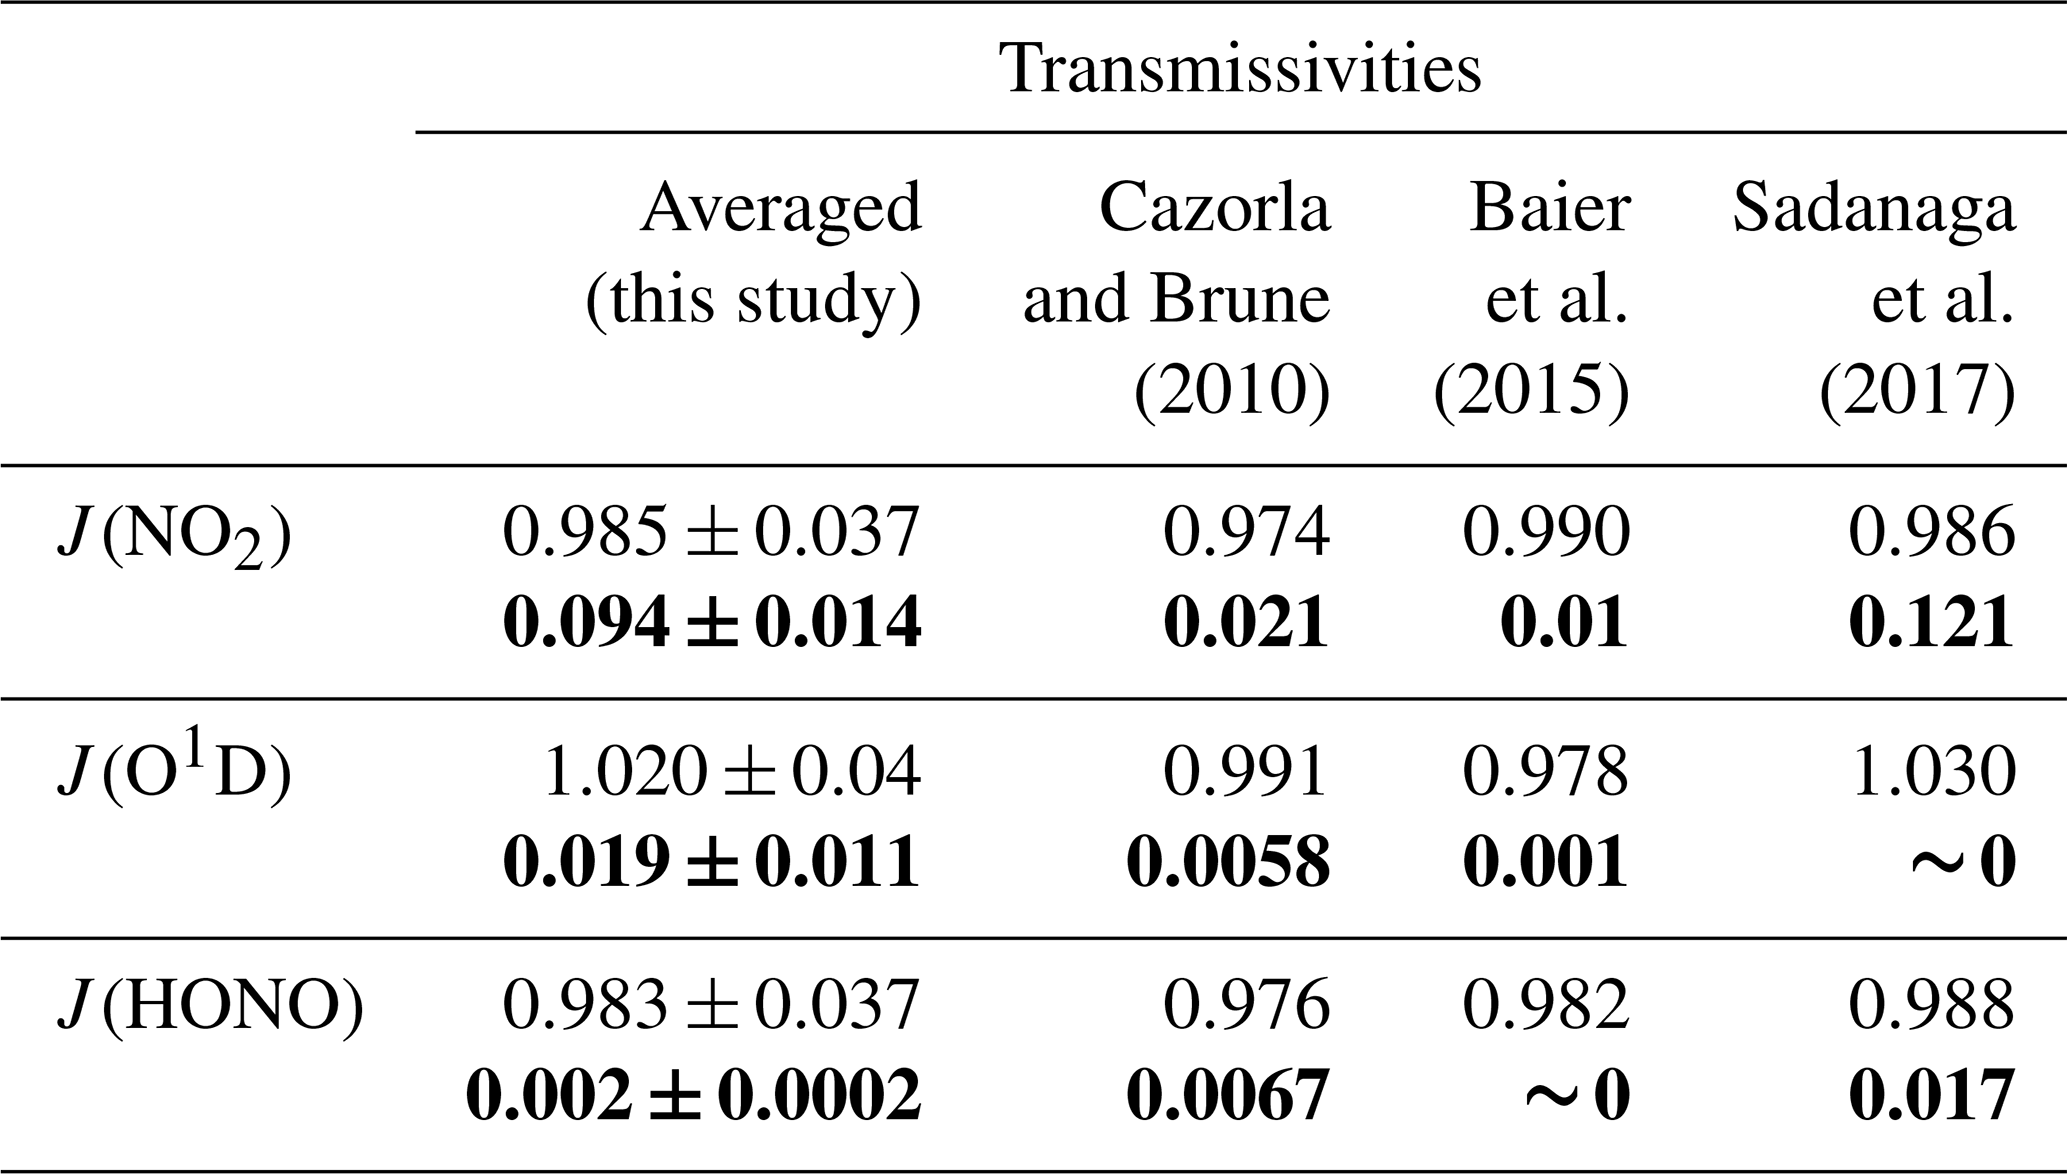
The photolysis frequencies of all species inside the reaction chamber were in agreement with those measured outside the reaction chamber within 4 %. Table S7 shows that the transmissivities of J(H2O2), J(NO3_M), J(NO3_R), J(HCHO_M), and J(HCHO_R) in the reaction chamber were more than 90 %. However, we have observed that the transmissivities of J(O1D) were even higher than those of J(HONO) (as shown in Table 1) in the reference chamber (which blocks sunlight at wavelengths < 390 nm); theoretically, this is not possible according to JPL Publication 19-5 (Burkholder et al., 2020), where the absorption cross section of HONO at wavelengths of 390–395 nm ranged from approximately 4.0 to 17.1 × 10⁻²¹ cm2, which is about 2 or 3 orders of magnitude higher than that of ozone (which ranged from approximately 0.8 to 2.6 × 10⁻²³ cm2 at wavelengths of 390–410 nm), and the photolysis quantum yield of HONO at wavelengths of 390–395 nm is unity, which is about 10 times higher than that of ozone (∼ 0.08). This will surely make the J values of HONO inside the reference chamber (which only has sunlight with wavelengths > 390 nm) higher than that of ozone according to the Eq. (S9). We also found that the transmissivities of photolysis frequencies of HONO and O3 in the reference chamber obtained from the tropospheric ultraviolet and visible (TUV) model simulation (as described in Sect. 3.2) were 0.01 and 0, respectively, as shown in Table S13. Therefore, we believe the non-zero measurement results of the transmissivities of photolysis frequencies of O3 shown in Tables 1 and S7 are mostly probably due to the instrument measurement error, this error is relatively large due to a limit number of measurement points (three points for each species). We further evaluated the measurement error of J values based on the instrument measurement error of the actinic flux spectrometer, which can reach ±5 % according to Bohn and Lohse (2017), and re-evaluated the transmittivity error listed in Tables 1 and S7 following the procedures described in the Supplement (Sect. S1.5). The calculation result from Eq. (S5) shows that the transmissivity errors are 0.07 for all species; within this error range, J(O1D), J(HONO), J(H2O2), J(HCHO_M), and J(HCHO_R) can be considered statistically indistinguishable from 0 in the reference chamber. However, J(NO2), J(NO3_M), and J(NO3_R) still show distinctly positive values. Specifically, the transmissivities of J(NO3_M) and J(NO3_R) of the reference chamber were more than 90 % (Table S7). The influence of the measurement error of J values of all species on P(O3)net will be discussed in Sect. 3.
We further detected the temperature in both the reaction and reference chambers when running the NPOPR detection system in an ambient observation campaign during November 2022 on the Panyu Campus of Jinan University in Guangzhou, China (23∘02′ N, 113∘36′ E). We found that the UV protection Ultem film on the reference chamber did not block the heat outside the chamber, and the temperature remained the same in the reaction and reference chambers during the measurement test, as shown in Fig. S10.
2.2.4 The quantitative conversion efficiency of O3 to NO2 (α)
The quantitative conversion efficiency of O3 to NO2 (α) in the NO reaction chamber is crucial for accurate measurement of P(O3)net. Here, we used a perfluoroalkoxy (PFA) tube (outer diameter of 12.7 mm, inner diameter of 9.5 mm) as the NO reaction chamber. The experimental schematic diagram is shown in Fig. S12. Known mixing ratios of O3 and NO standard gas were introduced into the NO reaction chamber, and NO reacted with O3 to produce NO2. To avoid the influence of small amounts of NO2 impurity in the NO standard gas used for conversion, we added a cylinder filled with partialized crystals of FeSO4•7H2O to reduce NO2 in the NO N2 gas cylinder to NO. We injected ∼ 1800 ppbv NO into the NO reaction chamber and tested the NO2 mixing ratios from its outlet using a CAPS NO2 monitor, as shown in Fig. S13. We found that the standard deviation of the NO2 mixing ratios was lower than 0.027 ppbv, which is smaller than the baseline drifts of the CAPS (which were 0.043 and 0.030 ppbv (1σ) at integration times of 35 and 100 s, respectively, as mentioned in Sect. 2.3), and thus we believe the particulate crystals of FeSO4•7H2O performed well and that the potential bias introduced by the impurity in NO mixing ratio for P(O3)net was negligible. Finally, the total NO2 mixing ratios, including that from the ambient air, were measured using a CAPS NO2 monitor ([NO2]CAPS). The O3 mixing ratios were controlled at approximately 310 ppbv according to its maximum mixing ratio range in the normal ambient atmosphere (to ensure that all ambient and newly generated O3 can react with NO and produce equivalent amounts of NO2). An O3 generator equipped with a low-pressure mercury lamp was employed to generate O3, and the generated O3 mixing ratios ([O3]g) were measured by a 2B O3 monitor as mentioned above. Here, we note that the O3 mixing ratios were diluted by the added NO N2 gas (with a flow rate of 20 mL min−1) in the NO reaction chamber (with a total flow rate of 1.11 L min−1). Taking 1800 ppbv NO N2 gas as an example, the relationship between [NO2]CAPS and [O3]g can be described by Eq. (3):
To determine the optimal length of the NO reaction chamber and NO mixing ratios, we performed a cross test of α under the following scenarios: the NO-reaction chamber lengths were increased from 30 to 650 cm in 50 cm steps, and the NO standard gas (102.1 ppmv) was diluted to 600, 900, 1200, 1500, 1800, 2100, and 2400 ppbv in the NO reaction chamber. The results are shown in Fig. 2. We found that at [O3]g of approximately 310 ppbv, with NO mixing ratios ≥ 1800 ppbv in the NO reaction chamber, α reached 99 %, 99.6 %, and 99.9 % with NO reaction chamber lengths of 50, 70, and 100 cm, respectively, where the corresponding O3 residence times in the NO reaction chamber were 1.95, 2.74, and 3.91 s, respectively. Considering both the optimal reaction time in the NO reaction chamber and α, we selected the NO reaction chamber length of 100 cm with an NO mixing ratio of 1800 ppbv for the NPOPR detection system.
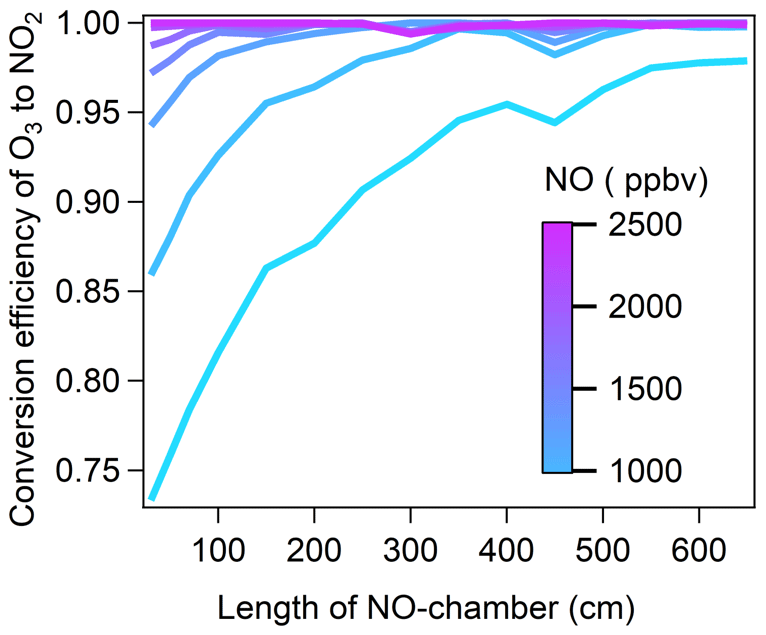
Figure 2The conversion efficiency of O3 by NO to NO2 in the NO reaction chamber as a function of the NO chamber length (color coded by NO mixing ratio).
2.2.5 The airtightness of the reaction and reference chambers
We also checked the airtightness of the reaction and reference chambers by passing through gases with different flow rates based on the schematic diagram shown in Fig. S14 and compared the values of (airflow rate × pressure) between the inlet and outlet of the chambers (as indicated in Fig. 3). We found that the deviations in (airflow rate × pressure) at the inlet and outlet of the reaction and reference chambers at different flow rates were < 3 % (as shown in Table S8), indicating the good airtightness of the reaction and reference chambers. This ensured that the photochemical reactions in the reaction and reference chambers would not be affected by the ambient air outside the chambers.
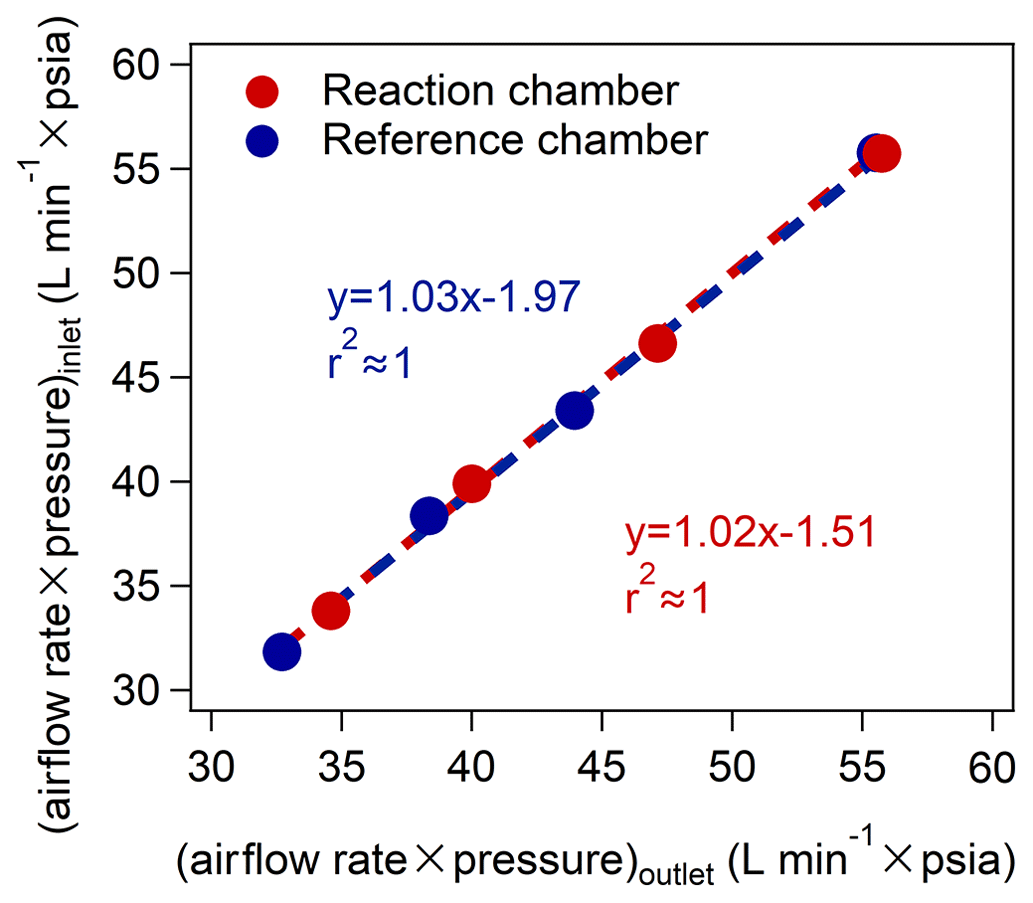
Figure 3The relationship of the values of (airflow rate × pressure) between the inlet and outlet of the chambers (psia: pounds per square inch absolute, 1 psia ≈ 6895 Pa).
2.2.6 The flow states in the reaction and reference chambers
We calculated the Reynolds number to check the gas flow state in the reaction and reference chambers. The Reynolds number (expressed as Eq. 4) is a dimensionless number that can be used as the basis for judging the flow characteristics of a fluid:
where v, ρ, and μ are the flow velocity, density, and viscosity coefficient of the fluid, respectively. In this study, the fluid is air, and d is the equivalent diameter of the reaction and reference chambers. The calculated Reynolds numbers in the two chambers under flow rates of 1.3, 2, 3, 4, and 5 L min−1 were 9.39, 14.58, 21.75, 29.05, and 36.34, respectively, indicating laminar flows in both chambers at different flow rates.
2.2.7 The HONO production in the reaction and reference chambers
We tested the HONO production in the reaction and reference chambers under weather conditions similar to those during the SZMGT observations (humidity of 60 %–90 % at a temperature of ∼ 20 ∘C and J(NO2) of ∼ 0–8 × 10⁻³ s−1) at a 5 L min−1 sampling flow rate. We found that the HONO mixing ratios in the reaction and reference chambers were almost the same and not statistically different from that in the ambient air within the standard deviation, as shown in Fig. S9; therefore, we assumed that the HONO production in the reaction and reference chambers would not cause a significant difference in P(O3)net in the two chambers. Unfortunately, we did not test HONO during the field observation period, but we have added the modeled HONO produced from the precursors before the ambient air was injected into the NPOPR detection system, as described in Sect. 3.2.
2.3 Calibration and measurement error of the CAPS NO2 monitor
The Ox in the NPOPR detection system was measured by the CAPS NO2 monitor. Detailed descriptions of this technique can be found elsewhere (Kebabian et al., 2008, 2005). We calibrated the CAPS NO2 monitor using a NO2 standard gas (with an original mixing ratio of 2.08 ppmv), which was calibrated using the gas-phase titration method using NO standard gas and excessive O3. The related experimental results are shown in Fig. S15. The detailed calibration procedure is as follows. First, (a) inject ∼ 10–100 ppbv of NO2 standard gas for 30 min to passivate the surfaces of the monitor and then inject dry pure air for ∼ 10 min to minimize the zero-point drift, which was 0.043 and 0.047 ppbv at integration times of 35 and 100 s, respectively, and resulted in LODs of CAPS of 0.13 and 0.14 ppbv (3σ), respectively. Second, (b) inject a wide range of NO2 mixing ratios (from 0–160 ppbv) prepared by mixing the NO2 standard gas with ultrapure air into the CAPS NO2 monitor and repeat the experiments three times at each NO2 mixing ratio. The final results are shown in Fig. 4. To check the baseline drift of the CAPS at different humidities, we added another two sets of tests (as shown in Fig. S11) using ambient air and wet pure air and found that (a) when injecting ambient air into the CAPS (RH ranged from ∼ 30 %–35 %), the baseline drifts were 0.035 and 0.032 ppbv (1σ) at integration times of 35 and 100 s, respectively, and (b) when injecting wet pure air into the CAPS (RH ranged from 35 %–70 %), the baseline drifts were 0.043 and 0.030 ppbv (1σ) at integration times of 35 and 100 s, respectively. These baseline drifts were smaller than those when injecting dry pure air to estimate the LOD of the CAPS. We chose the largest baseline drift when injecting dry pure air to estimate the P(O3)net error in the following analysis; by doing this, we were able to include all the short-duration baseline drifting in the CAPS NO2 monitor under different humidities.
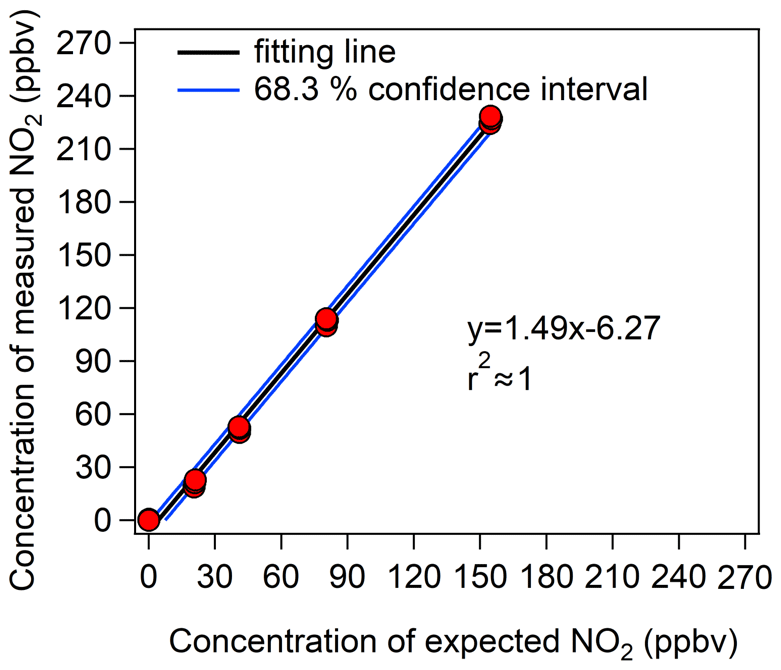
Figure 4Calibration results of the CAPS NO2 monitor with different NO2 mixing ratios. The y axis represents the NO2 mixing ratios measured by the CAPS NO2 monitor, and the x axis represents the prepared NO2 mixing ratios from the diluted NO2 standard gas.
To obtain an accurate measurement error of the CAPS NO2 monitor ((O)error), we fitted the calibration results with a 68.3 % confidence level, and the blue line in Fig. 4 represents the maximum fluctuation range under this confidence level. (O)error was then calculated from the fluctuation range of the 68.3 % confidence interval of the calibration curve. The relationship between (O)error and the measured Ox value ([Ox]measured) can be expressed as a power function curve, as shown in Eq. (5):
Subsequent P(O3)net error estimation according to the instrument measurement error of the CAPS NO2 monitor and the O3 light-enhanced loss in the reaction and reference chambers are described in Sect. S2.
2.4 The measurement error of P(O3)net and the LOD of the NPOPR detection system
To assess the measurement error of P(O3)net and the LOD of the NPOPR detection system, dry pure air was introduced into the NPOPR detection system in sequence to adjust the system for ∼ 2 h, followed by dry pure air or ambient air when the time resolution of the CAPS NO2 monitor was 1 s and the integration time period was 100 s (the measurement durations for the reaction and reference chambers were both 2 min). The LOD of the NPOPR detection system was obtained as 3 times the measurement error of P(O3)net, which was determined at a time resolution of 4 min by propagating the errors of the Ox measured by the CAPS NO2 monitor when ultrapure air or ambient air was introduced into the NPOPR detection system, combined with the related 〈τ〉 under different flow rates, i.e., 〈τ〉 was 0.063 h at a flow rate of 5 L min−1. The detailed calculation method is shown in Eq. (6):
where [Ox]rea_SD and [Ox]ref_SD represent the standard deviation of Ox in the reaction and reference chambers measured by the CAPS NO2 monitor with an integration time period of 100 s, respectively.
However, considering that the background Ox mixing ratios (measured by the CAPS NO2 monitor of the air in the reference chamber) changed when measuring the ambient air, the measured Ox errors in the reaction and reference chambers changed with the Ox mixing ratios (as shown in Sect. 2.3), and the LOD must also be a function of the intrinsic ambient and photochemically formed O3 and NO2 mixing ratios (i.e., the Ox mixing ratios measured by the CAPS NO2 monitor). It is worth noting that the measured Ox errors may also be influenced by the light-enhanced loss of O3 in the reaction and reference chambers under ambient conditions when the light intensity (especially J(O1D)) and O3 mixing ratios are high, as tested and shown in Sect. S1, but this effect is included in the measured Ox errors. Therefore, when injecting ambient air into the NPOPR detection system, the error and LOD of P(O3)net with a residence time of τ can be calculated using Eqs. (7) and Eq. (8), respectively:
where and represent the measurement error caused by the light-enhanced loss of O3 in the reaction and reference chambers, respectively, and and represent the standard deviation of Ox in the reaction and reference chambers caused by the CAPS NO2 monitor with an integration time period of 100 s, respectively. More details about the and estimation method can be found in Sect. S2.
In conclusion, the LOD of the NPOPR detection system is determined to be 3 times P(O3)net_error, where P(O3)net_error is mainly determined by the measurement error of Ox (including the Ox measurement error of the CAPS NO2 monitor, the light-enhanced loss of O3, and the chamber Ox losses). Because the measurement error of the CAPS NO2 monitor decreases with increasing Ox mixing ratios (as shown in Sect. 2.3), higher LODs could be obtained when injecting dry pure air into the NPOPR detection system, which were approximately 0.07, 1.4, and 2.3 ppbv h−1 at airflow rates of 1.3, 3, and 5 L min−1, respectively. The results are summarized in Table S9.
During the field observations, the LOD values were highly dependent on the ambient conditions, especially the light intensity and the Ox mixing ratios, and higher O3 mixing ratios and lower light intensity will likely result in lower LOD values.
2.5 Laboratory tests of the NPOPR detection system
We conducted an experiment in the laboratory to test the performance of the NPOPR detection system at Jinan University Panyu Campus (23.0∘ N, 113.4∘ E) on 26 March 2021. Ambient air (5 L min−1) was simultaneously injected into the reaction and reference chambers of the NPOPR detection system in parallel, and the sunlight simulation lamp mentioned above was used to simulate sunlight radiation. The light intensities of the sunlight simulation lamp were decreased from 26 000 to 0 cd in steps of 3700 cd, where cd indicates the SI light intensity unit candela. P(O3)net was 28.6 ppbv h−1 at a light intensity of 26 000 cd and gradually approached 0 ppbv h−1 at 0 cd (as shown in Fig. 5), indicating that the P(O3)net change due to the different sunlight radiation could be captured well by the NPOPR detection system.
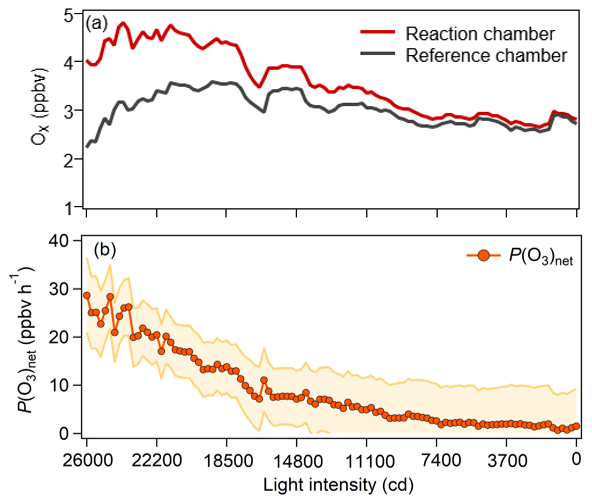
Figure 5(a) Measured Ox mixing ratios in the reaction and reference chambers and (b) the related P(O3)net as a function of the light intensity during the experiment.
3.1 Field observations
The self-built NPOPR detection system was employed in the field campaign conducted at SZMGT, which is located in Shenzhen, China (as shown in Fig. S17), from 7 to 9 December 2021. During the campaign, to achieve the lowest O3 and NO2 wall loss, we used a 5 L min−1 airflow rate in the reaction and reference chambers (with a residence time of ∼ 4 min). The photolysis frequencies of different species were measured using the actinic flux spectrometer as mentioned above. O3 and NOx (NO + NO2) mixing ratios were measured using a 2B O3 monitor and a chemiluminescence NOx monitor (Model 42i, Thermo Fisher Scientific, USA), respectively. T and RH were measured by a portable weather station (Met Pak, Gill Instruments Ltd, UK). Volatile organic compounds (VOCs) were measured by high-resolution proton transfer reaction time-of-flight mass spectrometry (PTR-ToF-MS, Ionicon Analytik, Austria) (Wang et al., 2020; Wu et al., 2020) and an offline gas chromatography mass spectrometry flame ionization detector (GC-MS-FID) technique (Wuhan Tianhong, Co. Ltd, China) (Yuan et al., 2012) (Table S11). Additionally, a self-built formaldehyde analyzer was used to detect formaldehyde (HCHO) (Zhu et al., 2020). Figure 6 presents the temporal and diurnal variations in the P(O3)net, Ox, O3, NO, NO2, NOx, T, RH, J(O1D), and J(NO2) mixing ratios at SZMGT during the campaign.
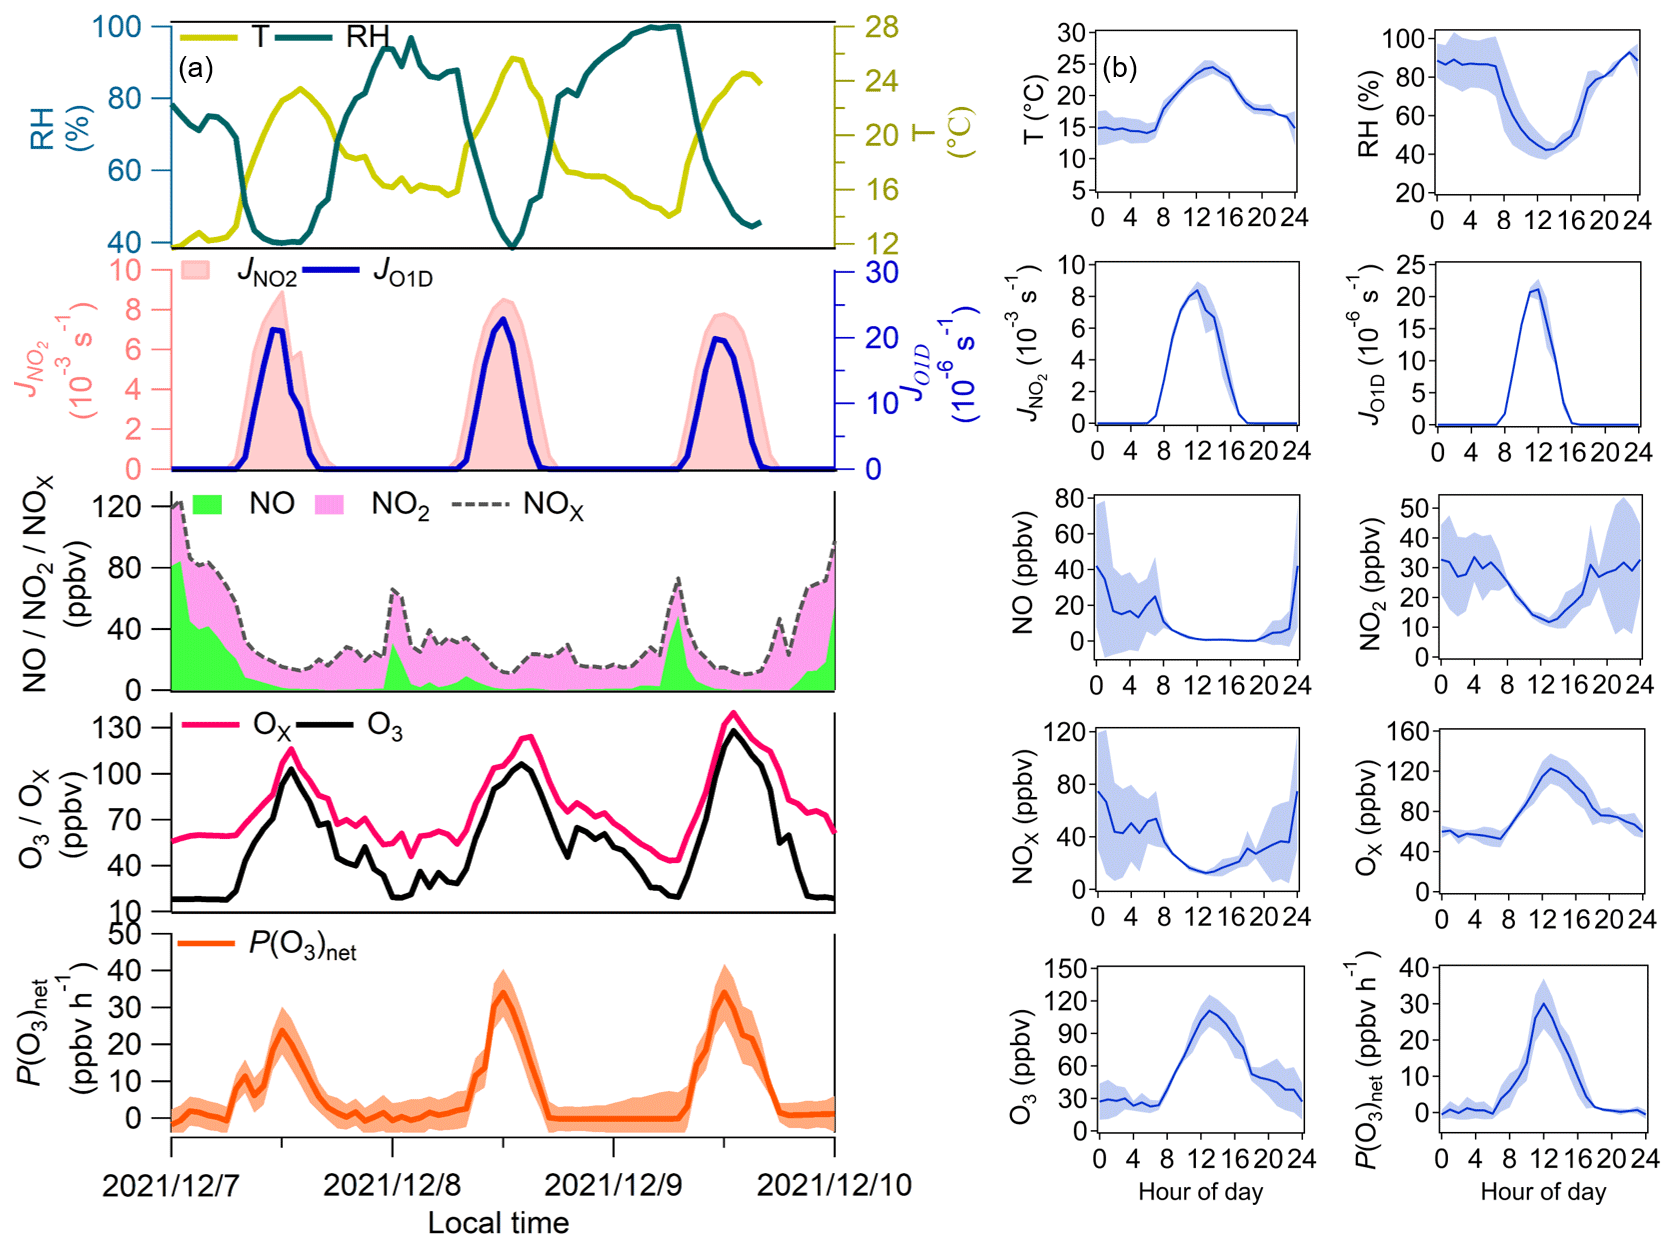
Figure 6(a) Time series and (b) average diurnal variations in P(O3)net, J(NO2), J(O1D), T, RH, Ox, NO2, and NO measured at SZMGT from 7 to 9 December 2021. The shaded areas represent the error of each measured species, where the error of P(O3)net was calculated according to the method described in Sect. 2.4.
During the measurement period, P(O3)net ranged from ∼ 0 to 34.1 ± 7.8 ppbv h−1, with an average daytime (from 06:00–18:00 LT) value of 12.8 (± 5.5) ppbv h−1. The maximum P(O3)net at SZMGT was lower than that measured in the urban area of Houston in the United States (40–50 and 100 ppbv h−1 in autumn and spring, respectively) (Baier et al., 2015; Ren et al., 2013), close to that measured in Indiana in the United States (∼ 30 ppbv h−1 in spring) (Sklaveniti et al., 2018), and much higher than that measured at the Wakayama Forest Research Station in a remote area of Japan (10.5 ppbv h−1 in summer) (Sadanaga et al., 2017) and in an urban area of Pennsylvania in the United States (∼ 8 ppbv h−1 in summer) (Cazorla and Brune, 2010). The result indicates the rationality of the measured P(O3)net in this study. From previous studies, the O3 pollution in the PRD area is more severe in summer and autumn than in winter and spring (Zhang et al., 2021). In this study, P(O3)net was measured in wintertime, which was already high, so we believe that the O3 pollution of the PRD is severe and urgently needs to be controlled. More measurements of P(O3)net worldwide are listed in Table S10, and we found that P(O3)net was much higher in urban areas than in remote areas using both modeling and direct measurement methods.
According to the diurnal variation in all the measured pollutant indicators, P(O3)net started to increase at approximately 07:00 LT, which may be due to two reasons: (1) the rise in O3 precursors (i.e., VOCs) due to air from the high-altitude atmospheric residual layer transported downward near the surface at this time and (2) the increase in solar radiation intensity after 07:00 LT, which increased the atmospheric oxidation capacity. These two factors jointly enhanced the photochemical oxidation reaction of VOCs and gradually increased P(O3)net. P(O3)net then peaked at approximately 12:00 LT; this was consistent with J(NO2), but this peak time occurred earlier than that of O3, which peaked at approximately 14:00 LT, which may be due to the photochemical reactions dominating O3 mixing ratio changes between 12:00 and 14:00 LT. After 14:00 LT, the O3 mixing ratios started to decrease, which may be due to other processes dominating the O3 mixing ratio changes at this time, such as O3 reacting with other pollutants or surface deposition and the outflow of O3 by physical transport. In conclusion, the changes in O3 mixing ratios were influenced by both photochemical production and physical transport. Because HO2 and RO2 were not well captured in the model, the simulations could lead to an underestimation of P(O3)net.
3.2 Model simulation of P(O3)net in the reaction and reference chambers
3.2.1 Modeling method
To obtain a comprehensive understanding of the ozone production rate P(O3) and ozone destruction rate D(O3) during a 4 min photochemical reaction in the reaction and reference chambers, we modeled P(O3) and D(O3) at 12:00 LT on 7 December 2021 based on field observation data using a zero-dimensional box model based on the F0AM v3.2 coupled with MCM v3.3.1, which contains a total of 143 VOCs, more than 6700 species, involving more than 17 000 reactions (Jenkin et al., 2015). P(O3)net can be expressed by the difference between P(O3) and D(O3), and P(O3) and D(O3) can be expressed as Eqs. (9) and (10), respectively.
where kM+N represents the bimolecular reaction rate constant of M and N and φi is the yield of NO2 from the RO2,i + NO reaction. The relevant reaction rates of P(O3) and D(O3) and the VOC mixing ratios from 7–9 December 2021 at the SZMGT used in the model are listed in Tables 2 and S11.
Table 2O3 production and destruction reactions and the relevant reaction rates used in the model.
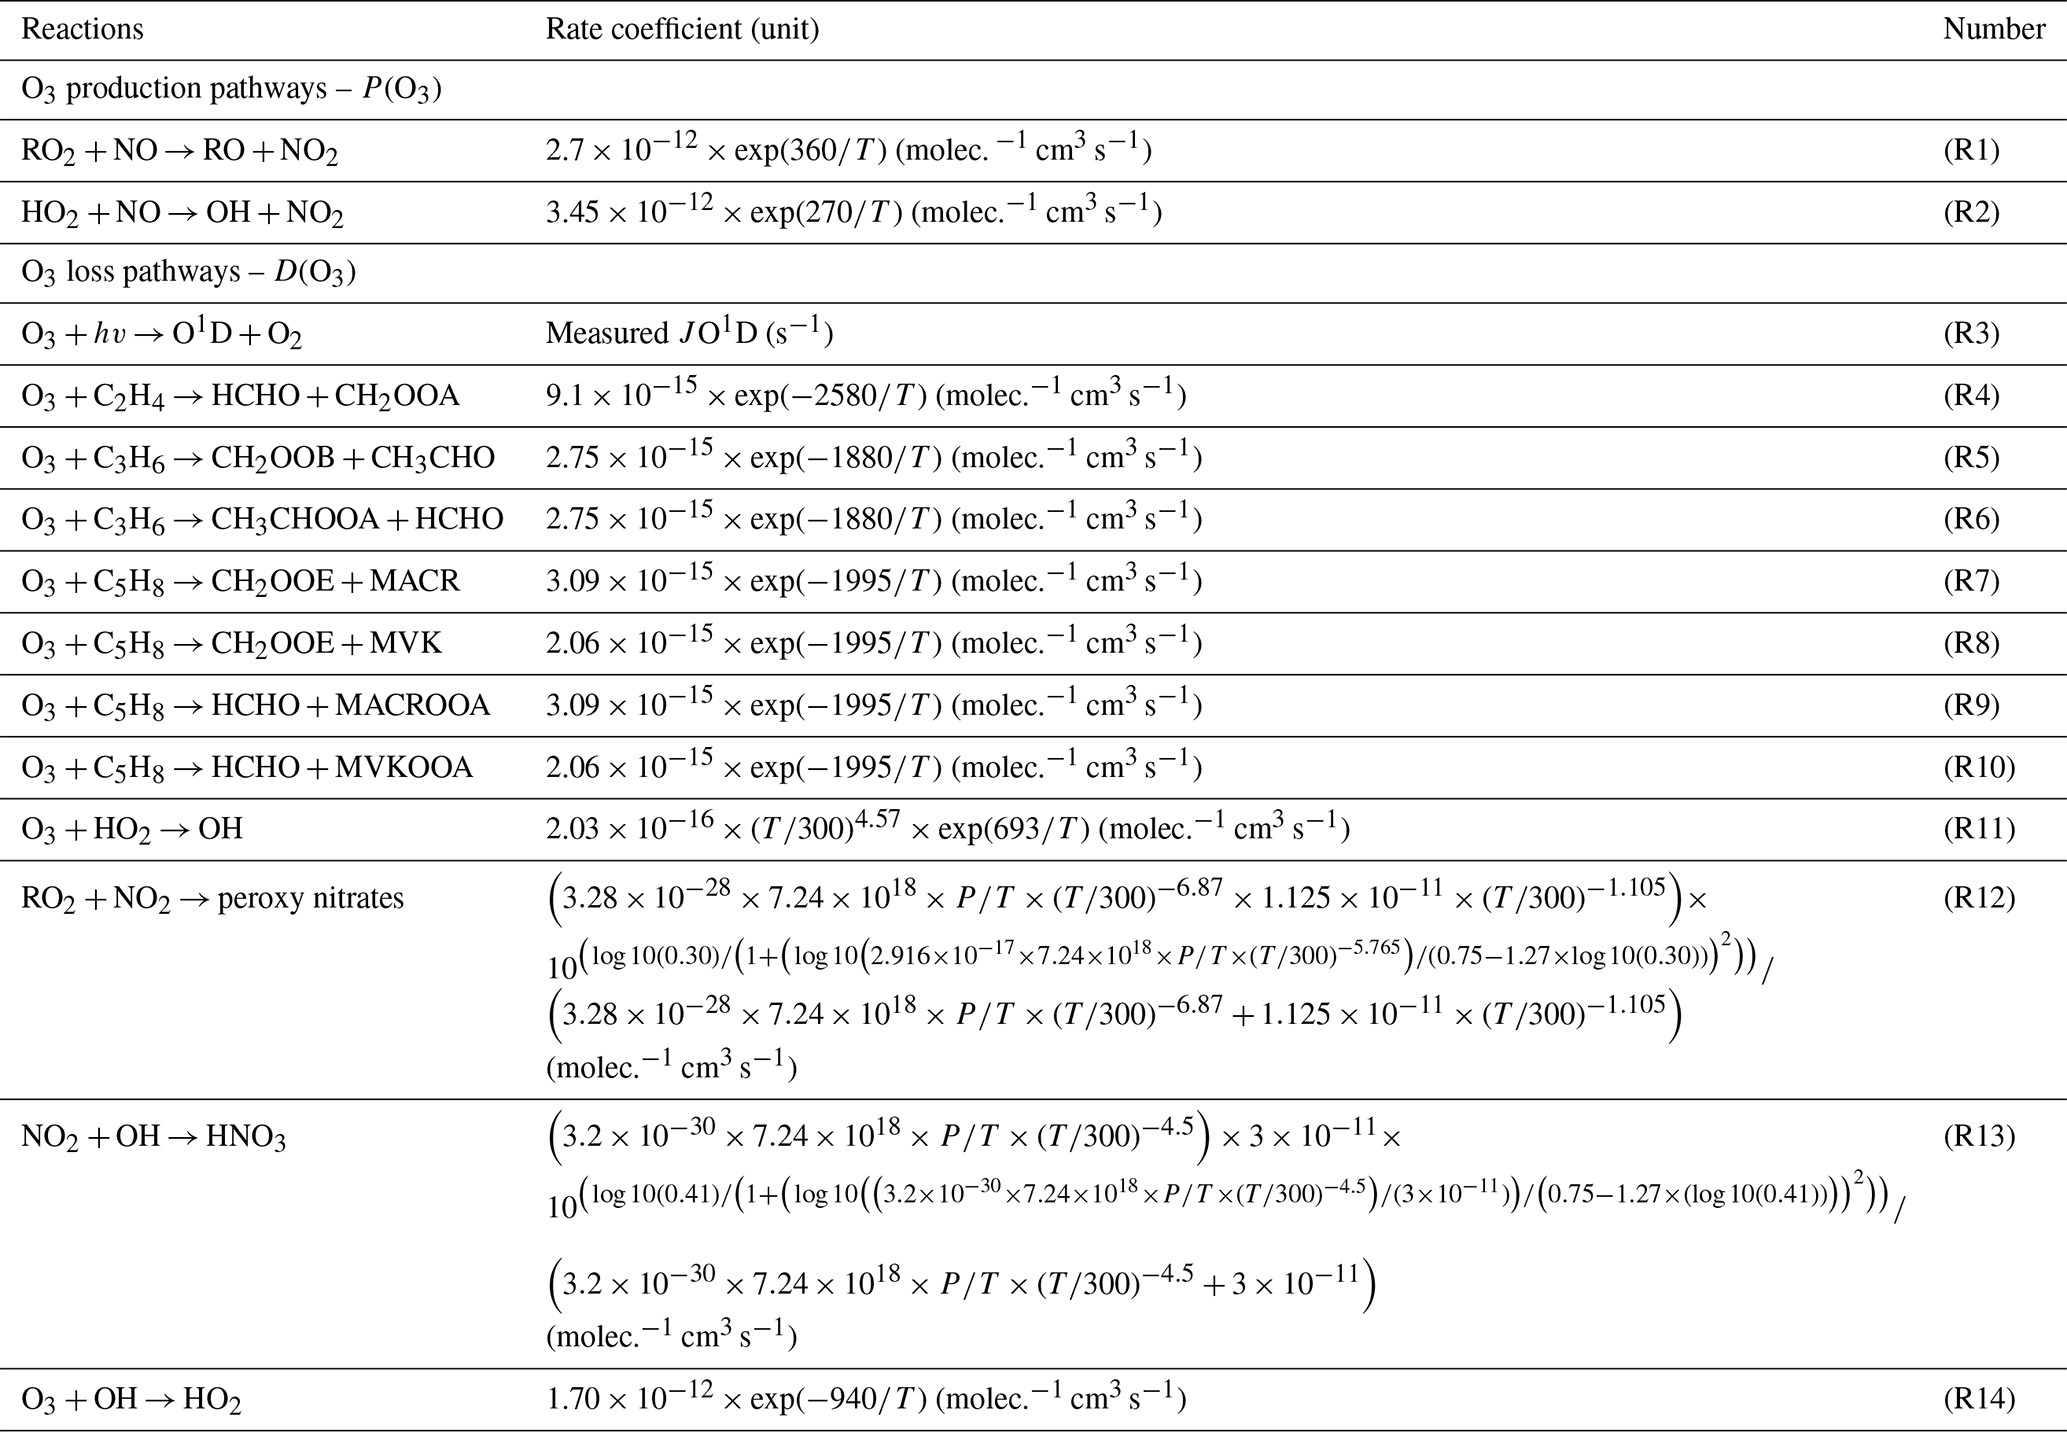
∗ The rate coefficient obtained from the MCM v3.3.1 model.
Three-stage simulations were carried out to obtain the 4 min photochemical reactions in the reaction and reference chambers, and all three-stage models were operated in a time-dependent mode with a 1 s resolution. In the first stage, to establish a real atmospheric environment system, all observations on 7 December 2021 from 06:00–11:30 LT were used to constrain the model to obtain the mixing ratios of the unmeasured species in the ambient atmosphere, including oxygenated VOCs (OVOCs, in total 16 species), and non-methane hydrocarbons (in total 47 species), O3, NO, NO2, J values, T, RH, and pressure (P). Because O3–NO–NO2 was not in a steady state when all species were constrained, we conducted a second-stage simulation from 11:30–12:00 LT. In this stage, we used the output mixing ratios of the unmeasured species from the simulation in the last 1 s of the first-stage simulation as the input, which were not constrained after providing initial values. For the measured species, O3, NO, and NO2 were no longer constrained after providing initial values, while all other variables (including NOx, VOCs, J values, RH, T, P) were still constrained in a time-dependent mode with a 1 s resolution after providing initial values. In the third-stage, we modeled the 4 min photochemical reactions in the reaction and reference chambers. We used the output mixing ratios of the unmeasured species (i.e., OH, HO2, RO2, SO2, HONO) from the simulation in the last 1 s of the second-stage simulation and all measured values (i.e., O3, NO, NO2, VOCs, J values, RH, T, P) as the model input, which were not constrained after providing initial values. In addition, while maintaining the setup conditions for the second-stage of the simulation, we extended the simulation of the environment to 12:04 LT to obtain the modeled P(O3)net in the environment in the third-stage simulation. The result is shown as an orange point in Fig. 10d. Figure 7 shows an explicit explanation of the third-stage simulation in the reaction and reference chambers.
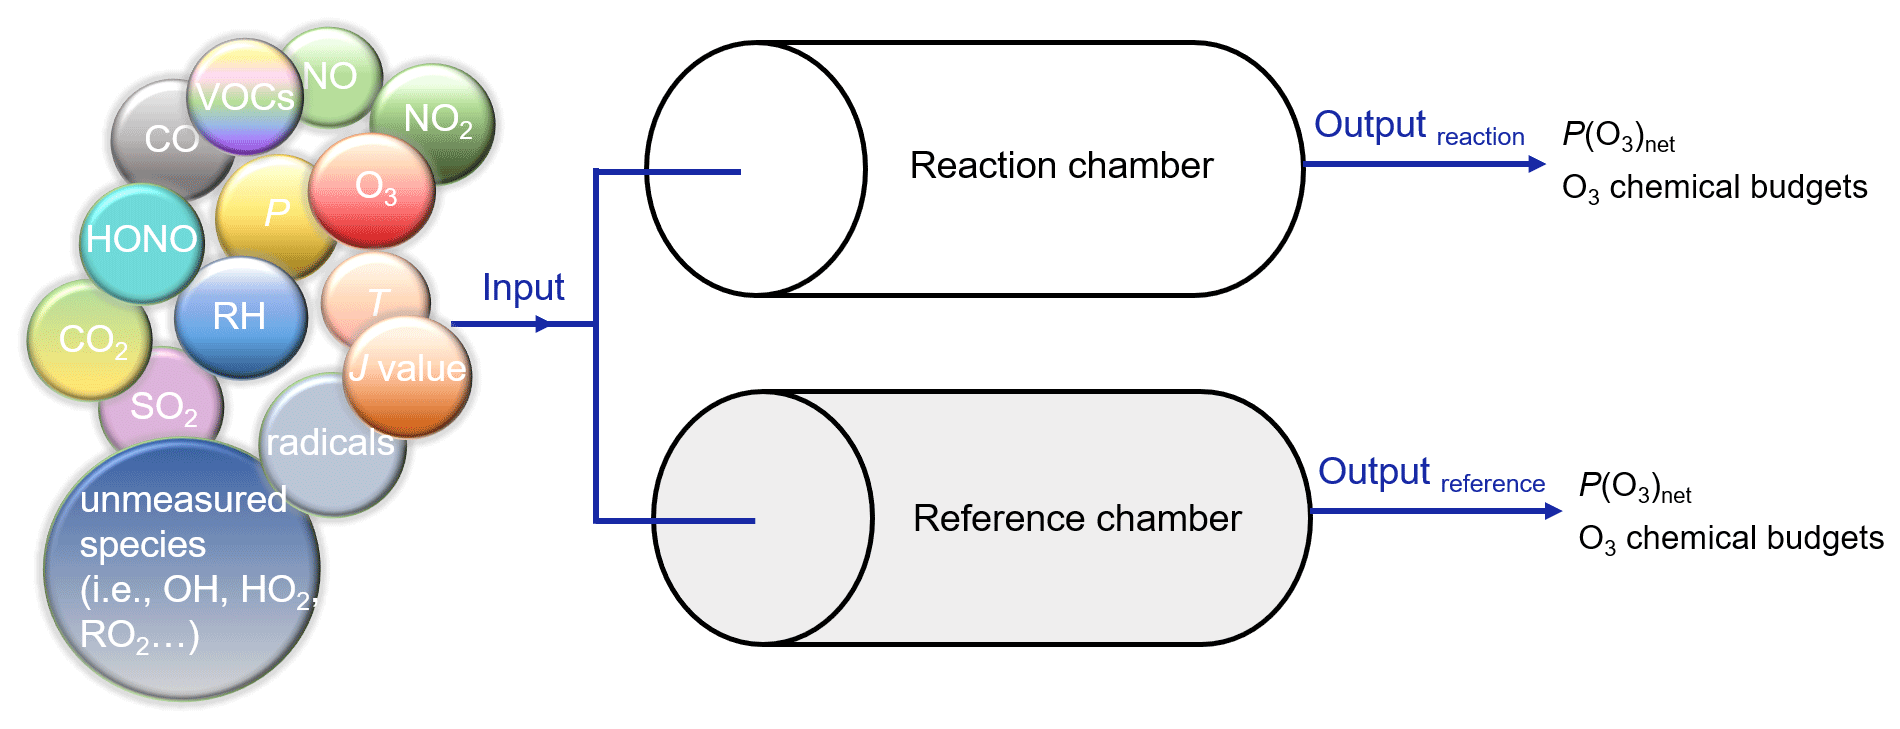
Figure 7Explicit explanation of the third-stage model simulation. The input meteorological conditions are as follows: P is 1015.3 hPa, T is 295.6 K, and RH is 39.7 %.
Specifically, because the photolysis frequencies play critical roles in the simulation of P(O3)net, the J values obtained from two methods (labeled methods I and II) were used in the third-stage 4 min simulation. The J values used in method I were obtained from the measured values (including J(NO2), J(O1D), J(HONO), J(H2O2), J(NO3_M), J(NO3_R), J(HCHO_M), and J(HCHO_R)), and the simulated values were obtained using the TUV model (version 5.3) (including J(HNO3), J(CH3CHO), J(MACR), J(MEK), J(HOCH2CHO), J(C2H5CHO), J(C3H7CHO), and J(C4H9CHO)), while the J values in method II were all obtained from the simulated values using the TUV model; detailed information on these two methods is introduced in Sect. S4 (Tables S12 and S13, respectively).
3.2.2 Radical chemistry in the reaction and reference chambers
The variations in the radical mixing ratios (i.e., HO2, OH, RO2) and NO3, NO, NO2, and O3 mixing ratios obtained from methods I and II during the third-stage 4 min model simulation are shown in Figs. 8 and S18, respectively. The production and destruction reactions of HO2, OH, RO2, and NO3 in the reaction and reference chambers obtained from methods I and II are shown in Figs. 9 and S19, respectively; the production and destruction reactions of ROx in the reaction and reference chambers obtained from methods I and II are shown in Fig. S20; the detailed ROx production pathways of NO3 + VOCs are shown in Fig. S21; and the final modeling results are shown in Figs. 10 and S22.
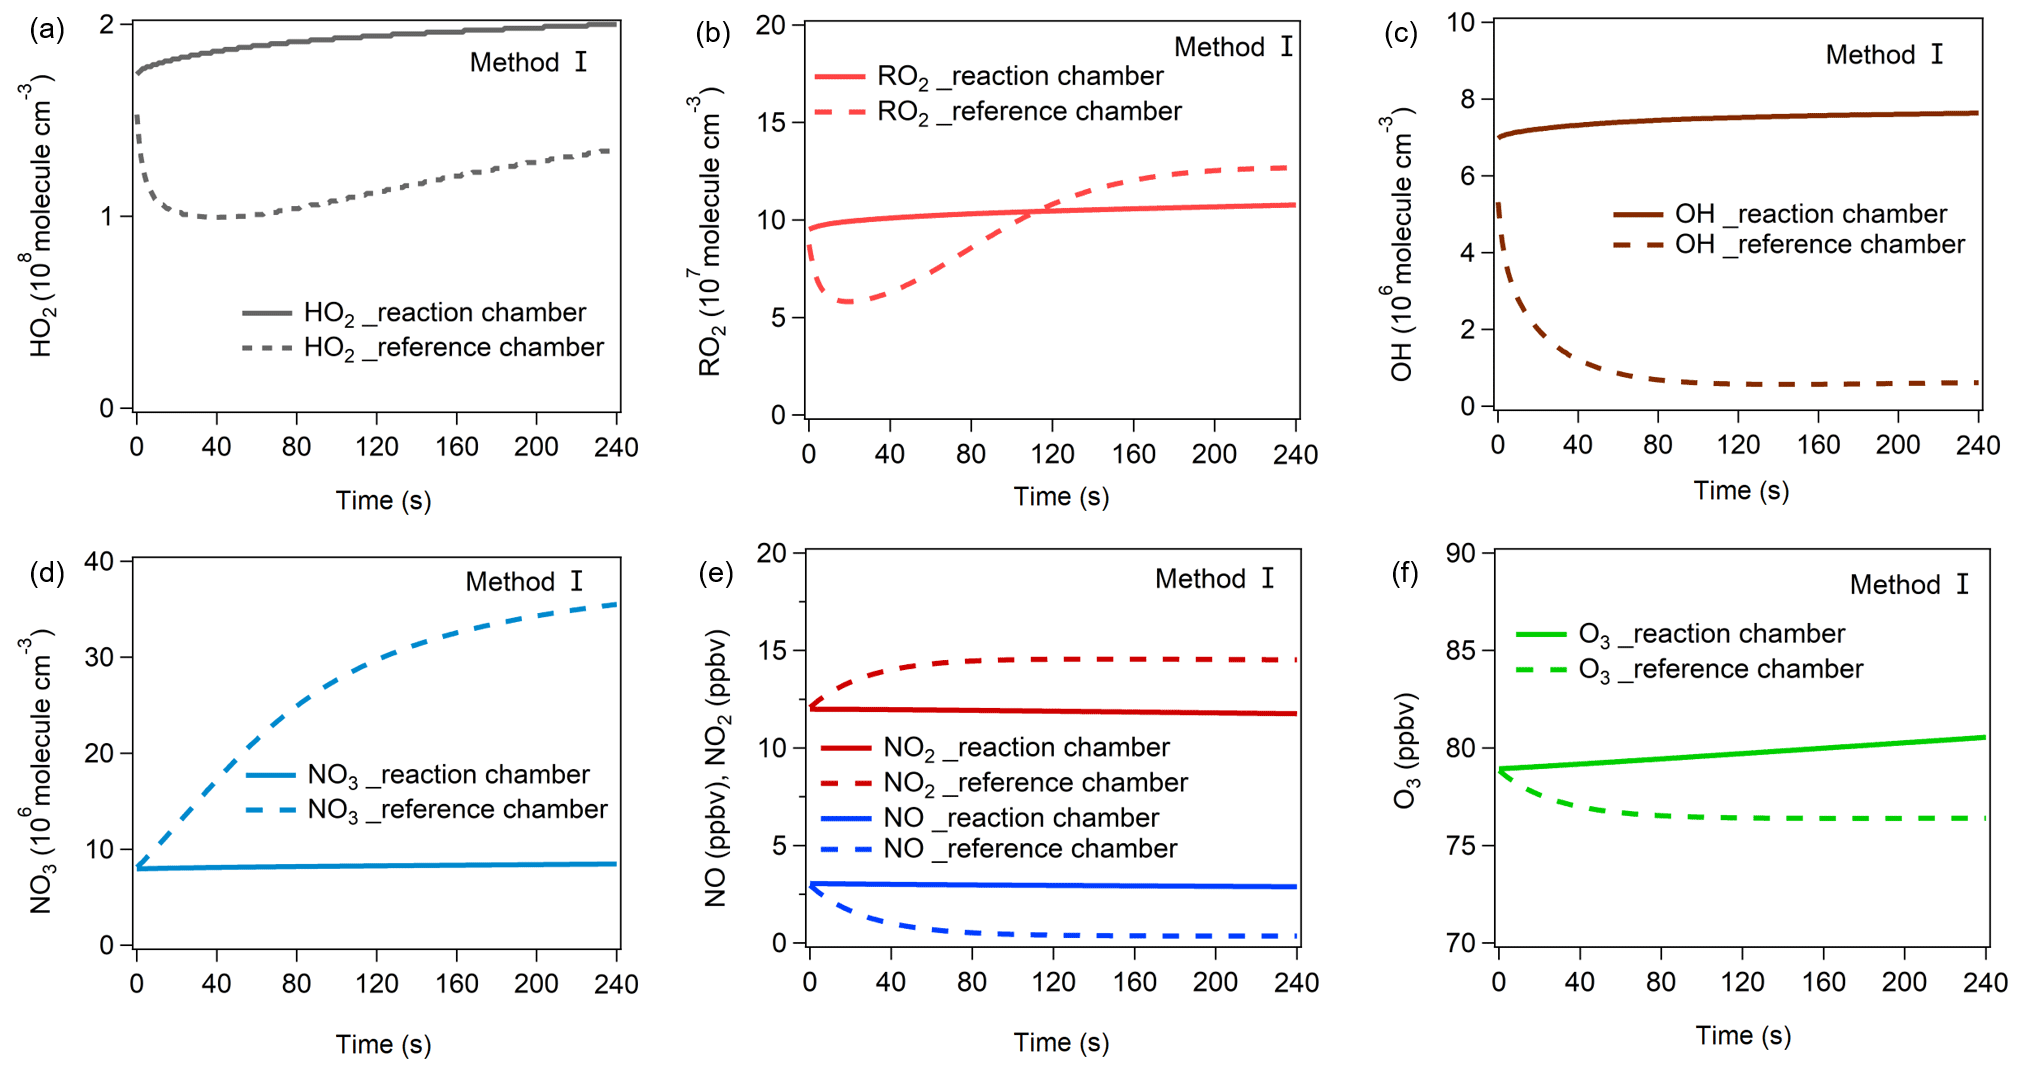
Figure 8The variations in (a) HO2, (b) RO2, (c) OH, (d) NO3, (e) NO, NO2, and (f) O3 mixing ratios during the third-stage 4 min model simulation using method I. The mixing ratio changes in these items for method II are shown in Fig. S18.
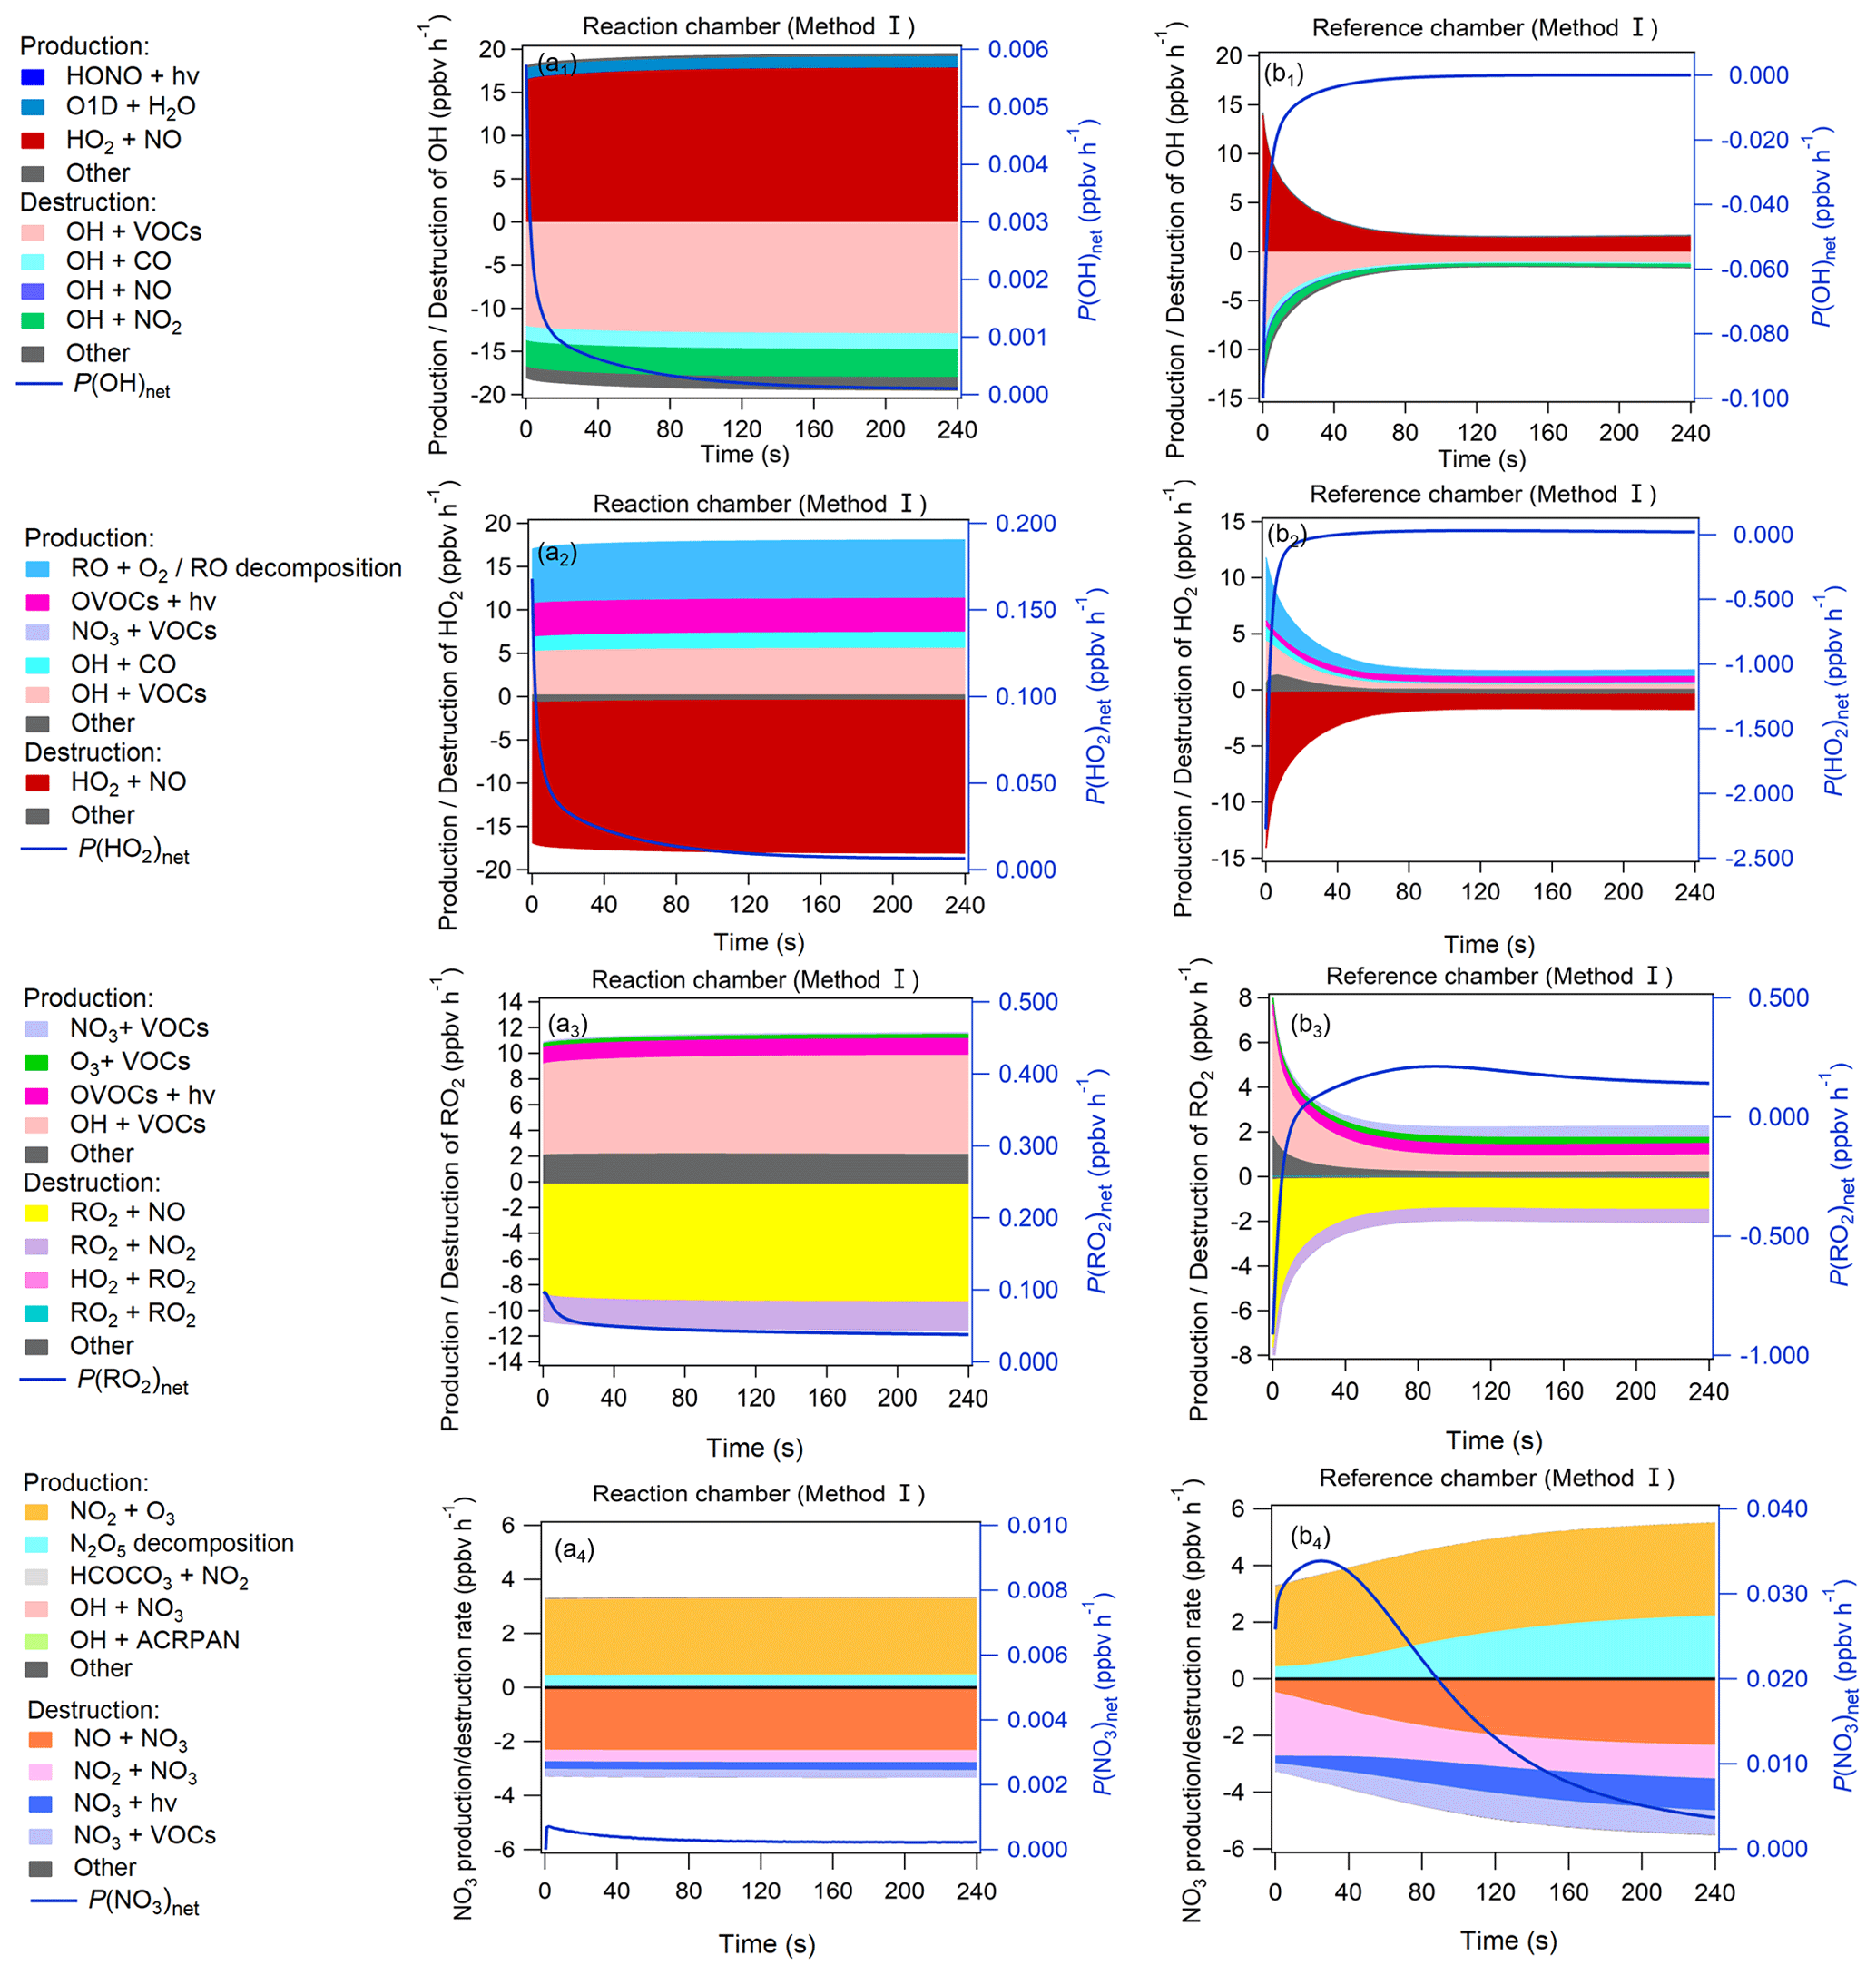
Figure 9Production and destruction pathways of OH (a1, b1), HO2 (a2, b2), RO2 (a3, b3), and NO3 (a4, b4) during the third-stage 4 min model simulation in the reaction and reference chambers in method I. The related content for method II is shown in Fig. S19 in the Supplement.
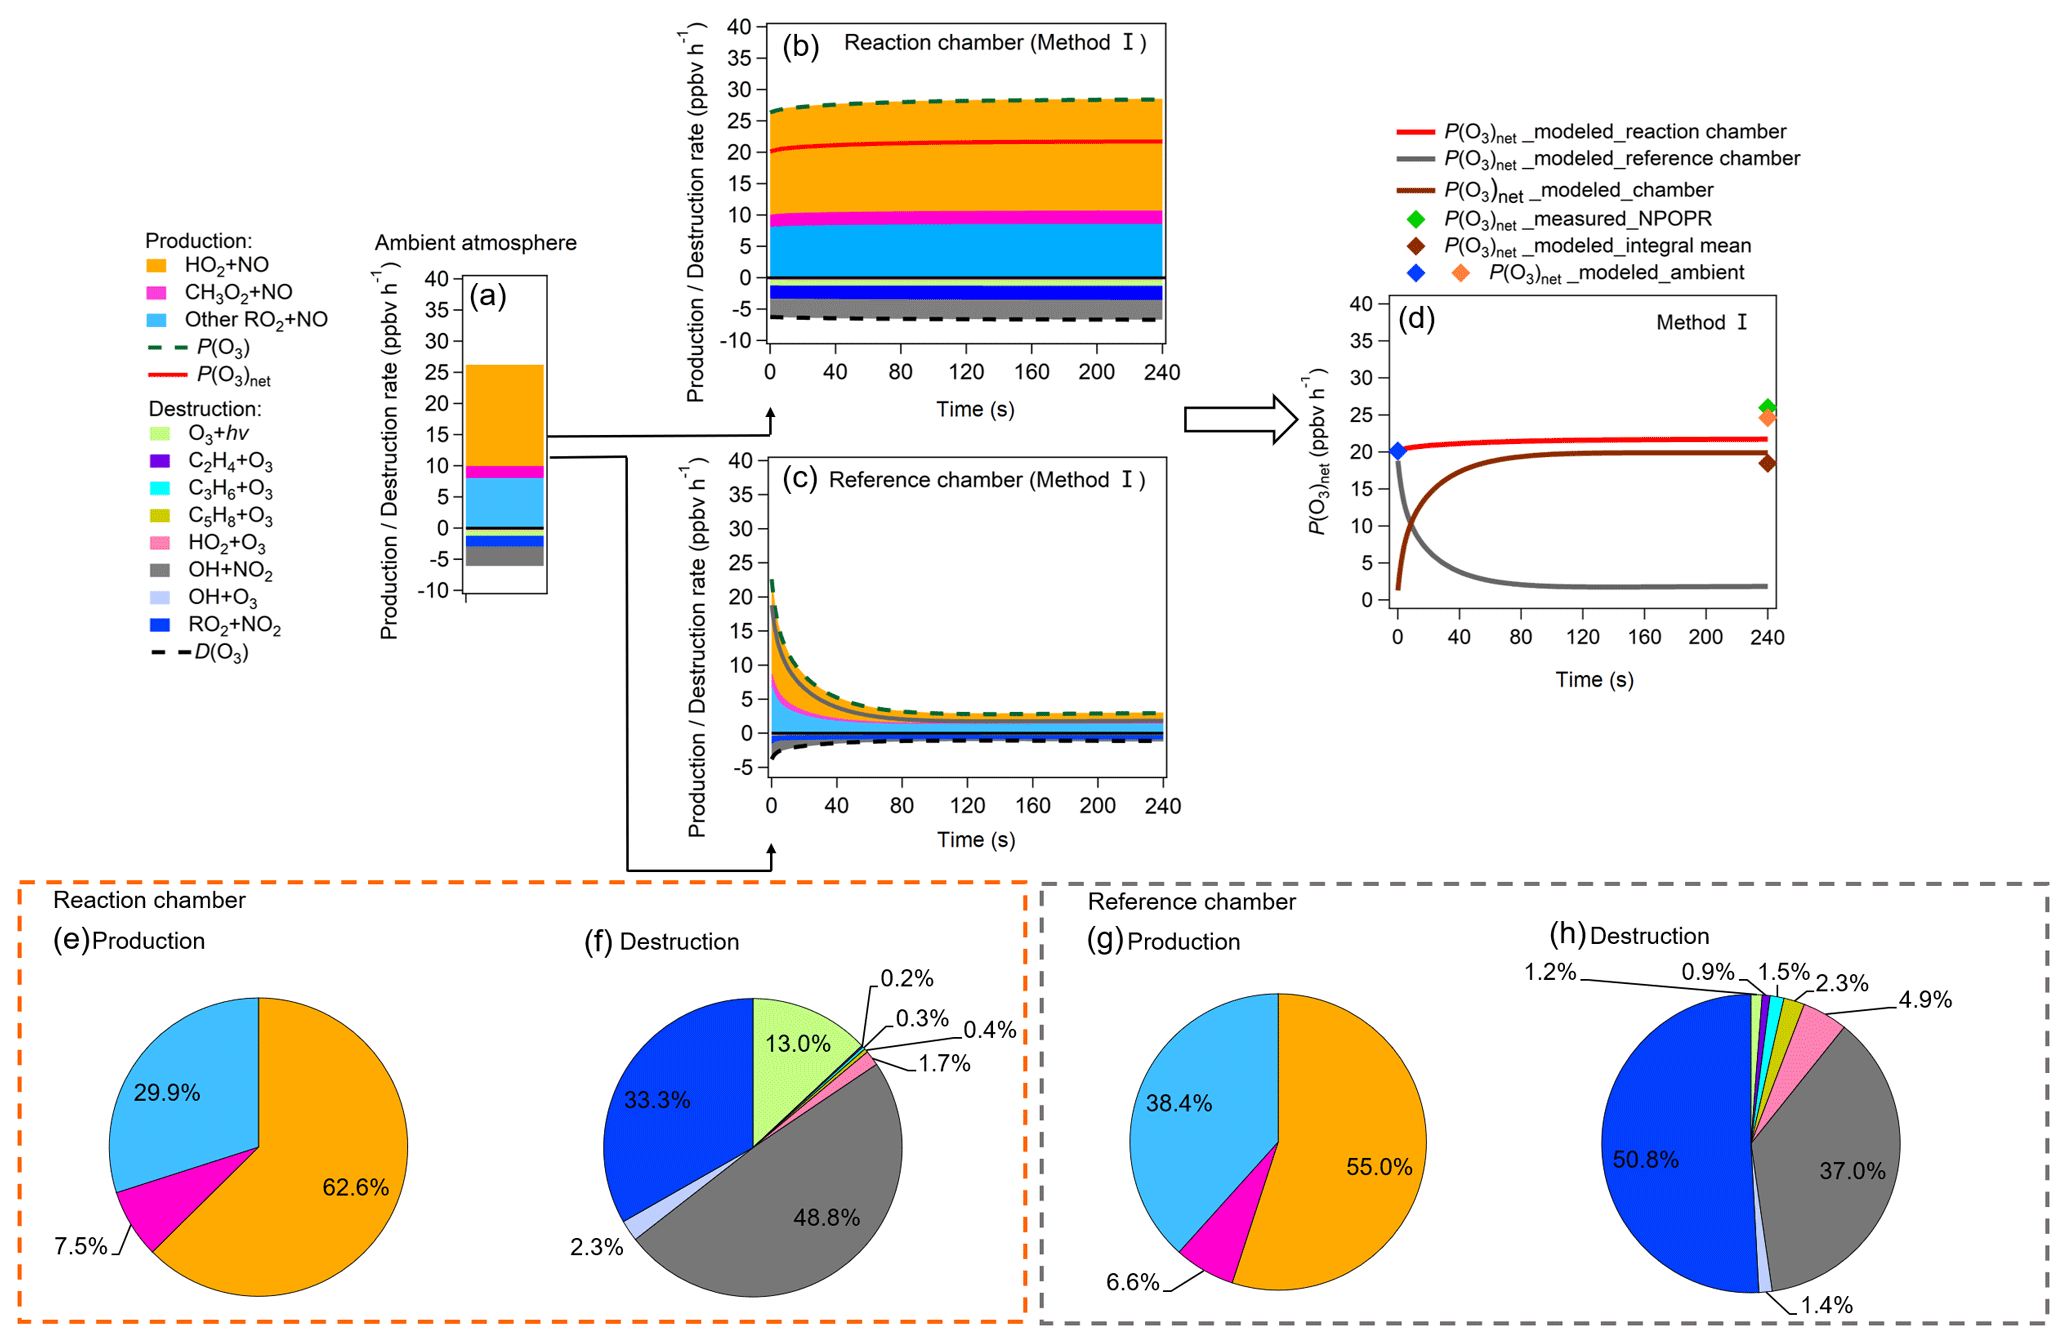
Figure 10(a–c) Modeled P(O3)net values and O3 chemical budgets in (a) ambient air when injected into the reaction and reference chambers and (b–c) the reaction and reference chambers during the 4 min model simulation. (d) P(O3)net, where P(O3)net_modeled_ambient represents the modeled P(O3)net in the ambient air at the time before (blue point) and after (orange point) the sampled ambient air was injected into the dual-channel reaction chamber. P(O3)net_modeled_reaction chamber and P(O3)net_modeled_reference chamber represent the P(O3)net change trends during the 4 min photochemical reactions in the reaction and reference chambers, respectively. P(O3)net_modeled_chamber represents the difference of P(O3)net_modeled_reaction chamber and P(O3)net_modeled_reference chamber, and P(O3)net_modeled_integral mean represents the integral mean of the P(O3)net_modeled_chamber. Moreover, P(O3)net_measured_NPOPR is the P(O3)net measured by NPOPR detection system. (e–h) Reaction weights of each production and destruction reaction process of O3 in the reaction and reference chambers in method I.
From Fig. 8, in the reaction chamber the HO2, OH, RO2, and NO3 concentrations first slightly increased and then became stable, and their final concentrations were 2.00 × 10⁸, 7.64 × 10⁶, 1.08 × 10⁸, and 8.47 × 10⁶ molec. cm−3, respectively. In the reference chamber, the HO2 and RO2 concentrations dropped during the first half minute and rose afterward. The final HO2 concentration (1.35 × 10⁸ molec. cm−3) was lower than that in the reaction chamber, while the RO2 concentration exceeded that in the reaction chamber at the end of the second minute and gradually became stable at 1.27 × 10⁸ molec. cm−3. The OH concentration dropped significantly at the first minute and then became stable at approximately 6.16 × 10⁵ molec. cm−3. The NO3 concentration rose significantly during the 4 min simulation and reached 3.55 × 10⁷ molec. cm−3 at the end, which was much higher than that in the reaction chamber.
The OH, HO2, RO2, and NO3 concentrations greatly impact the O3 production and destruction rate. To better understand the factors that drive the OH, HO2, RO2, and NO3 concentration changes, we have added their production and destruction pathways in Fig. 9. We found that the decrease in HO2 and RO2 concentrations in the reference chamber in the first half minute was mainly due to NO titration effects, as high NO mixing ratios existed during the first half minute. The increase in HO2 concentrations afterward was largely attributable to RO + O2 reaction RO decomposition, OH + CO VOC reaction, OVOC photolysis (i.e., C3H4O2, C2H2O2, C4H6O2), and NO3 + VOC reactions, and the increases in RO2 concentrations afterward were largely attributable to OH + VOC oxidation, OVOC photolysis, and O3 + VOC reactions. The main OH sources in the reference chamber were HO2 + NO in both methods I and II. Due to sufficiently high J(NO3) (∼ 90 % of that in the reaction chamber) and NO2 concentrations in the reference chamber, the NO3 photolysis and NO2 + NO3 reaction consumed NO3 in the reference chamber, but the NO3 concentrations were still sufficiently high due to high production rates of NO3 at the same time. The main NO3 source in the reference chamber was the NO2 + O3 reaction, followed by N2O5 decomposition. The NO concentrations were relatively high in the first minute and consumed NO3 very quickly, but due to continuous NO3 sources, the net NO3 production rates (P(NO3)net) were positive (as shown in Fig. 9), which caused the NO3 concentration to continue to increase (as shown in Fig. 8d). The main difference in NO3 production in the reference chamber compared to that in the reaction chamber was the much higher N2O5 decomposition, which was mainly due to the high NO2 concentrations in the reference chamber. On the other hand, although the NO + NO3 reaction was also one of the dominant NO3 destruction pathways, NO3 consumed by the NO + NO3 reaction was significantly smaller than NO3 produced by the NO2 + O3 reaction. Furthermore, in order to check if the NO3 + VOC reaction exists, we extracted all the P(ROx) pathways related to NO3 + VOC reactions during the third-stage 4 min model simulation in the reaction and reference chambers in method I, as shown in Fig. S21. We found that the NO3 + VOC reactions are mostly related to the OVOCs (i.e., 6-ethyl-m-cresol and 3-ethyl-6-methylbenzene-1,2-diol). The production and destruction rates of ROx are shown in Fig. S20.
3.2.3 P(O3)net formation and destruction pathways in the reaction and reference chambers
Figure 10a–d show the modeled P(O3)net and the sources and sinks of various species during the third-stage 4 min simulation. Figure 10a shows the steady state of P(O3)net and the various species in the ambient atmosphere achieved in the last 1 s of the second-stage simulation. Figure 10b and c show the modeled P(O3)net and the O3 chemical budgets in the reaction and reference chambers during the model simulation period. Figure 10d summarizes the modeled P(O3)net in the ambient air (represented as blue and orange points at the time when the ambient air was going in and out of the NPOPR detection system, respectively) and the modeled P(O3)net in the reaction and reference chambers. To compare the modeled results with our measured results, we calculated the integral mean of the modeled P(O3)net in the reaction and reference chambers and appended the related measured P(O3)net value during the 4 min simulation time onto Fig. 10d (green maker). Furthermore, the reaction weights of different production and destruction reaction processes of O3 are shown in Fig. 10e–h.
Figure 10a–h show the contributions of different reaction pathways to P(O3) and D(O3). P(O3) and D(O3) were almost the same within the 4 min reaction in the reaction chamber (all species reached a steady-state condition), while P(O3) and D(O3) in the reference chamber significantly decreased within the first minute and remained stable in the following minutes. In the reaction chamber, the HO2 + NO reaction contributed the most to P(O3), accounting for 62.6 % of the total P(O3), with an integral mean value of 17.5 ppbv h−1 in the reaction chamber. The second important pathway of P(O3) was RO2 + NO (accounting for 37.4 % of the total P(O3)). The RO2 + NO core reaction accounts for more than approximately 1200 types of RO2 radicals, and the pathway of CH3O2 + NO contributed 7.5 % to the total P(O3). The most important contributor of D(O3) was OH + NO2 (48.8 %), followed by RO2 + NO2 (33.3 %), O3 photolysis (13.0 %), O3 + OH (2.3 %), O3 + HO2 (1.7 %), C5H8 + O3 (0.4 %), C3H6 + O3 (0.3 %), and C2H4 + O3 (0.2 %). In the reference chamber, the integral mean value of the HO2 + NO reaction was 2.3 ppbv h−1, which had the largest contribution to P(O3) (accounting for 55.0 %). The second-largest contributor to P(O3) was RO2 + NO (accounting for 45.0 % of the total P(O3)), in which the pathway of CH3O2 + NO contributed 6.6 % to the total P(O3). The most important contributor of D(O3) was RO2 + NO2 (50.8 %), followed by OH + NO2 (37.0 %), O3 + HO2 (4.9 %), C5H8 + O3 (2.3 %), C3H6 + O3 (1.5 %), O3 + OH (1.4 %), O3 photolysis (1.2 %), and C2H4 + O3 (0.9 %). For all P(O3) reactions, the weight of the RO2 + NO reaction in the reference chamber was 7.5 % higher than that in the reaction chamber; however, for all D(O3) reactions, the weight of the RO2 + NO2 reaction in the reference chamber was 17.5 % higher than that in the reaction chamber, which mitigated the high P(O3) value caused by RO2 + NO in the reference chamber. Furthermore, the weight of the OH + NO2 reaction in the reference chamber was 11.9 % lower than that in the reaction chamber, which may be the main reason that led to NO2 mixing ratios in the reference chamber being much higher than those in the reaction chamber. It is worth noting that the different reaction pathways of P(O3) and D(O3) stabilized at approximately 1.5 min for both methods I and II (as shown in Figs. 10 and S22, respectively), and the radicals that play critical roles in photochemical O3 formation, such as HO2, RO2 and OH, reached quasi-steady states in approximately 3 min (as shown in Figs. 8 and S18). As the lowest experimental residence time in the reaction and reference chambers was 3.8 min at an airflow rate of 5 L min−1, the photochemical reaction time at different airflow rates in the NPOPR detection system was sufficient for P(O3)net investigation, and it is reasonable for us to set the alternate ambient air sampling time for the reaction and reference chambers to 2 min, where the ambient air actually had already reacted for at least 3.8 min in the chambers.
The P(O3)net value measured by the NPOPR detection system at 12:04 LT was 26.0 ppbv h−1, which is 1.4 ppbv h−1 higher than the modeled P(O3)net value in the ambient air (orange point in Fig. 10d; 24.6 ppbv h−1) and 7.5 ppbv h−1 higher than the modeled P(O3)net value of the NPOPR detection system (brown point in Fig. 10d; 18.5 ppbv h−1, as calculated from the integral mean of P(O3)net in the third-stage 4 min simulation in the reaction and reference chambers). Here, we note that for a better comparison between the measured and modeled P(O3)net values, the measured P(O3)net used here was obtained from a 4 min time resolution, which is 1.4 ppbv h−1 higher than the measured P(O3)net value used in Fig. 6 (1 h time resolution). The ratio of the measured and modeled P(O3)net values was 1.4, which is consistent with the measured-to-modeled ratio of the cumulative P(O3)net (1.3 and 1.4) obtained from previous studies (Cazorla et al., 2012; Ren et al., 2013), where P(O3)net values were also directly measured in the atmosphere and were independent of the OH and HO2 measurements. The reason for the difference between the measured and modeled P(O3)net here may be due to the inaccurate estimation of HO2 RO2 radicals; for example, Ren et al. (2013) found that P(O3) calculated from the modeled HO2 was lower than that calculated from the measured HO2. The unknown HO2 source should be identified for a more accurate estimation of P(O3)net in future studies.
Additionally, the modeled P(O3)net using the J values obtained from method II was 9.3 ppbv h−1 lower than the measured P(O3)net, and this discrepancy was slightly larger than that using method I, as shown in Sect. S4 (Fig. S22). The differences in the measured and modeled P(O3)net using methods I and II were 28.8 % and 35.8 %, respectively. This difference was mainly due to the transmittance of J(NO2) in method II (30 %) being much higher than that in method I (9 %), and NO2 photolysis products were involved in the main reaction of O3 production through HO2 + NO and RO2 + NO, so the modeled P(O3)net in the reference chamber was slightly overestimated in method II, thus leading to an underestimation of the final P(O3)net.
Furthermore, because the NO2 data used here were measured by a commercially available chemiluminescence NOx monitor, the NO2 and NOx mixing ratios could be overestimated due to NOz interference (i.e., HNO3, peroxyacetyl nitrate (PANs), HONO) (Dunlea et al., 2007). According to our results, the chemiluminescence technique could bias NO2 by 5 % compared to the CAPS technique, which is regarded as a trustworthy NO2 measurement technique without chemical interference. Therefore, we simulated the interference of NO2 measured by a chemiluminescence NOx monitor in method I by reducing and increasing the ambient NO2 mixing ratios in the reaction and reference chambers by 5 % in the third-stage 4 min simulation. The results showed that increasing and decreasing NO2 by 5 % resulted in a decrease in P(O3)net by 1.64 % and 3.68 %, respectively (as shown in Fig. S23), which is much smaller than the biases caused by P(O3)net in the reference chamber (which were 13.9 % and 22.3 % for methods I and II, respectively). To evaluate the P(O3)net error caused by the measurement error of J values, we introduced a ±5 % error to the measured J values during the third stage of the 4 min simulation in method I. The modeled P(O3)net results are presented in Fig. S24 in the Supplement. We observed that the inclusion of a −5 % measurement error in J values led to a decrease in P(O3)net of 7.27 %, while adding a +5 % measurement error in J values caused an increase in P(O3)net of 3.08 %. This implies that the maximum bias of P(O3)net caused by the measurement error of J values falls within the error range of the currently assessed P(O3)net error, which was 13.9 % for method I. Therefore, we conclude that this type of error will not influence our final modeling results and conclusions.
In conclusion, modeling tests demonstrated that the radicals and gas species in the reaction chamber of the NPOPR detection system were similar to those in genuine ambient air, but these radicals also unexpectedly existed in the reference chamber. This was mainly because the UV protection film used by the reference chamber did not completely filter out sunlight, which led to the low transmittance of light ranging from 390 to 790 nm. The P(O3)net biases caused by this interference modeled in methods I and II were 13.9 % and 22.3 %, respectively, which ensured that the measured P(O3)net by the NPOPR detection system should be regarded as the lower limit values of real P(O3)net in the atmosphere. We recommend that the J values obtained from method I should be used in the model simulation, which can better explain the photochemical formation of O3 in the actual atmosphere, but if direct J value measurements cannot be achieved during field observations, the J values obtained from method II would also be acceptable in modeling studies.
We modified and improved a net photochemical ozone production rate (NPOPR) detection system based on a dual-channel reaction chamber technique that provides more accurate results and has broader application potential compared to previous studies. The main improvements of the NPOPR detection system compared to previous studies were as follows: (1) the improvement of the design of the reaction and reference chambers to make sure they have good airtightness; (2) a change to the air sampling structure to enable the total airflow rates to change freely from 1.3 to 5 L min−1 in the reaction and reference chambers, which can make the NPOPR detection system achieve different limits of detection (LODs) and applicable to different ambient environments; (3) characterization of the NPOPR detection system at different airflow rates to optimize the P(O3)net measurements, where the LODs of the NPOPR detection system are 0.07, 1.4, and 2.3 ppbv h−1 at airflow rates of 1.3, 3, and 5 L min−1, respectively; and (4) testing of the performance of both reaction and reference chambers by combining the field measurement and the MCM modeling method.
The NPOPR detection system was employed in the field observation at the Shenzhen Meteorological Gradient Tower (SZMGT), which is located in the PRD, China. During the measurement period, the P(O3)net was around zero during nighttime and ranged from ∼ 0 to 34.1 ± 7.8 ppbv h−1 during daytime (from 06:00–18:00 LT), with an average value of 12.8 (± 5.5) ppbv h−1. In addition, P(O3)net starts to increase at around 07:00 LT; this may be due to the rise in the O3 precursors (i.e., VOCs) transported down from the high-altitude atmospheric residual layer to near the surface and the increase in solar radiation intensity increasing the atmospheric oxidation capacity. P(O3)net then reaches a peak at around 12:00 LT, and by coupling this with diurnal O3 mixing ratio trends, we confirmed that the ground-level O3 mixing ratios were influenced by both photochemical production and physical transport.
In order to clarify the detailed photochemical reaction processes in the reaction and reference chambers of NPOPR detection system, we modeled the P(O3)net on 7 December 2021 at 12:00–12:04 LT in the reaction and reference chambers using MCM v3.3.1. As the photolysis frequencies of different species (J values) play critical roles in the formation of P(O3)net, the J values obtained from two methods were used in the 4 min chamber photochemical reaction (labeled as methods I and II); in method I, eight main J values (e.g., J(NO2), J(O1D), J(HONO)) were measured directly, and other J values were obtained from the simulated values using the tropospheric ultraviolet and visible (TUV) radiation model, while in method II, J values were all obtained from the simulated values using the TUV model (as described in Sect. 3.2). Modeling tests demonstrated that the mixing ratios of different radicals and gas species (i.e., OH, HO2, RO2, NO3, NO, NO2, and O3) in the reaction chamber were similar with those in the real ambient environment, but because the UV protection film used by the reference chamber does not completely filter out the sunlight, there was low transmittance of light that ranged from 390 nm to 790 nm, which caused a low amount of P(O3)net in the reference chamber. In the reaction chamber, the contribution of different reactions to P(O3) and D(O3) modeled by methods I and II were quite similar, where the HO2 + NO reaction contributed most to P(O3) (∼ 62.6 %), followed by the RO2 + NO reaction (∼ 37.4 %). The OH + NO2 reaction contributed most to D(O3), which accounted for ∼ 48.9 %, followed by the RO2 + NO2 reaction O3 photolysis, which accounted for ∼ 33.3 % and 13.0 %, respectively. In the reference chamber, the contribution of different reactions to P(O3) and D(O3) modeled by method I and II were different, where the HO2 + NO reaction contributed ∼ 55.0 % and ∼ 58.2 % to the total P(O3), respectively, and RO2 + NO contributed ∼ 44.9 % and 41.8 % to the total P(O3), respectively. The most important contributor of D(O3) modeled by method I was RO2 + NO2 (50.8 %), followed by OH + NO2 (37.0 %), while the most important contributor of D(O3) modeled by method II was OH + NO2 (46.8 %), followed by RO2 + NO2 (44.1 %). For all P(O3) reactions, the weight of the RO2 + NO reaction in the reference chamber was 7.5 % and 4.3 % higher than that in the reaction chamber in method I and II, respectively; however, for all D(O3) reactions, the weight of RO2 + NO2 reaction in the reference chamber was 17.5 % and 10.9 % higher than that in the reaction chamber in method I and II, respectively, which somewhat mitigates the high P(O3) caused by RO2 + NO in the reference chamber. The different reaction pathways of P(O3) and D(O3) had stabilized at around 1.5 min, and the radicals that play critical roles in photochemical O3 formation, such as HO2, RO2, and OH, reached quasi-steady states in about 3 min; the long-enough ambient air residence times in the reaction and reference chambers (≥ 3.8 min) make the photochemical reaction time at different airflow rates in the NPOPR detection system sufficient enough for investigating the P(O3)net, and it is reasonable for us to set the alternate ambient air sampling time for the reaction and reference chambers at 2 min as the ambient air has actually already reacted for at least 3.8 min in the chambers.
The biases of the modeled P(O3)net caused by the interference of the reactions in the reference chamber in methods I and II were 13.9 % and 22.3 %, respectively; thus, the measured P(O3)net by the NPOPR detection system should be regarded as the lower limit values of the real P(O3)net in the atmosphere. Nevertheless, the measured P(O3)net values were 7.5 and 9.3 ppbv h−1 higher than the modeled P(O3)net values obtained from methods I and II, respectively, which may be due to the inaccurate modeling of HO2 RO2 radicals. Short-lived intermediate measurements coupled with direct P(O3)net measurements are needed in a future study in order to better understand the photochemical O3 production and destruction mechanisms. We recommend that the J values obtained from method I should be used in the model simulation, which can better explain the photochemical formation of O3 in the actual atmosphere, but if direct J value measurements cannot be achieved during field observations, the J values obtained from method II would also be acceptable in modeling studies.
The self-built NPOPR detection system in this study filled the gap in the observation method in China. The research results not only help us to better understand the tropospheric O3 budget but also provide an important data basis for formulating correct O3 pollution prevention measures and control strategies.
The observational data used in this study are available from the corresponding authors upon request (junzhou@jnu.edu.cn).
The supplement related to this article is available online at: https://doi.org/10.5194/acp-23-9891-2023-supplement.
JZ, BY, and MS designed the experiment. JZ and YHa developed and assembled the NPOPR detection system. YHa, JZ, JPZ, BY, YWa, YWu, ShY, YP, JQ, XH, XS, and YC collected and analyzed the data. YHa and JZ wrote the manuscript. All authors revised the manuscript.
The contact author has declared that none of the authors has any competing interests.
Publisher's note: Copernicus Publications remains neutral with regard to jurisdictional claims in published maps and institutional affiliations.
We thank Nan Ma and Xiaofeng Su from the Institute for Environmental and Climate Research of Jinan University for the HONO production experiment.
This research has been supported by the Natural Science Foundation of Guangdong Province (grant no. 2020A1515110526) and the Key-Area Research and Development Program of Guangdong Province (grant no. 2020B1111360003).
This paper was edited by Anne Perring and reviewed by two anonymous referees.
Avnery, S., Mauzerall, D. L., Liu, J., and Horowitz, L. W.: Global crop yield reductions due to surface ozone exposure: 1. Year 2000 crop production losses and economic damage, Atmos. Environ., 45, 2284–2296, https://doi.org/10.1016/j.atmosenv.2010.11.045, 2011.
Baier, B. C., Brune, W. H., Lefer, B. L., Miller, D. O., and Martins, D. K.: Direct ozone production rate measurements and their use in assessing ozone source and receptor regions for Houston in 2013, Atmos. Environ., 114, 83–91, https://doi.org/10.1016/j.atmosenv.2015.05.033, 2015.
Baier, B. C., Brune, W. H., Miller, D. O., Blake, D., Long, R., Wisthaler, A., Cantrell, C., Fried, A., Heikes, B., Brown, S., McDuffie, E., Flocke, F., Apel, E., Kaser, L., and Weinheimer, A.: Higher measured than modeled ozone production at increased NOx levels in the Colorado Front Range, Atmos. Chem. Phys., 17, 11273–11292, https://doi.org/10.5194/acp-17-11273-2017, 2017.
Bell, M. L., McDermott, A., Zeger, S. L., Samet, J. M., and Dominici, F.: Ozone and short-term mortality in 95 US urban communities, J. Am. Med. Assoc., 292, 2372–2378, https://doi.org/10.1001/jama.292.19.2372, 2004.
Berman, J. D., Fann, N., Hollingsworth, J. W., Pinkerton, K. E., Rom, W. N., Szema, A. M., Breysse, P. N., White, R. H., and Curriero, F. C.: Health benefits from large-scale ozone reduction in the United States, Environ. Health. Persp., 120, 1404–1410, https://doi.org/10.1289/ehp.1104851, 2012.
Bohn, B. and Lohse, I.: Calibration and evaluation of CCD spectroradiometers for ground-based and airborne measurements of spectral actinic flux densities, Atmos. Meas. Tech., 10, 3151–3174, https://doi.org/10.5194/amt-10-3151-2017, 2017.
Burkholder, J., Sander, S., Abbatt, J., Barker, J., Cappa, C., Crounse, J., Dibble, T., Huie, R., Kolb, C., and Kurylo, M.: Chemical kinetics and photochemical data for use in atmospheric studies, evaluation number 19, Jet Propulsion Laboratory, National Aeronautics and Space Administration, Pasadena, CA, http://jpldataeval.jpl.nasa.gov (last access: 27 June 2023), 2020.
Cazorla, M. and Brune, W. H.: Measurement of Ozone Production Sensor, Atmos. Meas. Tech., 3, 545–555, https://doi.org/10.5194/amt-3-545-2010, 2010.
Cazorla, M., Brune, W. H., Ren, X., and Lefer, B.: Direct measurement of ozone production rates in Houston in 2009 and comparison with two estimation methods, Atmos. Chem. Phys., 12, 1203–1212, https://doi.org/10.5194/acp-12-1203-2012, 2012.
Dunlea, E. J., Herndon, S. C., Nelson, D. D., Volkamer, R. M., San Martini, F., Sheehy, P. M., Zahniser, M. S., Shorter, J. H., Wormhoudt, J. C., Lamb, B. K., Allwine, E. J., Gaffney, J. S., Marley, N. A., Grutter, M., Marquez, C., Blanco, S., Cardenas, B., Retama, A., Ramos Villegas, C. R., Kolb, C. E., Molina, L. T., and Molina, M. J.: Evaluation of nitrogen dioxide chemiluminescence monitors in a polluted urban environment, Atmos. Chem. Phys., 7, 2691–2704, https://doi.org/10.5194/acp-7-2691-2007, 2007.
Jenkin, M. E., Young, J. C., and Rickard, A. R.: The MCM v3.3.1 degradation scheme for isoprene, Atmos. Chem. Phys., 15, 11433–11459, https://doi.org/10.5194/acp-15-11433-2015, 2015.
Kanaya, Y., Tanimoto, H., Yokouchi, Y., Fumikazu Taketani, F. T., Komazaki, Y., Irie, H., Takashima, H., Pan, X., Nozoe, S., and Inomata, S.: Diagnosis of photochemical ozone production rates and limiting factors in continental outflow air masses reaching Fukue Island, Japan: ozone-control implications, Aerosol Air. Qual. Res., 16, 430–441, https://doi.org/10.4209/aaqr.2015.04.0220, 2016.
Karakatsani, A., Kapitsimadis, F., Pipikou, M., Chalbot, M. C., Kavouras, I. G., Orphanidou, D., Papiris, S., and Katsouyanni, K.: Ambient air pollution and respiratory health effects in mail carriers, Environ. Res., 110, 278–285, https://doi.org/10.1016/j.envres.2009.11.002, 2010.
Kebabian P. L., Herndon S. C., and Freedman, A.: Detection of Nitrogen Dioxide by Cavity Attenuated Phase Shift Spectroscopy, Anal. Chem., 77, 724–728, https://doi.org/10.1021/ac048715y, 2005.
Kebabian P. L., Wood E. C., Herndon S. C., and Freedman, A.: A Practical alternative to chemiluminescence-based detection of Nitrogen Dioxide: Cavity Attenuated Phase Shift Spectroscopy, Environ. Sci. Technol., 42, 6040–6045, https://doi.org/10.1021/es703204j, 2008.
Lee, S.-B., Bae, G.-N., Lee, Y.-M., Moon, K.-C., and Choi, M.: Correlation between light intensity and ozone formation for photochemical smog in urban air of seoul, Aerosol Air. Qual. Res., 10, 540–549, https://doi.org/10.4209/aaqr.2010.05.0036, 2010.
Liu, S. C.: Possible effects on fropospheric O3 and OH due to NO emissions, Geophys. Res. Lett., 4, 325–328, https://doi.org/10.1029/GL004i008p00325, 1977.
Lu, K., Zhang, Y., Su, H., Brauers, T., Chou, C. C., Hofzumahaus, A., Liu, S. C., Kita, K., Kondo, Y, Shao, M., Wahner, A., Wang, J., Wang, X., and Zhu, T.: Oxidant (O3 + NO2) production processes and formation regimes in Beijing, J. Geophys. Res.-Atmos., 115, D07303, https://doi.org/10.1029/2009JD012714, 2010.
Malley, C. S., Henze, D. K., Kuylenstierna, J. C. I., Vallack, H. W., Davila, Y., Anenberg, S. C., Turner, M. C., and Ashmore, M. R.: Updated global estimates of respiratory mortality in adults = 30 years of age attributable to long-term ozone exposure, Environ. Health. Persp., 125, 087021, https://doi.org/10.1289/EHP1390, 2017.
Martinez, M.: OH and HO2 concentrations, sources, and loss rates during the Southern Oxidants Study in Nashville, Tennessee, summer 1999, J. Geophys. Res.-Atmos., 108, 4617, https://doi.org/10.1029/2003JD003551, 2003.
Mazzuca, G. M., Ren, X., Loughner, C. P., Estes, M., Crawford, J. H., Pickering, K. E., Weinheimer, A. J., and Dickerson, R. R.: Ozone production and its sensitivity to NOx and VOCs: results from the DISCOVER-AQ field experiment, Houston 2013, Atmos. Chem. Phys., 16, 14463–14474, https://doi.org/10.5194/acp-16-14463-2016, 2016.
Mills, G., Sharps, K., Simpson, D., Pleijel, H., Broberg, M., Uddling, J., Jaramillo, F., Davies, W. J., Dentener, F., Van den Berg, M., Agrawal, M., Agrawal, S. B., Ainsworth, E. A., Buker, P., Emberson, L., Feng, Z., Harmens, H., Hayes, F., Kobayashi, K., Paoletti, E., and Van Dingenen, R.: Ozone pollution will compromise efforts to increase global wheat production, Glob. Chang. Biol., 24, 3560–3574, https://doi.org/10.1111/gcb.14157, 2018.
O'Neill, M. S., Jerrett, M., Kawachi, I., Levy, J. I., Cohen, A. J., Gouveia, N., Wilkinson, P., Fletcher, T., Cifuentes, L., and Schwartz, J.: Health, wealth, and air pollution: advancing theory and methods, Environ. Health. Persp., 111, 1861–1870, https://doi.org/10.1289/ehp.6334, 2003.
Pan, X., Kanaya, Y., Tanimoto, H., Inomata, S., Wang, Z., Kudo, S., and Uno, I.: Examining the major contributors of ozone pollution in a rural area of the Yangtze River Delta region during harvest season, Atmos. Chem. Phys., 15, 6101–6111, https://doi.org/10.5194/acp-15-6101-2015, 2015.
Ren, X., van Duin, D., Cazorla, M., Chen, S., Mao, J., Zhang, L., Brune, W. H., Flynn, J. H., Grossberg, N., Lefer, B. L., Rappenglück, B., Wong, K. W., Tsai, C., Stutz, J., Dibb, J. E., Thomas Jobson, B., Luke, W. T., and Kelley, P.: Atmospheric oxidation chemistry and ozone production: results from SHARP 2009 in Houston, Texas, J. Geophys. Res.-Atmos., 118, 5770–5780, https://doi.org/10.1002/jgrd.50342, 2013.
Sadanaga, Y., Kawasaki, S., Tanaka, Y., Kajii, Y., and Bandow, H.: New system for measuring the photochemical ozone production rate in the atmosphere, Environ. Sci. Technol., 51, 2871–2878, https://doi.org/10.1021/acs.est.6b04639, 2017.
Shen, H., Liu, Y., Zhao, M., Li, J., Zhang, Y., Yang, J., Jiang, Y., Chen, T., Chen, M., Huang, X., Li, C., Guo, D., Sun, X., Xue, L., and Wang, W.: Significance of carbonyl compounds to photochemical ozone formation in a coastal city (Shantou) in eastern China, Sci. Total. Environ., 764, 144031, https://doi.org/10.1016/j.scitotenv.2020.144031, 2021.
Sklaveniti, S., Locoge, N., Stevens, P. S., Wood, E., Kundu, S., and Dusanter, S.: Development of an instrument for direct ozone production rate measurements: measurement reliability and current limitations, Atmos. Meas. Tech., 11, 741–761, https://doi.org/10.5194/amt-11-741-2018, 2018.
Tadic, I., Crowley, J. N., Dienhart, D., Eger, P., Harder, H., Hottmann, B., Martinez, M., Parchatka, U., Paris, J.-D., Pozzer, A., Rohloff, R., Schuladen, J., Shenolikar, J., Tauer, S., Lelieveld, J., and Fischer, H.: Net ozone production and its relationship to nitrogen oxides and volatile organic compounds in the marine boundary layer around the Arabian Peninsula, Atmos. Chem. Phys., 20, 6769–6787, https://doi.org/10.5194/acp-20-6769-2020, 2020.
Wang, C., Yuan, B., Wu, C., Wang, S., Qi, J., Wang, B., Wang, Z., Hu, W., Chen, W., Ye, C., Wang, W., Sun, Y., Wang, C., Huang, S., Song, W., Wang, X., Yang, S., Zhang, S., Xu, W., Ma, N., Zhang, Z., Jiang, B., Su, H., Cheng, Y., Wang, X., and Shao, M.: Measurements of higher alkanes using NO+ chemical ionization in PTR-ToF-MS: important contributions of higher alkanes to secondary organic aerosols in China, Atmos. Chem. Phys., 20, 14123–14138, https://doi.org/10.5194/acp-20-14123-2020, 2020.
Wang, F., An, J., Li, Y., Tang, Y., Lin, J., Qu, Y., Chen, Y., Zhang, B., and Zhai, J.: Impacts of uncertainty in AVOC emissions on the summer ROx budget and ozone production rate in the three most rapidly-developing economic growth regions of China, Adv. Atmos. Sci., 31, 1331–1342, https://doi.org/10.1007/s00376-014-3251-z, 2014.
Wu, C., Wang, C., Wang, S., Wang, W., Yuan, B., Qi, J., Wang, B., Wang, H., Wang, C., Song, W., Wang, X., Hu, W., Lou, S., Ye, C., Peng, Y., Wang, Z., Huangfu, Y., Xie, Y., Zhu, M., Zheng, J., Wang, X., Jiang, B., Zhang, Z., and Shao, M.: Measurement report: Important contributions of oxygenated compounds to emissions and chemistry of volatile organic compounds in urban air, Atmos. Chem. Phys., 20, 14769–14785, https://doi.org/10.5194/acp-20-14769-2020, 2020.
Yuan, B., Chen, W., Shao, M., Wang, M., Lu, S., Wang, B., Liu, Y., Chang, C.-C., and Wang, B.: Measurements of ambient hydrocarbons and carbonyls in the Pearl River Delta (PRD), China, Atmos. Res., 116, 93–104, https://doi.org/10.1016/j.atmosres.2012.03.006, 2012.
Zhang, A., Lin, J., Chen, W., Lin, M., and Lei, C.: Spatial-temporal distribution variation of ground-level ozone in China's Pearl River Delta metropolitan region, Int. J. Environ. Res. Public Health., 18, 872, https://doi.org/10.3390/ijerph18030872, 2021.
Zhou, W., Cohan, D. S., and Henderson, B. H.: Slower ozone production in Houston, Texas following emission reductions: evidence from Texas Air Quality Studies in 2000 and 2006, Atmos. Chem. Phys., 14, 2777–2788, https://doi.org/10.5194/acp-14-2777-2014, 2014.
Zhu, M., Dong, H., Yu, F., Liao, S., Xie, Y., Liu, J., Sha, Q., Zhong, Z., Zeng, L., and Zheng, J.: A new portable instrument for online measurements of formaldehyde: from ambient to mobile emission sources, Environ. Sci. Technol. Lett., 7, 292–297, https://doi.org/10.1021/acs.estlett.0c00169, 2020.
Zou, Y., Deng, X. J., Zhu, D., Gong, D. C., Wang, H., Li, F., Tan, H. B., Deng, T., Mai, B. R., Liu, X. T., and Wang, B. G.: Characteristics of 1 year of observational data of VOCs, NOx and O3 at a suburban site in Guangzhou, China, Atmos. Chem. Phys., 15, 6625–6636, https://doi.org/10.5194/acp-15-6625-2015, 2015.