the Creative Commons Attribution 4.0 License.
the Creative Commons Attribution 4.0 License.
 | 22 Aug 2023
Atlantic Multidecadal Oscillation modulates the relationship between El Niño–Southern Oscillation and fire weather in Australia
Guanyu Liu
Tong Ying
The El Niño–Southern Oscillation (ENSO) is a crucial driver of fire weather in Australia, with the correlation between ENSO and Australian fire weather having intensified over the past 2 decades. However, the underlying causes for this change have not been thoroughly investigated. In this study, we utilize reanalysis datasets and numerical model simulations to demonstrate that the Atlantic Multidecadal Oscillation (AMO) could potentially modulate the ENSO–Australian fire weather relationship. The correlation between ENSO and the Australian Fire Weather Index (FWI) increases from 0.17 to 0.70 as the AMO transitions from its negative to positive phase. This strengthening effect can be attributed to atmospheric teleconnection mechanisms. Specifically, the positive AMO phase, characterized by warming in the northern and tropical Atlantic, generates Rossby wave trains, leading to high-pressure systems over Australia. Consequently, local temperature and wind speed increase, while precipitation decreases. This signal, superimposed on ENSO, serves to amplify the ENSO effect on Australian fire weather.
- Article
(5451 KB) - Full-text XML
-
Supplement
(1659 KB) - BibTeX
- EndNote


Australia, recognized as the world's primary fire-prone region, is characterized by highly flammable biota and frequently experiences wildfires during the austral spring and summer seasons (Duc et al., 2018; Cai et al., 2009; Dowdy, 2018). The catastrophic 2019/2020 wildfire season exemplifies this vulnerability (Abram et al., 2021; Arriagada et al., 2020). Australian wildfires significantly impact the environment, human health, and ecological systems (Damany-Pearce et al., 2022; Nguyen et al., 2021; D. Y. Liu et al., 2022; G. Y. Liu et al., 2022; Yu et al., 2020). With the intensification of heat waves and droughts due to global warming, wildfires are anticipated to become more severe, resulting in far-reaching consequences (Clarke and Evans, 2018; Jain et al., 2021).
Fire weather, a key determinant of wildfire occurrence and spread in Australia, is closely related to the El Niño–Southern Oscillation (ENSO), the predominant climate mode governing moisture and temperature variability (Bradstock, 2010; Clarke et al., 2019; Risbey et al., 2009). Typically, ENSO events exacerbate droughts and fire weather in Australia (Chen et al., 2017; Mariani et al., 2016). Notably, the ENSO–Australian fire weather relationship has intensified in the 21st century, yet the underlying causes remain elusive (Mariani et al., 2018).
Decadal climate variability, such as the Atlantic Multidecadal Oscillation (AMO), may also influence fire weather and impose interannual variability. For instance, Atlantic-induced anomalies significantly impact the Pacific sea surface temperature (SST) and circulation changes (Chikamoto et al., 2016, 2020; Lv et al., 2022), accounting for nearly 75 % of the tropical SST changes during the satellite era (Li et al., 2016). The AMO's shift from a negative to a positive phase in the late 1990s may potentially have affected ENSO and its teleconnection patterns, including meteorological conditions in Australia associated with fire weather. This study examines the Atlantic's impact on Australian fire weather and its potential contribution to the ENSO–Australian fire weather relationship, elucidating the possible underlying mechanisms. The findings aim to enhance understanding of Australian fire weather variability and improve wildfire modeling and forecasting in the region.
In this study, we systematically examine the influence of the Atlantic Ocean on Australian fire weather conditions and explore its potential role in modulating the ENSO–Australian fire weather relationship. To achieve this, we first scrutinize the ENSO–fire weather connection under distinct AMO phases, identifying an amplification of this relationship during the positive AMO phase. Subsequently, we construct composite maps of various meteorological variables during contrasting ENSO and AMO phases, utilizing an array of multisource reanalysis datasets. To further substantiate these findings, we employ numerical simulation experiments, thus providing robust validation of the observed impacts. Last, we endeavor to elucidate the underlying mechanisms responsible for these effects through a comprehensive analysis of the simulation results.
2.1 Fire Weather Index, meteorological data, and climate variability index
Fire occurrence and spread are determined by the convergence of sufficient fuel, an ignition source, and suitable weather conditions, all of which comprise the fire triangle of heat, fuel, and oxygen (Krawchuk et al., 2009). In regions with high biomass (abundant fuel), such as Australia, fire occurrence over time is primarily modulated by fuel moisture (i.e., weather) and ignitions (lightning and human activities; Bradstock, 2010). The Fire Weather Index (FWI) is a numerical rating system that estimates the fire intensity based on prevailing weather conditions. It has been demonstrated to be a reliable indicator of fire risk due to its consideration of two key factors, namely fuel availability and the ease of fire spread. Fuel availability is represented by a component related to drought conditions, which affect the presence and number of combustible materials in an area that are affected by the level of dryness in a given area. The ease of spread is a measure of how quickly and extensively a fire can propagate under specific weather conditions normally measured by surface wind speed (Simpson et al., 2014). By incorporating both of these factors, this provides a comprehensive assessment of the potential danger and intensity of fires. To obtain this index, it is explicitly calculated using daily meteorological variables including select 2 m temperature (T2 m), relative humidity, total precipitation (TP), and 10 m wind speed (WND10). Daily FWI (0.25∘ × 0.25∘; 1981–2019) is obtained from the historical data of fire danger indices from the Copernicus Emergency Management Service (Copernicus Contractor, 2021). This dataset offers a complete historical reconstruction of meteorological conditions favorable for the initiation, spread, and sustainability of fires. The daily FWI is subsequently converted to monthly FWI for further analysis.
Meteorological variables, including surface temperature, precipitation, and wind speed, play a crucial role in determining the FWI (Lawson, 2008). To analyze the response of these variables to remote sea surface temperature (SST) forcing, we primarily utilize monthly meteorological data from the re-gridded and interpolated ERA5 reanalysis datasets (Hersbach et al., 2019) obtained from the Copernicus Climate Data Store (CDS) disks. Following Lawson (2008), we select T2 m, TP, SLP, and WND10 for the period 1981–2019, with a resolution of 0.1∘ × 0.1∘. WND10 is calculated using the zonal (U10) and meridional (V10) components of the wind vector to represent the intensity of the 10 m wind. To compare results from various datasets, we also employ the same variables from the National Centers for Environmental Prediction (NCEP)–National Center for Atmospheric Research (NCAR) Reanalysis 1 datasets, with a spatial resolution of 2.5∘ × 2.5∘; the Modern-Era Retrospective analysis for Research and Applications, version 2 (MERRA-2), datasets, with a spatial resolution of 0.625∘ × 0.625∘ (Global Modeling and Assimilation Office, 2015a, b; Kalnay et al., 1996); and re-gridded and interpolated ERA5 reanalysis datasets (Hersbach et al., 2019), with a spatial resolution of 0.1∘ × 0.1∘ (Hersbach et al., 2019) for the period 1959–2019. It is noted that the native spatial resolution of the ERA5 reanalysis dataset is 9 km on a reduced Gaussian grid. The data used here have been regridded to a regular latitudinal–longitudinal grid of 0.1 × 0.1 degree by the CDS. All meteorological variables and climate indices undergo linear detrending to minimize the influence of global warming on the analysis. Utilizing these reanalysis datasets, we generate composite maps of meteorological variables corresponding to distinct phases of the ENSO and AMO. The objective of these composite maps is to elucidate the modulating effect of the AMO on the influence of ENSO in Australia.
Climate variability indices, such as the monthly AMO and Niño 3.4 indices from 1981 to 2019, obtained from the NCAR climate data guide (Trenberth, 1997; Trenberth and Stepaniak, 2001; Trenberth and Shea, 2006), are employed to represent the variability in AMO and ENSO, respectively. Additionally, we investigate dataset dependence of the primary results by utilizing various SST datasets, including Centennial in situ Observation-Based Estimates-SST 2 (COBE), the Met Office Hadley Centre's SST (Hadley), and Kaplan Extended SST v2 (Kaplan), NOAA Extended Reconstructed SST V4 (NOAA V4), and NOAA Extended Reconstructed SST V5 (NOAA V5; Huang et al., 2015, 2017; Kaplan et al., 1998; Liu et al., 2015; Rayner et al., 2003). The general trends and variability in AMO and the ENSO–Australian FWI relationship under different AMO phases, as indicated by these datasets, exhibit high consistency (Figs. S1–S2 in the Supplement), further validating the robustness of the results.
We subsequently computed the meteorological variable composite maps of ENSO (AMO), which are defined as the meteorological variables of Niño 3.4 (AMO) positive-phase years minus those in Niño 3.4 (AMO) negative-phase years. The positive-phase year of Niño 3.4 is determined when the absolute value of the moving average of the Niño 3.4 index in 3 months exceeds 0.5∘ for at least 5 months, and vice versa (Trenberth, 1997). Moreover, basic random fluctuations may contribute to the observed decadal shifts and should be considered to be a potential factor influencing variable ENSO behaviors. Therefore, to obtain a more robust conclusion, we estimated all p values by accounting for autocorrelation using the method by Storch and Zwiers (2000).
2.2 Ocean basin experiments
To investigate the meteorological responses and underlying physical mechanisms of Atlantic influences on Australia, we conducted a series of ocean basin experiments using the Community Earth System Model–Community Atmosphere Model version 4 (CESM–CAM4; Gent et al., 2011). The northern and tropical Atlantic sea surface temperature (SST) variabilities were incorporated into the model to assess the response of meteorological variables in Australia to these remote forcings. Specifically, the monthly SST variability from 1979 to 2015 was added to the northern Atlantic region (25–75∘ N) and the tropical Pacific region (20∘ N–20∘ S), with a 10∘ buffer zone to the north and south of each region. SST forcings in other regions maintained seasonally varying climatological SSTs. The rationale for distinguishing between the tropical Atlantic and northern Atlantic regions stems from the dissimilar sea surface temperature (SST) variability observed in these two areas (not shown). We initially performed the CAM simulation driven by climatological forcing for 8 model years. The restart files for each year served as the initial condition for the eight ensemble members. An ensemble simulation comprising eight members was conducted, and the ensemble means were considered to be the atmospheric response to SST forcing in the target ocean basin. We refer to this experiment as the ocean basin experiments (OBE), which is consistent with previous studies (G. Y. Liu et al., 2022; Wang et al., 2018).
Given that the peak season for fire weather in Australia primarily occurs during the local spring (September, October, and November or SON; Earl and Simmonds, 2017), we selected the model responses to the SON northern Atlantic SST (25–65∘ N, 10–60∘ W) and tropical Atlantic SST (0–20∘ N, 10–60∘ W) in the OBE for further analysis. The OBE results were primarily employed to discern the impact of the AMO and to ascertain the underlying teleconnection pattern between the AMO and the ENSO–Australian FWI relationship.
2.3 Significance test
The assessment of the differences between ENSO composites with positive AMO (AMO+) and negative AMO (AMO−) was conducted using Student's t test to ascertain the statistical significance of these differences. This robust analytical method facilitated the evaluation of the potential impacts of AMO phases on the ENSO–Australian fire weather relationship.
The Student's t is calculated as follows:
where and are sample means, and n1 and n2 are sample sizes for different samples. σ is the pooled standard deviation, which is calculated as
where s1 and s2 are standard deviations for different samples. The test statistic under the null hypothesis has Student's t distribution, with degrees of freedom.
3.1 Influence of AMO on the relationship between ENSO and the Australian FWI
Previous studies have established a strong correlation between Australian fire weather and ENSO (Harris et al., 2014; Mariani et al., 2016), with a significant positive correlation (R ≈ 0.53, p < 0.01) being observed between the Australian FWI and the Niño 3.4 index. ENSO events, characterized by anomalously positive Niño 3.4 indices, typically result in warmer-than-average temperatures and reduced precipitation across most of Australia during the SON season. These meteorological anomalies create favorable conditions for the ignition and spread of wildfires (Keeley et al., 2022; Littell et al., 2016). Additionally, Australia is influenced by a high-pressure center and enhanced northwesterly winds, which contribute to the expansion of burned areas (Clements et al., 2008; Koo et al., 2010).
However, the correlation between ENSO and Australian fire weather is not constant, as it changes over time. Mariani et al. (2018) reported that the impact of ENSO on Southern Hemisphere fire weather, including Australia, has intensified since the beginning of the 21st century. Our analysis supports this finding, with the ENSO–Australian FWI correlation increasing from 0.34 during 1981–1999 to 0.66 during 2000–2019 (Fig. S3a). In contrast, the other two major Southern Hemisphere wildfire regions, namely Southern Africa and South America, do not exhibit discernible trends (Fig. S3b, c). Mariani et al. (2018) proposed that this correlation shift is likely due to global warming. However, considering the slowdown or pause in the global warming trend between the years ∼ 2000 and 2015, this hypothesis seems unwarranted, prompting further investigation into alternative causes. Moreover, the strengthened correlation persists even when analyzing detrended time series, further undermining the attribution of this correlation shift to global warming.
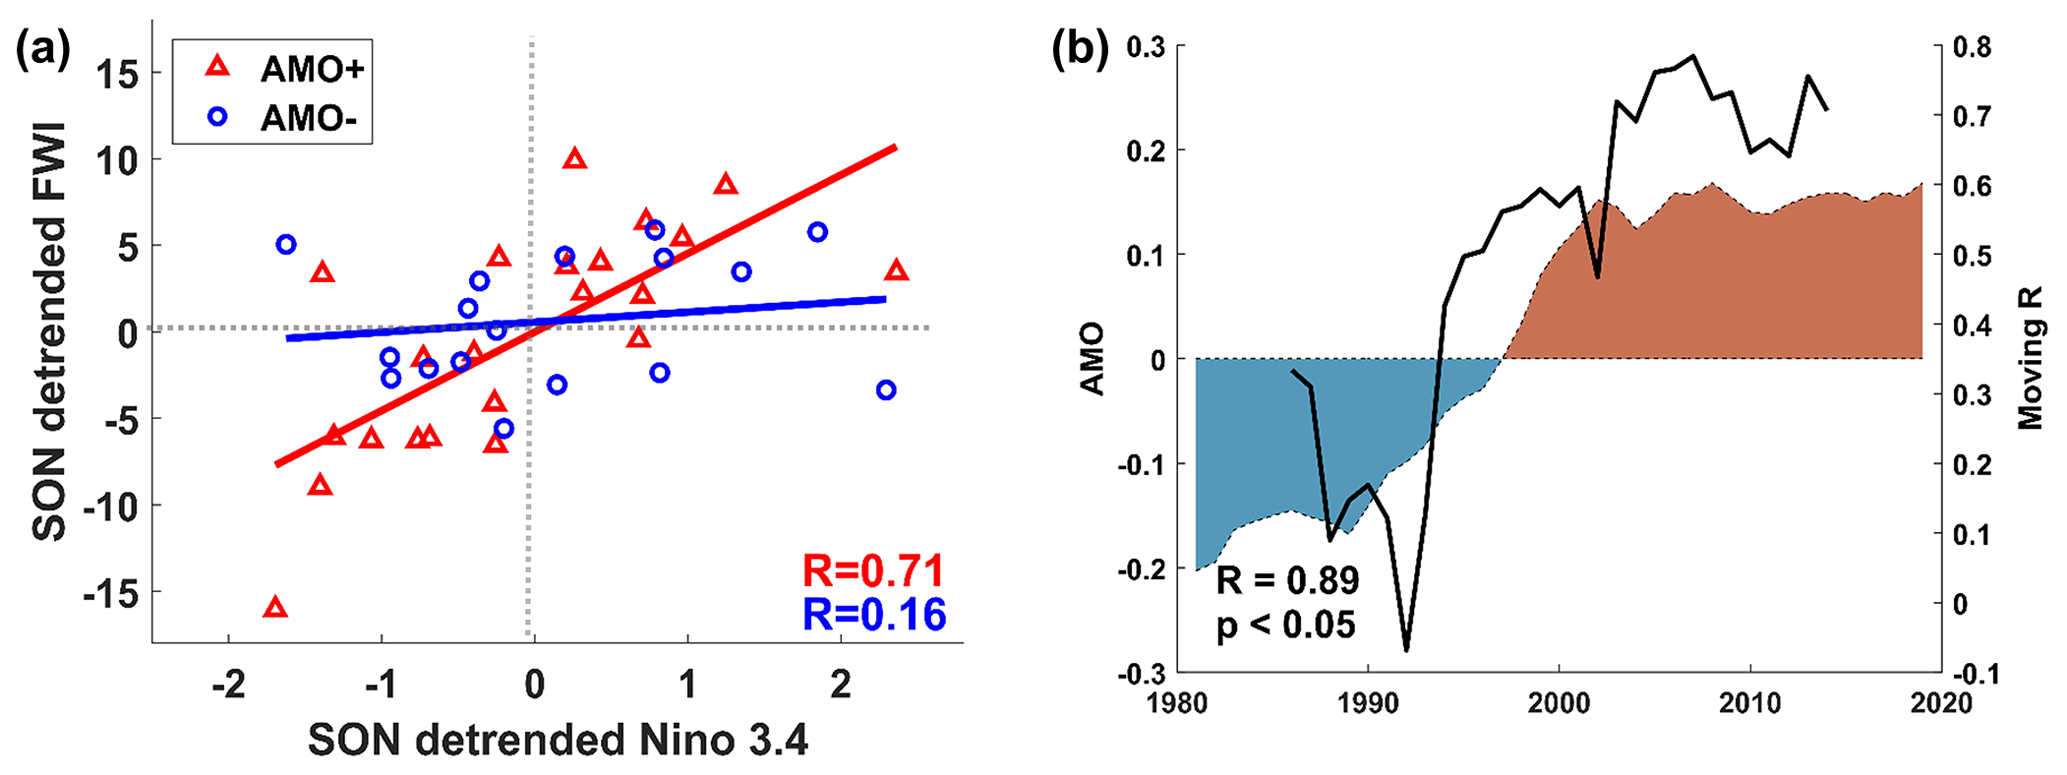
Figure 1(a) Scatterplots for detrended, standardized SON Niño 3.4 index and the corresponding reanalysis of the mean Australia FWI from 1981 to 2019. The red triangles represent positive AMO indices, while the blue circles represent negative ones. The lines are linear fit lines. The correlation coefficient (R =0.71) corresponding to AMO+ passed the significance test of p < 0.05, while the other one did not. (b) The black solid line represents the sliding correlation coefficient between the detrended SON FWI in Australia and the detrended SON Niño 3.4 index, with a sliding window of 10 years. The shaded area represents the annual AMO index by detrending and an 11-year running mean. Red is positive, and blue is negative. All the correlation coefficients assume an autocorrelation with the time series.
Around 2000, the Atlantic Multidecadal Oscillation (AMO), a significant global decadal climate variability, transitioned from its negative to its positive phase. Atlantic climate variability has been demonstrated to have a broad impact on the global climate system, including the Pacific Ocean (Chikamoto et al., 2016), the Indian Ocean (Xue et al., 2018), and even Antarctica (Ren et al., 2022). Indeed, the ENSO–Australian FWI relationship underwent a dramatic change between the different AMO phases, with correlation coefficients increasing from 0.17 to 0.70 between negative and positive AMO phases (Fig. 1a). This increase is similar to the correlation shift observed before and after 2000 (Fig. S1a), albeit with a more pronounced contrast. We further calculated a running correlation between ENSO and the Australian FWI and compared its time series with that of the AMO (Fig. 1b). It is evident that during the negative AMO phase, the ENSO–Australia FWI correlation is low, mostly below 0.3, while it increases to above 0.6 or even 0.8 during the positive AMO. The timing of the transition between the two time series aligns well, as it occurred in the late 1990s, although the correlation time series displays a slight lead, primarily due to the smoothing treatment.
3.2 Impact of northern and tropical Atlantic on the Australian FWI
In an effort to elucidate the potential reinforcement of the ENSO and the Australian FWI relationship by the AMO, we conducted a comprehensive examination of the effects on Australian meteorological conditions and placed particular emphasis on the coherent interplay between ENSO and AMO. To achieve this, we analyzed some reanalysis datasets and the OBE simulation results.
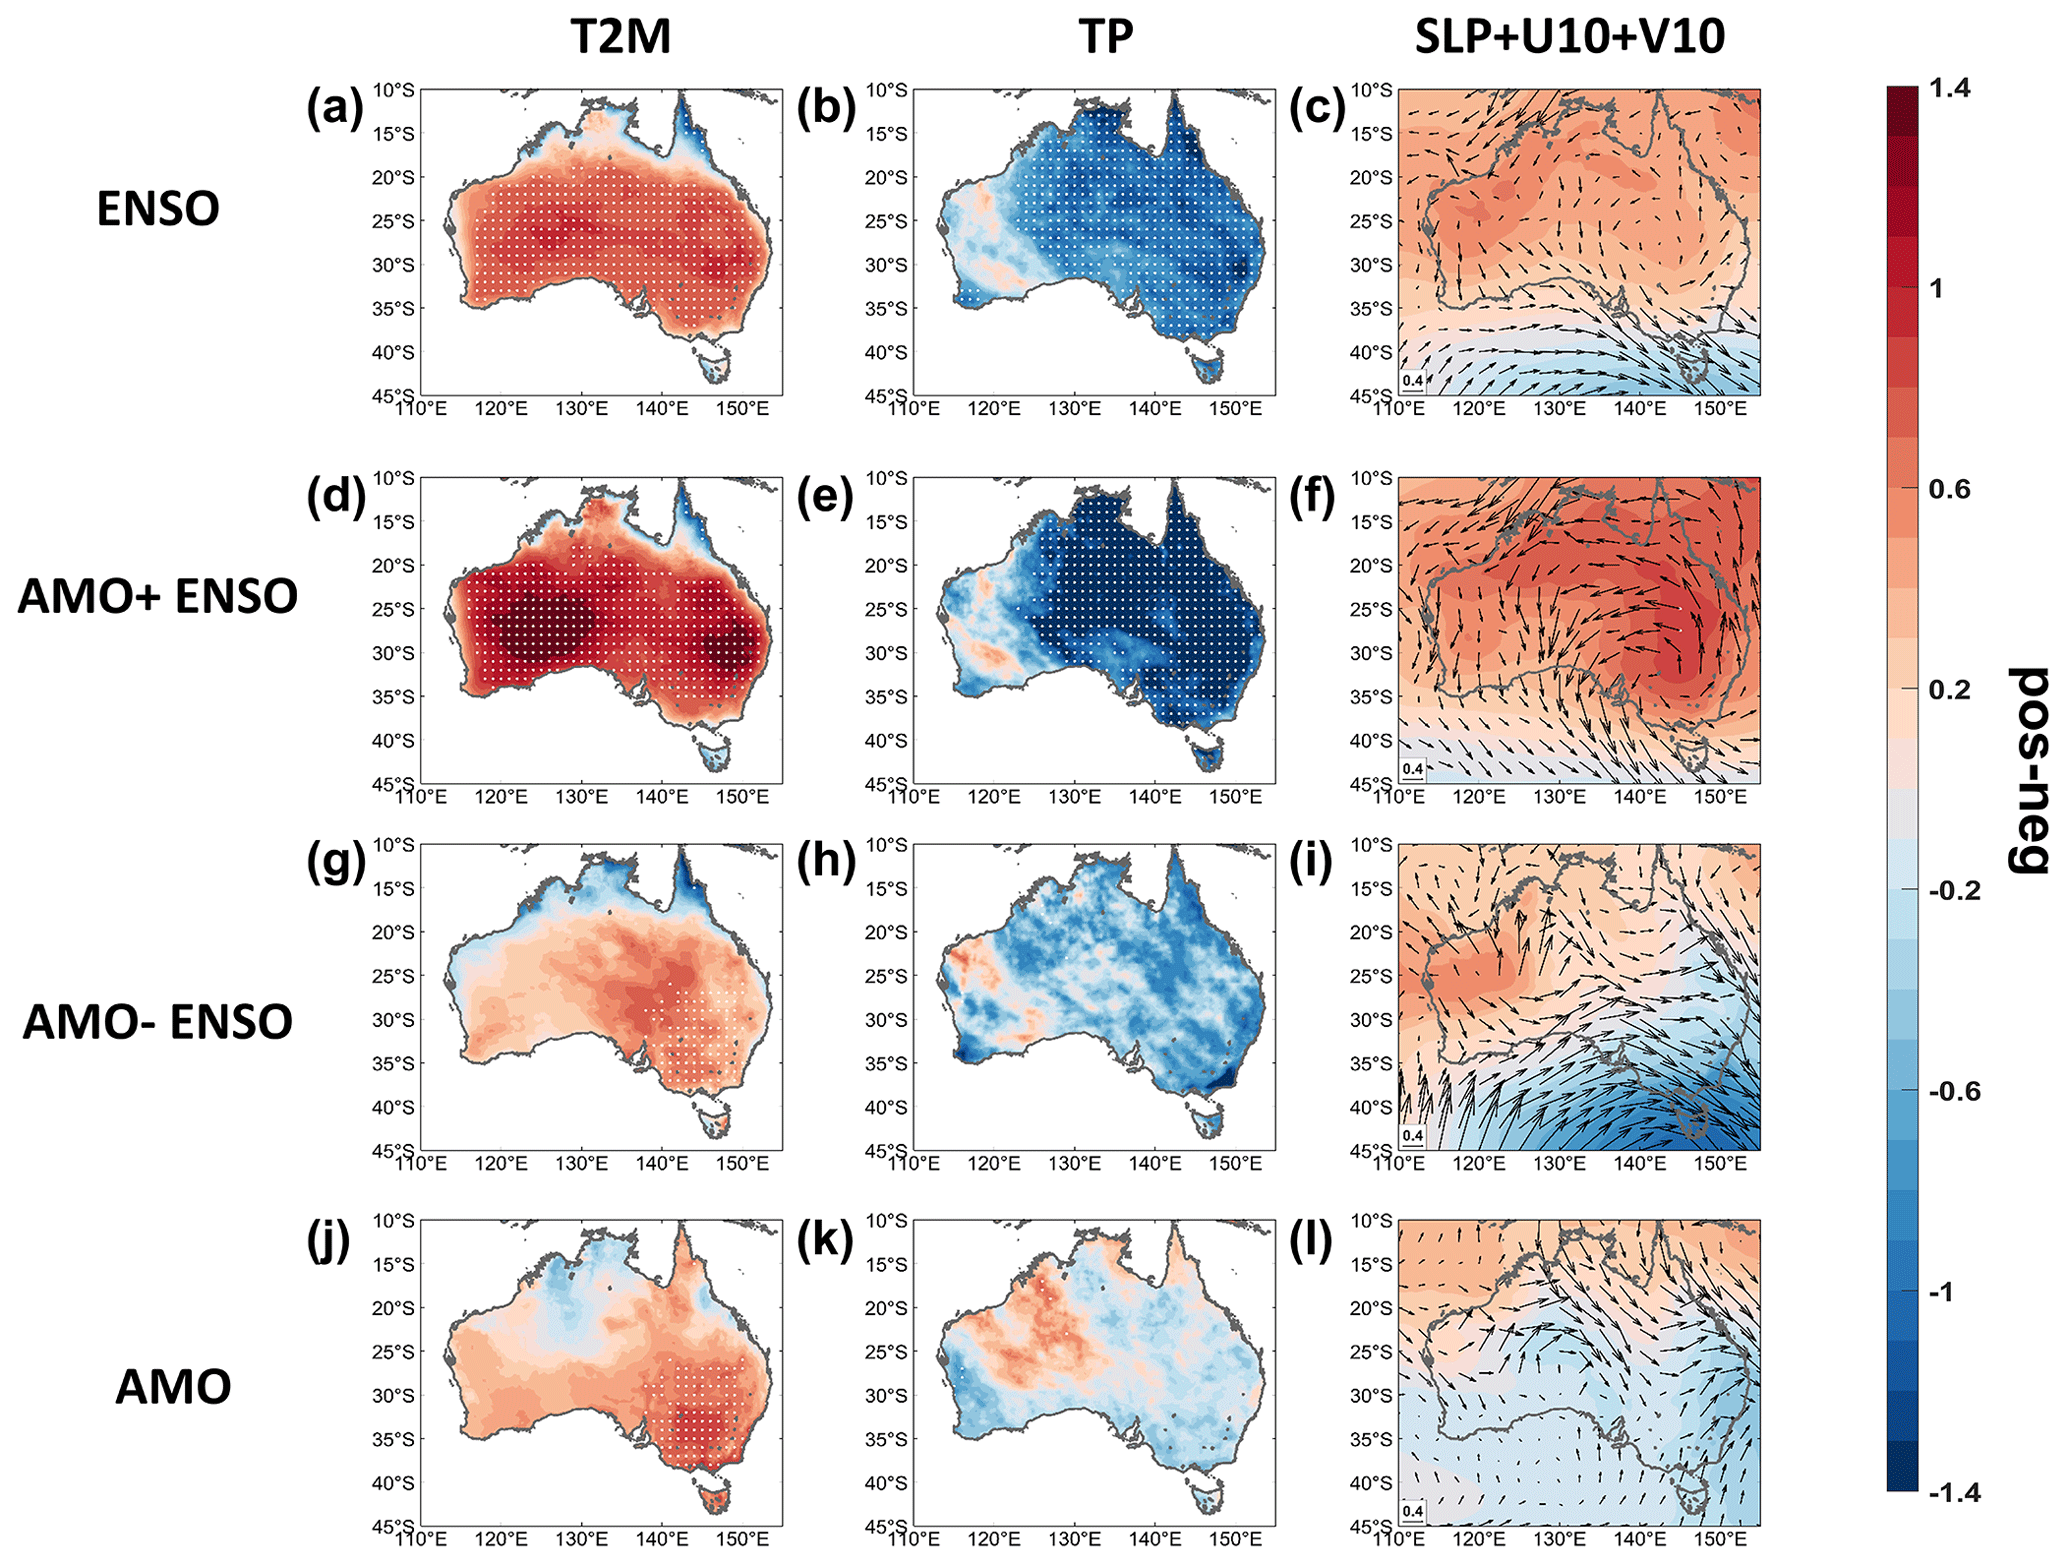
Figure 2The difference maps for the detrended and normalized reanalysis for SON (a, d, g, j) 2 m temperature (T2 m), (b, e, h, k) total precipitation (TP), and (c, f, i, l) sea level pressure (SLP), with +10 m zonal and meridional winds (U10 + V10), in conditions with the (a–c) ENSO composite (El Niño composite minus La Niña composite), (d–f) ENSO composite with AMO+, (g–i) ENSO composite with AMO−, and (j–l) AMO composite from 1981 to 2019. The composite results are calculated using meteorological variables with positive indices minus those with negative ones. The area with white dots passed the significance test of p < 0.05 in Student's t test.
As previously noted, positive ENSO events, specifically El Niño events, are associated with higher SLP, increased temperature, and reduced precipitation, which collectively contribute to fire generation (Fig. 2a–c). With regard to surface wind, the composite field exhibits the same direction (southeasterly wind) as the climatological surface wind, thereby playing a crucial role in augmenting the wind speed and facilitating wildfire expansion (Fig. 2c). This relationship is further substantiated by the composite difference maps of the temperature, precipitation, and circulation field between El Niño and La Niña events (not shown).
In our investigation, we first juxtapose El Niño-associated meteorological responses in Australia during positive (Fig. 2d–f) and negative AMO phases (Fig. 2g–i). Our findings reveal that temperature increases and precipitation decreases are more pronounced during El Niño events coinciding with a positive AMO phase. This intensified response is particularly evident in central and southern Australia, where the predominant vegetation comprises grasslands and shrublands, which are highly susceptible to ignition and wildfire propagation. Furthermore, SLP and WND10 responses are markedly more robust during positive AMO phases compared to negative phases (Fig. 2f, i). Specifically, El Niño events in the positive phase of AMO are characterized by elevated SLP and intensified surface winds. The elevated SLP corresponds to descending airflow, consequently exacerbating hot and dry conditions in the biomass-rich regions of Australia. Collectively, these observations suggest that AMO may potentially amplify the relationship between ENSO and FWI.
We further conduct a composite analysis of Australian meteorological fields during positive and negative AMO phases (Fig. 2j–l), revealing similarities to ENSO patterns (Fig. 2a–c). Specifically, a positive AMO corresponds to increased temperatures and decreased precipitation, with significant precipitation changes primarily concentrated in the southern region. Given that wildfires are more intense in southern Australia (Hennessy et al., 2005), these AMO-associated meteorological anomalies contribute to heightened fire weather. Additionally, positive AMO corresponds to easterly wind anomalies in eastern Australia. Due to the topography of the Great Dividing Range in eastern Australia, easterly winds adiabatically sink, leading to increased temperatures and reduced humidity in biomass-rich areas (Kriwoken, 1996), thereby creating a high-temperature, low-humidity environment. These similarities suggest that the positive AMO may reinforce the ENSO effect on the Australian FWI, resulting in more severe and widespread wildfires.
Furthermore, it is indeed crucial to identify the meteorological factors that most significantly contribute to the strengthened ENSO–FWI relationship under the positive AMO phase. As evidenced, T2 m plays a dominant role in reinforcing the ENSO–FWI relationship in western Australia, whereas TP and SLP mainly influence this relationship in eastern Australia. This distinction can be partly ascribed to the atmospheric circulation patterns illustrated in Fig. 2f and i. During the positive phase of the AMO, warm advection from lower latitudes heats the ground in western Australia, resulting in warmer conditions than those observed in the negative phase. On the other hand, in eastern Australia, the wind predominantly blows from the land to the sea, with limited water vapor levels, during the positive phase of the AMO. During the negative phase, however, an increased volume of vapor is transported from the Southern Ocean, leading to enhanced precipitation in eastern Australia. We also examined the differences in ENSO events between two periods with distinct AMO phases (1981–1999 and 2000–2019; Fig. S4) but found no significant differences in their spatial patterns (Fig. S4e, f), indicating that the ENSO flavor is an unlikely factor driving the shift in the ENSO–Australian FWI relationship.
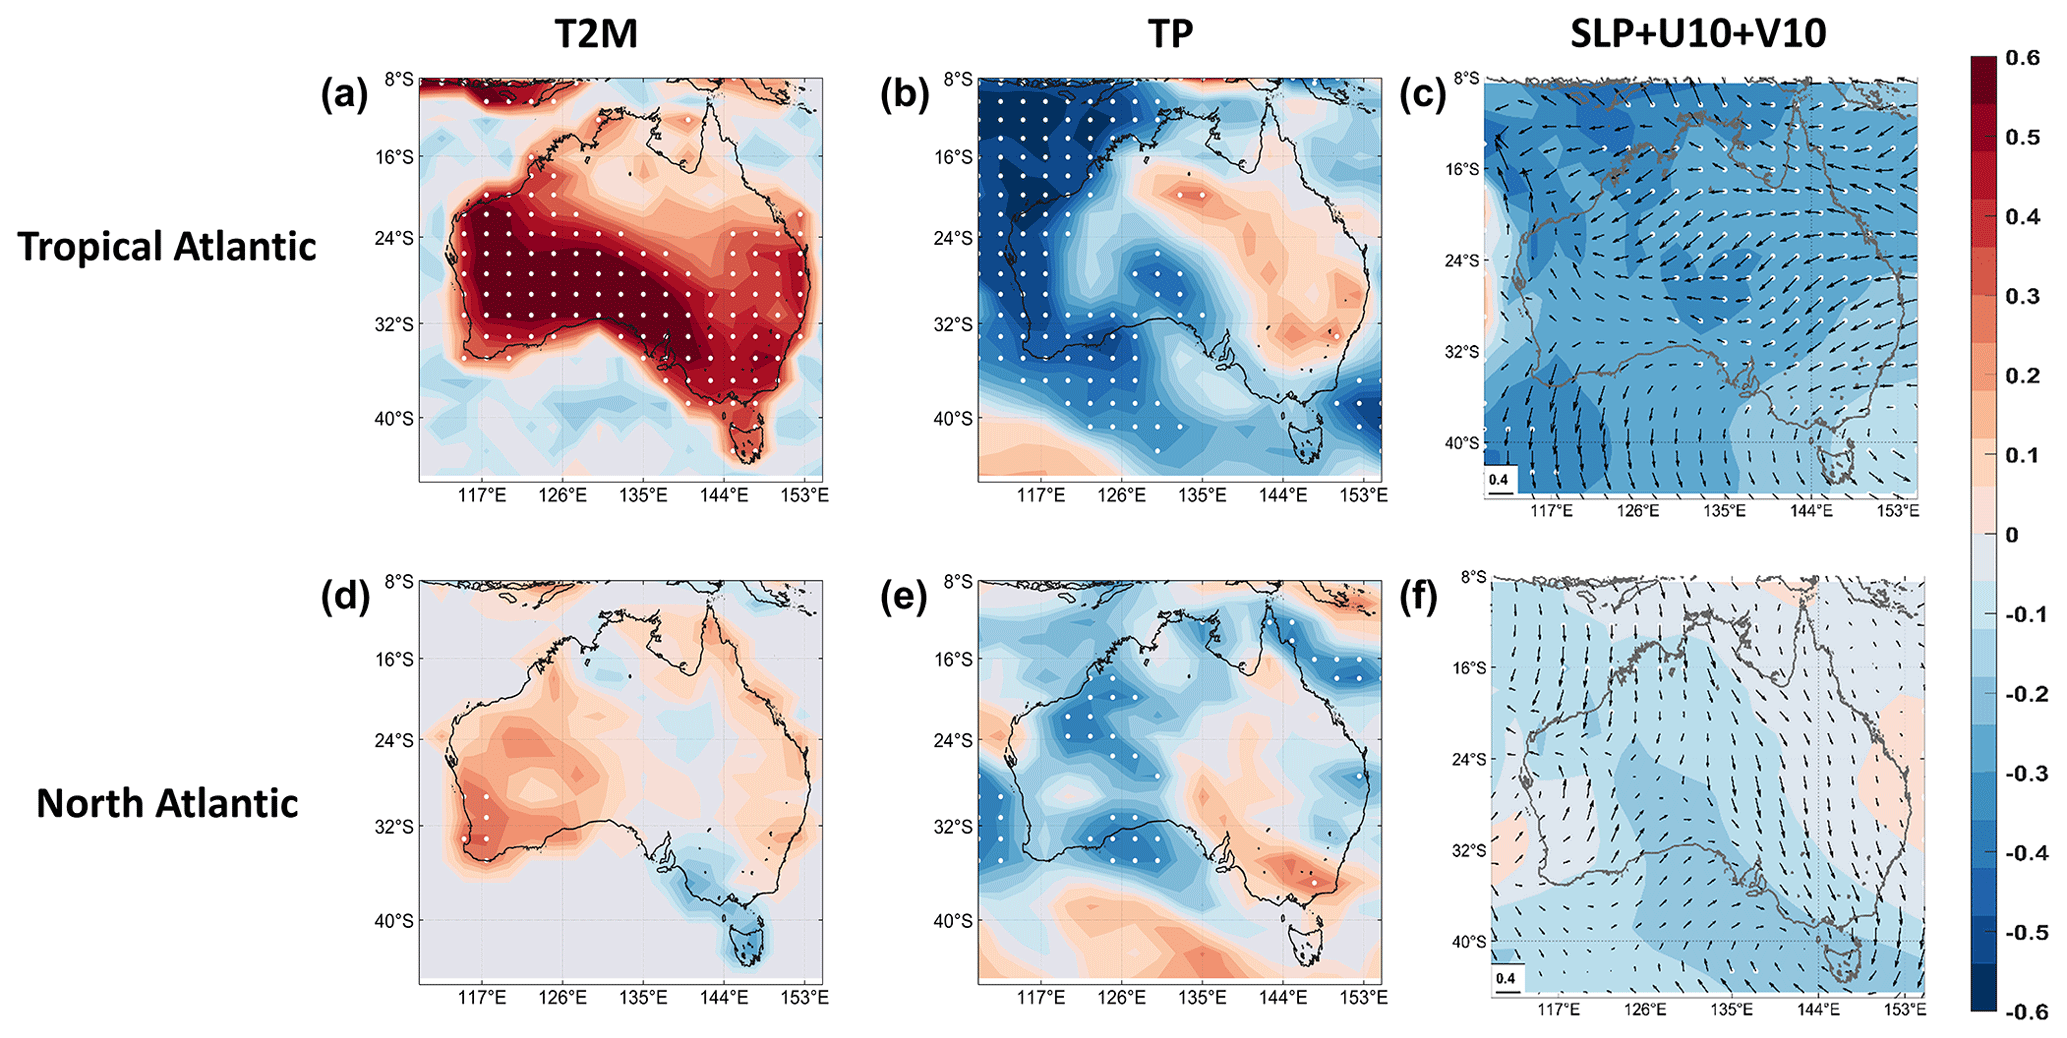
Figure 3Regression coefficients of the ensemble mean detrended and normalized SON (a, d) T2 m, (b, e) TP, and (c, f) SLP + U10 + V10 onto the detrended and normalized SON (a–c) tropical Atlantic (0–20∘ N, 10–60∘ W) SST and (d–f) northern Atlantic (25–45∘ N, 10–60∘ W) SST in the OBE. The area with white dots passed the significance test of p ≤ 0.05 in Student's t test.
Reanalysis datasets encompass numerous physical processes; therefore, to isolate the AMO effect, we further investigate the responses of major meteorological variables (T2 m, TP, SLP, U10, and V10) to the northern and tropical Atlantic in the OBE. We regress the detrended and normalized SON meteorological variables on the detrended and normalized SON tropical Atlantic and northern Atlantic SST in OBE. The regression coefficients, representing the responses of local meteorological variables to remote SST forcings in the corresponding ocean basin, are depicted in Fig. 3. Although AMO modulates the ENSO–FWI relationship in both El Niño and La Niña events (Fig. S5), El Niño events may induce more severe fire weather in Australia compared to La Niña events (Fig. 2a–c). Consequently, our subsequent discussion primarily focuses on the modulation of Australian fire weather during El Niño conditions.
For the tropical Atlantic, an anomalously high SST corresponds to increased T2 m and decreased TP in southern Australia (Fig. 3a–b), which is the primary wildfire region. This anomaly is also associated with anomalously easterly and northerly winds in eastern Australia (Fig. 3c). These winds, influenced by topographic factors, result in increased temperature and reduced humidity. Such meteorological anomalies may diminish moisture in combustible plants and heighten surface dryness, creating favorable conditions for wildfire ignition and propagation. Although the responses of these meteorological variables are relatively weaker compared to northern Atlantic forcing (Fig. 3d–f), their changes in direction concur with those under tropical Atlantic forcing; i.e., positive northern Atlantic SST anomalies correspond to increased T2 m and decreased TP in southern Australia. Furthermore, the influence of the tropical Atlantic appears more pronounced and statistically significant, which may be attributable to its closer proximity to Australia. Nevertheless, the impact of the northern Atlantic on precipitation remains statistically significant across southern and western Australia, warranting further consideration.
The consistent results in the reanalysis (Fig. 2) and OBE (Fig. 3) suggest that the positive AMO phase, associated with warm northern and tropical Atlantic SST anomalies, induces warmer and drier weather in Australia, particularly in the southern region. This induction reinforces the positive ENSO signal on Australian fire weather, thereby enhancing the ENSO–fire weather relationship. Moreover, the AMO's modulation effect on Australian climate remains significant in different periods (1981–2019 and 1959–2019) and various reanalysis datasets (ERA5, NCEP–NCAR, and MERRA-2), further corroborating the robustness of our findings (Figs. S6–S8).
3.3 Possible mechanism accounting for this modulation
To elucidate the physical processes underlying the Atlantic's impact on Australia, we investigate the responses of the 200 hPa geopotential height (GPH) and stream function (SF) in the northern and tropical Atlantic OBE and the mechanisms by which the northern and tropical Atlantic individually influence the Australian FWI. The 200 hPa stream function is a widely employed diagnostic tool that has been used for analyzing Rossby wave propagation in previous studies (An et al., 2023; Li et al., 2019). Following the methodology of Sardeshmukh and Hoskins (1988), we diagnose the dynamics of Rossby waves by examining the barotropic vorticity equation at 200 hPa, specifically focusing on the Rossby wave source (RWS) that quantifies the vorticity forcing associated with low-level convergence and upper-level divergence.
In the case of the tropical Atlantic, thermal forcing in this region drives changes to the zonal Walker circulation. These alterations may result in an upward vertical motion and localized convection over the Atlantic, with corresponding low-level convergence and upper-level divergence subsequently producing an intensification of the local Hadley circulation (Li et al., 2014, 2015). This process enhances upper-level convergence at the descending branch of the Hadley cell (Simpkins et al., 2014), leading to an intensification of the local Hadley circulation and the generation of a significant source of Rossby waves that propagate eastward with the climatological mean flow in the Southern Hemisphere (Fig. 4e). This Rossby wave source is evident over the southern Atlantic (30∘ S, 20∘ W in Fig. 4e), and the corresponding Rossby wave will propagate toward Australia, intensifying the high pressure in the region (Fig. 4a). The regression coefficients of the 200 hPa stream function further corroborate this Rossby wave propagation from the southern Atlantic to Australia (Fig. 4c). With sea surface temperature (SST) warming in the tropical Atlantic, the response of the stream function in the upper level above Australia corresponds to a high-pressure center, with descending airflow in this region (Fig. 4c). In summary, the anomalous deep convection in response to increased SST in the tropical Atlantic drives the anomalous divergence of the large-scale flow that extends away from local heating by modulating the Hadley and Walker circulations. This process has been discussed in detail by Simpkins et al. (2014).
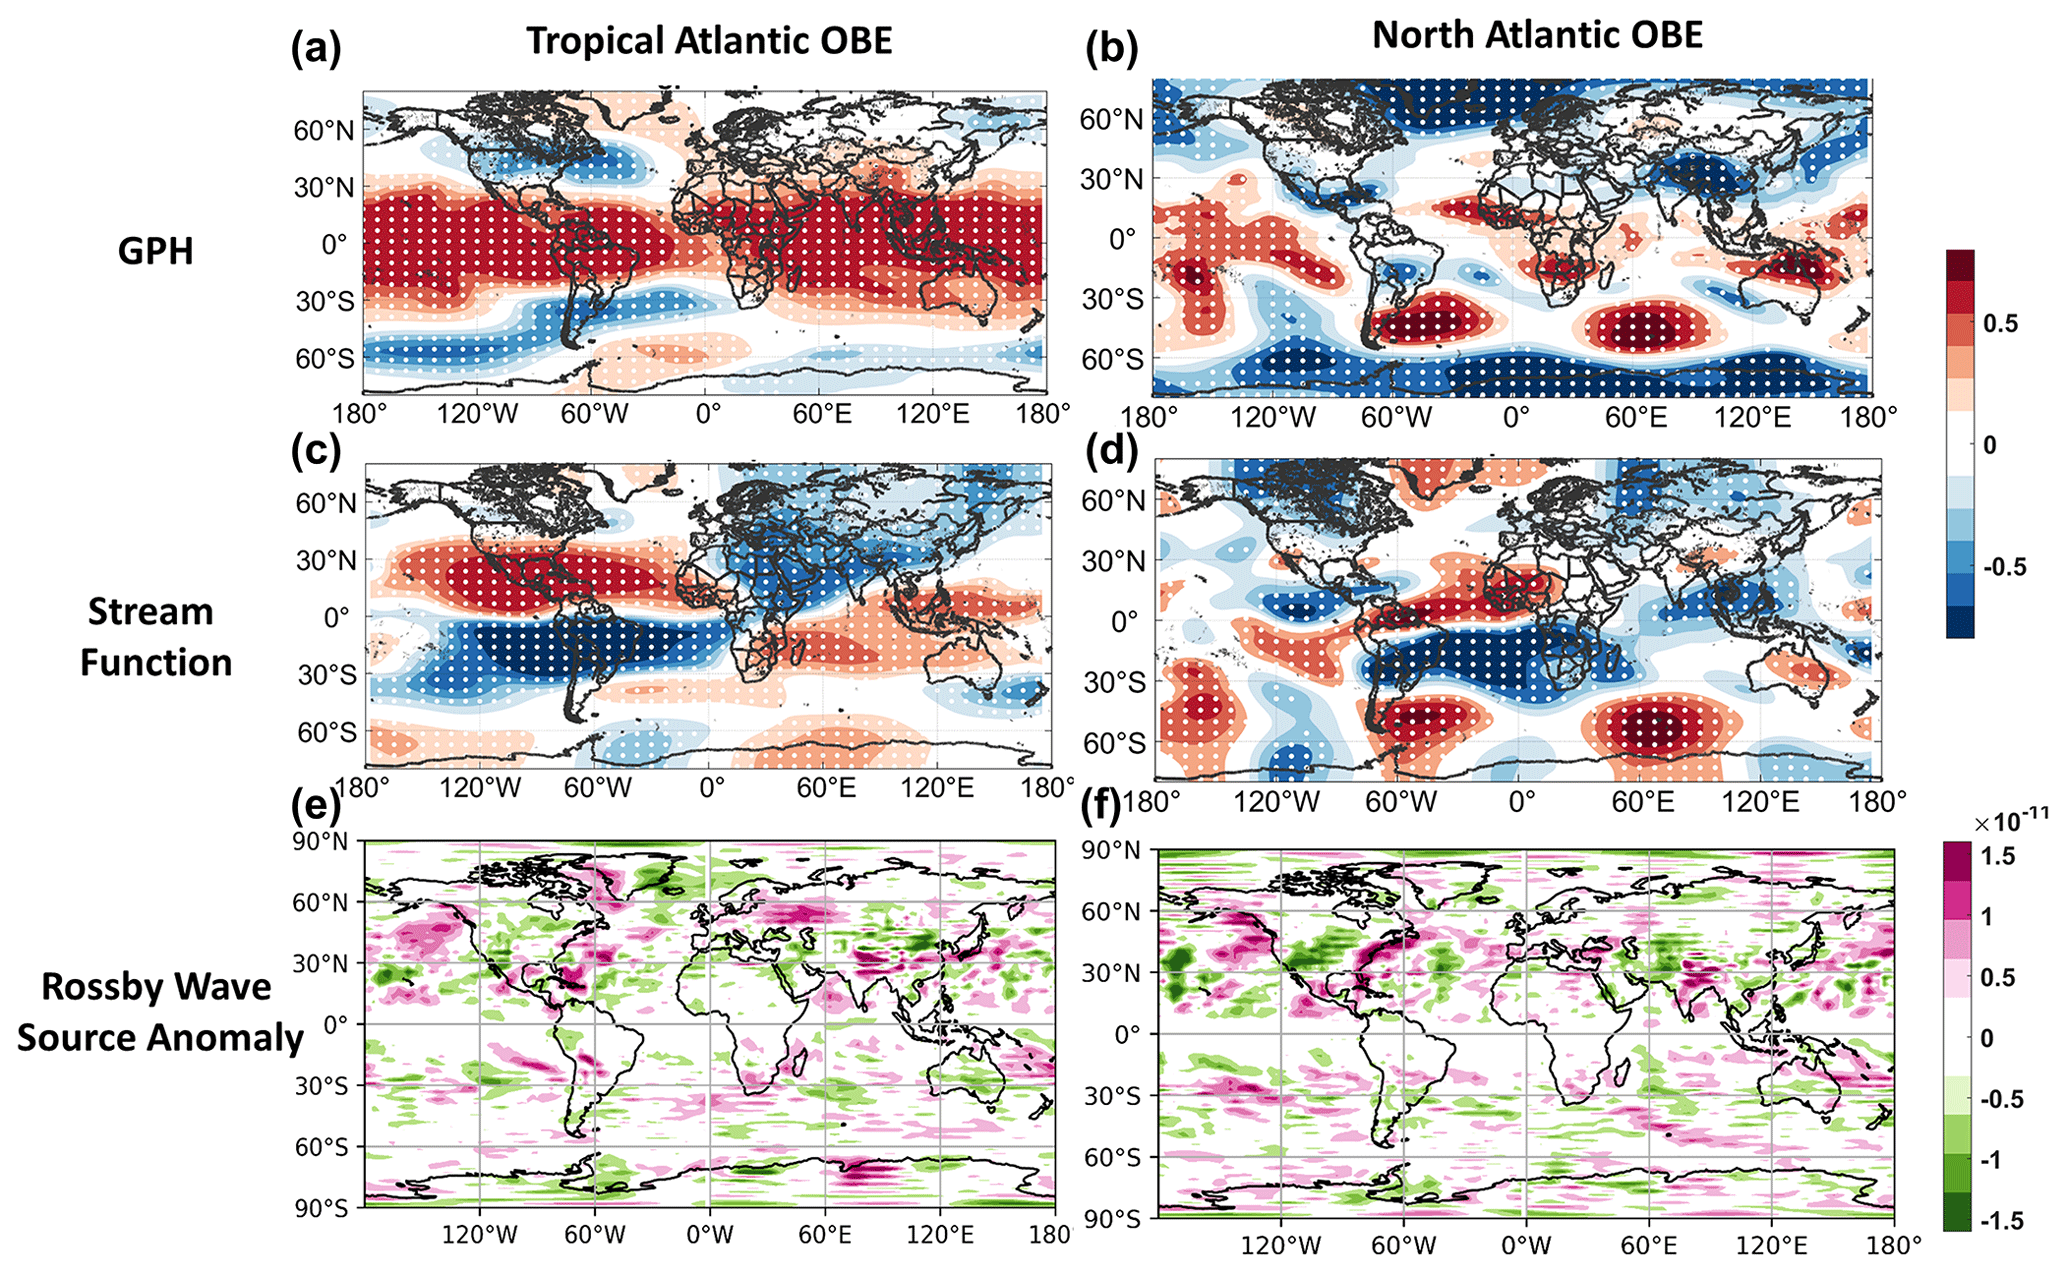
Figure 4(a–d) Regression coefficients of the detrended and normalized SON 200 hPa (a–b) GPH and (c–d) stream function onto the detrended and normalized SON (a, c) tropical Atlantic (0–20∘ N, 10–60∘ W) and (b, d) northern Atlantic (25–45∘ N, 10–60∘ W) SST in the OBE. (e–f) The 200 hPa Rossby wave source anomaly in the (e) tropical Atlantic OBE and (f) northern Atlantic OBE. The area with white dots passed the significance test of p ≤ 0.05 in Student's t test.
Regarding the northern Atlantic, warmer Atlantic temperatures heat the air above, forming a local high-pressure center in the upper troposphere. This signal generates the Rossby wave source over the northern Atlantic (Fig. 4e), with the corresponding Rossby wave train propagating from west to east, featuring alternating high- and low-pressure centers that culminate in a high-pressure anomaly in Australia (Fig. 4b). This high pressure corresponds to descending motions over Australia that are characterized by drier and hotter air that is unfavorable for cloud and rain formation. It is worth noting that stationary Rossby waves can cross the Equator under the influence of meridional background wind, and their direction and tilt structure depend on the meridional background wind (X. C. Li et al., 2015; Y. J. Li et al., 2015). Furthermore, the responses of the stream function are in strong accordance with those of GPH, with a high-pressure center above Australia. These responses lend further support to the cross-equatorial propagation under the influence of the northern Atlantic SST forcing (30∘ N, 35∘ W in Fig. 4d). The patterns of regression coefficients (Fig. 4a–d) also correspond well to the equatorial windows and wave guides for Rossby wave propagation in the upper troposphere, as identified in previous studies (Li et al., 2019). The southward propagation of Rossby waves originating from the Atlantic is also supported by previous works (Miller et al., 2007; Zhao et al., 2019), which form the basis of the teleconnection between the northern Atlantic and Australia. Previous studies also indicate that the Atlantic Multidecadal Oscillation (AMO) can modulate El Niño–Southern Oscillation (ENSO) effects through similar Rossby wave dynamics (Lin and Li, 2012; Nagaraju et al., 2018). The impact of AMO on ENSO itself has been widely discussed in previous studies, encompassing aspects that include its influence on ENSO's amplitude, flavor, and predictability. The AMO is known to force changes in the Walker circulation in the tropical Pacific Ocean, thus affecting ENSO's amplitude (Levine et al., 2017) by impacting the depth of the equatorial thermocline and the positive feedback effect of the thermocline (Geng et al., 2020). Regarding ENSO's flavor, the positive AMO enhances the zonal sea surface temperature gradient in the central Pacific, strengthening zonal advective feedback and favoring extreme and central Pacific (CP) El Niño development (Gan et al., 2022; Yu et al., 2015). Regarding the predictability of ENSO, it is modulated by the Atlantic mean state bias and systematic errors in interbasin interactions (Chikamoto et al., 2020).
In conclusion, SST forcing in the tropical Atlantic instigates alterations in the Walker circulation, subsequently influencing the Hadley circulation and the generation of Rossby waves. Simultaneously, elevated temperatures in the northern Atlantic affect the atmospheric conditions, resulting in the propagation of Rossby waves. These interconnected processes establish the teleconnection between the Atlantic SST and FWI in Australia. It is also noted that the AMO has the potential to modulate the ENSO effects through analogous Rossby wave dynamics, thereby impacting its amplitude, characteristics, and predictability.
Fire weather in Australia is closely related to the variability in ENSO. The correlation between fire weather in Australia and the variability in ENSO has intensified over the past 2 decades, yet the underlying cause remains elusive. Through the analysis of reanalysis datasets and ocean basin experiments utilizing a global climate model, our study posits that the AMO modulates the ENSO–Australian fire weather relationship. The correlation coefficient between ENSO and the Australian FWI escalates from 0.17 to 0.70 as the AMO shifts from a negative to positive phase. During positive AMO, ENSO conditions correspond to enhanced temperature increases, reduced precipitation, and intensified surface winds conducive to wildfire generation, and vice versa. Physically, a positive AMO, linked to warmer northern and tropical Atlantic sea surface temperatures (SST), generates a local low-pressure center that propagates southwestwardly via a Rossby wave train. This wave train reaches Australia as a high-pressure anomaly, inducing descending air and promoting warmer, drier meteorological conditions favorable for wildfire generation. These meteorological anomalies amplify the positive ENSO-induced meteorological changes, augmenting the Australian fire weather response to ENSO. Previous research also indicates that positive AMO, characterized by basin-wide Atlantic warming, triggers an Atlantic–Pacific SST seesaw, reinforcing the Walker circulation over the Pacific (Chafik et al., 2016; McGregor et al., 2014; Wang et al., 2013). This bolstered Walker circulation may further magnify ENSO's effects on the Australian FWI.
In contrast to previous studies, this work elucidates the teleconnection between AMO and the Australian climate and fire weather on a decadal scale. By investigating the combined influence of ENSO and AMO on fire weather, we have uncovered noteworthy interactions between these climate modes, which can either enhance or suppress fire weather severity during specific phases. The 2019 Australian mega-fire during the austral spring has been ascribed to the ENSO event, positive Southern Annular Mode, and positive Indian Ocean Dipole event of that year (Abram et al., 2021; Nolan et al., 2020; van Oldenborgh et al., 2021). Our study discloses that this period also coincides with an elevated Atlantic SST (Fig. S9), which may amplify the Australian atmospheric response to the ENSO event, thereby leading to extended dry seasons and intensified heat waves. Our study highlights the importance of considering both ENSO and AMO variability in the prediction of fire weather conditions and provides valuable insights for improved understanding and forecasting of fire risk in Australia. It is worth noting that Pacific decadal variability, such as the Pacific Decadal Oscillation (PDO), plays a crucial role in Australia's climate (Power et al., 1999). However, prior research suggests that the Pacific variability may be partially induced by the Atlantic variability (Li et al., 2016; Ren et al., 2021), underscoring the latter's significance in Earth's climate system. We also examined the modulation effect of the Interdecadal Pacific Oscillation (IPO) or PDO on ENSO and the Australian FWI but found it less pronounced than that of the AMO in both observations and simulations (figures not shown). Admittedly, our analysis is constrained by the FWI data time span availability, and longer time span data may be less reliable due to inadequate observations. Future research will explore the influence of other ocean basins on Australian fire weather and the ENSO–Australian fire weather relationship.
The historical Fire Weather Index (FWI) data were downloaded from the fire danger indices historical data at https://doi.org/10.24381/cds.0e89c522 (Copernicus Climate Change Service, 2019) and https://doi.org/10.5281/zenodo.5754302 (Copernicus Contractor, 2021). The meteorological reanalysis data were downloaded from ERA5 hourly and monthly averaged data in the Copernicus Climate Data Store (CDS) at https://doi.org/10.24381/cds.f17050d7 (Hersbach et al., 2019) and https://doi.org/10.24381/cds.adbb2d47 (Hersbach et al., 2023). The NCEP–NCAR Reanalysis 1 data were downloaded from the NOAA Physical Sciences Laboratory (https://psl.noaa.gov/data/gridded/data.ncep.reanalysis.html; Kalnay et al., 1996). The MERRA-2 data were downloaded from MDISC (https://doi.org/10.5067/0JRLVL8YV2Y4, Global Modeling and Assimilation Office, 2015a; https://doi.org/10.5067/AP1B0BA5PD2K, Global Modeling and Assimilation Office, 2015b). AMO and Niño 3.4 indexes were obtained from the NCAR Climate Data Guide (based on Schneider et al., 2013, https://doi.org/10.1002/2013eo130001), namely the AMO index (https://climatedataguide.ucar.edu/climate-data/atlantic-multi-decadal-oscillation-amo, Climate Analysis Section, 2022a) and Niño 3.4 index (https://climatedataguide.ucar.edu/climate-data/nino-sst-indices-nino-12-3-34-4-oni-and-tni, Climate Analysis Section, 2022b), respectively. The sea surface temperature data were obtained from the NOAA Extended Reconstructed sea surface temperature (SST) V4 (https://doi.org/10.7289/V5KD1VVF; Huang et al., 2015); NOAA Extended Reconstructed sea surface temperature (SST) V5 (https://doi.org/10.7289/V5T72FNM; Huang et al., 2017); COBE-SST 2 (https://psl.noaa.gov/data/gridded/data.cobe2.html; Japan Meteorological Agency, 2006), HadISST (https://www.metoffice.gov.uk/hadobs/hadisst/; Rayner et al., 2003); and Kaplan Extended SST V2 (https://psl.noaa.gov/data/gridded/data.kaplan_sst.html; Kaplan et al., 1998).
The supplement related to this article is available online at: https://doi.org/10.5194/acp-23-9217-2023-supplement.
The paper was written by GL and JL and designed by JL. The data analysis was performed by GL and TY. All the co-authors contributed to the interpretation of the results and improvement of this paper.
The contact author has declared that none of the authors has any competing interests
Publisher’s note: Copernicus Publications remains neutral with regard to jurisdictional claims in published maps and institutional affiliations.
We thank the ECMWF for providing the ERA5 reanalysis data. We also acknowledge the efforts of the CAM4 working groups and support team for developing and maintaining the CAM4 model.
This research has been supported by the National Natural Science Foundation of China (grant no. 41975023).
This paper was edited by Yun Qian and reviewed by Alejandro Jaramillo and five anonymous referees.
Abram, N. J., Henley, B. J., Sen Gupta, A., Lippmann, T. J. R., Clarke, H., Dowdy, A. J., Sharples, J. J., Nolan, R. H., Zhang, T. H., Wooster, M. J., Wurtzel, J. B., Meissner, K. J., Pitman, A. J., Ukkola, A. M., Murphy, B. P., Tapper, N. J., and Boer, M. M.: Connections of climate change and variability to large and extreme forest fires in southeast Australia, Communications Earth & Environment, 2, 8, https://doi.org/10.1038/s43247-020-00065-8, 2021.
An, X., Chen, W., Ma, T., Aru, H., Cai, Q., Li, C., and Sheng, L.: Key role of Arctic sea-ice in subseasonal reversal of early and late winter PM2.5 concentration anomalies over the North China Plain, Geophys. Res. Lett, 50, e2022GL101841, https://doi.org/10.1029/2022GL101841, 2023.
Arriagada, N. B., Palmer, A. J., Bowman, D., Morgan, G. G., Jalaludin, B. B., and Johnston, F. H.: Unprecedented smoke-related health burden associated with the 2019–20 bushfires in eastern Australia, Med. J. Aust., 213, 282–283, https://doi.org/10.5694/mja2.50545, 2020.
Bradstock, R. A.: A biogeographic model of fire regimes in Australia: current and future implications, Glob. Ecol. Biogeogr., 19, 145–158, https://doi.org/10.1111/j.1466-8238.2009.00512.x, 2010.
Cai, W., Cowan, T., and Raupach, M.: Positive Indian Ocean Dipole events precondition southeast Australia bushfires, Geophys. Res. Lett., 36, L19710, https://doi.org/10.1029/2009GL039902, 2009.
Chafik, L., Hakkinen, S., England, M. H., Carton, J. A., Nigam, S., Ruiz-Barradas, A., Hannachi, A., and Miller, L.: Global linkages originating from decadal oceanic variability in the subpolar North Atlantic, Geophys. Res. Lett., 43, 10909–10919, https://doi.org/10.1002/2016GL071134, 2016.
Chen, Y., Morton, D. C., Andela, N., van der Werf, G. R., Giglio, L., and Randerson, J. T.: A pan-tropical cascade of fire driven by El Nino/Southern Oscillation, Nat. Clim. Change, 7, 906-911, https://doi.org/10.1038/s41558-017-0014-8, 2017.
Chikamoto, Y., Mochizuki, T., Timmermann, A., Kimoto, M., and Watanabe, M.: Potential tropical Atlantic impacts on Pacific decadal climate trends, Geophys. Res. Lett., 43, 7143–7151, https://doi.org/10.1002/2016GL069544, 2016.
Chikamoto, Y., Johnson, Z. F., Wang, S. Y. S., McPhaden, M. J., and Mochizuki, T.: El Nino-Southern Oscillation Evolution Modulated by Atlantic Forcing, J. Geophys. Res.-Oceans, 125, e2020JC016318, https://doi.org/10.1029/2020JC016318, 2020.
Clarke, H. and Evans, J. P.: Exploring the future change space for fire weather in southeast Australia, Theor. Appl., 136, 513–527, https://doi.org/10.1007/s00704-018-2507-4, 2019.
Clarke, H., Gibson, R., Cirulis, B., Bradstock, R. A., and Penman, T. D.: Developing and testing models of the drivers of anthropogenic and lightning-caused wildfire ignitions in south-eastern Australia, J. Environ. Manage., 235, 34–41, https://doi.org/10.1016/j.jenvman.2019.01.055, 2019.
Clements, C. B., Zhong, S. Y., Bian, X. D., Heilman, W. E., and Byun, D. W.: First observations of turbulence generated by grass fires, J. Geophys. Res.-Atmos., 113, D22102, https://doi.org/10.1029/2008JD010014, 2008.
Climate Analysis Section: AMO Index Data, NCAR [data set], Boulder, USA, https://climatedataguide.ucar.edu/climate-data/atlantic-multi-decadal-oscillation-amo, last access: 17 August 2022a.
Climate Analysis Section: Nino SST Indices (Nino 1+2, 3, 3.4, 4; ONI and TNI), NCAR [data set], Boulder, USA, https://climatedataguide.ucar.edu/climate-data/nino-sst-indices-nino-12-3-34-4-oni-and-tni, last access: 17 August 2022b.
Copernicus Climate Change Service: Fire danger indices historical data from the Copernicus Emergency Management Service, Copernicus Climate Change Service (C3S) Climate Data Store (CDS) [data set], https://doi.org/10.24381/cds.0e89c522, 2019.
Copernicus Contractor: Fire danger indices historical data from the Copernicus Emergency Management Service, Zenodo [data set], https://doi.org/10.5281/zenodo.5754302, 2021.
Damany-Pearce, L., Johnson, B., Wells, A., Osborne, M., Allan, J., Belcher, C., Jones, A., and Haywood, J.: Australian wildfires cause the largest stratospheric warming since Pinatubo and extends the lifetime of the Antarctic ozone hole, Sci. Rep., 12, 12665, https://doi.org/10.1038/s41598-022-15794-3, 2022.
Dowdy, A. J.: Climatological Variability of Fire Weather in Australia, J. Appl. Meteorol. Clim., 57, 221–234, https://doi.org/10.1175/JAMC-D-17-0167.1, 2018.
Duc, H. N., Chang, L. T. C., Azzi, M., and Jiang, N. B.: Smoke aerosols dispersion and transport from the 2013 New South Wales (Australia) bushfires, Environ. Monit. Assess., 190, 428, https://doi.org/10.1007/s10661-018-6810-4, 2018.
Earl, N. and Simmonds, I.: Variability, trends, and drivers of regional fluctuations in Australian fire activity, J. Geophys. Res.-Atmos., 122, 7445–7460, https://doi.org/10.1002/2016JD026312, 2017.
Gan, R., Liu, Q., Huang, G., Hu, K. M., and Li, X. C.: Greenhouse warming and internal variability increase extreme and central Pacific El Niño frequency since 1980, Nat. Commun., 14, 394, https://doi.org/10.1038/s41467-023-36053-7, 2023.
Geng, X., Zhang, W., Jin, F., Stuecker, M. F., and Levine, A. F. Z.: Modulation of the Relationship between ENSO and Its Combination Mode by the Atlantic Multidecadal Oscillation, J. Climate, 33, 4679–4695, https://doi.org/10.1175/JCLI-D-19-0740.1, 2020.
Gent, P. R., Danabasoglu, G., Donner, L. J., Holland, M. M., Hunke, E. C., Jayne, S. R., Lawrence, D. M., Neale, R. B., Rasch, P. J., Vertenstein, M., Worley, P. H., Yang, Z., and Zhang, M.: The Community Climate System Model Version 4, J. Climate, 24, 4973–4991, https://doi.org/10.1175/2011JCLI4083.1, 2011.
Global Modeling and Assimilation Office (GMAO): MERRA-2 tavgM_2d_flx_Nx: 2d, Monthly mean, Time-Averaged, Single-Level, Assimilation, Surface Flux Diagnostics V5.12.4, Greenbelt, MD, USA, Goddard Earth Sciences Data and Information Services Center (GES DISC) [data set], https://doi.org/10.5067/0JRLVL8YV2Y4, 2015a.
Global Modeling and Assimilation Office (GMAO): MERRA-2 tavgM_2d_slv_Nx: 2d, Monthly mean, Time-Averaged, Single-Level, Assimilation, Single-Level Diagnostics V5.12.4, Greenbelt, MD, USA, Goddard Earth Sciences Data and Information Services Center (GES DISC) [data set], https://doi.org/10.5067/AP1B0BA5PD2K, 2015b.
Harris, S., Nicholls, N., and Tapper, N.: Forecasting fire activity in Victoria, Australia, using antecedent climate variables and ENSO indices, Int. J. Wildland Fire, 23, 173–184, https://doi.org/10.1071/WF13024, 2014.
Hennessy, K. J., Lucas, C., Nicholls, N., Bathols, J., Suppiah, R., and Ricketts, J. H.: Climate change impacts on fire-weather in south-east Australia, 88 pp., ISBN: 1-921061-10-3, 2005.
Hersbach, H., Bell, B., Berrisford, P., Biavati, G., Horányi, A., Muñoz Sabater, J., Nicolas, J., Peubey, C., Radu, R., Rozum, I., Schepers, D., Simmons, A., Soci, C., Dee, D., and Thépaut, J.-N.: ERA5 monthly averaged data on single levels from 1979 to present, Copernicus Climate Change Service (C3S) Climate Data Store (CDS) [data set], https://doi.org/10.24381/cds.f17050d7, 2019.
Hersbach, H., Bell, B., Berrisford, P., Biavati, G., Horányi, A., Muñoz Sabater, J., Nicolas, J., Peubey, C., Radu, R., Rozum, I., Schepers, D., Simmons, A., Soci, C., Dee, D., and Thépaut, J.-N.: ERA5 hourly data on single levels from 1940 to present, Copernicus Climate Change Service (C3S) Climate Data Store (CDS) [data set], https://doi.org/10.24381/cds.adbb2d47, 2023.
Huang, B., Banzon, V. F., Freeman, E., Lawrimore, J., Wei, L., Peterson, T. C., Smith, T. M., Thorne, P. W., Woodruff, S. D., and Zhang, H.-M.: Extended Reconstructed Sea Surface Temperature (ERSST), Version 4, NOAA National Centers for Environmental Information [data set], https://doi.org/10.7289/V5KD1VVF, 2015.
Huang, B., Thorne, P. W., Banzon, V. F., Boyer, T., Chepurin, G., Lawrimore, J. H., Menne, M. J., Smith, T. M., Vose, R. S., and Zhang, H.-M.: NOAA Extended Reconstructed Sea Surface Temperature (ERSST), Version 5, NOAA National Centers for Environmental Information [data set], https://doi.org/10.7289/V5T72FNM, 2017.
Jain, P., Castellanos-Acuna, D., Coogan, S. C. P., Abatzoglou, J. T., and Flannigan, M. D.: Observed increases in extreme fire weather driven by atmospheric humidity and temperature, Nat. Clim., 12, 63–70, https://doi.org/10.1038/s41558-021-01224-1, 2021.
Japan Meteorological Agency: Characteristics of Global Sea Surface Temperature Analysis Data (COBE-SST) for Climate Use, Monthly Report on Climate System Separated, Japan Meteorological Agency, 12, 116 pp., https://psl.noaa.gov/data/gridded/data.cobe2.html (last access: 20 November 2022), 2006.
Kalnay, E., Kanamitsu, M., Kistler, R., Collins, W., Deaven, D., Gandin, L., Iredell, M., Saha, S., White, G., Woollen, J., Zhu, Y., Leetmaa, A., Reynolds, B., Chelliah, M., Ebisuzaki, W., Higgins, W., Janowiak, J., Mo, K. C., Ropelewski, C., Wang, J., Jenne, R., and Joseph, D.: The NCEP/NCAR 40-year reanalysis project, B. Am. Meteorol. Soc., 77, 437–471, https://doi.org/10.1175/1520-0477(1996)077<0437:TNYRP>2.0.CO;2, 1996 (data available at: https://psl.noaa.gov/data/gridded/data.ncep.reanalysis.html, last access: 19 November 2021).
Kaplan, A., Cane, M. A., Kushnir, Y., Clement, A. C., Blumenthal, M. B., and Rajagopalan, B.: Analyses of global sea surface temperature 1856–1991, J. Geophys. Res.-Oceans, 103, 18567–18589, https://doi.org/10.1029/97JC01736, 1998 (data available at: https://psl.noaa.gov/data/gridded/data.kaplan_sst.html, last access: 20 November 2021).
Keeley, J. E., Brennan, T. J., and Syphard, A. D.: The effects of prolonged drought on vegetation dieback and megafires in southern California chaparral, Ecosphere, 13, e4203, https://doi.org/10.1002/ecs2.4203, 2022.
Koo, E., Pagni, P. J., Weise, D. R., and Woycheese, J. P.: Firebrands and spotting ignition in large-scale fires, Int. J. Wildland Fire, 19, 818–843, https://doi.org/10.1071/WF07119, 2010.
Krawchuk, M. A., Moritz, M. A., Parisien, M. A., Van Dorn, J., and Hayhoe, K.: Global Pyrogeography: the Current and Future Distribution of Wildfire, PLoS One, 4, e5102, https://doi.org/10.1371/journal.pone.0005102, 2009.
Kriwoken, L. K.: Australian biodiversity and marine protected areas, Ocean Coast. Manage., 44, 113–132, https://doi.org/10.1016/S0964-5691(96)00047-6, 1996.
Lawson, B. D. and Armitage, O. B.: Weather Guide for the Canadian Forest Fire Danger Rating System, Northern Forestry Center, Canadian Forest Service, 1–84, ISBN: 978-1-100-11565-8, 2008.
Levine, A. F. Z., McPhaden, M. J., and Frierson, D. M. W.: The impact of the AMO on multidecadal ENSO variability, Geophys. Res. Lett., 44, 3877–3886, https://doi.org/10.1002/2017GL072524, 2017.
Li, X. C., Holland, D. M., Gerber, E. P., and Yoo, C.: Impacts of the north and tropical Atlantic Ocean on the Antarctic Peninsula and sea ice, Nature, 505, 538–542, https://doi.org/10.1038/nature12945, 2014.
Li, X. C., Gerber, E. P., Holland, D. M., and Yoo, C.: A Rossby Wave Bridge from the Tropical Atlantic to West Antarctica, J. Climate, 28, 2256–2273, https://doi.org/10.1175/JCLI-D-14-00450.1, 2015.
Li, X. C., Xie, S. P., Gille, S. T., and Yoo, C.: Atlantic-induced pan-tropical climate change over the past three decades, Nat. Clim., 6, 275–279, https://doi.org/10.1038/nclimate2840, 2016.
Li, Y. J., Li, J. P., Jin, F. F., and Zhao, S.: Interhemispheric propagation of stationary Rossby waves in a horizontally nonuniform background flow, J. Atmos. Sci., 72, 3233–3256, https://doi.org/10.1175/JAS-D-14-0239.1, 2015.
Li, Y. J., Feng, J., Li, J. P., and Hu, A. X.: Equatorial windows and barrier for Stationary Rossby waves, J. Climate, 32, 6117–6135, https://doi.org/10.1175/JCLI-D-18-0722.1, 2019.
Lin, Z. D. and Li, Y.: Remote Influence of the Tropical Atlantic on the Variability and Trend in North West Australia Summer Precipitation, J. Climate, 25, 2408–2420, https://doi.org/10.1175/JCLI-D-11-00020.1, 2012.
Littell, J. S., Peterson, D. L., Riley, K. L., Liu, Y. Q., and Luce, C. H.: A review of the relationships between drought and forest fire in the United States, Glob. Chang. Biol., 22, 2353–2369, https://doi.org/10.1111/gcb.13275, 2016.
Liu, D. Y., Zhou, C. R., Keesing, J. K., Serrano, O., Wener, A., Fang, Y., Chen, Y. J., Masque, P., Kinloch, J., Sadekov, A., and Du, Y.: Wildfires enhance phytoplankton production in tropical oceans, Nat. Commun., 13, 1348, https://doi.org/10.1038/s41467-022-29013-0, 2022.
Liu, G. Y., Li, J., Jiang, Z. J., and Li, X. C.: Impact of Sea Surface Temperature Variability at Different Ocean Basins on Dust Activities in the Gobi Desert and North China, Geophys. Res. Lett., 49, e2022GL099821, https://doi.org/10.1029/2022GL099821, 2022.
Liu, W., Huang, B., Thorne, P. W., Banzon, V. F., Zhang, H., Freeman, E., Lawrimore, J., Peterson, T. C., Smith, T. M., and Woodruff, S. D.: Extended Reconstructed Sea Surface Temperature Version 4 (ERSST.v4): Part II. Parametric and Structural Uncertainty Estimations, J. Climate, 28, 931–951, https://doi.org/10.1175/JCLI-D-14-00007.1, 2015.
Lv, Z., Yang, J.-C., Lin, X., and Zhang, Y.: Stronger North Atlantic than Tropical Pacific Effects on North Pacific Decadal Prediction, J. Climate, 35, 5773–5785, https://doi.org/10.1175/JCLI-D-21-0957.1, 2022.
Mariani, M., Fletcher, M. S., Holz, A., and Nyman, P.: ENSO controls interannual fire activity in southeast Australia, Geophys. Res. Lett., 43, 10891–10900, https://doi.org/10.1002/2016GL070572, 2016.
Mariani, M., Holz, A., Veblen, T. T., Williamson, G., Fletcher, M. S., and Bowman, D. M. J. S.: Climate Change Amplifications of Climate-Fire Teleconnections in the Southern Hemisphere, Geophys. Res. Lett., 45, 5071–5081, https://doi.org/10.1029/2018GL078294, 2018.
McGregor, S., Timmermann, A., Stuecker, M. F., England, M. H., Merrifield, M., Jin, F. F., and Chikamoto, Y.: Recent Walker circulation strengthening and Pacific cooling amplified by Atlantic warming, Nat. Clim., 4, 888–892, https://doi.org/10.1038/NCLIMATE2330, 2014.
Miller, A. J., Neilson, D. J., Luther, D. S., Hendershott, M. C., Cornuelle, B. D., Worcester, P. F., Dzieciuch, M. A., Dushaw, B. D., Howe, B. M., Levin, J. C., Arango, H. G., and Haidvogel, D. B.: Barotropic Rossby wave radiation from a model Gulf Stream, Geophys. Res. Lett., 34, L23613, https://doi.org/10.1029/2007GL031937, 2007.
Nagaraju, C., Ashok, K., Balakrishnan Nair, T. M., Guan, Z., and Cai, W.: Potential influence of the Atlantic Multi-decadal Oscillation in modulating the biennial relationship between Indian and Australian summer monsoons, Int. J. Climatol., 38, 5220–5230, https://doi.org/10.1002/joc.5722, 2018.
Nguyen, H. D., Azzi, M., White, S., Salter, D., Trieu, T., Morgan, G., Rahman, M., Watt, S., Riley, M., Chang, L. T.-C., Barthelemy, X., Fuchs, D., Lieschke, K., and Nguyen, H.: The Summer 2019–2020 Wildfires in East Coast Australia and Their Impacts on Air Quality and Health in New South Wales, Australia, Int. J. Env. Res. Pub. He., 18, 3538, https://doi.org/10.3390/ijerph18073538, 2021.
Nolan, R. H., Boer, M. M., Collins, L., de Dios, V. R., Clarke, H., Jenkins, M., Kenny, B., and Bradstock, R. A.: Causes and consequences of eastern Australia's 2019–20 season of mega-fires, Glob. Chang. Biol., 26, 1039–1041, https://doi.org/10.1111/gcb.15125, 2020.
Power, S., Casey, T., Folland, C., Colman, A., and Mehta, V.: Inter-decadal modulation of the impact of ENSO on Australia, Clim. Dynam., 15, 319–324, https://doi.org/10.1007/s003820050284, 1999.
Rayner, N. A., Parker, D. E., Horton, E. B., Folland, C. K., Alexander, L. V., Rowell, D. P., Kent, E. C., and Kaplan, A.: Global analyses of sea surface temperature, sea ice, and night marine air temperature since the late nineteenth century, J. Geophys. Res.-Atmos, 108, 4407, https://doi.org/10.1029/2002JD002670, 2003 (data available at: https://www.metoffice.gov.uk/hadobs/hadisst/, last access: 20 November 2021).
Ren, H. C., Zuo J. Q., and Li, W. J.: The impact of tropical Atlantic SST variability on the tropical atmosphere during boreal summer, J. Climate, 34, 6705–6723, https://doi.org/10.1175/JCLI-D-20-0259.1, 2021.
Ren, X. Y., Zhang, L., Cai, W. J., Li, X. C., Wang, C. Y., Jin, Y. S., and Wu, L. X.: Influence of tropical Atlantic meridional dipole of sea surface temperature anomalies on Antarctic autumn sea ice, Environ. Res. Lett., 17, 094046, https://doi.org/10.1088/1748-9326/ac8f5b, 2022.
Risbey, J. S., Pook, M. J., McIntosh, P. C., Wheeler, M. C., and Hendon, H. H.: On the Remote Drivers of Precipitation Variability in Australia, Mon. Weather Rev., 137, 3233–3253, https://doi.org/10.1175/2009MWR2861.1, 2009.
Sardeshmukh, P. D. and Hoskins, B. J.: The Generation of Global Rotational Flow by Steady Idealized Tropical Divergence, J. Atmos. Sci., 45, 1228–1251, https://doi.org/10.1175/1520-0469(1988)045<1228:TGOGRF>2.0.CO;2, 1988.
Schneider, D. P., Deser, C., Fasullo, J., and Trenberth, K. E.: Climate Data Guide Spurs Discovery and Understanding, EOS T. Am. Geophys. Un., 94, 121, https://doi.org/10.1002/2013eo130001, 2013.
Simpkins, G. R., McGregor, S., Taschetto, A. S., Ciasto, L. M., and England, M. H.: Tropical Connections to Climatic Change in the Extratropical Southern Hemisphere: The Role of Atlantic SST Trends, J. Climate, 27, 4923–4936, https://doi.org/10.1175/JCLI-D-13-00615.1, 2014.
Simpson, C. C., Pearce, H. G., Sturman, A. P., and Zawar-Reza, P.: Behaviour of fire weather indices in the 2009–10 New Zealand wildland fire season, Int. J. Wildland Fire, 23, 1147–1164, https://doi.org/10.1071/wf12169, 2014.
Storch, H. V. and Zwiers, F. W.: Statistical Analysis in Climate Research, Cambridge University Press, Cambridge, 6–8, https://doi.org/10.2307/2669798, 2000.
Trenberth, K. E.: The Definition of El Niño, B. Am. Meteorol. Soc., 78, 2771–2778, https://doi.org/10.1175/1520-0477(1997)078<2771:TDOENO>2.0.CO;2, 1997.
Trenberth, K. E. and Shea, D. J.: Atlantic hurricanes and natural variability in 2005, Geophys. Res. Lett., 33, L12704, https://doi.org/10.1029/2006GL026894, 2006.
Trenberth, K. E. and Stepaniak, D. P.: Indices of El Niño Evolution, J. Climate, 14, 1697–1701, https://doi.org/10.1175/1520-0442(2001)014<1697:LIOENO>2.0.CO;2, 2001.
van Oldenborgh, G. J., Krikken, F., Lewis, S., Leach, N. J., Lehner, F., Saunders, K. R., van Weele, M., Haustein, K., Li, S., Wallom, D., Sparrow, S., Arrighi, J., Singh, R. K., van Aalst, M. K., Philip, S. Y., Vautard, R., and Otto, F. E. L.: Attribution of the Australian bushfire risk to anthropogenic climate change, Nat. Hazards Earth Syst. Sci., 21, 941–960, https://doi.org/10.5194/nhess-21-941-2021, 2021.
Wang, B., Liu, J., Kim, H.-J., Webster, P. J., Yim, S.-Y., and Xiang, B.: Northern Hemisphere summer monsoon intensified by mega-El Niño/southern oscillation and Atlantic multidecadal oscillation, P. Natl. Acad. Sci. USA, 110, 5347–5352, https://doi.org/10.1073/pnas.1219405110, 2013.
Wang, X. Y., Li, X. C., Zhu, J., and Tanajura, C. A. S.: The strengthening of Amazonian precipitation during the wet season driven by tropical sea surface temperature forcing, Environ. Res. Lett., 13, 094015, https://doi.org/10.1088/1748-9326/aadbb9, 2018.
Xue, J. Q., Sun, C., Li, J. P., and Mao, J. Y.: South Atlantic Forced Multidecadal Teleconnection to the Midlatitude South Indian Ocean, Geophys. Res. Lett., 45, 8480–8489, https://doi.org/10.1029/2018GL078990, 2018.
Yu, J., Kao, P., Paek, H., Hsu, H., Hung, C., Lu, M., and An, S.: Linking Emergence of the Central Pacific El Niño to the Atlantic Multidecadal Oscillation, J. Climate, 28, 651–662, https://doi.org/10.1175/JCLI-D-14-00347.1, 2015.
Yu, P., Xu, R. B., Abramson, M. J., Li, S. S., and Guo, Y. M.: Bushfires in Australia: a serious health emergency under climate change, Lancet Planet. Health, 4, E7–E8, https://doi.org/10.1016/S2542-5196(19)30267-0, 2020.
Zhao, S., Li, J. P., Li, Y. J., Jin, F. F., and Zheng, J. Y.: Interhemispheric influence of Indo-Pacific convection oscillation on Southern Hemisphere precipitation through southward propagation of Rossby waves, Clim. Dynam., 52, 3203–3221, https://doi.org/10.1007/s00382-018-4324-y, 2019.