the Creative Commons Attribution 4.0 License.
the Creative Commons Attribution 4.0 License.
 | 18 Aug 2023
A set of methods to evaluate the below-cloud evaporation effect on local precipitation isotopic composition: a case study for Xi'an, China
Meng Xing
Weiguo Liu
Jing Hu
Zheng Wang
When hydrometeors fall from an in-cloud saturated environment toward the ground, especially in arid and semiarid regions, below-cloud processes may heavily alter the isotopic composition of precipitation through equilibrium and non-equilibrium fractionations. If these below-cloud processes are not correctly identified, they can lead to misinterpretation of the precipitation isotopic signal. To correctly understand the environmental information recorded in the precipitation isotopes, qualitatively analyzing the below-cloud processes and quantitatively calculating the below-cloud evaporation effect are two important steps. Here, based on 2 years of synchronous observations of precipitation and water vapor isotopes in Xi'an, China, we compiled a set of effective methods to systematically evaluate the below-cloud evaporation effect on local precipitation isotopic composition. The ΔdΔδ diagram is a tool to effectively diagnose below-cloud processes, such as equilibration or evaporation, because the isotopic differences (δ2H; d-excess) between the precipitation-equilibrated vapor and the observed vapor show different pathways. By using the ΔdΔδ diagram, our data show that evaporation is the major below-cloud process in Xi'an, while snowfall samples retain the initial cloud signal because they are less impacted by the isotopic exchange between vapor and solid phases. Then, we chose two methods to quantitatively characterize the influence of below-cloud evaporation on local precipitation isotopic composition. One is based on the raindrop's mass change during its falling (hereafter referred to as method 1), and the other is dependent on the variations in precipitation isotopic composition from the cloud base to the ground (hereafter referred to as method 2). By comparison, we found that there are no significant differences between the two methods in evaluating the evaporation effect on δ2Hp, except for snowfall events. The slope of the evaporation in proportion to the variation in δ2H (H) is slightly larger in method 1 (1.0 ‰ %−1) than in method 2 (0.9 ‰ %−1). Additionally, both methods indicate that the evaporation effect is weak in autumn and heavy in spring. Through a sensitivity test, we found that in two methods, relative humidity is the most sensitive parameter, while the temperature shows different effects on the two methods. Therefore, we concluded that both methods are suited to the investigation of the below-cloud evaporation effect, while in method 2, other below-cloud processes, such as supersaturation, can still be included. By applying method 2, the diagnosis of below-cloud processes and the understanding of their effects on the precipitation isotopic composition will be improved.
- Article
(2879 KB) - Full-text XML
-
Supplement
(1174 KB) - BibTeX
- EndNote


For the paleoenvironment, the isotopic signal of precipitation recorded in ice cores (Thompson et al., 2000; Yao et al., 1996), tree rings (Liu et al., 2004; Y. Liu et al., 2017), speleothems (Cai et al., 2010; Tan et al., 2014), leaf wax of loess–paleosol deposits (Z. Wang et al., 2018), and lake sediments (W. Liu et al., 2017, 2019) could be used to reconstruct the information of temperature, precipitation, and hydrological regimes in geologic history, as it participated in the formation or growth of these geological archives. For the modern environment, it could be used to quantitatively constrain the water vapor contribution from the end-members of advection (Peng et al., 2011), evaporation (Sun et al., 2020; Wang et al., 2016a), transpiration (Li et al., 2016; Zhao et al., 2019), and even anthropogenic activities (Fiorella et al., 2018; Gorski et al., 2015; Xing et al., 2020), as it is itself an important part of the hydrological cycle. Thus, the hydrogen and oxygen isotopes of precipitation are some of the most important tools to trace the hydrological cycle and climate change (Bowen et al., 2019; Gat, 1996). However, due to being limited by the sampling and isotopic fractionation theories, there remains large uncertainty (i.e., the below-cloud evaporation intensity, the moisture recycling ratio, and water molecule exchange between the droplet and ambient air) in deciphering the information contained in precipitation when using hydrogen and oxygen isotopes (Bowen et al., 2019; Yao et al., 2013).
Below-cloud evaporation is one of the processes that influences the falling raindrops and modifies their final stable isotopic content and thus needs to be properly evaluated. Over the past decades, in order to determine whether a hydrometeor has evaporated during its fall, most studies have depended on a second-order isotopic parameter (Dansgaard, 1964; Jeelani et al., 2018; Li and Garzione, 2017), deuterium excess (defined as d-excess = δ2H − 8 × δ18O). This parameter is representative of the non-equilibrium fractionations, since light isotopes (1H and 16O) equilibrate faster than heavy isotopes (2H and 18O) in different phases (Clark and Fritz, 1997; Dansgaard, 1964). For raindrops, the lighter water molecules (1HO) preferentially equilibrate or diffuse from the liquid phase to the gas phase during their falling through unsaturated ambient air. Equilibrium fractionation does not substantially change d-excess, while a non-equilibrium diffusional process would result in a decrease in d-excess in rain (Fisher, 1991; Merlivat and Jouzel, 1979). Additionally, the slope of the local meteoric water line (LMWL) has also been widely used as a metric to infer the below-cloud evaporation effect according to the theory of water isotope equilibrium fractionation (Chakraborty et al., 2016; Putman et al., 2019; S. Wang et al., 2018). Generally, the LMWL slope is approximately equal to 8.0 in equilibrium fractionation, and a slope deviating from 8.0 is related to non-equilibrium fractionation, such as the re-evaporation of raindrops.
However, it is worth noting that the change in air masses (Guan et al., 2013), condensation under supersaturation conditions (Jouzel et al., 2013), or moisture exchange in the cloud and subcloud layers (Graf et al., 2019) also cause large variations in the slopes and d-excess values (Putman et al., 2019; Tian et al., 2018). Therefore, it is imperative to explore a novel method to more accurately identify the below-cloud processes. Recently, Graf et al. (2019) provided a new interpretive framework to directly separate the convoluted influences on the stable isotopic composition of vapor and precipitation according to the theoretical fractionation processes, especially with respect to the influences of equilibration and below-cloud evaporation. The axes of the new diagram consist of the differences, namely Δδ2H and Δd, between the isotopic composition of equilibrated vapor from precipitation and near-surface observed vapor, namely the ΔδΔd diagram. Compared with the slope of the LMWL or d-excess, below-cloud equilibration and evaporation have different spatial distributions in the two-dimensional-phase space of the ΔδΔd diagram, which makes them more easily distinguishable. Although the ΔδΔd diagram gives us a new guideline to more accurately identify below-cloud processes, the work by Graf et al. (2019) was only tested on a cold frontal rain event during a short time, and hence, more work needs to be done to validate the general applicability of their framework.
The cloud-base signal of precipitation isotopes is important in hydrological studies, and thus it is necessary to quantitatively evaluate the influence of below-cloud evaporation on its variations. Normally, the isotopic difference between raindrops between ground level and cloud base is determined by the below-cloud evaporation intensity. Because it is difficult to accurately measure the vapor or precipitation isotopic composition at the cloud base, the model proposed by Stewart (1975) has been widely used to evaluate the below-cloud evaporation effect for a long time. Based on well-defined laboratory conditions, Stewart (1975) parameterized the change in the isotopic composition of a falling water drop with the vapor and raindrop isotopic compositions at the cloud base and the remaining fraction of raindrop mass after evaporation (hereafter referred to as method 1). Froehlich et al. (2008) adapted the Stewart model and then assessed the change in d-excess due to below-cloud evaporation in the European Alps. Wang et al. (2016b) further refined the calculations of the parameters, which are used to determine the remaining fraction of raindrop mass in the Stewart model and to assess the variation in d-excess of raindrops in central Asia. However, these quantitative evaluations of below-cloud evaporation are indirect because the results are largely dependent on the parameter that is the remaining fraction of raindrop mass after evaporation.
In recent years, with progress in optical laser systems, relatively portable field-deployable laser spectroscopic instruments have emerged, which allow online, autonomous, and high-frequency site measurements of the water vapor stable isotope composition to be achieved (Aemisegger et al., 2012; Christner et al., 2018). Therefore, the vapor or precipitation isotopic composition at the cloud base could be directly measured (Salmon et al., 2019) or indirectly deduced from the ground-level vapor isotopic composition (Deshpande et al., 2010; Salamalikis et al., 2016). This enables us to directly calculate the influence of below-cloud processes on the precipitation isotopic composition (hereafter referred to as method 2). However, thus far, these have not been systematically compared.
Here, we use measurements of 2-year near-ground water vapor isotope compositions and 141 precipitation isotope compositions (including event-based snowfall samples) that were collected in Xi'an (34.23∘ N, 108.88∘ E), Shaanxi province, located in the Chinese Loess Plateau (CLP). The objectives of this study are to (1) qualitatively identify the below-cloud processes of falling raindrops by using the ΔδΔd diagram; (2) quantitatively evaluate the below-cloud evaporation effect on precipitation isotopic composition by two methods and compare their differences; and (3) understand the role of meteorological factors on below-cloud evaporation and the characteristics of below-cloud evaporation in Xi'an city. Therefore, with the advantages of paired observations of vapor and precipitation isotopes near the ground, this study will compile a set of effective methods to evaluate the below-cloud evaporation effect on the local precipitation isotopic composition.
2.1 Sampling site
As the capital city of the Shaanxi province and the largest city in northwestern China, Xi'an is located on the Guanzhong Plain on the southern edge of the CLP at an average elevation of 400 m. The city is located in a semiarid to arid region and is representative of most cities in northern and northwestern China (e.g., Lanzhou and Xining; Fig. 1). The mean annual precipitation is 573.7 mm, and the mean annual evaporation is 426.6 mm from 1951 to 2008 (Wu et al., 2013). The notable below-cloud evaporation effect has been reported in many studies for this area (Sun et al., 2020; Wan et al., 2018; Zhu et al., 2016). Therefore, it is an ideal site to study below-cloud processes.
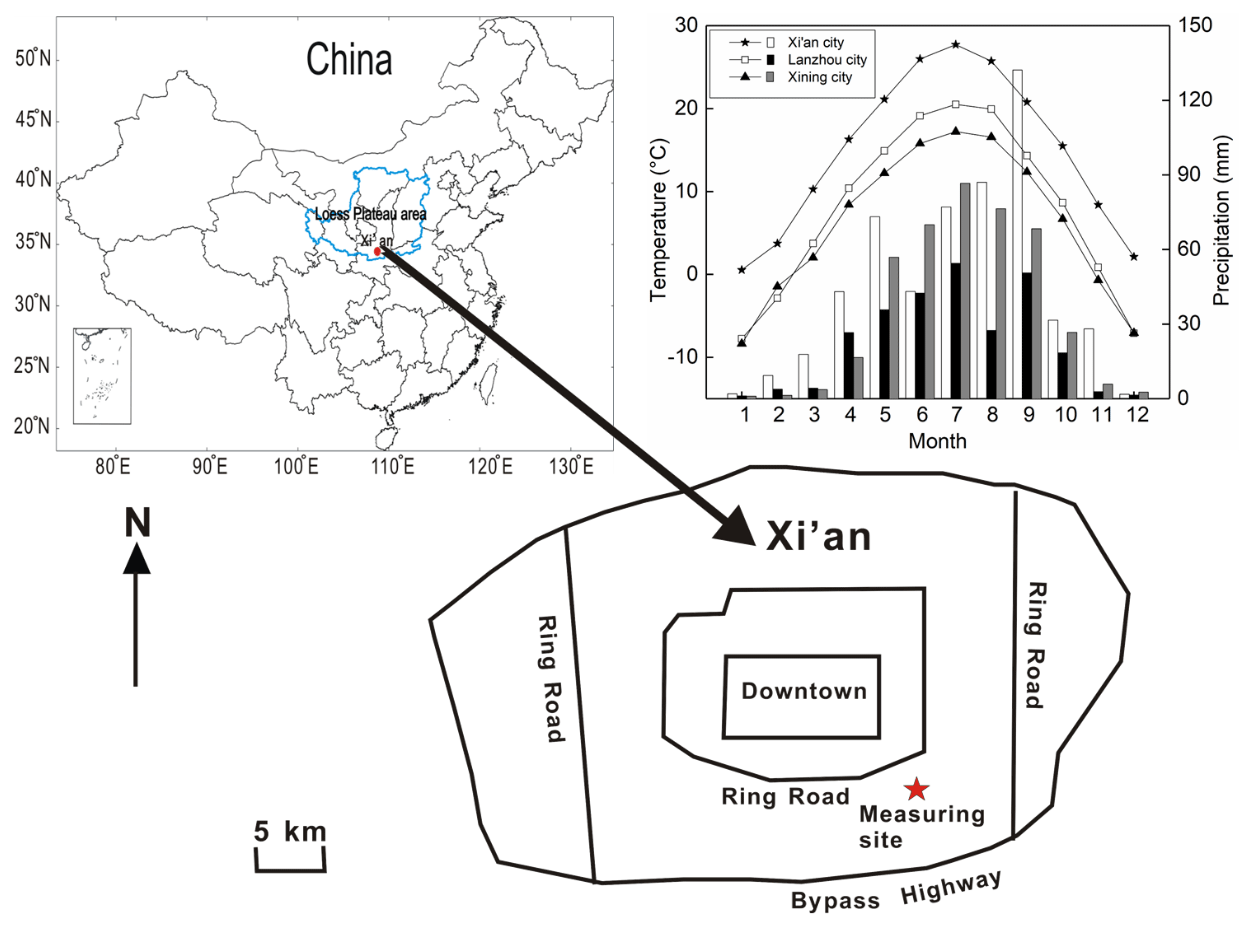
Figure 1Average monthly variations in temperature and precipitation in Xi'an, Lanzhou, and Xining during 2010–2015. Location of the sampling site in the Yanta zone, 9 km SE of downtown Xi'an. Water vapor samples are taken on the seventh floor of a 12-story building, which is approximately 30 m a.g.l. Precipitation samples are collected on the top floor, which is 50 m a.g.l.
The water vapor in situ measurement site is located in a residential area, approximately 10 km southeast of downtown Xi'an city (Fig. 1). The atmospheric water vapor isotopic composition was observed from 1 January 2016 to 31 December 2017 on the seventh floor of the Institute of Earth Environment, Chinese Academy of Sciences, approximately 30 m above ground level (m a.g.l.). The rainfall or snowfall collector was placed on the rooftop of the building (1 m above the floor of the roof), approximately 50 m a.g.l.
2.2 Sampling and isotopic measurement
Rainfall and snowfall samples were collected manually from the beginning of each precipitation event using a polyethylene collector (700 × 450 × 170 mm). Before being used, the collector was cleaned with soap and water, rinsed with deionized water, and then dried. When the precipitation event ended, the collector was quickly taken back to minimize water evaporation. The rainfall volume was measured using a graduated flask. After collection, the samples were filtered through 0.40 µm polycarbonate membranes. Then, the rainfall samples were immediately poured into 100 mL polyethylene bottles. The snowfall samples were first melted at room temperature in closed plastic bags, next the samples were filtered, and finally they were immediately poured into 100 mL polyethylene bottles. Approximately 2 mL of each filtrate was transferred into a sample vial and stored at −4 ∘C until analysis. Of the 141 collected samples, during the 2-year sampling campaigns, 130 were rainfall samples, and the other 11 were snowfall samples (Table S3 in the Supplement).
In all cases, the data are reported in the standard delta notation (δ), i.e., the per mille (‰) deviation from the Vienna Standard Mean Ocean Water according to, , where R is the isotope ratio of the heavy and light isotopes (e.g., ) in the sample and the reference.
The precipitation samples were analyzed with a Picarro L2130-i (serial number HIDS 2104) wavelength-scanned cavity ring-down spectrometer in high-precision mode. Every isotopic standard or sample was sequentially injected eight times using a 5 µL syringe, and then the arithmetic average of the last three injections was accepted as the final result. All of the samples were calibrated by three laboratory standards, while the δ18O and δ2H true values of the three laboratory standards (laboratory standard-1 (LS-1) is δ18O = +0.3 ‰ and δ2H = −0.4 ‰; laboratory standard-2 (LS-2) is δ18O = −8.8 ‰ and δ2H = −64.8 ‰; laboratory standard-3 (LS-3) is δ18O = −24.5 ‰ and δ2H = −189.1 ‰) are calibrated to the scale of two international standards VSMOW–GISP (Vienna Standard Mean Ocean Water–Greenland Ice Sheet precipitation), with a precision of ±0.2 ‰ and ±1.0 ‰ for δ18O and δ2H, respectively. To correct the instrument drift, the instrument was repeatedly calibrated with the laboratory standards after analyzing eight samples.
Atmospheric water vapor δ18Ov and δ2Hv were also analyzed by Picarro L2130-i but in the liquid–vapor dual mode. The inlet of the gas-phase instrument is connected to the vapor source through an external solenoid valve when measuring vapor samples. This valve can switch the input of the instrument from the vapor sample to dry gas. The instrument is connected to dry gas prior to being connected to the evaporator for measuring liquid water standards so that any traces of the water vapor sample are removed from the measurement cell. The standards are injected into the evaporator with a CTC Analytics autosampler, PAL HTC-xt (LEAP Technologies, Inc., Carrboro, NC, USA), and measured by a laser spectrometer. The atmospheric water vapor is pumped through a 2 m stainless-steel tube ( in. or 0.3175 cm) using a diaphragm pump at a speed of 4 L min−1 and detected by the laser spectrometer. The outside length of the stainless-steel tube is approximately 0.5 m, and the inside length is approximately 1.5 m. We covered the stainless-steel tube with heating tape maintained at 60 ∘C to prevent water vapor from condensing in the stainless-steel tube. The air intake was protected with a shield to prevent rainwater from entering the sample line and limit direct sunlight.
The raw water vapor δ18Ov and δ2Hv data were obtained at approximately 1 Hz and then block-averaged into 1 h intervals. As the main usage of this instrument is to measure liquid water samples in our laboratory, it is used to monitor water vapor isotopes in its spare time. Thus, the missing data indicate that the instrument is either being used for measuring liquid samples or being maintained. The event-based water vapor isotopic result is the average value from the start of the precipitation event to the end.
The hourly meteorological data, such as temperature, relative humidity (RH), and surface pressure in Xi'an, are reported by the Chinese Meteorological Administration and can be downloaded from http://www.weather.com.cn/ (last access: 10 August 2023). The meteorological station is approximately 10 km to the north of our sampling site.
2.3 The representativeness of data
Over 2 years, a total of 514 d of water vapor isotopic composition measurements were carried out. For 141 precipitation samples, 100 precipitation samples have corresponding event-based water vapor isotopic results. In this study, the precipitation events mainly occurred in summer and autumn and less frequently in winter and spring. In summer and autumn, the rainfall amount accounted for more than 70 % of the annual rainfall (Fig. S3 in the Supplement). This is consistent with the multiyear average precipitation distribution in Xi'an (Fig. 1). Therefore, the collected samples are able to represent the precipitation characteristics in this region.
2.4 Water vapor isotopic data correction
The water vapor concentration effect and isotopic composition dependency of the cavity ring-down spectrometer have been pointed out by many studies (e.g., Bastrikov et al., 2014; Benetti et al., 2014; Steen-Larsen et al., 2013; Weng et al., 2020). To minimize the uncertainty from the measurement, it is important to determine the isotopic composition–humidity correction response function. The humidity dependency shown in Fig. S1 also shows a dependency on the isotopic composition of the standards, as reported by Weng et al. (2020). For example, in Fig. S1a and b, LS-1 shows a decrease in Δδ18O and Δδ2H with decreasing humidity, while LS-3 shows an increase with decreasing humidity. Therefore, we referred to the correction scheme in Weng et al. (2020) for the isotopic composition–humidity dependency.
The isotopic measurements of ground-level δ18Ov and δ2Hv were corrected for isotopic composition–humidity dependency using the following:
where δiso-hum-cor is the isotopic composition–humidity dependency-corrected water vapor isotopic composition at 20 000 ppmv. δmeas is the raw, measured isotopic composition at that humidity. h is the measured humidity, and a, b, and c are fitting coefficients for each water standard and isotope species. The detailed correction processes are provided in Text S1 in the Supplement.
To calibrate the water vapor isotopic composition to the VSMOW–GISP scale, three known-value laboratory standards were used in the conversion, while these standards were analyzed in 24 h intervals to correct for instrument drift. The 1σ-estimated total uncertainties are from 2.1 ‰ to 12.4 ‰ for δ2Hv, 0.4 ‰ to 1.7 ‰ for δ18Ov, and 3.8 ‰ to 18.4 ‰ for d-excessv over the range of humidity from 30 000 to 3000 ppmv on a 10 min average, using a Monte Carlo method.
2.5 Analytical methods
2.5.1 ΔdΔδ diagram
When raindrop falls from the cloud base to the ground, it continuously exchanges with the surrounding vapor and may encounter a net loss due to evaporation. However, this process is difficult to quantify by observation. Making use of stable water isotopes, Graf et al. (2019) introduced the ΔdΔδ diagram to diagnose the below-cloud processes and their effects on vapor and precipitation isotopic composition, since equilibration and evaporation are two different processes and lead to different directions in the two-dimensional-phase space of the ΔdΔδ diagram. Here, the differences in the isotopic composition of precipitation-equilibrated vapor relative to the observed ground-level vapor can be expressed as follows:
where δpv-eq and δgr-v are the δ2H (δ18O) of equilibrium vapor from precipitation and observed vapor near the ground, respectively, and d-excesspv-eq and d-excessgr-v are the d-excess values of the equilibrium vapor from precipitation and observed vapor near the ground, respectively. For the detailed calculation processes, please refer to the Text S2 or Graf et al. (2019).
2.5.2 Below-cloud evaporation calculation: method 1
As reported by Stewart (1975), the isotopic ratio of a falling water drop is as follows:
where iRgr is the isotopic ratio of falling raindrops near the ground. iRva and iRcb are the initial isotopic ratios for the vapor and raindrop at the cloud base. iγ and iβ are the parameters related to the equilibrium fractionation factor, relative humidity, and molecular diffusivities. Fr is the remaining fraction of raindrop mass after evaporation.
Assuming that the initial isotopic composition of the raindrop at the cloud base is in equilibrium with the surrounding water vapor, Froehlich et al. (2008) adapted the Stewart (1975) model and simplified the equation to evaluate the isotopic enrichment due to below-cloud evaporation by the following:
where α is the equilibrium fractionation factor for hydrogen and oxygen isotopes. The parameters of γ and β are defined by Stewart (1975). Fr is the remaining fraction of raindrop mass after evaporation, Δδp is the raindrop isotopic variation due to below-cloud evaporation, and Fi is the evaporation proportion. For the detailed calculation processes, please refer to the Text S3 in the Supplement or Froehlich et al. (2008), Wang et al. (2016b), and Salamalikis (2016).
2.5.3 Below-cloud evaporation calculation: method 2
Because the isotopic composition of a raindrop is directly influenced by the below-cloud processes during its falling, the below-cloud effects could be directly represented by the difference between the isotopic composition of precipitation at the ground level and cloud base.
where δgr-p and δcb-p are the isotopic compositions of a falling raindrop near the ground and below the cloud base, respectively, and Δδp is the raindrop isotopic variation due to below-cloud evaporation. δgr-p is our observed precipitation isotopic composition, and δcb-p can be calculated by ground-level water vapor isotopic composition, according to Deshpande et al. (2010). For the detailed calculation processes, please refer to Text S4 in the Supplement or Araguás-Araguás et al. (2000), Deshpande et al. (2010), and Salamalikis (2016).
Here, it should be noted that both methods use an important assumption, which is that the surface water vapor has a (moist) adiabatic connection to the cloud-base water vapor. In method 1, this assumption is used to calculate the cloud-base height, temperature, and pressure (Text S3; Eqs. S14–S16). In method 2, the isotopic composition of the cloud-base water vapor is calculated assuming a moist adiabatic ascent of the measured ground-level water vapor (Text S3; Eq. S22). In addition, in method 2, we assume that the raindrop isotopic composition (δcb-p) at the cloud base is in equilibrium with the surrounding water vapor, and the observed ground-level precipitation isotopic composition (δgr-p) includes the processes of evaporation, growth, and isotopic equilibrium with the surrounding vapor. Furthermore, the air column is assumed to have no horizontal advection into or out of it and no updraft or downdraft of the air masses during the fall of the hydrometeors. That means the vertical column at the observation site is undisturbed by horizontal movement. These assumptions only hold if a single vertical column extends from the ground to the cloud-base height. If the vertical column is affected by the lateral entrainment of surrounding air, then these assumptions become invalid. The equilibrium exchange process is not separated from evaporation; therefore, the Δδ results may underestimate the below-cloud evaporation effect in method 2. To obtain accurate results, more work is needed to separate equilibration process from the evaporation in future.
Actually, method 1 makes use of the mass change in the falling raindrop to evaluate the below-cloud evaporation effect on isotopic composition, while method 2 evaluates its effect by directly measuring the variations in isotope composition.
2.5.4 Statistical analysis
To compare the difference between the two methods, an independent t test was performed on the Statistical Package for Social Sciences (SPSS 13.0, SPSS Inc., Chicago, USA), followed by setting the significant difference at the p=0.05 level of confidence.
3.1 Relationship between water vapor and precipitation isotopic compositions
Influenced by below-cloud evaporation, the slope of the local meteoric water line (LMWL) would be lower than 8, the precipitation isotopic composition would become more positive, the d-excess of precipitation would be less than 10, and the equilibrated water vapor isotopic composition would be more positive than the observed one. As shown in Fig. 2, the LMWL is defined as δ2Hp = 7.0 × δ18Op + 3.0, based on the event precipitation isotopic composition, and the local water vapor line (LWVL) is defined as δ2Hv = 7.8 × δ18Ov + 15.1, based on the per-precipitation-event water vapor isotopic composition. Both the slope and intercept of the LMWL are lower than the global meteoric water line (GMWL), which has a slope of 8.0 and intercept of 10.0 (Dansgaard, 1964; Gat, 1996), indicating the potentially significant below-cloud evaporation effect on precipitation (Froehlich et al., 2008). In general, the slopes of the meteoric water lines are indicative of kinetic processes superimposed on the equilibrium fractionation, and the somewhat lower slope of the LWVL (slope = 7.8), compared to the expected equilibrium fractionation (slope = 8.0), may also be related to the increasing influence of kinetic processes (Rangarajan et al., 2017).
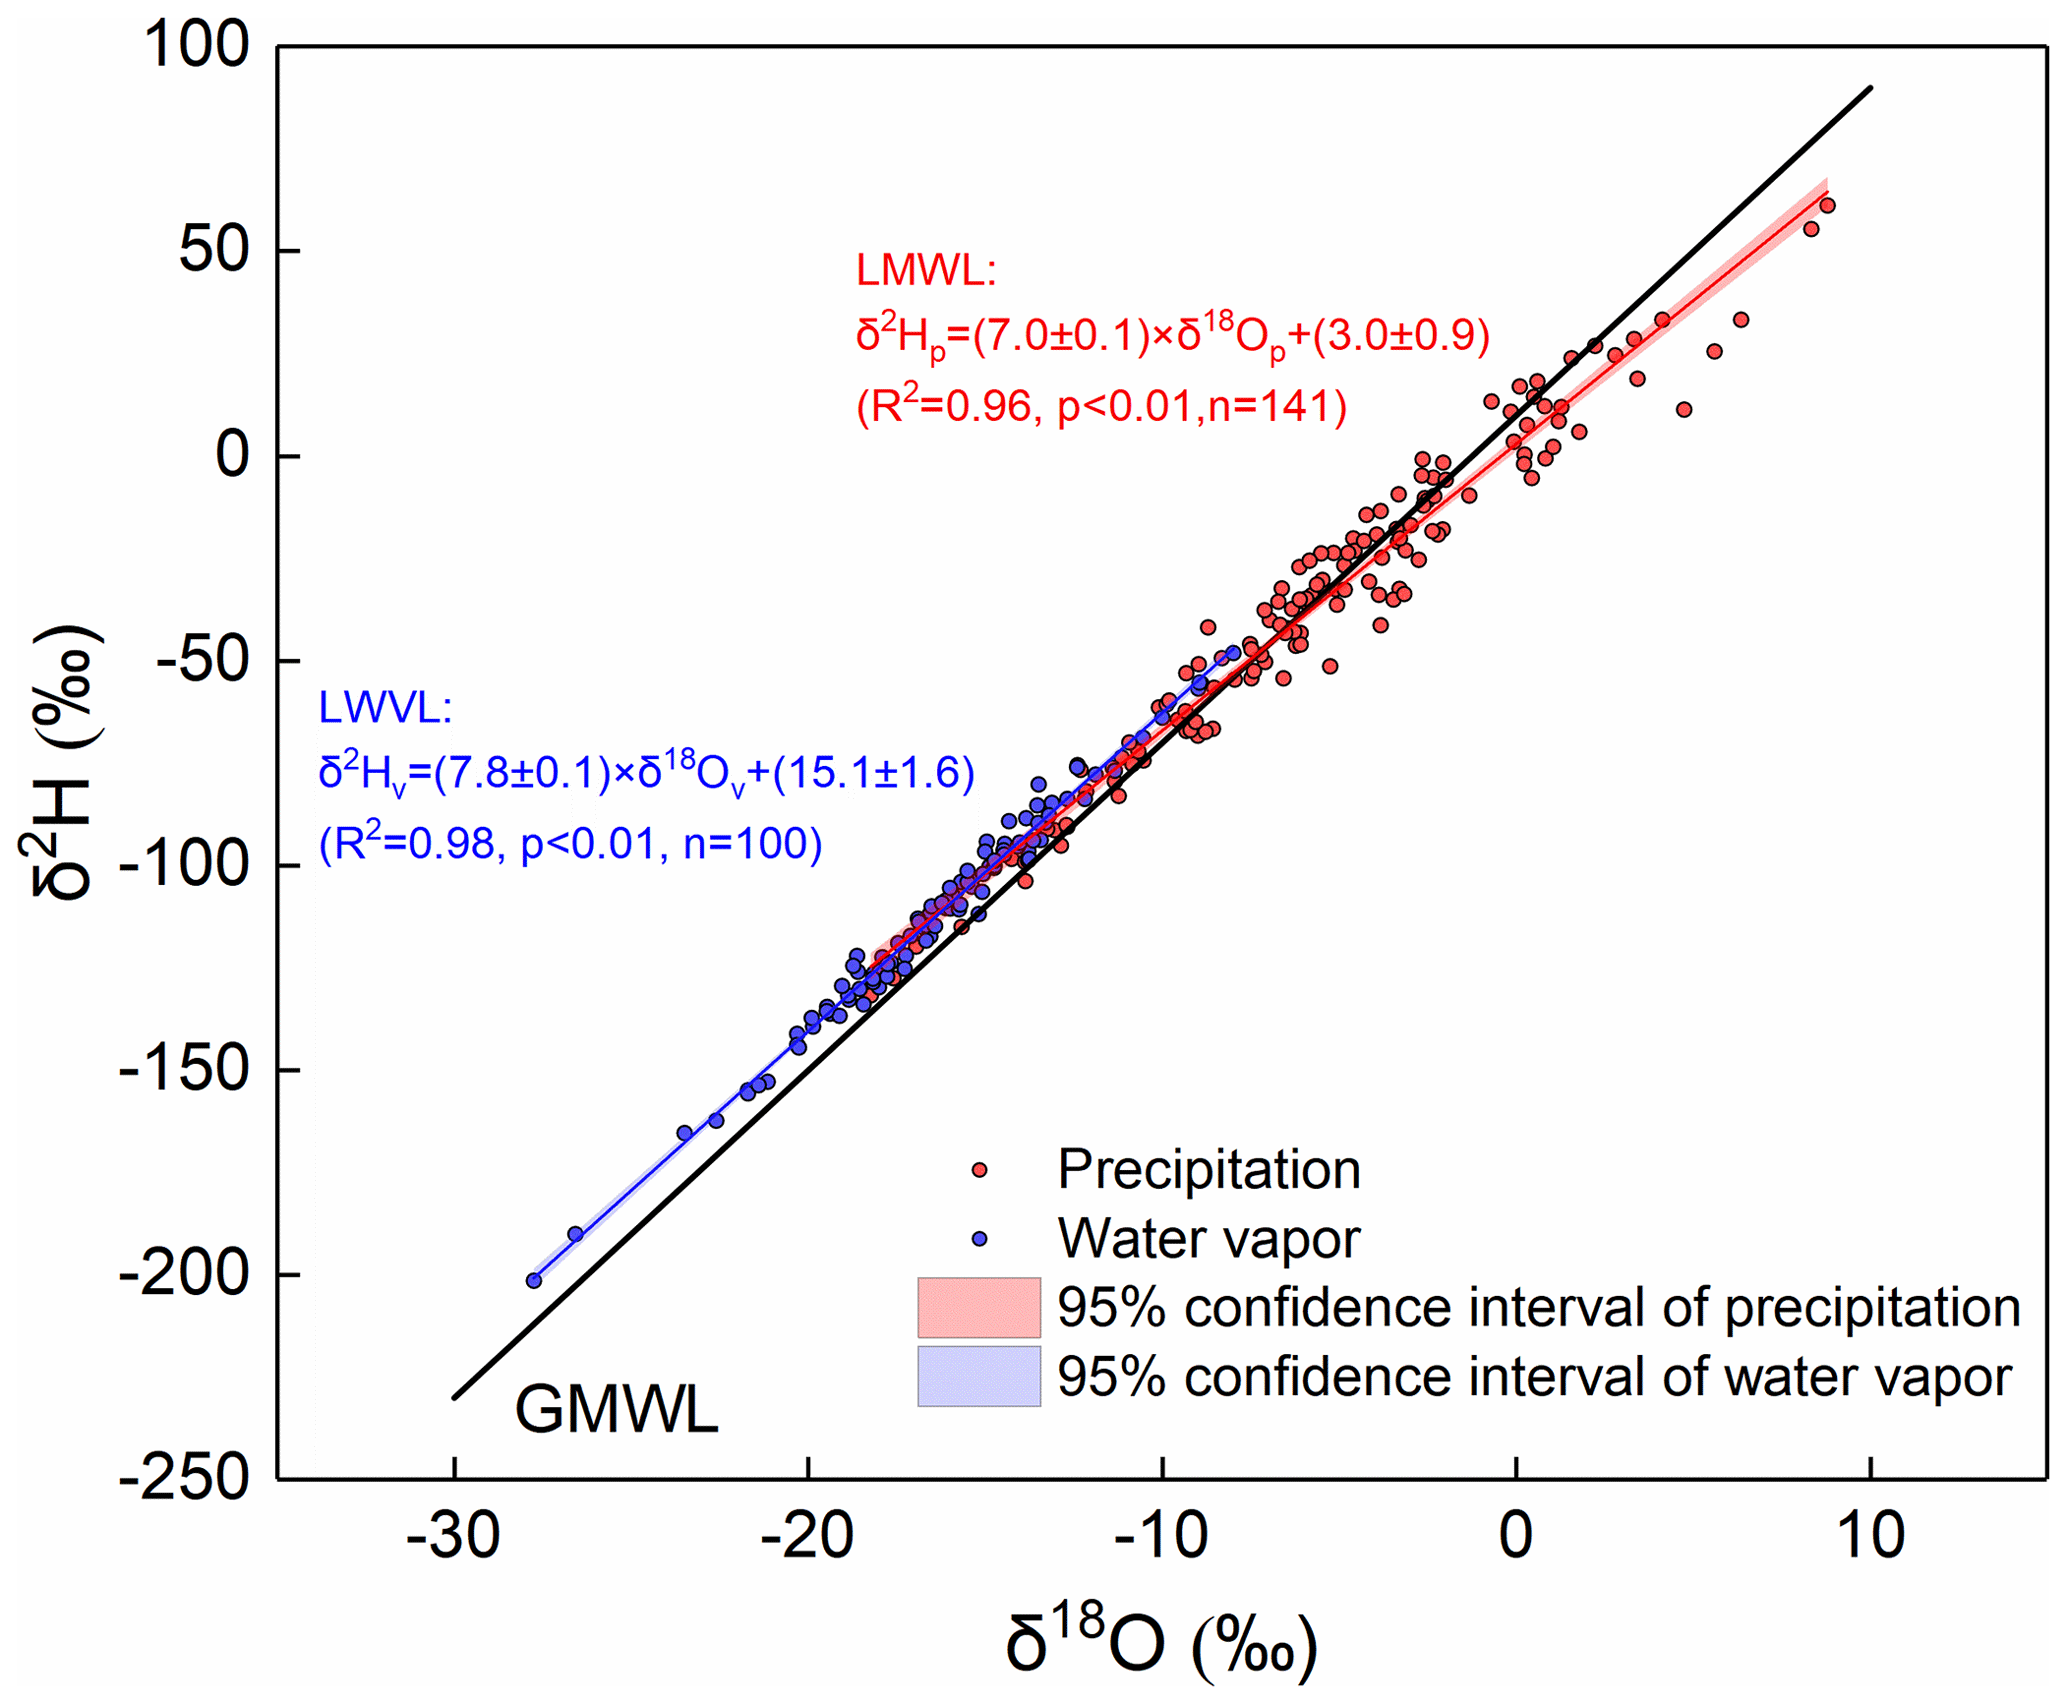
In addition, we noted that the water vapor and precipitation isotopic compositions were basically distributed in different ranges, with the former being generally more negative than the latter (Fig. 2). According to the classic isotopic fractionation theory, heavier isotopes preferentially condense into the liquid phase during the precipitation process, which results in the precipitation isotopic composition being more positive than the water vapor isotopic composition (Dansgaard, 1964). Hence, the distribution characteristics of water vapor and precipitation on the δ18O-δ2H plot would make us suppose that their isotopic compositions are at or close to equilibrium at this study site. To validate our assumption, we plot their relationship in Fig. 3a. As expected, they show a significant positive correlation (R2=0.70; p<0.01), and thus, the water vapor isotopic composition can explain 70 % of the variation in the precipitation isotopic composition. Furthermore, we used the measured precipitation isotopic composition to deduce the water vapor isotopic composition at the ground level according to the liquid–vapor equilibrium isotope fractionation (δ18Opv-eq) and compared it with the observed water vapor (δ18Ov) in Fig. 3b. The scatterplot of the observed δ18Ov versus the equilibrated δ18Opv-eq also presents a significantly positive relationship (Fig. 3b).
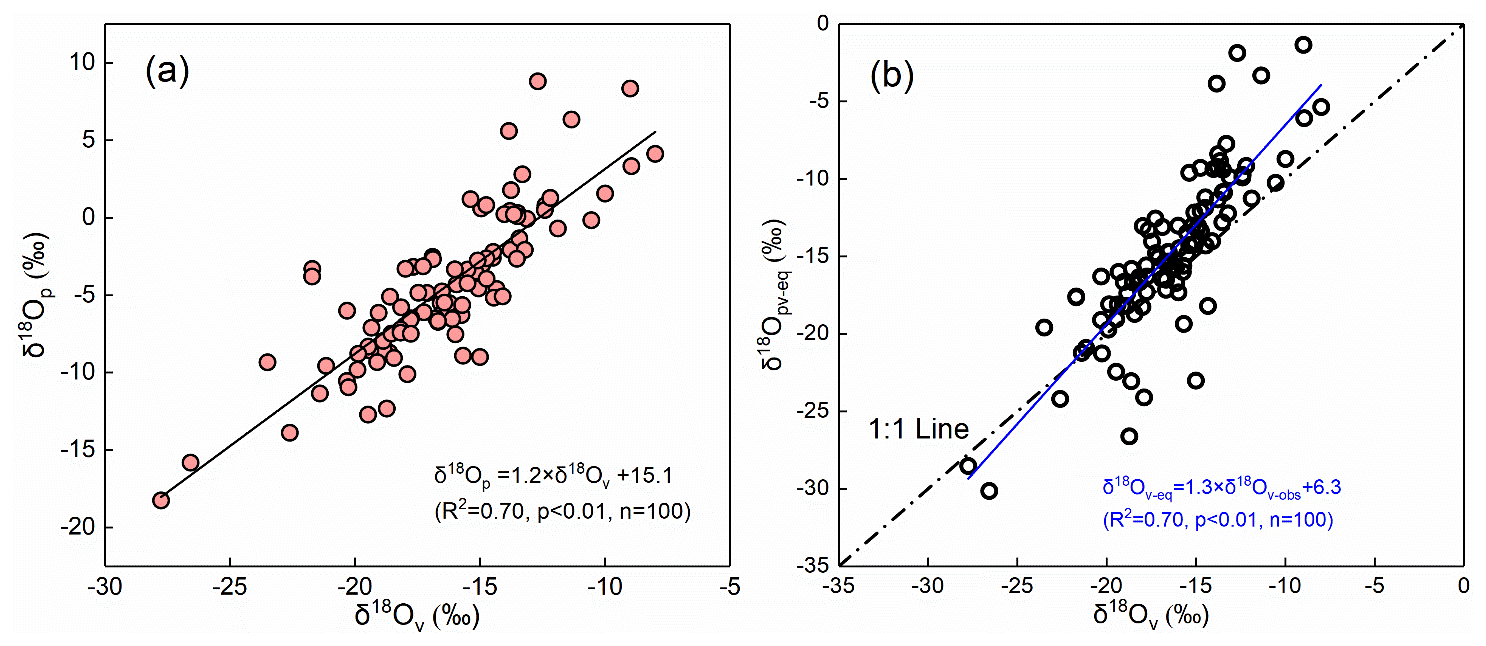
Figure 3Relationship between δ18Op of precipitation and δ18Ov of water vapor in Xi'an (a). The relationship between the equilibrium computed δ18Opv-eq based on the precipitation isotopic composition and the near-ground observed δ18Ov (b). The dashed–dotted line in panel (b) represents the 1 : 1 line, and the blue line represents the regression line of the data.
In Fig. 3b, we also noted that the equilibrated δ18Opv-eq is relatively more positive than the observed δ18Ov. Because Xi'an city belongs to a semiarid area, raindrops are likely to evaporate in an unsaturated environment during falling. Therefore, the positive δ18Opv-eq is caused by the non-equilibrium fractionation in low relative humidity, which makes the δ18Opv-eq-δ18Ov points deviate from the 1 : 1 line.
The reasonable agreement of observed and equilibrated water vapor isotopic compositions has been reported by Jacob and Sonntag (1991), Welp et al. (2008), and Wen et al. (2010); however, they postulated the different relationships underlying δ18Ov and δ18Opv-eq. Jacob and Sonntag (1991) suggested that the water vapor isotopic composition can be deduced from the corresponding precipitation isotopic composition, but Wen et al. (2010) speculated that the equilibrium method cannot accurately predict the ground-level water vapor isotopic composition in arid and semiarid climates because the monthly equilibrated water vapor values in April and November deviate from the observed values. Here, with 2 years of continuous observations, the mean difference between δ18Ov and δ18Opv-eq is −1.1 ‰ for δ18O, −8.1 ‰ for δ2H, and 0.7 ‰ for d-excess. Although there is a good relationship between δ18Ov and δ18Opv-eq in our data, below-cloud evaporation has a significant influence on the precipitation isotopic composition. Therefore, caution should be exercised when deriving the water vapor isotopic composition from the precipitation isotopic composition.
3.2 Below-cloud processes indicated by the ΔdΔδ diagram
Traditionally, to qualitatively assess the below-cloud evaporation of raindrops, the value of d-excessp is a benchmark. Due to the differences in diffusivities of the individual water molecules in non-equilibrium fractionation, d-excessp will deviate from 0 ‰, which is a theoretical value under vapor–liquid equilibrium fractionation at temperatures of approximately 20 ∘C (Gat, 1996). The global mean value of 10 ‰ for the d-excessp in precipitation indicates that evaporation is in general a non-equilibrium process. Normally, below-cloud evaporation will decrease the d-excessp, and in comparison, mixing with the recycled water vapor from surface evaporation and plant transpiration will increase d-excessp (Craig, 1961; Dansgaard, 1964). In addition, in the water molecule diffusion process, the water vapor d-excessv may be modified, which enhances the uncertainty in gauging the below-cloud evaporation process by solely using d-excessp. In contrast, the ΔdΔδ diagram introduced by Graf et al. (2019) provides more information on below-cloud processes.
Theoretically, on the ΔdΔδ diagram, Δd < 0 ‰ and Δδ > 0 ‰ indicate the below-cloud evaporation process. Δδ < 0 ‰ indicates that the falling raindrop is less influenced by below-cloud evaporation and retains the cloud signals. Δd and Δδ close are to 0 ‰, suggesting equilibrium conditions. By projecting our data on the ΔdΔδ diagram, the evaporation, equilibration, and non-exchange (e.g., a snowfall event or a transition from rain to snow with a stronger cloud signal) processes could be clearly differentiated. It is apparent in Fig. 4 that most of the rainfall samples are located in the fourth quadrant with positive Δδ2Hv and negative Δd-excessv, indicating that evaporation is the major below-cloud process. Interestingly, most of the snowfall samples seize the second and third quadrants with negative Δδ2Hv, which is suggestive of below-cloud evaporation with less impact on them, and their initial signals are well retained after cloud-based equilibrium fractionation.
Based on the results from numerical simulations and in situ observations, Graf et al. (2019) concluded that raindrop size and precipitation intensity are two important factors for determining below-cloud processes. For example, precipitation with large raindrops and heavy intensities is less affected by below-cloud processes because of the shorter residence time of raindrops in the atmospheric column with a faster fall velocity. Therefore, they are less affected by the evaporation and equilibration processes when falling toward the ground, and the Δδ2Hv is more negative. It is worth noting that in the case of not considering the factors of raindrop size and rain rate, the different precipitation types also show a clear distribution on the ΔdΔδ diagram, as almost all the snowfall samples have negative Δδ2Hv values (Fig. 4). Theoretically, snowfall events normally occur in low-temperature conditions and correspond to weak evaporation. Furthermore, the diffusion speed of the ice phase (solid) to vapor is lower than that of liquid to vapor. Hence, under such conditions, the isotopic signals of hydrometeor are less affected by the below-cloud processes during falling. This leads Δδ to be more negative with decreasing temperature, such as the observed phenomenon in the post-frontal precipitation isotopes in the Graf et al. (2019) study. Additionally, on the ΔdΔδ diagram, the snow samples with positive Δd-excessv (in the second quadrant) may be related to the supersaturation process, as the water has unusually high d-excessp for the non-equilibrium fractionation of supersaturation (Deshpande et al., 2013; Jouzel and Merlivat, 1984). We conclude that in addition to raindrop size and rain rate, precipitation type is also an essential factor in determining the data distributions on the ΔdΔδ diagram.
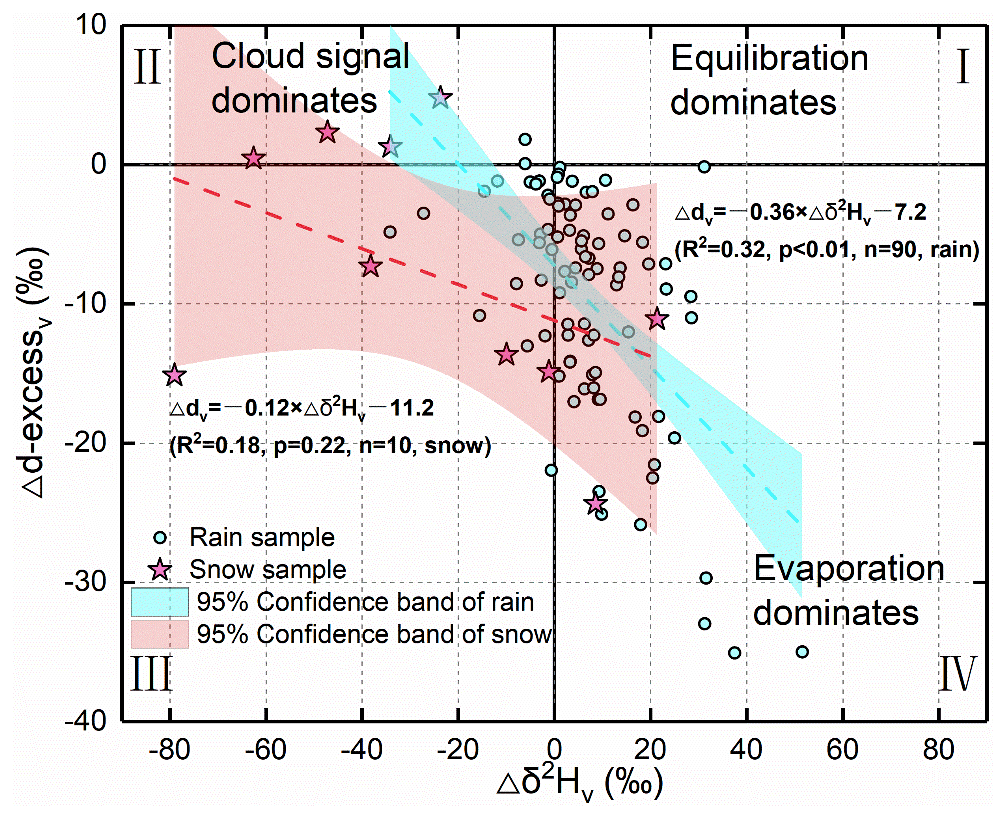
Figure 4The projection of our data on the suggested ΔdΔδ diagram by Graf et al. (2019). The solid lines represent Δd-excessv and Δδ2Hv of 0 ‰. The dashed line corresponds to the linear fit through the samples with the 95 % confidence band in shading. The red line is for rainfall samples, and the cyan line is for snowfall samples. The Roman numerals represent the category of the quadrant.
In Fig. 4, the slope of Δd/Δδ is −0.36 for the rainfall samples and −0.12 for the snowfall samples. Graf et al. (2019) reported a Δd/Δδ slope of −0.3. It should be noted that the slope of Graf et al. (2019) is based on intra-event samples (from the start to the end of precipitation, each with an interval of 10 min to collect one sample), while ours is based on per-event samples (only one sample was collected in each precipitation event). Although the timescale is different in the two studies, interestingly, the rainfall slopes are close to each other, while the snowfall slope is obviously different from the rainfall slope. The Δd/Δδ slope of −0.3 could represent a general characteristic of rainfall for continental midlatitude cold front passages (Graf et al., 2019). Xi'an city is located near 35∘ N in inland China, which belongs to the continental midlatitude region. In comparison, the Δd/Δδ slope of our snow samples is less negative. Therefore, the different Δd/Δδ slopes might be related to the different climatic characteristics or precipitation types. Certainly, to validate this assumption, more work needs to be done in future studies.
3.3 Comparing and analyzing the two methods
The ΔdΔδ diagram provides valuable information on the below-cloud processes, but it is only a qualitative analysis. In comparison, a quantitative evaluation is more important for identifying the below-cloud evaporation effect. Here, we chose two methods to calculate the variations in Δδ2Hp and the evaporation fraction (Fi) of per-event precipitation and to compare their differences.
3.3.1 Quantitative evaluation of the below-cloud evaporation derived from the two methods
The Δδ2Hp ranges from 0 ‰ to 131.1 ‰, with an average and standard deviation of 17.8 ± 23.8 ‰, and the Fi ranges from 0 % to 82.7 %, with an average and standard deviation of 16.3 ± 21.9 % (n=141) for method 1. The Δδ2Hp ranges from −73.8 ‰ to 82.5 ‰, with an average and standard deviation of 16.3 ± 24.4 ‰, and the Fi ranges from 0 % to 67.6 %, with an average and standard deviation of 22.1 ± 21.7 % (n=100) for method 2. For the 90 rainfall events with corresponding water vapor data, the average and standard deviation are 18.4 ± 21.7 ‰ for Δδ2Hp derived from method 1, and the value is 18.7 ± 20.6 ‰ for Δδ2Hp derived from method 2. For the 10 snowfall events, the average and standard deviation values of Δδ2Hp are 42.6 ± 43.7 ‰ for method 1 and ‰ for method 2. In the two methods, according to the independent t test, there are no significant differences in the Δδ2Hp of rainfall samples (F=0; p=0.91; n=90), but the Δδ2Hp of snowfall shows a large difference (F=0.196; p<0.05; n=10).
As shown in Fig. 5a and b, the Δδ2Hp and Fi in the two methods have similar fluctuation trends. A positive Δδ2Hp and high Fi appear from March to July, while a negative Δδ2Hp and low Fi appear from September to the following February. In addition, the most positive Δδ2Hp values are captured by method 1, while the most negative values are detected by method 2. To analyze the underlying reason, we checked the equation used to calculate Δδ2Hp. We noted that, in Eq. (5), Fr is always lower than 1, and thus () is negative. Similarly, is smaller than 1, and thus the () is also negative. Therefore, the Δδ2Hp calculated by method 1 is always positive. In method 2, the most negative Δδ2Hp values relate to snowfall events. During the supersaturation process, vapor deposition takes place over ice in the cloud (Jouzel and Merlivat, 1984), with non-equilibrium fractionation (the kinetic fractionation factor αk<1), leading to the effective isotopic fractionation factor (αeff=αeqαk) being smaller than the equilibrium fractionation coefficient (αeq) and resulting in the ground-observed δgr-p of solid precipitation (snow) being more depleted than the calculated δcb-p under equilibrium fractionation (in Eq. 7). In fact, the mass of snow also increases under supersaturation conditions; however, method 1 only considers the evaporation process. The diameter of the raindrop used to determine the terminal velocity and evaporation intensity (Text S3; Eqs. S10–S13) does not take into account the different relationship of fall velocity to hydrometeor size for snowflakes and raindrops, which results in great uncertainty in method 1. Therefore, method 1 is not suitable for evaluating the below-cloud effect on the precipitation isotopic composition for snowfall or low-temperature rainfall events.
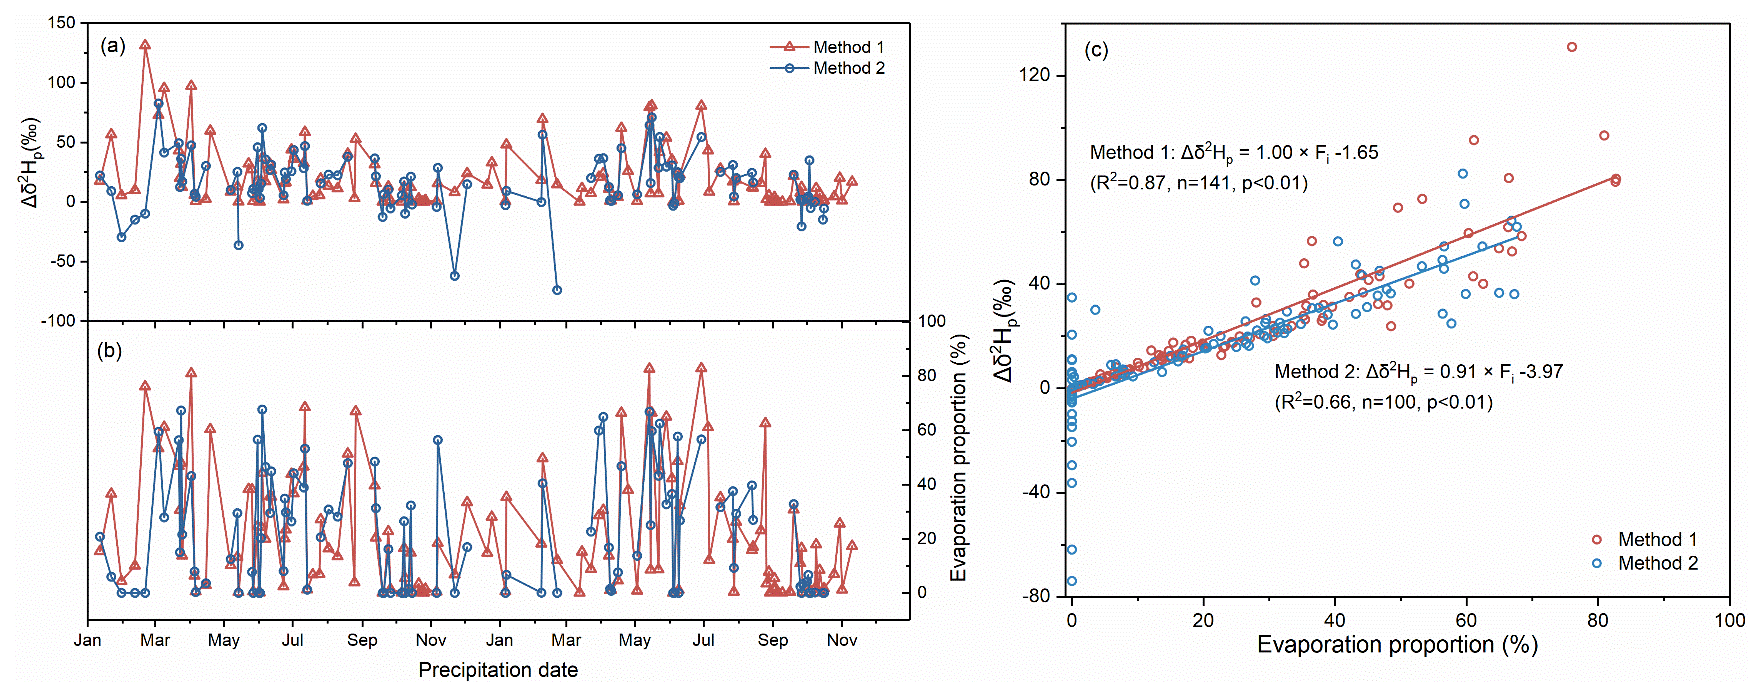
Figure 5The variation in Δδ2Hp for per-event precipitation in method 1 and method 2 (a). The same as panel (a) but for Fi (b). The relationship between Fi and Δδ2Hp in method 1 and method 2 (c).
In addition, the influence of the below-cloud evaporation effect on δ2Hp is greater in method 1 than in method 2, especially at higher Fi conditions (Fig. 5c) because the slope of H in method 1 (1.00 ‰ %−1) is slightly steeper than that in method 2 (0.91 ‰ %−1), and the intercept in method 1 (−1.65) is more positive than that in method 2 (−3.97). Thus, under the same evaporation intensity, Δδ2Hp is more enriched in method 1 than in method 2.
On the seasonal scale, both methods show that the below-cloud evaporation effect is heavier in spring and summer and weaker in autumn and winter (Fig. S4). Their differences are the smallest in spring and the largest in winter. The significant difference in winter might be related to the predominance of solid precipitation, which is not accounted for in method 1.
3.3.2 Meteorological controls on the two methods
To further explore the differences in the two methods, we performed correlation analyses between meteorological factors and Δδ2Hp (Fig. 6). The results show that RH is the most important meteorological factor for both methods (Fig. 6b). Furthermore, the impact of RH on the variations in Δδ2Hp is stronger in method 1 () than in method 2 (), and this phenomenon is more obvious when the RH is lower than 60 %. Although precipitation amounts have influences on both methods as well, their effect on Δδ2Hp is rather weak ( for method 1; for method 2; Fig. 6c), and the relationships are nonlinear. For temperature, in method 1, there is no clear correlation between Δδ2Hp and temperature (r=0.05), and in method 2 their positive correlation is weak (r=0.42).
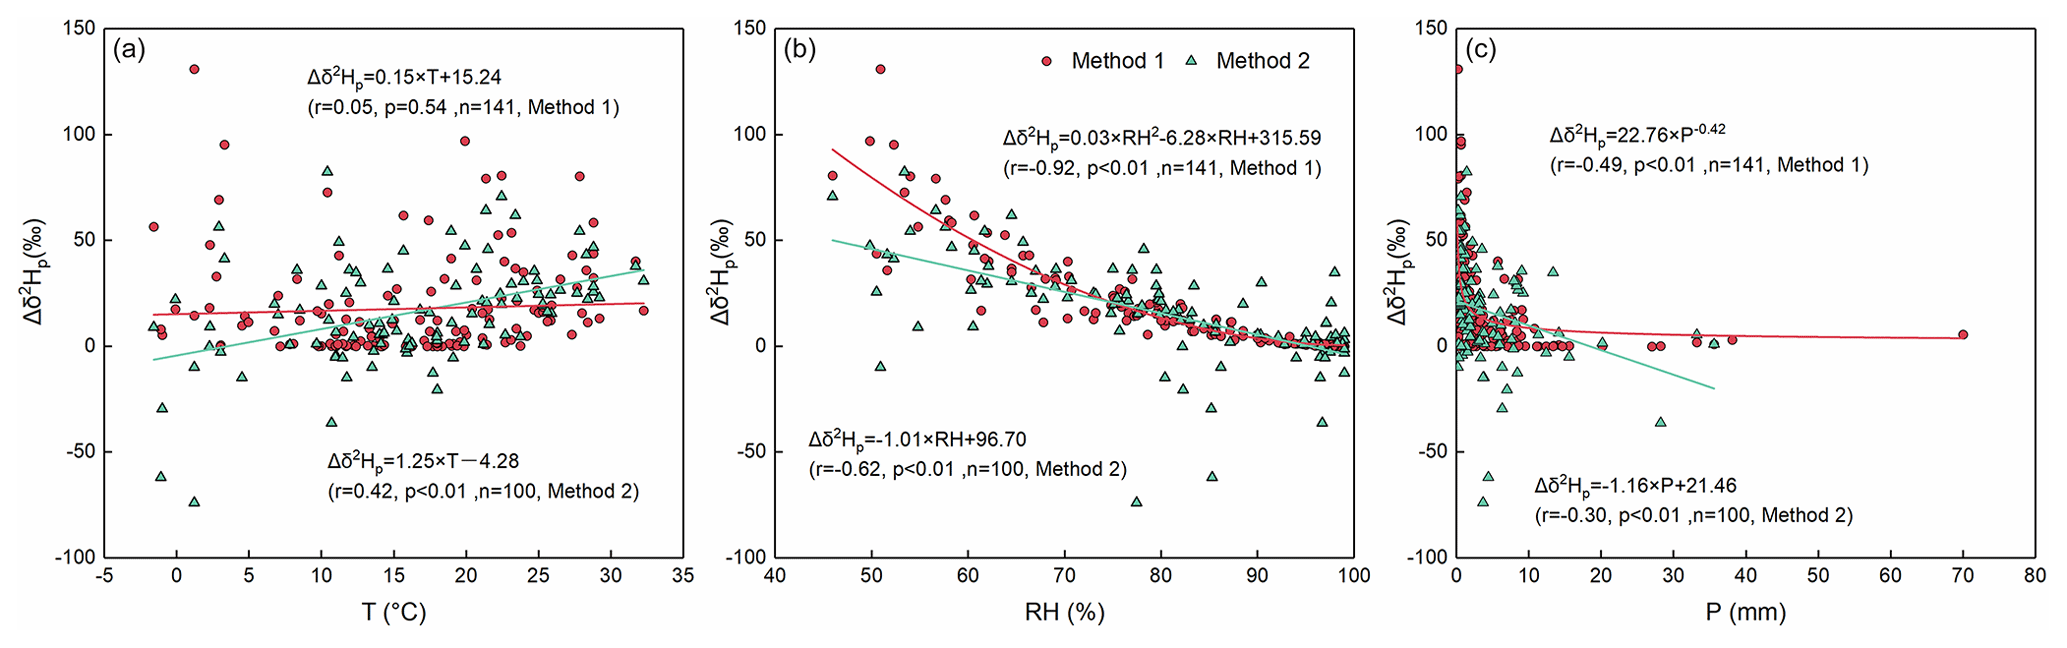
Figure 6The correlations between Δδ2Hp and the temperature in method 1 (red dots) and in method 2 (green triangles) (a). The same as panel (a) but for RH (b). The same as panels (a) and (b) but for precipitation amount (c).
In both methods, under an arid environment with high temperature, low RH, and small precipitation amounts, the evaporation effect on Δδ2Hp is large. However, under the low-temperature conditions (below 5 ∘C), there is a divergence in Δδ2Hp for the two methods, which is partly attributed to the supersaturation condition. With increasing RH, Δδ2Hp becomes closer to 0 in both methods, but the variation in Δδ2Hp is large in method 2 and very limited in method 1 when the RH is higher than 80 %. There is a wide range, from 0 to 130 ‰, for Δδ2Hp when the precipitation amount is small. As the precipitation amount is above 10 mm, the value of Δδ2Hp tends toward 0 ‰.
3.3.3 Sensitivity test
In method 1, the input physical parameters include temperature, RH, precipitation amount, and surface pressure. In method 2, the same input parameters as for method 1 were used, except for the precipitation amount. Therefore, these parameters are considered in the sensitivity tests.
For the RH test, one case adds 10 % to the measured RH, and another case subtracts 10 % from the measured RH. If the RH values are above 100 %, then they are artificially set to 99 % to conform to reality. Two temperature scenarios, plus and minus 10 ∘C, based on the actual temperature, are analyzed. In the sensitivity test of precipitation amount, considering that the amounts are lower than 0.1 mm in some precipitation events, the reduction lower limit is set to 0.1 mm, and the enhancement upper limit is set to 5 mm. Under the basic surface pressure condition, a 10 kPa pressure fluctuation is considered for its impact.
As shown in Fig. 7, the increase in RH and precipitation and decrease in temperature have a negative impact; that is, the below-cloud evaporation effect on the isotopic composition will be attenuated. In contrast, the decrease in RH and precipitation and increase in temperature have a positive impact, indicating that the below-cloud evaporation effect will be strengthened. The varying surface pressure has no impact on Δδ2Hp for both methods. Moreover, the influencing strength of the different physical parameters on Δδ2Hp is different in the two methods. For example, in method 1, the increase in temperature basically does not change the evaporation effect on Δδ2Hp, and the influence of decreasing temperature on mitigating evaporation is limited as well. However, the situation is totally different in method 2, where the temperature is a decisive factor. In addition, the influence of RH is over the temperature in method 1, but the condition is reversed in method 2. The precipitation amount is also an important factor, as the influence of precipitation on Δδ2Hp even surpasses the RH when it is increased by 5 mm. Because of the limited decrease in precipitation amount, its positive feedback is difficult to evaluate.

Figure 7Sensitivity test of Δδ2Hp under different cases. In method 1, the cases include ±10 % RH, ±10 ∘C temperature, ±10 kPa surface pressure, +5 mm precipitation amount, and −0.1 mm precipitation amount. In method 2, the cases include ±10 % RH, ±10 ∘C temperature, and ±10 kPa surface pressure. Δδ2Hp(Sen) represents the results of the sensitivity test, and Δδ2Hp(Base) represents the results of the base condition.
In the calculation process of method 2 (Eq. 7; Text S4; Eq. S22), except for the measured ground-level precipitation and water vapor isotopic compositions (δgr-p and δgr-v), the other two controlling factors are the equilibrium fractionation factor (α) and the cloud-base height. α is determined by the temperature variations in the cloud base, while the cloud-base height is related to surface temperature and RH (Text S3; Eqs. S14–S17). With increasing RH, the cloud-base heights decrease, and vice versa (Fig. S5). In comparison, the cloud-base heights are not sensitive to the changes in temperature (Fig. S5).
Compared with method 2, the calculation process of method 1 is more complex. Many variables, such as raindrop diameter, evaporation intensity, raindrop falling velocity, and cloud-base height need to be considered, while they are convoluted with temperature, RH, precipitation amount, and surface pressure. Through the sensitivity test, RH and precipitation amount are the two decisive factors in method 1 for determining the below-cloud evaporation intensity.
3.3.4 Uncertainty estimations
There are many uncertainties in the estimates of the two methods. In method 1, the input parameters include the variation in temperature, RH, precipitation amount, and surface pressure. In method 2, the uncertainty comes from the variations in the input temperature, RH, surface pressure, ground level water vapor δ2Hgr-v, and precipitation δ2Hp. However, the variations in surface pressure show no impact on Δδ2Hp in the sensitivity test; therefore, they are not considered in the uncertainty calculation.
To check the influence of temperature, RH, precipitation amount, and precipitation δ2Hp on the below-cloud evaporation effect, we assume that the errors are mainly from the measurement uncertainty in the instrument, which is ±0.3 ∘C, ±3 % and ±4 % precipitation amount, and ±1.0 ‰, respectively. Due to the humidity effect (Sect. 2.4), the measured δ2Hgr-v for each event has a wide range of uncertainty, which varies from 1.3 ‰ to 8.2 ‰. Hence, the lower and upper limits of the above-used input parameters for method 1 and method 2 are used to quantify the uncertainties and add them quadratically to ascertain the total uncertainty (Rangarajan et al., 2017; Wu et al., 2022). We obtain the overall uncertainty, which varies from 0.71 ‰ to 0.72 ‰ for method 1 and from 0.60 ‰ to 1.05 ‰ for method 2, in the estimates of Δδ2Hp values (refer to Text S5).
The below-cloud processes of precipitation are complex, variable, and influenced by many factors, especially in arid and semiarid regions. Previously, below-cloud evaporation was the most well-studied post-condensation process, with the aid of the slope of LMWL and d-excess of precipitation. In comparison, other below-cloud processes, such as vapor–liquid equilibration or hydrometeor supersaturation growth, have paid less attention to different rain types. In this study, based on the 2 years of precipitation data collected in Xi'an, we compiled a set of methods to systematically evaluate the below-cloud evaporation effect on the local precipitation isotopic composition and obtained the following main conclusions:
-
In arid areas, the precipitation and water vapor isotopic compositions are closely related, and thus the joint observation of the two tracers could provide more information on precipitation processes. In Xi'an, the below-cloud evaporation effect is stronger in spring and summer and weaker in autumn and winter and is related to the variation in the local RH.
-
Our work evaluates the general applicability of the ΔdΔδ diagram. Although there is a difference in timescale between the Graf et al. (2019) study (intra-event) and ours (per event), the influence of below-cloud processes on our precipitation and water vapor isotopic data can be clearly visualized on the ΔdΔδ diagram. In this study, below-cloud evaporation is the main process during raindrop fall. However, snowfall samples are less influenced by evaporation, and mainly preserve their initial water vapor information. The different Δd/Δδ slopes of rainfall and snowfall might be related to the precipitation types.
-
By comparing the two methods, there are no significant differences in Δδ2Hp for rainfall events, but they show a large difference for snowfall events, and this is related to the supersaturation process not being considered in method 1. The slope of H in method 1 (1.00 ‰ %−1) is slightly steeper than that in method 2 (0.91 ‰ %−1), indicating a stronger evaporation effect on Δδ2H for method 1. Through meteorology and sensitivities analysis, we found that in the two methods, RH is the main controlling factor, and temperature shows different impacts on the variations in Δδ2H. Through uncertainty estimations, method 2 shows a larger uncertainty range (ranging from 0.60 ‰ to 1.05 ‰) than method 1 (ranging from 0.71 ‰ to 0.72 ‰).
-
Considering the assumption that the surface water vapor has a (moist) adiabatic connection to the cloud-base water vapor, the validation of the two methods is for specific weather conditions, such as convective precipitation. Here, method 1 only includes below-cloud evaporation by construction, while in method 2, other processes can still be included, such as supersaturation. Therefore, both methods are suited for studying the below-cloud evaporation effect (no significant differences in Δδ2Hp for rainfall events); however, if other below-cloud processes are included, applying method 2 is the better choice. In future studies, further high-resolution observations of vertical profiles of precipitation and water vapor isotopes, whether tower-based results or aircraft-based results, have the potential to greatly improve constraints on below-cloud processes.
The datasets can be obtained from Table S3 in the Supplement.
The supplement related to this article is available online at: https://doi.org/10.5194/acp-23-9123-2023-supplement.
MX and WL designed the experiments, interpreted the results, and prepared the paper, with contributions from all co-authors. MX and JH analyzed the precipitation and water vapor samples. JH maintained the experimental instruments. ZW helped with scientific interpretation and discussion.
The contact author has declared that none of the authors has any competing interests.
Publisher’s note: Copernicus Publications remains neutral with regard to jurisdictional claims in published maps and institutional affiliations.
The authors would like to thank Xijing Cao for helping to collect precipitation samples.
This work has been supported by the National Natural Science Foundation of China (grant no. 42177903), West Light Foundation of the Chinese Academy of Sciences (grant no. XAB2020YN01), and China Scholarship Council (grant no. 201704910115).
This paper was edited by Eliza Harris and reviewed by two anonymous referees.
Aemisegger, F., Sturm, P., Graf, P., Sodemann, H., Pfahl, S., Knohl, A., and Wernli, H.: Measuring variations of δ18O and δ2H in atmospheric water vapour using two commercial laser-based spectrometers: an instrument characterisation study, Atmos. Meas. Tech., 5, 1491–1511, https://doi.org/10.5194/amt-5-1491-2012, 2012.
Araguás-Araguás, L., Froehlich, K., and Rozanski, K.: Deuterium and oxygen-18 isotope composition of precipitation and atmospheric moisture, Hydrol. Process., 14, 1341–1355, https://doi.org/10.1002/1099-1085(20000615)14:8<1341::AID-HYP983>3.3.CO;2-Q, 2000.
Bastrikov, V., Steen-Larsen, H. C., Masson-Delmotte, V., Gribanov, K., Cattani, O., Jouzel, J., and Zakharov, V.: Continuous measurements of atmospheric water vapour isotopes in western Siberia (Kourovka), Atmos. Meas. Tech., 7, 1763–1776, https://doi.org/10.5194/amt-7-1763-2014, 2014.
Benetti, M., Reverdin, G., Pierre, C., Merlivat, L., Risi, C., Steen-Larsen, H. C., and Vimeux, F.: Deuterium excess in marine water vapor: Dependency on relative humidity and surface wind speed during evaporation, J. Geophys. Res., 119, 584–593, https://doi.org/10.1002/2013JD020535, 2014.
Bowen, G. J., Cai, Z., Fiorella, R. P., and Putman, A. L.: Isotopes in the Water Cycle: Regional- to Global-Scale Patterns and Applications, Annu. Rev. Earth Pl. Sc., 47, 453–479, https://doi.org/10.1146/annurev-earth-053018-060220, 2019.
Cai, Y., Cheng, H., An, Z., Edwards, R. L., Wang, X., Tan, L., and Wang, J.: Large variations of oxygen isotopes in precipitation over south-central Tibet during Marine Isotope Stage 5, Geology, 38, 243–246, https://doi.org/10.1130/G30306.1, 2010.
Chakraborty, S., Sinha, N., Chattopadhyay, R., Sengupta, S., Mohan, P. M., and Datye, A.: Atmospheric controls on the precipitation isotopes over the Andaman Islands, Bay of Bengal, Sci. Rep.-UK, 6, 19555, https://doi.org/10.1038/srep19555, 2016.
Christner, E., Aemisegger, F., Pfahl, S., Werner, M., Cauquoin, A., Schneider, M., Hase, F., Barthlott, S., and Schädler, G.: The Climatological Impacts of Continental Surface Evaporation, Rainout, and Subcloud Processes on δD of Water Vapor and Precipitation in Europe, J. Geophys. Res.-Atmos., 123, 4390–4409, https://doi.org/10.1002/2017JD027260, 2018.
Clark, I. D. and Fritz, P.: Environmental Isotopes in Hydrogeology, CRC Press/Lewis Publishers, Boca Raton, Florida, https://doi.org/10.1029/99EO00169, 1997.
Craig, H.: Isotopic Variations in Meteoric Waters, Science, 133, 1702–1703, 1961.
Dansgaard, W.: Stable isotopes in precipitation, Tellus A, 16, 436–468, https://doi.org/10.3402/tellusa.v16i4.8993, 1964.
Deshpande, R. D., Maurya, A. S., Kumar, B., Sarkar, A., and Gupta, S. K.: Rain-vapor interaction and vapor source identification using stable isotopes from semiarid western India, J. Geophys. Res.-Atmos., 115, 1–11, https://doi.org/10.1029/2010JD014458, 2010.
Deshpande, R. D., Maurya, A. S., Kumar, B., Sarkar, A., and Gupta, S. K.: Kinetic fractionation of water isotopes during liquid condensation under super-saturated condition, Geochim. Cosmochim. Ac., 100, 60–72, https://doi.org/10.1016/j.gca.2012.10.009, 2013.
Fiorella, R. P., Bares, R., Lin, J. C., Ehleringer, J. R., and Bowen, G. J.: Detection and variability of combustion-derived vapor in an urban basin, Atmos. Chem. Phys., 18, 8529–8547, https://doi.org/10.5194/acp-18-8529-2018, 2018.
Fisher, D. A.: Remarks on the deuterium excess in precipitation in cold regions, Tellus B, 43, 401–407, https://doi.org/10.1034/j.1600-0889.1991.t01-4-00006.x, 1991.
Froehlich, K., Kralik, M., Papesch, W., Rank, D., Scheifinger, H., and Stichler, W.: Deuterium excess in precipitation of Alpine regions – moisture recycling, Isot. Environ. Healt. S., 44, 61–70, https://doi.org/10.1080/10256010801887208, 2008.
Gat, J. R.: OXYGEN AND HYDROGEN ISOTOPES IN THE HYDROLOGIC CYCLE, Annu. Rev. Earth Pl. Sc., 24, 225–262, https://doi.org/10.1146/annurev.earth.24.1.225, 1996.
Gorski, G., Strong, C., Good, S. P., Bares, R., Ehleringer, J. R., and Bowen, G. J.: Vapor hydrogen and oxygen isotopes reflect water of combustion in the urban atmosphere, P. Natl. Acad. Sci. USA, 112, 3247–3252, https://doi.org/10.1073/pnas.1424728112, 2015.
Graf, P., Wernli, H., Pfahl, S., and Sodemann, H.: A new interpretative framework for below-cloud effects on stable water isotopes in vapour and rain, Atmos. Chem. Phys., 19, 747–765, https://doi.org/10.5194/acp-19-747-2019, 2019.
Guan, H., Zhang, X., Skrzypek, G., Sun, Z., and Xu, X.: Deuterium excess variations of rainfall events in a coastal area of south Australia and its relationship with synoptic weather systems and atmospheric moisture sources, J. Geophys. Res.-Atmos., 118, 1123–1138, https://doi.org/10.1002/jgrd.50137, 2013.
Jacob, H. and Sonntag, C.: An 8-year record of the seasonal variation of 2H and 18O in atmospheric water vapour and precipitation at Heidelberg, Germany, Tellus B, 43, 291–300, https://doi.org/10.3402/tellusb.v43i3.15276, 1991.
Jeelani, G., Deshpande, R. D., Galkowski, M., and Rozanski, K.: Isotopic composition of daily precipitation along the southern foothills of the Himalayas: impact of marine and continental sources of atmospheric moisture, Atmos. Chem. Phys., 18, 8789–8805, https://doi.org/10.5194/acp-18-8789-2018, 2018.
Jouzel, J. and Merlivat, L.: Deuterium and oxygen 18 in precipitation: Modeling of the isotopic effects during snow formation, J. Geophys. Res., 89, 11749, https://doi.org/10.1029/jd089id07p11749, 1984.
Jouzel, J., Delaygue, G., Landais, A., Masson-Delmotte, V., Risi, C., and Vimeux, F.: Water isotopes as tools to document oceanic sources of precipitation, Water Resour. Res., 49, 7469–7486, https://doi.org/10.1002/2013WR013508, 2013.
Li, L. and Garzione, C. N.: Spatial distribution and controlling factors of stable isotopes in meteoric waters on the Tibetan Plateau: Implications for paleoelevation reconstruction, Earth Planet. Sc. Lett., 460, 302–314, https://doi.org/10.1016/j.epsl.2016.11.046, 2017.
Li, Z., Qi, F., Wang, Q. J., Kong, Y., Cheng, A., Song, Y., Li, Y., Li, J., and Guo, X.: Contributions of local terrestrial evaporation and transpiration to precipitation using δ18O and D-excess as a proxy in Shiyang inland river basin in China, Global Planet. Change, 146, 140–151, 2016.
Liu, W., Feng, X., Liu, Y., Zhang, Q., and An, Z.: δ18O values of tree rings as a proxy of monsoon precipitation in arid Northwest China, Chem. Geol., 206, 73–80, https://doi.org/10.1016/j.chemgeo.2004.01.010, 2004.
Liu, W., Liu, H., Wang, Z., An, Z., and Cao, Y.: Hydrogen isotopic compositions of long-chain leaf wax n-alkanes in Lake Qinghai sediments record palaeohydrological variations during the past 12 ka, Quaternary Int., 449, 67–74, https://doi.org/10.1016/j.quaint.2017.05.024, 2017.
Liu, W., Wang, H., Leng, Q., Liu, H., Zhang, H., and Xing, M.: Hydrogen isotopic compositions along a precipitation gradient of Chinese Loess Plateau: Critical roles of precipitation/evaporation and vegetation change as controls for leaf wax δD, Chem. Geol., 528, 119278, https://doi.org/10.1016/j.chemgeo.2019.119278, 2019.
Liu, Y., Liu, H., Song, H., Li, Q., Burr, G. S., Wang, L., and Hu, S.: A monsoon-related 174-year relative humidity record from tree-ring δ18O in the Yaoshan region, eastern central China, Sci. Total Environ., 593–594, 523–534, https://doi.org/10.1016/j.scitotenv.2017.03.198, 2017.
Merlivat, L. and Jouzel, J.: Global climatic interpretation of the deuterium-oxygen 18 relationship for precipitation, J. Geophys. Res.-Oceans, 84, 5029–5033, https://doi.org/10.1029/JC084iC08p05029, 1979.
Peng, T. R., Liu, K. K., Wang, C. H., and Chuang, K. H.: A water isotope approach to assessing moisture recycling in the island-based precipitation of Taiwan: A case study in the western Pacific, Water Resour. Res., 47, 1–11, https://doi.org/10.1029/2010WR009890, 2011.
Putman, A. L., Fiorella, R. P., Bowen, G. J., and Cai, Z.: A Global Perspective on Local Meteoric Water Lines: Meta-analytic Insight into Fundamental Controls and Practical Constraints, Water Resour. Res., 55, 6896–6910, https://doi.org/10.1029/2019WR025181, 2019.
Rangarajan, R., Laskar, A. H., Bhattacharya, S. K., Shen, C. C., and Liang, M. C.: An insight into the western Pacific wintertime moisture sources using dual water vapor isotopes, J. Hydrol., 547, 111–123, https://doi.org/10.1016/j.jhydrol.2017.01.047, 2017.
Salamalikis, V., Argiriou, A. A., and Dotsika, E.: Isotopic modeling of the sub-cloud evaporation effect in precipitation, Sci. Total Environ., 544, 1059–1072, https://doi.org/10.1016/j.scitotenv.2015.11.072, 2016.
Salmon, O. E., Welp, L. R., Baldwin, M. E., Hajny, K. D., Stirm, B. H., and Shepson, P. B.: Vertical profile observations of water vapor deuterium excess in the lower troposphere, Atmos. Chem. Phys., 19, 11525–11543, https://doi.org/10.5194/acp-19-11525-2019, 2019.
Steen-Larsen, H. C., Johnsen, S. J., Masson-Delmotte, V., Stenni, B., Risi, C., Sodemann, H., Balslev-Clausen, D., Blunier, T., Dahl-Jensen, D., Ellehøj, M. D., Falourd, S., Grindsted, A., Gkinis, V., Jouzel, J., Popp, T., Sheldon, S., Simonsen, S. B., Sjolte, J., Steffensen, J. P., Sperlich, P., Sveinbjörnsdóttir, A. E., Vinther, B. M., and White, J. W. C.: Continuous monitoring of summer surface water vapor isotopic composition above the Greenland Ice Sheet, Atmos. Chem. Phys., 13, 4815–4828, https://doi.org/10.5194/acp-13-4815-2013, 2013.
Stewart, M. K.: Stable isotope fractionation due to evaporation and isotopic exchange of falling waterdrops: Applications to atmospheric processes and evaporation of lakes, J. Geophys. Res., 80, 1133–1146, https://doi.org/10.1029/JC080i009p01133, 1975.
Sun, C., Chen, W., Chen, Y., and Cai, Z.: Stable isotopes of atmospheric precipitation and its environmental drivers in the Eastern Chinese Loess Plateau, China, J. Hydrol., 581, 124404, https://doi.org/10.1016/j.jhydrol.2019.124404, 2020.
Tan, L., An, Z., Huh, C.-A., Cai, Y., Shen, C.-C., Shiau, L.-J., Yan, L., Cheng, H., and Edwards, R. L.: Cyclic precipitation variation on the western Loess Plateau of China during the past four centuries, Sci. Rep.-UK, 4, 6381, https://doi.org/10.1038/srep06381, 2014.
Thompson, L. G., Yao, T., Mosley-Thompson, E., Davis, M. E., Henderson, K. A., and Lin, P.-N.: A High-Resolution Millennial Record of the South Asian Monsoon from Himalayan Ice Cores, Science, 289, 1916–1919, https://doi.org/10.1126/science.289.5486.1916, 2000.
Tian, C., Wang, L., Kaseke, K. F., and Bird, B. W.: Stable isotope compositions (δ2H, δ18O and δ17O) of rainfall and snowfall in the central United States, Sci. Rep.-UK, 8, 6712, https://doi.org/10.1038/s41598-018-25102-7, 2018.
Wan, H., Liu, W., and Xing, M.: Isotopic composition of atmospheric precipitation and its tracing significance in the Laohequ Basin, Loess plateau, China, Sci. Total Environ., 640–641, 989–996, https://doi.org/10.1016/j.scitotenv.2018.05.338, 2018.
Wang, S., Zhang, M., Che, Y., Chen, F., and Fang, Q.: Contribution of recycled moisture to precipitation in oases of arid central Asia: A stable isotope approach, Water Resour. Res., 52, 3246–3257, https://doi.org/10.1002/2015WR018135, 2016a.
Wang, S., Zhang, M., Che, Y., Zhu, X., and Liu, X.: Influence of Below-Cloud Evaporation on Deuterium Excess in Precipitation of Arid Central Asia and Its Meteorological Controls, J. Hydrometeorol., 17, 1973–1984, https://doi.org/10.1175/JHM-D-15-0203.1, 2016b.
Wang, S., Zhang, M., Hughes, C. E., Crawford, J., Wang, G., Chen, F., Du, M., Qiu, X., and Zhou, S.: Meteoric water lines in arid Central Asia using event-based and monthly data, J. Hydrol., 562, 435–445, https://doi.org/10.1016/j.jhydrol.2018.05.034, 2018.
Wang, Z., An, Z., Liu, Z., Qiang, X., Zhang, F., and Liu, W.: Hydroclimatic variability in loess δDwax records from the central Chinese Loess Plateau over the past 250 ka, J. Asian Earth Sci., 155, 49–57, https://doi.org/10.1016/j.jseaes.2017.11.008, 2018.
Welp, L. R., Lee, X., Kim, K., Griffis, T. J., Billmark, K. A., and Baker, J. M.: δ18O of water vapour, evapotranspiration and the sites of leaf water evaporation in a soybean canopy, Plant Cell Environ., 31, 1214–1228, https://doi.org/10.1111/j.1365-3040.2008.01826.x, 2008.
Wen, X. F., Zhang, S. C., Sun, X. M., Yu, G. R., and Lee, X.: Water vapor and precipitation isotope ratios in Beijing, China, J. Geophys. Res.-Atmos., 115, 1–10, https://doi.org/10.1029/2009JD012408, 2010.
Weng, Y., Touzeau, A., and Sodemann, H.: Correcting the impact of the isotope composition on the mixing ratio dependency of water vapour isotope measurements with cavity ring-down spectrometers, Atmos. Meas. Tech., 13, 3167–3190, https://doi.org/10.5194/amt-13-3167-2020, 2020.
Wu, H., Fu, C., Zhang, C., Zhang, J., Wei, Z., and Zhang, X.: Temporal Variations of Stable Isotopes in Precipitation from Yungui Plateau: Insights from Moisture Source and Rainout Effect, J. Hydrometeorol., 23, 39–51, https://doi.org/10.1175/JHM-D-21-0098.1, 2022.
Wu, J., Li, P., and Qian, H.: Variation characteristics of meteorological elements and prediction model of available precipitation in Xi'an city, South-to-North Water Transfers and Water Science Technology, 11, 50–54, 2013.
Xing, M., Liu, W., Li, X., Zhou, W., Wang, Q., Tian, J., Li, X., Tie, X., Li, G., Cao, J., Bao, H., and An, Z.: Vapor isotopic evidence for the worsening of winter air quality by anthropogenic combustion-derived water, P. Natl. Acad. Sci. USA, 117, 33005–33010, https://doi.org/10.1073/pnas.1922840117, 2020.
Yao, T., Thompson, L. G., Mosley-Thompson, E., Zhihong, Y., Xingping, Z., and Lin, P.-N.: Climatological significance of δ18O in north Tibetan ice cores, J. Geophys. Res.-Atmos., 101, 29531–29537, https://doi.org/10.1029/96JD02683, 1996.
Yao, T., Masson-Delmotte, V., Gao, J., Yu, W., Yang, X., Risi, C., Sturm, C., Werner, M., Zhao, H., He, Y., Ren, W., Tian, L., Shi, C., and Hou, S.: A review of climatic controls on δ18O in precipitation over the Tibetan Plateau: Observations and simulations, Rev. Geophys., 51, 525–548, https://doi.org/10.1002/rog.20023, 2013.
Zhao, L., Liu, X., Wang, N., Kong, Y., Song, Y., He, Z., Liu, Q., and Wang, L.: Contribution of recycled moisture to local precipitation in the inland Heihe River Basin, Agr. Forest Meteorol., 271, 316–335, https://doi.org/10.1016/j.agrformet.2019.03.014, 2019.
Zhu, G. F., Li, J. F., Shi, P. J., He, Y. Q., Cai, A., Tong, H. L., Liu, Y. F., and Yang, L.: Relationship between sub-cloud secondary evaporation and stable isotope in precipitation in different regions of China, Environ. Earth Sci., 75, 876–894, https://doi.org/10.1007/s12665-016-5590-9, 2016.