the Creative Commons Attribution 4.0 License.
the Creative Commons Attribution 4.0 License.
 | 04 Aug 2023
Insights of warm-cloud biases in Community Atmospheric Model 5 and 6 from the single-column modeling framework and Aerosol and Cloud Experiments in the Eastern North Atlantic (ACE-ENA) observations
Xiaojian Zheng
Xiquan Dong
Yuk L. Yung
There has been a growing concern that most climate models predict precipitation that is too frequent, likely due to lack of reliable subgrid variability and vertical variations in microphysical processes in low-level warm clouds. In this study, the warm-cloud physics parameterizations in the singe-column configurations of NCAR Community Atmospheric Model version 6 and 5 (SCAM6 and SCAM5, respectively) are evaluated using ground-based and airborne observations from the Department of Energy (DOE) Atmospheric Radiation Measurement (ARM) Aerosol and Cloud Experiments in the Eastern North Atlantic (ACE-ENA) field campaign near the Azores islands during 2017–2018. The 8-month single-column model (SCM) simulations show that both SCAM6 and SCAM5 can generally reproduce marine boundary layer cloud structure, major macrophysical properties, and their transition. The improvement in warm-cloud properties from the Community Atmospheric Model 5 and 6 (CAM5 to CAM6) physics can be found through comparison with the observations. Meanwhile, both physical schemes underestimate cloud liquid water content, cloud droplet size, and rain liquid water content but overestimate surface rainfall. Modeled cloud condensation nuclei (CCN) concentrations are comparable with aircraft-observed ones in the summer but are overestimated by a factor of 2 in winter, largely due to the biases in the long-range transport of anthropogenic aerosols like sulfate. We also test the newly recalibrated autoconversion and accretion parameterizations that account for vertical variations in droplet size. Compared to the observations, more significant improvement is found in SCAM5 than in SCAM6. This result is likely explained by the introduction of subgrid variations in cloud properties in CAM6 cloud microphysics, which further suppresses the scheme's sensitivity to individual warm-rain microphysical parameters. The predicted cloud susceptibilities to CCN perturbations in CAM6 are within a reasonable range, indicating significant progress since CAM5 which produces an aerosol indirect effect that is too strong. The present study emphasizes the importance of understanding biases in cloud physics parameterizations by combining SCM with in situ observations.
- Article
(5223 KB) - Full-text XML
-
Supplement
(5168 KB) - BibTeX
- EndNote


Marine boundary layer (MBL) clouds are crucial for the global radiation budget, as they efficiently regulate the solar radiation reaching the ocean surface (Dong et al., 2022) and largely determine the climate sensitivity (Sherwood et al., 2020). However, numerical simulations of MBL clouds in global climate models (GCMs) remain challenging, mainly due to the mismatch of the spatial scales of MBL clouds (tens of meters) and GCM grids (∼100 km). Therefore, empirical parameterizations of subscale cloud properties and variabilities, for both microphysics and macrophysics, play a critical role in predicting MBL clouds and precipitation in GCMs (Wang et al., 2013). Consequently, how to constrain and improve those cloud parameterizations using the state-of-the-art observations become an important issue. One challenging aspect of the GCM cloud evaluation lies in the tight coupling between cloud physics and dynamics, as cloud microphysics can feed back to dynamics and thermodynamics through heating profile alteration or radiation flux interference (Wang et al., 2014, 2020).
To better probe the uncertainty source in the cloud physical parameterizations, a simplified GCM configuration has been developed to separate cloud physics from large-scale dynamical and thermodynamical conditions. The so-called single-column model (SCM) is ideal for utilizing in situ observations from the field campaigns that are normally conducted intensively over the targeted area (Zhao et al., 2021). The modeling framework adopted in this study, NCAR Community Earth System Model (CESM), has a long history of providing such a modeling tool along with the development of its comprehensive models (Liu et al., 2007; Gettelman et al., 2019). With more added features and enhanced representations of cloud and aerosol in the cloud physical parametrizations in CESM versions 1 and 2, it is valuable to evaluate the single-column versions of them using the recent field measurements.
The eastern North Atlantic (ENA) is an ideal place around the world to study MBL clouds, considering the prevailing MBL cloud occurrence, diverse mesoscale meteorological conditions (Jensen et al., 2021; Zheng et al., 2022a), and distinctive aerosol sources (J. Wang et al., 2021). A recent field campaign, the Aerosol and Cloud Experiments in the Eastern North Atlantic (ACE-ENA), provides ample ground-based and in situ aircraft observations of cloud micro- and macrophysics, aerosol properties, and atmospheric states over a whole summer and winter (J. Wang et al., 2021; Wu et al., 2020). Recent Weather Research and Forecasting (WRF) large-eddy simulations (LESs) driven by the ERA5 reanalysis over the ENA reproduce well the general vertical variations in meteorological factors and cloud cellular structure (Wang et al., 2020). Meanwhile, LESs and observations exhibit substantial discrepancies in the evolution of MBL clouds in two selected stratocumulus cases during the ACE-ENA field campaign, likely due to the biases in both warm-cloud physical parameterizations and meteorological conditions as external forcing. Those issues motivate us to look for stronger observational constraints in the single-column framework which minimize the propagated errors from large-scale forcing. In this study, we use the Atmospheric Radiation Measurement (ARM) 3-hourly large-scale forcing of atmospheric states specifically developed for the ACE-ENA intensive observation periods (IOPs) to drive a SCM.
The uncertainties of warm-cloud physics in the atmospheric component of CESM1 and 2 have been reported in many previous studies (e.g., Kay et al., 2016; Zhao et al., 2022), but most of them focused on addressing the issues on the global scale. Leveraging the continuous radar retrievals of MBL cloud and drizzle microphysical properties during ACE-ENA, Dong et al. (2021) modified the parameterizations of two key processes in warm-cloud microphysics in Community Atmospheric Model 5 (CAM5), i.e., autoconversion from cloud droplets to rain drops and accretion of cloud droplets by raindrops. They showed that by applying this set of new parameterizations to CAM5 in global climate simulations, precipitation frequency is generally reduced but with enhanced intensity mainly in the mid-latitude regions, alleviating the long-lasting issue in the climate models, e.g., precipitation that is too frequent and too light. Even the cloud radiative effect and top-of-atmosphere radiative flux simulations can be improved consequently. Meanwhile, a remaining question lies in whether such a new scheme works well over the location where the radar observational constraints come from originally. The single-column modeling framework enables us to examine the effect of the modified microphysical scheme on the local scale.
2.1 Single-column version of Community Atmospheric Model
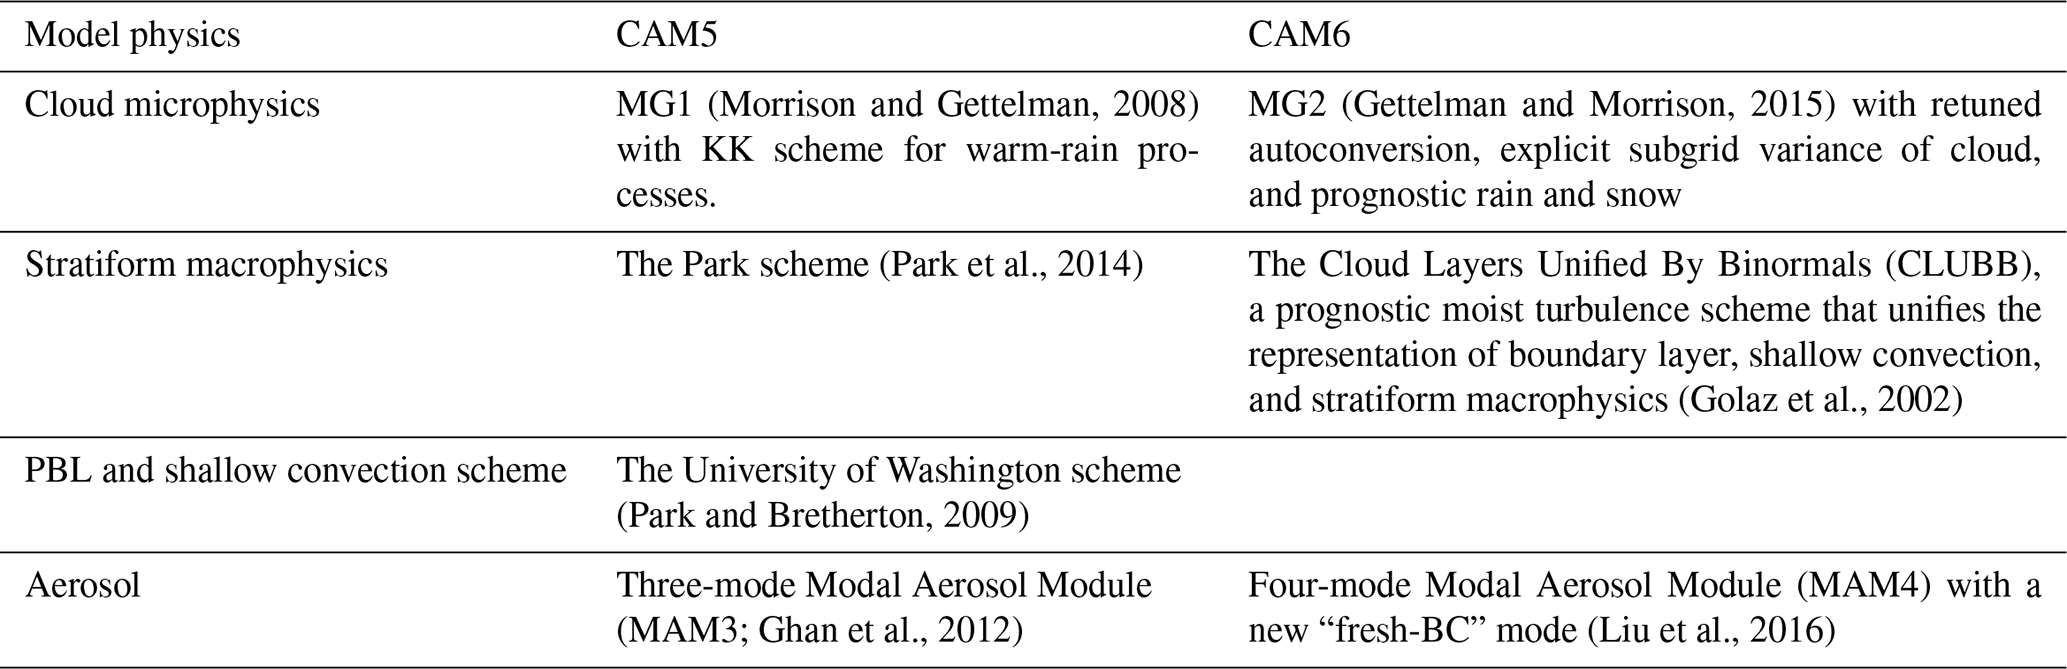
In this study, we use the single-column configuration of Community Atmospheric Model version 6 (referred to as SCAM6 hereafter) in the Community Earth System Model (CESM 2.1.1). NCAR CESM is a community GCM that has been widely used to study climate change (e.g., Yeager et al., 2018), precipitation extremes (e.g., Wang et al., 2016), cloud processes (e.g., Kay et al., 2012), and aerosol–cloud–radiation–circulation feedbacks in the Earth system (e.g., Wang et al., 2015). The atmosphere component of CESM2 (CAM6) has been modified substantially with a range of enhancements and improvements for the representation of physical processes since its last version, CAM5. In particular, the modifications of the aerosol and cloud parameterizations are extensive. For example, a multivariate PDF-based third-order turbulence closure parameterization scheme, Cloud Layers Unified by Binormals (CLUBB), is implemented to unify the representation of boundary layer, shallow convection, and stratiform macrophysics in the model (Bogenschutz et al., 2013; Golaz et al., 2002). The two-moment cloud microphysical scheme is updated to version 2 (MG2; Gettelman and Morrison, 2015) with warm-rain parameterization remaining as the Khairoutdinov and Kogan (2000) scheme (hereafter called KK). Major updates on cloud microphysics include prognostic precipitation (rain and snow), the sub-stepping technique, and the retuned autoconversion scheme which is critical for aerosol indirect effect on cloud lifetime and precipitation (Malavelle et al., 2017). The strong coupling between CLUBB and MG2 also enables interactions between subgrid shallow cloud, aerosol, and environment. Deep convection remains parameterized by the Zhang-McFarlane (1995) scheme and has been retuned to increase the sensitivity to convective inhibition. Parameterizations of homogeneous ice nucleation and heterogeneous immersion nucleation in cirrus clouds (Liu and Penner, 2005) explicitly consider the effects of sulfate and dust aerosol serving as ice nuclei on the cold clouds.
The Modal Aerosol Module (MAM) in CESM is updated from a three-mode to four-mode approach (MAM4) to better consider the aging processes of black carbon in the atmosphere (Liu et al., 2016; Wang et al., 2018). Six types of aerosols with different hygroscopicity and optical properties are considered in MAM3, including sulfate, black carbon (BC), primary organic matter (POM), secondary organic aerosol (SOA), dust, and sea salt. The aerosol module accounts for most of the important processes associated with atmospheric aerosols, including emission, nucleation, coagulation, condensational growth, gas and aqueous-phase chemistry, dry deposition, in-cloud and below-cloud scavenging, re-production from evaporated cloud droplets, and suppression, as well as agricultural, deforestation, and peat fires (Li and Lawrence, 2017). To test the impacts of cloud physical parameterization on the model fidelity, we also conduct the single-column simulations using the CAM5 physics (SCAM5) under the same large-scale forcing data. The physical parameterizations relevant to warm-cloud processes in CAM5 and CAM6 are summarized in Table 1.
Table 1Comparison of physical parameterizations relevant to warm-cloud processes between CAM5 and CAM6.
Because the ACE-ENA is a relatively new field campaign and does not have a pre-defined case in SCAM6, we create a new case in CAM6 based on a new set of large-scale data for this IOP. The large-scale forcing over the ARM ENA site is developed from the constrained variational analysis (VARANAL; Xie et al., 2004; Tang et al., 2019). It includes air temperature (T) and moisture (q), their horizontal and vertical advection, surface sensible and latent heat fluxes, U and V winds, large-scale vertical motion/velocity, and the top-of-atmosphere (TOA) and surface radiation fluxes. VARANAL is based on ERA5 reanalysis (Hersbach et al., 2020) with the additional input of observations from the ARM ENA site incorporated into the variational analysis to represent the atmospheric states over a Global Climate Model (GCM) grid box. The original VARANAL data are produced specifically for the ACE-ENA IOP, with a temporal resolution of 3 h and 45 vertical levels.
To minimize the biases in aerosol advection and dynamical forcing, aerosol and the temperature fields are nudged to their initial conditions on different timescales, varying from 10 d at the bottom of the model to 2 d at the top of the model (Gettelman et al., 2019). Also, to simulate the right seasonal variations in aerosol and temperature initial conditions, each of our model integrations only lasts 1 month, and a new sequential run will follow with updated initial conditions. By doing so the seasonality of aerosols will follow that of climatology on the monthly basis. The CAM6 model has 32 vertical levels from the surface to 2 hPa (about 45 km), while CAM5 has 30 levels. The two models both use a time step of about 30 min, while CAM6 uses sub-stepping for microphysical processes.
2.2 Numerical experiment design
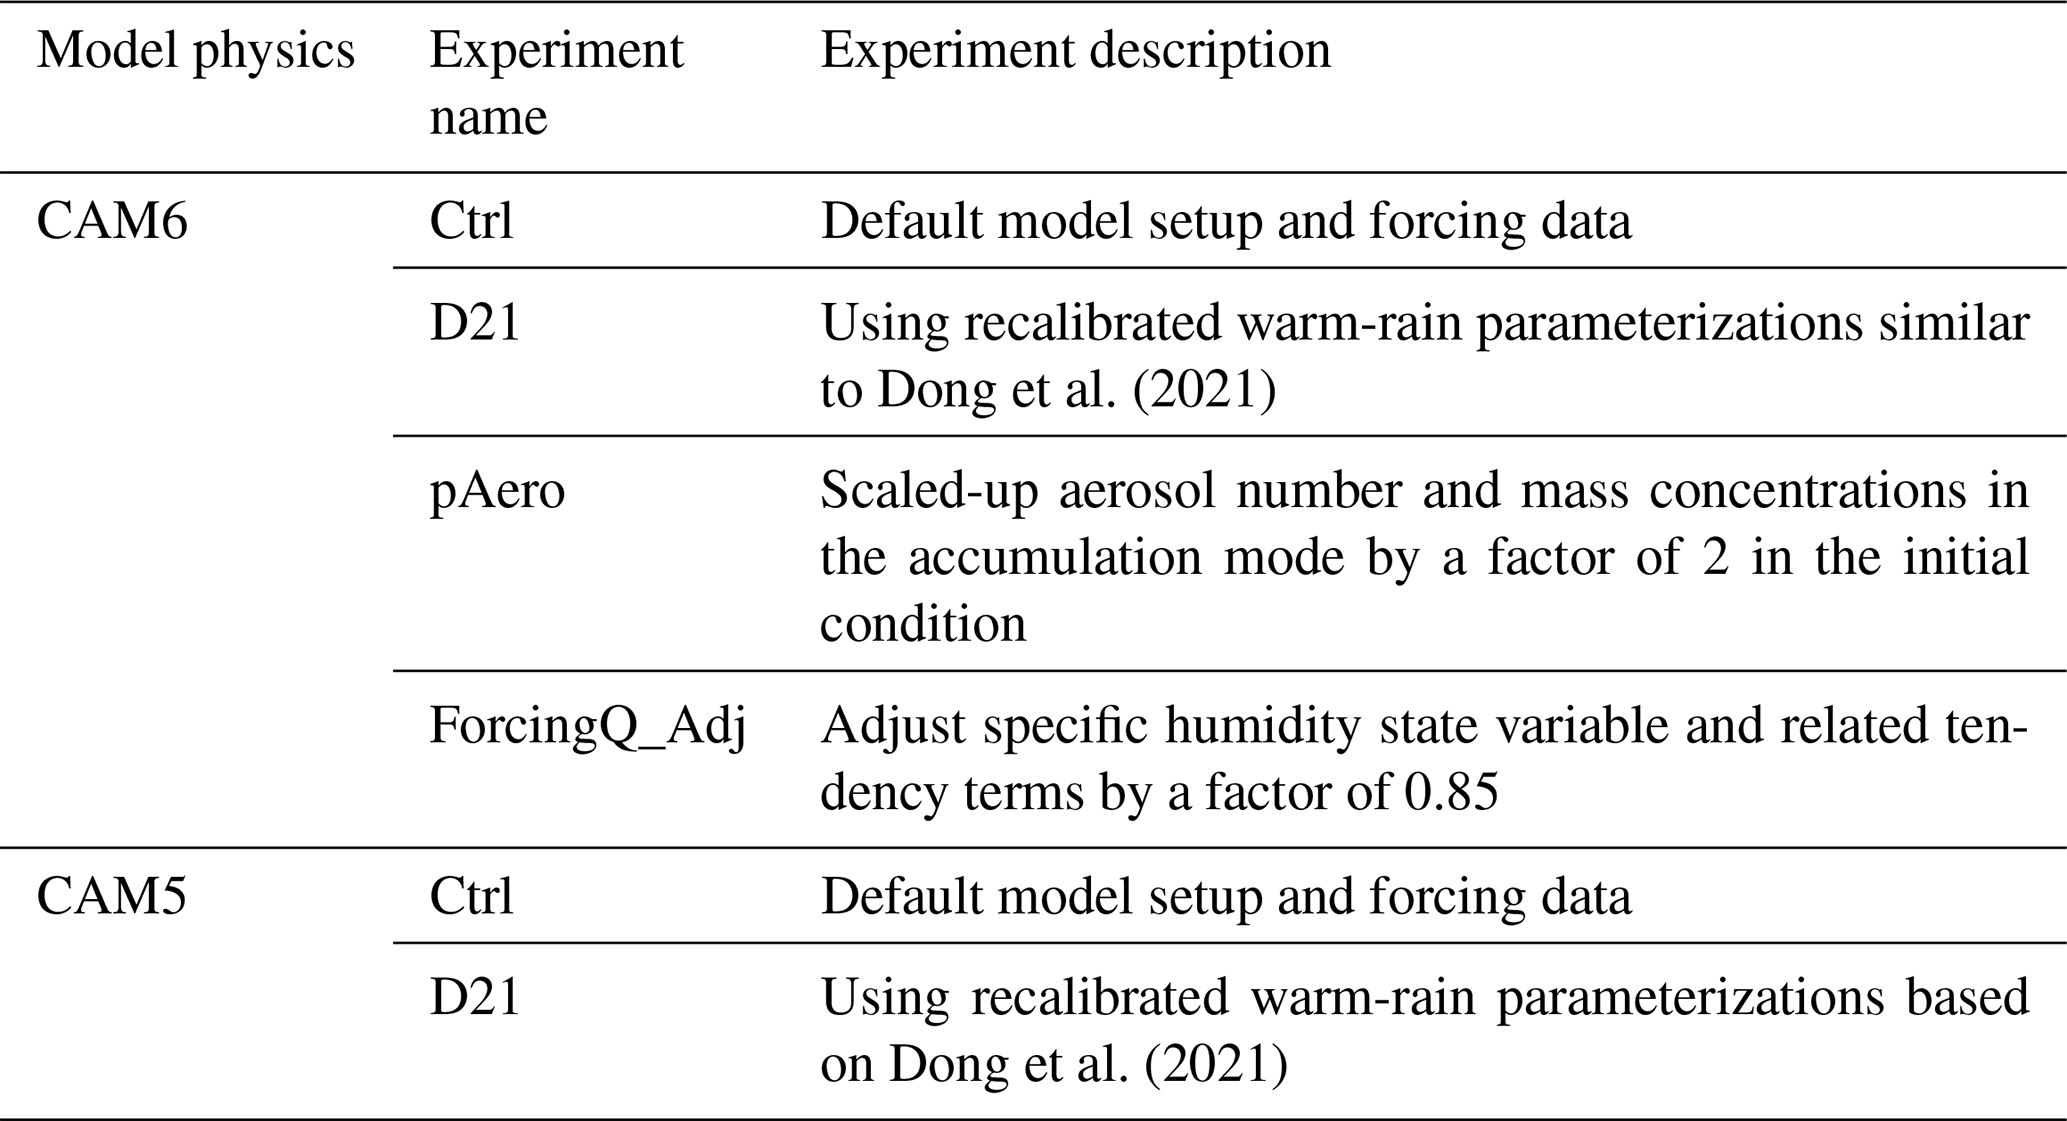
To cover the full IOP in our simulations, we run SCAM5 and SCAM6 over 8 months from 1 June 2017 to 1 February 2018 as control experiments (Ctrl). To explore the possible sources of biases in simulated drizzle and liquid water content (LWC), we employ a retuned KK scheme (Dong et al., 2021, hereafter as D21-KK) that explicitly links the autoconversion and accretion rates with mass mean cloud droplet radius (rm,c). The original KK scheme is expressed as below:
and
where A= 1350, a1= 2.47, and in CAM5. In D21-KK, both autoconversion and accretion rates are further aware of the vertical variations in rc, so the constant A and B are replaced as a function of rc:
and
where A′ and B′ are further parameterized in CAM5 as follows:
and
CAM6 microphysics aims to reduce the autoconversion dependency on the Nc, so a2 and A are set as −1.1 and 13.5, respectively, with a2 unchanged. We did the same recalibration for CAM6 autoconversion processes, and the corresponding A′ is parameterized as follows:
Hence, the updated autoconversion for CAM6 microphysics has the form as below:
where fe represents an enhancement factor which is diagnosed from the CLUBB to account for subgrid variabilities in cloud and rain.
In another set of sensitivity experiments, to explore the aerosol indirect effect on cloud and warm precipitation, we scale up aerosol number and mass concentrations in the accumulation mode by a factor of 2 in the initial condition. Such an experiment is named “pAero”. Moreover, to examine the sensitivity of cloud simulations to the large forcing data, we perturb the specific humidity state variable and related tendency terms with the experiment name “ForcingQ_Adj”. All the above experiment are summarized in Table 2.
2.3 ACE-ENA observations
Aircraft in situ observations during the ACE-ENA campaign provide the best available characterizations of cloud and aerosol vertical distributions, with the differentiation of aerosol types and hygroscopicity. During the two IOPs, 39 flights were deployed to collect data for 39 d, 20 in the summer IOP and 19 in the winter IOP. Meanwhile, ground-based observations were conducted simultaneously and consecutively. Based on the Ka-band ARM Zenith Radar (KAZR) measurements, cloud and rain microphysical properties (cloud droplet effective radius, rc; cloud droplet number concentration, Nc; cloud liquid water content, CLWC; rain droplet mass median radius, rm,r; rain droplet number concentration, Nr; and rain liquid water content, RLWC) over the ARM ENA site can be retrieved (Wu et al., 2020). The cloud and drizzle microphysical retrievals were validated by the aircraft in situ measurements from the ACE-ENA field campaign, with the estimated median uncertainties of ∼15 % for rc, ∼ 30 % for rm,r, ∼ 30 % for Nc and CLWC, and ∼ 50 % for Nr and RLWC. Note that the subscript “c” denotes cloud and subscript “r” denotes rain. The model counterparts are extracted and compared with the retrieval, except the rm,r which is not an output from the model. Following the method in Wu et al. (2020) and their Eq. (2a), the rm,r can be calculated by
where ρw is water density, and NW is the normalized drizzle number concentration (). Furthermore, the CLWC (RLWC) is scaled by the cloud (rain) fraction within the grid box to match the retrievals.
For the aircraft in situ measurements of aerosol, the passive cavity aerosol spectrometer (PCASP) measured the aerosols with the size range from 0.1 to 3.2 µm (Goldberger, 2020); hence, the accumulation-mode aerosol number concentration (NAcc) can be derived from the PCASP 0.1 to 1.0 µm measurement. The cloud condensation nuclei (CCN) number concentration (NCCN) is obtained by the CCN-200 particle counter on board a G-1 aircraft. The NCCN is a measurement under the controlled supersaturation of 0.35 % with a humidified particle size range from 0.75 to 10 µm (Uin and Mei, 2019). The PM1 (particulate matter with aerodynamic size smaller than 1 µm) chemical component mass concentrations are measured by the Aerodyne high-resolution time-of-flight aerosol mass spectrometer (HR-ToF-AMS). The accuracy of each individual instrument can be found in the instrument handbooks available on the ARM website.
We select only those research flights that followed a horizontal track within one grid size of the CAM models (1.25∘ longitude and 0.9∘ latitude), centered on the ARM ENA site. Also, to meet the criteria for comparison with SCAM, each aircraft case must include comprehensive vertical sampling of cloud and aerosol within the specified time period. To ensure the apple-to-apple comparison between model and observations, the cloud and rain samples are selected following the same criteria: (1) 4 µm < rc < 25 µm, (2) CLWC > 0.01 gm−3, (3) Nc > 1 cm−3, and (4) RLWC > 1 × 10⁻⁴ gm−3. The geopotential height from the model output is extracted for each time step; hence, the quantities at pressure level can be converted to height level and compared with the observation results. Both model and observation results are limited to below 3 km.
3.1 Meteorological conditions
To understand the cloud and drizzle property differences between simulations and observations, we first evaluate the SCAM6 simulated meteorological conditions by the ARM Interpolated Sonde (INTERPSONDE) value-added product (VAP), which is an independent dataset from the large-scale forcing data used to drive SCM. As shown in Fig. 1a, the simulated air temperature (Tair) values are generally comparable to the observed ones with clear seasonal variations. The statistics from the 8-month simulations show that the differences in both mean and median Tair agree within 1 % to the observed ones (Fig. 1c). However, the probability distribution functions (PDFs) reveal some canceling effect behind the good agreement on the means: the simulated values over the temperature “extremes” (lower and higher bins) are larger than the observed ones, but in the middle bins, the observed values surpass the simulated ones (for the bins between 280 and 290 K). Essentially, the modeled Tair PDF is wider than the observed one. The discrepancy of the moisture field is more evident. Even though the model captures the evolution of relative humidity (RH) throughout 8 months, both mean and median RH values have ∼ 10 % bias in the model. In particular, the biases become severe when RH values fall into the high-humidity regime. The RH frequency within the 90 %–100 % range is about 2 times higher in SCAM6 than the observations. A comparison of specific humidity (SH) shows that SCAM6 overpredicts SH by 11.8 %, indicating that the RH bias stems mainly from the absolute moisture bias. The similar statistics for the grids with RH larger than 90 % shows the discrepancy in SH is still larger than that of Tair (Supplement Fig. S1), indicating the larger contribution of SH to RH biases than Tair. It can be explained by the fact that the temperature field is relaxed to the input as an additional constraint, while SH is predicted to be a fully prognostic variable in SCM. We will examine the potential impact of moisture uncertainty in the large-scale forcing data on the cloud property simulation through sensitivity, and the results will be discussed below.
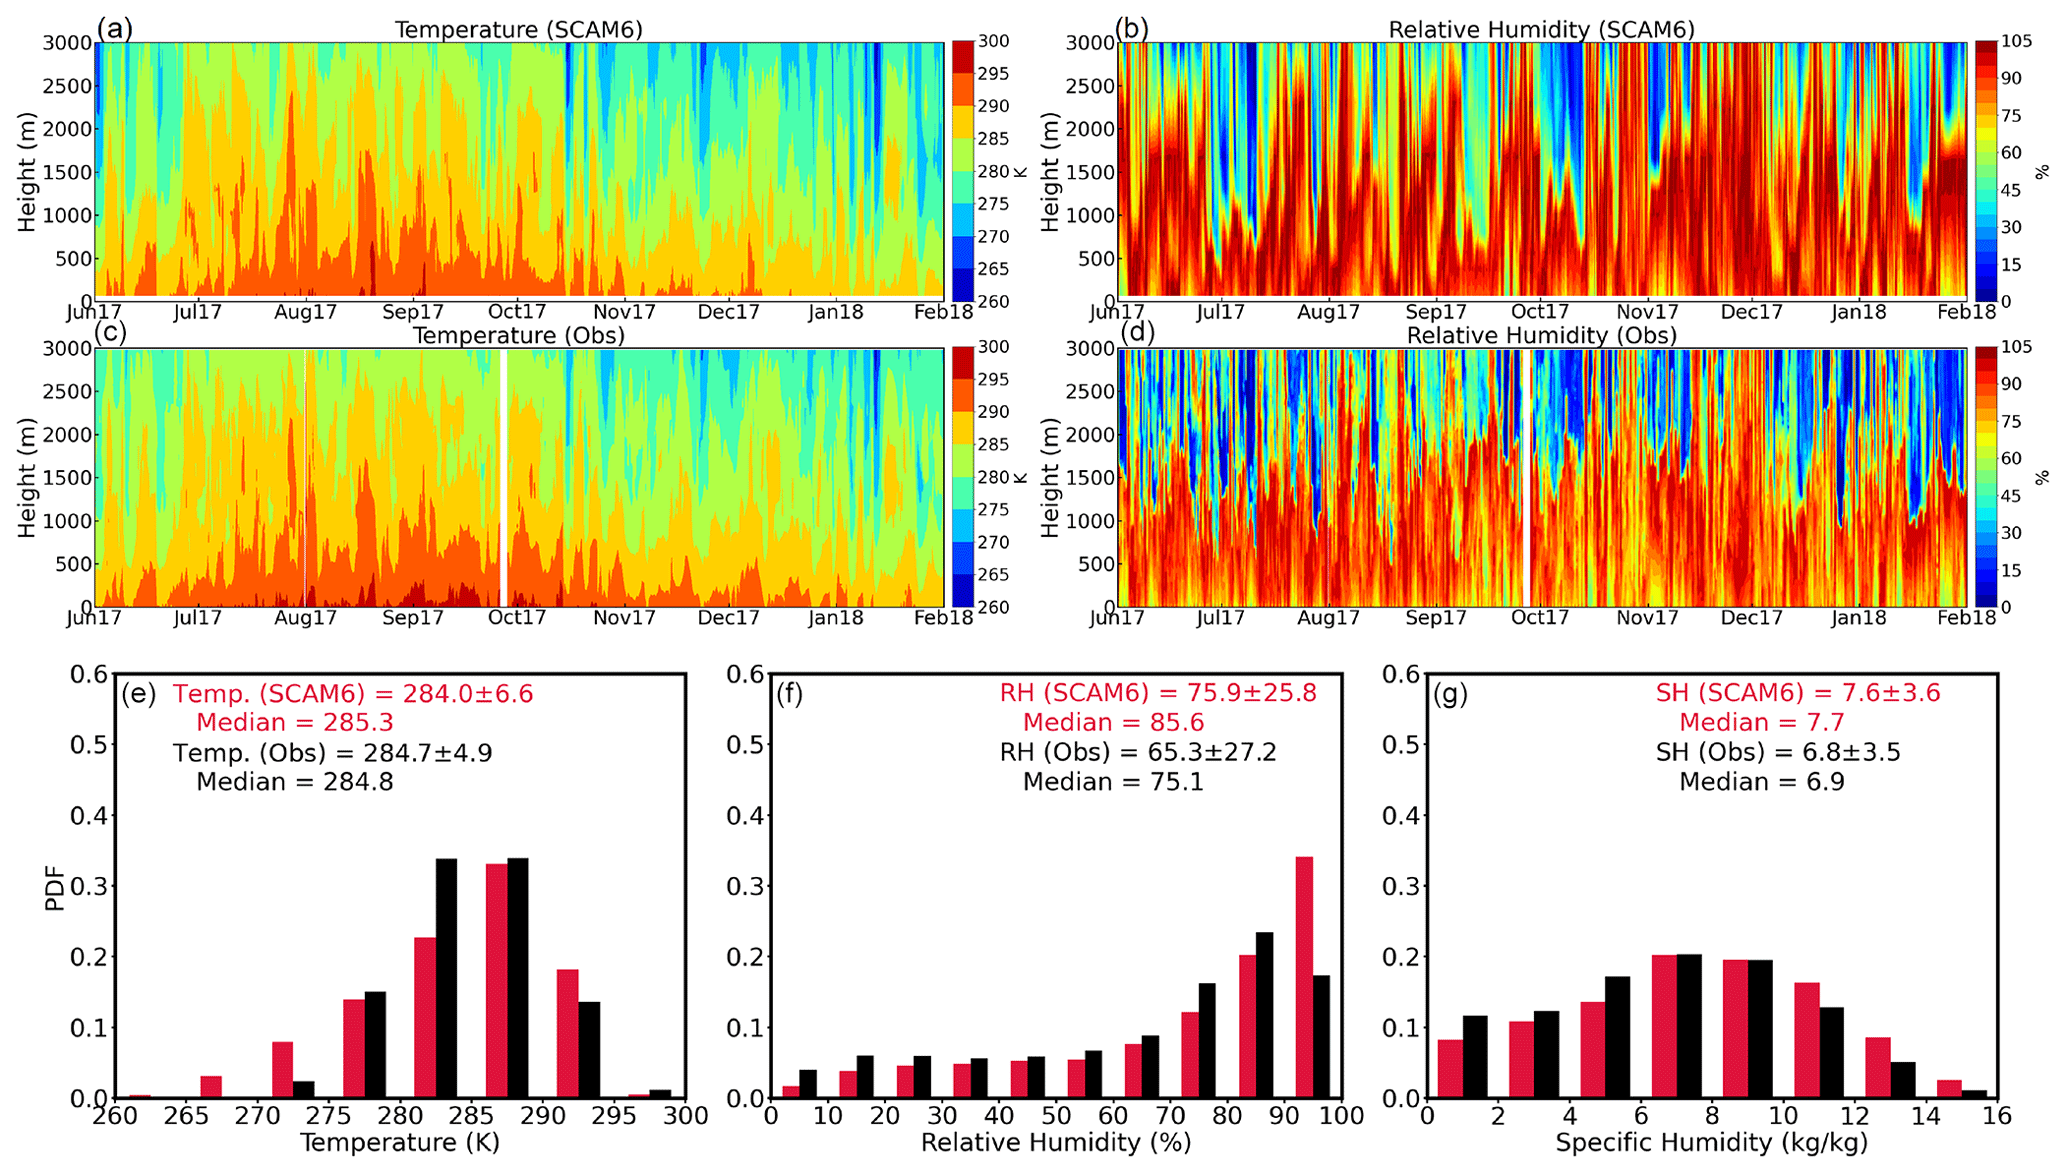
Figure 1Comparisons of meteorological conditions between SCAM6 simulations and ARM Interpolated Sonde (INTERPSONDE) soundings. Time series of air temperature (a, c) and relative humidity (b, d) from SCAM6 (a, b) and ARM ENA observations (c, d). (e, f, g) SCAM6 (red) simulated air temperature, relative humidity (RH), and specific humidity (SH) within 3 km in comparison with the ARM ENA observations (black).
3.2 Cloud properties
We first compare CLWC and RLWC over time and altitude dimensions between SCAM6 simulations and ARM radar–lidar–MWR (microwave radiometer) retrievals (Fig. 2a–d). The simulated CLWC values in both time and altitude are generally consistent with the ARM retrievals. More specifically, SCAM6 can capture those vertically thick clouds in early November and middle December due to the prevalent frontal systems during that time of the year. However, some high CLWC values are not reproduced in the model. Similarly, the temporal evolution of simulated RLWC agrees with the retrievals as demonstrated in Fig. 2c–d; however, their magnitudes are much lower than the retrievals. The relatively coarse vertical resolution near the planetary boundary layer (PBL) is discernable from the discretized cloud vertical distribution in the model simulations (Fig. 2a, c). However, the vertical development of different cloud types (stratus, stratocumulus, and cumulus) and their transitions are generally reproduced by SCAM6. When cumulus occurs with cloud top height greater that 2000 m, the model can always capture them. Despite good agreement on cloud top height, SCAM6 overpredicts CLWC and RLWC frequency near the surface (< 200 m) compared to the observations. The statistics of cloud macrophysics in Fig. 3 support the analyses above. Cloud top heights show good agreement between SCAM6 and observations, with 8-month mean values of 1561 and 1425 m, respectively (Fig. 3f). It corroborates the notion that SCAM6 can capture the cloud type transition relatively well. However, due to the lower cloud base height in SCAM6, cloud physical thickness is overestimated in the model. Even with the above biases in cloud macrophysics, the modeled cloud mass center (CMC) height (mean cloud layer heights weighted by CLWC) is comparable to the observed ones (Fig. 3h).
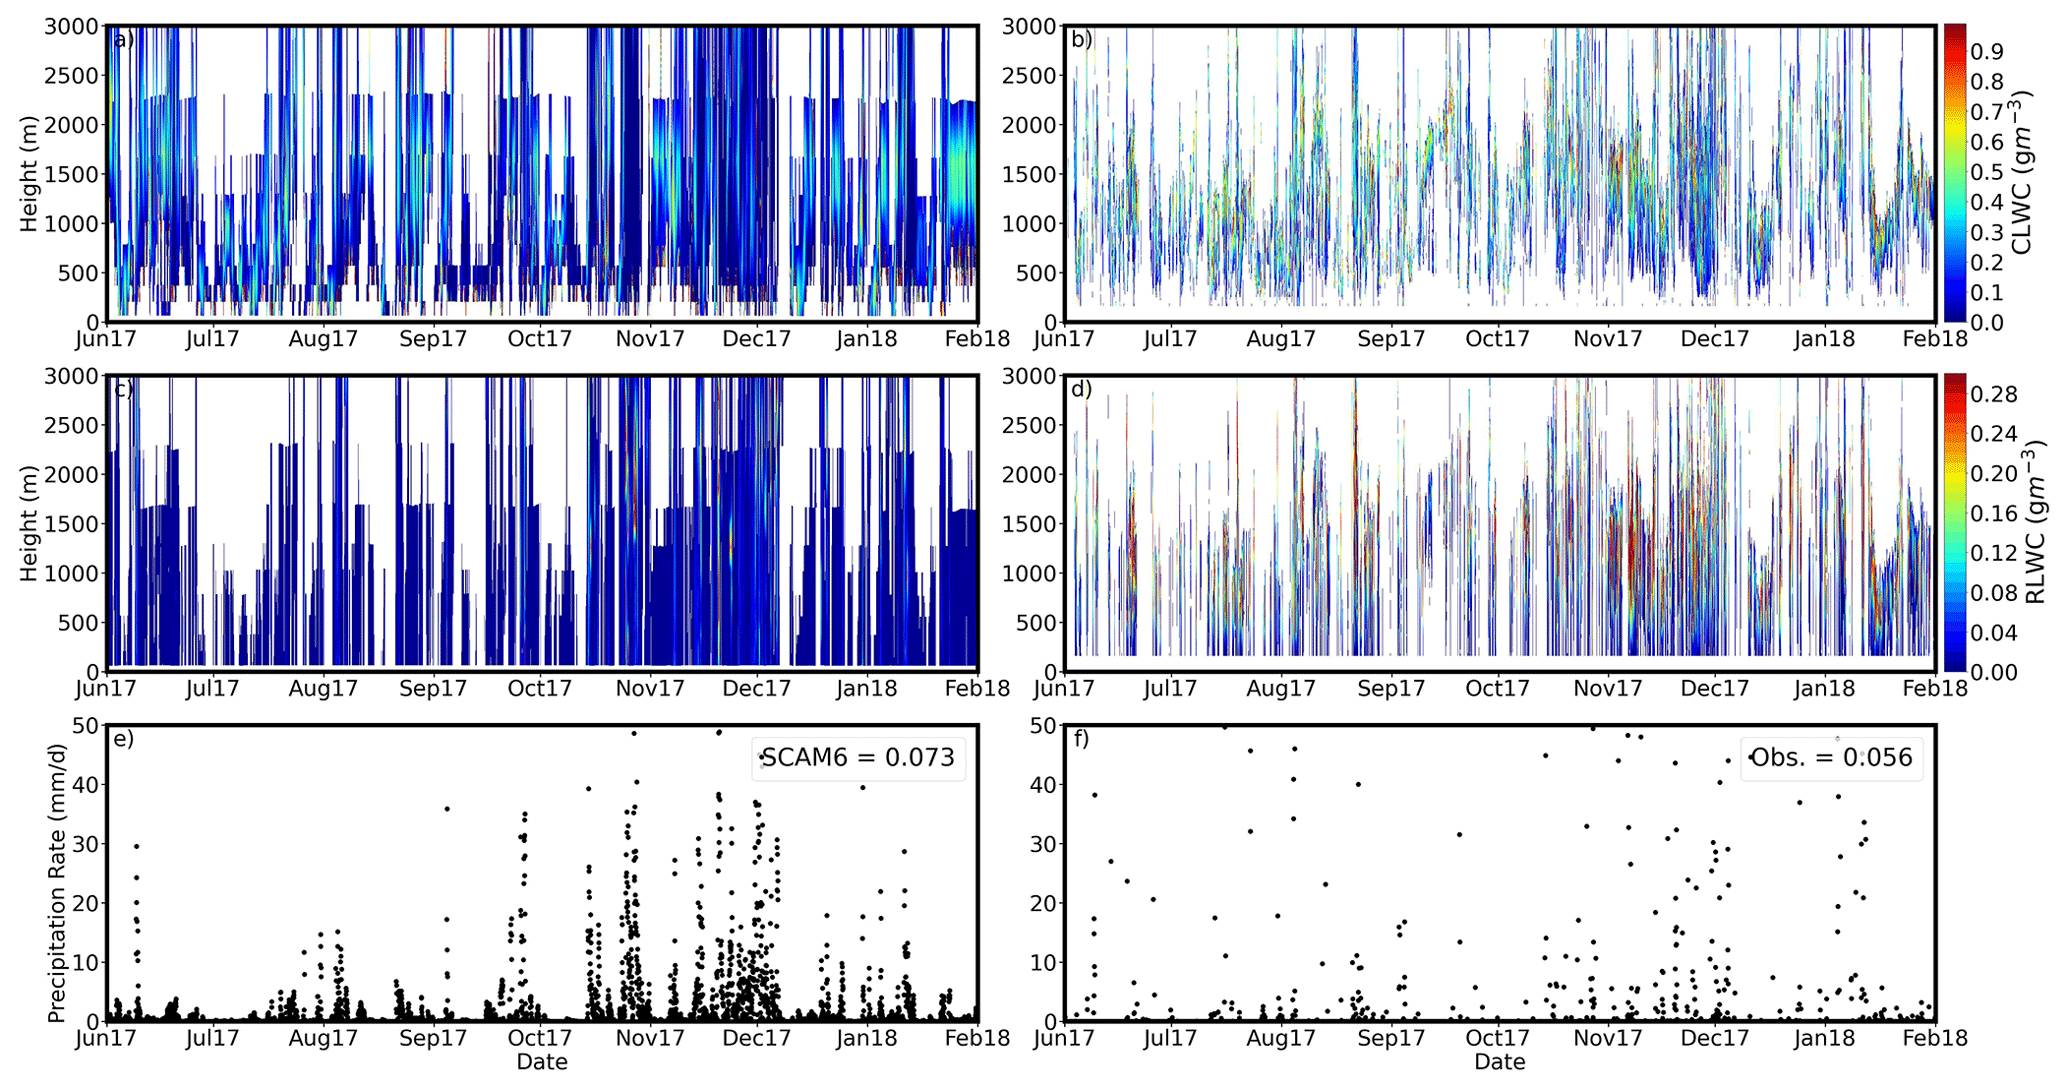
Figure 2Time series of the cloud liquid water content (CLWC, a, b), rain liquid water content (RLWC, c, d), and surface precipitation (e, f) from the SCAM6 simulations (a, c, e) and the ARM ENA retrievals and observations (b, d, f).
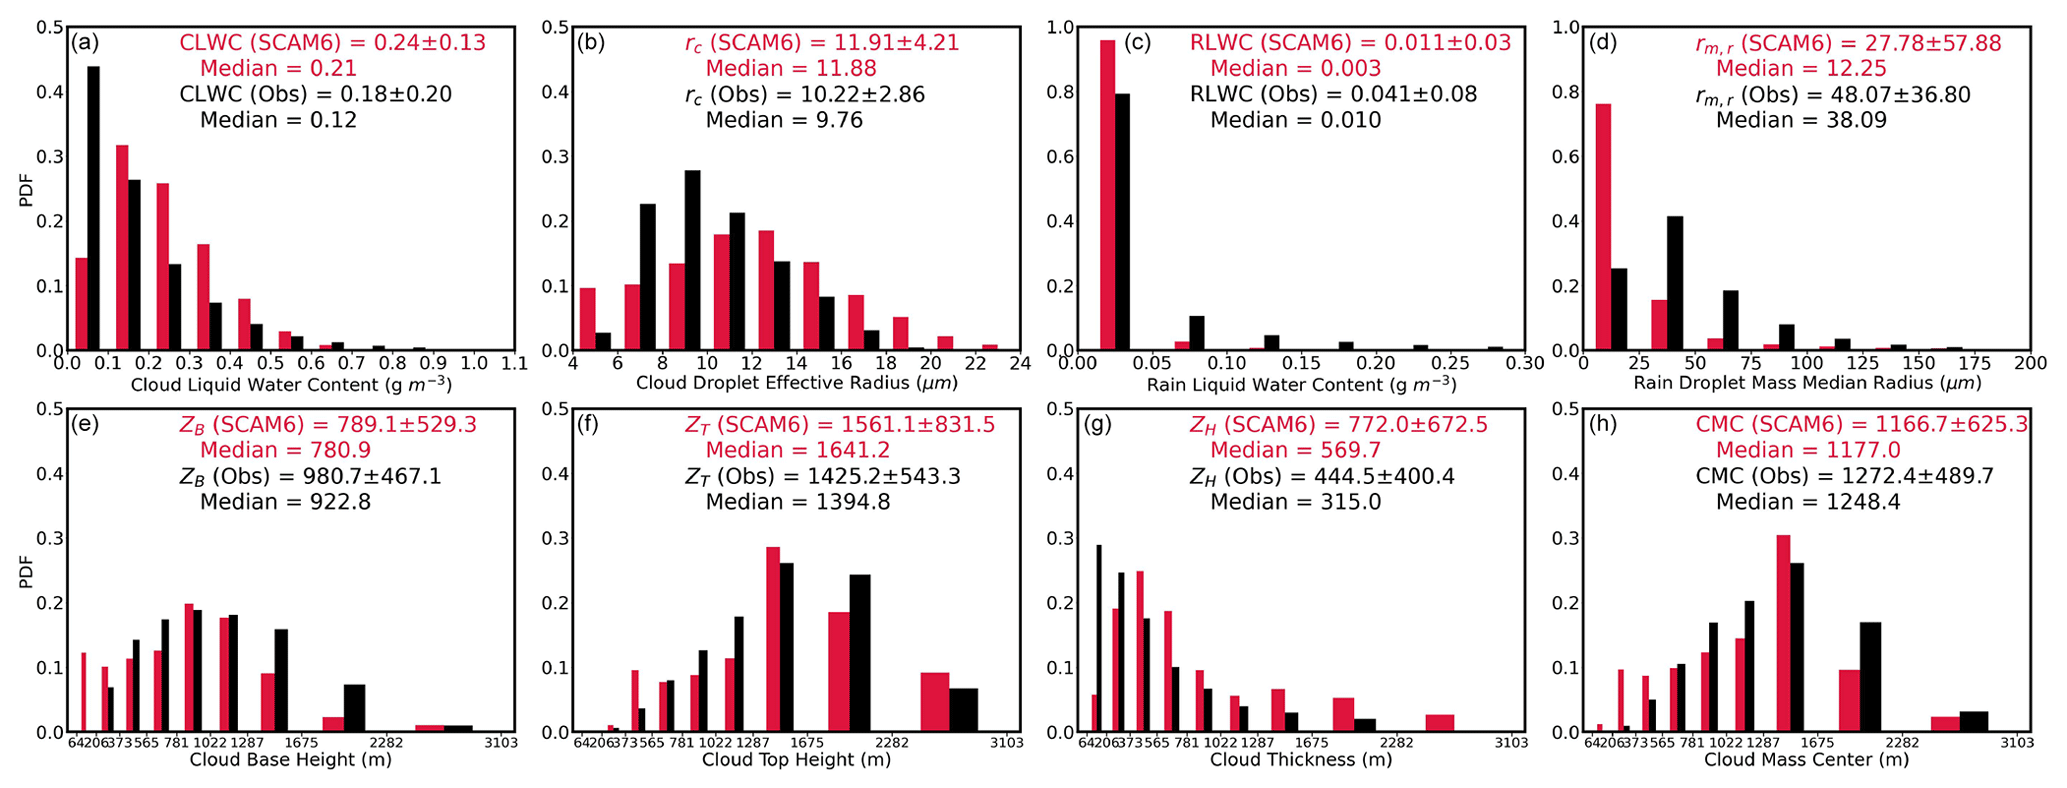
Figure 3Probability distribution functions (PDFs), mean, standard deviation, and median values of cloud and rain microphysics and cloud macrophysics simulated from SCAM6 (red) and observed/retrieved from ground-based remote sensors (black). (a) Cloud liquid water content, CLWC; (b) cloud droplet effective radius, rc; (c) rain liquid water content, RLWC; (d) rain droplet mass median radius, rm,r; (e) cloud base height, ZB; (f) cloud top height, ZT; (g) cloud thickness, ZH; and (h) cloud mass center.
A further comparison of 8-month surface precipitation rate in Fig. 2e and f shows that SCAM6 can capture the heavy precipitation (> 25 mm d−1) under the large-scale forcing during the winter season (October to January). However, the issue of drizzle that is too frequent persists throughout the 8-month simulations. The frequency of light precipitation (< 2 mm d−1) is more than 80 %, which is rather unrealistic compared to the observations. The mean surface precipitation in SCAM6 is overestimated by 30 % compared to the rain gauge measurements during the whole 8-month period.
The statistical comparisons of cloud and drizzle microphysical properties in Fig. 3a–d reveal that CLWC is overestimated by about 30 %. Consequently, rc is slightly larger in the model, and the bias becomes worse for those larger droplets (rc greater than 10 µm). CLWC that is too large fosters fast cloud to warm-rain conversion, but the simulated RLWC values are smaller than the retrievals, leading to surface precipitation that is too frequent mainly in the drizzle form. Note that retrieved RLWC from ground-based radar also bears large uncertainty, as indicated by the large error bar in Fig. 3c. Hence, the real differences in RLWC between SCAM6 and observations remain hard to quantify. Our analyses here include all 8-month simulation results and all types of cloud. In an additional analysis, by focusing on the marine boundary layer (MBL) stratiform cloud only, we obtain quite similar cloud evaluation results. As shown in Fig. S2, when we strengthen our selection criteria by only sampling consecutive cloud layers lasting more than 2 h with the cloud top height less than 3 km, the statistics of cloud micro- and macro-physical properties do not differ significantly. It reflects the fact that over the ENA, MBL clouds are predominant during those seasons. Considering the SH bias against observations (Fig. 1), an additional SCAM6 sensitivity test is conducted by perturbing moisture content and the associated advection with a scaling factor of 0.85. Results show that the distributions of simulated SH and RH only slightly shift towards the lower tail with smaller mean values, which cannot correct their biases. Notably, despite the minor changes in the simulated cloud and drizzle microphysics, the cloud top height, thickness, and CMC simulations perform noticeably better than the control simulation (Fig. S3). It suggests that the moisture fields in the large-scale forcing exert larger impacts on the simulated cloud structure and macrophysics than the microphysics. In other words, cloud microphysical properties are strongly regulated by the parameterizations in the model and are less sensitive to the external forcing.
Driven by the same large-scale forcing, SCAM5 simulated meteorological fields are similar to SCAM6 (Fig. S4), but cloud properties are quite different from those by SCAM6. Instead of an overestimation in SCAM6, the SCAM5 simulated CLWC exhibits an underestimation (Fig. 4a). One possible reason is the change in formula for the saturation vapor pressure in the MG2 cloud microphysics scheme (Gettelman and Morrison, 2015). Previous SCM simulations for the Microphysics of Arctic Clouds Experiment (MPACE) case also show the larger LWC by MG2 than the first cloud microphysics scheme (MG1; Gettelman et al., 2015). The good agreement of the mean rc in SCAM6 does not exist in the SCAM5 simulations (Fig. 4b), and too many small cloud droplets (less than 6 µm) are present in SCAM5, which are not found in either observations or SCAM6. RLWC in SCAM5 is still much smaller than observations (Fig. 4c), suffering the similar issue to SCAM6. Different from SCAM6, SCAM5 overpredicts mean rm,r (Fig. 4d) but underpredicts mean rc. The high bias in drizzle size is likely related to the raindrop accretion process that is too strong, while the low bias in drizzle amount is subject to both source and sink uncertainty with the drizzle budget. The mean surface precipitation in SCAM5 is 0.082 mm d−1 (Fig. S5), higher than the 0.056 mm d−1 in observations and 0.073 in SCAM6. The anomalously high surface precipitation lines up with drizzle size that is too large and drizzle amount suspended in the air that is too low in SCAM5.
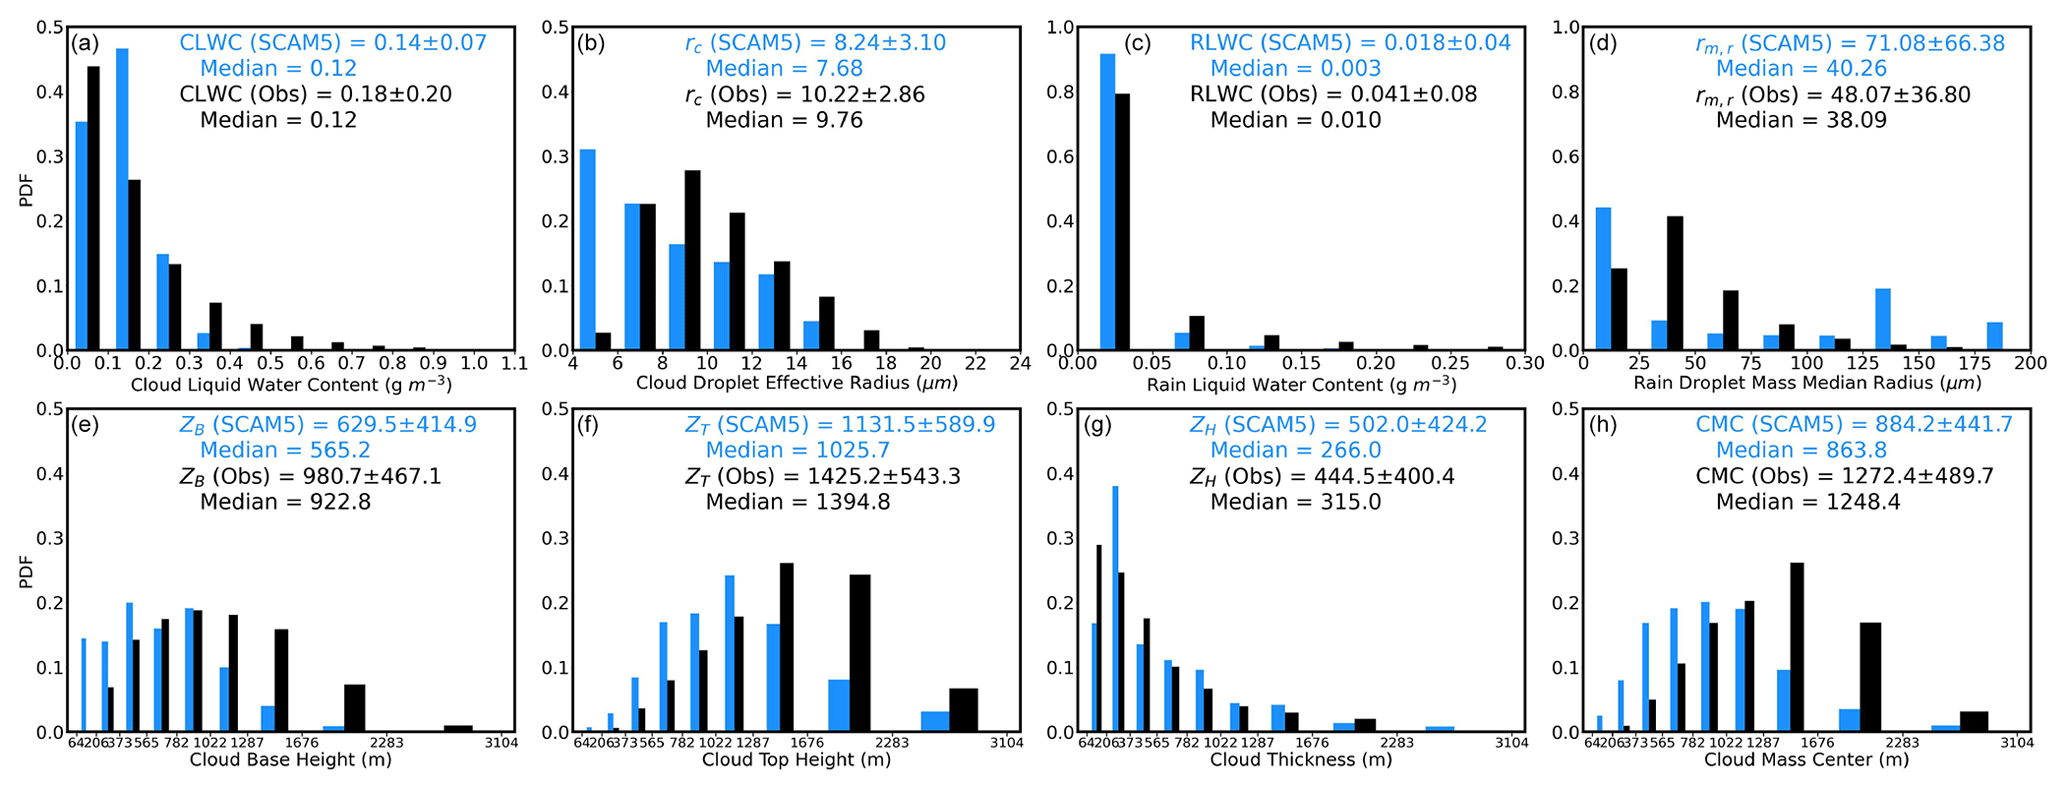
The improvement in the cloud macrophysics from SCAM5 to SCAM6 is more evident than that in microphysics. Cloud base height and cloud top height that are too low result in a cloud deck that is too thin in SCAM5 (Fig. 4e–g). The cloud center mass is also systematically low in SCAM5. By and large, the updated cloud physics in CAM6 helps improve many aspects of cloud simulations, but the drizzle issues still linger on.
3.3 Aerosols
To probe the possible uncertainty sources for cloud droplet number concentration, vertical profiles of aerosol and CCN number concentrations are compared between SCAM6 simulations and in situ aircraft observations from 17 flights near the Azores islands during the ACE-ENA field campaign (Fig. 5). The in situ profiles represent the average of data collected during 12 flights and 5 flights selected during the summer and winter IOPs, respectively. The SCAM6 profiles correspond to the averages within the 17-flight time stamps. SCAM6 generally gets seasonality right; i.e., aerosol and CCN number concentrations are high in summer and low in winter. The model also agrees with observations on the magnitude of accumulation-mode aerosol concentration (NACC) and CCN concentration (NCCN) during the summer, which further leads to a reasonable comparison of Nc. The small bias of Nc generally follows the performance of NCCN, i.e., high bias near the bottom while low bias near the top. One intriguing phenomenon during the summertime is that NCCN can be even higher than NACC, found in both aircraft measurements and model simulations. The high NCCN occurs within the MBL (< 1000 m) in SCAM6. In contrast, measured NCCN in the lower free troposphere (FT, 2000–2500 m) is of the same magnitude as that within the MBL, and FT NCCN is higher than NACC in the observations. A breakdown of the aerosol number concentration budget in SCAM6 (Fig. S6) shows that Aitken-mode aerosols contribute to about 20 % summertime and 45 % wintertime total aerosol numbers. In contrast, the coarse-mode aerosol number is only about 1 % of the Aitken-mode one. Therefore, the large NCCN within the MBL in SCAM6 should be attributed to the efficient Aitken-mode aerosol activation near the cloud bottom in SCAM6. A further examination of aerosol chemical compositions in SCAM6 suggests that sulfate is the predominant aerosol species in the Aitken mode (Fig. S7).
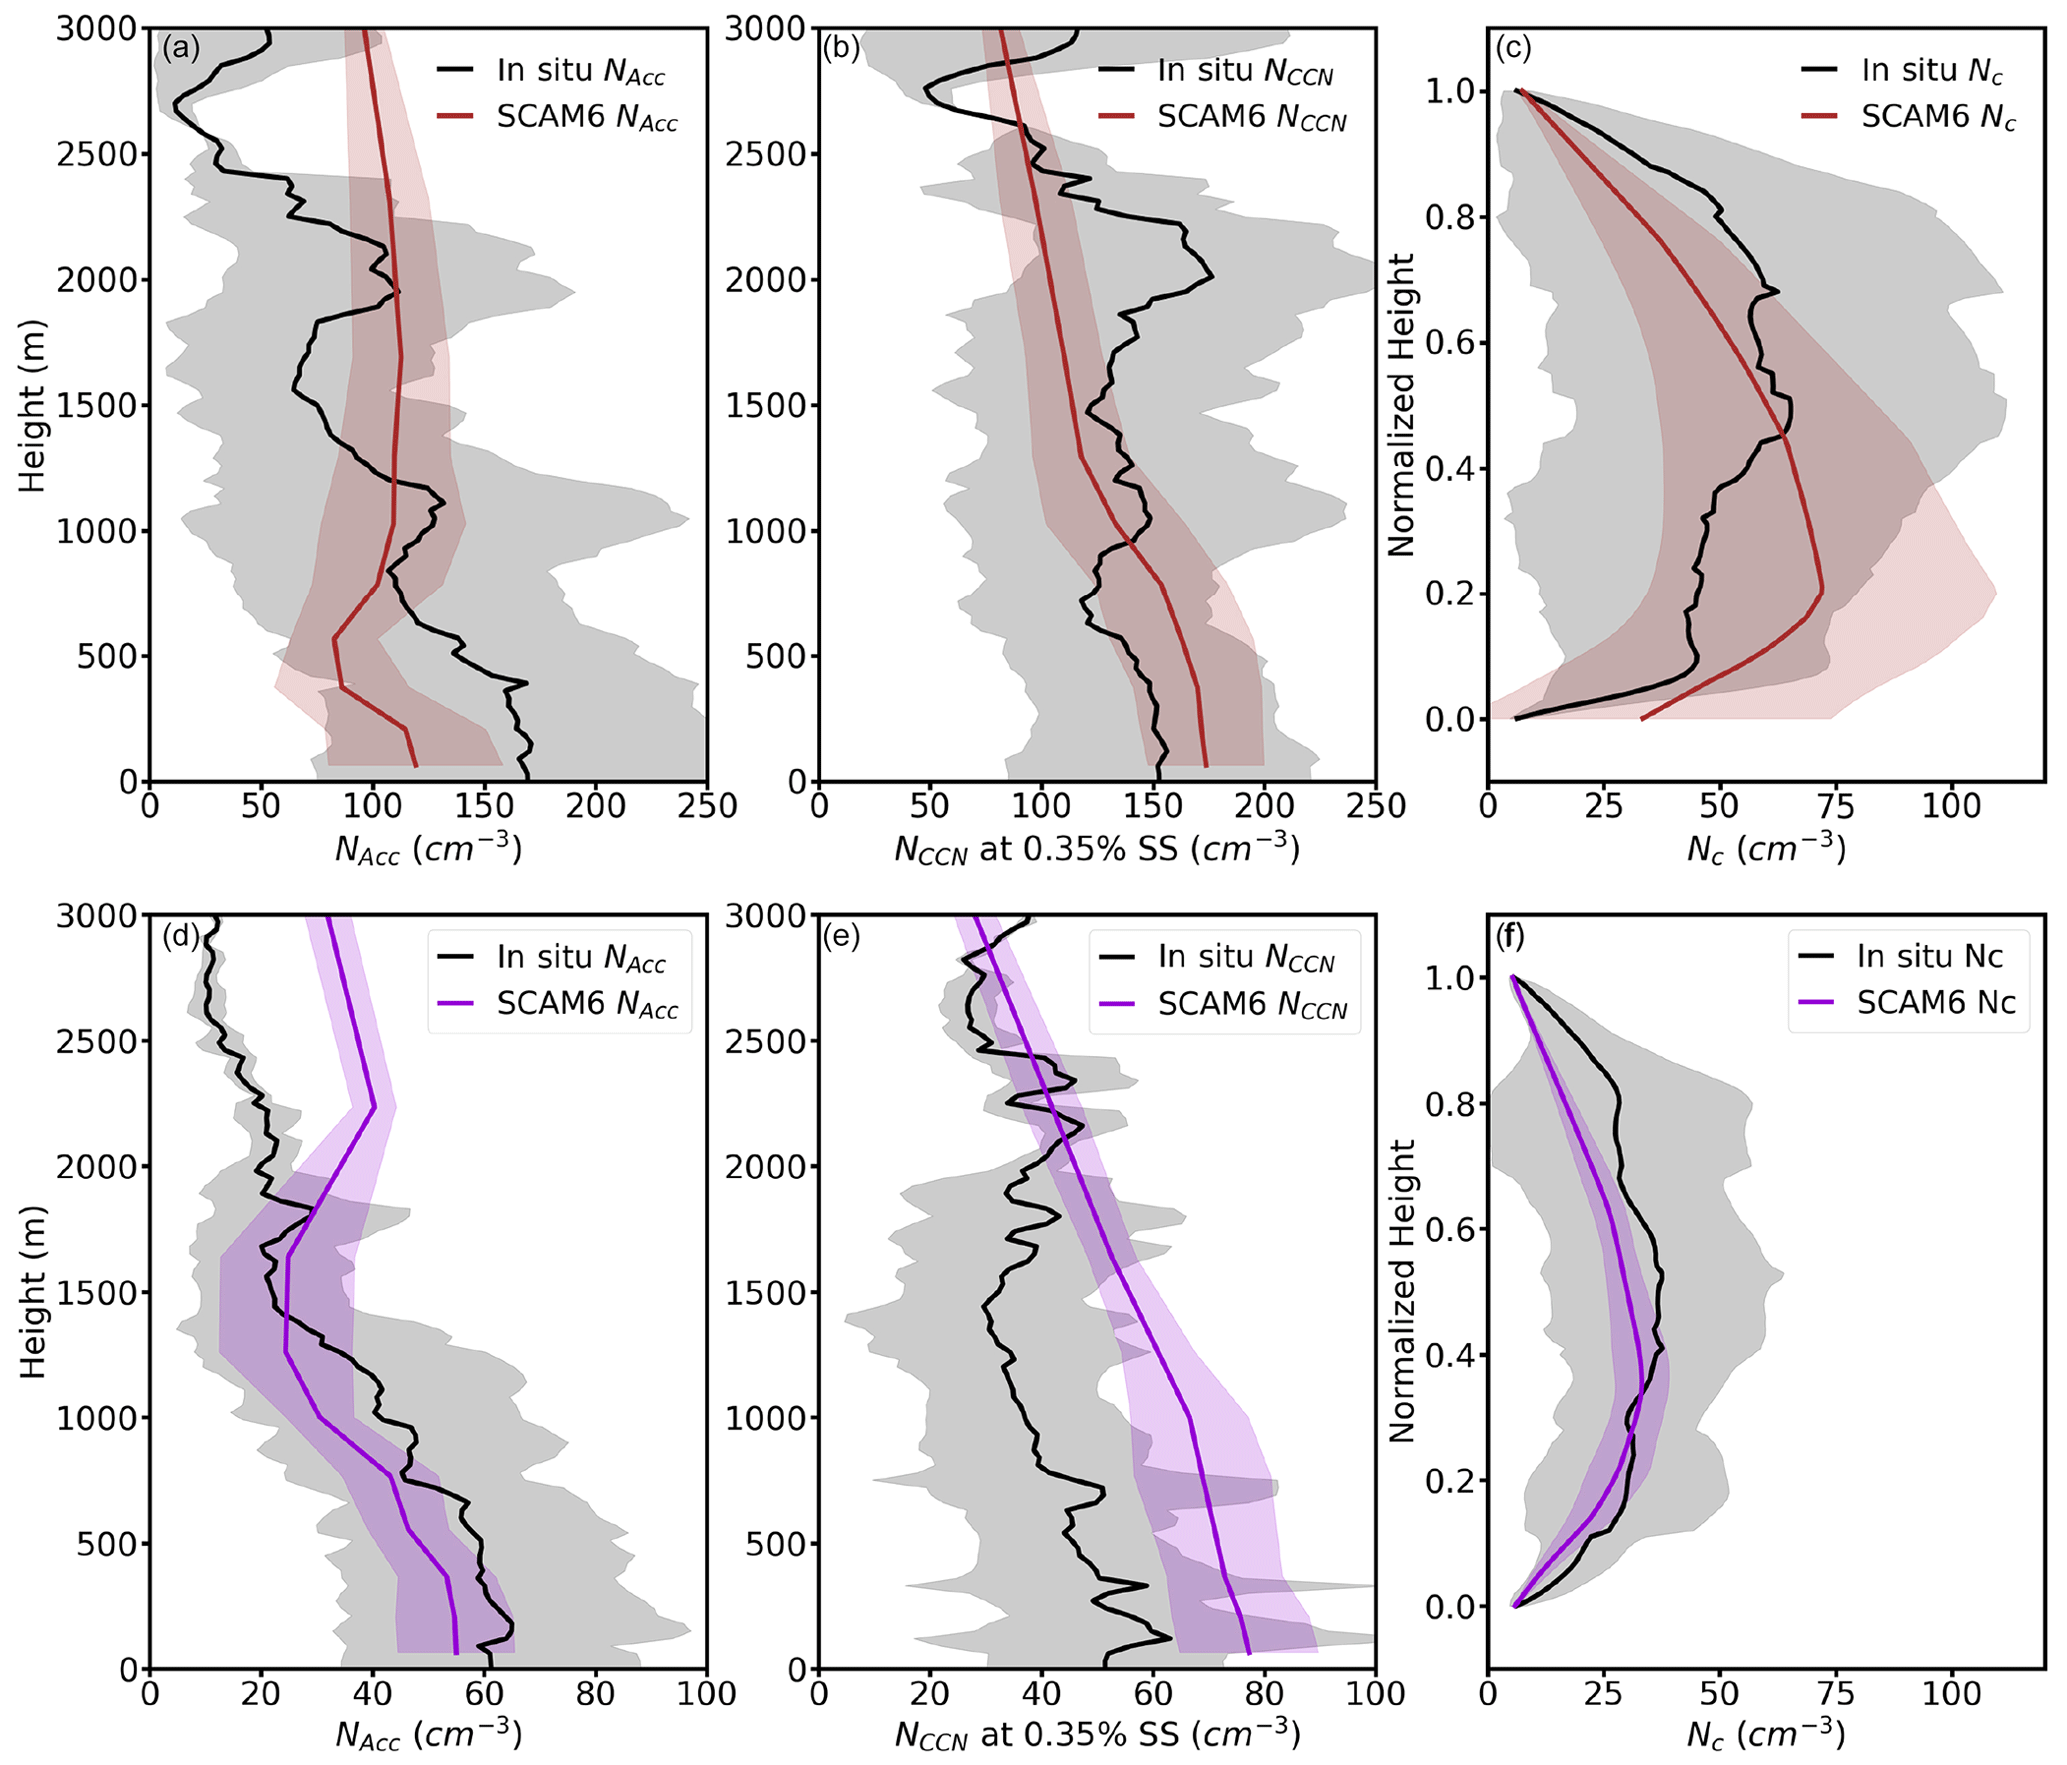
Figure 5Vertical profiles of accumulation-mode aerosol (NACC) (a, d), CCN concentration (NCCN) at 0.35 % supersaturation (b, e) during interstitial conditions, and cloud droplet number concentration (Nc) at normalized height (c, f; 0 is cloud base, 1 is cloud top) for cloudy samples. SCAM6 simulations (brown and purple) and aircraft in situ measurements (black) during the summer (a–c) and winter (d–f) ACE-ENA IOPs. The shaded areas denote the standard deviation at each level. The SCAM6 simulations are selected within each time duration of the aircraft cases. The reason of using normalized height for Nc is that the cloud layer thickness and vertical positions differ for each corresponding time stamp. We need to normalize the height within each cloud layer to ensure that the Nc vertical variation is representative.
Understanding larger NCCN than NACC in the lower FT in the observations is challenging because coarse- and Aitken-mode aerosol number concentrations were not measured during the IOP. However, a previous study found that new particle formation frequently occurs in the FT over the ENA because of the sulfuric acids being elevated, especially during summertime when the oceanic dimethyl sulfide (DMS) emissions are strong (Zawadowicz et al., 2021). Previous back-trajectory analyses by Wang et al. (2020) suggest the long-range transport of the fine-mode aerosols to the ENA site likely originates from the continental US. Therefore, the oxidations of DMS, jointly with the long-range transported pollution, contribute to the elevated Aitken-mode aerosol concentrations in the FT. Those Aitken-mode aerosols (e.g., DMS oxides and diluted continental pollutants) are found to be substantial contributors to the CCN budget (Y. Wang et al., 2021). The FT aerosols and CCN can be further entrained down to the MBL, consistent with what is shown in Fig. 5. Note that SCAM6 predicts the “top-heavy” Aitken-model aerosol concentration profile, but it does not lead to the larger NCCN above the MBL. Hence, we can only speculate that in the real atmosphere, there are significant Aitken-mode aerosols that can serve as CCN in the lower FT, but that is not the case in SCAM6. The above discussions reinforce the notion that it is crucial to accurately simulate the long-range transport of aerosols and their growth over a remote maritime region like ENA. Future investigation on how the aerosol activation process is simulated in different model levels is warranted.
During the winter, NACC is comparable between model and observation (Fig. 5d), while NCCN is significantly overestimated from the surface to 2000 m altitude (Fig. 5e). Based on our analyses above for the summer, we can infer that a contribution that is too strong from the Aitken mode to the CCN budget also exists in winter. Moreover, there is a non-negligible effect which is that the frequent convective activities and associated large super saturation within the mid-latitude frontal systems during wintertime also likely result in the stronger activation of Aitken-mode aerosol. Surprisingly, the modeled Nc shows good agreement with observations despite the overestimated NCCN. One plausible reason is the canceling effect from the Nc sink that is too strong in the model. The overestimated cloud droplet size by the model (Fig. 3b) fosters the warm-rain formation and, in turn, efficiently depletes cloud droplets (Zheng et al., 2022b), keeping the modeled Nc at a comparable level with the observations.
Our previous study showed that this set of new parameterizations in CAM5 helps alleviate the long-lasting issue in the climate models, e.g., precipitation that is too frequent and too light, on the global scale (Dong et al., 2021). When we apply the same set of parameterizations in SCAM5 over the ENA (referred to as SCAM5D21), we find similar improvements in cloud and precipitation properties. As shown in Fig. 6, CLWC in SCAM5D21 is elevated due to the less efficient autoconversion scheme, and the simulated CLWC values agree better with the ARM retrievals compared with the original SCAM5. rc is also enlarged in SCAM5D21, being more consistent with retrievals. The mass median radius of raindrops rm,r is reduced slightly, while there is no significant change in RLWC in SCAM5D21. Because of the improved cloud microphysical properties, cloud macrophysics also match up better with observations. Cloud base height, cloud top height, and cloud mass center height are all improved to some extent in SCAM5D21 simulations (Fig. 6e–h). These comparisons are encouraging, indicating that the new D21-KK warm parameterizations in SCAM5 make significant improvements on the simulated MBL cloud and drizzle properties.
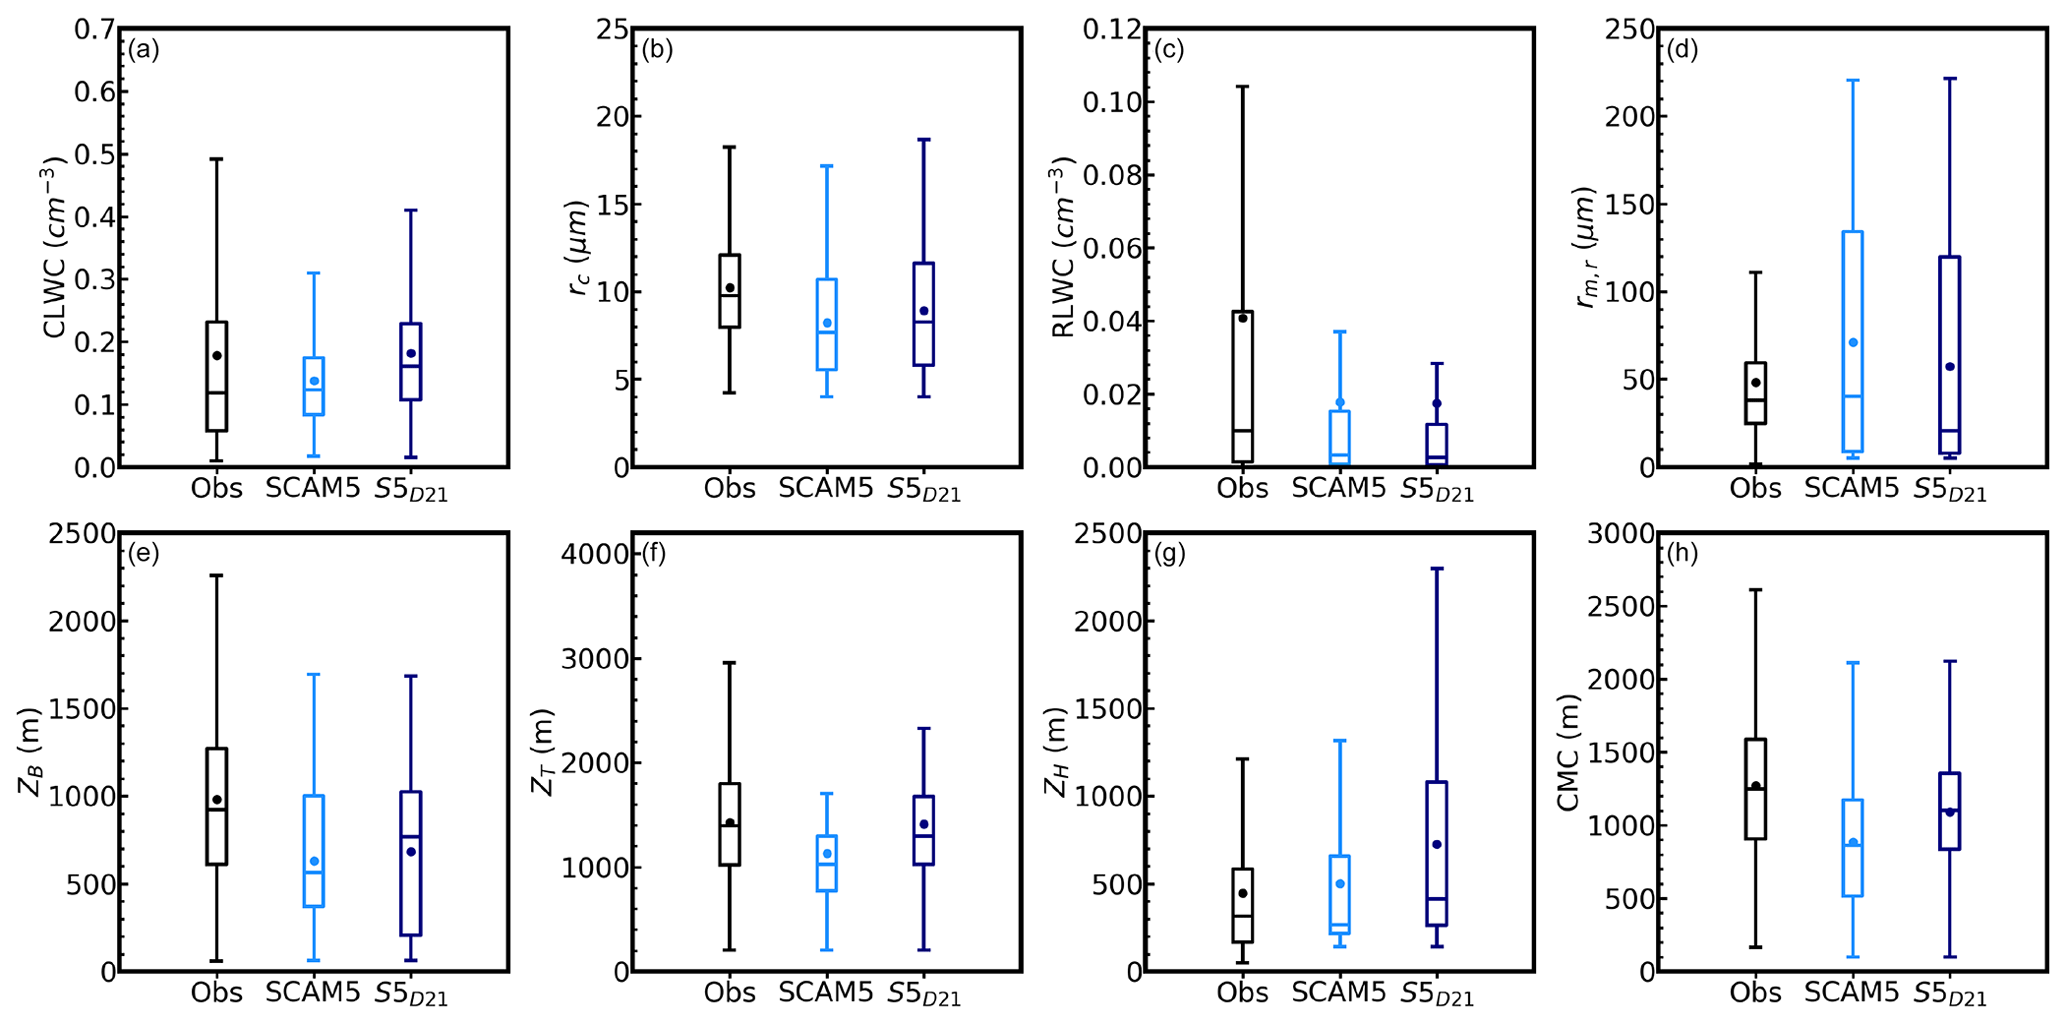
Figure 6Comparisons of cloud and rain microphysics and cloud macrophysics between observations (black), SCAM5 (blue), and SCAM5 with the D21-KK parameterization (SCAM5D21, dark blue). (a) CLWC, (b) rc, (c) RLWC, (d) rm,r, (e) ZB, (f) ZT, (g) ZH, and (h) cloud mass center. Dots represent the mean values, and the bars from bottom to top represent 10 %, 25 %, 50 %, 75 %, and 90 % values, respectively.
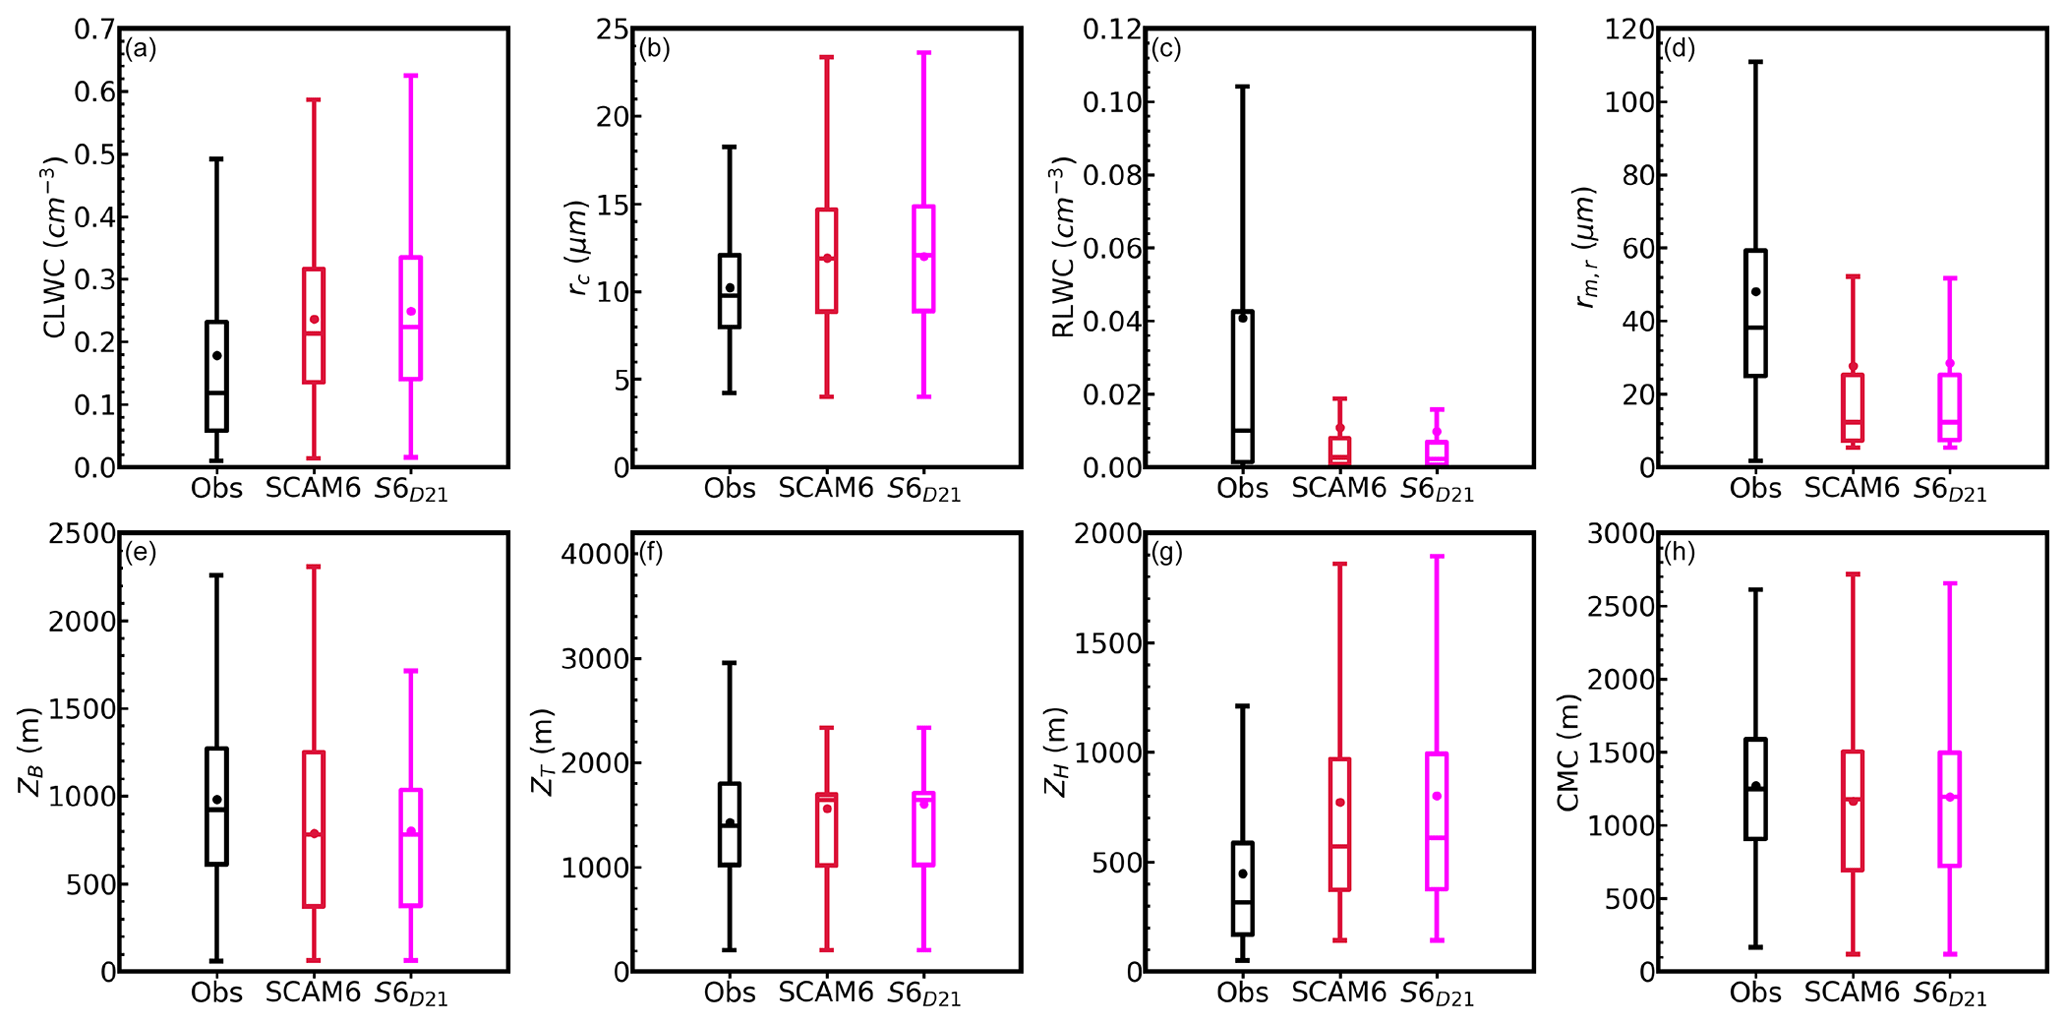
Figure 7Same as Fig. 6 except for SCAM6 (red) and SCAM6 with the D21-KK parameterization (SCAM6D21, pink).
Different from the CAM5 microphysics, CAM6 starts to introduce subgrid cloud variations (Lebsock et al., 2013; Zhang et al., 2019) and retune the parameters in the KK scheme. One direct consequence is that CLWC has been changed from underestimation to overestimation (Fig. 7a). Therefore, an even slower autoconversion process with the new D21-KK scheme cannot further benefit the warm-rain processes in CAM6. As expected, SCAM6D21 does not exhibit improvement in simulating both cloud microphysics and macrophysics (Fig. 7). Distinctive sensitivities to the same microphysical parameter modification under different versions of the physics package pose a challenge to model improvement through only updating a certain set of parameterizations.
Aerosol indirect effects, especially the second indirect effect concerning the liquid water content change, were reported to be overpredicted in CAM5 when simulating the aerosol perturbations, such as volcano eruptions, on the low clouds (Malavelle et al., 2017). Here we assess the first and second aerosol indirect effects of CAM6 over the ENA under the single-column framework. To perturb the CCN budget, we choose to modify the accumulation-mode aerosols in their initial conditions. As the aerosol relaxation is on, such a perturbation is expected to constantly impact the aerosol field during the integrations. Considering the relatively low background aerosol concentration over ENA, the change in aerosol direct effect on the clear-sky radiation fluxes can be ignored in this setup. Both aerosol number and mass concentrations in the accumulation mode are enlarged by a factor of 2, and the results are labeled S6pAero and are compared with the original SCAM6 simulations (Fig. 8). With such an aerosol perturbation, NCCN within MBL (< 1 km) is increased from 112.5 to 175.8 cm−3, corresponding to a 56 % enhancement. Similarly, CCN in the lower FT and upper MBL (1–3 km) increased by 61 %. First and second aerosol indirect effects are evident in SCAM6, as reduced rc and increased CLWC are both found in the perturbed experiment. We further quantify the droplet size susceptibility and cloud water susceptibility with respect to MBL CCN changes by and , respectively. The SCAM6 simulated droplet size susceptibility is –0.2, close to the LES range from −0.22 to −0.25 and the upper bound of the observed range over ENA (Wang et al., 2020; Zheng et al., 2022a). The SCAM6 simulated cloud water susceptibility is +0.19 which also falls into the LES prediction (+0.18 to +0.30). Those results suggest that the newly introduced subgrid cloud variabilities in SCAM6 can account for the aerosol indirect effects at a reasonable level. Mean surface precipitation amount shows relatively small responses to CCN perturbation (less than 2 %) because convective precipitation in early winter dominates the study period, while deep convective parameterization in SCAM6 is still unlinked with cloud microphysics and does not account for CCN effects so far. Cloud top height (ZT) shows an increase with higher CCN concentrations (Fig. 8f), likely due to the enhanced latent heat release following the elevated condensational rate.
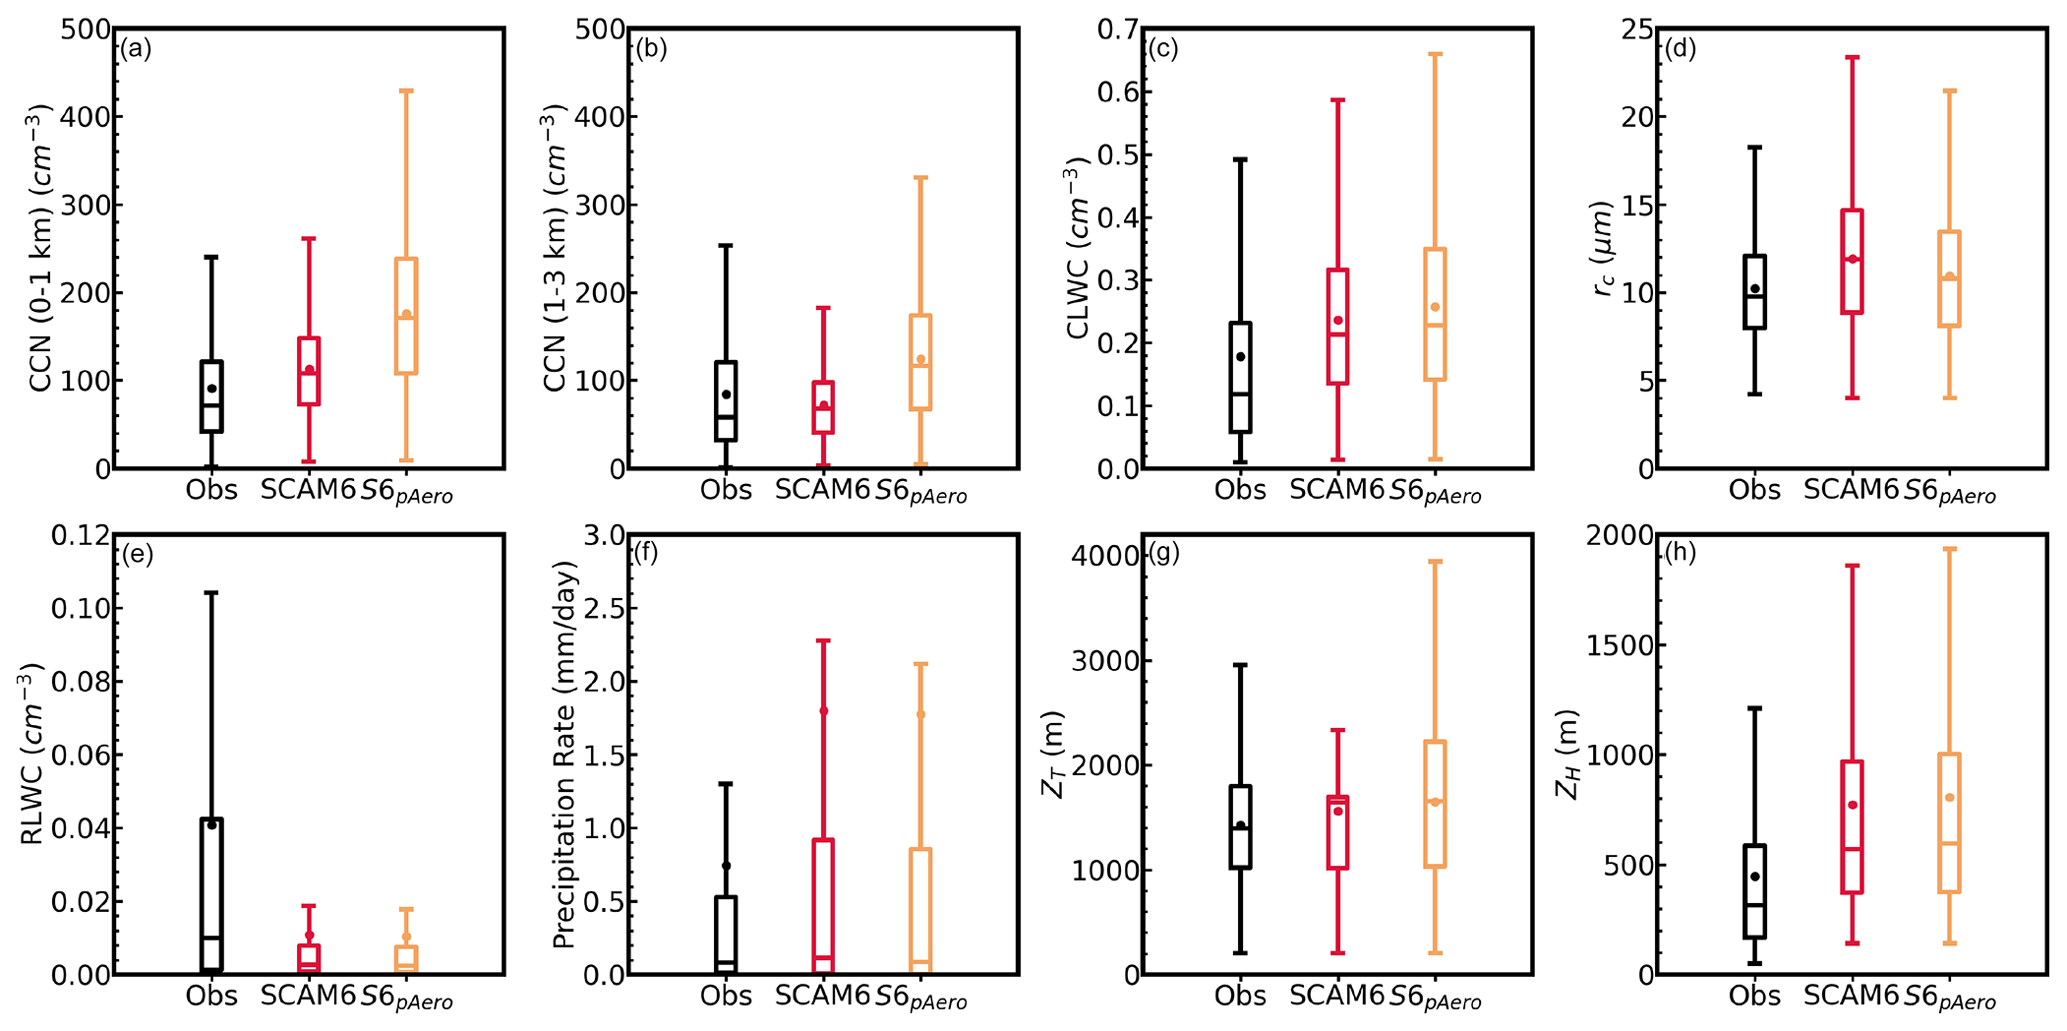
Figure 8Aerosol and cloud properties simulated from control (red) and aerosol-perturbing experiments (pAero, orange) by SCAM6 and comparison to observations (black). The observed CCN at 0.35 % supersaturation (SS) are averaged from the selected aircraft measurements during the ACE-ENA campaign.
The single-column versions of NCAR CAM5 and CAM6 are employed to simulate MBL cloud and aerosol properties over the eastern North Atlantic during the ACE-ENA field campaign and to assess the uncertainty in cloud microphysical parameterizations. The 3-hourly large-scale forcing data are derived from the systematic measurements of atmospheric states during the 8-month IOP. SCAM6 reproduces well the temperature field but overestimates specific and relative humidity by about 10 %, especially for those near-cloud grid points. Our moisture adjustment simulation suggests that moisture variables in the large-scale forcing exert larger impacts on simulated cloud structures than cloud microphysics. It further implies that cloud microphysical properties are strongly regulated by the parameterizations and less sensitive to the external forcing. Cloud frequency and transition between different types show good agreement between SCM and observations. Cloud simulations are generally improved from SCAM5 to SCAM6 in terms of droplet effective radius, cloud top height, and cloud thickness. However, there are some common issues with warm precipitation in those two models, which are rainwater content that is too small and surface light precipitation that is too frequent.
To probe the possible contributions from the warm-cloud parameterization to those drizzle biases, we implement the recalibrated autoconversion and accretion processes in the KK scheme for both SCAM5 and SCAM6. The updated parameterizations explicitly consider vertical variations in droplet size. The new scheme tends to improve CLWC and rc in SCAM5, as well as rm,r, but does not significantly alleviate the drizzle problem. The improvement is absent in SCAM6, likely because subgrid variations in cloud properties have been introduced in CAM6 cloud microphysics (especially for the autoconversion parameterization), suppressing the KK scheme's sensitivity to other factors. Further study is warranted to test whether the same warm-rain precipitation sensitivity holds for different cases using SCAM5 and 6.
Aerosol simulations in SCAM6 are evaluated against the aircraft measurements during the ACE-ENA campaign. A significant Aitken-mode aerosol contribution to the CCN budget over ENA is identified in both models and observations. SCAM6 agrees with observations on the magnitude of concentration of accumulation-mode aerosol, CCN, and cloud droplets during the summer, while NCCN is significantly biased high from the surface to 2000 m in altitude during the winter. Aerosol budget analyses show that in SCAM6, long-range transport provides too many Aitken-mode sulfates that entrain into the MBL and can grow to CCN-sized particles consequently. We further quantify aerosol indirect effects by perturbing accumulation-mode aerosol concentrations in the model. SCAM6-predicted cloud water and droplet size susceptibilities line up with the classic CCN effects, i.e., reduced droplet size but enhanced liquid water content under the high-CCN scenario. The magnitudes of the cloud water and droplet size susceptibilities are also close to the LESs conducted for the selected cases during the ACE-ENA campaign.
The present study provides new insight into model biases in aerosol and warm-cloud simulations in the NCAR CAM models. Different from the previous evaluations of a full model run with potential large biases propagated from modeled large-scale conditions, the model biases discussed here, especially the drizzle property issue, should be adequately addressed in the future development of CAM. The existing progress of predicted cloud properties and aerosol effects is clearly demonstrated under the single-column framework in this study. More comprehensive aerosol measurements, including Aitken- and coarse-mode aerosol properties, are needed in the future field campaign to better understand the aerosol budget and aerosol–cloud interactions.
Instructions for acquiring the CESM 1 and 2 source code can be found at https://github.com/ESCOMP/cesm (NCAR, 2022), with the description of the single column model by Gettelman et al. (2019).
All the CESM model simulation output datasets used for this research can be downloaded from the website at http://web.gps.caltech.edu/~yzw/share/Wang-2023-SCM (Wang, 2023). The aircraft and ground-based measurements used in this study were obtained from the Atmospheric Radiation Measurement (ARM) program sponsored by the U.S. Department of Energy (DOE) Office of Energy Research, Office of Health and Environmental Research, and Environmental Sciences Division. The data can be downloaded from https://adc.arm.gov/discovery/#/results/site_code::ena (Atmospheric Radiation Measurement Data Center, 2020).
The supplement related to this article is available online at: https://doi.org/10.5194/acp-23-8591-2023-supplement.
This study was conceived by YW with contributions from all authors. YW performed model simulations, and XZ helped analyze the results. XD and BX participated in the result discussions. YW prepared the manuscript, with comments and edits from XZ, XD, BX, and YLY.
At least one of the (co-)authors is a member of the editorial board of Atmospheric Chemistry and Physics. The peer-review process was guided by an independent editor, and the authors also have no other competing interests to declare.
Publisher’s note: Copernicus Publications remains neutral with regard to jurisdictional claims in published maps and institutional affiliations.
This article is part of the special issue “Marine aerosols, trace gases, and clouds over the North Atlantic (ACP/AMT inter-journal SI)”. It is not associated with a conference.
We thank the instrument mentors of the instruments and the individuals collecting measurements during the ACE-ENA field campaign. We also acknowledge high-performance computing support from NCAR Cheyenne. All requests for materials in this paper should be addressed to Yuan Wang (yzwang@stanford.edu).
This research has been supported by the U.S. National Science Foundation (grant nos. AGS-2031751 and 2031750).
This paper was edited by Matthew Lebsock and reviewed by two anonymous referees.
Atmospheric Radiation Measurement Data Center: Aircraft and ground observation, ARM [data set], https://adc.arm.gov/discovery/#/results/site_code::ena (last access: 1 July 2022), 2020.
Bogenschutz, P. A., Gettelman, A., Morrison, H., Larson, V. E., Craig, C., and Schanen, D. P.: Higher-Order Turbulence Closure and Its Impact on Climate Simulations in the Community Atmosphere Model, J. Climate, 26, 9655–9676, https://doi.org/10.1175/JCLI-D-13-00075.1, 2013.
Dong, X., Wu, P., Wang, Y., Xi, B., and Huang, Y.: New Observational Constraints on Warm Rain Processes and Their Climate Implications, Geophys. Res. Lett., 48, e2020GL091836, https://doi.org/10.1029/2020GL091836, 2021.
Dong, X., Zheng, X., Xi, B., and Xie, S.: A climatology of mid-latitude maritime cloud fraction and radiative effect derived from the ARM ENA ground-based observations, J. Climate, 36, 531–546, https://doi.org/10.1175/JCLI-D-22-0290.1, 2022.
Gettelman, A. and Morrison, H.: Advanced Two-Moment Bulk Microphysics for Global Models. Part I: Off-Line Tests and Comparison with Other Schemes, J. Climate, 28, 1268–1287, https://doi.org/10.1175/JCLI-D-14-00102.1, 2015.
Gettelman, A., Morrison, H., Santos, S., Bogenschutz, P., and Caldwell, P. M.: Advanced Two-Moment Bulk Microphysics for Global Models. Part II: Global Model Solutions and Aerosol–Cloud Interactions, J. Climate, 28, 1288–1307, https://doi.org/10.1175/JCLI-D-14-00103.1, 2015.
Gettelman, A., Truesdale, J. E., Bacmeister, J. T., Caldwell, P. M., Neale, R. B., Bogenschutz, P. A., and Simpson, I. R.: The Single Column Atmosphere Model Version 6 (SCAM6): Not a Scam but a Tool for Model Evaluation and Development, J. Adv. Model. Earth Sy., 11, 1381–1401, https://doi.org/10.1029/2018MS001578, 2019.
Ghan, S. J., Liu, X., Easter, R. C., Zaveri, R., Rasch, P. J., Yoon, J. H., and Eaton, B.: Toward a minimal representation of aerosols in climate models: Comparative decomposition of aerosol direct, semidirect, and indirect radiative forcing, J. Climate, 25, 6461–6476, https://doi.org/10.1175/JCLI-D-11-00650.1, 2012.
Golaz, J. C., Larson, V. E., and Cotton, W. R.: A PDF-based model for boundary layer clouds. Part I: Method and model description, J. Atmos. Sci., 59, 3540–3551, 2002.
Goldberger, L.: Passive cavity aerosol spectrometer probe aboard aircraft (PCASP-AIR) with signal processing package 200 instrument handbook, DOE/SC-ARM-TR-241, https://www.arm.gov/publications/tech_reports/handbooks/doe-sc-arm-tr-241.pdf (last access: 20 January 2023), 2020.
Hersbach, H., Bell, B., Berrisford, P., Hirahara, S., Horányi, A., Muñoz-Sabater, J., Nicolas, J., Peubey, C., Radu, R., Schepers, D., Simmons, A., Soci, C., Abdalla, S., Abellan, X, Balsamo, G., Bechtold, P., Biavati, G., Bidlot, J., Bonavita, M., De Chiara, G., Dahlgren, P., Dee, D., Diamantakis, M., Dragani, R., Flemming, J., Forbes, R., Fuentes, M., Geer, A., Haimberger, L., Healy, S., Hogan, R. J., Hólm, E., Janisková, M., Keeley, S., Laloyaux, P., Lopez, P., Lupu, C., Radnoti, G., de Rosnay, P., Rozum, I., Vamborg, F., Villaume, S., and Thépaut, J.: The ERA5 global reanalysis, Q. J. Roy. Meteor. Soc., 146, 1999–2049, https://doi.org/10.1002/qj.3803, 2020.
Jensen, M. P., Ghate, V. P., Wang, D., Apoznanski, D. K., Bartholomew, M. J., Giangrande, S. E., Johnson, K. L., and Thieman, M. M.: Contrasting characteristics of open- and closed-cellular stratocumulus cloud in the eastern North Atlantic, Atmos. Chem. Phys., 21, 14557–14571, https://doi.org/10.5194/acp-21-14557-2021, 2021.
Kay, J. E., Hillman, B. R., Klein, S. A., Zhang, Y., Medeiros, B., Pincus, R., Gettelman, A., Eaton, B., Boyle, J., Marchand, R., and Ackerman, T. R.: Exposing Global Cloud Biases in the Community Atmosphere Model (CAM) Using Satellite Observations and Their Corresponding Instrument Simulators, J. Climate, 25, 5190–5207, https://doi.org/10.1175/JCLI-D-11-00469.1, 2012.
Kay, J. E., Bourdages, L., Miller, N. B., Morrison, A., Yettella, V., Chepfer, H., and Eaton, B.: Evaluating and improving cloud phase in the Community Atmosphere Model version 5 using spaceborne lidar observations, J. Geophys. Res.-Atmos., 121, 4162–4176, https://doi.org/10.1002/2015JD024699, 2016.
Khairoutdinov, M. and Kogan, Y. A New Cloud Physics Parameterization in a Large-Eddy Simulation Model of Marine Stratocumulus, Mon. Weather Rev., 128, 229–243, 2000.
Lebsock, M., Morrison, H., and Gettelman, A.: Microphysical implications of cloud-precipitation covariance derived from satellite remote sensing, J. Geophys. Res.-Atmos., 118, 6521–6533, https://doi.org/10.1002/jgrd.50347, 2013.
Li, F. and Lawrence, D. M.: Role of Fire in the Global Land Water Budget during the Twentieth Century due to Changing Ecosystems, J. Climate, 30, 1893–1908, https://doi.org/10.1175/JCLI-D-16-0460.1, 2017.
Liu, X. and Penner, J. E.: Ice Nuclei Parameterization for Global Model, Meteorol. Z., 14, 499–514. https://doi.org/10.1127/0941-2948/2005/0059, 2005.
Liu, X., Penner, J. E., Ghan, S. J., and Wang, M.: Inclusion of Ice Microphysics in the NCAR Community Atmospheric Model Version 3 (CAM3), J. Climate, 20, 4526–4547, https://doi.org/10.1175/JCLI4264.1, 2007.
Liu, X., Ma, P.-L., Wang, H., Tilmes, S., Singh, B., Easter, R. C., Ghan, S. J., and Rasch, P. J.: Description and evaluation of a new four-mode version of the Modal Aerosol Module (MAM4) within version 5.3 of the Community Atmosphere Model, Geosci. Model Dev., 9, 505–522, https://doi.org/10.5194/gmd-9-505-2016, 2016.
Malavelle, F. F., Haywood, J. M., Jones, A., Gettelman, A., Clarisse, L., Bauduin, S., Allan, R. P., Karset, I. H. H., Kristjánsson, J. E., Oreopoulos, L., Cho, N., Lee, D., Bellouin, N., Boucher, O., Grosvenor, D. P., Carslaw, K. S., Dhomse, S., Mann, G. W., Schmidt, A., Coe, H., Hartley, M. E., Dalvi, M., Hill, A. A., Johnson, B. T., Johnson, C. E., Knight, J. R., O'Connor, F. M., Partridge, D. G., Stier, P., Myhre, G., Platnick, S., Stephens, G. L., Takahashi, H., and Thordarson, T.: Strong constraints on aerosol–cloud interactions from volcanic eruptions, Nature, 546, 485–491, https://doi.org/10.1038/nature22974, 2017.
Morrison, H. and Gettelman, A.: A new two-moment bulk stratiform cloud microphysics scheme in the community atmosphere model, version 3 (cam3). part i: Description and numerical tests, J. Climate, 21, 3642–3659, 2008.
NCAR: The Community Earth System Model, GitHub [code], https://github.com/ESCOMP/cesm, last access: 1 June 2022.
Park, S. and Bretherton, C. S.: A New Moist Turbulence Parameterization in the Community Atmosphere Model, J. Climate, 22, 3422–3448, https://doi.org/10.1175/2008jcli2556.1, 2009.
Park, S., Bretherton, C. S., and Rasch, P. J.: Integrating Cloud Pro- cesses in the Community Atmosphere Model, Version 5, J. Climate, 27, 6821–6856, https://doi.org/10.1175/jcli-d-14-00087.1, 2014.
Sherwood, S. C., Webb, M. J., Annan, J. D., Armour, K. C., Forster, P. M., Hargreaves, J. C., Hegerl, G., Klein, S. A., Marvel, K. D., Rohling, E. J., Watanabe, M., Andrews, T., Braconnot, P., Bretherton, C. S., Foster, G. L., Hausfather, Z., von der Heydt, A. S., Knutti, R., Mauritsen, T., Norris, J. R., Proistosescu, C., Rugenstein, M., Schmidt, G. A., Tokarska, K. B., and Zelinka, M. D.: An Assessment of Earth's Climate Sensitivity Using Multiple Lines of Evidence, Rev. Geophys., 58, e2019RG000678, https://doi.org/10.1029/2019RG000678, 2020.
Tang, S., Tao, C., Xie, S., and Zhang, M.: Description of the ARM Large-Scale Forcing Data from the Constrained Variational Analysis (VARANAL) Version 2, DOE ARM Climate Research Facility, Technical Report DOE/SC-ARM-TR-222, https://www.arm.gov/publications/tech_reports/doe-sc-arm-tr-222.pdf (last access: 20 January 2023), 2019.
Uin, J. and Mei, F.: Cloud condensation nuclei particle counter instrument handbook – airborne version, DOE/SC-ARM-TR-225, https://www.arm.gov/publications/tech_reports/handbooks/doe-sc-arm-tr-225.pdf (last access: 20 January 2023), 2019.
Wang, J., Wood, R., Jensen, M. P., Chiu, J. C., Liu, Y., Lamer, K., Desai, N., Giangrande, S. E., Knopf, D. A., Kollias, P., Laskin, A., Liu, X., Lu, C., Mechem, D., Mei, F., Starzec, M., Tomlinson, J., Wang, Y., Yum, S. S., Zheng, G., Aiken, A. C., Azevedo, E. B., Blanchard, Y., China, S., Dong, X., Gallo, F., Gao, S., Ghate, V. P., Glienke, S., Goldberger, L., Hardin, J. C., Kuang, C., Luke, E. P., Matthews, A. A., Miller, M. A., Moffet, R., Pekour, M., Schmid, B., Sedlacek, A. J., Shaw, R. A., Shilling, J. E., Sullivan, A., Suski, K., Veghte, D. P., Weber, R., Wyant, M., Yeom, J., Zawadowicz, M., and Zhang, Z.: Aerosol and Cloud Experiments in the Eastern North Atlantic (ACE-ENA), B. Am. Meteorol. Soc., 103, 1–51, https://doi.org/10.1175/BAMS-D-19-0220.1, 2021.
Wang, Y., Fan, J., Zhang, R., Leung, L. R., and Franklin, C.: Improving bulk microphysics parameterizations in simulations of aerosol effects, J. Geophys. Res.-Atmos., 118, 5361–5379, https://doi.org/10.1002/jgrd.50432, 2013.
Wang, Y., Wang, M., Zhang, R., Ghan, S. J., Lin, Y., Hu, J., Pan, B., Levy, M., Jiang, J. H., and Molina, M. J.: Assessing the effects of anthropogenic aerosols on Pacific storm track using a multiscale global climate model, P. Natl. Acad. Sci. USA, 111, 6894–6899, https://doi.org/10.1073/pnas.1403364111, 2014.
Wang, Y., Jiang, J. H., and Su, H.: Atmospheric responses to the redistribution of anthropogenic aerosols, J. Geophys. Res.-Atmos., 120, 9625–9641, https://doi.org/10.1002/2015JD023665, 2015.
Wang, Y., Ma, P.-L., Jiang, J., Su, H., and Rasch, P.: Towards Reconciling the Influence of Atmospheric Aerosols and Greenhouse Gases on Light Precipitation Changes in Eastern China, J. Geophys. Res.-Atmos. 121, 5878–5887, 2016.
Wang, Y., P. Ma, J. Peng, R. Zhang, J.H. Jiang, R. Easter and Y. Yung, Constraining Aging Processes of Black Carbon in the Community Atmosphere Model Using Environmental Chamber Measurements, J. Adv. Model. Earth Sy., 10, 2514–2526, 2018.
Wang, Y., Zheng, X., Dong, X., Xi, B., Wu, P., Logan, T., and Yung, Y. L.: Impacts of long-range transport of aerosols on marine-boundary-layer clouds in the eastern North Atlantic, Atmos. Chem. Phys., 20, 14741–14755, https://doi.org/10.5194/acp-20-14741-2020, 2020.
Wang, Y., Zheng, G., Jensen, M. P., Knopf, D. A., Laskin, A., Matthews, A. A., Mechem, D., Mei, F., Moffet, R., Sedlacek, A. J., Shilling, J. E., Springston, S., Sullivan, A., Tomlinson, J., Veghte, D., Weber, R., Wood, R., Zawadowicz, M. A., and Wang, J.: Vertical profiles of trace gas and aerosol properties over the eastern North Atlantic: variations with season and synoptic condition, Atmos. Chem. Phys., 21, 11079–11098, https://doi.org/10.5194/acp-21-11079-2021, 2021.
Wang, Y.: SCAM5 and SCAM6 model output, Caltech Server [data set], http://web.gps.caltech.edu/~yzw/share/Wang-2023-SCM (last access: 23 May 2023), 2023.
Wu, P., Dong, X., Xi, B., Tian, J., and Ward, D. M.: Profiles of MBL Cloud and Drizzle Microphysical Properties Retrieved From Ground-Based Observations and Validated by Aircraft In Situ Measurements Over the Azores, J. Geophys. Res.-Atmos., 125, e2019JD032205, https://doi.org/10.1029/2019JD032205, 2020.
Xie, S. C., Cederwall, R. T., and Zhang, M. H.: Developing long-term single-column model/cloud system-resolving model forcing data using numerical weather prediction products constrained by surface and top of the atmosphere observations, J. Geophys. Res.-Atmos., 109, D01104, https://doi.org/10.1029/2003jd004045, 2004.
Yeager, S. G., Danabasoglu, G., Rosenbloom, N. A., Strand, W., Bates, S. C., Meehl, G. A., Karspeck, A. R., Lindsay, K., Long, M. C., Teng, H., and Lovenduski, N. S.: Predicting Near-Term Changes in the Earth System: A Large Ensemble of Initialized Decadal Prediction Simulations Using the Community Earth System Model, B. Am. Meteorol. Soc., 99, 1867–1886, https://doi.org/10.1175/BAMS-D-17-0098.1, 2018.
Zawadowicz, M. A., Suski, K., Liu, J., Pekour, M., Fast, J., Mei, F., Sedlacek, A. J., Springston, S., Wang, Y., Zaveri, R. A., Wood, R., Wang, J., and Shilling, J. E.: Aircraft measurements of aerosol and trace gas chemistry in the eastern North Atlantic, Atmos. Chem. Phys., 21, 7983-8002, https://doi.org/10.5194/acp-21-7983-2021, 2021.
Zhang, G. J. and McFarlane, N. A.: Sensitivity of climate simulations to the parameterization of cumulus convection in the Canadian climate centre general circulation model, Atmos. Ocean, 33, 407–446, https://doi.org/10.1080/07055900.1995.9649539, 1995.
Zhang, Z., Song, H., Ma, P.-L., Larson, V. E., Wang, M., Dong, X., and Wang, J.: Subgrid variations of the cloud water and droplet number concentration over the tropical ocean: satellite observations and implications for warm rain simulations in climate models, Atmos. Chem. Phys., 19, 1077–1096, https://doi.org/10.5194/acp-19-1077-2019, 2019.
Zhao, L., Wang, Y., Zhao, C., Dong, X., and Yung, Y. L.: Compensating Errors in Cloud Radiative and Physical Properties over the Southern Ocean in the CMIP6 Climate Models, Adv. Atmos. Sci., 39, 2156–2171, https://doi.org/10.1007/s00376-022-2036-z, 2022.
Zhao, X., Liu, X., Phillips, V. T. J., and Patade, S.: Impacts of secondary ice production on Arctic mixed-phase clouds based on ARM observations and CAM6 single-column model simulations, Atmos. Chem. Phys., 21, 5685–5703, https://doi.org/10.5194/acp-21-5685-2021, 2021.
Zheng, X., Xi, B., Dong, X., Wu, P., Logan, T., and Wang, Y.: Environmental effects on aerosol–cloud interaction in non-precipitating marine boundary layer (MBL) clouds over the eastern North Atlantic, Atmos. Chem. Phys., 22, 335–354, https://doi.org/10.5194/acp-22-335-2022, 2022a.
Zheng, X., Dong, X., Ward, D. M., Xi, B., Wu, P., and Wang, Y.: Aerosol-Cloud-Precipitation Interactions in a Closed-cell and Non-homogenous MBL Stratocumulus Cloud, Adv. Atmos. Sci., 39, 2107–2123, https://doi.org/10.1007/s00376-022-2013-6, 2022b.
- Abstract
- Motivation and background
- Methodology
- Evaluation of SCAM using ACE-ENA observations
- Impacts of new observation-constrained warm-rain parameterizations
- Assessing aerosol indirect effects under the single-column frameworks
- Conclusion and discussion
- Code availability
- Data availability
- Author contributions
- Competing interests
- Disclaimer
- Special issue statement
- Acknowledgements
- Financial support
- Review statement
- References
- Supplement