the Creative Commons Attribution 4.0 License.
the Creative Commons Attribution 4.0 License.
 | 25 Jul 2023
Air quality and related health impact in the UNECE region: source attribution and scenario analysis
Claudio A. Belis
Rita Van Dingenen
The TM5-FAst Scenario Screening Tool (TM5-FASST) was used to study the influence of abatement policies within and outside the United Nations Economic Commission for Europe (UNECE) region on the exposure to O3 and PM2.5 and associated mortality in the UNECE countries. To that end, the impacts of pollutants derived from different geographic areas and activity sectors were evaluated using ECLIPSE V6b scenarios of air pollutant and greenhouse gas (GHG) emission reduction. The mortalities were attributed to O3 and PM2.5 following the Global Burden of Disease (GBD) approach and allocated to geographic areas (UNECE and non-UNECE) and activity sectors, including natural sources. In addition, a combination of runs designed for the purpose led to allocating exposure to O3 and related mortality to two families of precursors: NOx–VOC and CH4. In this study, the baseline scenario (current legislation scenario, CLE), which assumes that all air quality and greenhouse gas abatement measures adopted by 2018 are fully implemented, is compared with more ambitious scenarios (maximum feasible reduction, MFR). The findings from this comparison indicate that O3 exposure within the UNECE area is more sensitive to measures outside the UNECE region than PM2.5 exposure, even though the latter leads to higher mortality than the former. In the CLE, the mortality associated with O3 exposure in the UNECE region grows steadily from 2020 to 2050. The upward trend is mainly associated with the growing impact of CH4 emissions from areas outside UNECE. Also, the mortality related to NOx–VOC emissions outside UNECE increases in the same period. By comparison, a measurable decrease (13 %) is observed in the mortality attributable to NOx–VOC emissions within UNECE. In the same time window, the mortality associated with PM2.5 exposure in the UNECE region decreases between 2020 and 2040 and then rises until 2050. The PM2.5-related mortality in UNECE is mainly due to anthropogenic emissions within this region followed by natural sources (sea salt and dust) mainly located outside the UNECE region. Between 2020 and 2050, the impact of some UNECE anthropogenic sources on PM2.5-related mortality decreases progressively, in particular road transport, energy production and domestic combustion, while others, namely agriculture and industry, show an upward trend. Finally, the analysis of MFR scenarios confirms that abatement measures in line with UN Sustainable Development Goals (SDGs) and the Paris Agreement can lead to significant co-benefits between air quality and climate policies.
- Article
(2475 KB) - Full-text XML
-
Supplement
(1497 KB) - BibTeX
- EndNote


In 2019, 6.67 million deaths globally (equivalent to 12 % of the total deaths) were attributed to air pollution exposure, mainly due to fine particles and ozone (HEI, 2020). Air pollution is the main environmental risk of premature death worldwide. However, the gap between low- and medium-income countries (LMIC) and high-income countries (HIC) has widened since the beginning of this century due to the increasing trend of PM2.5-related mortality in the former (Burnett and Cohen, 2020).
The Convention on Long-Range Transport of Air Pollution (also known as “the Air Convention”) of the United Nations Economic Commission for Europe (UNECE) was adopted in 1979 and at present has 56 member states1, including the EU since 1982. It has eight protocols, four of which are active. The Gothenburg Protocol to abate acidification, eutrophication and ground-level ozone is under review and an evaluation is in progress to assess the adequacy of its obligations and provisions. One of the aspects under evaluation is the future trend for improvements in air quality, human health and ecosystem impacts linked to methane (CH4) emissions. Ground-level ozone (O3) concentrations in most of the UNECE region countries are also influenced by other factors in addition to the regional ozone precursors: e.g. climatic parameters, hemispheric transport and global CH4 emissions (Butler et al., 2020). Global background levels of O3, PM2.5 and their precursors, including CH4 emissions, contribute significantly to air pollution within the UNECE region, with impacts on public health, ecosystems and biodiversity (Jonson et al., 2018; Lefohn et al., 2018). Projected trends in anthropogenic CH4 emissions span a very wide range, depending on assumptions made about economic development and the use of emission control technology (Revell et al., 2015; Turnock et al., 2018).
The Air Convention protocols have contributed to reducing air pollution in UNECE countries. However, it is becoming more and more relevant to evaluate which pollutant levels are most affected/controlled by long-range transport of emissions outside the UNECE area and to which extent new air quality guidelines can be achieved through emission reductions within UNECE only. This study aims to investigate the extent to which the abatement policies within the UNECE region and those in the rest of the world (ROW) influence the exposure to O3, PM2.5 and their associated mortality in the UNECE countries. To that end, the impacts of pollutants derived from different geographic areas and activity sources that contribute to mortality related to air quality in the UNECE region are analysed under different abatement scenarios of air pollutants and greenhouse gas (GHG) emissions. The emphasis is on quantifying the achievable benefits by analysing the gap between scenarios with different levels of ambition and the baseline. In particular, one of the maximum feasible reduction (MFR) scenarios (MFR BASE) is mainly driven by technological development connected to air pollutant emissions combined with a basic set of climate-oriented policies (national determined contributions), while the other scenario (MFR sustainable development scenario, MFR-SDS) is an archetype of the potentially achievable reductions by implementing the UN Sustainable Development Goals (SDGs) related to energy combined with ambitious climate-oriented policies.
2.1 Exposure and health impact assessment
The TM5-FAst Scenario Screening Tool (TM5-FASST) is a reduced-form air quality model based on linearized emission-concentration response sensitivities (also called source–receptor coefficients). The emission-concentration responses to regional emission changes were pre-computed at a 1∘ × 1∘ grid resolution with the full chemical transport model (CTM) TM5 (Krol et al., 2005) for 56 continental source regions, as well as for international shipping and aviation, for an emission reduction of 20 % in each of the relevant pollutant precursors (SO2, NOx, NH3, BC, OC, NMVOC) and for each individual source region. The resulting deviation relative to the unperturbed case in ground-level pollutant concentrations is assumed to scale linearly with the emission deviation relative to the unperturbed case. More details are given in the Supplement.
The TM5-FASST model bypasses CPU-expensive explicit chemical and physical process computations, at the cost of accuracy, as documented by Van Dingenen et al. (2018). It is worth mentioning that the model addresses impacts of anthropogenic emissions under constant meteorological conditions (year 2001), and therefore does not consider feedbacks of climate on photolysis rates, precursor residence times and deposition rates etc. This also implies that natural emissions of volatile organic components (including natural CH4), NOx, as well as natural PM2.5, are treated as fixed, constant contributions. Still, without claiming to be quantitatively equivalent to a full CTM, the model captures major features and implications of emission trends and has proven to be a useful screening tool in science–policy analysis (Van Dingenen et al., 2018).
A great advantage of a source–receptor model is that it keeps track of the contribution of each of the 56 + 2 source regions, as well as each individual precursor, to each receptor grid cell of the global domain, under the first-order assumption that all contributions can be added up linearly. This makes the model particularly useful for source attribution studies, which can be applied with a large degree of flexibility in the definition of the receptor regions, the latter being a customizable aggregation of grid cells. In this study, we consider as receptor region the UNECE domain, and we explore contributions of pollutant emissions outside and inside the UNECE region. Further detail in the attribution studies is obtained by breaking down the emissions by anthropogenic sector.
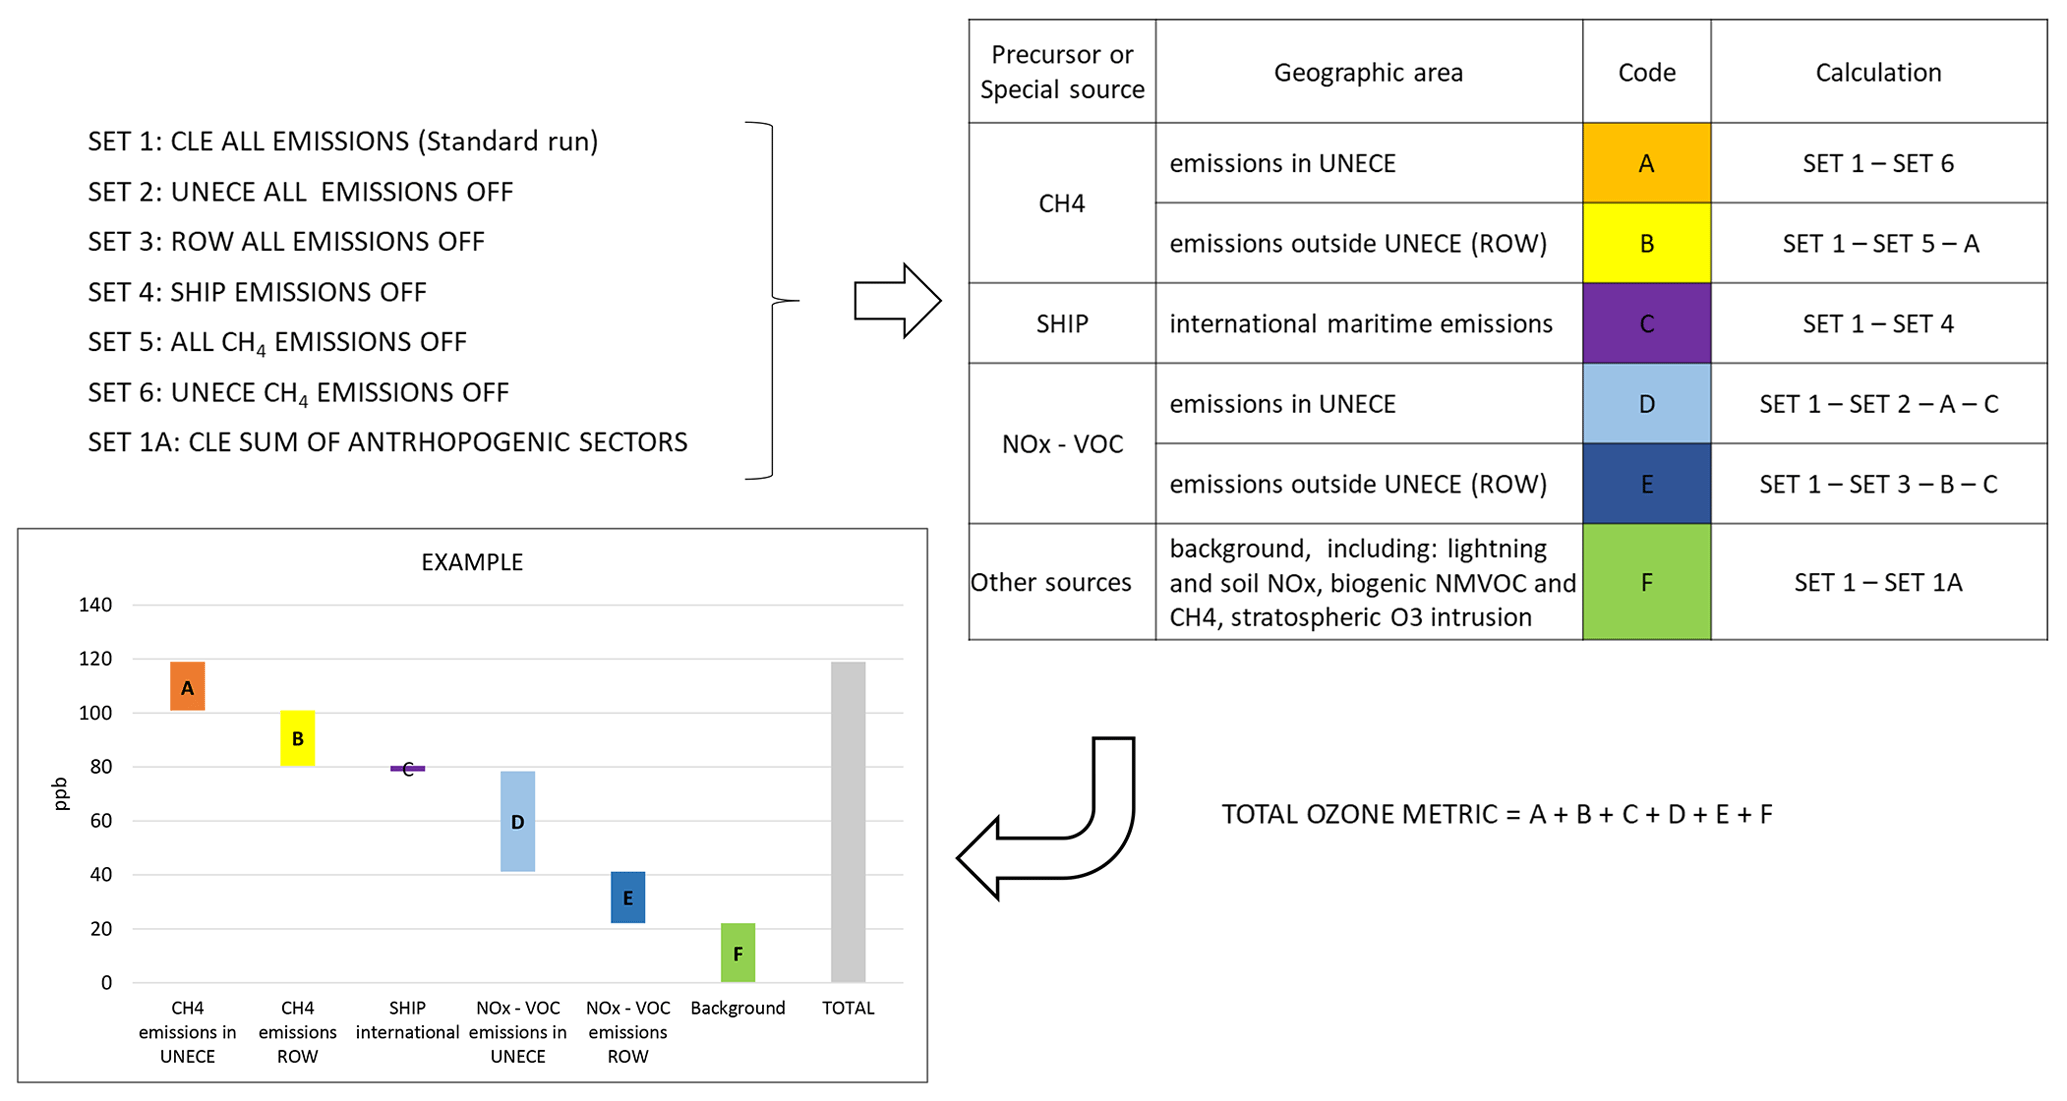
Figure 1Approach adopted to split O3 concentrations by emission area (UNECE and non-UNECE (ROW)) and by precursor (NOx–VOC and CH4).
Health-relevant exposure metrics considered in the present study are the population-weighted PM2.5 concentrations (as the sum of sulfate, nitrate, ammonium and primary PM2.5) and the seasonal daily maximum 8 h ozone average (SDMA8h). We apply a sub-grid correction to account for the spatial correlation between population density and primary PM2.5 associated with transport and household emissions, leading to a higher estimated exposure than the value based on a uniform PM2.5 distribution across the 1∘ × 1∘ grid. This is relevant where strong population gradients occur within a single grid (Van Dingenen et al., 2018). Details of the applied parameterization are given in the Supplement.
The mortality associated with exposure to outdoor pollutants is estimated according to the Global Burden of Disease (GBD) approach (Stanaway et al., 2018). The methodology to estimate the health impacts of air quality is given in the Supplement. A complete description and validation of the TM5-FASST model is provided in Van Dingenen et al. (2018), Sampedro et al. (2022) and Belis et al. (2022).
2.2 Sources
The contributions (or impacts) from anthropogenic sectors and natural emissions to PM2.5 and O3 exposure metrics in the UNECE region are estimated by the so-called brute-force or emission reduction impact approach (Belis et al., 2020, 2021). The impact of the following anthropogenic activity sectors (11) was quantified: agriculture (AGR), agricultural waste burning (AWB), domestic and commercial combustion (DOM), energy production (ENE), industry (IND), use of solvents (SLV), road transport (TRA), gas flaring (FLR), waste management (WST), open biomass burning (BMB) and maritime (SHP). Historical fire emissions were added from van Marle et al. (2017) and projections from the harmonized CMIP6 SSP2 scenario (Feng et al., 2020), including large-scale biomass burning and savannah burning and excluding AWB emissions to avoid double counting with the ECLIPSE V6b emissions. The resulting anthropogenic PM2.5 concentration fields are overlaid with fixed natural PM2.5 sources – dust (DUST) and sea salt (SS) – taken as the average of the CAMS reanalysis for the years 2000 to 2008 (https://www.ecmwf.int/en/forecasts/dataset/cams-global-reanalysis, last access: 18 July 2023). For O3, the above-mentioned sectoral attribution was complemented with runs separating the impact of NOx–NMVOC (hereon NOx–VOC) and CH4 precursor emissions from (1) UNECE (continental, anthropogenic), (2) ROW (rest of the world: non-UNECE continental, anthropogenic), (3) international shipping (hereon maritime) and (4) other sources, according to the scheme described in Fig. 1.
The standard simulations (set 1) include the emissions in each of the three ECLIPSE V6b scenarios as described in Sect. 2.3 (CLE, MFR BASE, MFR-SDS). In addition, a series of perturbations (sets 2 to 6) were computed in which the emissions of specific O3 precursors (either NOx–VOC or CH4) were reduced worldwide or in specific areas (either UNECE or rest of the world) for each of the above-mentioned scenarios. A total of 18 simulations were computed: 1 for each of the 3 scenarios in each of the 6 sets. Subsequently, sets 1 to 6 were conveniently subtracted as described in Fig. 1 (right) to split the contributions/impacts of UNECE countries from those of the rest of the world and allocate O3 to its two families of precursors: NOx–VOC or CH4. International maritime emissions are allocated into a stand-alone category as they are not attributed to any geographic area (UNECE nor ROW). The category “other sources” includes emissions not allocated to any specific area nor precursor (e.g. lightning and soil NOx, biogenic NMVOC and CH4, stratospheric O3 intrusion). In the analysis of the results, the apportionment by region and precursor described here was combined with the information about anthropogenic sources described at the beginning of this section.
In Appendix A, the PM2.5 and O3 source apportionment presented in this study is compared with similar studies in the literature.
The obtained shares for the PM2.5 and O3 exposure metrics are converted to total mortalities according to
where EXPOSURE METRICtotal is the sum of all individual sources (x) shares (Belis and Van Dingenen, 2023).
2.3 Scenarios
This study evaluates a set of scenarios (Appendix A, Table A1) derived from the ECLIPSE dataset version 6b (Amann et al., 2011; Klimont et al., 2017) developed using the GAINS model (IIASA, 2022). To assess different levels of ambition in the abatement policies from 2020 onwards, the CLE is compared with two maximum feasible reduction (MFR) scenarios: MFR BASE and MFR-SDS (Appendix A, Table A1). For every macro-sector (e.g. energy, transport, industry), each scenario combines a set of cross-cutting measures with others specific for each region of the world. The CLE and MFR BASE scenarios are based on the International Energy Agency's (IEA) New Policy Scenario (NPS; IEA, 2018) which includes measures that had been announced by 2018 and makes no assumptions about further evolution of these positions nor aims to achieving any particular outcome. The NPS includes the European Union's 2030 renewable energy and energy efficiency targets, the Chinese 3-year action plan for cleaner air, the planned revision of the Corporate Average Fuel Economy standards in the United States, as well as the announced US Affordable Clean Energy rule. Moreover, it considers Japan's revised basic energy plan and Korea's 8th National Electricity Plan. The climate policy for both CLE and MFR BASE is the same and is specific for every country as it is based on the countries' national determined contributions (NDCs) under the Paris Agreement (https://unfccc.int/process-and-meetings/the-paris-agreement/nationally-determined-contributions-ndcs, last access: 18 July 2023). Examples of cross-cutting measures in the NPS are the fuel sulfur standards of 10–15 ppm in the road transport sector, a global cap of 0.5 % on sulfur content of fuel in 2020 in the international shipping sector, and the improvement of fuel efficiency by 2 % yr−1 until 2020 in the international aviation sector. The emission reduction in the MFR BASE scenario compared to the CLE is based on the introduction of best available technology (BAT) with no -cost limitations (Table A1).
Unlike the previous two, the MFR-SDS scenario is based on the IEA's Sustainable Development Scenario (SDS; IEA, 2018) which includes the main energy-related components of the Sustainable Development Goals, agreed to by 193 countries in 2015 to keep the increase of global average temperature below 2 ∘C, achieving universal access to modern energy by 2030 and dramatically reducing the premature deaths due to energy-related air pollution. Examples of cross-cutting assumptions in the SDS are the staggered introduction of CO2 prices, fossil fuel subsidies phased out by 2025 in net-importing countries and by 2035 in net-exporting countries, and the maximum sulfur content of oil products capped at 1 % for heavy fuel oil, 0.1 % for gas oil and 10 ppm for gasoline and diesel. A full description of the scenarios goes beyond the purposes of the present work. More details are available elsewhere (https://iiasa.ac.at/models-tools-data/global-emission-fields-of-air-pollutants-and-ghgs, last access: 18 July 2023; IEA, 2018; Belis et al., 2022).
In this study, the shared socio-economic pathway (SSP) gridded population projections from Jones and O'Neill (2016) were used. The SSP2 projections were associated with CLE and MFR BASE while SSP1 were used with the MFR-SDS scenario.
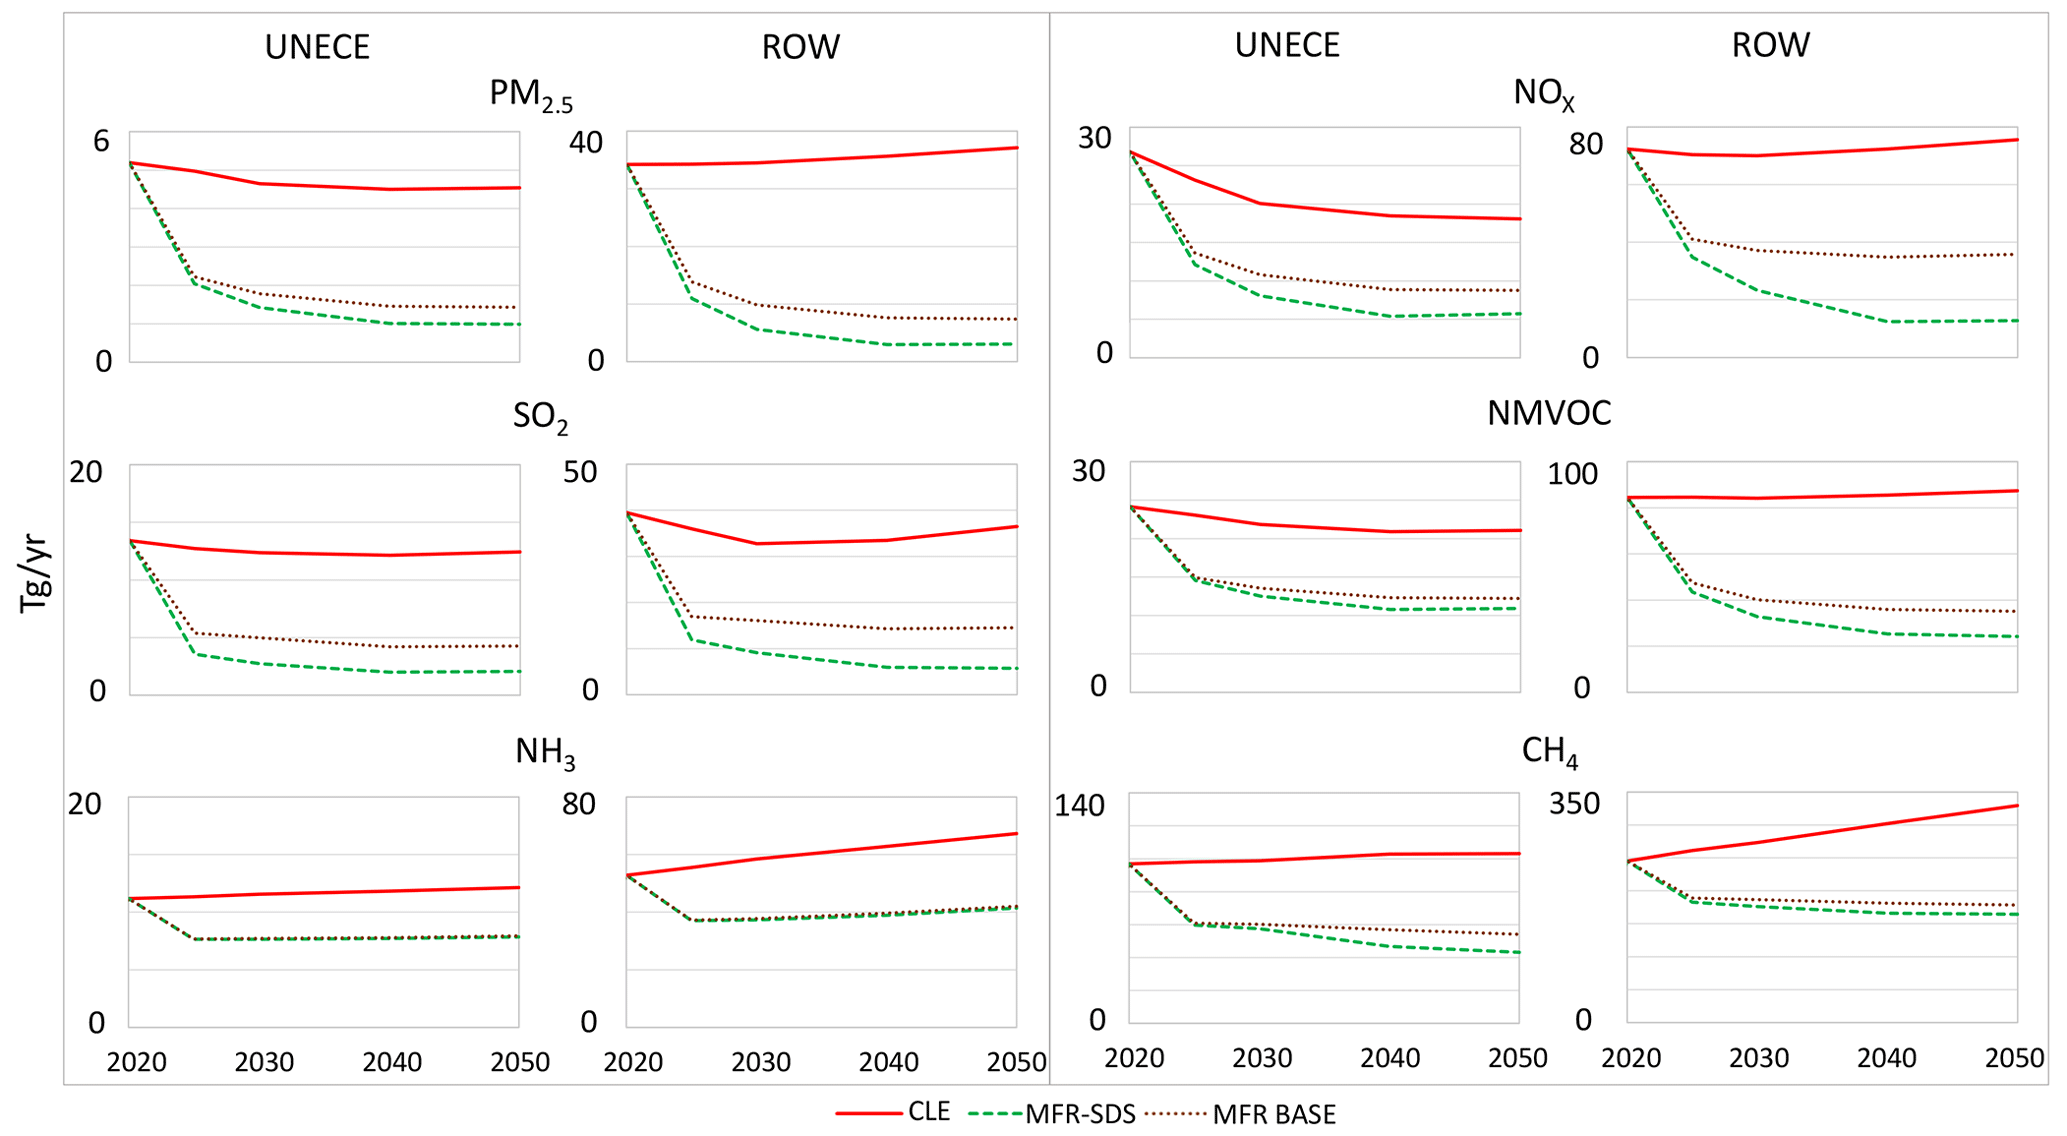
Figure 2UNECE (left) and ROW (right) emission trends of the main O3 and PM2.5 precursors in the studied ECLIPSE V6b scenarios.
3.1 Emissions
The UNECE and ROW emission trends between 2020 and 2050 of O3 and PM2.5 precursors in all the studied scenarios are shown in Fig. 2. In the CLE scenario, UNECE NOx, NMVOC and PM2.5 emissions decrease by 33 %, 13 % and 13 %, respectively, between 2020 and 2050, while in ROW, NH3 and CH4 increase by 27 % and 34 %, respectively.
In both MFR scenarios, UNECE emissions show a downward trend over the whole time window with the exception of NH3, which remains stable after an initial decrease. Moreover, in these scenarios, NH3 is the only precursor with a distinguishable upward emission trend between 2025 and 2050 in ROW while all the others show a downward trend. In MFR BASE, UNECE emissions in 2050 are between 69 % (PM2.5) and 35 % (NH3) lower than the CLE while ROW emissions are between 80 % (PM2.5) and 37 % (NH3) lower than the CLE. Despite MFR-SDS emissions following similar trends, the reductions with respect to the CLE are higher, with the exception of NH3 which is the same in both MFR scenarios.
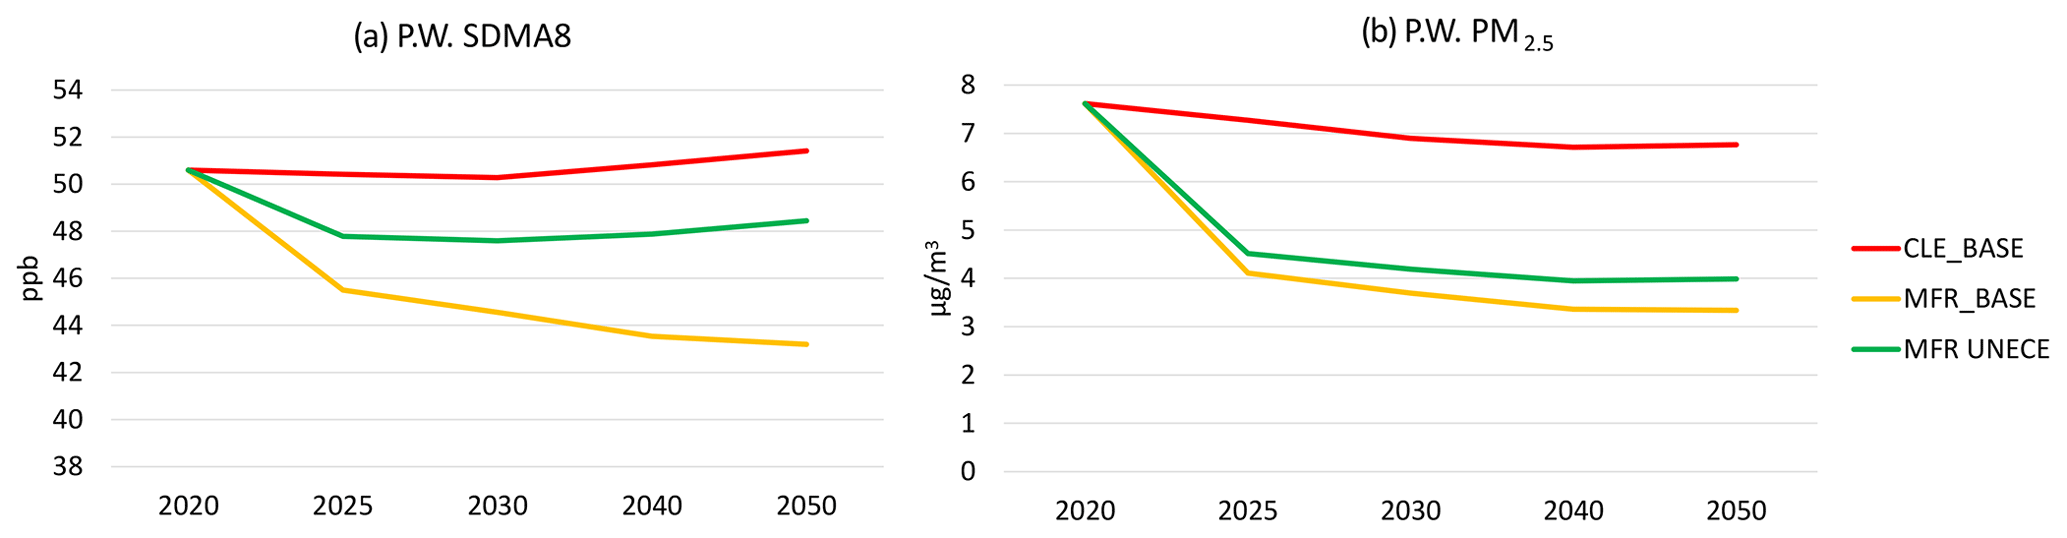
Figure 3O3 seasonal mean of 8 h (population-weighted SDMA8h, a) and anthropogenic population-weighted PM2.5 (b) annual averages in the UNECE region, average of countries, under different scenarios: CLE (current legislation), MFR BASE applied in UNECE countries only (MFR UNECE), MFR BASE in all countries (MFR BASE).
3.2 Influence of ROW on UNECE
To assess the impact of air pollutant and GHG abatement measures outside the UNECE region (rest of the world; ROW) on UNECE emission abatement policies, a regional source attribution exercise is discussed in this section. The exposure to PM2.5 (anthropogenic) and O3 in UNECE countries between 2020 and 2050 in the global baseline scenario (CLE) is compared with the MFR BASE scenario and with a scenario in which the emission reductions foreseen in the MFR BASE are applied only in the UNECE region while CLE emissions are kept in ROW (MFR UNECE scenario) (Fig. 3).
The O3 exposure in CLE (red line) and MFR UNECE (green line) shows an upward trend from 2025 onwards. The abatement benefit, i.e. the difference between the O3 exposure in CLE and MFR UNECE, over the considered time window is relatively small (5 % to 6 %), suggesting that the application of emission reductions in UNECE countries only leads to limited additional abatement in the O3 exposure in UNECE countries relative to the baseline (CLE). By comparison, the O3 exposure in MFR BASE (yellow line) follows a downward trend and the abatement benefit (delta CLE–MFR BASE) is twice as much as MFR UNECE (10 % to 16 %), indicating that the implementation of MFR worldwide would not only lead to higher abatement of exposure in UNECE but also reverse the trend from increasing to decreasing.
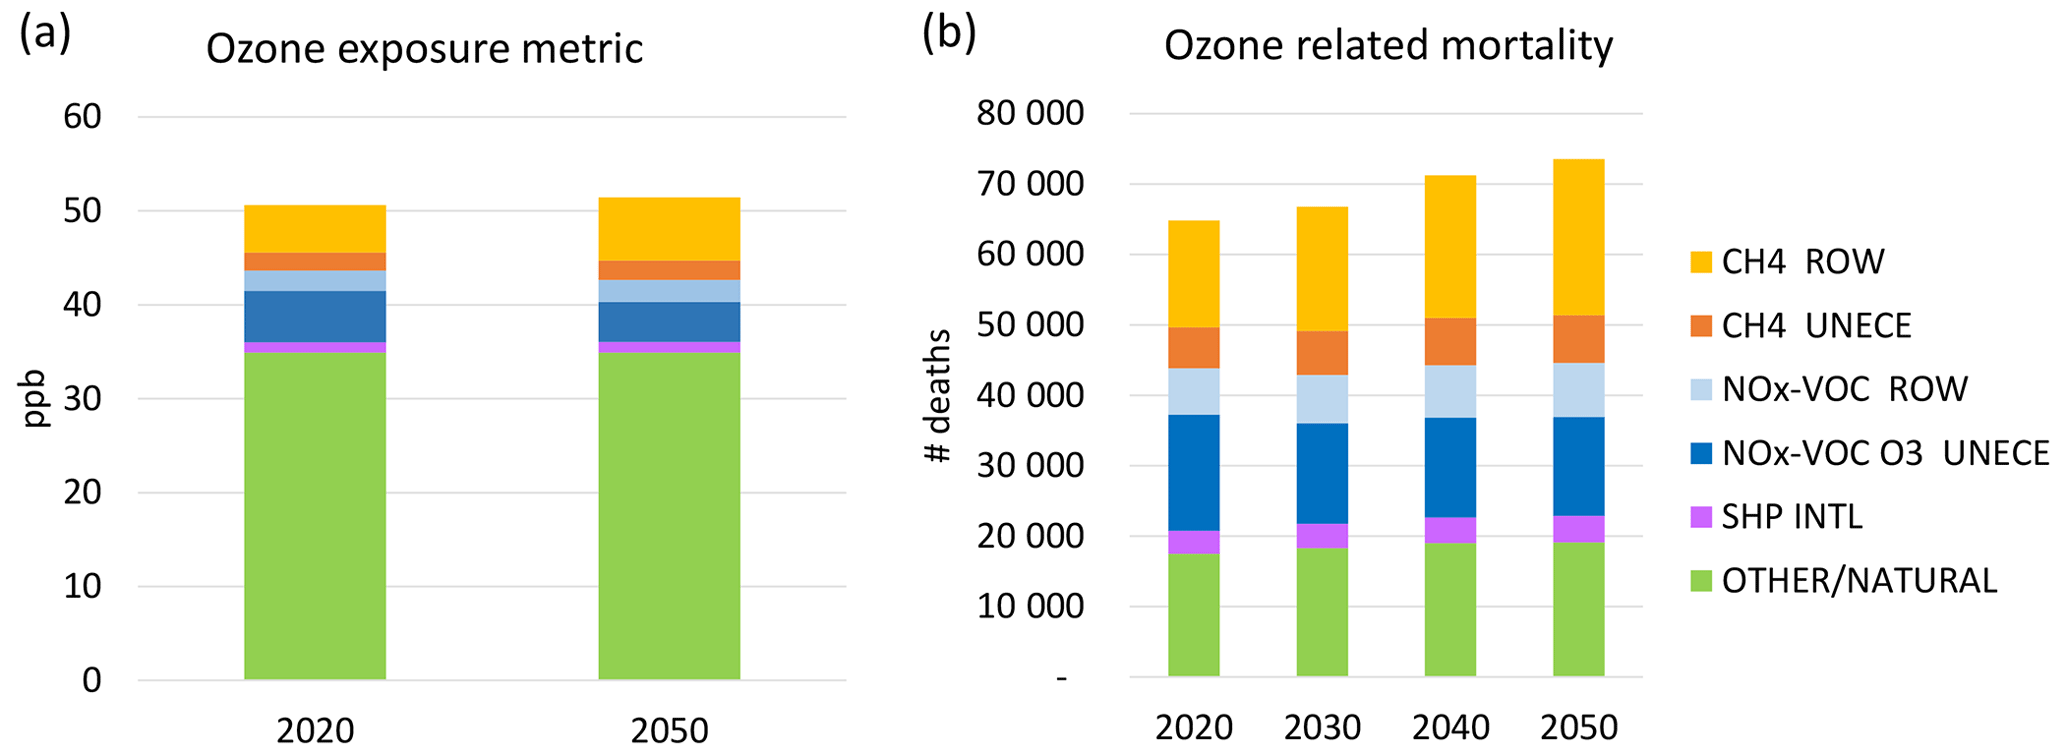
Figure 4Allocation of the population-weighted O3 (SDMA8h) exposure in UNECE to geographic source areas (UNECE, ROW), precursors and other/natural sources. Units: (a) parts per billion (ppb), (b) mortality (UNECE total) associated with O3 exposure in UNECE split by natural background (only the fraction above the exposure threshold) and anthropogenic emissions.
Unlike O3, PM2.5 exposure shows a decreasing trend for the three scenarios. The abatement benefit (CLE–MFR UNECE) over the studied period is already high (−38 % to −41 %) and applying the MFR BASE scenario globally leads to a relatively small marginal benefit (≤ 10 % of CLE). In synthesis, for PM2.5 abatement, UNECE is only slightly affected by ROW measures, while O3 levels are strongly modulated by measures taken outside the UNECE region. This is obviously related to the longer (compared to PM2.5) atmospheric lifetime of O3, formed from its short-lived precursors, NOx and NMVOC, and its long-lived precursor CH4 which contributes to the global background O3. The UNECE countries where the differences in O3 and PM2.5 exposure between MFR UNECE and MFR BASE are the highest (in the range 6 to 10 ppb and 1.5 to 2.4 µg m−3, respectively) are located at the boundary of the UNECE region and therefore more exposed to long-range pollution from the ROW (Fig. S2 in the Supplement). Some of these countries are in the Caucasus and central Asia (Armenia, Azerbaijan, Tajikistan, Kyrgyzstan and Turkmenistan) downwind, highly polluted regions (e.g. southern Asia, Far East). The highest differences between these scenarios for both pollutants are observed in Israel which is a small country surrounded by an area of non-UNECE countries with high emissions. Some countries in the Atlantic coastal area (Portugal, Spain and Ireland) present high differences in the O3 exposure between MFR UNECE and MFR BASE, likely due to the influence of air masses circulating over the sea and mostly affected by emissions in ROW. A similar situation is observed in Malta which is mostly affected by the high background levels in the Mediterranean Sea.
The attribution of O3 and PM2.5 levels to precursor emissions inside and outside the UNECE region is further investigated in the following sections.
3.3 Source allocation of ozone exposure and premature mortality in UNECE in the baseline scenario (CLE)
In this section, the O3 exposure and related mortality within UNECE is broken down by (a) precursor, (b) sector and (c) source region (UNECE versus ROW) considering only the attribution runs of the CLE scenario. The O3 background (other/natural), including biogenic and other unspecified sources (Fig. 4a), is estimated by subtracting the sum of all anthropogenic sectors from total O3 (see Sect. 2.2) and is the main single contributor to the O3 exposure. The impact of this “source” is approximately 35 ppb and remains relatively constant throughout the analysed time window (2020–2050). Despite its dominance, this component is not the main focus of the analysis since it is, by design, affected only a little by anthropogenic emissions in the short term. In the 2020–2050 time window, the anthropogenic fraction of the O3 exposure is worth 16–19 ppb.
In terms of precursors, there is a remarkable shift in the relative role of short-lived components (NOx, NMVOC) versus CH4 between 2020 and 2050 in CLE. The initial dominant role of NOx and NMVOC in anthropogenic ozone formation is replaced by CH4 towards 2050. This is due to the combined decrease of UNECE NOx and NMVOC emissions (while ROW emissions remain relatively constant) and the increase of ROW CH4 emissions (while UNECE emissions remain relatively constant). The overall O3 exposure metric is stable along the observed time window because the decreasing impact of NOx–VOC emissions from UNECE over time is largely compensated by the increasing impact of CH4 emitted in ROW.
The overall share of O3 exposure allocated to anthropogenic NOx–VOC emissions is mainly associated with transport, industry and maritime sources while the CH4 emissions affecting this pollutant are mainly emitted from agriculture, gas flaring and waste management. Energy production, another important anthropogenic source, presents similar shares of both precursor families (Fig. S3).
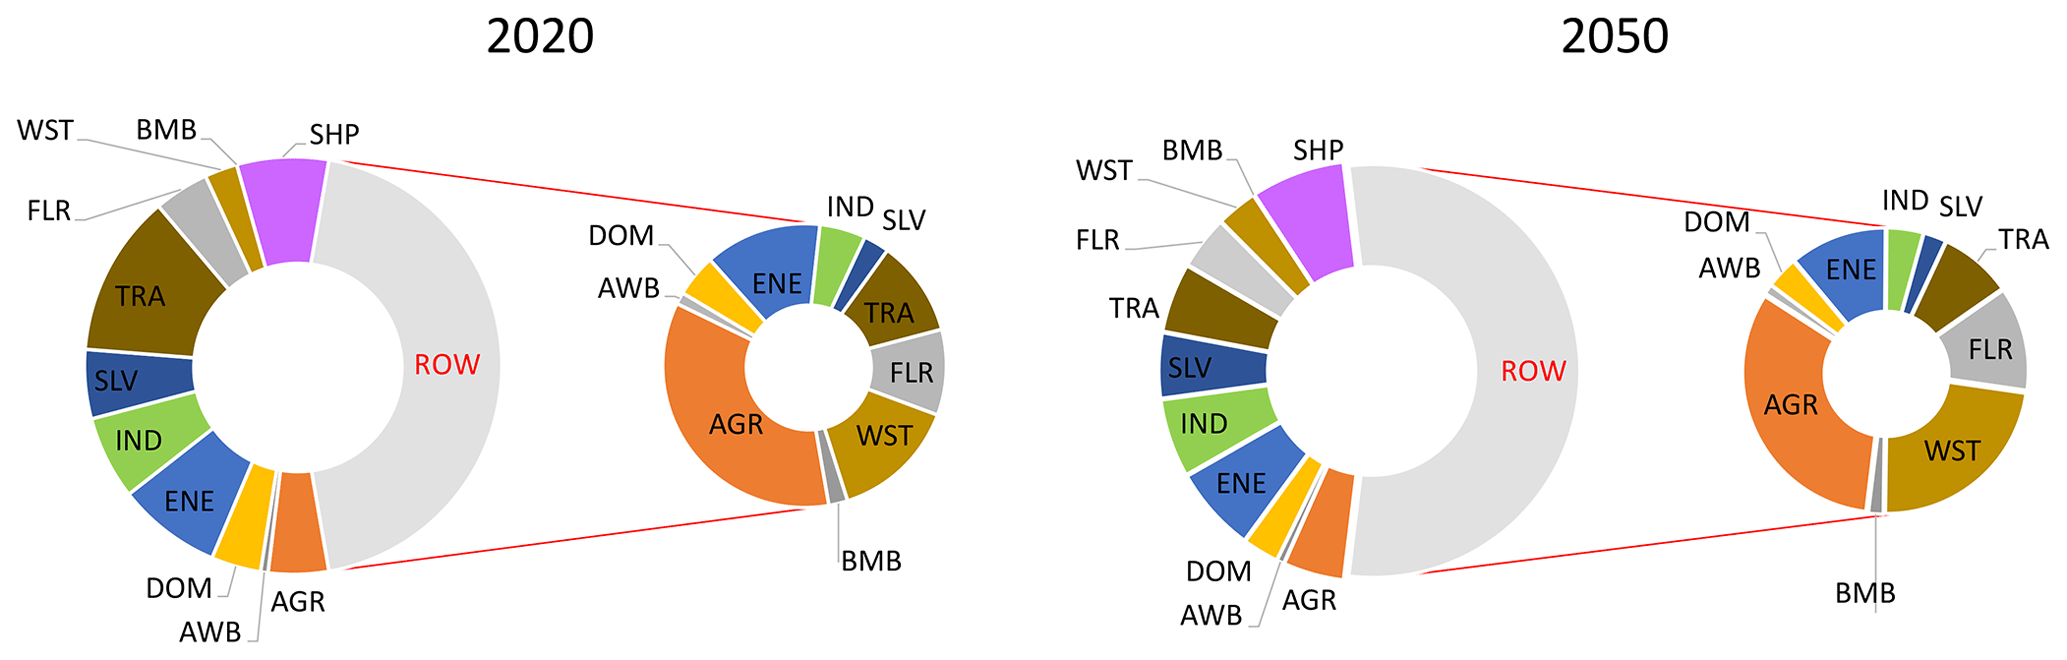
Figure 5Allocation of O3 exposure and related mortality (UNECE avg.) to anthropogenic sources under CLE. The overall impacts are represented in the main pie charts while the small pie charts to the left of them show the detail of ROW impacts only. The data are also available in Table S1 in the Supplement. AGR: agriculture, AWB: agricultural waste burning, DOM: domestic and commercial combustion, ENE: energy production, IND: industry, SLV: use of solvents, TRA: road transport, FLR: gas flaring, WST: waste management, BMB: open biomass burning and SHP: maritime.
In Fig. 4b the premature mortality associated with O3 exposure in the UNECE region estimated in the CLE is shown. The number of premature deaths grows steadily from 65 000 in 2020 to 74 000 in 2050. This upward trend in mortality is mainly associated with an increased impact of anthropogenic CH4 emissions from ROW (+46 %, +7000 deaths per year). Also the mortality related to anthropogenic NOx–VOC emissions in ROW increases by 17 % in the same period (+1000 deaths per year). On the contrary, a measurable decrease is observed in the mortality attributable to anthropogenic NOx–VOC emissions in UNECE which drops from 16 000 in 2020 to 14 000 in 2050.
The contributing sectors change their relative importance evolving from a mix dominated by transport, agriculture and energy production in 2020 to a one dominated by agriculture, waste management, transport and energy production in 2050 (Fig. 5, Table S1). Transport, industry and maritime contribute to O3 exposure only via NOx–VOC precursors while agriculture, gas flaring and waste management contribute almost only via CH4 emissions (Fig. S3).
The CH4 impact of agriculture, gas flaring, waste management and energy production emissions from ROW on O3 exposure in UNECE presents an upward trend between 2020 and 2050 (Fig. S3). In the same time window, the NOx–VOC contribution from transport, energy production and domestic emissions from UNECE show a downward trend with the exception of industry which increases slightly. Although energy production is the only source which shares of O3 exposure due to NOx–VOC and CH4 are comparable, the balance between these two components evolves along the studied time window towards an increase in the share of the latter.
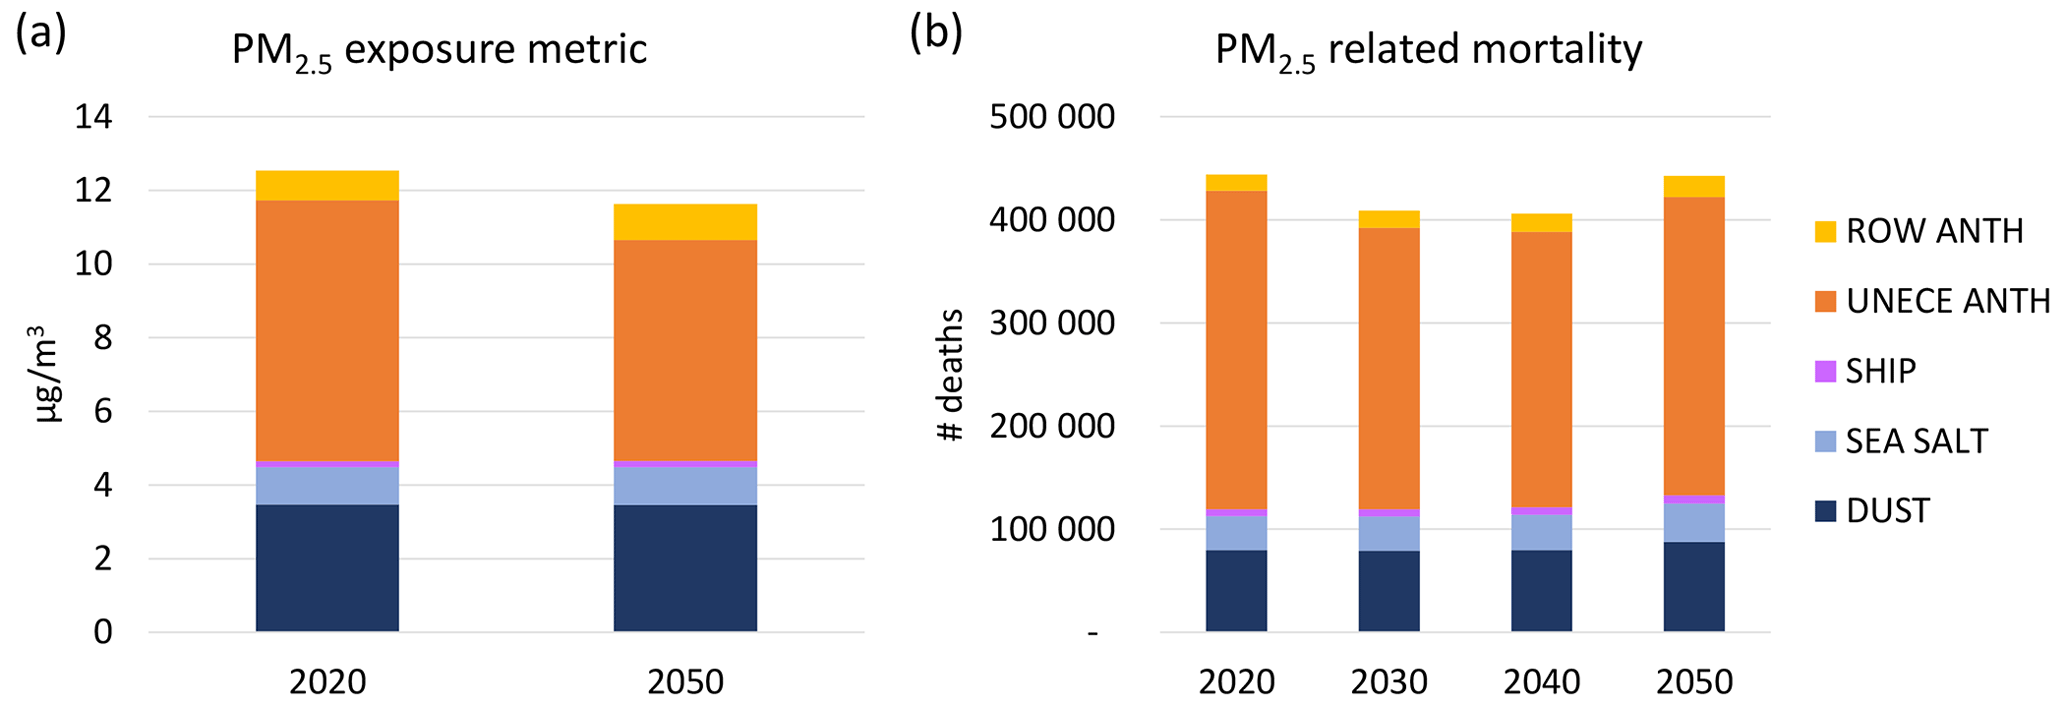
Figure 6(a) Allocation of the population weighted PM2.5 exposure in UNECE to geographic source areas (UNECE, ROW) and natural sources under CLE. (b) Mortality (UNECE average) associated with PM2.5 exposure attributable to both anthropogenic and natural sources under CLE.
3.4 Source allocation of PM2.5 exposure and premature mortality in UNECE in the baseline scenario
The UNECE anthropogenic emissions are the main responsible for PM2.5 exposure in UNECE, with a decreasing trend between 2020 and 2050, while those from ROW have a minor role which increases slightly over the observed time window (Fig. 6).
The mortality associated with PM2.5 exposure in the UNECE region (including both natural and anthropogenic sources) is 444 000 cases in 2020. It shows a downward trend between 2020 and 2030 and a subsequent rise between 2040 and 2050 when it reaches 443 000 units (Fig. 6b).
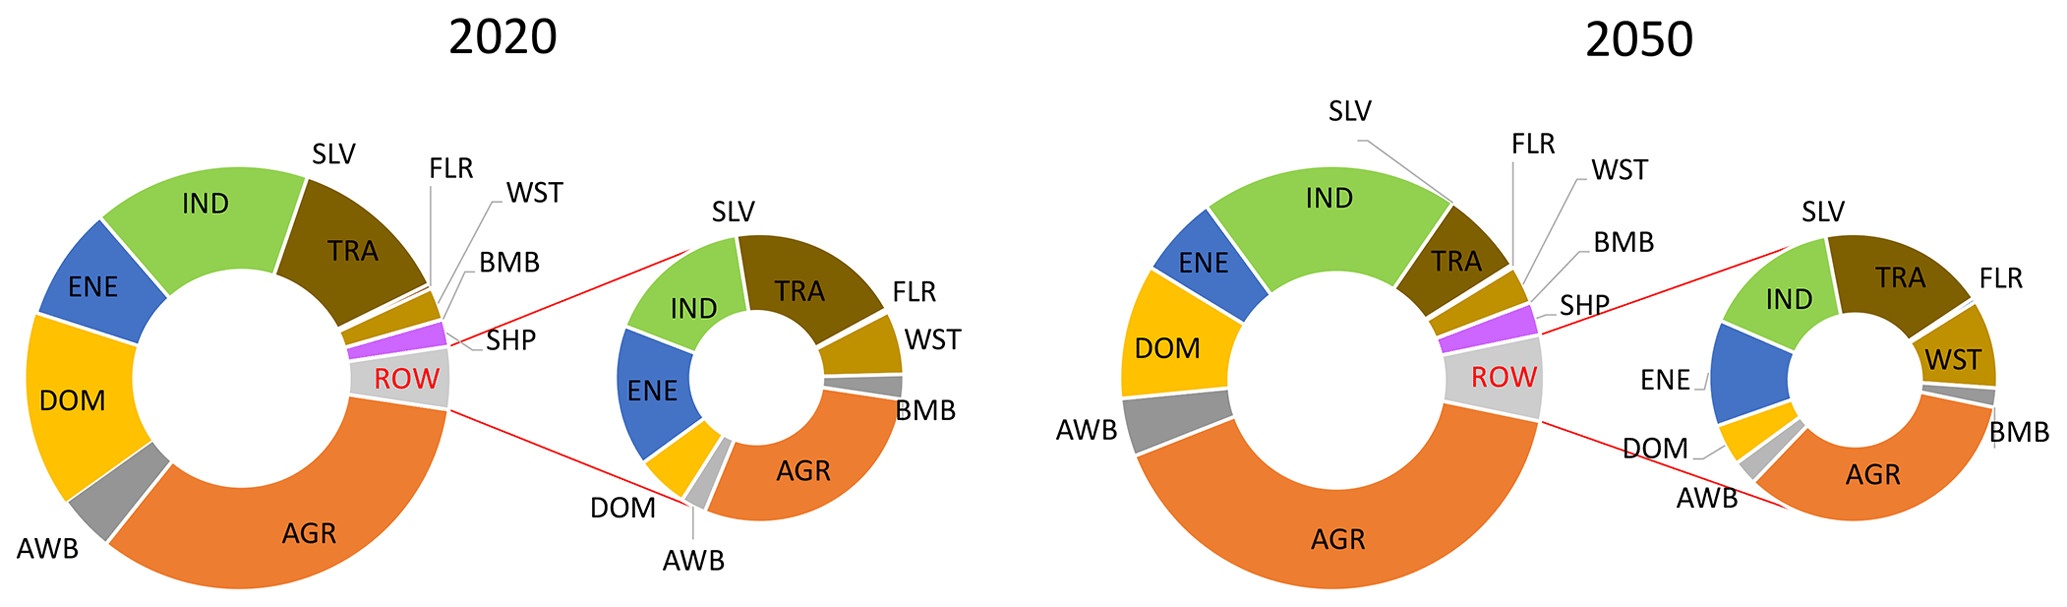
Figure 7Allocation of PM2.5 exposure and related mortality (UNECE average) to anthropogenic sources under CLE. The overall impacts are represented in the main pie charts while the small pie charts to the left of them show the detail of ROW impacts only. The data are also available in Table S2. AGR: agriculture, AWB: agricultural waste burning, DOM: domestic and commercial combustion, ENE: energy production, IND: industry, SLV: use of solvents, TRA: road transport, FLR: gas flaring, WST: waste management, BMB: open biomass burning and SHP: maritime.
The main anthropogenic contributors within UNECE are agriculture, industry, domestic, energy production and transport (Fig. 7, Table S2). An overall downward trend in the impact of domestic, energy production and transport from UNECE and an increasing role of industry and agriculture from this region are observed. The share of maritime, a contributor which is not geographically allocated in this analysis, is stable from 2020 onwards. In 2050, there is an increase in the PM2.5 exposure mainly due to a rise in the impact of agriculture, transport, gas flaring and waste management emissions from ROW, and there is an increase of agriculture and industry emissions from the UNECE region.
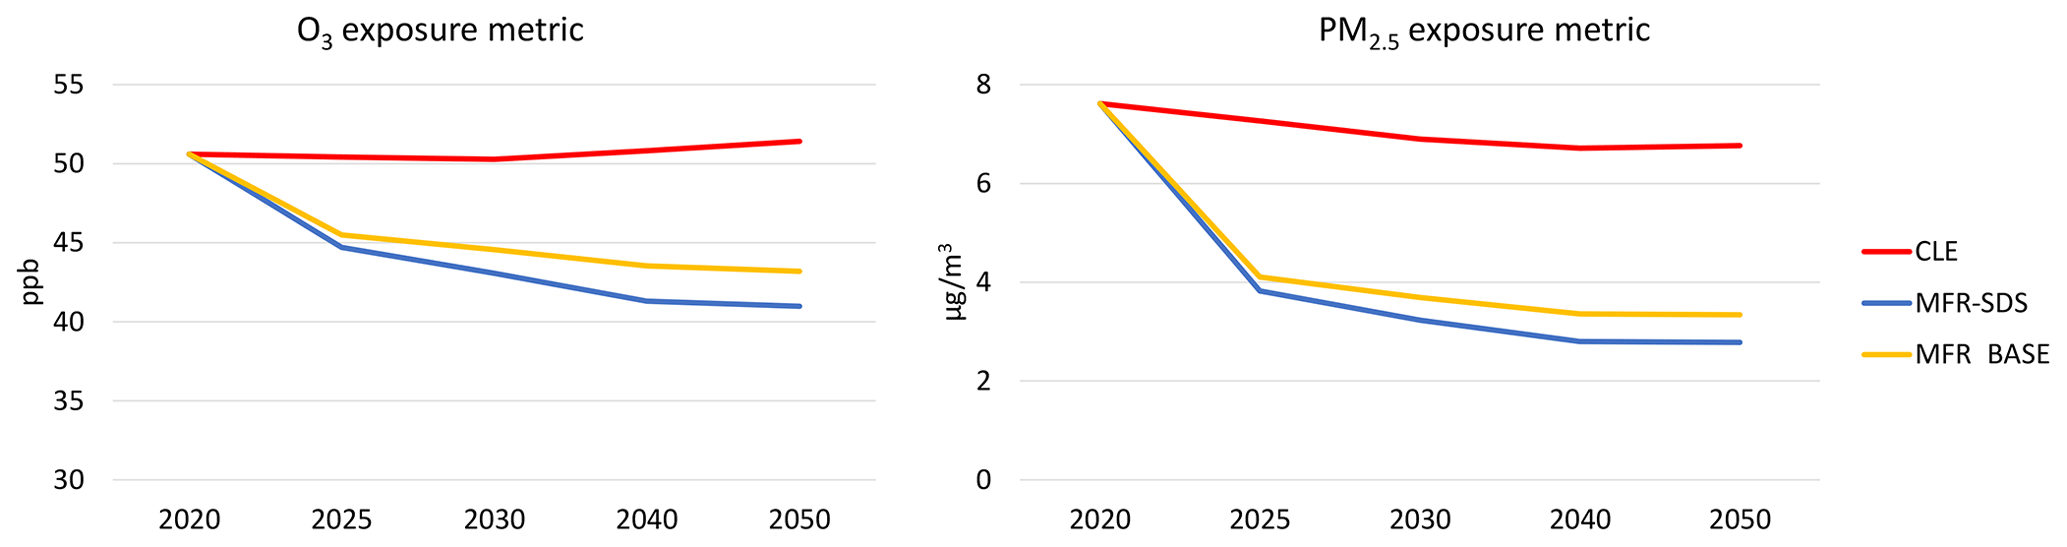
Figure 8O3 and anthropogenic PM2.5 exposure metrics (UNECE average) computed with TM5-FASST according to the ECLIPSE V 6b scenarios: CLE, MFR BASE and MFR-SDS.
3.5 Source allocation of exposure to air pollutants in UNECE in MFR scenarios
This section evaluates the trends of the O3 and PM2.5 exposure in UNECE between 2020 and 2050 computed with TM5-FASST using the ECLIPSE V6b MFR BASE and MFR-SDS emission scenarios (Table A1; Fig. 8). In 2050, the MFR BASE and MFR-SDS O3 exposure is 16 % and 20 % lower than CLE, respectively, while the PM2.5 (anthropogenic) exposure in the above-mentioned scenarios is 51 % and 59 % below CLE, respectively.
In the period 2025–2050, the main anthropogenic contributor to O3 exposure and mortality in both MFR scenarios is by far agriculture due to CH4 emissions in ROW (Fig. S4).
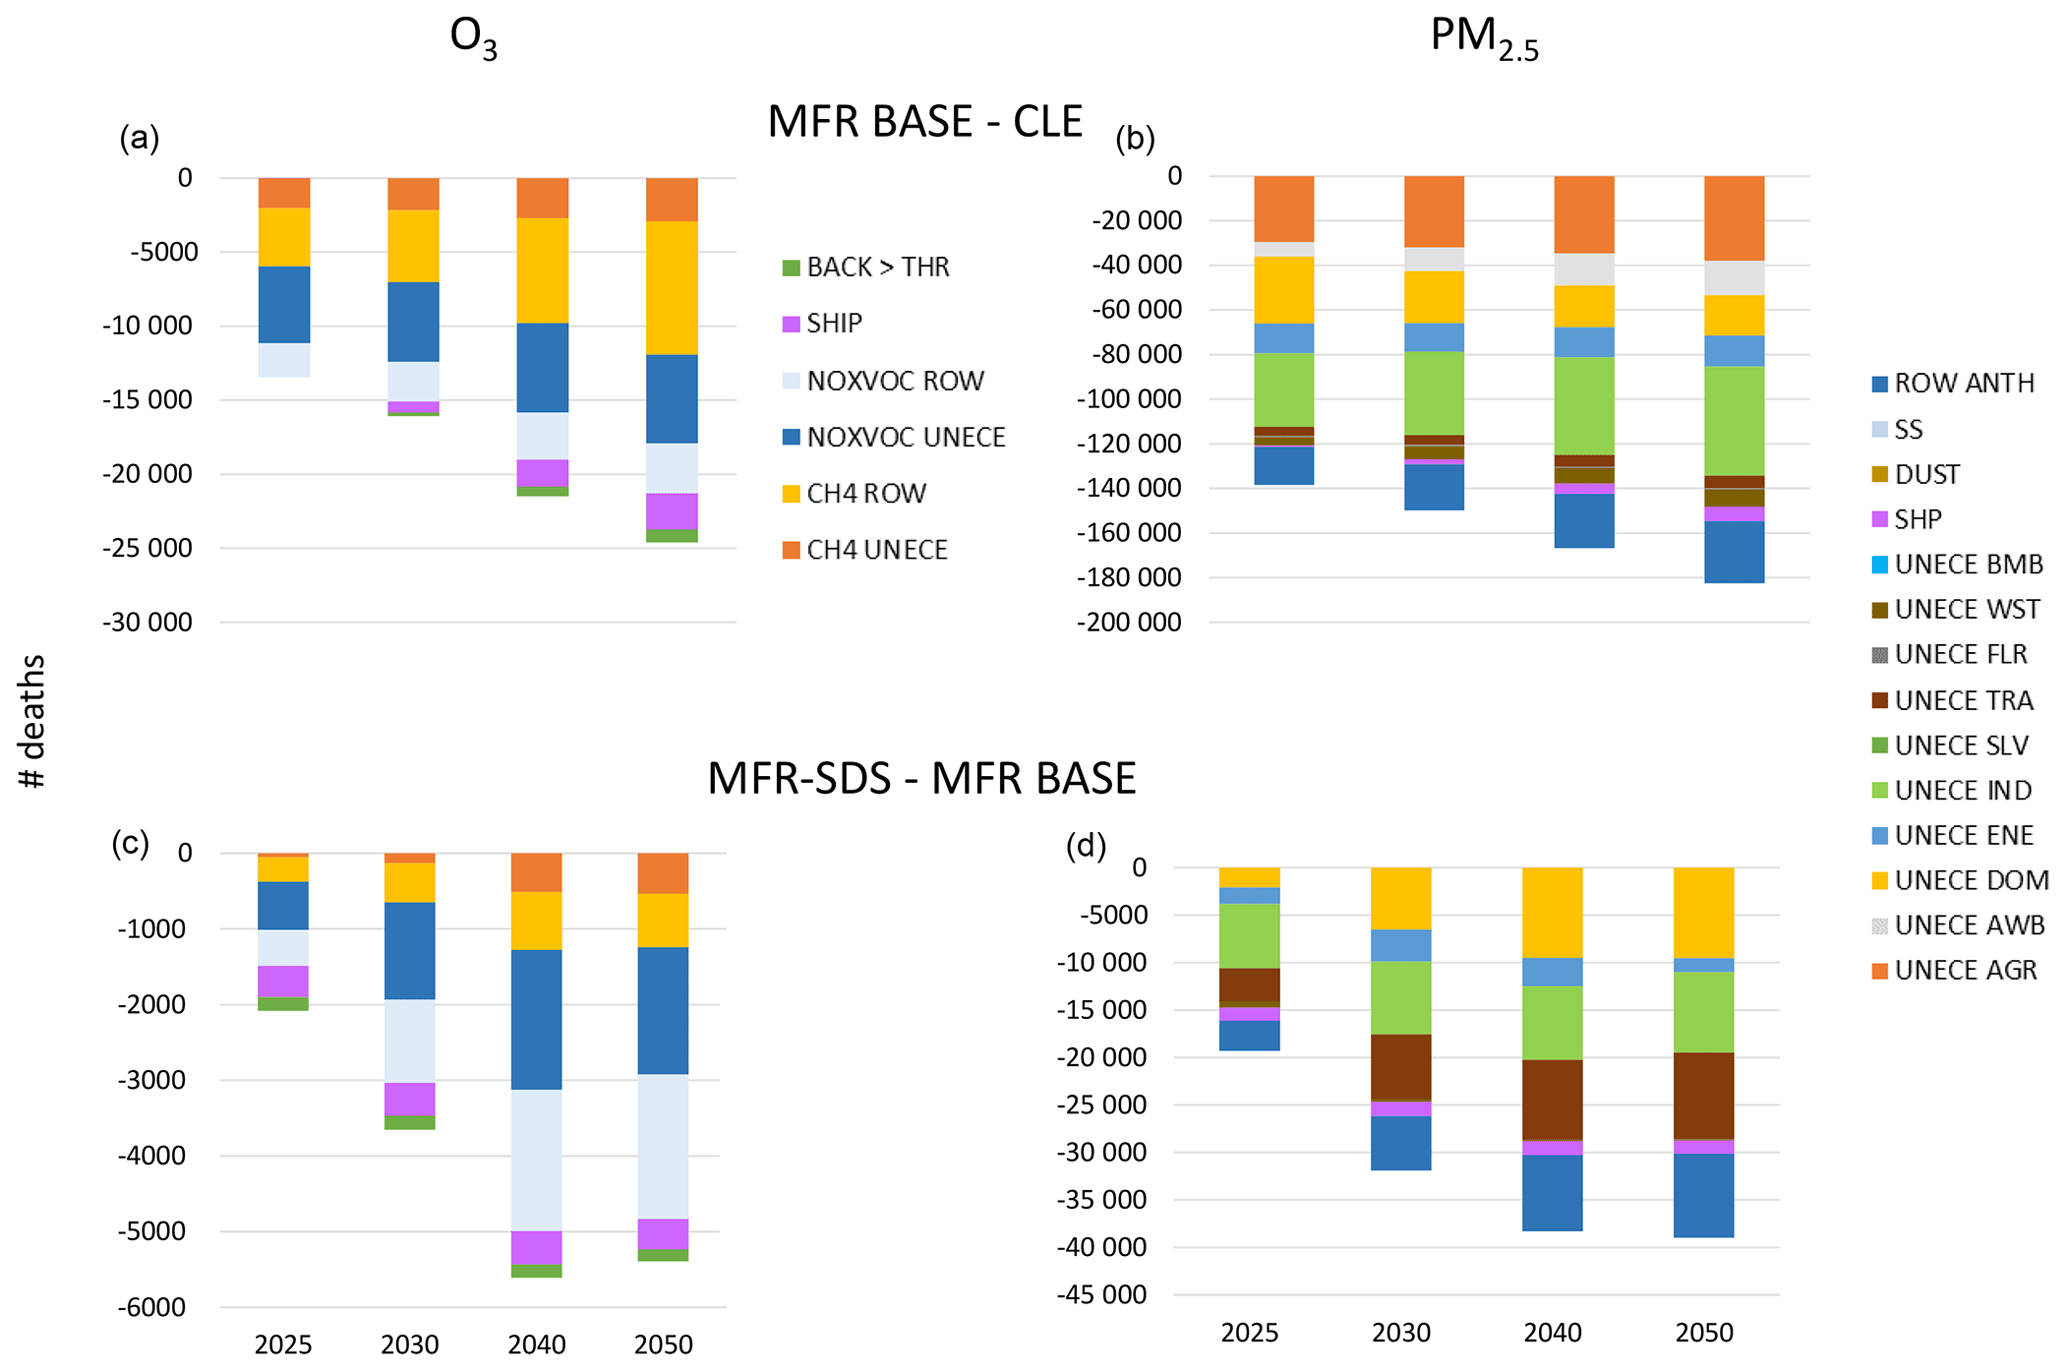
Figure 9Delta MFR BASE–CLE and MFR-SDS–MFR BASE of O3- (a, c) and PM2.5- (b, d) associated mortality (UNECE total) split by precursor and main emission areas. For O3 we only consider the fraction of “OTHER/NATURAL” exceeding the zero effect threshold of 29.1 ppb.
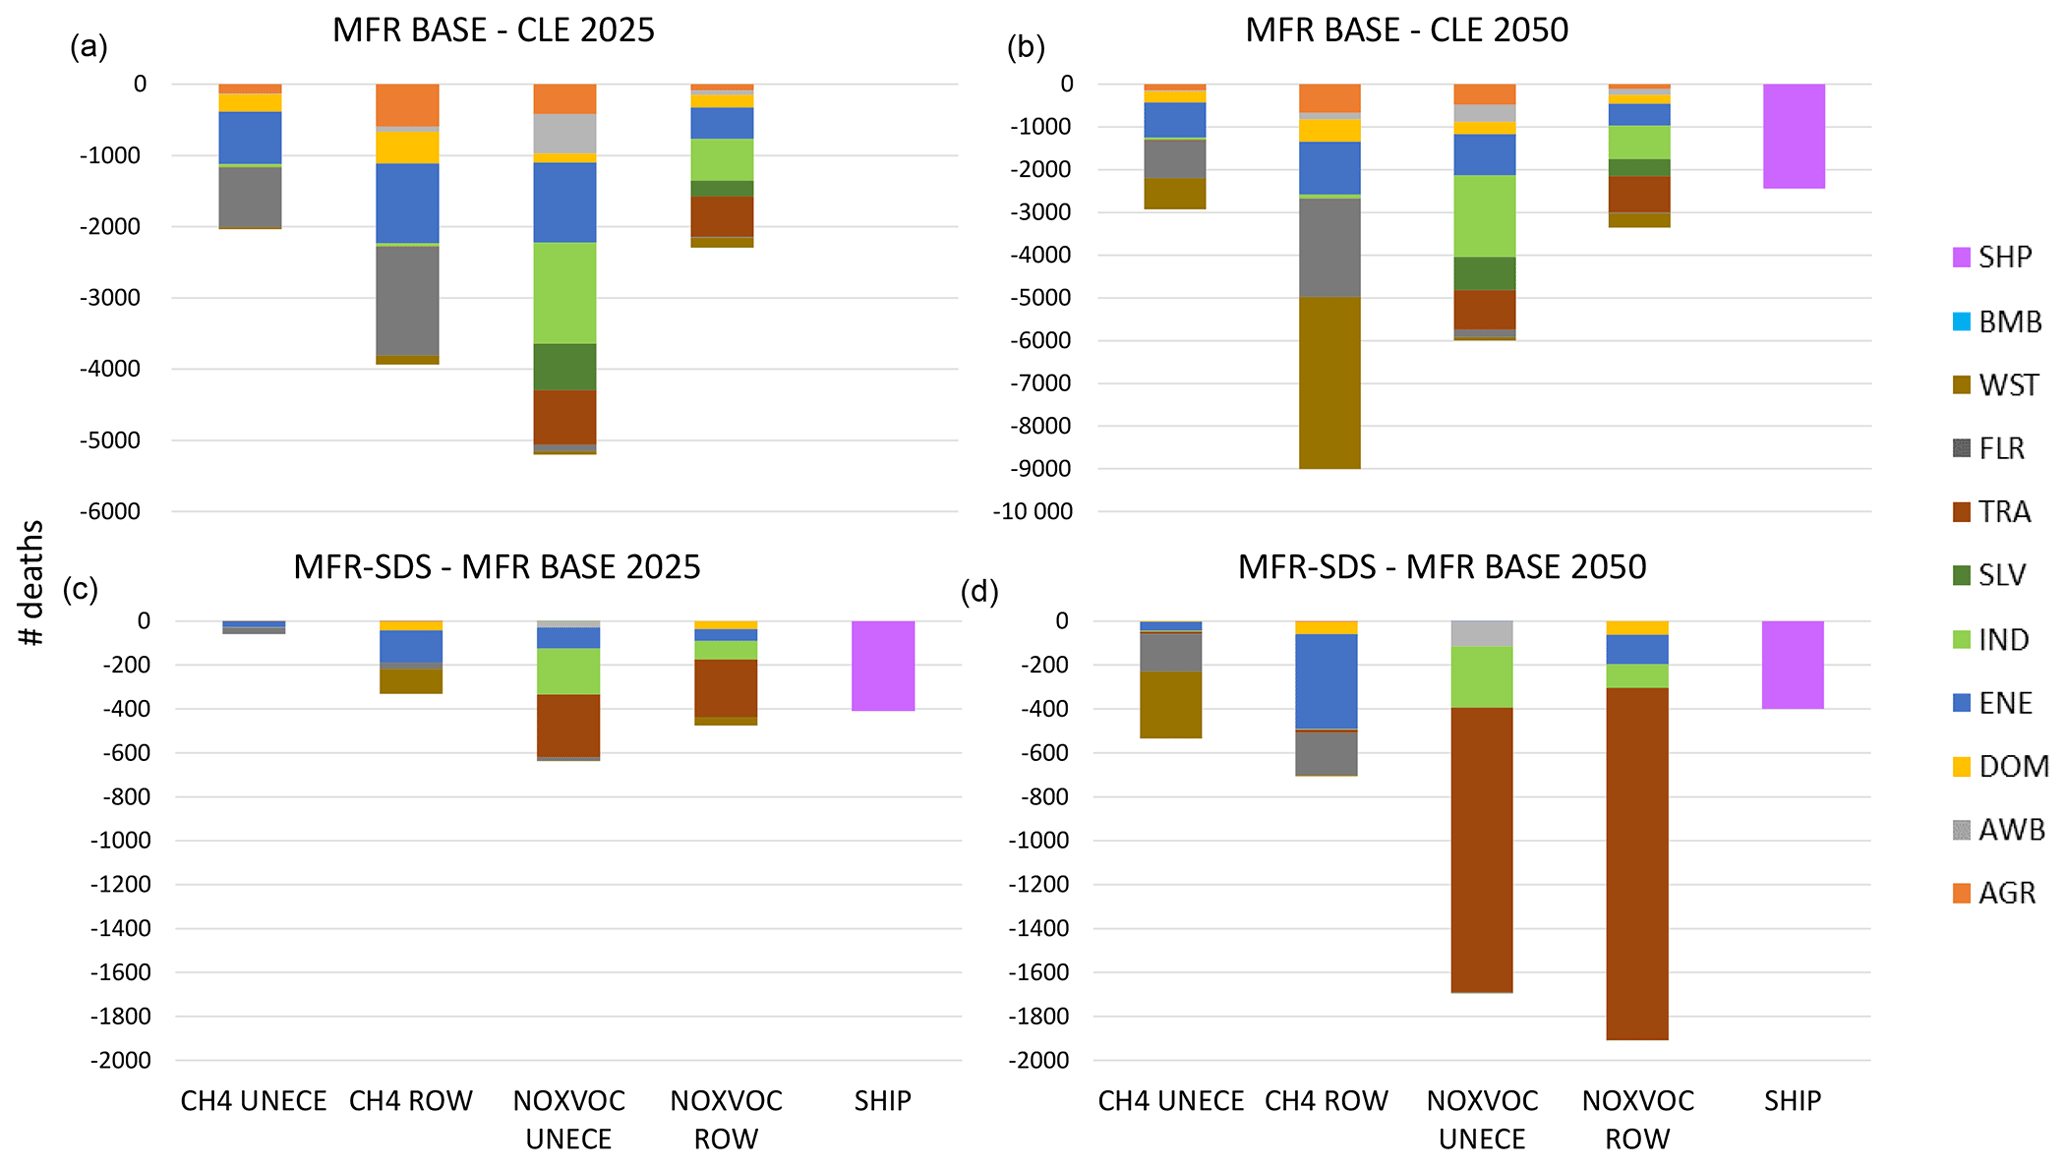
Figure 10Delta MFR BASE–CLE (a, b) and MFR-SDS–MFR BASE (c, d) of UNECE O3-associated mortality in 2025 and 2050 split by source sectors.
In the MFR BASE scenario, which is mainly based on the implementation of best available technologies (BATs) and Paris Agreement NDCs, the delta mortality in UNECE compared to CLE ranges from −13 000 cases (−21 %) in 2025 to −24 000 cases (−34 %) in 2050 due to lower O3 exposure (Fig. 9a). Such an improvement is mainly associated with NOx–VOC emission reductions in the UNECE region and reductions of CH4 in ROW, the role of which increases considerably between 2025 and 2050 (Fig. 9a). A more detailed analysis of the MFR BASE reveals that the main UNECE NOx–VOC emission reductions in 2050 are associated with energy production, industry and transport sectors. By comparison, those of CH4 in ROW are mainly due to abatement of gas flaring and energy production in 2025 with dramatic abatement increase in the waste management sector between this year and 2050 (Fig. 10a and b).
The additional improvement compared to the MFR BASE from the most ambitious MFR-SDS scenario, in line with energy related SDGs and global temperature increase containment, ranges between ca. −2000 cases (−4 %) in 2025 and −5500 (−11 %) cases in 2050, and it is mainly due to the reduction of NOx–VOC emissions in both UNECE and ROW (Fig. 9c). Such abatement of O3-related mortality in the MFR-SDS scenario is associated with emission reductions in the transport sector in 2050 in both UNECE and ROW compared to 2020 (Fig. 10c and d).
In MFR BASE, the delta mortality in UNECE due to PM2.5 exposure compared to the CLE ranges from ca. −137 000 cases (−33 %) in 2025 to ca. −187 000 cases (−41 %) in 2050 (Fig. 9b). Such an improvement is mainly due to abatement of emissions in the agriculture and industry sectors in UNECE. In this region, the abatement of emissions in the domestic sector shows a decreasing importance between 2025 and 2050 while the opposite is true for agricultural waste burning and the anthropogenic emissions in ROW. By comparison, the MFR-SDS scenario leads to an additional reduction in mortality compared to the MFR BASE of ca. −19 000 cases (−7 %) in 2025 that reaches ca. −40 000 cases (−15 %) in 2050 (Fig. 9d). In this case, the reduction is associated with abatement of industry emissions, relatively constant throughout the observed period, and an increasing abatement along the studied time window in domestic and transport sectors from UNECE and anthropogenic emissions in ROW (Fig. 9d).
The implementation of more stringent air quality and GHG emission abatement policies only in the UNECE region (MFR UNECE scenario) leads to limited benefits in the air pollution exposure in this region because their effect is partially offset by the unabated emissions from non-UNECE countries, when similar measures are not implemented there as well. Such an effect is more pronounced for O3 than for PM2.5.
In CLE, the main single contributor to the O3 exposure in the UNECE region is non-anthropogenic O3 (other/natural), including biogenic and other unspecified sources (mainly soil-derived NOx, lightning and stratospheric intrusion), which remains relatively constant at ca. 35 ppb throughout the entire time window (2020–2050). In this scenario, the anthropogenic fraction of the O3 exposure is equivalent to 16–19 ppb. Transport, industry and maritime sectors contribute to this fraction predominantly via the emissions of NOx–VOC precursors while agriculture, gas flaring and waste management mostly contribute via emissions of the CH4 precursor. Energy production is the only source affecting O3 exposure with similar shares for both precursor families.
The overall upward trend in the O3-related mortality in the UNECE region over the studied time window is mainly associated with the increasing share of CH4 emissions from ROW. The O3 exposure shares of agriculture, waste management, gas flaring and energy production CH4 emissions from ROW show an upward trend along the simulated time window while that of transport, energy production and domestic NOx–VOC emissions from UNECE show an opposite trend.
Unlike O3, anthropogenic UNECE emissions are the main source of PM2.5 exposure and related mortality in UNECE countries. However, due to a reduction in the share of UNECE emissions and an increase in that from ROW, the importance of the former decreases from 70 % to 65 % of the total PM2.5 exposure metric over the simulated time window.
As a whole, the MFR BASE leads to 34 % and 41 % mortality reductions compared to the CLE scenario in 2050 for O3 and PM2.5 exposure, respectively, while the MFR-SDS leads to a total abatement of mortality in 2050 compared to CLE of 41 % and 50 % for O3 and PM2.5 exposure, respectively.
The applied methodology, based on a reduced form model, has several limitations we discuss here. Some of the limitations are inherited from the parent TM5 CTM. This is the case for secondary organic aerosol chemistry which is not considered and leads to a conservative estimate of PM2.5 exposure and consequently of the benefits from controls. The omission of secondary organic PM in TM5 is estimated to introduce a low bias in the PM2.5 concentration in the order of 0.1 µg m−3 as global mean. However, regional levels in central Europe and China can reach up to 1 µg m−3 in areas where average levels of primary organic matter are 20 µg m−3 (Van Dingenen et al., 2018). In addition, the TM5-FASST model does not include non-linear responses due to changing chemical regimes when switching off individual precursor emissions, nor does it consider impacts of future climate change on photolysis rates and on natural emissions that may affect ozone chemistry. Although an evaluation of climate–chemistry interactions is beyond the capabilities and the scope of the TM5-FASST model, we briefly discuss their possible impacts on our conclusions. The interaction between pollution and climate is complex as it involves many processes: meteorology, precursor emissions and atmospheric chemistry, the interactions of which introduce a considerable degree of uncertainty. For instance, the O3 level derives from the emission of precursors (NOx and VOC including methane), the interplay of which determines the chemical regime (NOx-limited or VOC-limited), and is modulated by temperature. From a purely meteorological point of view, a warmer climate is expected to cause a higher frequency of stagnant conditions leading to higher surface ozone production due to higher photolysis rates which would call for more stringent controls than anticipated under present climate in order to meet limit levels. Such climate penalty on summertime surface ozone concentrations is estimated to be in the range of 1–10 ppb, with the highest impacts in polluted conditions (Jacob and Winner, 2009). However, precursor emission reductions may decouple the long-term trends of O3 summer maximum concentrations and temperature (Fiore et al., 2015).
Natural VOC emissions from vegetation are expected to increase with increasing temperature – up to a critical level after which emissions decrease again (e.g. 38 ∘C for isoprene). Moreover, the VOC emissions are species-specific and therefore subject to changes due to type of vegetation or land use variations (Wu et al., 2012). In NOx-saturated (VOC-limited) conditions (typical of urban polluted areas), the climate-driven increased VOC emissions would increase the natural component of O3 formation and drive the chemical regime more towards the NOx-limited region, implying a higher response of O3 to anthropogenic NOx emission changes. However, under the more common conditions of VOC saturation (NOx limitation), the O3 response to NOx is only weakly dependent on the VOC concentrations (Akimoto and Tanimoto, 2022).
A warming climate is also expected to increase CH4 emissions from wetlands, the major natural CH4 source (Gedney et al., 2004); however, the magnitude of such variation is still quite uncertain (Nisbet, 2023).
The applied TM5-FASST methodology, not including these climate–chemistry feedbacks, is likely to underestimate the natural component of O3 formation in a future, warmer climate, as well as the O3 response to NOx reductions in specific polluted conditions. However, this does not compromise our conclusion that control of anthropogenic CH4 emissions can play a prominent and increasing role in the coming decades.
The estimated levels and source allocation in our study are comparable with those obtained in studies with similar scope. However, using previous studies as reference is not straightforward due to different underlying methodological assumptions and aggregation of the output data. This is particularly true when comparing the source apportionment with brute-force or emission reduction impact approach (used in this study) with the one resulting from tagged method studies (Appendix A, Fig. A2).
The scenario analysis presented in this study assesses the exposure to O3 and PM2.5 and associated mortality between 2020 and 2050 in the UNECE countries. To that end, a baseline scenario in which the air quality and GHG abatement measures adopted by 2018 are implemented (CLE) is compared with other scenarios with increasing degree of ambition. The adopted methodology for the identification of geographic origin with sectoral anthropogenic sources and precursor detail led to an in-depth understanding of the impact that different measures may have on mortality in the UNECE region in the medium and long term.
The study demonstrates that applying emission reductions only in UNECE countries leads to a limited abatement in the O3 exposure in UNECE countries with respect to the baseline (CLE) and that the implementation of BATs worldwide would not only lead to higher abatement of exposure in UNECE countries but also to a trend reversal, from increasing to decreasing. Moreover, the study shows that the overall upward trend in the O3-related mortality in the UNECE region over the studied time window is mainly associated with the growing share of CH4 emissions from ROW. This is mostly related to the relatively long atmospheric lifetime of O3 (compared to PM2.5), formed from its short-lived precursors NOx and NMVOC, and to the one of its long-lived precursor CH4 which contributes to global background O3. On the contrary, PM2.5-related mortality in UNECE appears to be mainly affected by its own emissions.
Controlling O3 exposure in UNECE countries is necessary to prevent the CLE projected increase in annual mortality from ca. 65 000 in 2020 to ca. 73 500 in 2050 (+9000 deaths per year), while acting on PM2.5 is a high priority to avoid the considerable mortality attributed to this pollutant turning back in 2050 to the same levels of 2020 (ca. 444 000 units). The analysis of the CLE scenario suggests the opportunity to act on CH4 sources agriculture, energy production, gas flaring and waste management beyond the UNECE region (ROW) in order to prevent an increase in O3 exposure and related mortality in the UNECE countries from 2030 onwards (in addition to the benefits for the ROW region). On the contrary, to significantly reduce the PM2.5 exposure and related mortality in the UNECE region beyond the CLE measures in the long term (2050), the main focus should be on the anthropogenic emissions from agriculture and industry sectors within the UNECE region.
In MFR-SDS, the abatement of some of the most critical CH4 sources identified in the analysis of CLE (energy production, gas flaring and waste management) plus the reduction of NOx–VOC from industry and transport globally and those of the maritime sector lead to a 30 %–41 % drop of O3-related mortality with respect to CLE in 2030 and 2050 (equal to ca. 20 000–30 000 avoided premature deaths per year), respectively. Moreover, the abatement of the most critical UNECE PM2.5 emissions identified in the analysis of CLE (i.e. agriculture and industry) plus emissions in the domestic sector complemented by reductions in natural sources (DUST and SS) lead to a 44 %–50 % drop in the PM2.5-related mortality compared to CLE in 2030 and 2050 (equal to ca. 182 000–221 000 avoided premature deaths per year), respectively.
The analysis of the MFR-SDS scenario confirms that the measures in line with UN's SDGs concerning energy sources can lead to significant benefits. It also shows the potential co-benefits of joint air quality and GHG abatement policies in line with the Paris Agreement ambition of keeping the global average temperature increase below 2 ∘C. However, considering the impact of agriculture, an important NH3 contributor, on the two studied pollutants in the CLE scenario, more ambitious reductions of this source should be explored, considering that the abatement of NH3 in the MFR scenarios compared to CLE is modest (−32 % to −35 % in UNECE in the studied time window).
The conclusions of this study are relevant for the revision of the UNECE's Air Convention Gothenburg protocol.
Comparison with other studies
The source allocation of average PM2.5 exposure in UNECE described in the present study is comparable with the one reported by Mc Duffie et al. (2021) for all world countries in 2017 on the basis of a combination of satellite data, chemical transport models and ground-based observations. The UNECE average population-weighted PM2.5 split in 20 source categories including fuel details obtained from the country averages reported in the above-mentioned study is shown in Fig. A1a. Such categories are merged using the same categories as the present study for comparison with the estimations obtained with TM5-FASST extrapolated for 2017 (Fig. A1b).
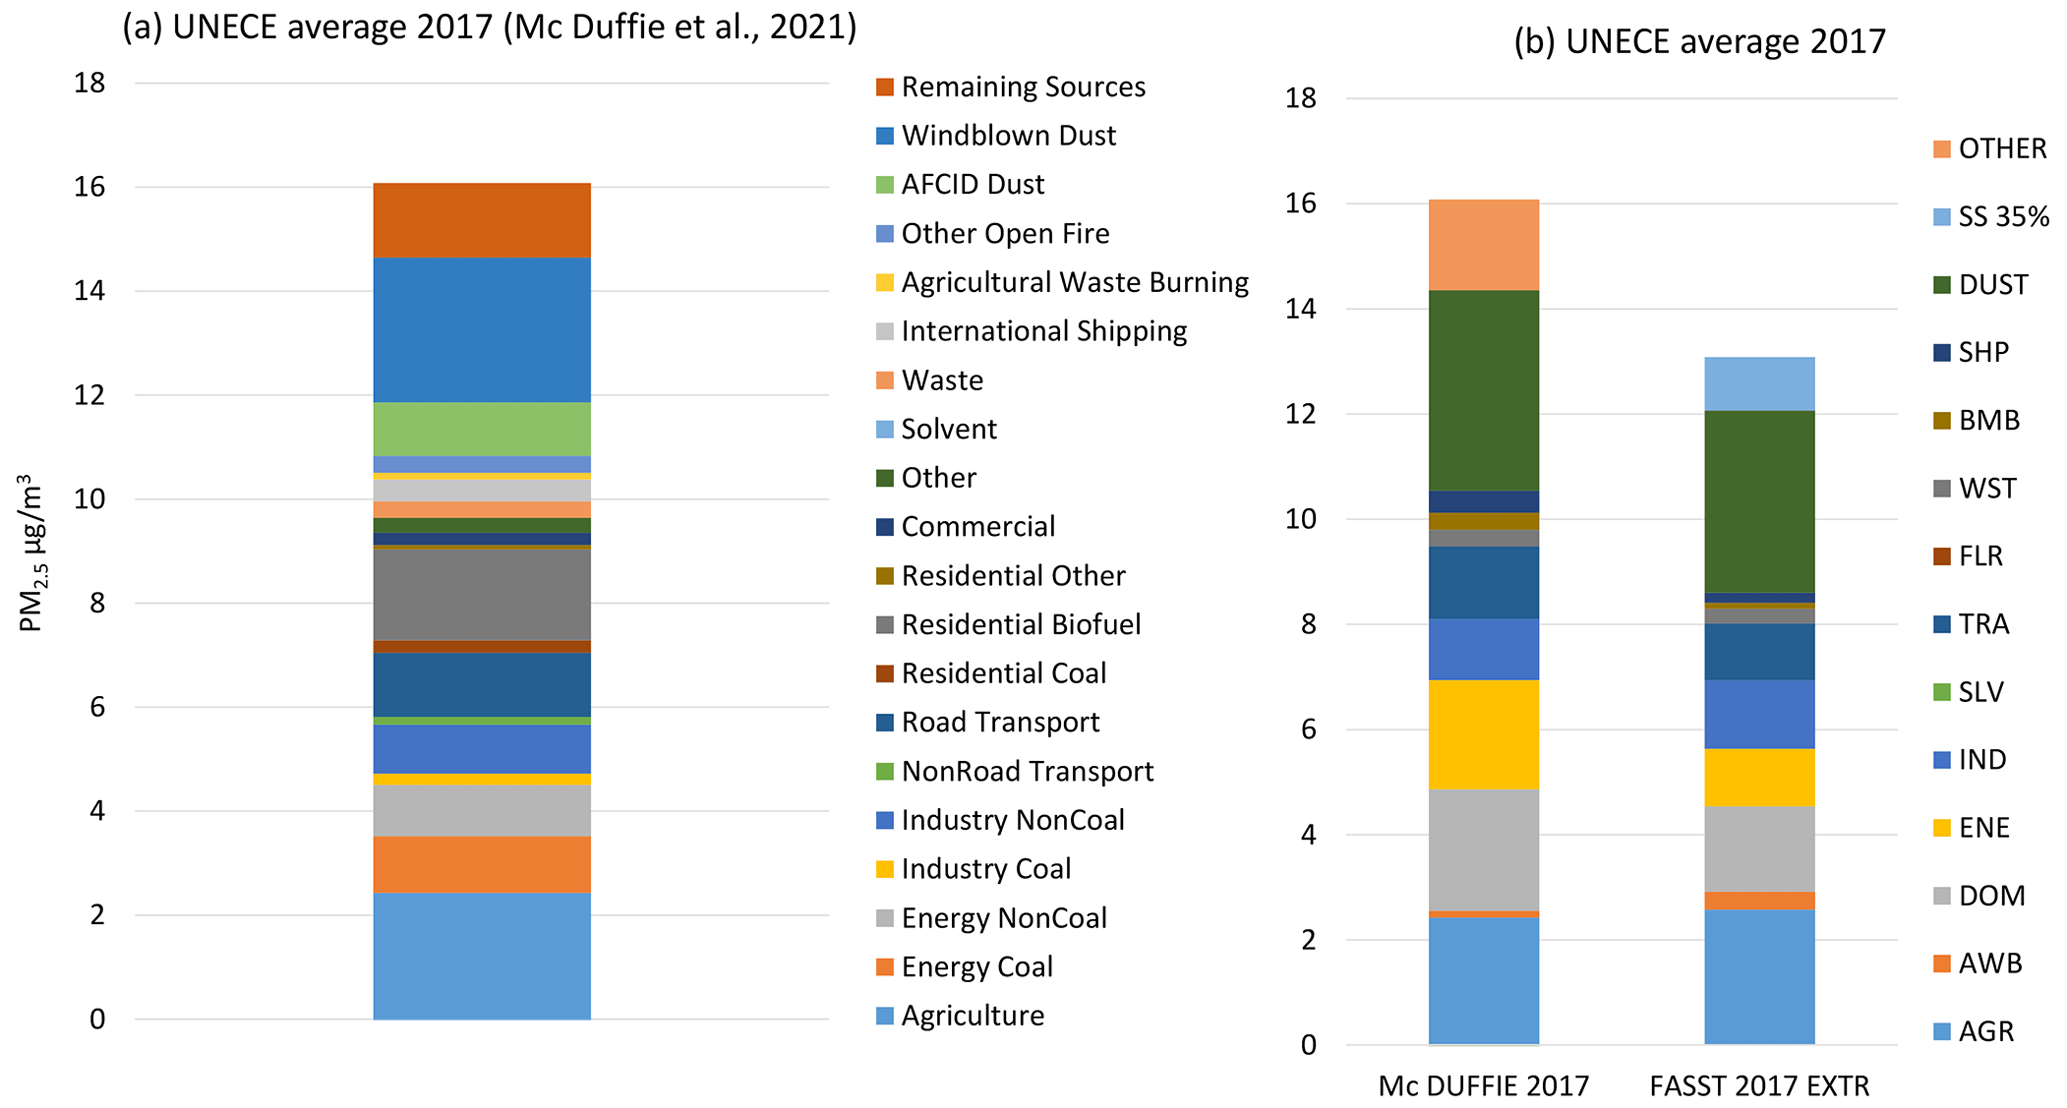
Figure A1UNECE average population-weighted PM2.5 split by source categories. (a) Original source categories (Mc Duffie et al., 2021); (b) comparison of PM2.5 source apportionment of the present study with the one by Mc Duffie et al. (2021) using the same source categories.
The average UNECE population-weighted PM2.5 from TM5-FASST is 2.4 µg m−3 (−18 %) lower than the one obtained from the country values reported by Mc Duffie and co-authors, likely due to the use of data fusion in the latter. The population-weighted PM2.5 allocated by TM5-FASST to energy production and domestic is lower than the one reported in the above-mentioned study (−47 % and −29 %, respectively). On the contrary, the higher agricultural waste burning share in TM5-FASST (+160 %) has been attributed to the incorporation of forest fires under this category in this model (Fig. A1b).
The UNECE O3 source allocation in the 2010 warm season (April–September) obtained in this study with TM5-FASST based on a perturbation approach was compared with the one reported by Butler et al. (2020) using a tagging approach (hereon Butler2020). Comparing the O3 apportionment in these studies is, however, not straightforward because Butler2020 splits the total O3 concentrations in two alternative ways by either NOx precursors or VOC precursors while TM5-FASST splits them between NOx–VOC and CH4 precursors at once. Moreover, in Butler2020, Central Asia (CAS) VOC contributions as well as those from Israel are included in ROW, while in this study, these countries have been included in the UNECE region.
The O3 concentrations are higher in TM5-FASST compared to Butler2020, likely due to the use of maximum daily 8 h averages instead of monthly averages (Fig. A2). The share of O3 produced by NOx–VOC emitted in UNECE according to TM5-FASST (6 ppb, 13 %) lies in-between the estimations obtained by Butler2020 for the contribution of NOx (17 ppb, 45 %) and NMVOC (4 ppb, 10 %) emissions in this region. By comparison, the share of O3 derived from NOx–VOC emissions from ROW provided by TM5-FASST (2 ppb, 4 %) is slightly lower than the estimations by Butler2020 for NOx (4 ppb, 11 %) and VOC (3 ppb, 7 %), respectively.
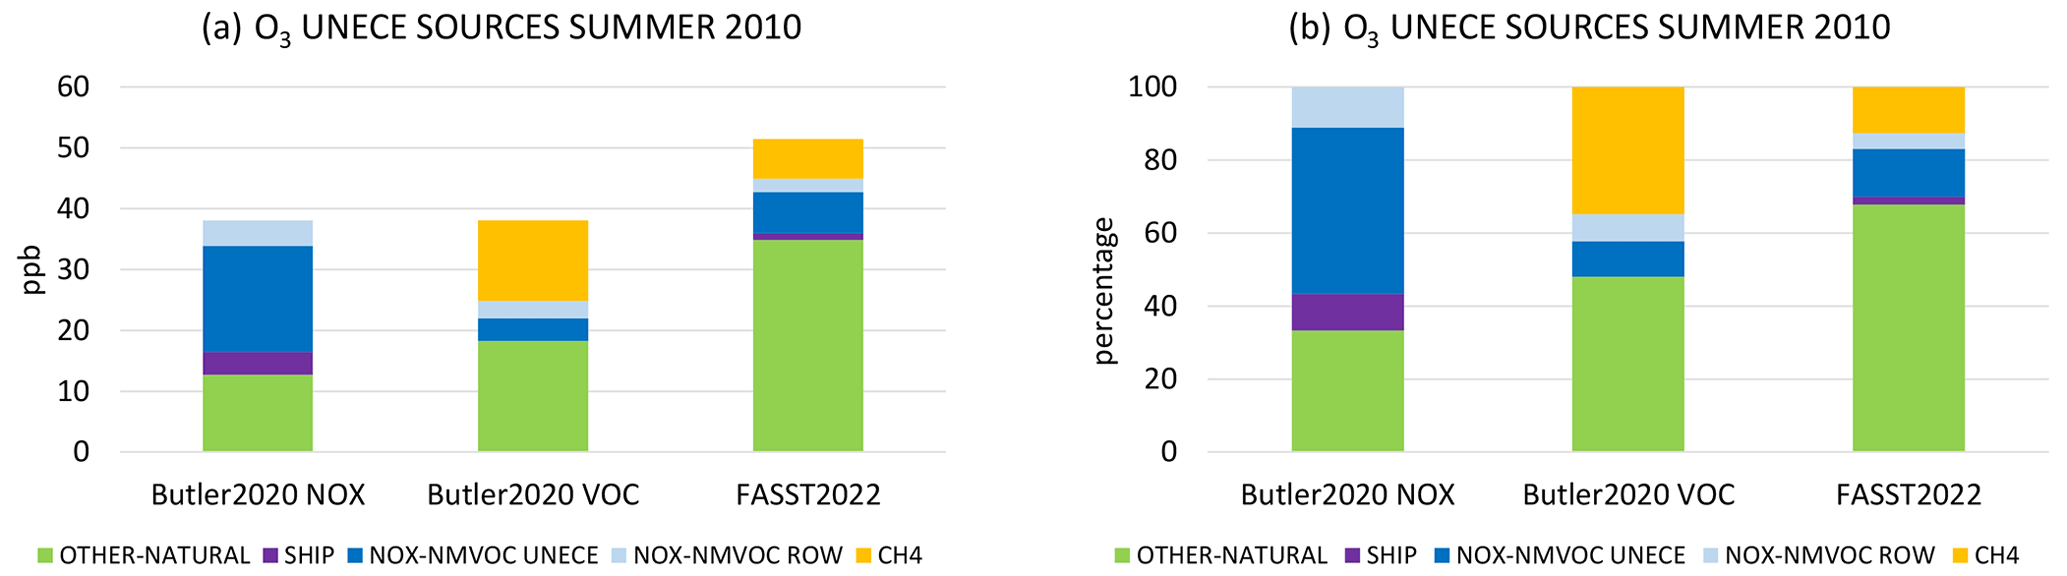
Figure A2UNECE average O3 split by source categories using a tagged approach (Butler et al., 2020) and a perturbation approach (TM5-FASST, this study) expressed as concentrations (a) and percentages (b).
Butler2020 links the CH4-related O3 only to VOC emissions and does not associate this precursor to any specific geographic area, while TM5-FASST allocates CH4-related O3 to its geographic source regions and precursors. In this analysis, the TM5-FASST aggregated share of O3 associated with CH4 (6 ppb, 13 %) is considerably lower than the one attributed by Butler2020 to this fraction (13 ppb, 35 %). Also, the contribution of shipping to O3 concentrations estimated by Butler2020 (4 ppb, 10 %) is higher than the share reported by TM5-FASST in this study (1 ppb, 2 %). By comparison, the role of the other/natural source is higher in TM5-FASST (35 ppb, 67 %) compared with the one attributed by Butler2020 (13 ppb, 33 % for NOx and 18 ppb, 48 % for VOC source allocation, respectively).
Brief description of scenarios
The scenarios used in this study are summarized in Table A1.
Table A1Description of the ECLIPSE version 6b global scenarios used in this study (IIASA, 2021).
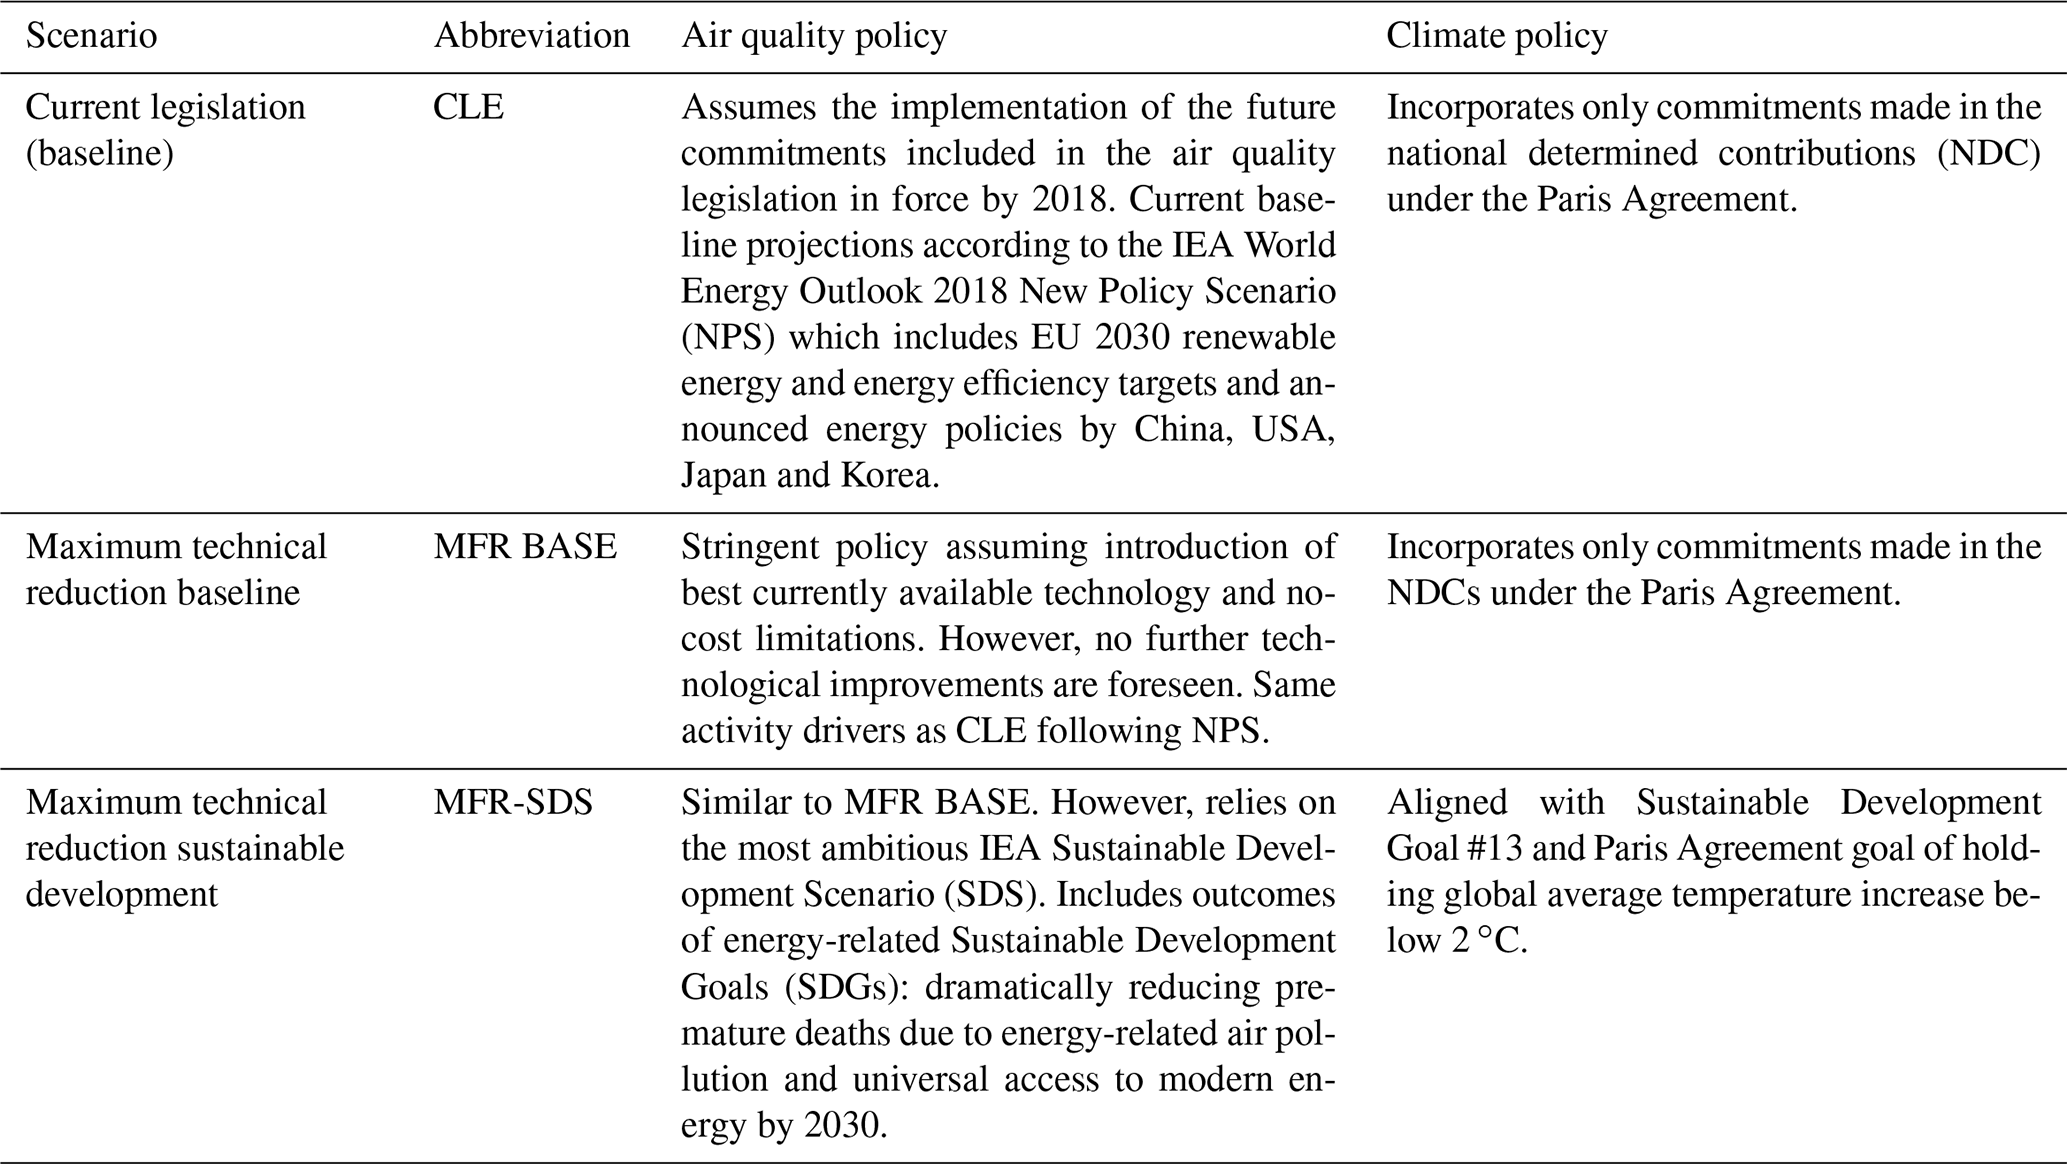
The current legislation baseline (CLE) scenario considers fuel consumption from IEA (International Energy Agency), agriculture data from FAO (UN Food and Agriculture Organization) and IFA (International Fertilizer Organization), and statistics on industry, waste, shipping, etc. from other sources (IEA, 2018).
The FASST code is available at https://doi.org/10.5281/zenodo.7417835 (Sampedro et al., 2022). Data used in this work are available at https://doi.org/10.5281/zenodo.8077436 (Belis and Van Dingenen, 2023).
The supplement related to this article is available online at: https://doi.org/10.5194/acp-23-8225-2023-supplement.
Both authors contributed equally to all the phases of the work and manuscript preparation.
The contact author has declared that none of the authors has any competing interests.
Publisher's note: Copernicus Publications remains neutral with regard to jurisdictional claims in published maps and institutional affiliations.
The authors are grateful to Julian Wilson for reviewing the English style of the paper. Special thanks to Zig Klimont and Chris Heyes for sharing an early version of the ECLIPSE scenarios.
This paper was edited by Jason West and reviewed by two anonymous referees.
Akimoto, H. and Tanimoto, H.: Rethinking of the adverse effects of NOx-control on the reduction of methane and tropospheric ozone – Challenges toward a denitrified society, Atmos. Environ., 277, 119033, https://doi.org/10.1016/j.atmosenv.2022.119033, 2022.
Amann, M., Bertok, I., Borken-Kleefeld, J., Cofala, J., Heyes, C., Höglund-Isaksson, L., Klimont, Z., Nguyen, B., Posch, M., Rafaj, P., Sandler, R., Schöpp, W., Wagner, F., and Winiwarter, W.: Cost-effective control of air quality and greenhouse gases in Europe: Modeling and policy applications, Environ. Model. Softw., 26, 1489–1501, https://doi.org/10.1016/j.envsoft.2011.07.012, 2011.
Belis, C. A. and Van Dingenen, R.: Air quality source attribution and scenario analysis in the UNECE region (1.0), Zenodo [data set], https://doi.org/10.5281/zenodo.8077436, 2023.
Belis, C. A., Pernigotti, D., Pirovano, G., Favez, O., Jaffrezo, J. L., Kuenen, J., Denier van Der Gon, H., Reizer, M., Riffault, V., Alleman, L. Y., Almeida, M., Amato, F., Angyal, A., Argyropoulos, G., Bande, S., Beslic, I., Besombes, J. L., Bove, M. C., Brotto, P., Calori, G., Cesari, D., Colombi, C., Contini, D., De Gennaro, G., Di Gilio, A., Diapouli, E., El Haddad, I., Elbern, H., Eleftheriadis, K., Ferreira, J., Vivanco, M. G., Gilardoni, S., Golly, B., Hellebust, S., Hopke, P. K., Izadmanesh, Y., Jorquera, H., Krajsek, K., Kranenburg, R., Lazzeri, P., Lenartz, F., Lucarelli, F., Maciejewska, K., Manders, A., Manousakas, M., Masiol, M., Mircea, M., Mooibroek, D., Nava, S., Oliveira, D., Paglione, M., Pandolfi, M., Perrone, M., Petralia, E., Pietrodangelo, A., Pillon, S., Pokorna, P., Prati, P., Salameh, D., Samara, C., Samek, L., Saraga, D., Sauvage, S., Schaap, M., Scotto, F., Sega, K., Siour, G., Tauler, R., Valli, G., Vecchi, R., Venturini, E., Vestenius, M., Waked, A., and Yubero, E.: Evaluation of receptor and chemical transport models for PM10 source apportionment, Atmospheric Environment X, 5, 100053, https://doi.org/10.1016/j.aeaoa.2019.100053, 2020.
Belis, C. A., Pirovano, G., Villani, M. G., Calori, G., Pepe, N., and Putaud, J. P.: Comparison of source apportionment approaches and analysis of non-linearity in a real case model application, Geosci. Model Dev., 14, 4731–4750, https://doi.org/10.5194/gmd-14-4731-2021, 2021.
Belis, C. A., Van Dingenen, R., Klimont, Z., and Dentener, F.: Scenario analysis of PM2.5 and ozone impacts on health, crops and climate with TM5-FASST: A case study in the Western Balkans, J. Environ. Manage., 319, 115738, https://doi.org/10.1016/j.jenvman.2022.115738, 2022.
Burnett, R. and Cohen, A.: Relative Risk Functions for Estimating Excess Mortality Attributable to Outdoor PM2.5 Air Pollution: Evolution and State-of-the-Art, Atmosphere, 6, 589, https://doi.org/10.3390/atmos11060589, 2020.
Butler, T., Lupascu, A., and Nalam, A.: Attribution of ground-level ozone to anthropogenic and natural sources of nitrogen oxides and reactive carbon in a global chemical transport model, Atmos. Chem. Phys., 20, 10707–10731, https://doi.org/10.5194/acp-20-10707-2020, 2020.
Feng, L., Smith, S. J., Braun, C., Crippa, M., Gidden, M. J., Hoesly, R., Klimont, Z., van Marle, M., van den Berg, M., and van der Werf, G. R.: The generation of gridded emissions data for CMIP6, Geosci. Model Dev., 13, 461–482, https://doi.org/10.5194/gmd-13-461-2020, 2020.
Fiore, A. M., Naik, V., and Leibensperger, E. M.: Air Quality and Climate Connections, J. Air Waste Manage., 65, 645–685, https://doi.org/10.1080/10962247.2015.1040526, 2015.
Gedney, N., Cox, P. M., and Huntingford, C.: Climate feedback from wetland methane emissions, Geophys. Res. Lett., 31, L20503, https://doi.org/10.1029/2004GL020919, 2004.
HEI: State of Global Air 2020, Health Effects Institute, Boston, USA, 2020.
IEA: World Energy Outlook 2018, International Energy Agency, Paris, 2018.
IIASA: Global emission fields of air pollutants and GHG, International Institute for Applied Systems Analysis, https://iiasa.ac.at/models-tools-data/global-emission-fields-of-air-pollutants-and-ghgs (last access: 18 July 2023), 2022.
Jacob, D. J. and Winner, D. A.: Effect of Climate Change on Air Quality, Atmos. Environ., 43, 51–63, https://doi.org/10.1016/j.atmosenv.2008.09.051, 2009.
Jones, B. and O'Neill, B. C.: Spatially explicit global population scenarios consistent with the Shared Socioeconomic Pathways, Environ. Res. Lett., 2016, 11.8, 084003, https://doi.org/10.1088/1748-9326/11/8/084003, 2016.
Jonson, J. E., Schulz, M., Emmons, L., Flemming, J., Henze, D., Sudo, K., Tronstad Lund, M., Lin, M., Benedictow, A., Koffi, B., Dentener, F., Keating, T., Kivi, R., and Davila, Y.: The effects of intercontinental emission sources on European air pollution levels, Atmos. Chem. Phys., 18, 13655–13672, https://doi.org/10.5194/acp-18-13655-2018, 2018.
Klimont, Z., Kupiainen, K., Heyes, C., Purohit, P., Cofala, J., Rafaj, P., Borken-Kleefeld, J., and Schöpp, W.: Global anthropogenic emissions of particulate matter including black carbon, Atmos. Chem. Phys., 17, 8681–8723, https://doi.org/10.5194/acp-17-8681-2017, 2017.
Krol, M., Houweling, S., Bregman, B., van den Broek, M., Segers, A., van Velthoven, P., Peters, W., Dentener, F., and Bergamaschi, P.: The two-way nested global chemistry-transport zoom model TM5: algorithm and applications, Atmos. Chem. Phys., 5, 417–432, https://doi.org/10.5194/acp-5-417-2005, 2005.
Lefohn, A. S., Malley, C. S., Smith, L., Wells, B., Hazucha, M., Simon, H., Naik, V., Mills, G., Schultz, M. G., Paoletti, E., De Marco, A., Xu, X., Zhang, L., Wang, T., Neufeld, H. S., Musselman, R. C., Tarasick, D., Brauer, M., Feng, Z., Tang, H., Kobayashi, K., Sicard, P., Solberg, S., and Gerosa, G.: Tropospheric ozone assessment report: Global ozone metrics for climate change, human health, and crop/ecosystem research, Elementa, 6, 27, https://doi.org/10.1525/elementa.279, 2018.
McDuffie, E. E., Martin, R. V., Spadaro, J. V., Burnett, R., Smith, S. J., O'Rourke, P., Hammer, M. S., van Donkelaar, A., Bindle, L., Shah, V., Jaeglé, L., Luo, G., Yu, F., Adeniran, J. A., Lin, J., and Brauer, M.: Source sector and fuel contributions to ambient PM2.5 and attributable mortality across multiple spatial scales, Nat. Commun., 12, 3594, https://doi.org/10.1038/s41467-021-23853-y, 2021.
Nisbet, E. G.: Climate feedback on methane from wetlands, Nat. Clim. Change, 13, 421–422, https://doi.org/10.1038/s41558-023-01634-3, 2023.
Revell, L. E., Tummon, F., Stenke, A., Sukhodolov, T., Coulon, A., Rozanov, E., Garny, H., Grewe, V., and Peter, T.: Drivers of the tropospheric ozone budget throughout the 21st century under the medium-high climate scenario RCP 6.0, Atmos. Chem. Phys., 15, 5887–5902, https://doi.org/10.5194/acp-15-5887-2015, 2015.
Sampedro, J., Khan, Z., Vernon, C. R., Smith, S. J., Waldhoff, S., and Van Dingenen, R.: rfasst: An R tool to estimate air pollution impacts on health and agriculture, Zenodo [code], https://doi.org/10.5281/zenodo.7417835, 2022.
Stanaway, J. D., Afshin, A., Gakidou, C. J. L., et al.: Global, regional, and national comparative risk assessment of 84 behavioural, environmental and occupational, and metabolic risks or clusters of risks for 195 countries and territories, 1990–2017: a systematic analysis for the Global Burden of Disease Study 2017, Lancet, 392, 1923–1994, https://doi.org/10.1016/S0140-6736(18)32225-6, 2018.
Turnock, S. T., Wild, O., Dentener, F. J., Davila, Y., Emmons, L. K., Flemming, J., Folberth, G. A., Henze, D. K., Jonson, J. E., Keating, T. J., Kengo, S., Lin, M., Lund, M., Tilmes, S., and O'Connor, F. M.: The impact of future emission policies on tropospheric ozone using a parameterised approach, Atmos. Chem. Phys., 18, 8953–8978, https://doi.org/10.5194/acp-18-8953-2018, 2018.
Van Dingenen, R., Dentener, F., Crippa, M., Leitao, J., Marmer, E., Rao, S., Solazzo, E., and Valentini, L.: TM5-FASST: a global atmospheric source–receptor model for rapid impact analysis of emission changes on air quality and short-lived climate pollutants, Atmos. Chem. Phys., 18, 16173–16211, https://doi.org/10.5194/acp-18-16173-2018, 2018.
van Marle, M. J. E., Kloster, S., Magi, B. I., Marlon, J. R., Daniau, A.-L., Field, R. D., Arneth, A., Forrest, M., Hantson, S., Kehrwald, N. M., Knorr, W., Lasslop, G., Li, F., Mangeon, S., Yue, C., Kaiser, J. W., and van der Werf, G. R.: Historic global biomass burning emissions for CMIP6 (BB4CMIP) based on merging satellite observations with proxies and fire models (1750–2015), Geosci. Model Dev., 10, 3329–3357, https://doi.org/10.5194/gmd-10-3329-2017, 2017.
Wu, S., Mickley, L. J., Kaplan, J. O., and Jacob, D. J.: Impacts of changes in land use and land cover on atmospheric chemistry and air quality over the 21st century, Atmos. Chem. Phys., 12, 1597–1609, https://doi.org/10.5194/acp-12-1597-2012, 2012.
Albania, Armenia, Austria, Azerbaijan, Belarus, Belgium, Bosnia and Herzegovina, Bulgaria, Canada, Croatia, Cyprus, Czech Republic, Denmark, Estonia, European Union, Finland, France, Georgia, Germany, Greece, Hungary, Iceland, Ireland, Israel, Italy, Kazakhstan, Kyrgyzstan, Latvia, Liechtenstein, Lithuania, Luxembourg, Malta, Monaco, Montenegro, Netherlands, North Macedonia, Norway, Poland, Portugal, Republic of Moldova, Romania, Russian Federation, Serbia, Slovakia, Slovenia, Spain, Sweden, Switzerland, Tajikistan, Türkiye, Turkmenistan, Ukraine, United Kingdom, United States of America and Uzbekistan.