the Creative Commons Attribution 4.0 License.
the Creative Commons Attribution 4.0 License.
 | 14 Jul 2023
Multi-model ensemble projection of the global dust cycle by the end of 21st century using the Coupled Model Intercomparison Project version 6 data
Yuan Zhao
Yang Cao
Jun Zhu
Chenguang Tian
Yuwen Chen
Yihan Hu
Weijie Fu
Xu Zhao
As a natural aerosol with the largest emissions on land, dust has important impacts on the atmospheric environment and climate systems. Both the emissions and transport of dust aerosols are tightly connected to meteorological conditions and as a result are confronted with strong modulations by the changing climate. Here, we project the changes in the global dust emissions and loading by the end of the 21st century, using an ensemble of model outputs from the Coupled Model Intercomparison Project version 6 (CMIP6) under four Shared Socioeconomic Pathways (SSPs). Based on the validations against site-level observations, we select 9 out of 14 models and estimate an ensemble global dust emissions of 2566 ± 1996 Tg a−1 (1 Tg = 1012 g) for the present day, in which 68 % is dry deposited and 31 % is wet deposited. Compared to 2005–2014, global dust emissions show varied responses, with a reduction of −5.6 ± 503 Tg a−1 under the SSP3–7.0 scenario but increased emissions up to 60.7 ± 542 Tg a−1 under the SSP5–8.5 scenario at 2090–2099. For all scenarios, the most significant increase in the dust emissions appears in North Africa (0.6 %–5.6 %) due to the combined effects of reduced precipitation but strengthened surface wind. In contrast, all scenarios show decreased emissions in the Taklimakan and Gobi deserts (−0.8 % to −11.9 %) because of the increased precipitation but decreased wind speed on a regional scale. The dust loading shows uniform increases over North Africa (1.6 %–13.5 %) and the downwind Atlantic, following the increased emissions but decreases over East Asia (−1.3 % to −10.5 %), and the downwind Pacific, partly due to enhanced local precipitation that promotes wet deposition. In total, global dust loading will increase by 2.0 %–12.5 % at the end of the 21st century under different climate scenarios, suggesting a likelihood of strengthened radiative and climatic perturbations by dust aerosols in a warmer climate.
- Article
(8098 KB) - Full-text XML
-
Supplement
(18084 KB) - BibTeX
- EndNote


Dust aerosol is one of the major air pollutants with strong climatic and environmental effects. Suspended dust aerosols can absorb and scatter solar radiation and act as condensation nuclei so as to change the cloud optical properties (Tegen et al., 2004; Penner et al., 2006; Forster et al., 2008). Dust deposition can change the albedo of snow and ice and transport mineral elements to the ocean (Jickells et al., 2005; Mahowald et al., 2005; Wittmann et al., 2017). Furthermore, strong dust storms present a serious threat to human society by reducing road visibility, thus influencing traffic safety (Middleton, 2017), carrying bacteria and viruses that affect public health (Goudie, 2014), and reducing crop yields that endangers the food supply (Stefanski and Sivakumar, 2009). In light of the great impacts of dust on climate and environment, it is of significant importance to study the spatiotemporal characteristics and future changes in global dust aerosols.
The dust cycle consists of three major processes including emissions, transport, and deposition (Schepanski, 2018), which are mainly related to meteorological conditions, such as precipitation, humidity, surface wind speed, and turbulent mixing (Liu et al., 2004; Shao et al., 2011; Csavina et al., 2014). Low humidity and/or strong surface wind are in favor of dust emissions (Csavina et al., 2014). Atmospheric humidity has a tight coupling effect with soil moisture, which in part controls the threshold of friction velocity and dust emissions intensity (Munkhtsetseg et al., 2016). Strong winds and the associated pressure systems promote the momentum of the surface layer and consequently increase the mobilization of dust (Li et al., 2022). The transport of dust aerosols is related to atmospheric circulation and turbulent mixing, which determine the horizontal and vertical distribution of dust aerosol particles, respectively (Zhang et al., 2014; Fernandes et al., 2020). The deposition process includes dry and wet settlement, in which the dry deposition is an effective way to remove large particles, while wet deposition dominates the removal of fine particles (Breuning-Madsen and Awadzi, 2005; Yue et al., 2009). Therefore, the spatiotemporal variations in the dust aerosols are closely related to meteorological factors.
Climate change exerts significant impacts on the global dust cycle. A study using RegCM3 (Regional Climate Model version 3) showed that dust emissions and the column burden would increase, respectively, by 2 % and 14 % in eastern Asia during 2091–2100 relative to 1991–2000 (Zhang et al., 2016). In contrast, the earlier study projected the reductions in the dust emissions by 26 %, using the ECHAM4/OPYC (Ocean and isoPYCnal) model, and 19 %, using HadCM3 (Hadley Centre Coupled Model, version 3), in the same region by the mid-century (Tegen et al., 2004). Compared to these studies based on 1–2 models, the ensemble projections using multiple models from the Coupled Model Intercomparison Project (CMIP) showed great potential with respect to indicating the uncertainties in the estimate of the global dust cycle. Wuet al. (2020) evaluated 15 dust models in CMIP phase 5 (CMIP5) and found that the uncertainty was relatively small for the dust belt extending from North Africa to East Asia, but the uncertainties in other regions such as Australia and North America were large. Based on the multi-model ensemble from CMIP5 data, Pu and Ginoux (2018) estimated an increase in the dust optical depth in central Arabian Peninsula and a decrease over northern China in the latter half of the 21st century under a strong warming scenario. Zong et al. (2021) also projected that dust emissions would decrease in East Asia by the end of 21st century under the same climate scenario. However, the different features of future global dust cycles and the related drivers under varied climate scenarios remain unclear.
The recent phase 6 of CMIP (CMIP6) includes more complete dust variables (e.g., emissions, depositions, concentrations, and optical depth) from climate models. The ensemble of CMIP6 simulations has been used to depict historical changes in the dust cycle and explore the possible climatic drivers (Le and Bae, 2022; Li and Wang, 2022). However, this valuable dataset has rarely been used for the future projections on the global scale. Compared to CMIP5 models, more dust emissions schemes are coupled with dynamic vegetation in CMIP6 models to optimize land surface emissions processes (Zhao et al.,2022). Such an improvement may also amplify the uncertainties in the dust simulations because the predicted vegetation change may be inconsistent with the observed tendencies (Wu et al., 2020). As a result, it is important to validate the simulated present-day dust cycle before the application of different models in the future projection (Aryal and Evans, 2021). In this study, we project the future changes in the global dust cycles by the end of 21st century under four different climate scenarios, based on the multi-model ensemble mean from CMIP6 models. We select a total of 14 climate models providing dust emissions, depositions, and concentrations for all four scenarios and validate the simulated near-surface dust concentrations and aerosol optical depth (AOD) with site-level measurements. The models with reasonable performance are selected to project the future changes in dust emissions and loadings by the years 2090–2099, relative to the present day (2005–2014). The changes in associated meteorological conditions are further explored to identify the main causes of the changes in the global dust cycle.
Table 1The information related to CMIP6 models.
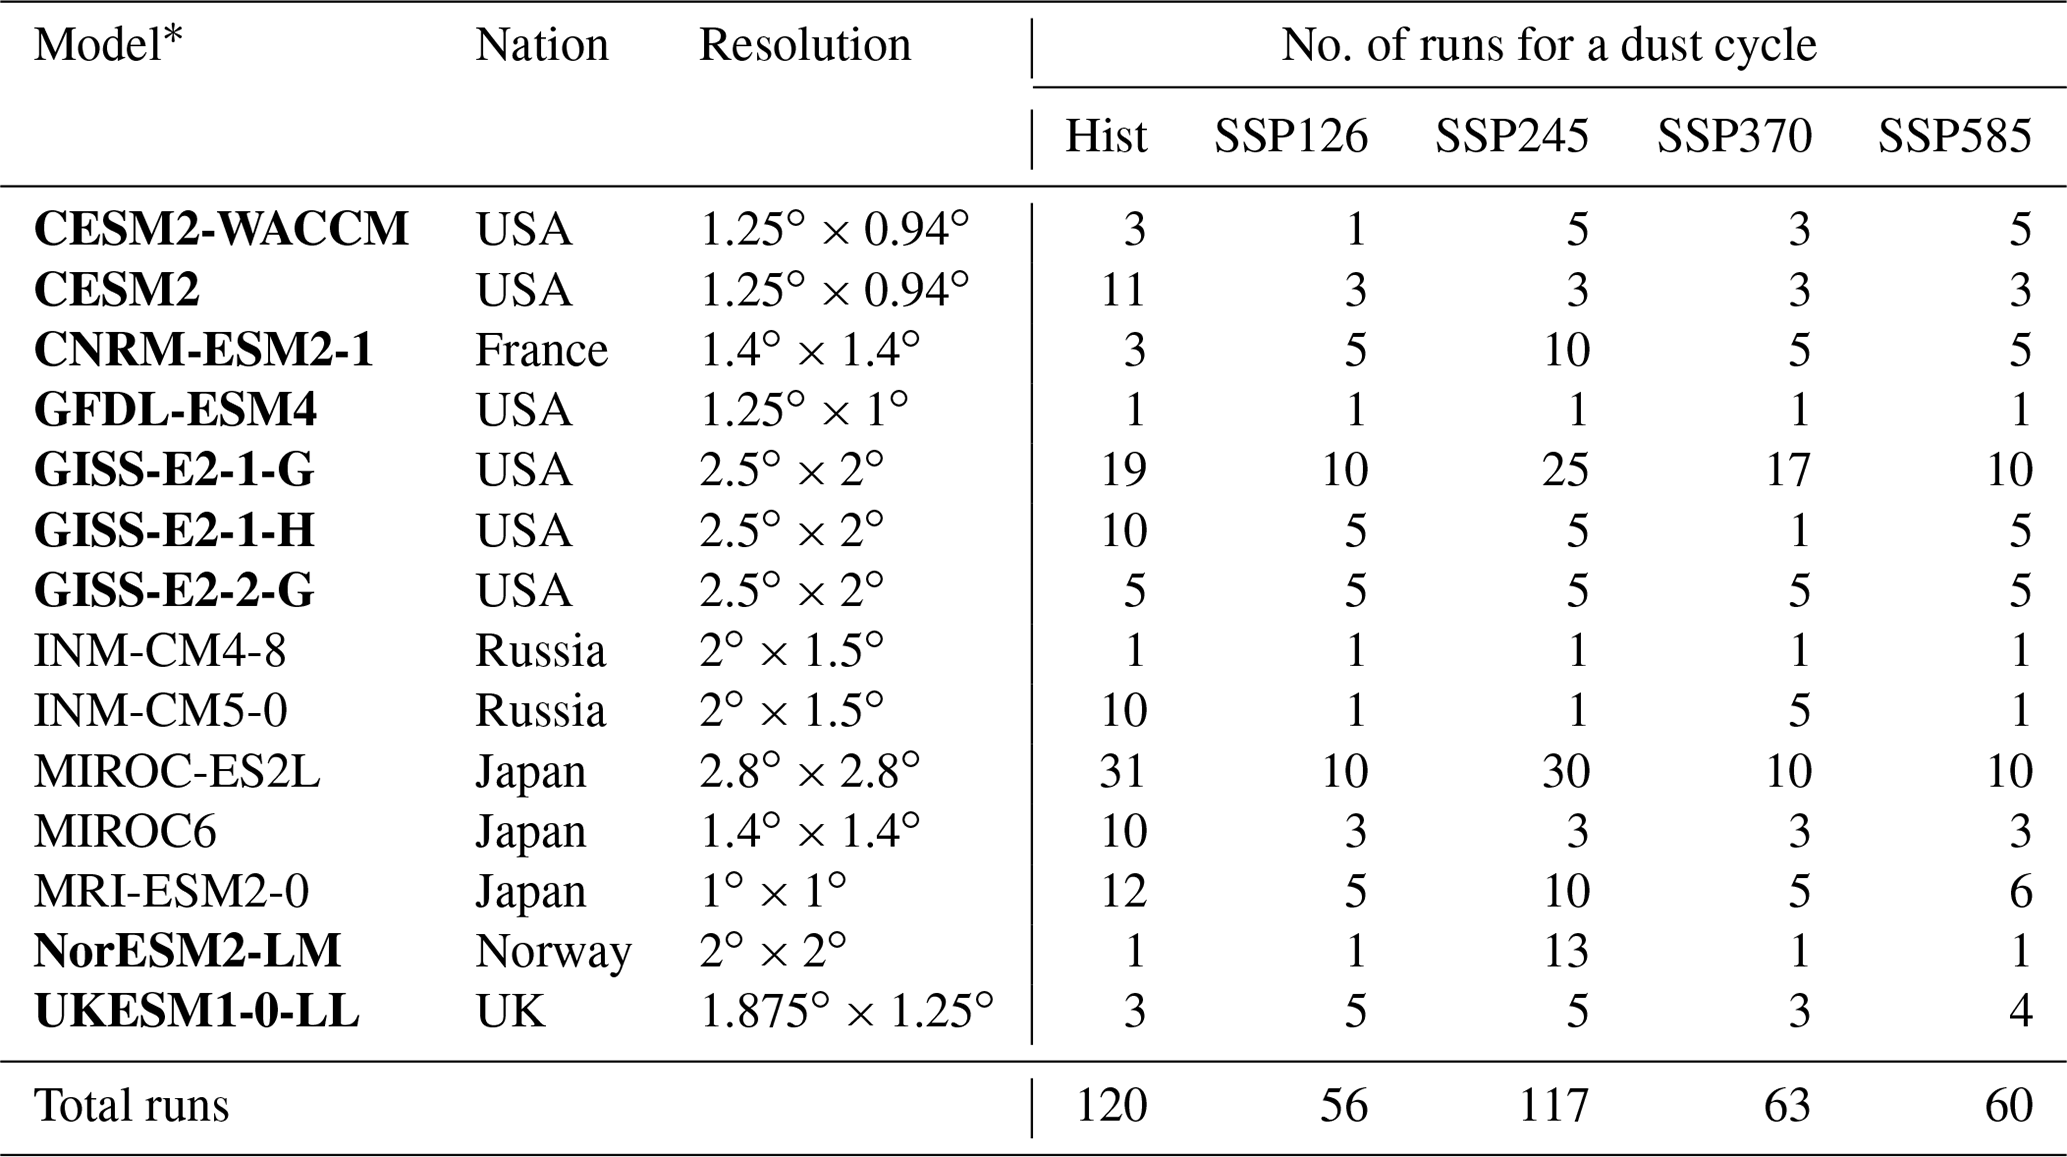
∗ The models selected for future projections are presented in bold.
2.1 Model data
We select all available CMIP6 models (last access: 20 April 2023) providing complete variables of the dust cycle (emissions, dry/wet deposition, and concentration) and the associated meteorology (surface wind, relative humidity, and precipitation) for both present-day and four future scenarios under the Shared Socioeconomic Pathways (SSPs) of SSP1–2.6, SSP2–4.5, SSP3–7.0, and SSP5–8.5, which represent the future climate with the low to high anthropogenic radiative forcings. A total of 14 models with different spatial resolutions are selected (Table 1). Different models may have varied numbers of ensemble runs for dust cycle variables (Table S1 in the Supplement). We use all available runs with different variants and labels from each of the climate models, resulting in a total of 416 runs for every dust variable (120 for history and 296 for four future scenarios) and 770 runs for every meteorological variable (212 for history and 558 for four future scenarios). In addition, we collect both dust optical depth (DOD) and AOD for the historical periods from these models (Table S1). To facilitate the model validation and intercomparison, we interpolate all model data with different spatial resolution to the same resolution of 1∘ × 1∘. For each model, we average all the ensemble runs under one climatic scenario to minimize the uncertainties due to the initial conditions. As a result, we derive five ensemble means (one for history and four for the future) for each variable of every model, leading to the same distribution of the weight among CMIP6 models. We use the average data from 2005 to 2014 to indicate conditions for the present day and data from 2090 to 2099 for the future period. We project the changes in dust cycle using the multi-model ensemble median values between the future and present day and explore the causes of the changes by linking the simulated dust cycle with meteorological variables from individual models.
2.2 Measurement data
We use dust concentrations observed at 18 ground sites operated by the University of Miami (Florida, USA) to validate the dust concentrations at the lowest level of the 14 models. All of these sites are located on islands, with seven in the Atlantic, seven in the Pacific, three in the Southern Ocean, and one in the Indian Ocean. Most of these sites were built near the dust source regions, with the maximum length of available data spanning 17 years. Although the observed data are not continuous at all sites, they provide the most valuable spatiotemporal information of global dust concentrations and have been widely used in the evaluations of dust models (Ginoux et al., 2001; Yue et al., 2009; Wu et al., 2020). We also use the monthly AOD measurements from the Aerosol Robotic Network (AERONET) to validate CMIP6 models. Observed AOD is affected by many different components, in addition to dust aerosols. We select a total of 19 sites with at least 1 year of available records and a simulated DOD-to-AOD ratio that is larger than 0.6, as indicated by the ensemble of CMIP6 models. In this way, AOD at the selected AERONET sites is more likely dominated by dust aerosols.
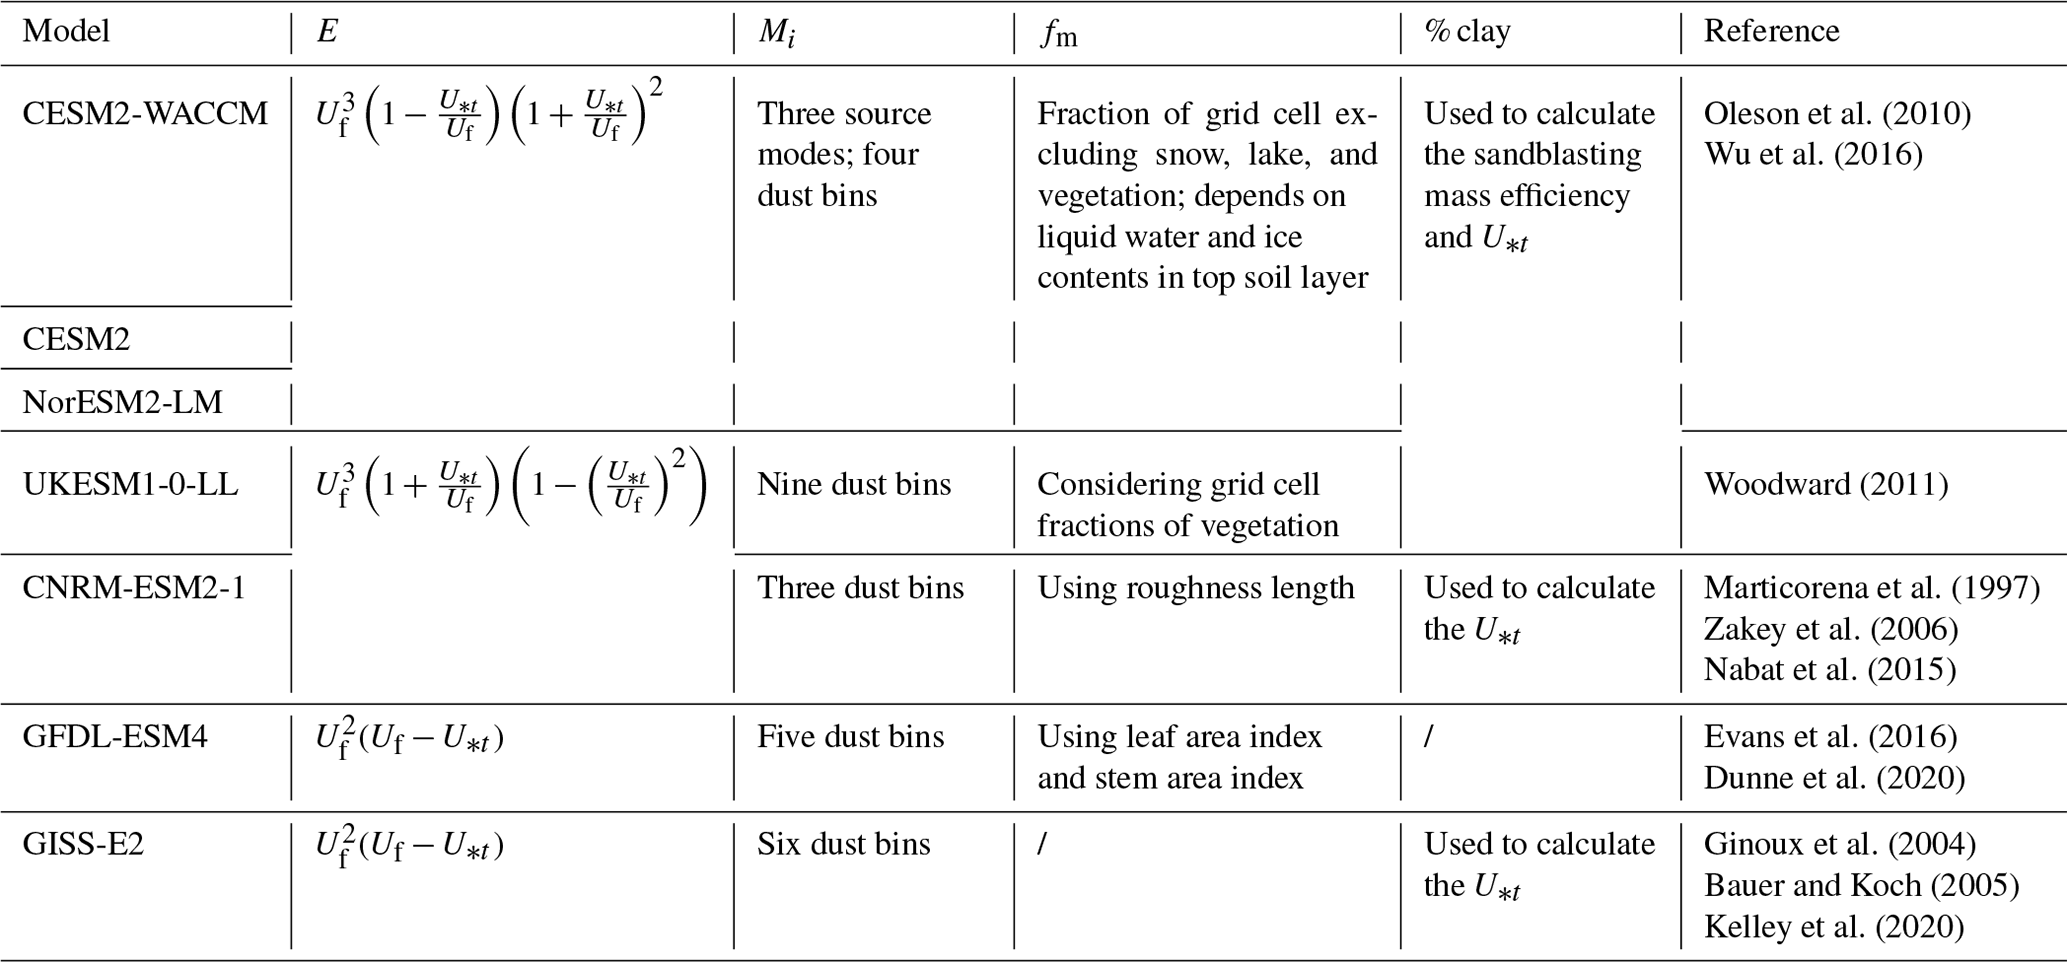
Table 2The parameterization schemes of the dust emissions function.
2.3 Dust emissions schemes
The vertical emissions flux Fi for a specific dust size bin i in most of the climate models can be derived using the following generic equation:
Here, C is a tunable parameter set to derive the reasonable dust climatology in individual models. ρd is the density of the dust particle. E is the impetus composed of the wind friction speed (Uf) above the threshold values (U∗t) for saltation. The value of U∗t is dependent on soil moisture. fm is the erodibility potential of bare soil suitable for dust mobilization, which is usually parameterized as the cover fraction of a grid cell excluding snow, ice, lakes, and vegetation. α is the sandblasting mass efficiency related to the clay fraction (% clay). Mi is the mass distribution of the specific dust bin size i. The detailed parameterizations for each component of Eq. (1) are shown for five selected models in Table 2. In general, the main factors influencing dust emissions include wind friction velocity, threshold wind speed, soil moisture, clay content, soil bareness, and dust particle size. These variables are used either as individual factors or in multiple components of Eq. (1). For example, in CESM2-WACCM (Community Earth System Model 2 and Whole Atmosphere Community Climate Model), CESM2, NorESM2-LM (Norwegian Earth System Model), and UKESM1-0-LL (UK Earth System Model), the clay fraction is used to calculate both the sandblasting mass efficiency and the threshold of wind friction speed (Lawrence et al., 2019). In the CNRM-ESM2-1 (Centre National de Recherches Météorologique Earth System Model), fm and α are combined to calculate U∗t rather than acting as individual factors in the emissions function (Zakey et al., 2006).
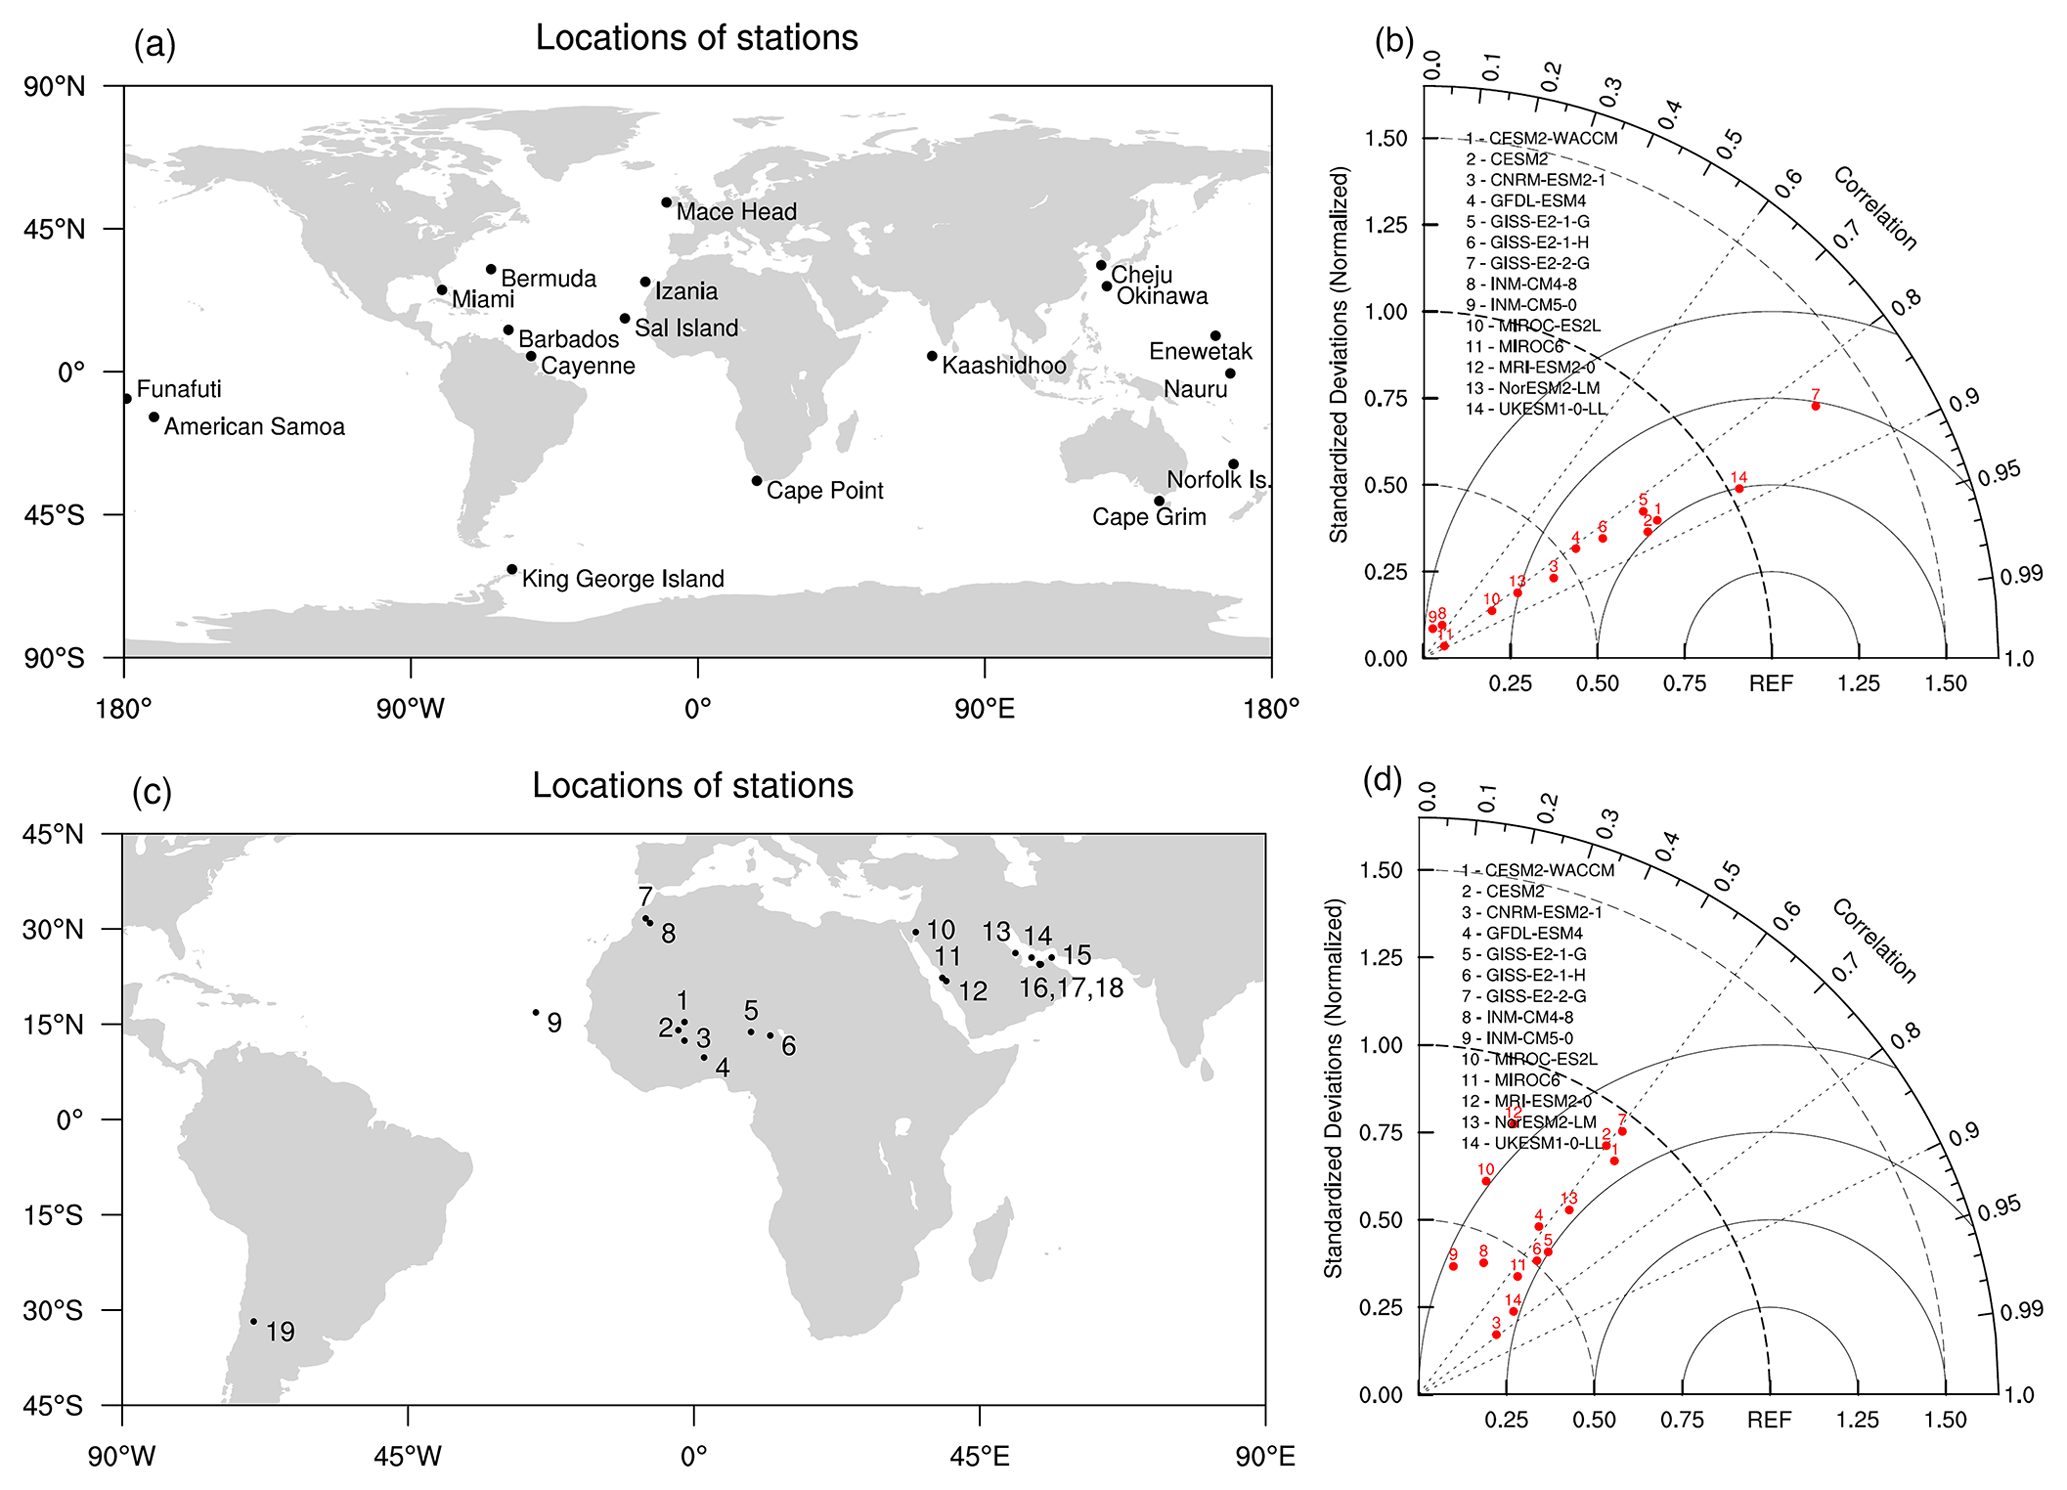
Figure 1(a) The locations of the 18 observational stations in the University of Miami Ocean Aerosol Network and the (b) evaluation of simulated dust concentrations from CMIP6 models at these stations. (c) Locations of 19 AERONET sites and the (d) evaluation of simulated AOD from CMIP6 models at these stations. The names of AERONET sites in panel (c) are 1 – Agoufou, 2 – Bidi_Bahn, 3 – Ouagadougou, 4 – Djougou, 5 – Zinder_Airport, 6 – DMN_Maine_Soroa, 7 – Ras_El_Ain, 8 – Ouarzazate, 9 – Calhau, 10 – Eilat, 11 – KAUST_Campus, 12 – Hada_El-Sham, 13 – Bahrain, 14 – Abu_Al_Bukhoosh, 15 – Dhadnah, 16 – Mussafa, 17 – Dhabi, 18 – Masdar_Institute, 19 – CASLEO. The longitudes and latitudes of these sites are indicated in Figs. 2 and 3.
3.1 Model validations
Figure 1a shows the spatial distribution of ground-based sites for dust observations. These sites cover a wide range of oceanic areas with different distances to the source regions. Compared to the observed concentrations (Fig. 1b), the simulations yield correlation coefficients (R) of 0.30–0.88 for 14 climate models, among which 12 models show R of higher than 0.8 (Table S2). Meanwhile, the simulations show normalized standard deviations (NSDs; standard deviation of the model divided by that of the observations) ranging from 0.07 to 2.16. Compared to observed AOD (Fig. 1d), the simulations yield R of 0.26–0.79 and NSDs of 0.28–0.95 (Table S2). With the validations, we select nine models for the future projections, including CESM2-WACCM, CESM2, CNRM-ESM2-1, GFDL-ESM4 (Geophysical Fluid Dynamics Laboratory), GISS-E2-1-G (Goddard Institute for Space Studies), GISS-E2-1-H, GISS-E2-2-G, NorESM2-LM, and UKESM1-0-LL. All of these selected models yield NSDs between 0.25 and 1.5 and correlation coefficients higher than 0.55 against observations of both dust concentrations and AOD.
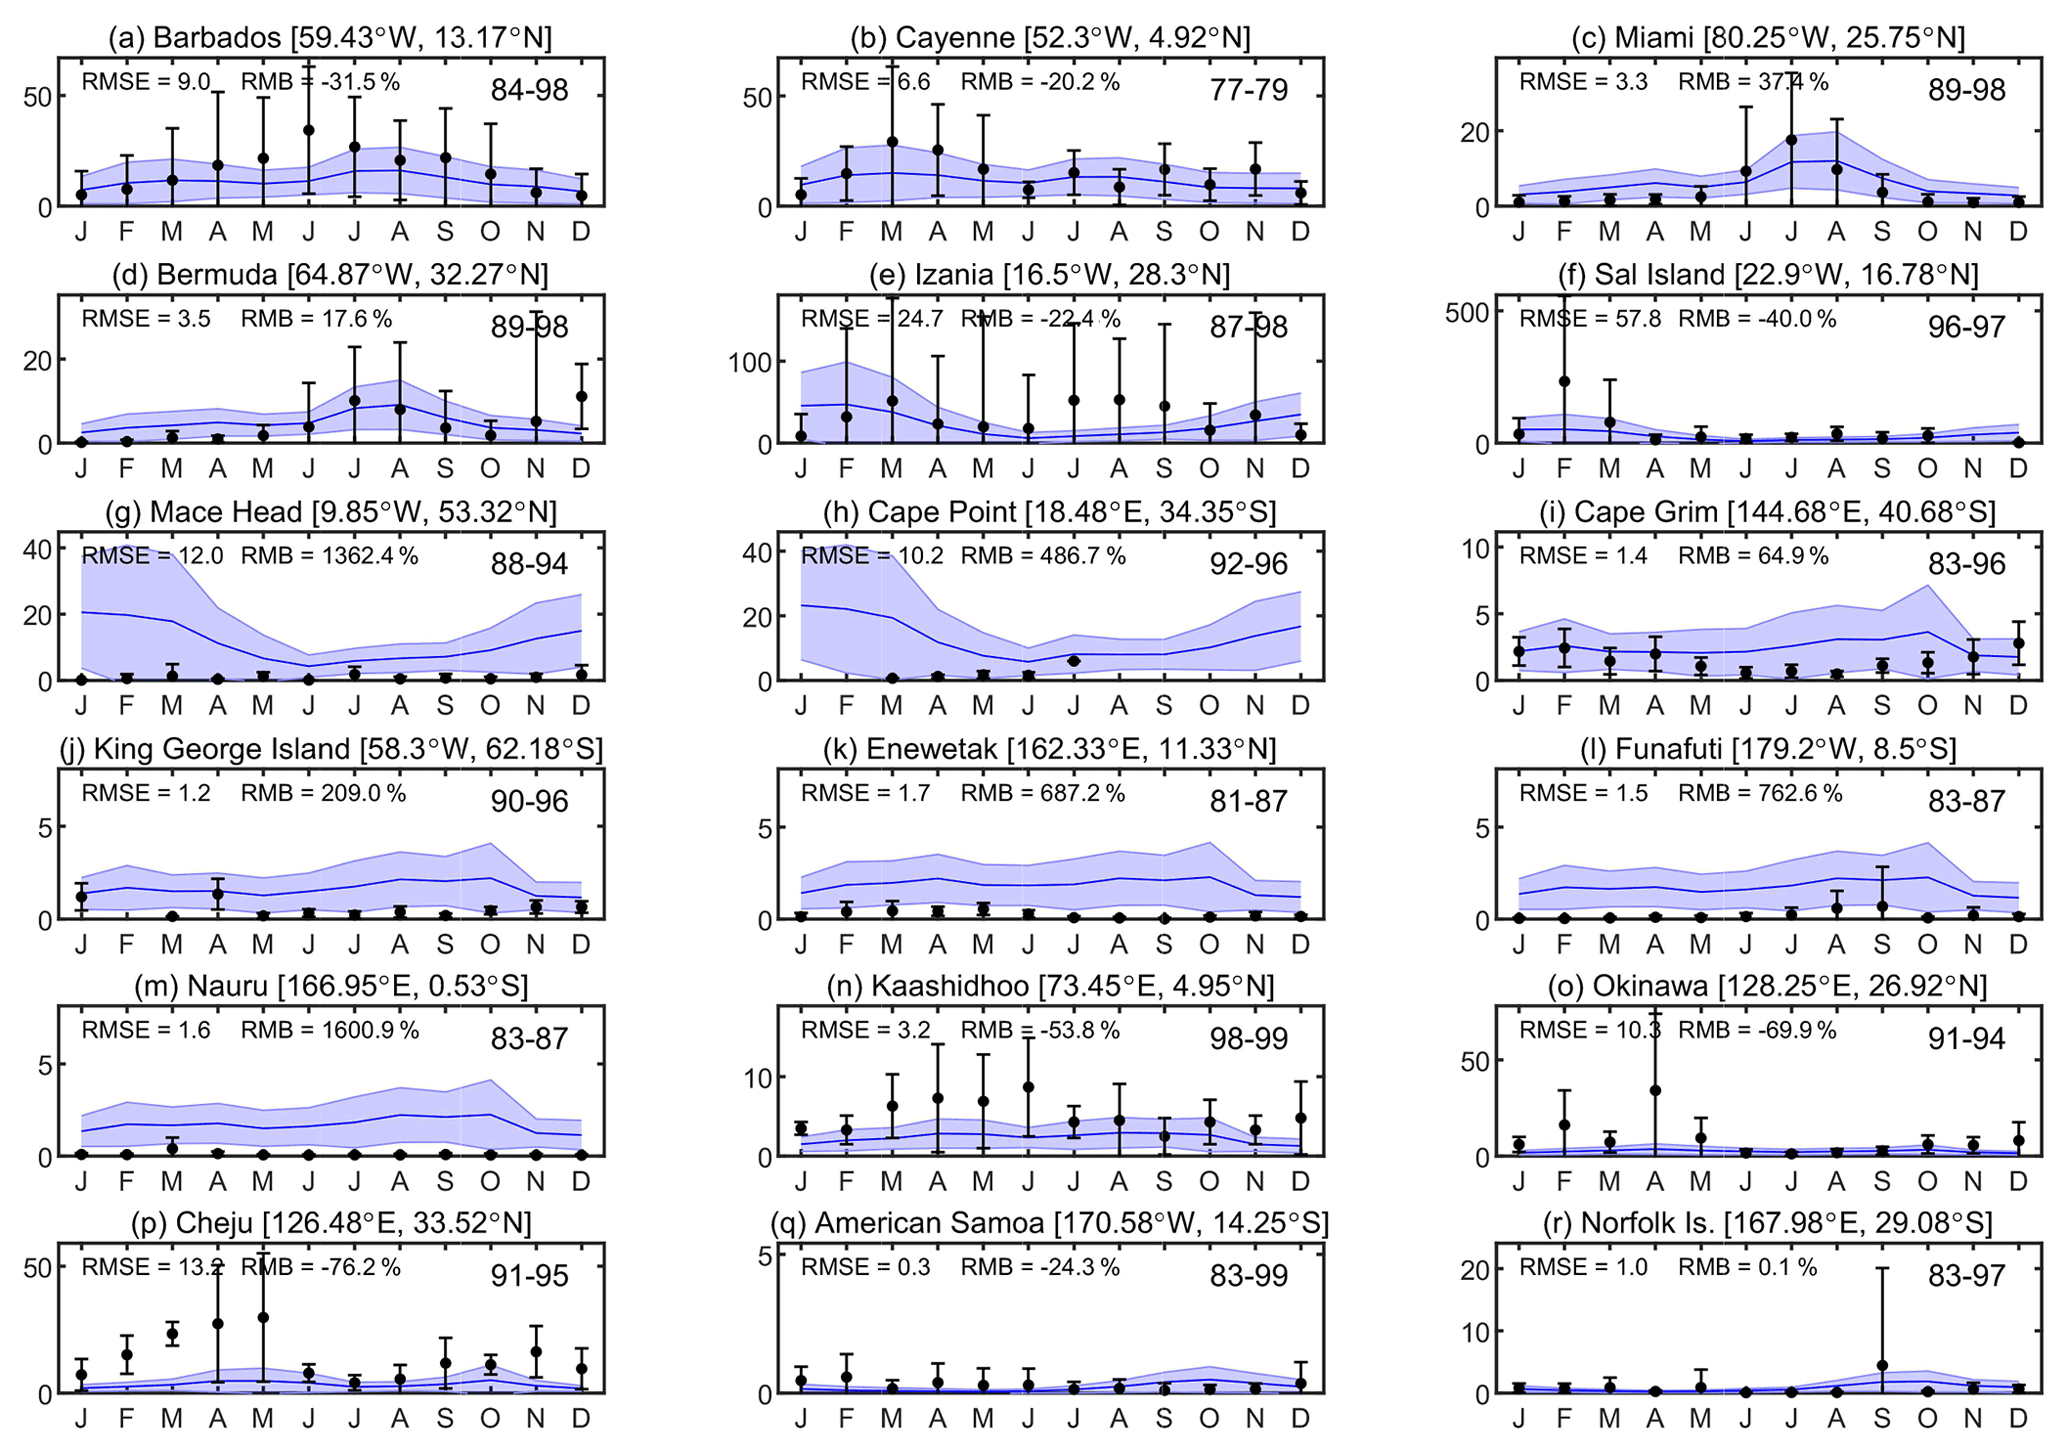
Figure 2Comparison of monthly dust concentrations (µg m−3) between the ensemble simulations by CMIP6 models and observations at 18 sites. The solid lines represent the ensemble mean of the simulations, with shadows indicating the intermodel spread. The points are the monthly mean of observations, with error bars indicating year-to-year variability. The time span of observations at each site is shown in the upper-right corner of each panel. The root mean square error (RMSE) and relative mean biases (RMBs) of the observations and simulations are shown in the upper-left corner of each panel.
The ensemble mean of dust concentrations from nine selected CMIP6 models is compared to observations at individual stations (Fig. 2). The models reproduce observed magnitude at six sites (Fig. 2a–f) downwind of Saharan dust sources, with relative mean biases (RMBs) ranging from −40 % to 37.4 %. For these sites, the model ensemble also captures reasonable dust seasonality, except for the underestimation of the peak values in summer for Barbados (Fig. 2a) and those in spring for Cayenne (Fig. 2b). For the remaining sites, the multi-model ensemble prediction overestimates dust concentrations at one site in the North Atlantic (Fig. 2g), three sites in the Southern Ocean (Fig. 2h–j), and three sites in the central Pacific (Fig. 2k–m), most of which are far away from dust source regions. In contrast, model simulations underestimate dust concentrations at one site in the Indian Ocean (Fig. 2n) and two sites offshore of East Asia (Fig. 2o and p). In summary, the simulated dust concentrations show smaller spatial gradients than the observations.
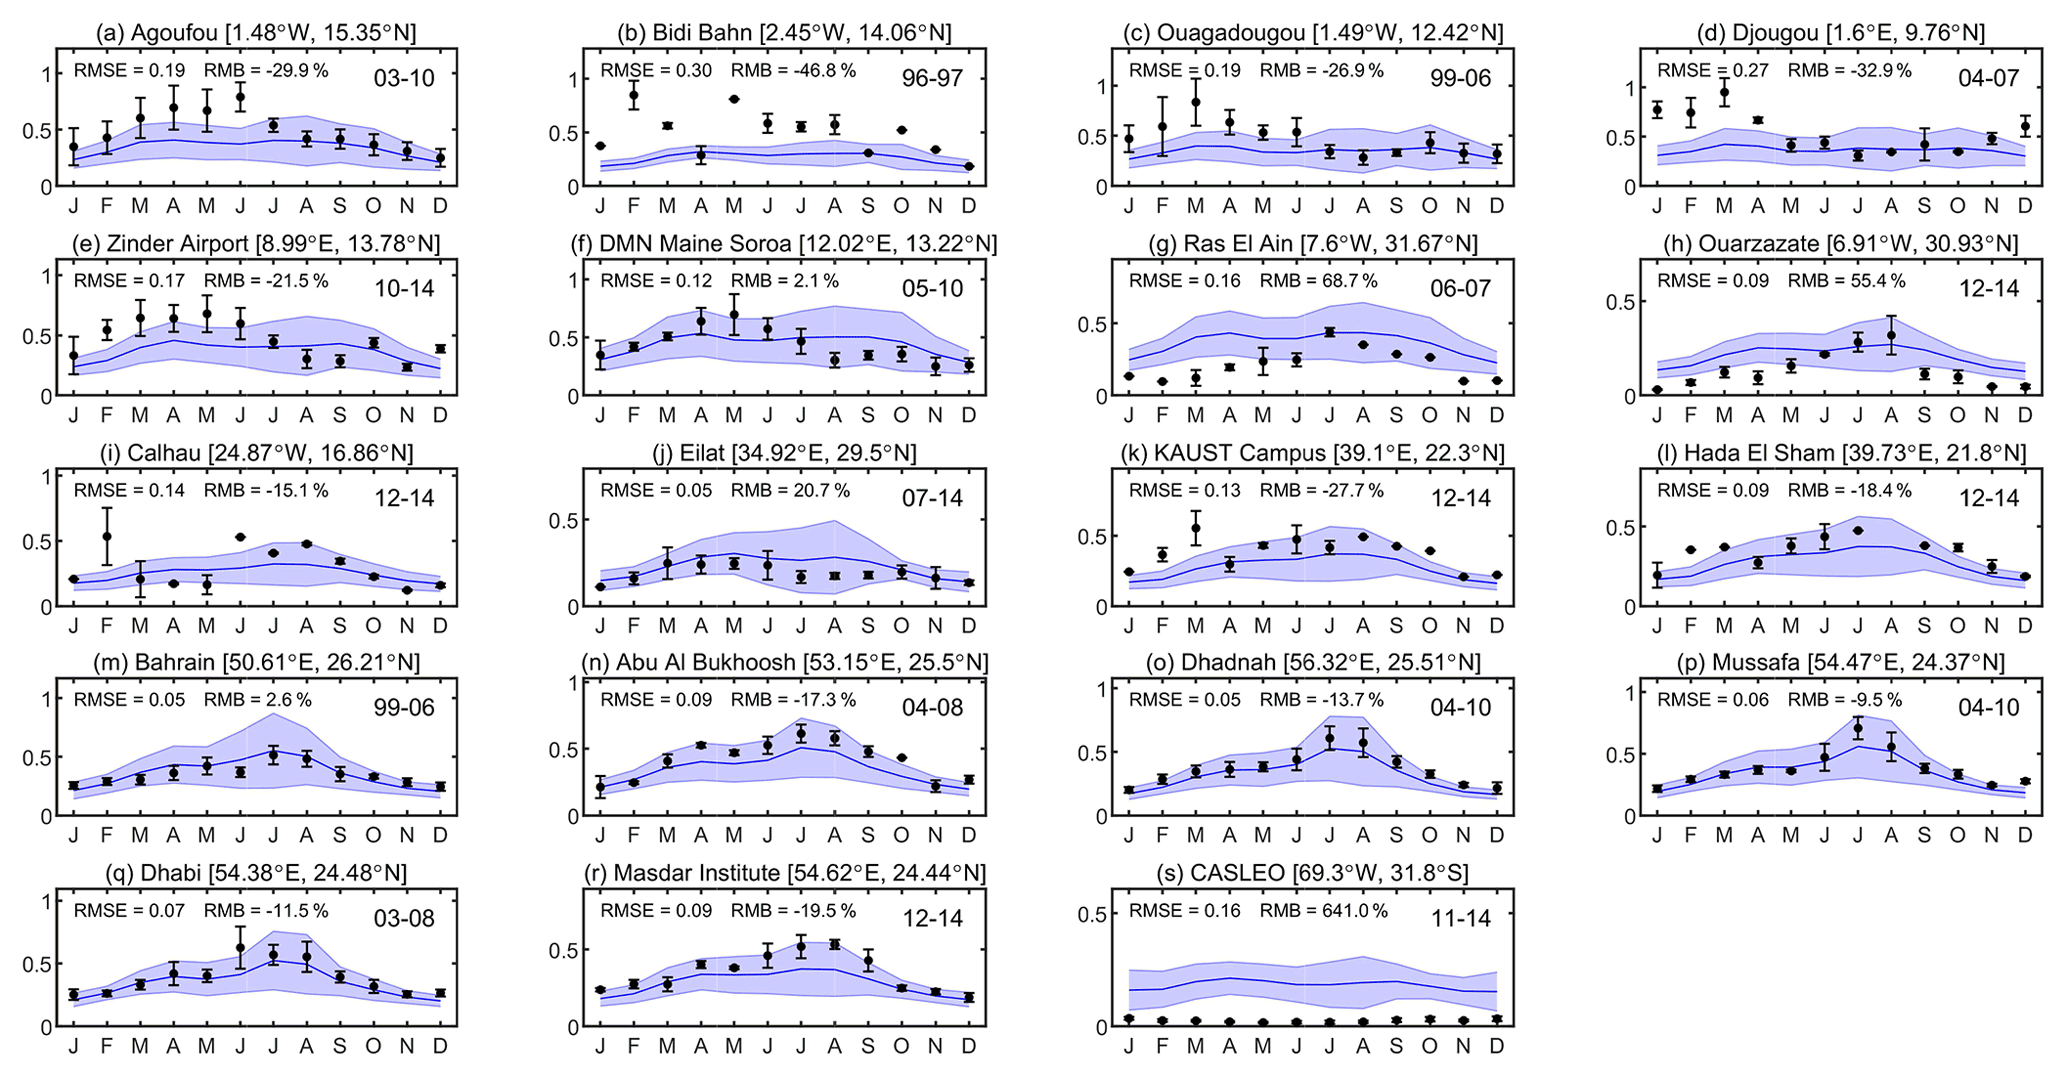
Figure 3The same as Fig. 2 but for the validation of the ensemble simulated aerosol optical depth at 19 AERONET sites.
The ensemble mean of AOD from nine selected CMIP6 models is compared to observations at 19 AERONET stations (Fig. 3). For six sites (1–6) in the inland North Africa, the model prediction underestimates the observed peaks in springtime, especially at Bidi_Bahn and Djougou. As a result, the ensemble predictions at these sites are lower than the observations by at least −20 %, except for DMN_Maine_Soroa. For three sites (7–9) along the western coast of North Africa, the model ensemble captures the summertime maximum but tends to slightly overestimate AOD in other seasons. For nine sites (10–18) in Middle East, the predicted AOD reproduces the observed seasonality and magnitude, with the RMB between −27.7 % and 20.7 %. However, for the only site (CASLEO) in South America, the model prediction shows much higher AOD than the measurements. The validations show that simulated AOD from the selected CMIP6 models agree well with the observed spatial pattern, especially at regions near dust sources.
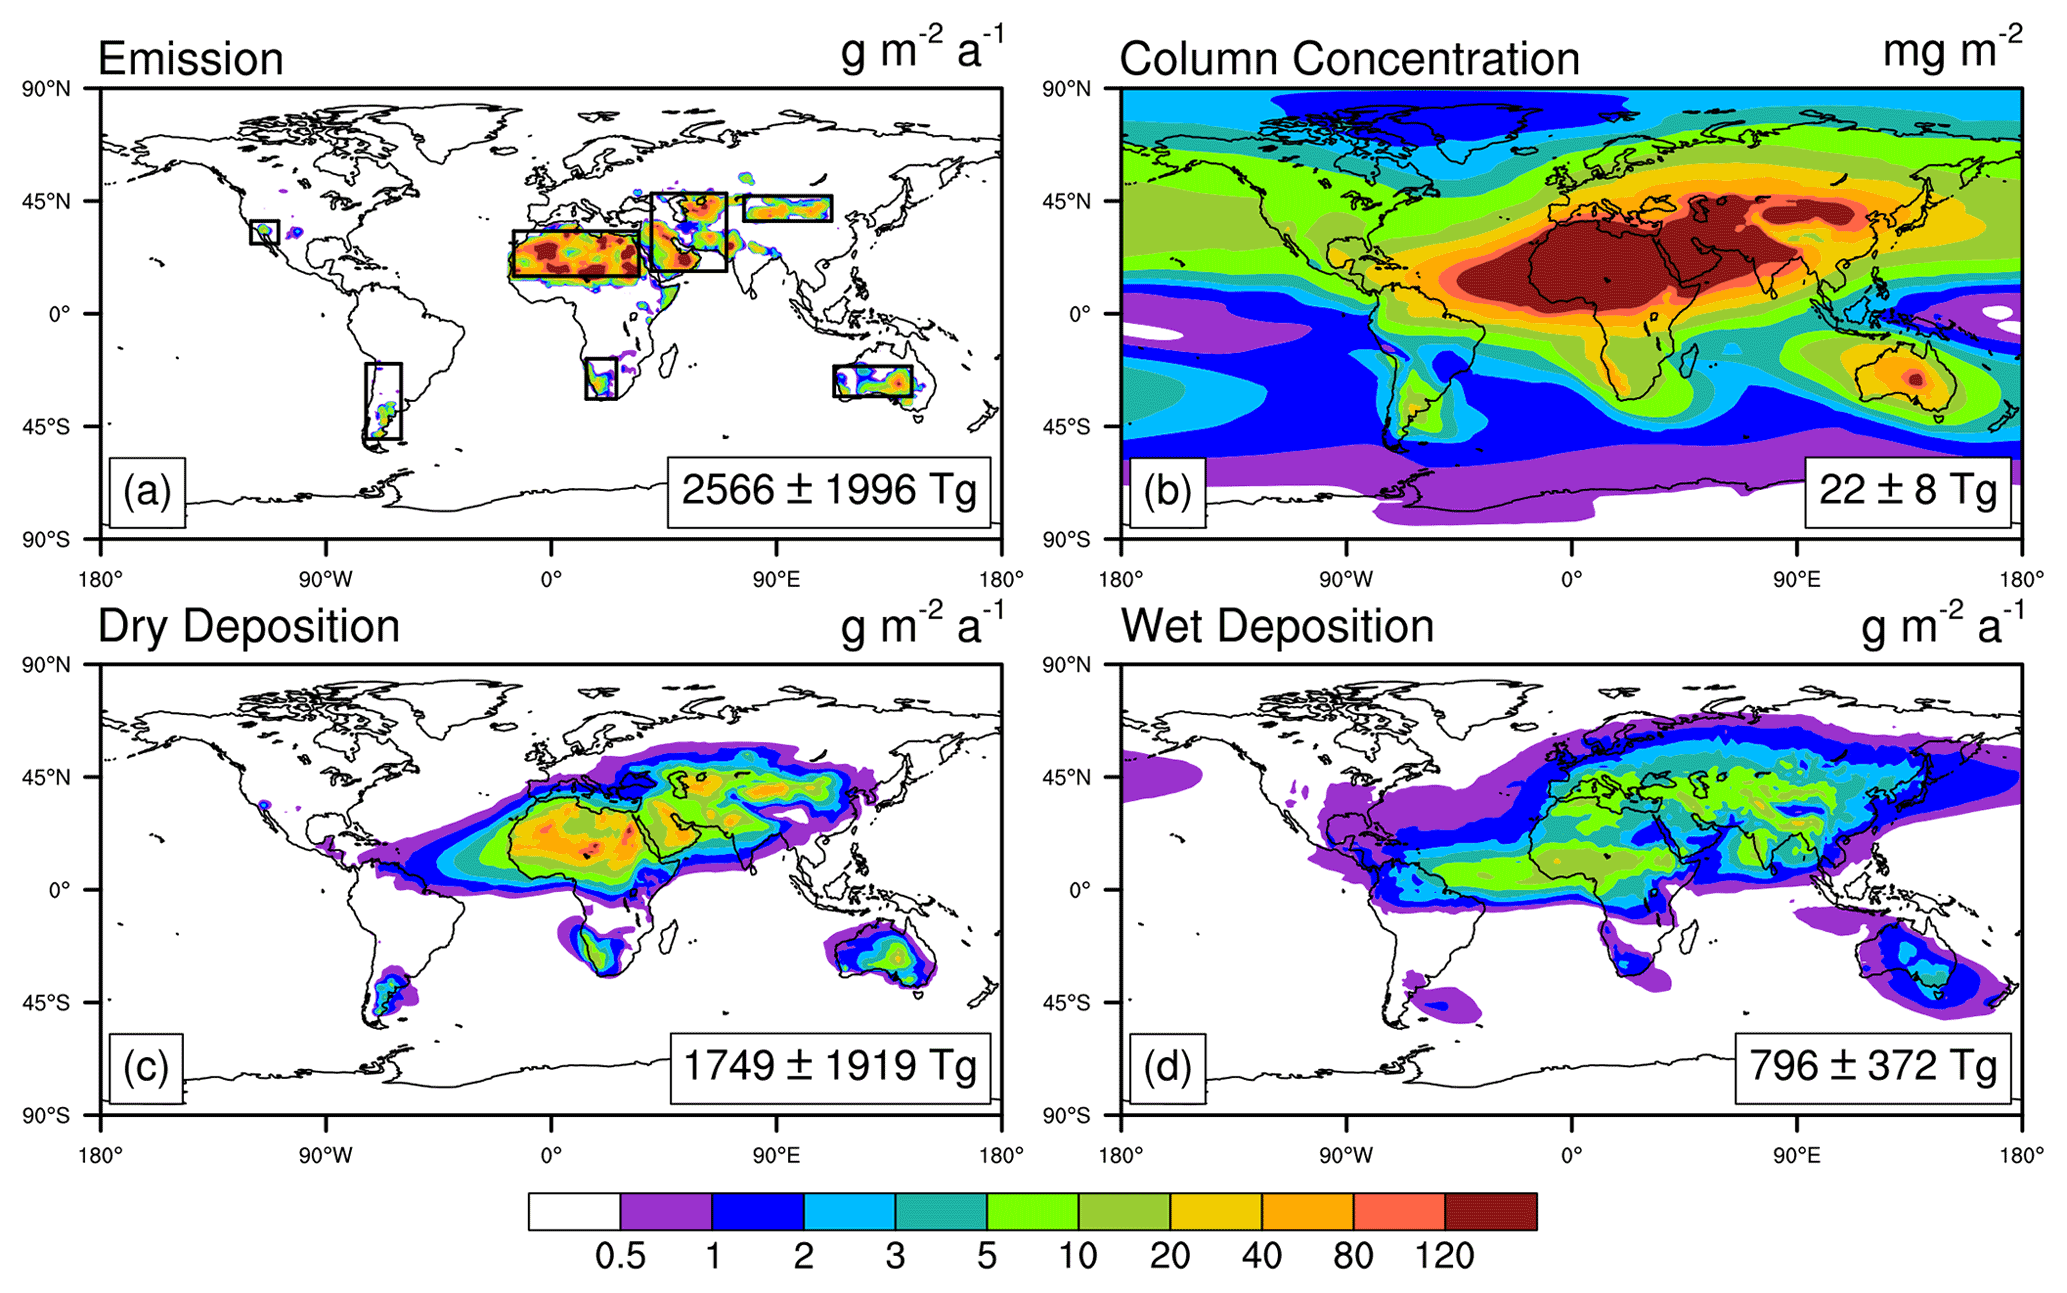
Figure 4Multi-model ensemble of (a) emissions, (b) column load, (c) dry deposition, and (d) wet deposition of dust aerosols for the present day (2005–2014). The box regions in panel (a) are the dust sources of North Africa (NAF; 15–33∘ N, 15∘ W–35∘ E), the Middle East and West Asia (MEWA; 17–48∘ N, 40–70∘ E), the Taklimakan and Gobi deserts (TGD; 37–47∘ N, 77–112∘ E), Australia (AUS; 33–21∘ S, 113–144∘ E), North America (NAM; 28–37∘ N, 120–109∘ W), South America (SAM; 50–20∘ N, 74–60∘ S), and Southern Africa (SAF; 34–18∘ S, 14–26∘ E). The detailed results for the individual models are shown in Fig. S1.
Table 3The summary of the dust cycle as for the present daya.
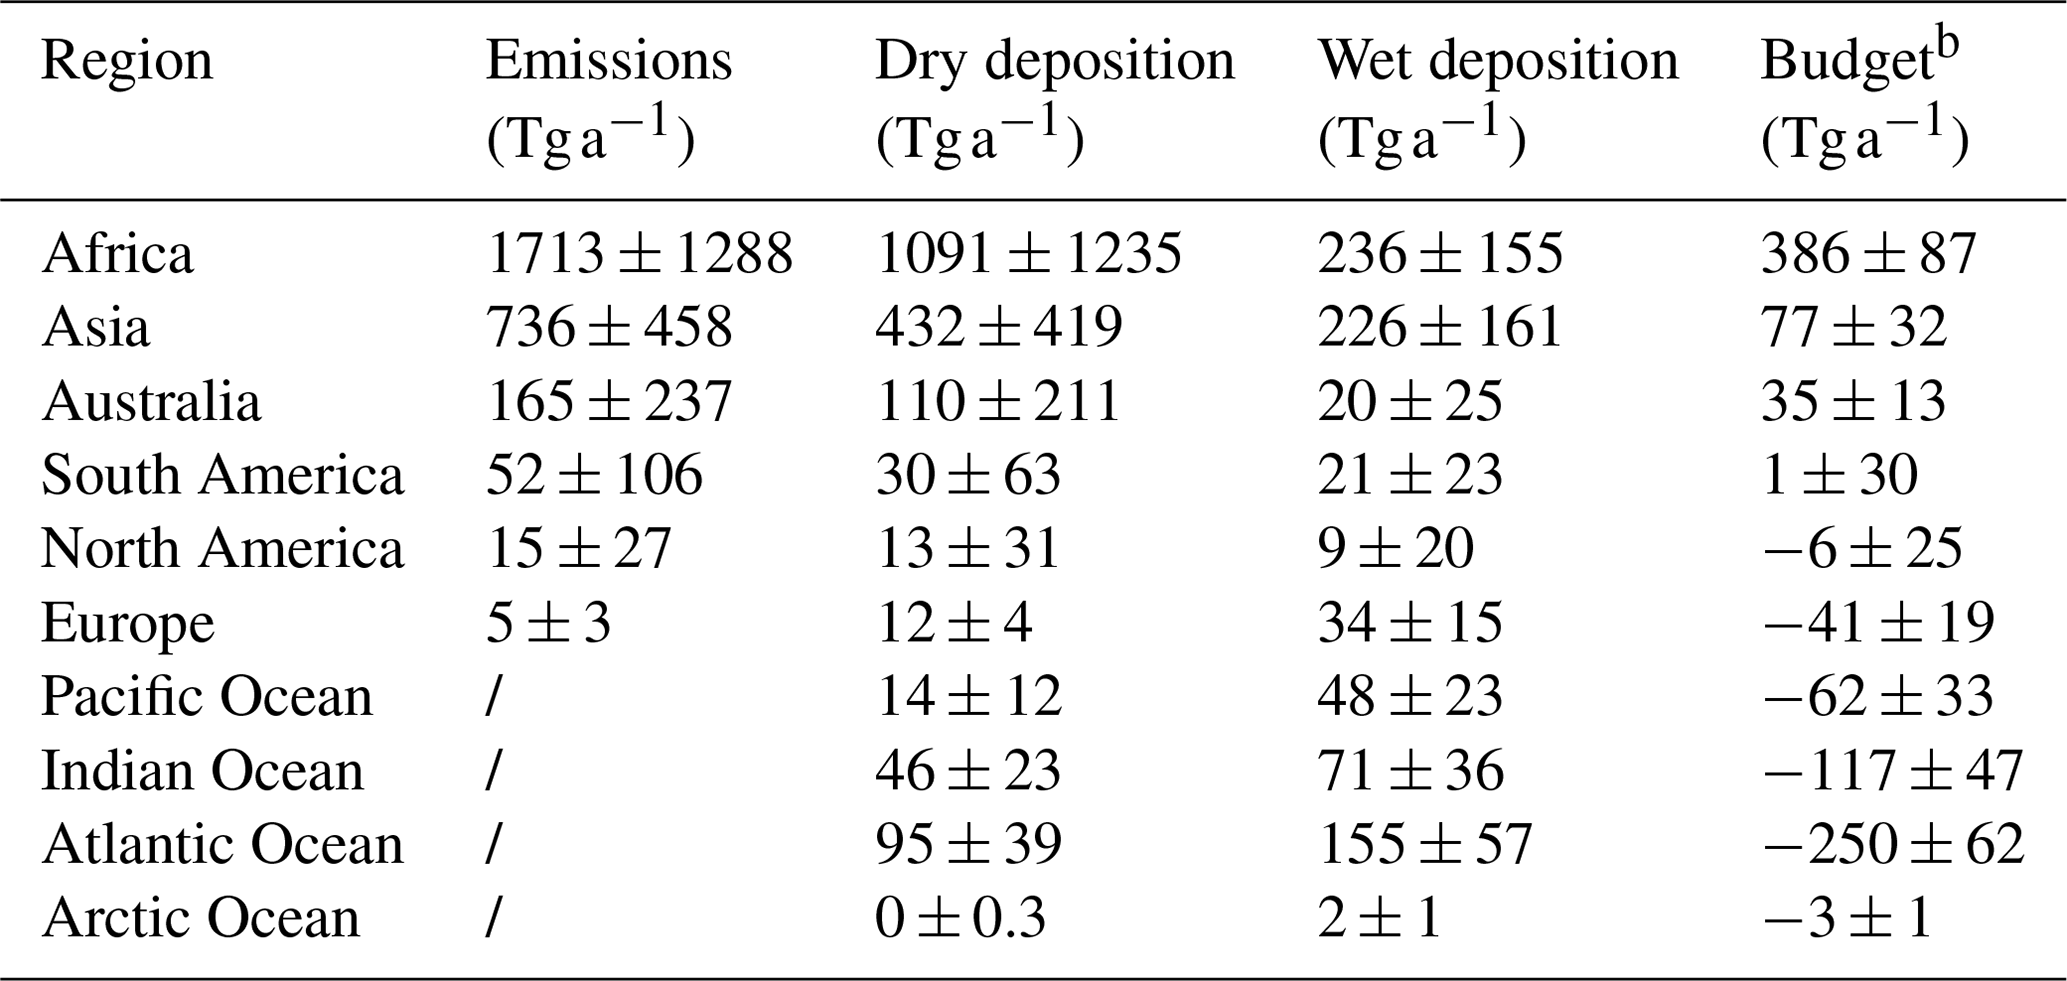
a Values from individual climate models are shown in Table S3. b Budget = emissions − dry deposition − wet deposition.
3.2 Dust cycle for the present day
Based on the selected models, the ensemble median dust emissions, concentrations, and depositions are assessed for 2005–2014 (Fig. 4). About 87 % of the dust emissions are located in the Northern Hemisphere, with hot spots over North Africa, Middle East, West Asia, and the Taklimakan and Gobi deserts (Fig. 4a). The source intensity is much smaller in the Southern Hemisphere, with moderate emissions over Australia, Southern Africa, and southern South America. The global total dust emissions from the ensemble of models is about 2566 ± 1996 Tg, to which the emissions from Africa alone contribute 67 % (Table 3). Three (CESM2, CESM2-WACCM, and NorESM2-LM) out of nine models show scattered emissions, while the rest show a more continuous distribution (Fig. S1 in the Supplement).
The spatial distribution of dust deposition resembles that of the emissions but with much larger coverage. Dry deposition is usually confined to the source regions (Fig. 4c) because dust particles with a large size are more likely to settle down and cannot travel far away from the source. In contrast, wet deposition is more dispersed (Fig. 4d) because small particles can be transported long distances to the downwind areas and finally washed out by the rain. On the global scale, the annual total dry deposition is 1749 ± 1919 Tg, more than 2 times the 796 ± 372 Tg by wet deposition.
The dust budget (emissions minus deposition) shows net sources of 386 ± 87 Tg a−1 in Africa and 77 ± 32 Tg a−1 in Asia (Tables 3 and S3). Meanwhile, the ocean acts as a net sink, with the largest sink of −250 ± 62 Tg a−1 in the Atlantic and a secondary sink of −117 ± 47 Tg a−1 in the Indian Ocean due to their vicinity to the source regions on the land. Following the emissions pattern, dust loading shows high values (> 120 mg m−2) around the source regions, especially in North Africa, and decreases gradually towards the global ocean (Fig. 4b).
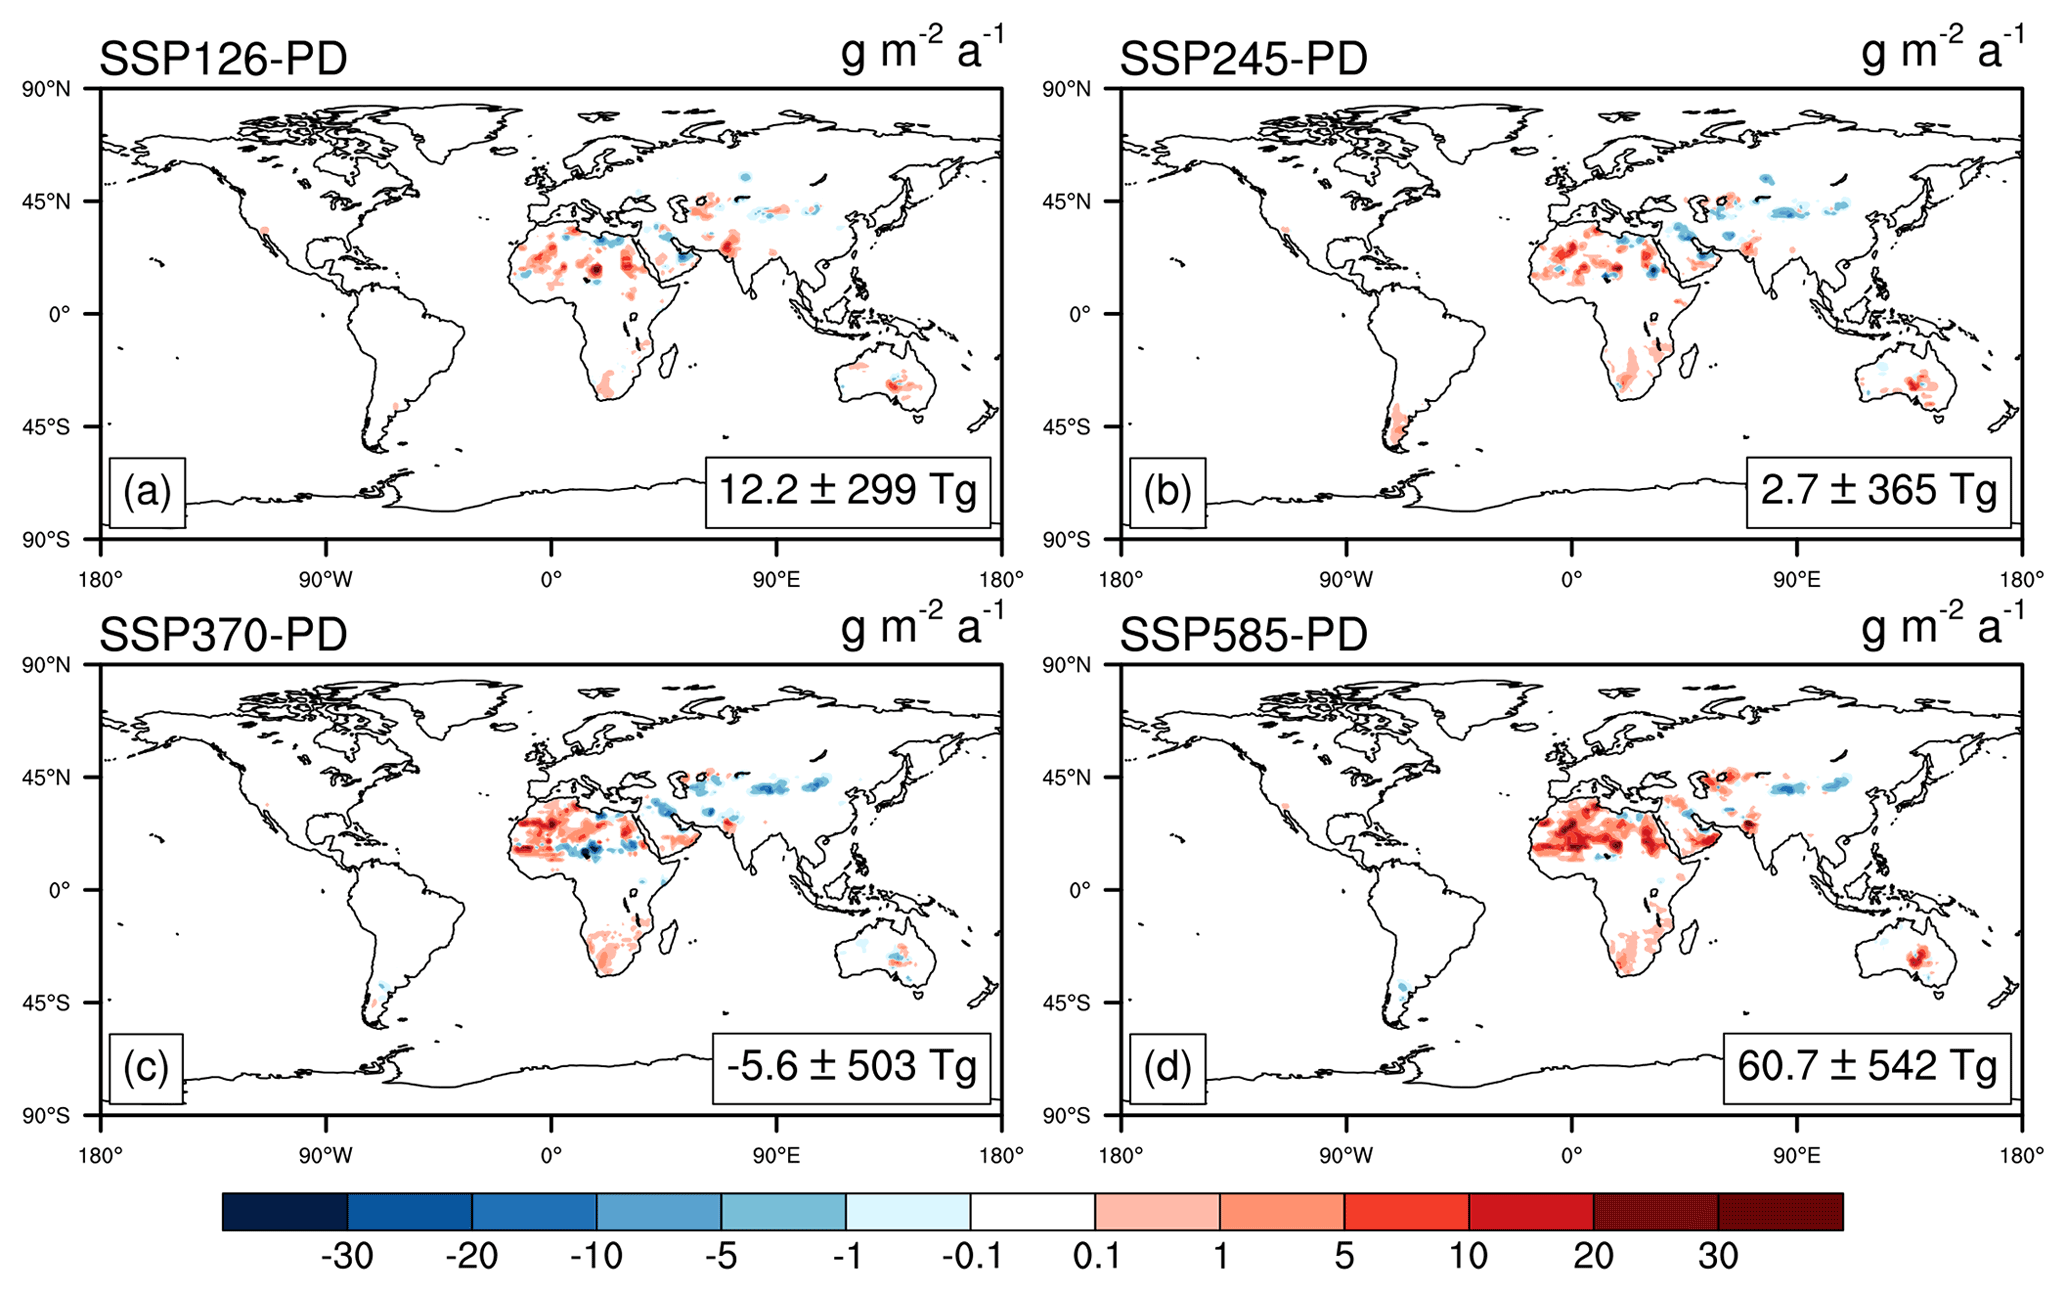
Figure 5Multi-model ensemble projection of the changes in dust emissions by the end of 21st century (2090–2099) relative to the present day (2005–2014) under four different anthropogenic emissions scenarios. The detailed projections during 2090–2099 for individual models are shown in Figs. S2–S5 under four different scenarios.
Table 4Multi-model ensemble projection of the absolute (Tg a−1) and relative changes (%) in dust emissions by the end of this century (2090–2099).
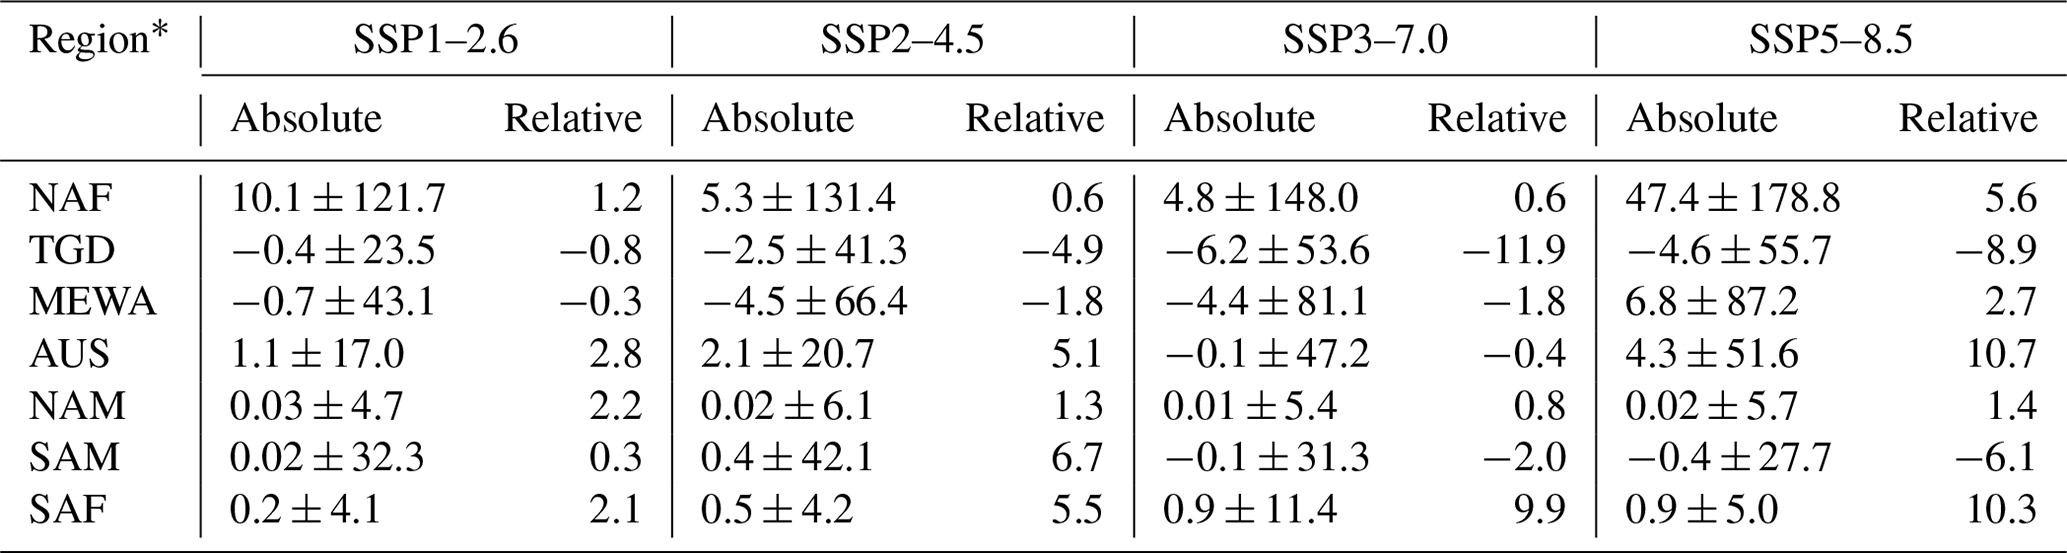
∗ The domain of each region is shown in Fig. 4a.
3.3 Projection of future dust emissions
We calculate the changes in the dust emissions at the end of the 21st century (2090–2099) relative to the present day (2005–2014). Global total emissions increase under three scenarios, with the largest change of 60.7 ± 542 Tg a−1 (5.0 %) in the SSP5–8.5 scenario (Fig. 5d). However, the total emissions show a moderate reduction of −5.6 ± 503 Tg a−1 (−0.46 %) in the SSP3–7.0 scenario (Fig. 5c). The most significant changes are located at the major dust source regions, such as North Africa, the Taklimakan, and the Middle East. Dust emissions in North Africa increase in all four scenarios, though with regional heterogeneous responses and a varied magnitude of 4.8–47.4 Tg a−1 (0.6 %–5.6 %; Table 4). The secondary enhancement is found in Australia, with increases of 1.1–4.3 Tg a−1 (2.8 %–10.7 %), except for the SSP3–7.0 scenario (Table 4). In contrast, dust emissions in the Taklimakan and Gobi deserts show decreases of −0.4 to −6.2 Tg a−1 (−0.8 % to −11.9 %), which are stronger than the enhancement in North Africa under the SSP3–7.0 scenario (Table 4). Furthermore, dust emissions over Asia (including the Taklimakan and Gobi deserts and West Asia and the Middle East) decrease in most scenarios, especially for SSP3–7.0, in which the regional reduction causes the global decline in the dust emissions (Fig. 5c). The intermodel variability is much higher than the projected median changes, suggesting the large uncertainties among climate models.
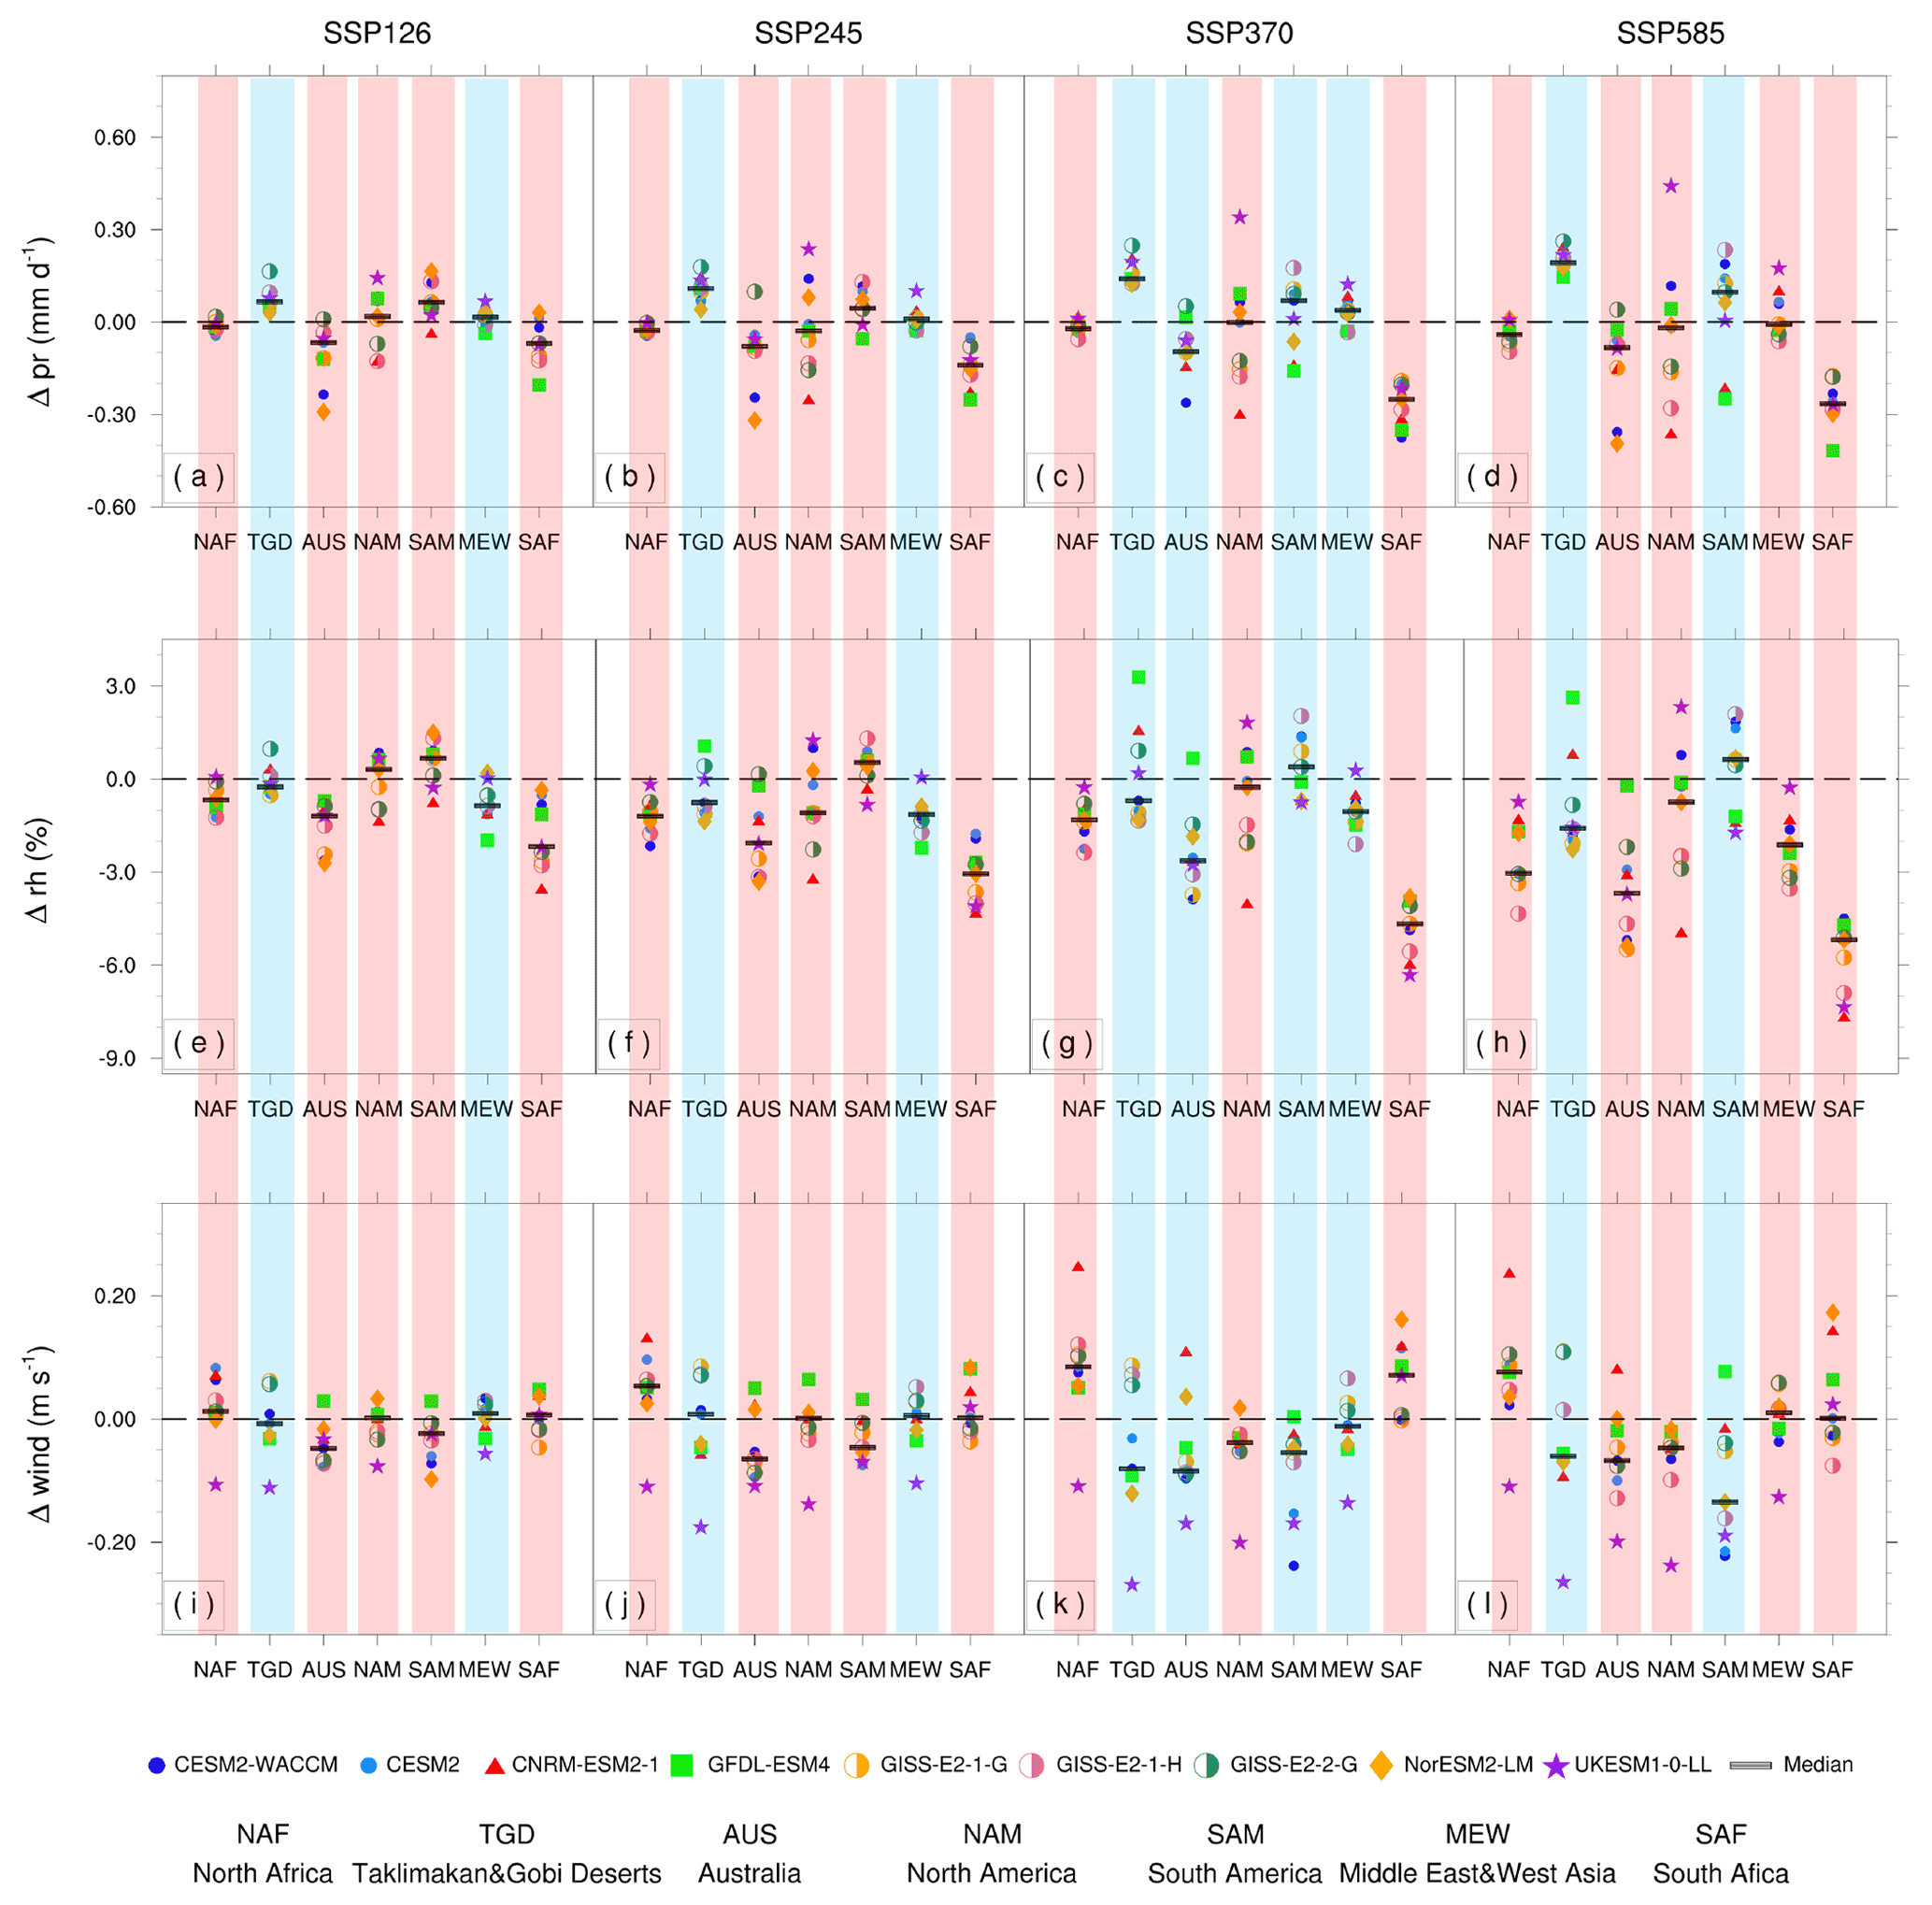
Figure 6Changes in the meteorological factors over main dust emissions regions under four SSP scenarios by the end of 21st century (2090–2099) relative to the present day (2005–2014). Each column represents a future climate scenario, including SSP1–2.6, SSP2–4.5, SSP3–7.0, and SSP5–8.5. Each row represents a meteorological factor, including precipitation (a–d), relative humidity (e–h), and surface wind (i–l). Regions with increasing emissions are marked with light red bars, while regions with emissions decreasing are marked with light blue bars.
We further explore the associated changes in the meteorological conditions at the source regions (Fig. 6). For North Africa, regional precipitation shows mild reductions under all four scenarios, even though the baseline rainfall is very low. The ensemble projections show decreased relative humidity of −0.6 % to −3.0 % and increased surface wind speed of 0.01–0.08 m s−1 over North Africa for all scenarios, contributing to the largest enhancement of regional dust emissions. Similarly, projections show decreased precipitation and relative humidity but increased surface wind over Southern Africa, resulting in the increase in the local emissions. As a comparison, precipitation, relative humidity, and surface wind all show decreasing trends in Australia, where the dust emissions increase for most scenarios, except SSP3–7.0. This indicates that the effect of drier conditions outweighs the decreased momentum for dust emissions in this specific region. Among the total of 18 region labels (the red labels in Fig. 6) with increased dust emissions under the four scenarios, 14 labels show decreased relative humidity by at least 0.5 %, 14 labels show decreased precipitation, and 10 labels show increased wind speed.
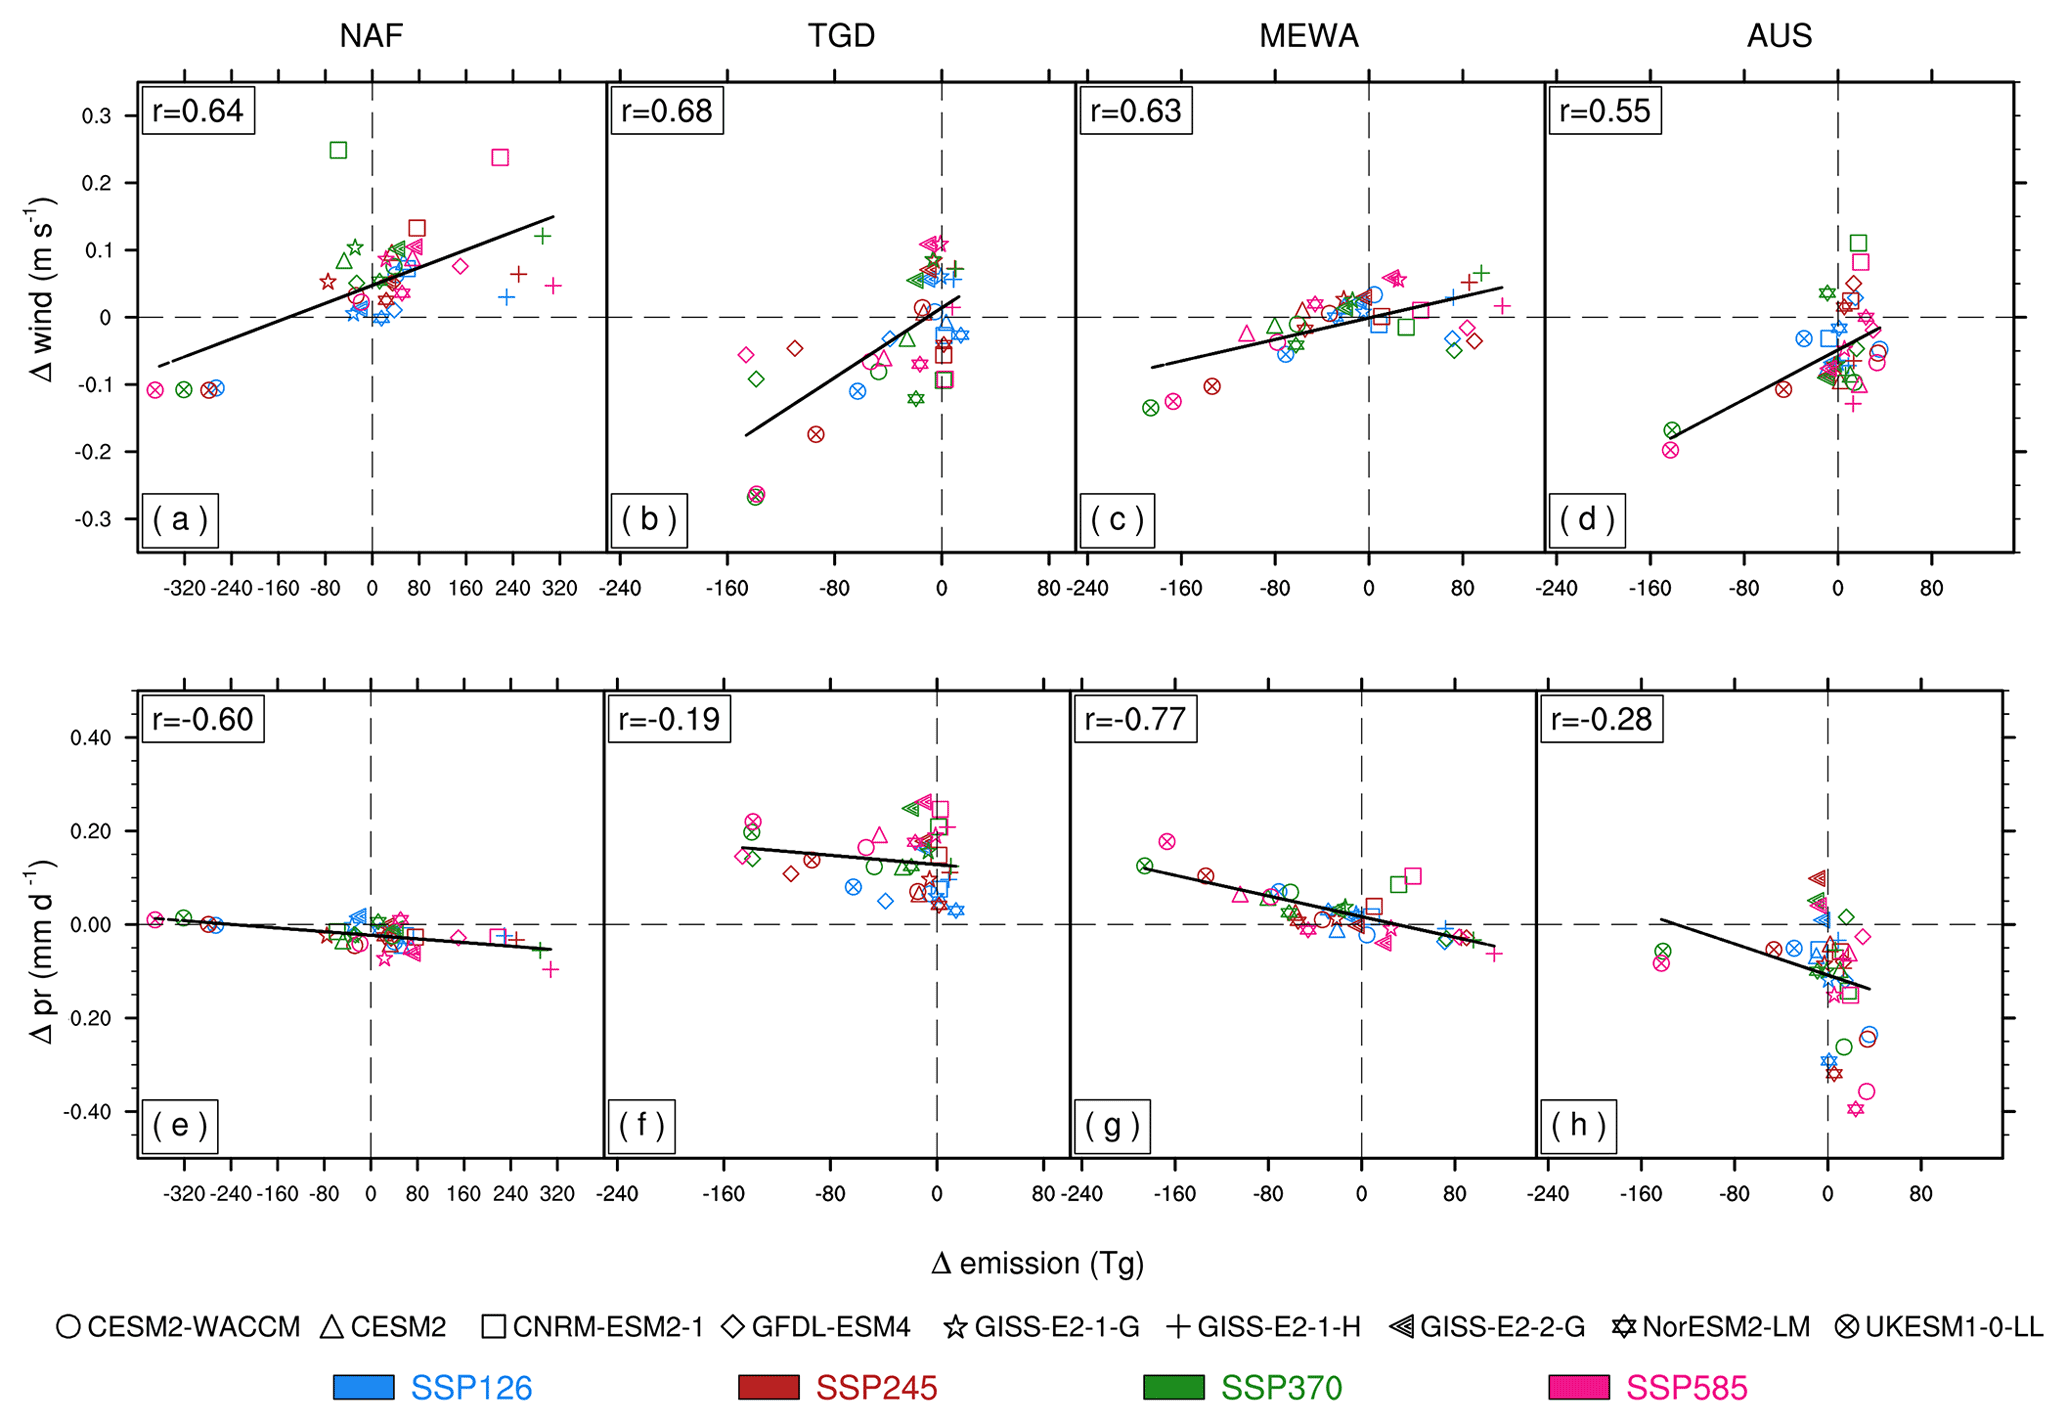
Figure 7Relationships between the changes in the dust emissions and the changes in the meteorological factors. Each column represents a source region, including North Africa (NAF), the Taklimakan and Gobi deserts (TGD), the Middle East and West Asia (MEWA), and Australia (AUS). Each row represents a meteorological factor, including surface wind (a–d) and precipitation (e–h).
In contrast, the future dust emissions decrease in the Taklimakan and Gobi deserts and the Middle East and West Asia under most scenarios (Fig. 5). Climate projections show increased precipitation (Fig. S6) and relative humidity (Fig. S7) but decreased wind speed (Fig. S8) over the source regions in the Taklimakan and Gobi deserts. All these changes in meteorological conditions tend to inhibit regional dust mobilization. The most significant reduction of 11.9 % occurs in SSP3–7.0 scenario, in which regional precipitation increases by 0.14 mm d−1 and surface wind speed decreases by 0.08 m s−1. For the Middle East and West Asia, the slight increase in the precipitation (Fig. 6) outweighs the moderate increase in the surface wind speed, leading to a decline in the regional dust emissions for SSP1–2.6 and SSP2–4.5 (Fig. 6). Specifically, almost all of the 10 regions labeled with reduced dust emissions under the four scenarios show increased regional precipitation but decreased wind speed, though eight labels show decreased relative humidity (Fig. 6). It suggests that the changes in precipitation and wind speed play more dominant roles in the changes seen in the dust emissions.
We select four main source regions where dust emissions are projected to increase by at least 1 Tg a−1 under most future climatic scenarios (Table 4). In these regions, we quantify the sensitivity of the dust emissions to perturbations in meteorological factors (Fig. 7). We find positive correlations between the changes in dust emissions and that of wind speed for all models and scenarios. The largest correlation coefficient of 0.68 is derived over the Taklimakan and Gobi deserts (Fig. 7b). In contrast, precipitation is negatively correlated with dust emissions across models and scenarios (Fig. 7). On average, we derive the increases in the dust emissions by a 33.1–123.3 Tg per 0.1 m s−1 increase in surface wind (Fig. 7a–d) and a 9.6–365.0 Tg per 0.1 mm d−1 reduction in precipitation (Fig. 7e–h) over the main dust source regions, based on the multi-model ensemble projections. Following these sensitivities, the intermodel spread of meteorological changes leads to the large uncertainties in the projection of future dust emissions. Among the nine climate models, UKESM1-0-LL shows the largest reductions in the wind speed, while having the largest enhancement of precipitation in most of source regions, thus resulting in the greatest decline in the dust emissions for this model under all the four scenarios (Fig. 7). In contrast, CNRM-ESM2-1 exhibits the largest increase in the wind speed and the consequent enhancement of dust emissions in North Africa. Meanwhile, CESM2-WACCM yields the greatest enhancement of dust emissions in Australia, where this model projects a pointed reduction in precipitation.
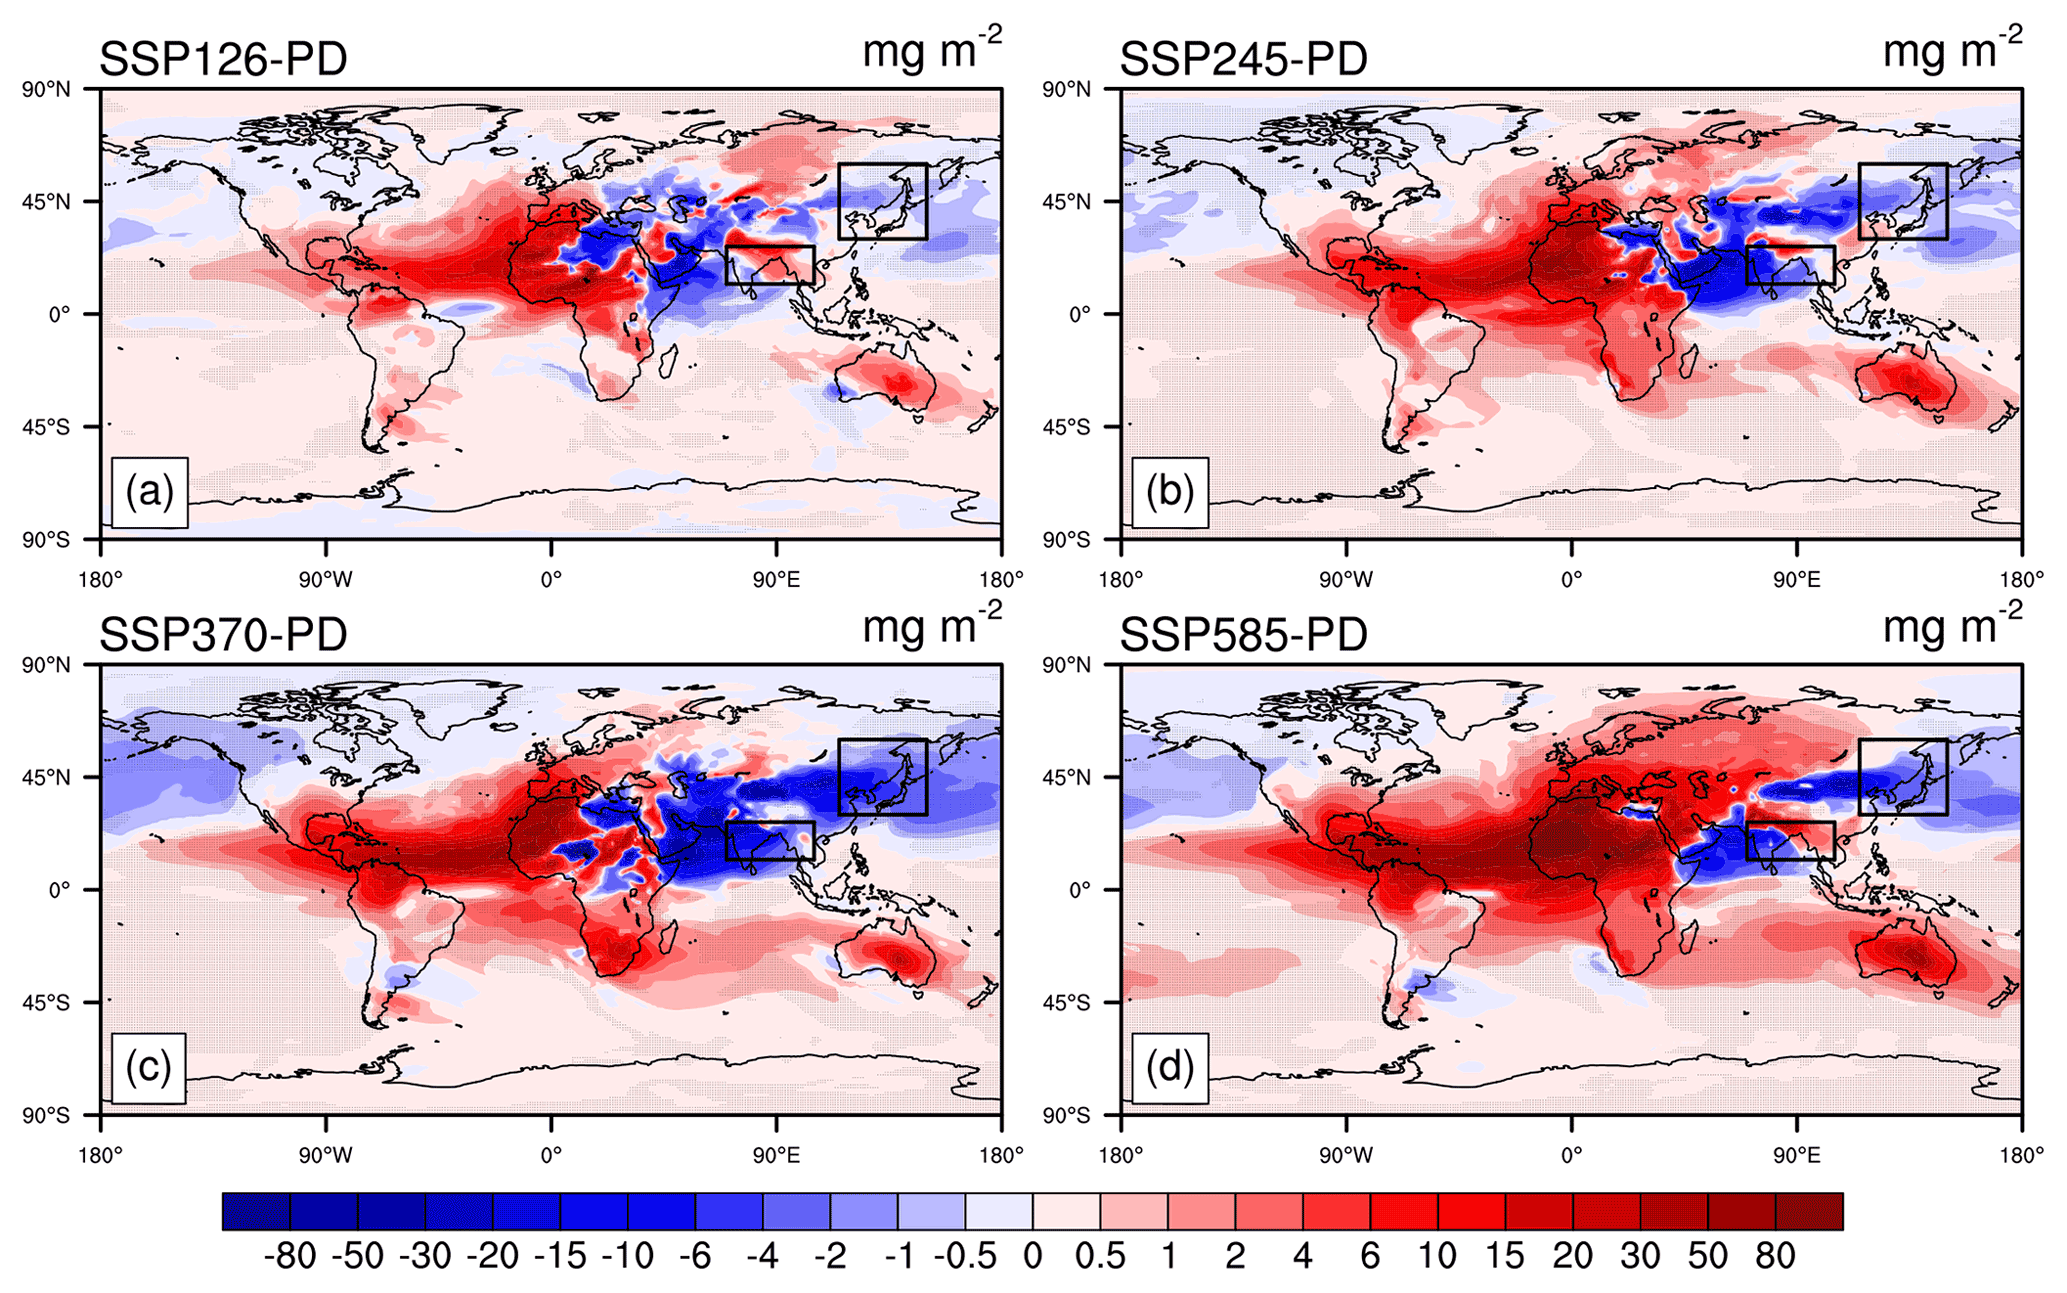
Figure 8Multi-model ensemble projection of the changes in the dust column load by the end of 21st century (2090–2099) relative to the present day (2005–2014). Dotted areas represent changes significant at the 90 % level. Two additional areas (in boxes) are selected for South Asia (12–27∘ N, 70–105∘ E) and East Asia (30–60∘ N, 115–150∘ E).
3.4 Projection of future dust loading
The dust column loading shows more continuous changes than dust emissions (Fig. 8). By the end of the 21st century, dust loading increases along the North Africa–Atlantic–North America and Australia–Southern Africa–South America belts but decreases along the central Asia–East Asia–North Pacific belt. Such a pattern is in general consistent among all four future scenarios, with the strongest magnitude under the SSP5–8.5 scenario. The loading in the Middle East and West Asia shows mixed responses, with an increasing trend in the SSP5–8.5 scenario but decreasing trends in other scenarios. In sum, dust loading increases by 0.1–668.3 Gg (1.0 %–13.5 %) with enhancement of column load in most regions, except for Asia and its downwind regions (Fig. 8 and Table S4).
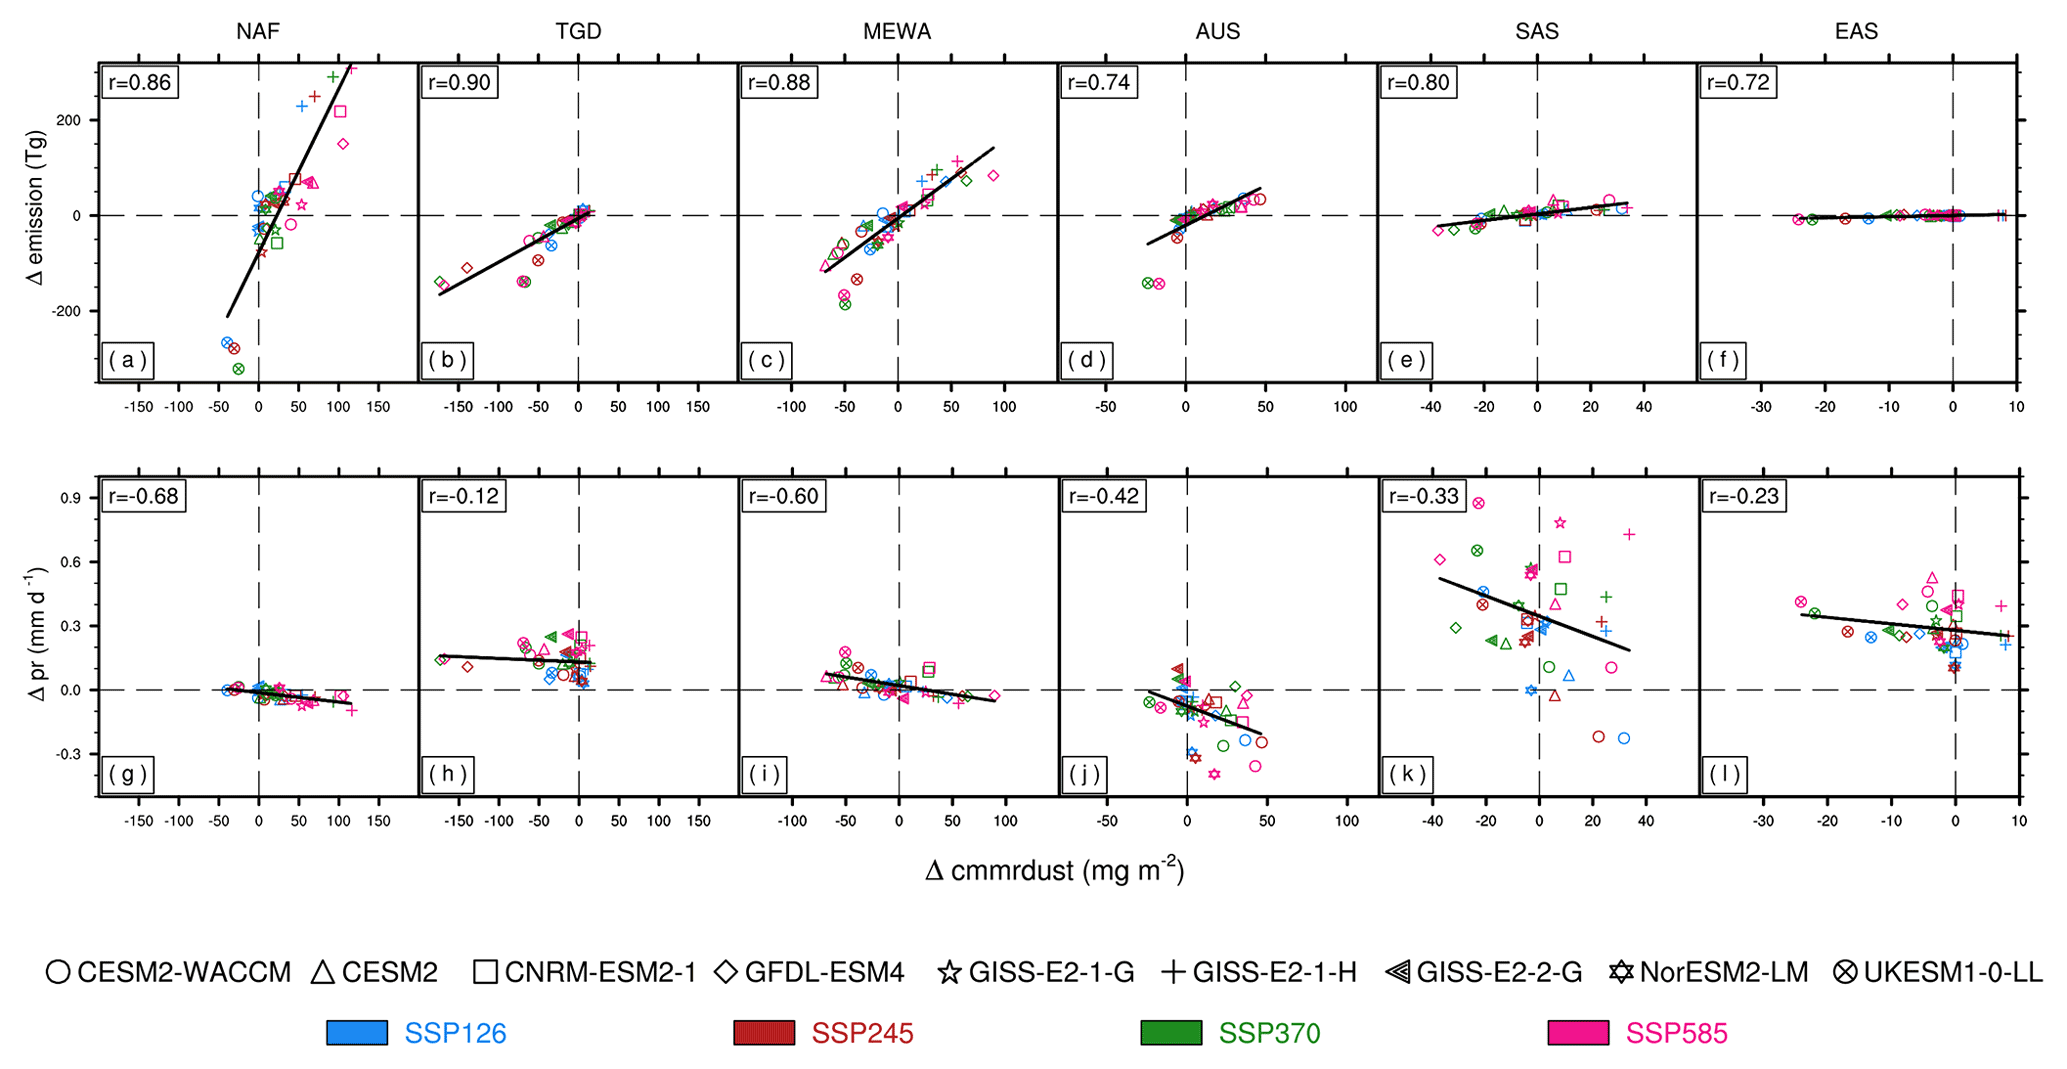
Figure 9Relationships between the changes in the dust column load and the change in the influencing factors. From left to right, each column represents a specific region, including North Africa (NAF), the Taklimakan and Gobi deserts (TGD), the Middle East and West Asia (MEWA), Australia (AUS), South Asia (SAS), and East Asia (EAS). Each row represents an influencing factor, including dust emissions (a–f) and precipitation (g–l).
We select four dust source regions and two non-source areas in Asia to analyze the driving factors for the changes in the dust loading (Fig. 9). Analyses show positive correlation coefficients ranging from 0.72 to 0.90 between dust loading and emissions. In contrast, negative correlations from −0.12 to −0.68 are yielded between the loading and precipitation. The higher magnitude of correlations in the former relationship suggests that the changes in the emissions dominate the variations in the dust loading. However, the role of precipitation cannot be ignored, as it can magnify the impact of emissions. For example, dust emissions in the source region of Southern Africa increase by 2.1 %–10.3 % under different scenarios (Table 4), while dust loading in this region increases by 2.2 %–38.3 % (Table S4). The higher enhancement of dust loading compared to emissions is mainly attributed to the decreased precipitation (Fig. S6), which reduces the proportion of wet deposition to the total deposition (Fig. S9).
For the non-source areas such as East Asia and South Asia, the moderate changes in the dust emissions cannot explain the significant reductions in the dust loading. Instead, the strong enhancement of regional precipitation (Fig. S6) helps promote wet deposition of dust in Asia, leading to the reduced number of suspended particles (Fig. 8) and the increased percentage of wet deposition to total deposition (Fig. S9). Studies have projected that global warming tends to enhance the East Asian summer monsoon and South Asian summer monsoon, leading to increased precipitation in the middle and low latitudes of Asia (Sabade et al., 2011; Wang et al., 2018; Wu et al., 2022). These changes are not favorable for regional dust mobilization but tend to decrease dust loading through increased wet deposition.
Based on the multi-model ensemble approach, our study projected the changes in the dust emissions and loadings by the end of the 21st century relative to the present day. It is found that dust emissions likely increase in Africa and Australia but decrease in Asia. Such a pattern is consistent among different climate scenarios, though the magnitude of regional changes shows some variations. As a result, the net changes in the global dust emissions vary among future scenarios, with moderate changes in SSP3–7.0 due to the strongest emissions reduction over Asia, but the large increase of 5.0 % in SSP5–8.5 is because of the prominent dust emissions enhancement in Africa. The changes in the dust loading in general follow that of emissions but with the joint impact of precipitation, which affects the loading through wet deposition. The decrease in precipitation may further promote dust loading over regions with increased emissions (e.g., Southern Africa) through the reduction in the wet deposition. In contrast, increased precipitation decreases the dust loading by more wet deposition over regions with moderate or limited changes in dust emissions (e.g., East Asia).
Our projection revealed large uncertainties in the future global dust cycle. These uncertainties firstly originated from the discrepancies in the dust emissions schemes and the size bins/ranges employed by different climate models. To limit the negative impacts of model diversity, we validated the simulated low-level dust concentrations and AOD and selected the models with reasonable performance. The ensemble mean of these selected models could better capture the observed magnitude and distribution of dust concentrations and AOD (Figs. 2 and 3). However, such validations excluded several available models, potentially increasing the uncertainties in the multi-model ensemble due to the small sample size. Based on the recent evaluations (Wu et al., 2022; Zhao et al., 2022), the latest version of the CMIP models did not improve the performance in the simulated dust cycles, including concentrations, deposition, and optical depth, suggesting that the more validations may rule out even more available models for the future projection. As a result, the observation-based constraint of emissions schemes (e.g., adjusting the tunable parameter C in Eq. 1) and size bins (e.g., extending or reducing the size range) in individual models is a requisite step to reduce the uncertainties in modeling the global dust cycle.
For this study, we did not validate the long-term trend of simulated dust variables due to the data limitations. A recent work by Kok et al. (2023) showed increasing global dust loading during historical periods with the glacier deposition records and found that all the CMIP6 models could not reproduce such a tendency. While this newly derived dataset provides a unique aspect for global dust activity, more validations are required and should use the ground-based concentrations and/or satellite-retrieved AOD. For example, the long-term records in China showed a decreasing trend of dust storms in East Asia during 1954–2000 (Wang et al., 2005), which is inconsistent with the upward trend in the same region, as revealed by Kok et al. (2023). Another limitation is that we ignore the possible impacts of vegetation changes on the future dust activity. Previous studies have revealed that dynamic vegetation process could significantly alter future dust activity (Woodward et al., 2022). However, we were not able to identify such effects because CMIP6 models do not output the information of dust sources and their strength. As a check, we compared the changes in the dust emissions at vegetation-free grid points for both historical and future periods so as to exclude the impacts of vegetation changes. We found very limited differences for those grids (Table S5) relative to the changes for all grids (Table 4), suggesting that the changes in the dust area are limited in most of the CMIP6 models.
We applied the multi-model ensemble approach to minimize the projection biases from individual models. We used the median instead of mean values from the selected models so that our projections reflected the tendency of the majority of the models rather than of the single model with maximum changes. For the present day, the ensemble projection reasonably captures the observed dust concentrations and AOD at most sites (Figs. 2 and 3). The predicted annual dust emissions of 2566 ± 1996 Tg are close to the estimate of 2836 Tg a−1, using an ensemble of five different dust models (Checa-Garcia et al., 2021). The largest emissions from Africa account for 67 % of the global emissions, similar to the estimates by previous studies (Wu et al., 2020; Aryal and Evans, 2021; Zhao et al., 2022). The global burden of 22 ± 8 Tg is close to the range of 12–25 Tg estimated by Zhao et al. (2022), who used three different datasets. For the future, our ensemble projected increases in the dust emissions in North Africa and Australia, while the reductions in central Asia are consistent with the results predicted when using two different models (Tegen et al., 2004). The ensemble projections with the nine selected models (Table 4) are in general consistent with the projections that use all 14 models (Table S6), especially for the enhancement of dust emissions in North Africa under all scenarios. However, both projections revealed large intermodel variability that may dampen the significance of the predicted changes.
Our sensitivity analyses showed the consistent dependence of dust emissions and loadings to meteorological variables among models and scenarios (Figs. 7 and 9). With such physical constraints, the trends of dust emissions are determined by the changes in the regional to global meteorological fields, especially from wind speed and precipitation. For example, models show contrasting tendencies of surface wind over North Africa (Fig. 7a) and precipitation in the Middle East and West Asia (Fig. 7g), leading to large intermodel variability, with the opposite signs for the changes in dust emissions by the end of 21st century. Given the importance of climate change, we checked the ensemble changes in precipitation (Fig. S10) and surface wind speed (Fig. S11) with all available CMIP6 models (32 models, as listed in Table S7). We found that the main features of increased drought and wind speed over North Africa and Southern Africa while enhanced rainfall over Asia was retained, following the “drier in dry and wetter in wet” pattern due to the land–air interactions through water and energy exchange (Feng and Zhang, 2015). It indicates that the main patterns of the changes in both dust emissions and loadings in our projections are solid. As a result, we suggest that dust emissions over the main source regions will likely enhance in a warming climate, contributing to the increased dust aerosol particles and radiative perturbations by the end of the 21st century.
The model output data from CMIP6 were downloaded from https://esgf-node.llnl.gov/search/cmip6/ (WCRP, 2023).
The supplement related to this article is available online at: https://doi.org/10.5194/acp-23-7823-2023-supplement.
XY conceived the study. XY and YZ designed the research, conducted the data analysis, and wrote the paper. YaC, JZ, CT, and HZ provided advice on writing the paper and helped with data analysis procedures. YuC, YH, WF, and XZ provided scientific advice. All co-authors contributed to improving the paper.
The contact author has declared that none of the authors has any competing interests.
Publisher's note: Copernicus Publications remains neutral with regard to jurisdictional claims in published maps and institutional affiliations.
The authors are grateful to the editor Yves Balkanski and two anonymous reviewers for their constructive comments that improved this study.
This research has been supported by the National Key Research and Development Program of China (grant no. 2019YFA0606802) and the Natural Science Foundation of Jiangsu Province (grant no. BK20220031).
This paper was edited by Yves Balkanski and reviewed by two anonymous referees.
Aryal, Y. N. and Evans, S.: Global Dust Variability Explained by Drought Sensitivity in CMIP6 Models, J. Geophys. Res.-Earth, 126, e2021JF006073, https://doi.org/10.1029/2021JF006073, 2021.
Bauer, S. E. and Koch, D.: Impact of heterogeneous sulfate formation at mineral dust surfaces on aerosol loads and radiative forcing in the Goddard Institute for Space Studies general circulation model, J. Geophys. Res., 110, D17202, https://doi.org/10.1029/2005jd005870, 2005.
Breuning-Madsen, H. and Awadzi, T. W.: Harmattan dust deposition and particle size in Ghana, Catena, 63, 23–38, https://doi.org/10.1016/j.catena.2005.04.001, 2005.
Checa-Garcia, R., Balkanski, Y., Albani, S., Bergman, T., Carslaw, K., Cozic, A., Dearden, C., Marticorena, B., Michou, M., van Noije, T., Nabat, P., O'Connor, F. M., Olivié, D., Prospero, J. M., Le Sager, P., Schulz, M., and Scott, C.: Evaluation of natural aerosols in CRESCENDO Earth system models (ESMs): mineral dust, Atmos. Chem. Phys., 21, 10295–10335, https://doi.org/10.5194/acp-21-10295-2021, 2021.
Csavina, J., Field, J., Félix, O., Corral-Avitia, A. Y., Sáez, A. E., and Betterton, E. A.: Effect of wind speed and relative humidity on atmospheric dust concentrations in semi-arid climates, Sci. Total Environ., 487, 82–90, https://doi.org/10.1016/j.scitotenv.2014.03.138, 2014.
Dunne, J. P., Horowitz, L. W., Adcroft, A. J., Ginoux, P., Held, I. M., John, J. G., Krasting, J. P., Malyshev, S., Naik, V., Paulot, F., Shevliakova, E., Stock, C. A., Zadeh, N., Balaji, V., Blanton, C., Dunne, K. A., Dupuis, C., Durachta, J., Dussin, R., Gauthier, P. P. G., Griffies, S. M., Guo, H., Hallberg, R. W., Harrison, M., He, J., Hurlin, W., McHugh, C., Menzel, R., Milly, P. C. D., Nikonov, S., Paynter, D. J., Ploshay, J., Radhakrishnan, A., Rand, K., Reichl, B. G., Robinson, T., Schwarzkopf, D. M., Sentman, L. T., Underwood, S., Vahlenkamp, H., Winton, M., Wittenberg, A. T., Wyman, B., Zeng, Y., and Zhao, M.: The GFDL Earth System Model Version 4.1 (GFDL-ESM 4.1): Overall Coupled Model Description and Simulation Characteristics, J. Adv. Model. Earth Sy., 12, e2019MS002015, https://doi.org/10.1029/2019MS002015, 2020.
Evans, S., Ginoux, P., Malyshev, S., and Shevliakova, E.: Climate-vegetation interaction and amplification of Australian dust variability, Geophys. Res. Lett., 43, 11823–11830, https://doi.org/10.1002/2016GL071016, 2016.
Feng, H. and Zhang, M.: Global land moisture trends: drier in dry and wetter in wet over land, Sci. Rep., 5, 18018, https://doi.org/10.1038/srep18018, 2015.
Fernandes, R., Dupont, S., and Lamaud, E.: Origins of Turbulent Transport Dissimilarity Between Dust and Momentum in Semiarid Regions, J. Geophys. Res.-Atmos., 125, e2019JD031247, https://doi.org/10.1029/2019jd031247, 2020.
Forster, P., Ramaswamy, V., Artaxo, P., Berntsen, T., Betts, R., Fahey, D. W., Haywood, J., Lean, J., Lowe, D. C., Raga, G., Schulz, M., Dorland, R. V., Bodeker, G., Etheridge, D., Foukal, P., Fraser, P., Geller, M., Joos, F., Keeling, C. D., Keeling, R., Kinne, S., Lassey, K., Oram, D., O'Shaughnessy, K., Ramankutty, N., Reid, G., Rind, D., Rosenlof, K., Sausen, R., Schwarzkopf, D., Solanki, S. K., Stenchikov, G., Stuber, N., Takemura, T., Textor, C., Wang, R., Weiss, R., Whorf, T., Nakajima, T., Ramanathan, V., Ramaswamy, V., Artaxo, P., Berntsen, T., Betts, R., Fahey, D. W., Haywood, J., Lean, J., Lowe, D. C., Myhre, G., Nganga, J., Prinn, R., Raga, G., Schulz, M., and Dorland, R. V.: Changes in Atmospheric Constituents and in Radiative Forcing, Climate Change 2007: The Physical Science Basis, Cambridge University Press, Cambridge, UK, 2008.
Ginoux, P., Chin, M., Tegen, I., Prospero, J. M., Holben, B., Dubovik, O., and Lin, S.-J.: Sources and distributions of dust aerosols simulated with the GOCART model, J. Geophys. Res.-Atmos., 106, 20255–20273, https://doi.org/10.1029/2000JD000053, 2001.
Ginoux, P., Prospero, J., Torres, O., and Chin, M.: Long-term simulation of global dust distribution with the GOCART model: correlation with North Atlantic Oscillation, Environ. Modell. Softw., 19, 113–128, https://doi.org/10.1016/s1364-8152(03)00114-2, 2004.
Goudie, A. S.: Desert dust and human health disorders, Environ. Int., 63, 101–113, https://doi.org/10.1016/j.envint.2013.10.011, 2014.
Jickells, T. D., An, Z. S., Andersen, K. K., Baker, A. R., Bergametti, G., Brooks, N., Cao, J. J., Boyd, P. W., Duce, R. A., Hunter, K. A., Kawahata, H., Kubilay, N., laRoche, J., Liss, P. S., Mahowald, N., Prospero, J. M., Ridgwell, A. J., Tegen, I., and Torres, R.: Global Iron Connections Between Desert Dust, Ocean Biogeochemistry, and Climate, Science, 308, 67–71, https://doi.org/10.1126/science.1105959, 2005.
Kelley, M., Schmidt, G. A., Nazarenko, L. S., Bauer, S. E., Ruedy, R., Russell, G. L., Ackerman, A. S., Aleinov, I., Bauer, M., Bleck, R., Canuto, V., Cesana, G., Cheng, Y., Clune, T. L., Cook, B. I., Cruz, C. A., Del Genio, A. D., Elsaesser, G. S., Faluvegi, G., Kiang, N. Y., Kim, D., Lacis, A. A., Leboissetier, A., LeGrande, A. N., Lo, K. K., Marshall, J., Matthews, E. E., McDermid, S., Mezuman, K., Miller, R. L., Murray, L. T., Oinas, V., Orbe, C., Garcia-Pando, C. P., Perlwitz, J. P., Puma, M. J., Rind, D., Romanou, A., Shindell, D. T., Sun, S., Tausnev, N., Tsigaridis, K., Tselioudis, G., Weng, E., Wu, J., and Yao, M. S.: GISS-E2.1: Configurations and Climatology, J. Adv. Model. Earth Sy., 12, e2019MS002025, https://doi.org/10.1029/2019MS002025, 2020.
Kok, J. F., Storelvmo, T., Karydis, V. A., Adebiyi, A. A., Mahowald, N. M., Evan, A. T., He, C., and Leung, D. M.: Mineral dust aerosol impacts on global climate and climate change, Nature Reviews Earth & Environment, 4, 71–86, https://doi.org/10.1038/s43017-022-00379-5, 2023.
Lawrence, D. M., Fisher, R. A., Koven, C. D., Oleson, K. W., Swenson, S. C., Bonan, G., Collier, N., Ghimire, B., Kampenhout, L. v., Kennedy, D., Kluzek, E., Lawrence, P. J., Li, F., Li, H., Lombardozzi, D., Riley, W. J., Sacks, W. J., Shi, M., Vertenstein, M., Wieder, W. R., Xu, C., Ali, A. A., Badger, A. M., Bisht, G., Broeke, M. v. d., Brunke, M. A., Burns, S. P., Buzan, J., Clark, M., Craig, A., Dahlin, K., Drewniak, B., Fisher, J. B., Flanner, M. G., Fox, A. M., Gentine, P., Hoffman, F., Keppel-Aleks, G., Knox, R., Kumar, S., Lenaerts, J., Leung, L. R., Lipscomb, W. H., Lu, Y., Pandey, A., Pelletier, J. D., Perket, J., Randerson, J. T., Ricciuto, D. M., Sanderson, B. M., Slater, A., Subin, Z. M., Tang, J., Thomas, R. Q., Martin, M. V., and Zeng, X.: The Community Land Model version 5: Description of new features, benchmarking, and impact of forcing uncertainty, J. Adv. Model. Earth Sy., 11, 4245–4287, https://doi.org/10.1029/2018MS001583, 2019.
Le, T. and Bae, D.-H.: Causal influences of El Niño–Southern Oscillation on global dust activities, Atmos. Chem. Phys., 22, 5253–5263, https://doi.org/10.5194/acp-22-5253-2022, 2022.
Li, J., Hao, X., Liao, H., Yue, X., Li, H., Long, X., and Li, N.: Predominant Type of Dust Storms That Influences Air Quality Over Northern China and Future Projections, Earths Future, 10, e2022EF002649, https://doi.org/10.1029/2022ef002649, 2022.
Li, W. and Wang, Y.: Reduced surface fine dust under droughts over the southeastern United States during summertime: observations and CMIP6 model simulations, Atmos. Chem. Phys., 22, 7843–7859, https://doi.org/10.5194/acp-22-7843-2022, 2022.
Liu, X., Yin, Z., Zhang, X., and Yang, X.: Analyses of the spring dust storm frequency of northern China in relation to antecedent and concurrent wind, precipitation, vegetation, and soil moisture conditions, J. Geophys. Res., 109, D16210, https://doi.org/10.1029/2004JD004615, 2004.
Mahowald, N. M., Baker, A. R., Bergametti, G., Brooks, N., Duce, R. A., Jickells, T. D., Kubilay, N., Prospero, J. M., and Tegen, I.: Atmospheric global dust cycle and iron inputs to the ocean, Global Biogeochem. Cy., 19, GB4025, https://doi.org/10.1029/2004GB002402, 2005.
Marticorena, B., Bergametti, G., Aumont, B., Callot, Y., N'Doum, C., and Legrand, M.: Modeling the atmospheric dust cycle 2. Simulation of Saharan dust sources, J. Geophys. Res., 102, 4387–4404, https://doi.org/10.1029/96JD02964, 1997.
Middleton, N. J.: Desert dust hazards: A global review, Aeolian Res., 24, 53–63, https://doi.org/10.1016/j.aeolia.2016.12.001, 2017.
Munkhtsetseg, E., Shinoda, M., Gillies, J. A., Kimura, R., King, J., and Nikolich, G.: Relationships between soil moisture and dust emissions in a bare sandy soil of Mongolia, Particuology, 28, 131–137, https://doi.org/10.1016/j.partic.2016.03.001, 2016.
Nabat, P., Somot, S., Mallet, M., Michou, M., Sevault, F., Driouech, F., Meloni, D., di Sarra, A., Di Biagio, C., Formenti, P., Sicard, M., Léon, J.-F., and Bouin, M.-N.: Dust aerosol radiative effects during summer 2012 simulated with a coupled regional aerosol–atmosphere–ocean model over the Mediterranean, Atmos. Chem. Phys., 15, 3303–3326, https://doi.org/10.5194/acp-15-3303-2015, 2015.
Oleson, K. W., Lawrence, D. M., Flanner, M. G., Kluzek, E., Levis, S., Swenson, S. C., Thornton, E., Dai, A., Decker, M., Dickinson, R., Feddema, J., Heald, C. L., Lamarque, J. F., Niu, G., Qian, T., Running, S., Sakaguchi, K., Slater, A., Stöckli, R., Wang, A., Yang, L., Zeng, X., and Zeng, X.: Technical Description of version 4.0 of the Community Land Model (CLM)(No. NCAR/TN-478+STR), University Corporation for Atmospheric Research, 266, https://doi.org/10.5065/D6FB50WZ, 2010.
Penner, J. E., Quaas, J., Storelvmo, T., Takemura, T., Boucher, O., Guo, H., Kirkevåg, A., Kristjánsson, J. E., and Seland, Ø.: Model intercomparison of indirect aerosol effects, Atmos. Chem. Phys., 6, 3391–3405, https://doi.org/10.5194/acp-6-3391-2006, 2006.
Pu, B. and Ginoux, P.: How reliable are CMIP5 models in simulating dust optical depth?, Atmos. Chem. Phys., 18, 12491–12510, https://doi.org/10.5194/acp-18-12491-2018, 2018.
Sabade, S. S., Kulkarni, A., and Kripalani, R. H.: Projected changes in South Asian summer monsoon by multi-model global warming experiments, Theor. Appl. Climatol., 103, 543–565, https://doi.org/10.1007/s00704-010-0296-5, 2011.
Schepanski, K.: Transport of Mineral Dust and Its Impact on Climate, Geosciences, 8, 151, https://doi.org/10.3390/geosciences8050151, 2018.
Shao, Y., Wyrwoll, K. H., Chappell, A., Huang, J., Lin, Z., McTainsh, G. H., Mikami, M., Tanaka, T. Y., Wang, X., and Yoon, S.: Dust cycle: An emerging core theme in Earth system science, Aeolian Res., 2, 181–204, https://doi.org/10.1016/j.aeolia.2011.02.001, 2011.
Stefanski, R. and Sivakumar, M. V. K.: Impacts of sand and dust storms on agriculture and potential agricultural applications of a SDSWS, IOP Conf. Ser. Earth Environ. Sci, 7, 012016, https://doi.org/10.1088/1755-1307/7/1/012016, 2009.
Tegen, I., Werner, M., Harrison, S. P., and Kohfeld, K. E.: Relative importance of climate and land use in determining present and future global soil dust emission, Geophys. Res. Lett., 31, L05105, https://doi.org/10.1029/2003GL019216, 2004.
Wang, S., Wang, J., Zhou, Z., and Shang, K.: Regional characteristics of three kinds of dust storm events in China, Atmos. Environ., 39, 509–520, https://doi.org/10.1016/j.atmosenv.2004.09.033, 2005.
Wang, T., Miao, J., Sun, J., and Fu, Y.: Intensified East Asian summer monsoon and associated precipitation mode shift under the 1.5 ∘C global warming target, Adv. Clim. Change Res., 9, 102–111, https://doi.org/10.1016/j.accre.2017.12.002, 2018.
Wittmann, M., Groot Zwaaftink, C. D., Steffensen Schmidt, L., Guðmundsson, S., Pálsson, F., Arnalds, O., Björnsson, H., Thorsteinsson, T., and Stohl, A.: Impact of dust deposition on the albedo of Vatnajökull ice cap, Iceland, The Cryosphere, 11, 741–754, https://doi.org/10.5194/tc-11-741-2017, 2017.
Woodward, S.: Mineral Dust in HadGEM2, Hadley Centre Technical Note, 087, Met Office Hadley Centre, Fitzroy Road, Exeter, EX1 3PB, UK, https://library.metoffice.gov.uk/Portal/Default/en-GB/RecordView/Index/2522462011 (last access: 20 April 2023), 2011.
Woodward, S., Sellar, A. A., Tang, Y., Stringer, M., Yool, A., Robertson, E., and Wiltshire, A.: The simulation of mineral dust in the United Kingdom Earth System Model UKESM1, Atmos. Chem. Phys., 22, 14503–14528, https://doi.org/10.5194/acp-22-14503-2022, 2022.
World Climate Research Programme (WCRP): CMIP6, World Climate Research Programme [data set], https://esgf-node.llnl.gov/search/cmip6/, last access: 20 April 2023.
Wu, C., Lin, Z., He, J., Zhang, M., Liu, X., Zhang, R., and Brown, H.: A process-oriented evaluation of dust emission parameterizations in CESM: Simulation of a typical severe dust storm in East Asia, J. Adv. Model. Earth Sy., 8, 1432–1452, https://doi.org/10.1002/2016MS000723, 2016.
Wu, C., Lin, Z., and Liu, X.: The global dust cycle and uncertainty in CMIP5 (Coupled Model Intercomparison Project phase 5) models, Atmos. Chem. Phys., 20, 10401–10425, https://doi.org/10.5194/acp-20-10401-2020, 2020.
Wu, Q., Li, Q., Ding, Y., Shen, X., Zhao, M., and Zhu, Y.: Asian summer monsoon responses to the change of land-sea thermodynamic contrast in a warming climate: CMIP6 projections, Adv. Clim. Change Res., 13, 205–217, https://doi.org/10.1016/j.accre.2022.01.001, 2022.
Yue, X., Wang, H., Wang, Z., and Fan, K.: Simulation of dust aerosol radiative feedback using the Global Transport Model of Dust: 1. Dust cycle and validation, J. Geophys. Res., 114, D10202, https://doi.org/10.1029/2008JD010995, 2009.
Zakey, A. S., Solmon, F., and Giorgi, F.: Implementation and testing of a desert dust module in a regional climate model, Atmos. Chem. Phys., 6, 4687–4704, https://doi.org/10.5194/acp-6-4687-2006, 2006.
Zhang, D., Gao, X., Zakey, A., and Giorgi, F.: Effects of climate changes on dust aerosol over East Asia from RegCM3, Adv. Clim. Change Res., 7, 145–153, https://doi.org/10.1016/j.accre.2016.07.001, 2016.
Zhang, J., Shao, Y., and Huang, N.: Measurements of dust deposition velocity in a wind-tunnel experiment, Atmos. Chem. Phys., 14, 8869–8882, https://doi.org/10.5194/acp-14-8869-2014, 2014.
Zhao, A., Ryder, C. L., and Wilcox, L. J.: How well do the CMIP6 models simulate dust aerosols?, Atmos. Chem. Phys., 22, 2095–2119, https://doi.org/10.5194/acp-22-2095-2022, 2022.
Zong, Q., Mao, R., Gong, D., Wu, C., Pu, B., Feng, X., and Sun, Y.: Changes in Dust Activity in Spring over East Asia under a Global Warming Scenario, Asia-Pac. J. Atmos. Sci., 57, 839–850, https://doi.org/10.1007/s13143-021-00224-7, 2021.