the Creative Commons Attribution 4.0 License.
the Creative Commons Attribution 4.0 License.
 | 13 Jul 2023
O3 and PAN in southern Tibetan Plateau determined by distinct physical and chemical processes
Wanyun Xu
Yuxuan Bian
Weili Lin
Yingjie Zhang
Yaru Wang
Zhiqiang Ma
Xiaoyi Zhang
Gen Zhang
Xiaobin Xu
Tropospheric ozone (O3) and peroxyacetyl nitrate (PAN) are both photochemical pollutants harmful to the ecological environment and human health. In this study, measurements of O3 and PAN as well as their precursors were conducted from May to July 2019 at Nam Co station (NMC), a highly pristine high-altitude site in the southern Tibetan Plateau (TP), to investigate how distinct transport processes and photochemistry contributed to their variations. Results revealed that, despite highly similar diurnal variations with steep morning rises and flat daytime plateaus that were caused by boundary layer development and downmixing of free-tropospheric air, day-to-day variations in O3 and PAN were in fact controlled by distinct physicochemical processes. During the dry spring season, air masses rich in O3 were associated with high-altitude westerly air masses that entered the TP from the west or the south, which frequently carried high loadings of stratospheric O3 to NMC. During the summer monsoon season, a northward shift of the subtropical jet stream shifted the stratospheric downward entrainment pathway also to the north, leading to direct stratospheric O3 entrainment into the troposphere of the northern TP, which traveled southwards to NMC within low altitudes via northerly winds in front of ridges or closed high pressures over the TP. Westerly and southerly air masses, however, revealed low O3 levels due to the overall less stratospheric O3 within the troposphere of low-latitude regions. PAN, however, was only rich in westerly or southerly air masses that crossed over polluted regions such as northern India, Nepal or Bangladesh before entering the TP and arriving at NMC from the south during both spring and summer. Overall, the O3 level at NMC was mostly determined by stratosphere–troposphere exchange (STE), which explained 77 % and 88 % of the observed O3 concentration in spring and summer, respectively. However, only 0.1 % of the springtime day-to-day O3 variability could be explained by STE processes, while 22 % was explained during summertime. Positive net photochemical formation was estimated for both O3 and PAN based on observation-constrained box modeling. Near-surface photochemical formation was unable to account for the high O3 level observed at NMC, nor was it the determining factor for the day-to-day variability of O3. However, it was able to capture events with elevated PAN concentrations and explain its day-to-day variations. O3 and PAN formation were both highly sensitive to NOx levels, with PAN being also quite sensitive to volatile organic compound (VOC) concentrations. The rapid development of transportation networks and urbanization within the TP may lead to increased emissions and loadings in NOx and VOCs, resulting in strongly enhanced O3 and PAN formation in downwind pristine regions, which should be given greater attention in future studies.
- Article
(17574 KB) - Full-text XML
-
Supplement
(4909 KB) - BibTeX
- EndNote


Ozone (O3) and peroxyacetyl nitrate (PAN) are key photochemical pollutants in the troposphere that are harmful to vegetation and human health (Kleindienst et al., 1990; Yukihiro et al., 2012; Taylor, 1969; Lefohn et al., 2017). Since O3 and PAN are both produced during the oxidation of volatile organic compounds (VOCs) in the presence of nitrogen oxides (NOx), they often share highly similar variational characteristics (Fischer et al., 2014). However, PAN is formed only from a limited number of oxygenated VOCs (OVOCs), which are typically oxidation products of alkenes (with low carbon numbers), aromatics and isoprene (Xu et al., 2021), while O3 can be practically formed from all VOCs. Additionally, the photochemical formation of O3 depends highly nonlinearly on its precursor concentrations, being insensitive to VOC changes under NOx-limited conditions and vice versa, while PAN varied nearly proportionally to its OVOC precursors, with additional influences from the NO2 to NO ratio (Xu et al., 2021). Thus, photochemistry can sometimes result in distinct variations of O3 and PAN, especially during cold seasons (Xu et al., 2021; Zhang et al., 2020). From the aspect of physical transport, O3 and PAN can both be transported over large distances. Since PAN is easily thermal decomposed under high temperatures, its transport is more favored in cold seasons or at higher altitudes. Early simulation studies suggested PAN to be an important reservoir for NOx in the troposphere and lower stratosphere (Singh and Hanst, 1981), redistributing NOx far from its source regions (Moxim et al., 1996). Different from PAN, O3 is naturally produced within the stratosphere and can be transported into the troposphere via stratosphere–troposphere exchange (STE) processes that are often associated with the occurrence of tropopause folds, cut-off lows, streamers near the polar-front jet or subtropical jet stream, and mid-latitude cyclones (Langford, 1999; Stohl et al., 2003; Sprenger et al., 2007; Tang et al., 2011). STE elevates tropospheric O3 and oxidation capacity at distinct latitudes during different seasons, with the largest mass fluxes in summer occurring mostly in higher mid-latitudes, followed by spring occurring mostly in lower mid-latitudes (Tang et al., 2011; Škerlak et al., 2014). Deep STE intrusions reaching the planetary boundary layer (PBL) and associated mass fluxes are largest during spring in China and the western part of North America.
While the variational characteristics, influence of photochemical formation, and transport on O3 and PAN have been widely investigated in polluted urban regions of China (Liu et al., 2018; Yao et al., 2019; Hu et al., 2020; Wei et al., 2020; Qiu et al., 2021; Zhang et al., 2021; Xu et al., 2021), those at remote background sites received less attention, especially for PAN. The Tibetan Plateau (TP), located in western China, is often called the “Third Pole” with its average altitude over 4000 m. Due to its harsh environment, the TP is only scarcely populated and thus highly pristine. The topography of the TP affects large-scale circulations with its strong thermal forcing, thereby influencing the weather, climate and air quality in eastern China (Yang et al., 2014). Surface O3 as a crucial greenhouse gas and with its deterministic role on atmospheric oxidation capacity has been paid certain attention in the TP, and special attention has been given to the photochemical formation of O3 under the strong radiative conditions at such high altitudes. Ma et al. (2002) investigated the photochemical formation of O3 at Mt. Waliguan (WLG) in the northeastern TP through box modeling and suggested wintertime net production and summertime net loss in O3. Xue et al. (2013) further constrained the box model with VOC sampling results, mainly including hydrocarbons and aromatic compounds (no oxygenated compounds), and found net O3 formation at WLG during both spring and summer 2003. Air-mass transport from central and eastern China was found to be frequent during summertime (Xue et al., 2011; W. Xu et al., 2018), revealing higher O3 production efficiencies (Xue et al., 2011) and being held responsible for rising O3 trends during summer and autumn (Xu et al., 2016; W. Xu et al., 2018). Due to its high altitude, the TP revealed the largest deep STE O3 mass fluxes, with higher fluxes in spring and winter and lower ones in summer and autumn, especially in the southeastern TP (Škerlak et al., 2014). At WLG, O3 was observed to be strongly influenced by STE associated with the subtropical jet during spring and summer in 2003, with stronger impacts during summer than spring (Ding and Wang, 2006; Zheng et al., 2008). STE was estimated to contribute an annual average of 10.2 % to tropospheric O3 at WLG based on the numerical global atmosphere–chemistry model EMAC (ECHAM/MESSy Atmospheric Chemistry) simulations using tagged tracers, revealing a peak contribution in June (Liu et al., 2020). At Nam Co station (NMC) in the southern TP stratospheric influence was also mainly observed during spring and summer, which was estimated to contribute 20 % and 10 %, respectively, based on model simulations (Yin et al., 2017). Measurements from Dangxiong, a lower site not far from NMC, also revealed significant stratospheric impacts on surface O3 (Lin et al., 2015). At Xianggelila station in the southeastern TP, the STE impact was suggested to be most pronounced during winter and weakest during spring and summer based on surface observations (Ma et al., 2014), which however was in disagreement with modeling results revealing strongest STE during April and May, with an annual average contribution of 4.3 %. In comparison, PAN was far less investigated, and the few existing studies mainly focused on the impact of transport on local PAN variations. Zhang et al. (2009) made measurements of O3 and PAN at WLG station during summer 2006 and found that the two oxidants exhibited distinct diurnal variations and only weak correlations to each other, suggesting they were controlled by different processes, with PAN being strongly influenced by regional transport of polluted air plumes. Xue et al. (2011) analyzed the same set of observations and reported PAN to be one of the most abundant reactive nitrogen species (NOy) at WLG, contributing 32 % to total NOy. X. Xu et al. (2018) made measurements of O3 and PAN at NMC station in summer 2011 and late spring to early summer 2012, detecting highly similar diurnal variations in both gases caused by boundary layer development and elevated PAN in connection with transport of air plumes crossing over Nepal, northern Pakistan or northern India.
Despite the findings in previous literature, the physicochemical factors determining the variation of O3 and PAN in the TP and their relative contributions have not been comprehensively investigated mainly due to the lack of comprehensive online VOC observations and accurate NOx measurements. In this study, we present integrated real-time measurements of O3, PAN, NO2, VOCs, CH4, CO, photolysis rates and other meteorological parameters during spring and summer 2019 at NMC station and analyzed them in combination with reanalysis data, utilizing trajectory modeling and box-modeling approaches. The different impact of distinct transport processes and photochemical formation on O3 and PAN, as well as differences in sensitivities towards their precursors, are intercompared using improved box-model constraints, and the relative contributions of physical and chemical processes to O3 and PAN variability are evaluated.
2.1 Site, observations and data
As the first part of the @Tibet series campaign, a campaign was carried out at NMC station (30.77∘ N, 90. 95∘ E; 4730 m a.s.l.), which is a highly pristine site in the southern TP (Fig. 1). The site campus is located within the natural reserve of NMC lake, thus far away from anthropogenic activities and emissions. The nearest county (Dangxiong) and city (Lhasa) are located 40 and 125 km to the southeast of NMC, respectively. The NMC lake was ∼1 km to the north of our observation site, while the foothills of the northern Nyainqên Tanglha Mountains were ∼15 km to the south.

Figure 1Map displaying the locations of the Nam Co site (NMC), Dangxiong (DX) county and Lhasa city (LS). The topographical background figure was provided by the ArcGIS World Imagery Map service (https://doc.arcgis.com/en/data-appliance/6.4/maps/world-imagery.htm, last access: 1 November 2022).
Measurements were performed from 1 May to 31 July 2019. Instruments for gases (including O3, PAN, NO2, CO, CH4 and non-methane volatile organic compounds (NMVOCs)) were housed in an air-conditioned container. O3 was measured alternatingly at the heights of 1.8 and 6.8 m (switching between two heights at 15 min intervals) using a Model TE-49C commercial O3 analyzer, which was calibrated with a TE-49iPS O3 calibrator (both from Thermo Electronics, USA). A Los Gatos Research (LGR) NO2 analyzer was adopted for the measurements of NO2, which has a measurement range of 0.01–1000 ppb and was calibrated using NO2 standard gas at the beginning and end of the experiment. PAN measurements were made using a GC-ECD analyzer (Meteorologie Consult GmbH, Germany), which was calibrated using PAN instantly formed in the reaction of a NO reference gas with acetone in the internal calibration unit of the instrument. CO and CH4 were measured (until 2 July) by a cavity ring-down spectroscopy (CRDS) analyzer (Model G2401, Picarro, USA) at a high precision (0.4 and 0.04 ppb, respectively, for CO and CH4). The CRDS instrument was calibrated twice using a mixed CO and CH4 standard gas, which was pressurized in 29.5 L treated aluminum alloy cylinders (Scott-Marrin Inc.) fitted with high-purity, two-stage gas regulators and calibrated with cylinders assigned by the Global Atmosphere Watch (GAW) CO Central Calibration Laboratory operated by National Oceanic and Atmospheric Administration (NOAA) Earth System Research Laboratory (ESRL). NMVOCs were measured (only from 29 April to 21 May) using an online GC-MS/FID analysis system (TH-PKU 300B, Wuhan Tianhong Instrument Co. Ltd., China) at a 1 h time resolution, with detection limits in the range of 0.004 to 0.066 ppb. Multipoint calibrations were performed using Photochemical Assessment Monitoring Stations (PAMS) standard mixture and TO-15 standard mixture (100 ppb, Spectra Gases Inc., New Jersey, USA). To account for the reactivity of different VOC species, propy-equivalent VOC concentrations were calculated as
where C(i) is the ppbC concentration of species i (calculated using ppb mixing ratios multiplied by carbon numbers of species i), kOH(i) the reaction rate of species i with OH radicals (obtained from master chemical mechanism, MCM, http://mcm.york.ac.uk/MCM/, last access: 17 May 2023), and kOH(C3H6) the reaction rate of propene with OH.
Photolysis rates (J values) were obtained using a Metcon CCD spectrograph (Meteorologie Consult GmbH, Germany), whose receptor optics were mounted on top of the container at the height of 2 m. Conventional meteorological parameters including temperature (T), relative humidity (RH), surface pressure (P), wind speed (WS) and wind direction (WD) were recorded by an automatic weather station. In addition, meteorological reanalysis data (ERA5) from the European Centre for Medium-Range Weather Forecasts (ECMWF) were used for complementary analysis (https://cds.climate.copernicus.eu/#!/home, last access: 24 June 2023).
2.2 Backward trajectory analysis and PSCF calculations
The HYSPLIT model (version 5) from NOAA Air Resources Laboratory (Draxler and Hess, 1997, 1998; Draxler, 1999) was used for backward trajectory calculations, with 0.25∘ resolution Global Forecast System (GFS) model data from the National Center for Environmental Prediction (NCEP) adopted as input. The trajectory endpoint was set at 250 m a.g.l. (above ground level) of NMC station; 7 d (168 h) backward trajectories were calculated at an hourly interval for the entire period of the campaign.
The potential sources of high O3 and PAN were studied using the potential source contribution function (PSCF) analysis, which has been widely applied to detect possible source regions (Ara Begum et al., 2005; Lucey et al., 2001; Zhou et al., 2004). The PSCF on grid (i, j) is defined as
where m(i,j) is the residence time of a subset of trajectories, whereas n(i,j) is the residence time of all the trajectories in that grid. Each trajectory was associated with O3 and PAN concentrations observed at its time of arrival. To pin out the potential source regions for high O3 and PAN, the m(i,j) was calculated using the subset of trajectories that were associated with O3 or PAN concentrations higher than their respective 75th percentiles.
Abnormally high PSCF values may be produced for certain grids with very small n(i,j) values, which would induce large uncertainties. Thus, a weighting factor W(ni,j) is introduced that was proposed by Zeng and Hopke (1989), giving grids with few trajectories passing through less weight:
where is the average number of ni,j.
The PSCF analysis was respectively performed for O3 and PAN, separately for spring and summer periods. Based on meteorological variations, spring and summer periods were defined as 1 May to 15 June and 15 June to 31 July, respectively.
2.3 Box modeling of local photochemistry
The Master Chemical Mechanism (version 3.2) was used within the F0AM (version 3.1) box-model framework developed by Wolfe et al. (2016), to simulate the impacts of local photochemistry on O3 and PAN and to evaluate how much of their variations could be explained through local photochemistry. Observation data of VOCs, NO2, J values and meteorological parameters were either averaged or interpolated into 10 min averages and used as constraints in the model. Model simulations were only performed for the period from 1 to 21 May, when VOC observation data were available. To evaluate local O3 and PAN formation, three sets of simulations were performed for each, respectively, using measurement constraints on OVOCs, NO2 or both of them. In O3 simulation cases, PAN was constrained by observations, while in PAN simulations O3 was constrained. Daytime O3 and PAN increments (ΔO3,mod and ΔPANmod) were calculated and compared against observed ones (ΔO3,obs and ΔPANobs), with their ratios used to reflect how much modeled local photochemistry can explain observed daytime increases in O3 and PAN. Simulated O3 and PAN net formation rates in distinct modeling scenarios were intercompared and evaluated the sensitivity of their formation to VOCs and NOx concentrations.
2.4 Impact of stratospheric–tropospheric exchange
A Y index was defined as the ratio between normalized O3 and water vapor concentrations, calculated using the following equation:
The Y index adopted in previous studies for the identification of stratospheric air intrusions has additionally divided Eq. (3) by normalized CO concentrations (Ma et al., 2014). Due to the lack of CO measurements after 2 July, the Y index was modified to the current form (in Eq. 4), which compared well with those calculated when incorporating normalized CO concentrations (Fig. S1 in the Supplement), since CO revealed very small variability during the entire observation period.
Additionally, O3 mass mixing ratios from the ERA5 hourly reanalysis dataset were converted to volume mixing ratios and applied in the investigation of STE impacts, since the ERA5 data are simulated with simple stratospheric O3 chemistry consideration and thus mainly represent the physical transport of stratospheric O3 (Sprenger and Wernli, 2003). Additionally, ERA5 O3 data have been verified to be well representative of observed O3 profiles and ground concentration levels in remote polar regions (Wang et al., 2021), indicating that it can well represent stratospheric O3 and the influence of its transport.
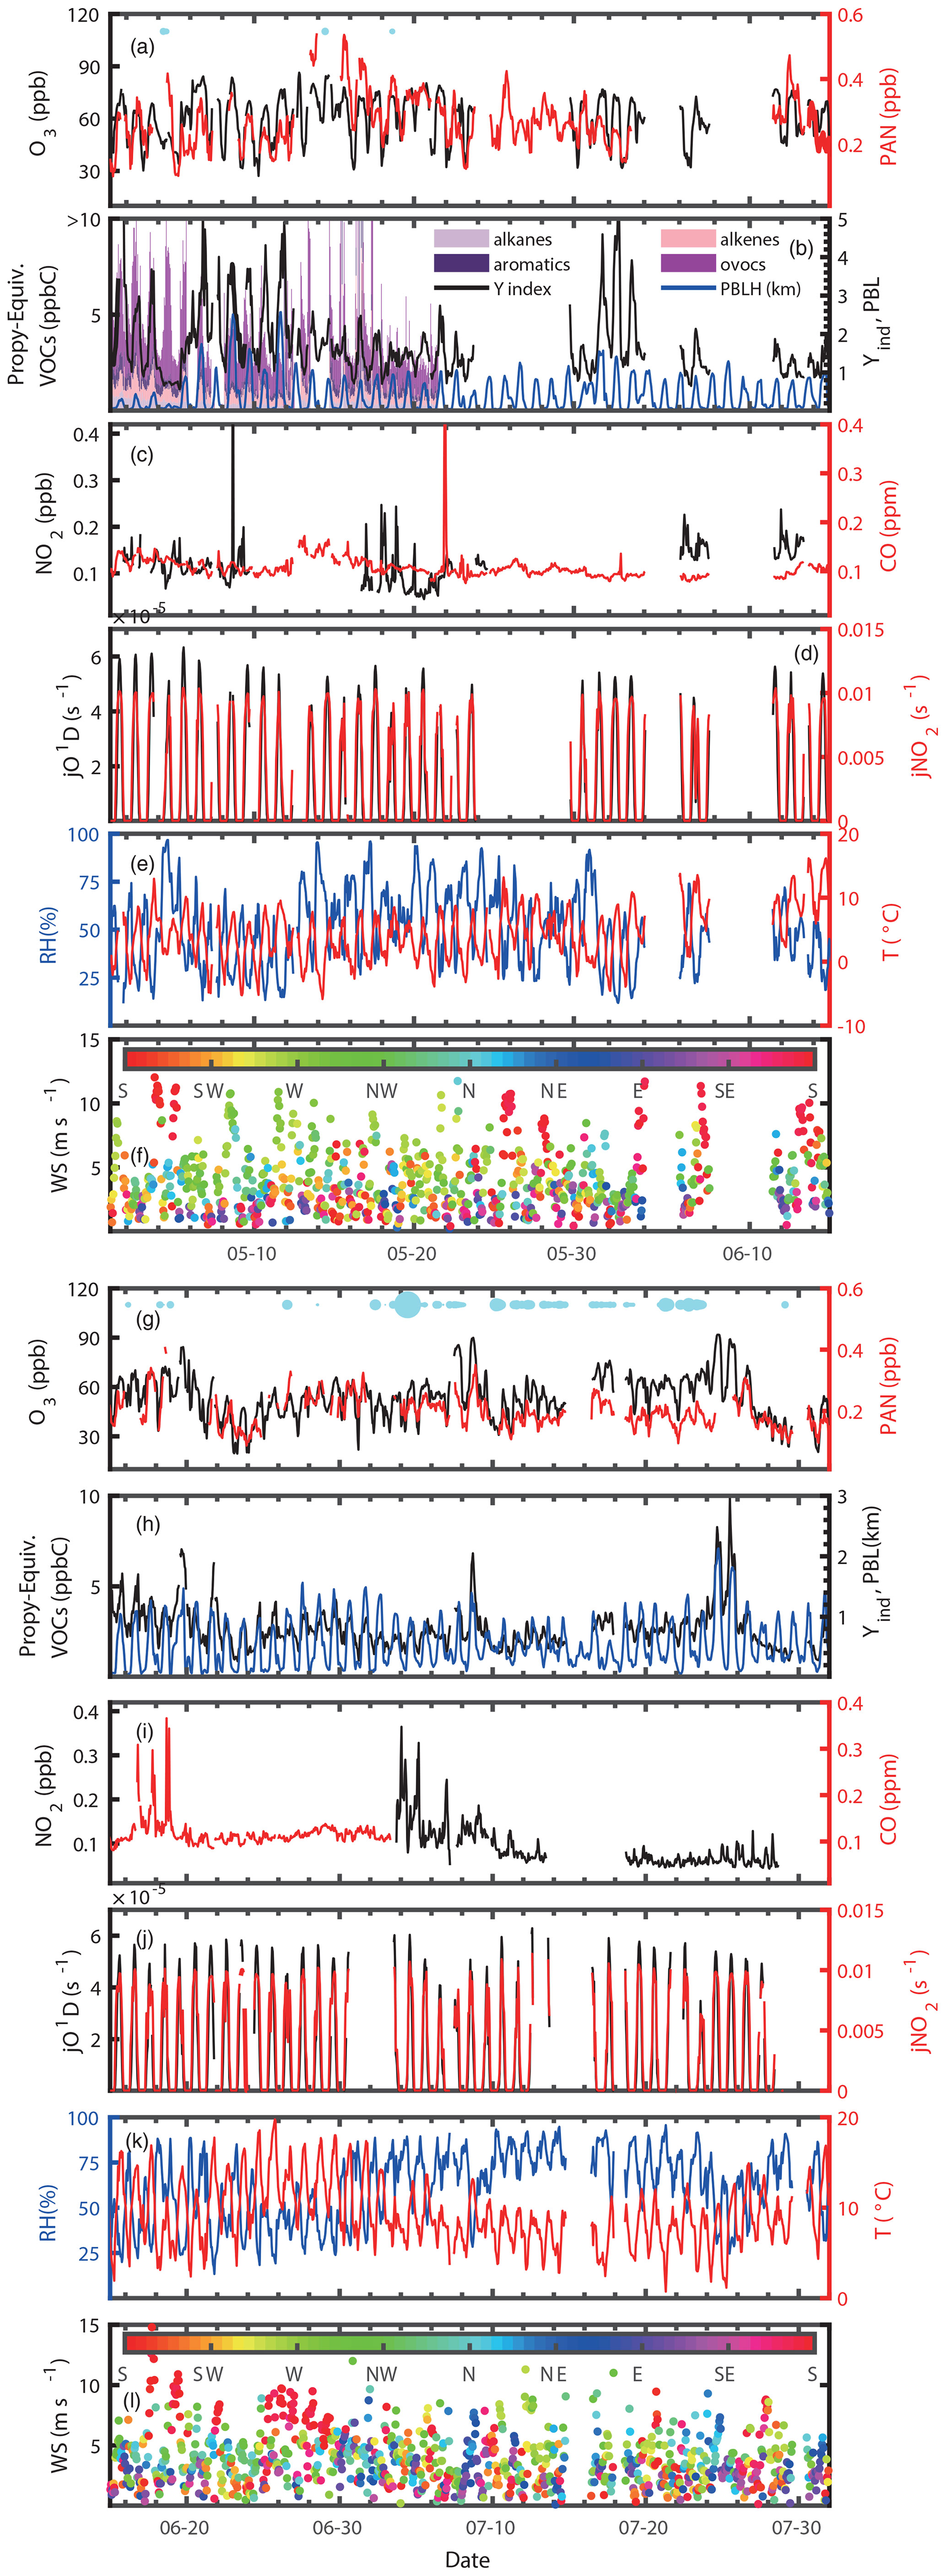
Figure 2Time series of (a, g) O3 (black), PAN (red), (b, h) VOCs (bars), Y index (black), PBLH (blue), (c, i) NO2 (black), CO (red), (d, j) jO1D (black), jNO2 (red), (e, k) RH (blue), T (red), (f, j) wind speed and wind direction (colored dots) during the spring (a–f, 1 May to 15 June) and summer (g–j, 15 June to 31 July) period at Nam Co.
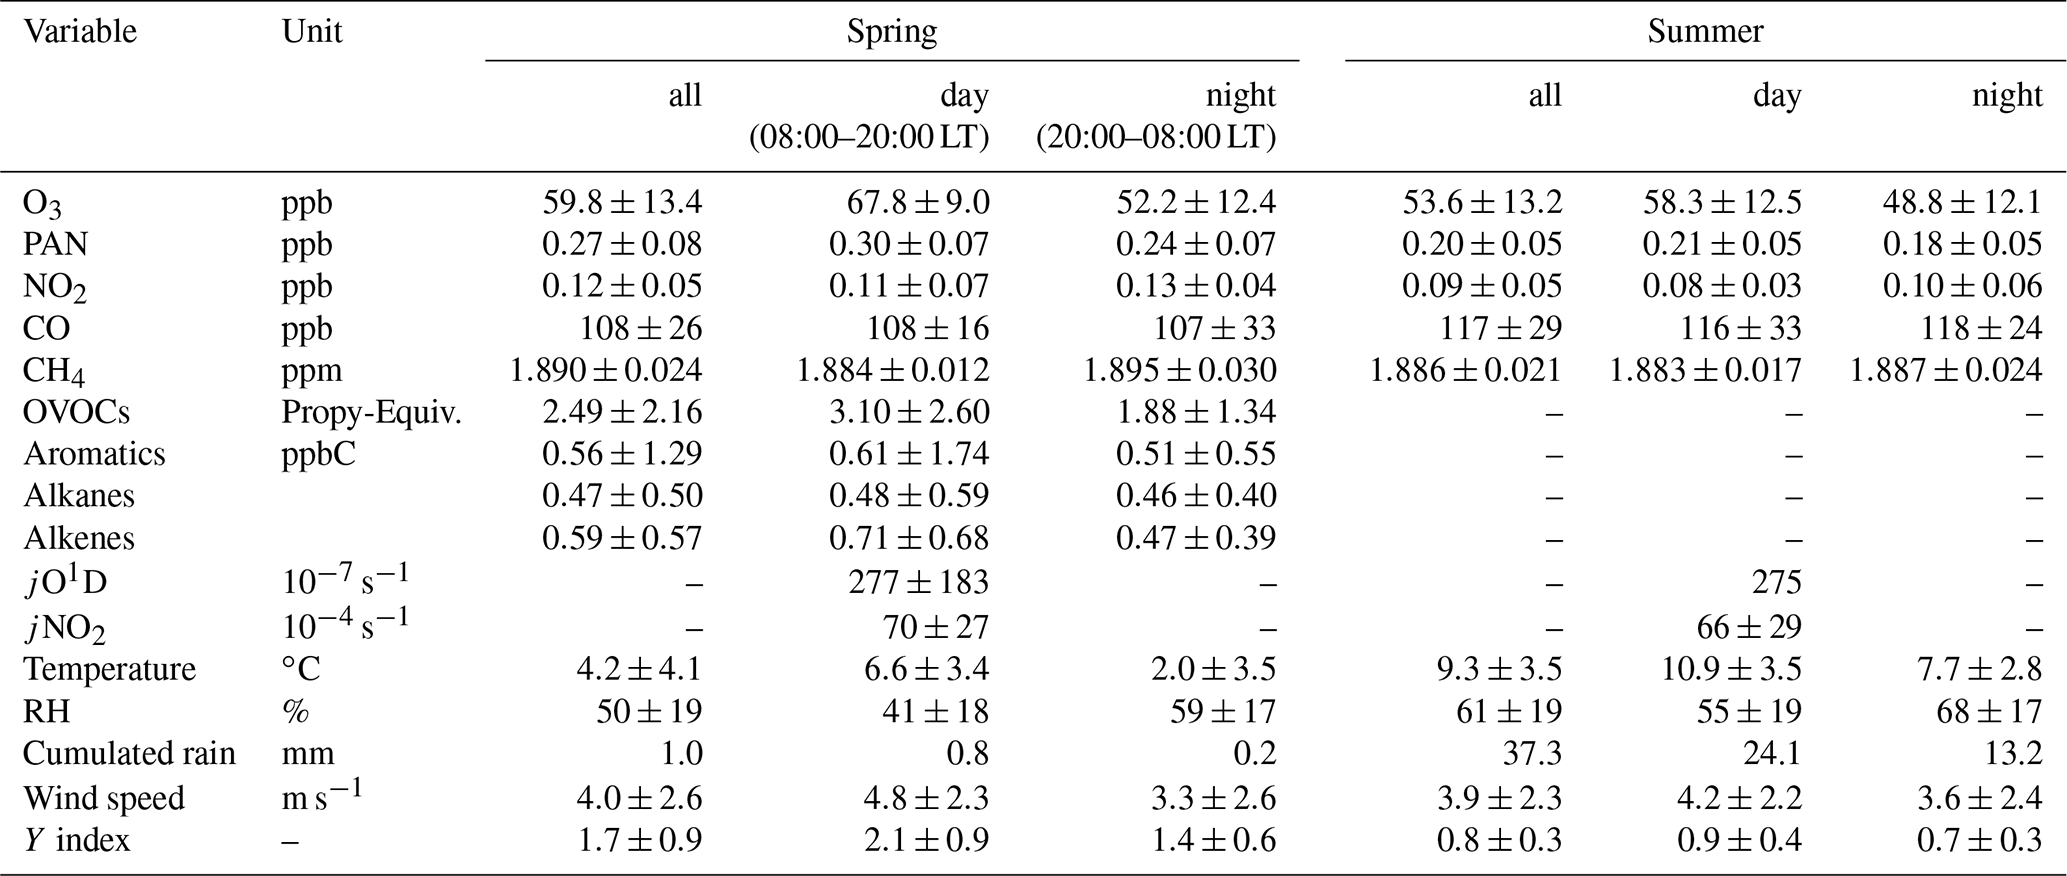
Table 1Statistics of trace gases (including O3, PAN, NO2, CO, OVOCs, aromatics, alkanes and alkenes), photolysis rates (jO1D and jNO2), meteorological variables, as well as the Y index.
3.1 Variational characteristics of O3, PAN and their precursors
The time series of observed O3, PAN, NO2, CO, photolysis rates of O3 (jO1D) and NO2 (jNO2), and meteorological parameters observed at NMC from 1 May to 31 July are displayed in Fig. 2. From 1 May to 15 June (defined hereafter as the spring period), NMC experienced cold temperatures, strong winds, and dry conditions with low relative humidity (RH) and hardly any precipitation except for three small snow events, while during 15 June to 31 July (defined hereafter as the summer period), temperatures increased, average wind speeds were smaller and frequent precipitation events occurred under the influence of the Asian summer monsoon (Fig. 2a, Table 1). Despite more frequent precipitation events, observed average daytime photolysis rates were similar between spring and summer periods.
Under such meteorological variations, O3 and PAN exhibited higher average concentrations in the spring (59.8±13.4 and 0.27±0.08 ppb) and lower ones in the summer period (53.6±13.2 and 0.20±0.05 ppb), with O3 levels being overall in accordance with previous observations (X. Xu et al., 2018; Yin et al., 2017), while PAN levels were significantly lower than those observed in 2012 (X. Xu et al., 2018). VOC concentrations were only obtained for the first half of the spring period, reaching average concentrations of 4.9±3.3 Propy-Equiv. ppbC (10.5±3.2 ppb), to which OVOCs contributed 61±12 % (reaching 2.5±2.2 Propy-Equiv. ppbC on average), followed by alkenes (0.6±0.6 Propy-Equiv. ppbC), aromatics (0.6±1.3 Propy-Equiv. ppbC) and alkanes (0.5±0.5 Propy-Equiv. ppbC), which made up similar fractions (14±6 %, 13±7 %, and 11±4 %, respectively), while other components (including alkynes, halogenated VOCs and nitriles) had negligible impacts (1±1 %) on the overall VOC concentration and reactivity (Fig. S2). Alkanes, alkenes and aromatics observed at the Dinghu Mountain (1000 m a.s.l.) background site in southern China were 48, 40 and 29 times those observed at the Nam Co site (Wu et al., 2016). Those in the Rocky Mountain National Park (3498 m a.s.l.) were 1.2, 3.6 and 1.3 times those observed in this study (Benedict et al., 2019), while those observed during summertime (1994–1996) were 0.9, 14 and 1.6 times those in Nam Co (Ma et al., 2002), revealing the extremely low primary VOC emissions at our site. However, OVOC concentrations at Nam Co were 1.3 times those observed in the Rocky Mountains, while only 0.24 times those previously observed at Mt. Waliguan (Mu et al., 2007), indicating that air masses in the TP were strongly photochemically aged due to the strong radiation and high atmospheric oxidative capacity at high altitudes, with additional influences from natural sources such as plant emissions or animal excrement (mostly from yak and sheep). At Nam Co, concentrations of isoprene and its oxidation products (e.g., MVK and MACR) were very low (0.034 ppb in total), with OVOCs being mostly dominated by formaldehyde, acetaldehyde and acetone (3.2 ppb in total), which have shown elevated concentrations over animal excrement (Mu et al., 2007). While daytime concentrations of OVOCs and alkenes were significantly higher than those during nighttime, other VOC species did not display much day–night discrepancy.
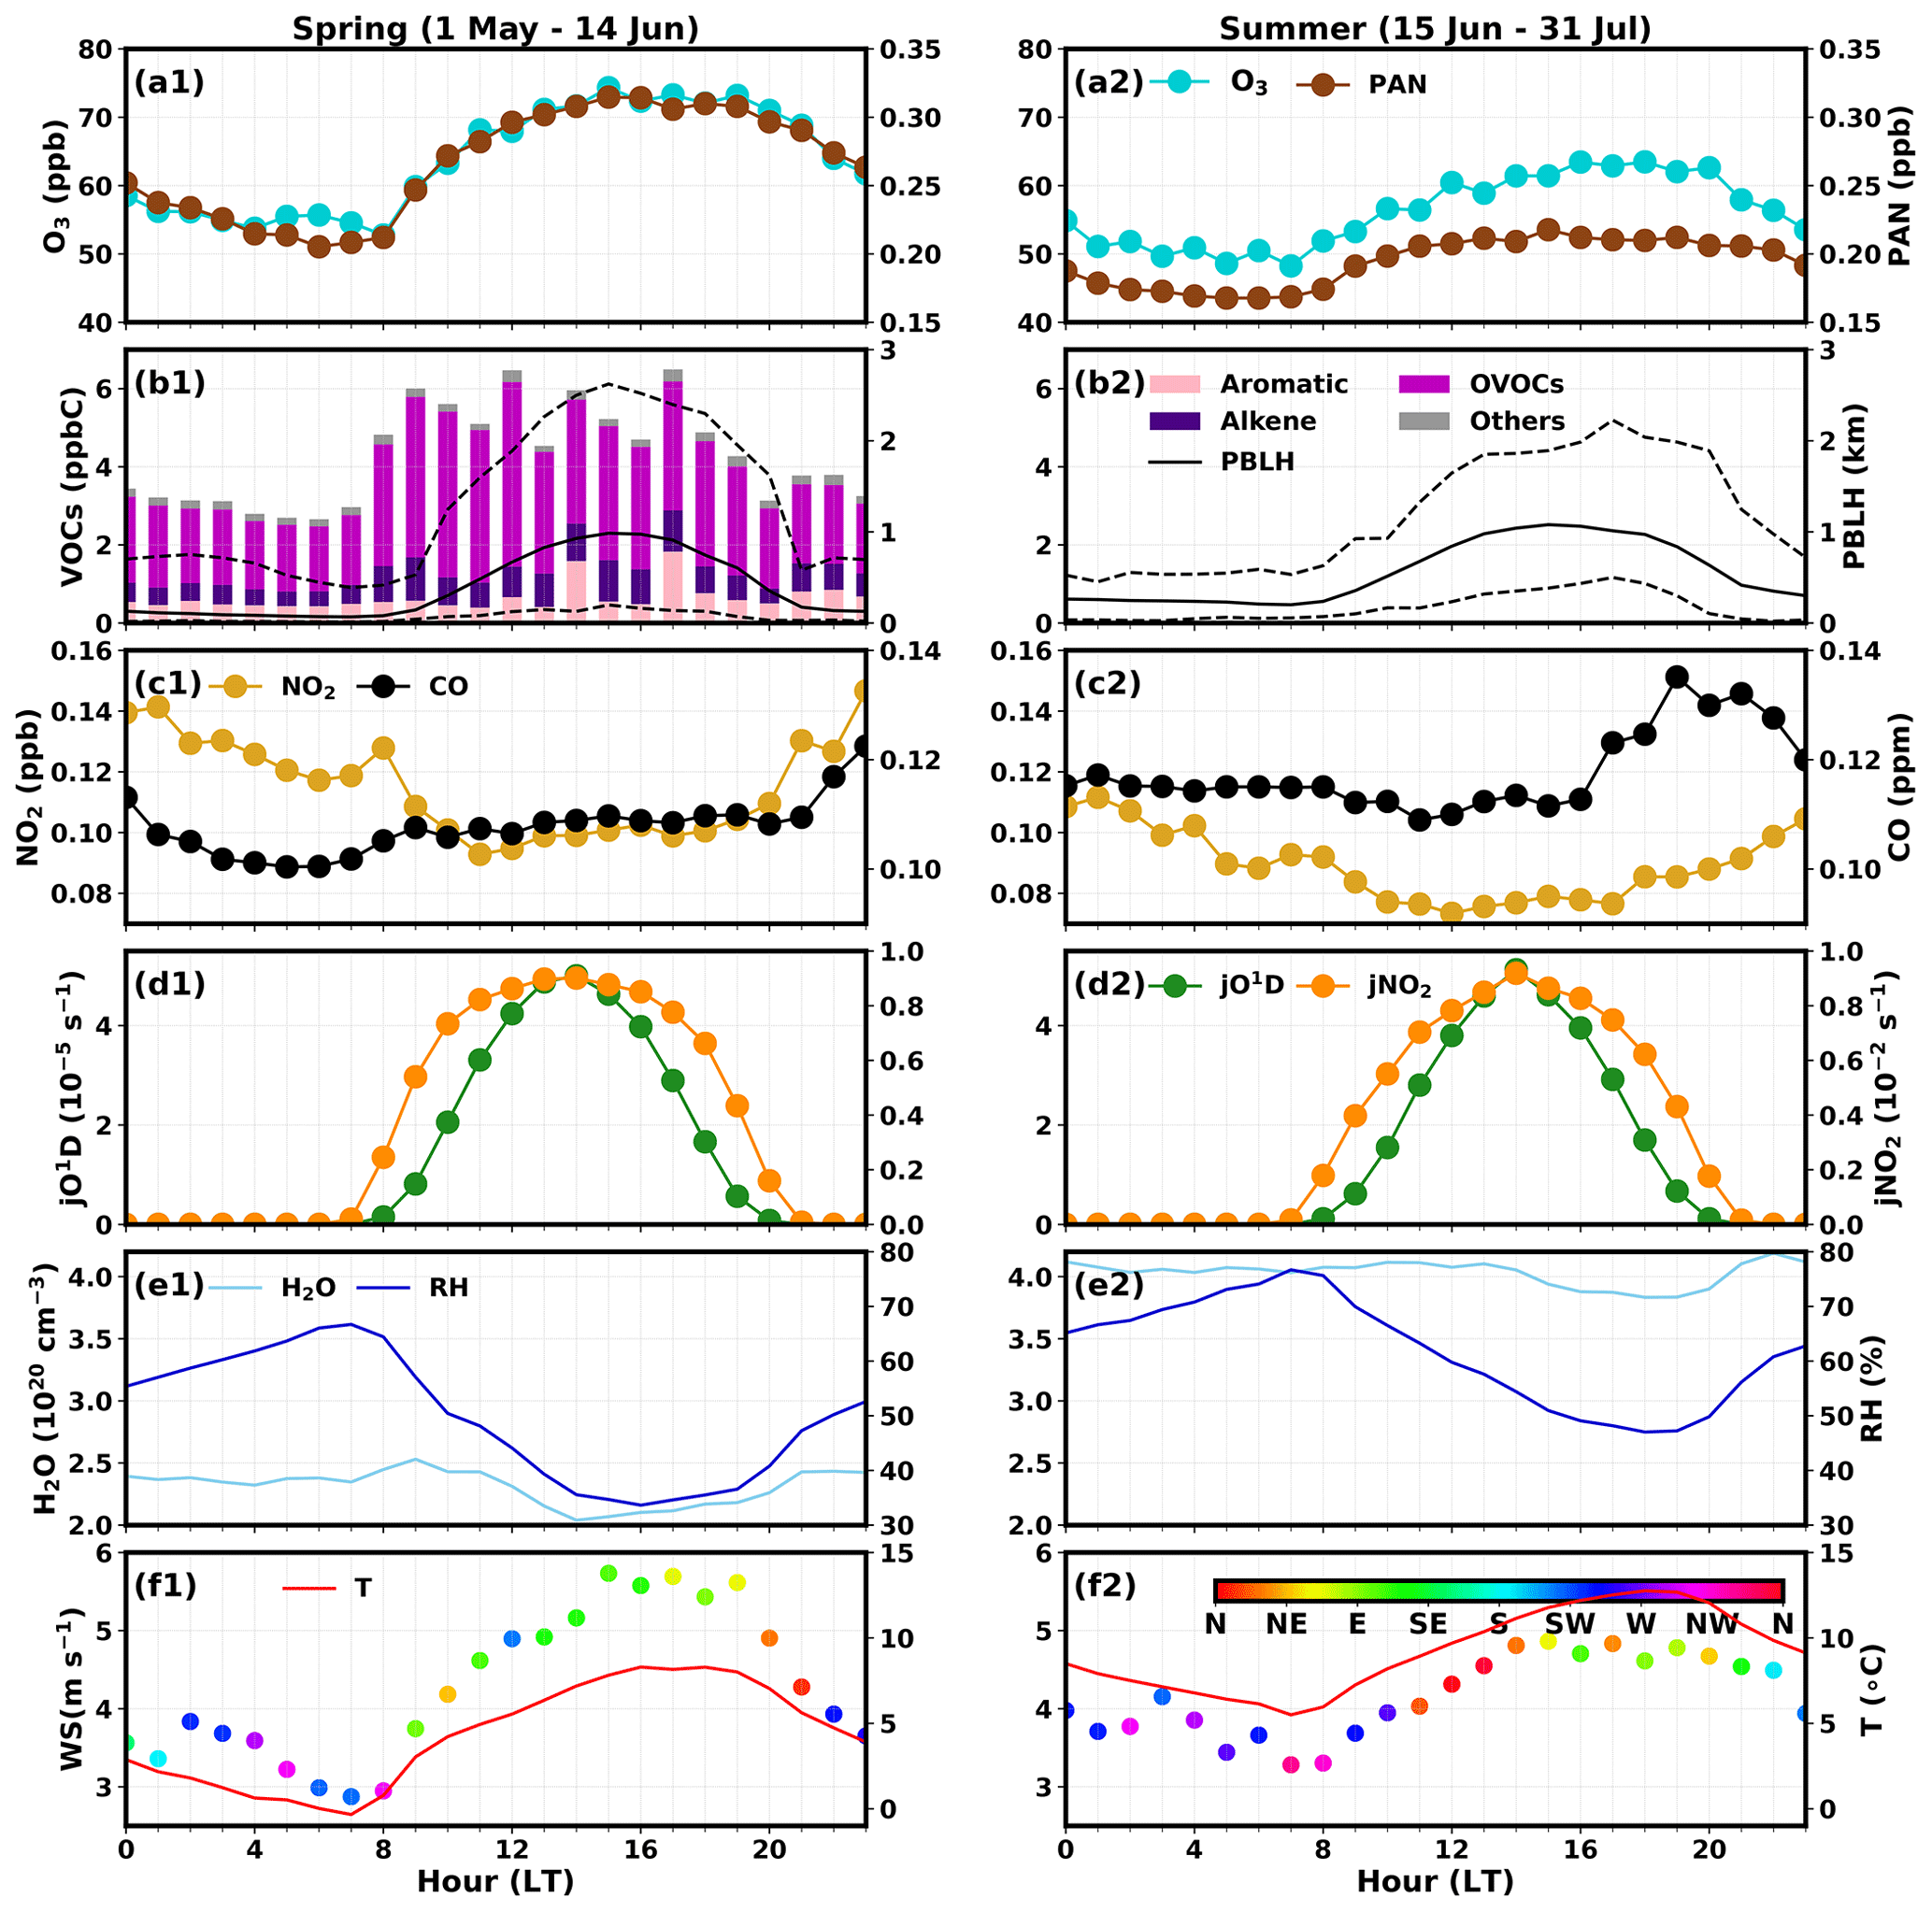
Figure 3Averaged diurnal variations of (a) O3 (blue), PAN (brown), (b) VOCs (bars), PBLH (solid line black line: average value, dashed black lines: minimum and maximum value) (c) NO2 (yellow), CO (black), (d) jO1D (green), jNO2 (orange), (e) H2O (light blue), RH (dark blue) and (f) temperature (red), wind speed and wind direction (colored dots) during the (1) spring and (2) summer period, respectively.
NO2 revealed averaged concentrations 0.12±0.05 and 0.09±0.05 ppb during spring and summer periods, respectively, with no evident day to night differences. NOx levels were only scarcely reported for remote high-altitude locations, mainly due to instrument limitations. NO2 levels were only slightly higher than the average NO2 and NO level reported at Mt. Waliguan during summer 1994–1996 (0.048±0.017 ppb) based on filter-pack sampling and spring 2003 (0.043±0.069 ppb) based on chemiluminescence (Ma et al., 2002; Wang et al., 2006). Since Nam Co is located far away from anthropogenic emission sources, NOx levels here are mainly determined by natural emissions, such as those from soil microbial activities or lightning processes. Additionally, a latest study has proposed that lakes in the TP are strong natural NOx emission sources (Kong et al., 2023). Averaged diurnal variations of O3 and PAN resembled each other (Fig. 3a1–2), both revealing decreases after sunset, reaching daily minimum concentrations near 07:00 Beijing local time (LT) and increasing quickly after sunrise simultaneous to PBL height (PBLH, Fig. 3b1–2) and exhibiting a flat plateau afterwards. Daily minimum O3 concentrations were 52.8±10.9 and 48.3±12.8 ppb, while those of PAN were 0.21±0.06 and 0.17±0.04 ppb during spring and summer, respectively. Daily maximum O3 reached 74.3±6.7 and 63.5±13.0 ppb, while those of PAN reached 0.31±0.08 and 0.22±0.06 ppb during spring and summer, respectively. Thus, O3 and PAN both revealed higher levels in spring and lower ones in summer; however, PAN concentrations have decreased more significantly than O3 (26 % versus 10 %), revealing a very flat and broad plateau during the day. OVOCs, aromatics and alkenes determined the variations of VOCs, with OVOCs and alkenes displaying diel variations similar to those of O3 and PAN, revealing increases from 07:00 to 09:00 LT, fluctuating around its daily maximum value over daytime and decreasing after 17:00 LT (Fig. 3b1–2). NO2 was typically higher during nighttime and lower during daytime, which is caused by combined effects of weakened dilution under nighttime shallow boundary layers, natural and anthropogenic NOx emissions, as well as chemical transformations. Additionally, springtime NO2 concentrations (0.12±0.04 ppb) were higher than those during the summer period (0.09±0.05 ppb, Fig. 3c1–2). CO, however, revealed only slightly higher concentrations during the summer period (107±26 and 117±29 ppb in spring and summer, respectively), staying overall flat during the day, without any diurnal variations (Fig. 3c1–2). Both RH and absolute water vapor concentrations were higher during the summer period. RH revealed a diurnal maximum by 07:00 LT during both periods, decreased rapidly after sunrise and reached its diurnal minimum at 16:00 and 18:00 LT in spring and summer, respectively (Fig. 3e1–2). Water vapor, however, increased further after sunrise, possibly due to surface evaporation processes of frost and dew during the morning. While the diurnal peak in photolysis rates were similar between spring and summer periods, the averaged diurnal variations displayed a narrower peak during summer, especially for jNO2, due to more frequent precipitation and higher cloud coverage.
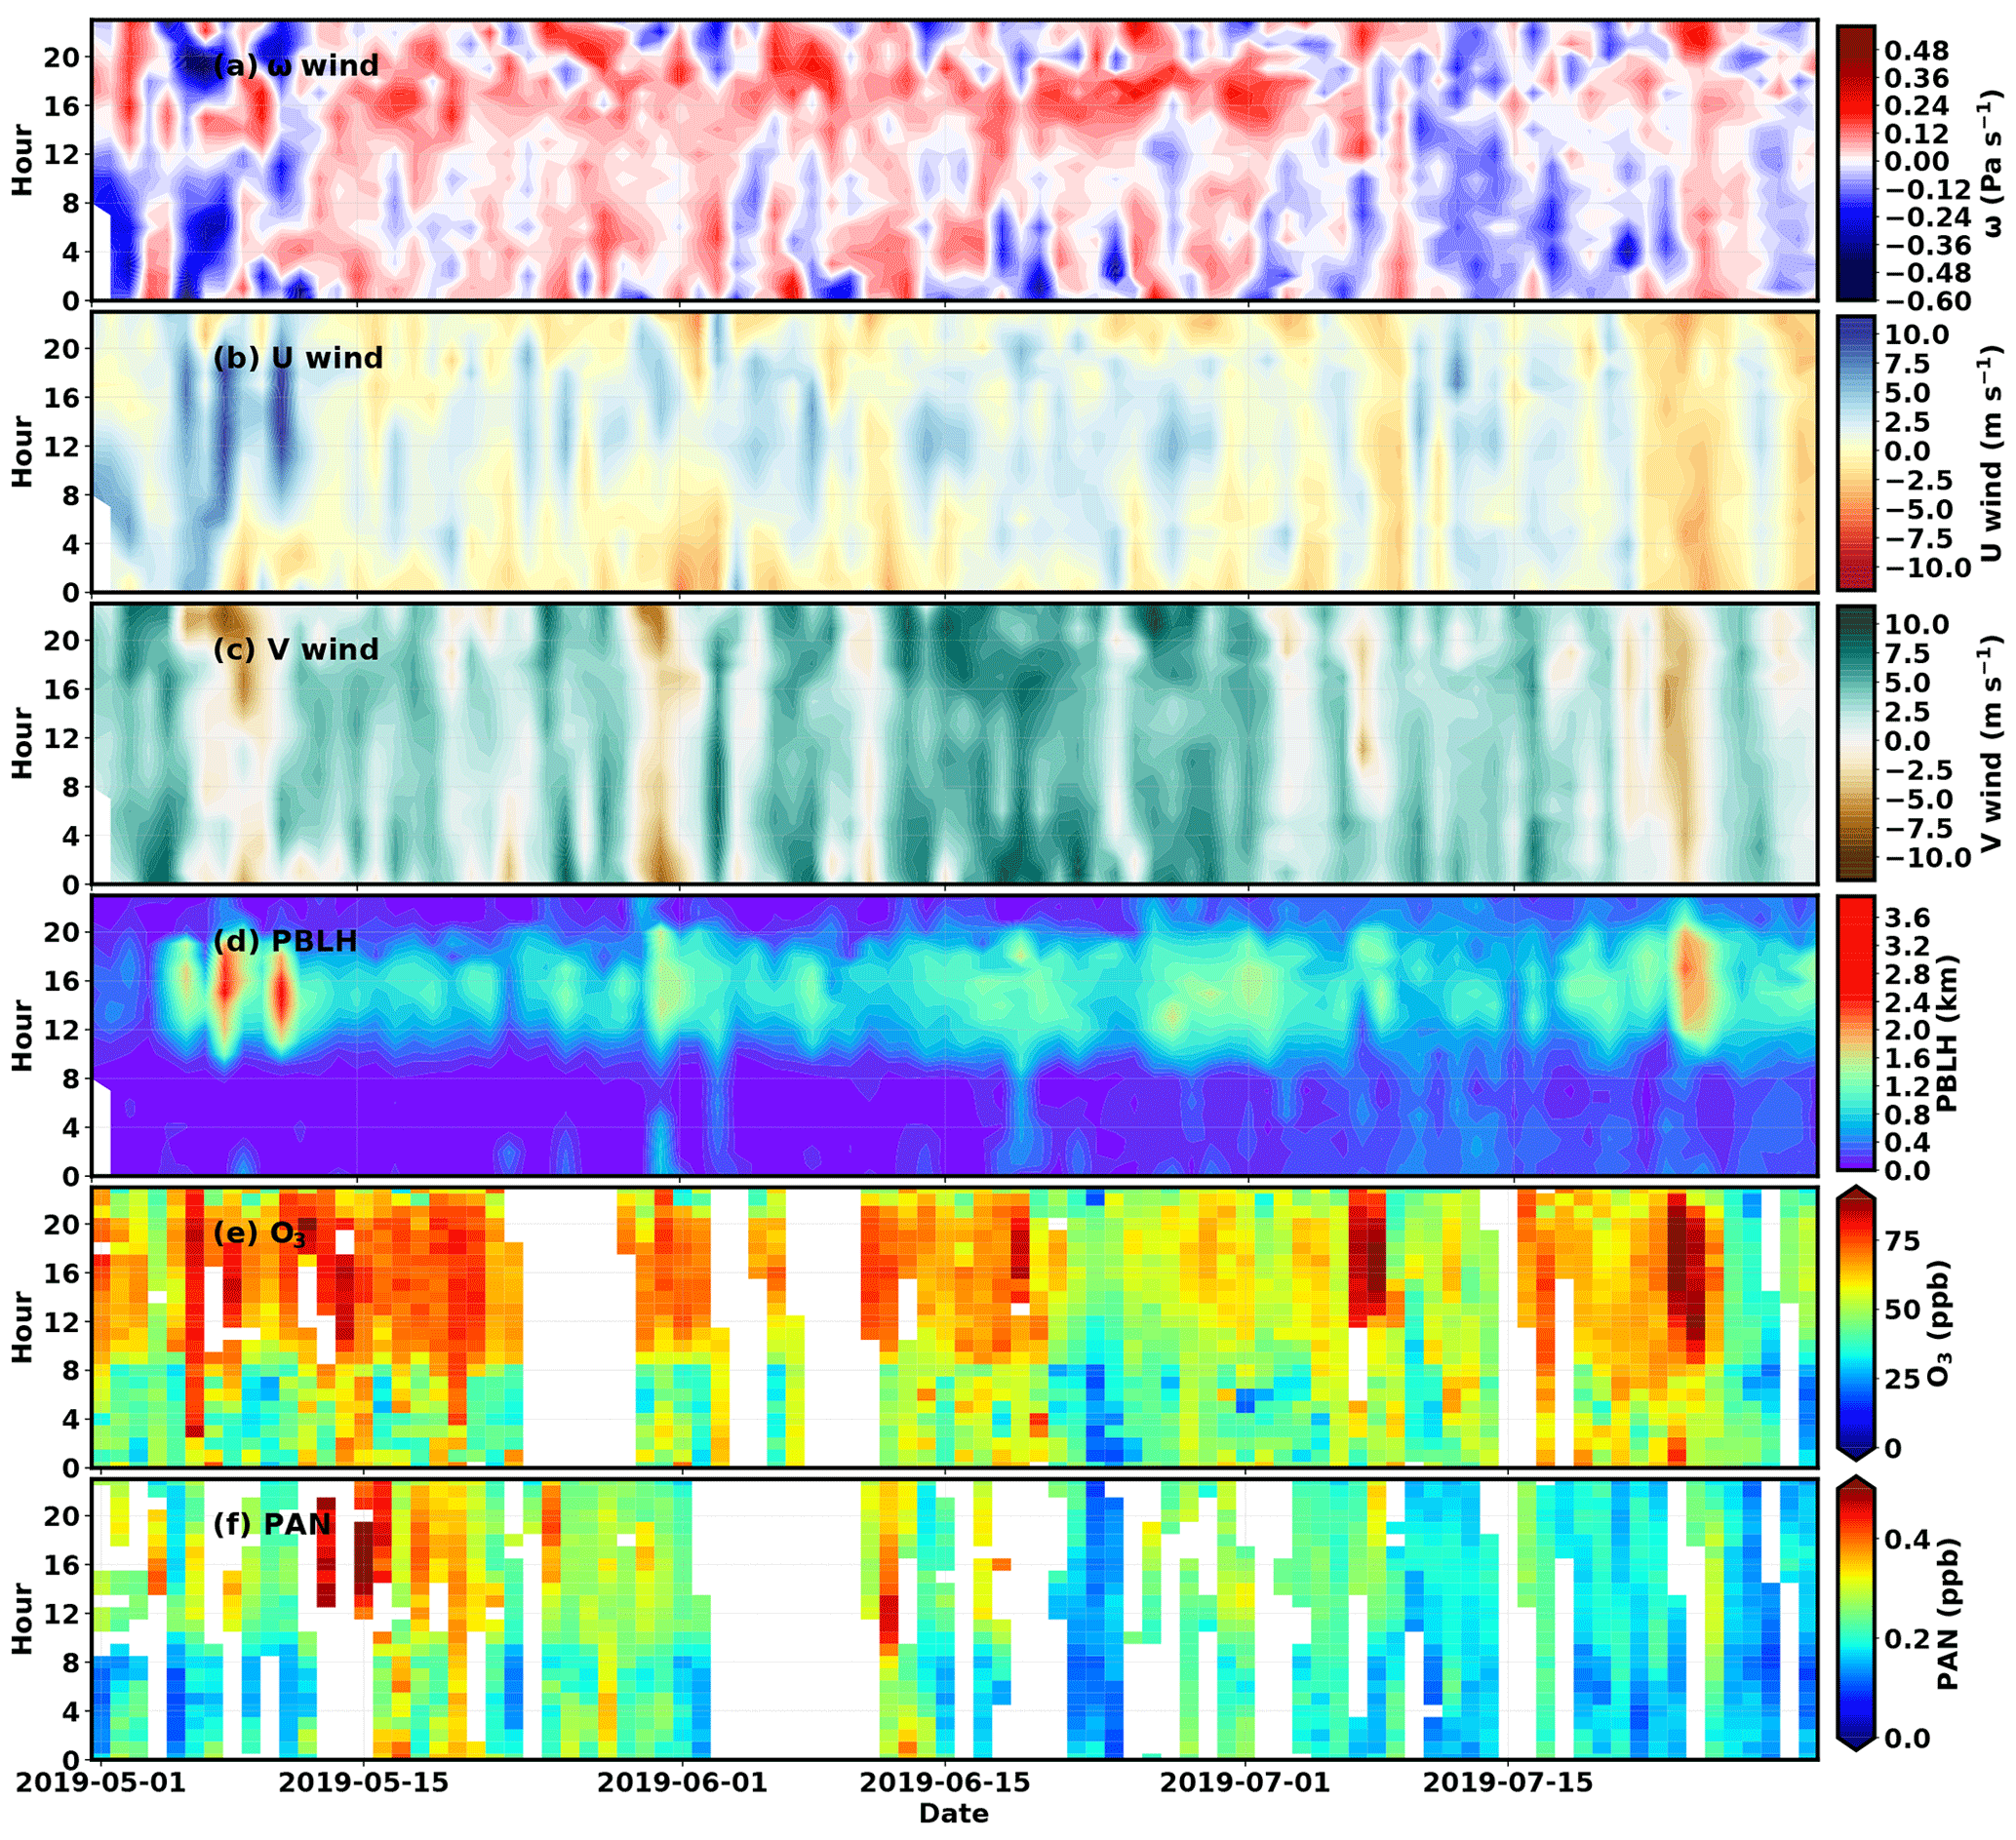
Figure 4Season–diurnal variations of ERA5 550 hPa (a) ω wind (vertical wind, Pa s−1), (b) u wind (zonal wind), (c) v wind (meridional wind), (d) ERA5 PBLH, (e) observed surface O3 and (f) PAN between 1 May and 31 July 2019 at Nam Co.
The day-to-day evolution of diurnal O3 and PAN variations as well as those of winds and PBLH are more clearly displayed by Fig. 4. Downward winds were strongest during the afternoon under high PBLH (Fig. 4a and d). Due to the local topography with the NMC lake to its west and north and the Nyainqên Tanglha Mountains to its south, the site was susceptible to both influences from land–lake and mountain–valley breezes. Accordingly, local surface winds displayed clear diurnal variations with southeasterly nighttime winds shifting to northwesterly winds during daytime (Fig. S3b–d, Fig. S3 is the same as Fig. 4, with winds replaced by 2 m wind measurements); 550 hPa winds from ERA5 over the 0.25∘ grid containing NMC station (representing near surface conditions, since surface pressure was on average 573±2 hPa) revealed stronger diurnal variations in zonal winds (Fig. 4b), overall agreeing with variations in surface winds, while meridional winds were dominated by southerly wind directions (Fig. 4c), with occasional changes to northerly winds, suggesting that local circulations had stronger impacts on zonal winds.
Broad peaks in O3 often lasted until late evening hours, while nighttime O3 frequently revealed increases under westerly winds and could reach daytime concentration levels, which can only be attributed to transport processes. High nighttime O3 was not always accompanied by simultaneous PAN increases, while vice versa, elevated nighttime PAN was also not always synchronized with those of O3, indicating that they might have originated from distinct sources and processes. O3 levels were continuously high throughout the spring period, especially during 6–13 May. Despite overall lower levels in the summer period, two O3 episodes occurred during 7–8 July and 24–25 July, respectively, exhibiting the highest concentrations (daily maximum concentrations ranging from 85.9 to 91.9 ppb) observed during the entire campaign (Figs. 2a and 4e). Compared to O3, PAN displayed much larger day-to-day variability, with an evident high PAN episode occurring from 13 to 16 May (0.42±0.08 ppb on average) under southeasterly winds from aloft (Fig. 4f). Summertime PAN was distinctly lower than that during spring season, with no increases detected during the two high O3 episodes.
Overall, while O3 and PAN revealed highly similar average diurnal variation patterns, their temporal variations often differed from each other, suggesting that they were determined by distinct transport or formation processes, which will be further investigated in the following sections.
3.2 Impact of local circulation
In previous studies, diurnal variations in O3 and PAN were mainly attributed to local circulations, particularly the development of the PBL. At pristine mountain sites such as WLG, surface O3 was influenced by free-tropospheric air during nighttime and by boundary layer air masses during daytime, which resulted in a diurnal cycle with lower daytime and higher nighttime O3 with very small diurnal variation amplitudes. Despite its high altitudes, NMC is located at the foot of the northern Nyainqên Tanglha Mountains and thus experienced local circulation distinct from those at WLG. Free-tropospheric air was suggested to be richer in O3 and PAN concentrations and was mixed down upon the rapid development of the convective boundary layer (CBL) after sunrise, while O3 and PAN concentrations decreased upon the establishment of the nocturnal boundary layer (NBL), due to the dominance of local boundary layer air masses during nighttime, which were low in O3 and PAN, since barely any surface O3 and PAN precursor emission sources existed at NMC, added by effects of dry deposition (X. Xu et al., 2018). The broad O3 peaks that often lasted until late evenings and the frequent events of elevated nighttime O3 (occurrence frequency of 38 %, Fig. 4e) both supported the idea that under favorable meteorological conditions, high surface O3 levels after sunlight hours could be sustained by continuous downmixing of free-tropospheric air (average daily maximum nighttime O3 reaching 67.6±10.1 and 62.9±6.4 ppb during spring and summer, respectively). The fact that nighttime O3 could reach the same level as noontime O3 is why previous studies suggested that physical transport was determining O3 variations at NMC, while photochemistry played a minor role.
Diurnal variations of O3 and PAN followed their averaged diel pattern on 72 % and 75 % out of the days with valid records, respectively. While O3 diurnal cycles revealed more days with such daytime increases during summer (69 % in spring vs. 74 % in summer), PAN conformed better to its averaged diurnal cycle in spring (90 % in spring vs. 63 % in summer), suggesting that despite being under the same meteorological influences and despite highly similar average diurnal concentration profiles, O3 and PAN often revealed different variations. O3 and PAN increasing rates (on days with daytime increases) between 07:30 and 10:30 LT both displayed linear correlations to temperature increasing rates (r=0.45 and 0.52 for O3 and PAN, respectively, Fig. S4), confirming again that their morning increases were closely connected to boundary layer development upon radiative heating. Prenoon (06:00 to 12:00 LT) O3 concentrations also increased with PBLH during both spring (Fig. 5a) and summer (Fig. 5b), however, revealing slightly distinct slopes during distinct seasons. Weaker prenoon winds that mainly occurred during early morning under low PBLH conditions were associated with evidently lower O3 concentrations. During early morning hours when PBLH was still low, strong winds that mostly came from the W–NW direction were associated with O3 concentrations as high as those observed during noontime in the spring period (Fig. 5a). During the afternoon (12:00 to 18:00 LT), when the CBL has fully established, O3 hardly displayed any more variation with PBLH (Fig. S5a), indicating that once boundary layer and free-tropospheric air was fully mixed, O3 did not further increase with PBLH. In the summer period, W–NW winds were less frequent and O3 associated with these winds only increased weakly with PBLH, whereas N–NE winds resulted in more significant rise in O3 over prenoon hours. Summertime afternoon PBLH was significantly lower than during spring due to frequent cloudy and rainy conditions, mostly falling into the range of 0.5–1.5 km (Fig. S5b). O3 still increased with PBLH, however, revealing large variability under the same PBLH, indicating that PBLH was not the deterministic factor for afternoon O3 levels. PAN did not replicate the variation of O3 with PBLH during prenoon hours, displaying large variability at lower PBLH and moderate concentration levels under high PBLH. This suggests that free-tropospheric O3 levels were consistently and significantly higher than boundary layer O3 levels, indicating for weak surface formation of O3 (further discussed in Sect. 3.3), which resulted in significant increases in observed surface O3 upon down mixing. Whereas free-tropospheric PAN or the surface formation of PAN might have had higher variability, which resulted in largely different responses of PAN with the down mixing of free-tropospheric air. Intensive downmixing for free-tropospheric air under high PBLH might have even diluted boundary layer PAN concentrations.
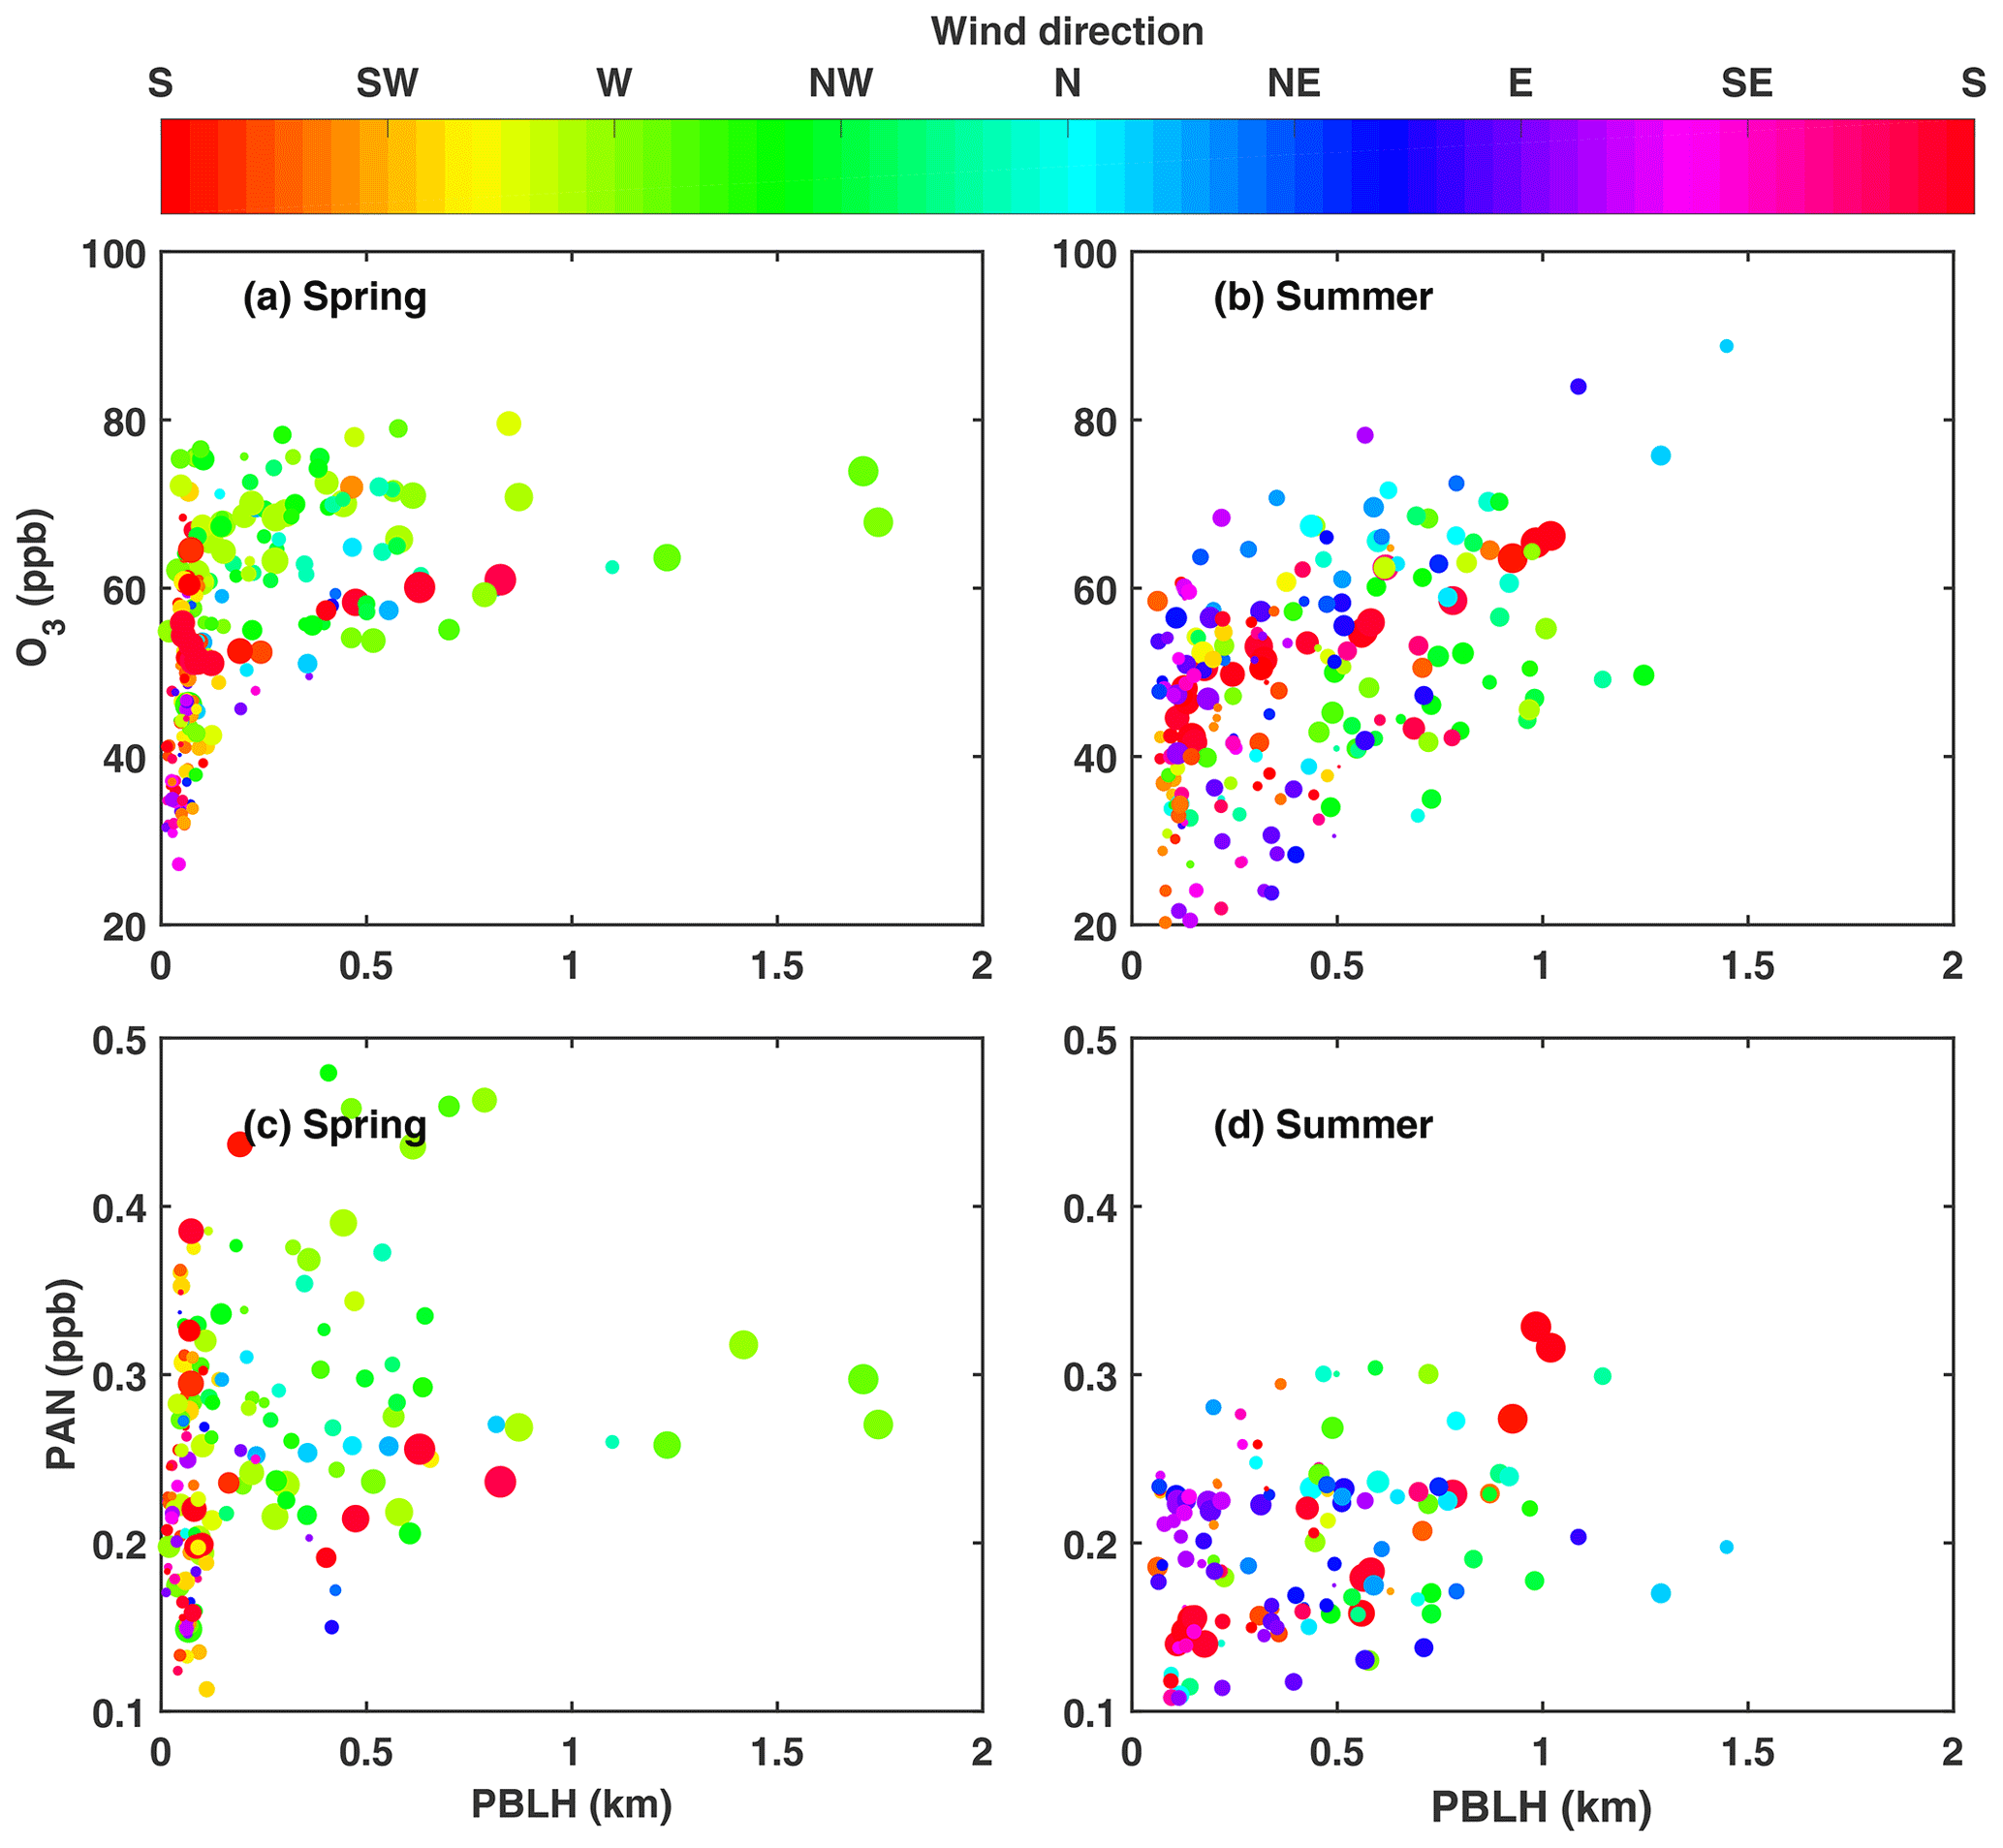
Figure 5Variation of prenoon (06:00–12:00 LT) O3 (a, b) and PAN (c, d) with PBLH (from ERA5 reanalysis data) during spring (a, c) and summer (b, d) periods, with wind speeds and directions indicated by sizes and colors of scattered dots (precipitation associated data points excluded).
To investigate what has caused the discrepancies in free-tropospheric O3 and PAN over NMC, the variations of surface O3 and PAN with free-tropospheric (500–550 hPa) winds during spring and summer are depicted in Fig. 6. At lower wind speeds, both O3 and PAN typically revealed lower concentrations. With increasing wind speeds, high concentrations of O3 and PAN were associated with distinct wind directions, in both spring and summer. During springtime, high concentrations of O3 and PAN both occurred with W winds; however, low O3 and high PAN concentrations were detected under strong S winds. During summertime, high O3 dominantly occurred with N–NE winds, while PAN mainly revealed elevated concentrations under S–SW winds. The distinct variation of O3 and PAN with wind speed and wind direction suggests that the concentrations of both gases might have been impacted by different long-range transport processes, which will be investigated in the next section.
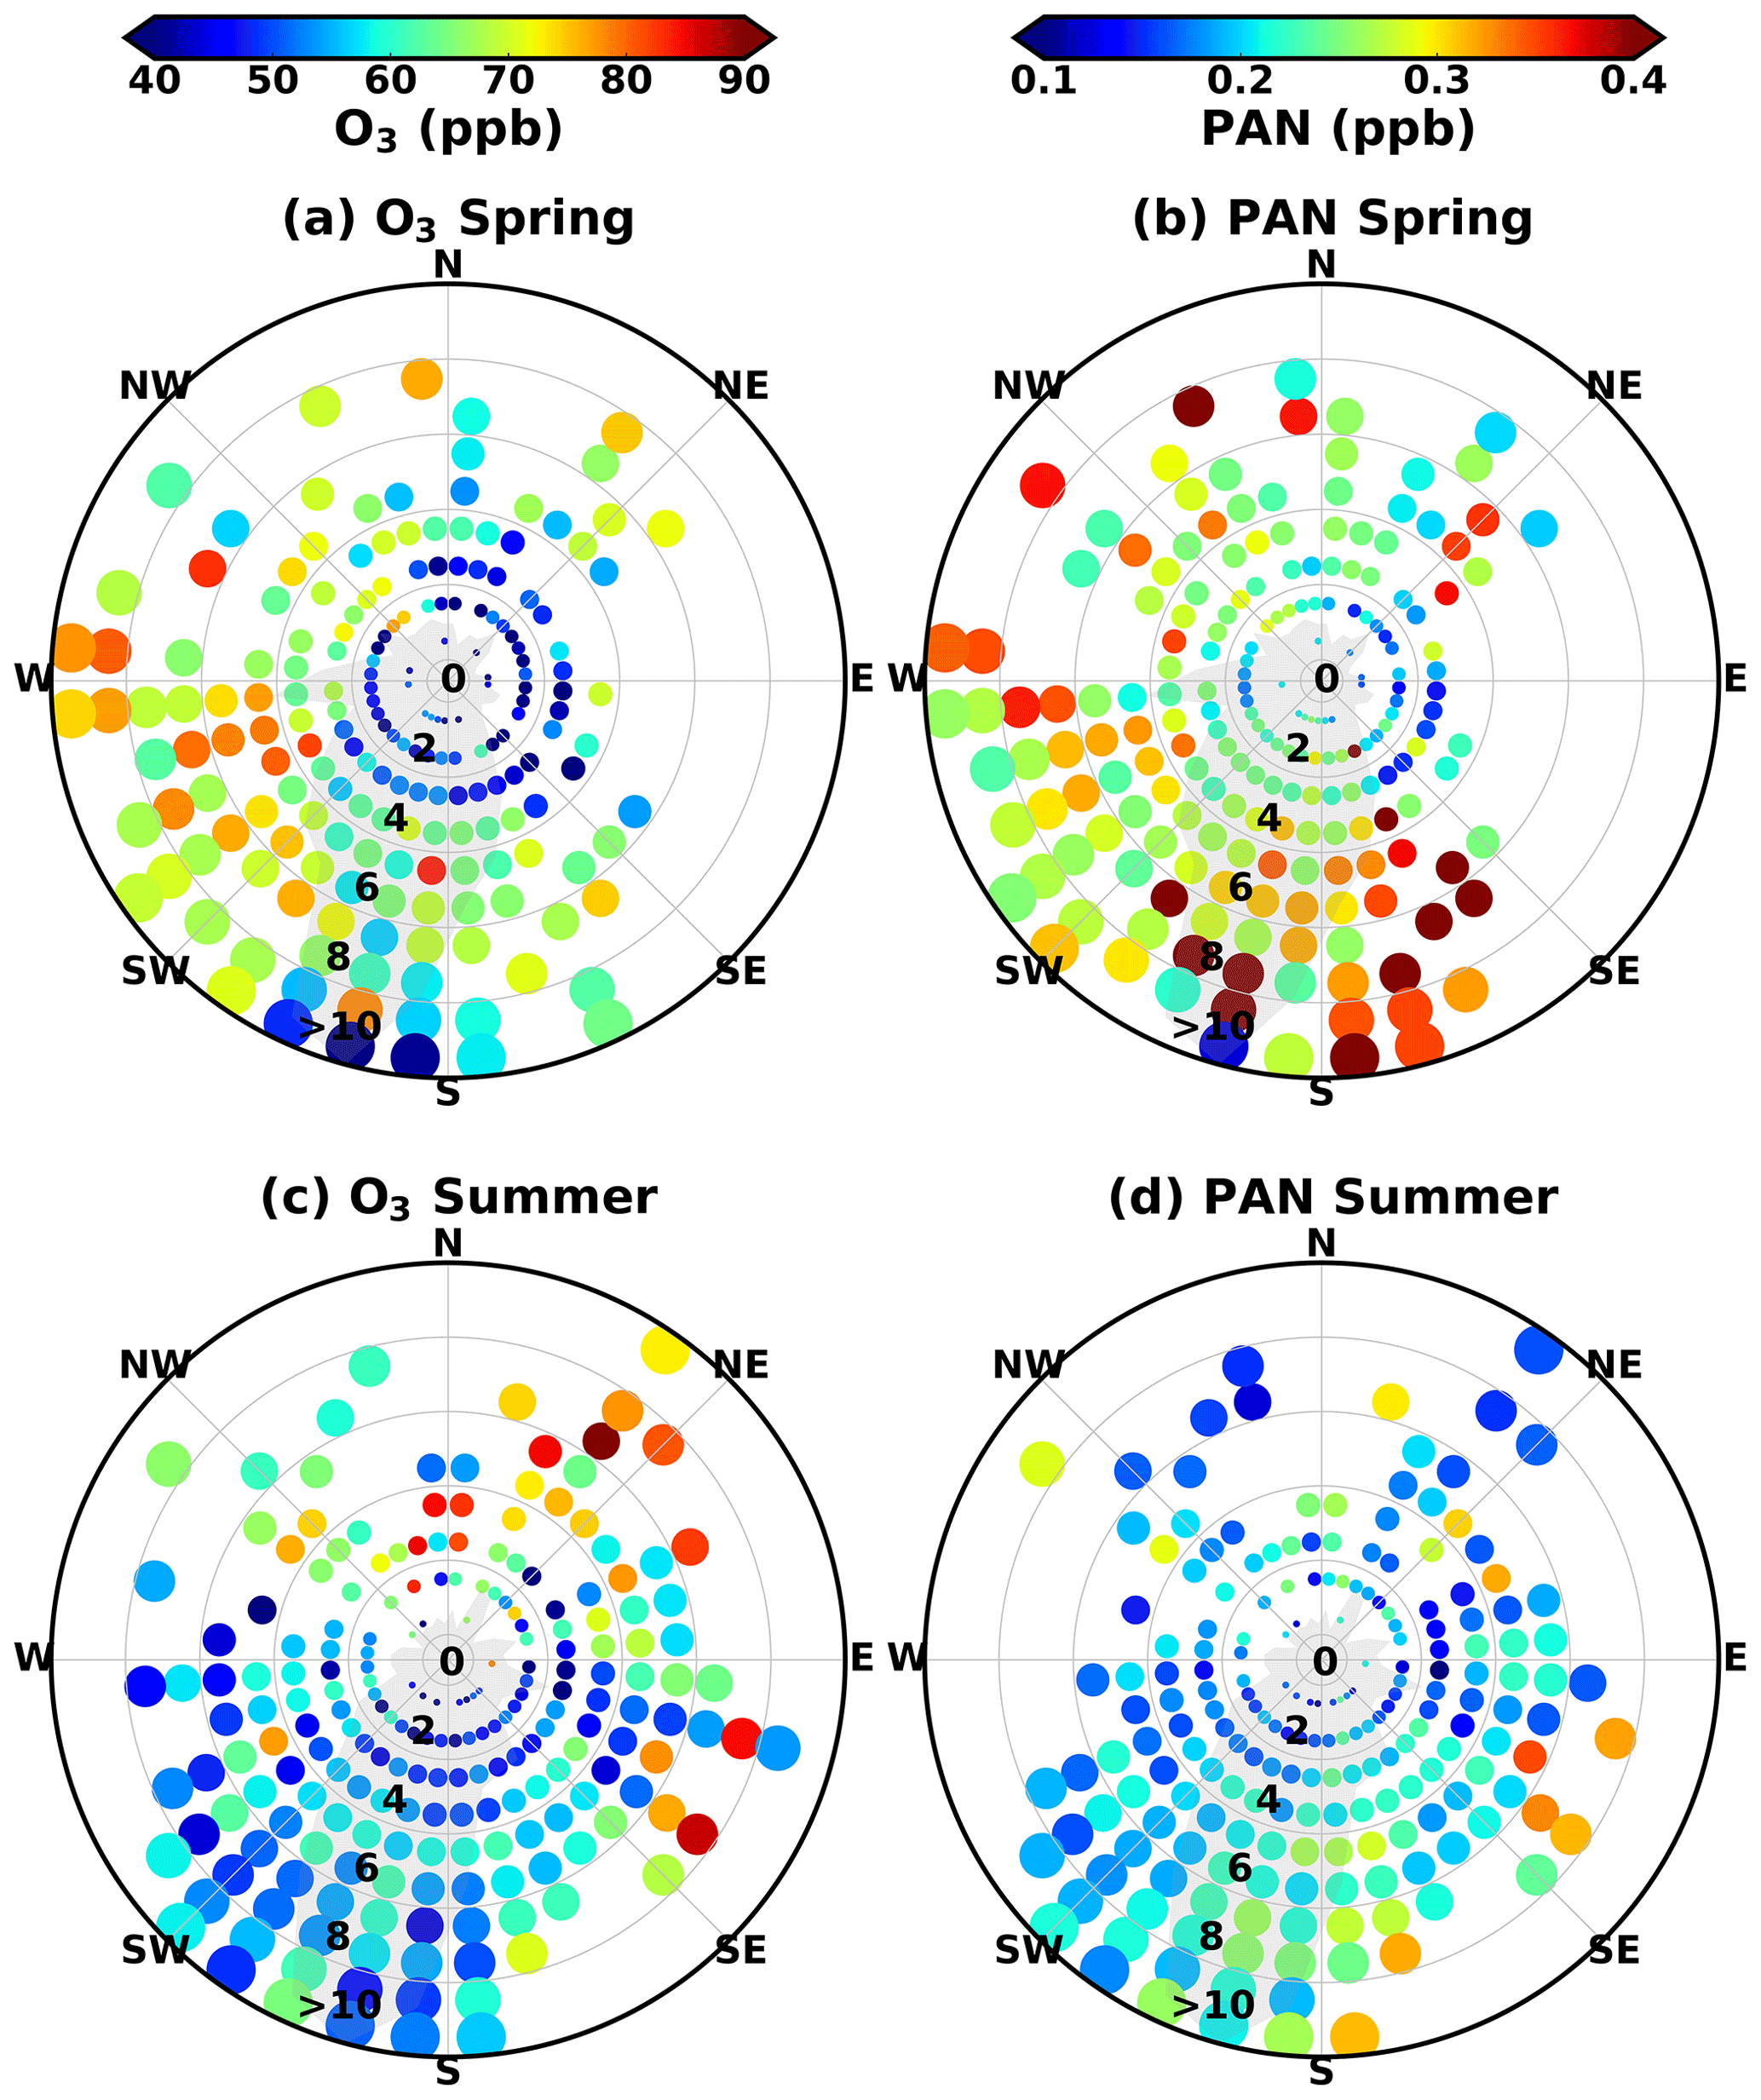
Figure 6Variation of springtime (a, b) and summertime (c, d) O3 (a, c) and PAN (b, d) concentrations with 2 m wind speeds and 500–550 hPa wind directions from ECMWF ERA5 data. Gray shading represents the relative occurrence frequency of wind directions.
3.3 Impact of inter-regional transport and stratospheric–tropospheric exchange
Potential influence of pollution transport from India and other South Asian countries have been previously reported, which had potential impacts on the transport of PAN (X. Xu et al., 2018). However, the source regions of O3 and PAN in the TP have not been systematically investigated before. NO2 and CO columns from TROPOMI revealed high concentrations in South Asian regions south of the TP contrasting to the pristine environment within the TP (Fig. 7). CO pollution was more severe and widespread outside of the TP during the spring period, while NO2 pollution was more severe during the summer period both in South Asia and to the east of the TP in China. Inside the TP, NO2 and CO columns were both higher during the summer period, suggesting that summertime atmospheric circulations might have been more favorable for pollution transport into the TP. The high-altitude Himalayas along the southern border of the TP are highly effective in blocking out direct intrusion of South Asian pollution, leading mostly to pollutant accumulation on its southern slope. High-resolution satellite observations clearly reveal high NO2 and CO along mountain and river valleys, indicating that pollution might have been transported into the TP through these passageways. Belts of elevated CO extend from the western side (Kashmir) to the southeastern corner of the TP, indicating that pollution from South Asia could not directly cross over the Himalayas, especially not over those regions with very high altitudes, but it had entered the TP by crossing either to its west or southeast.
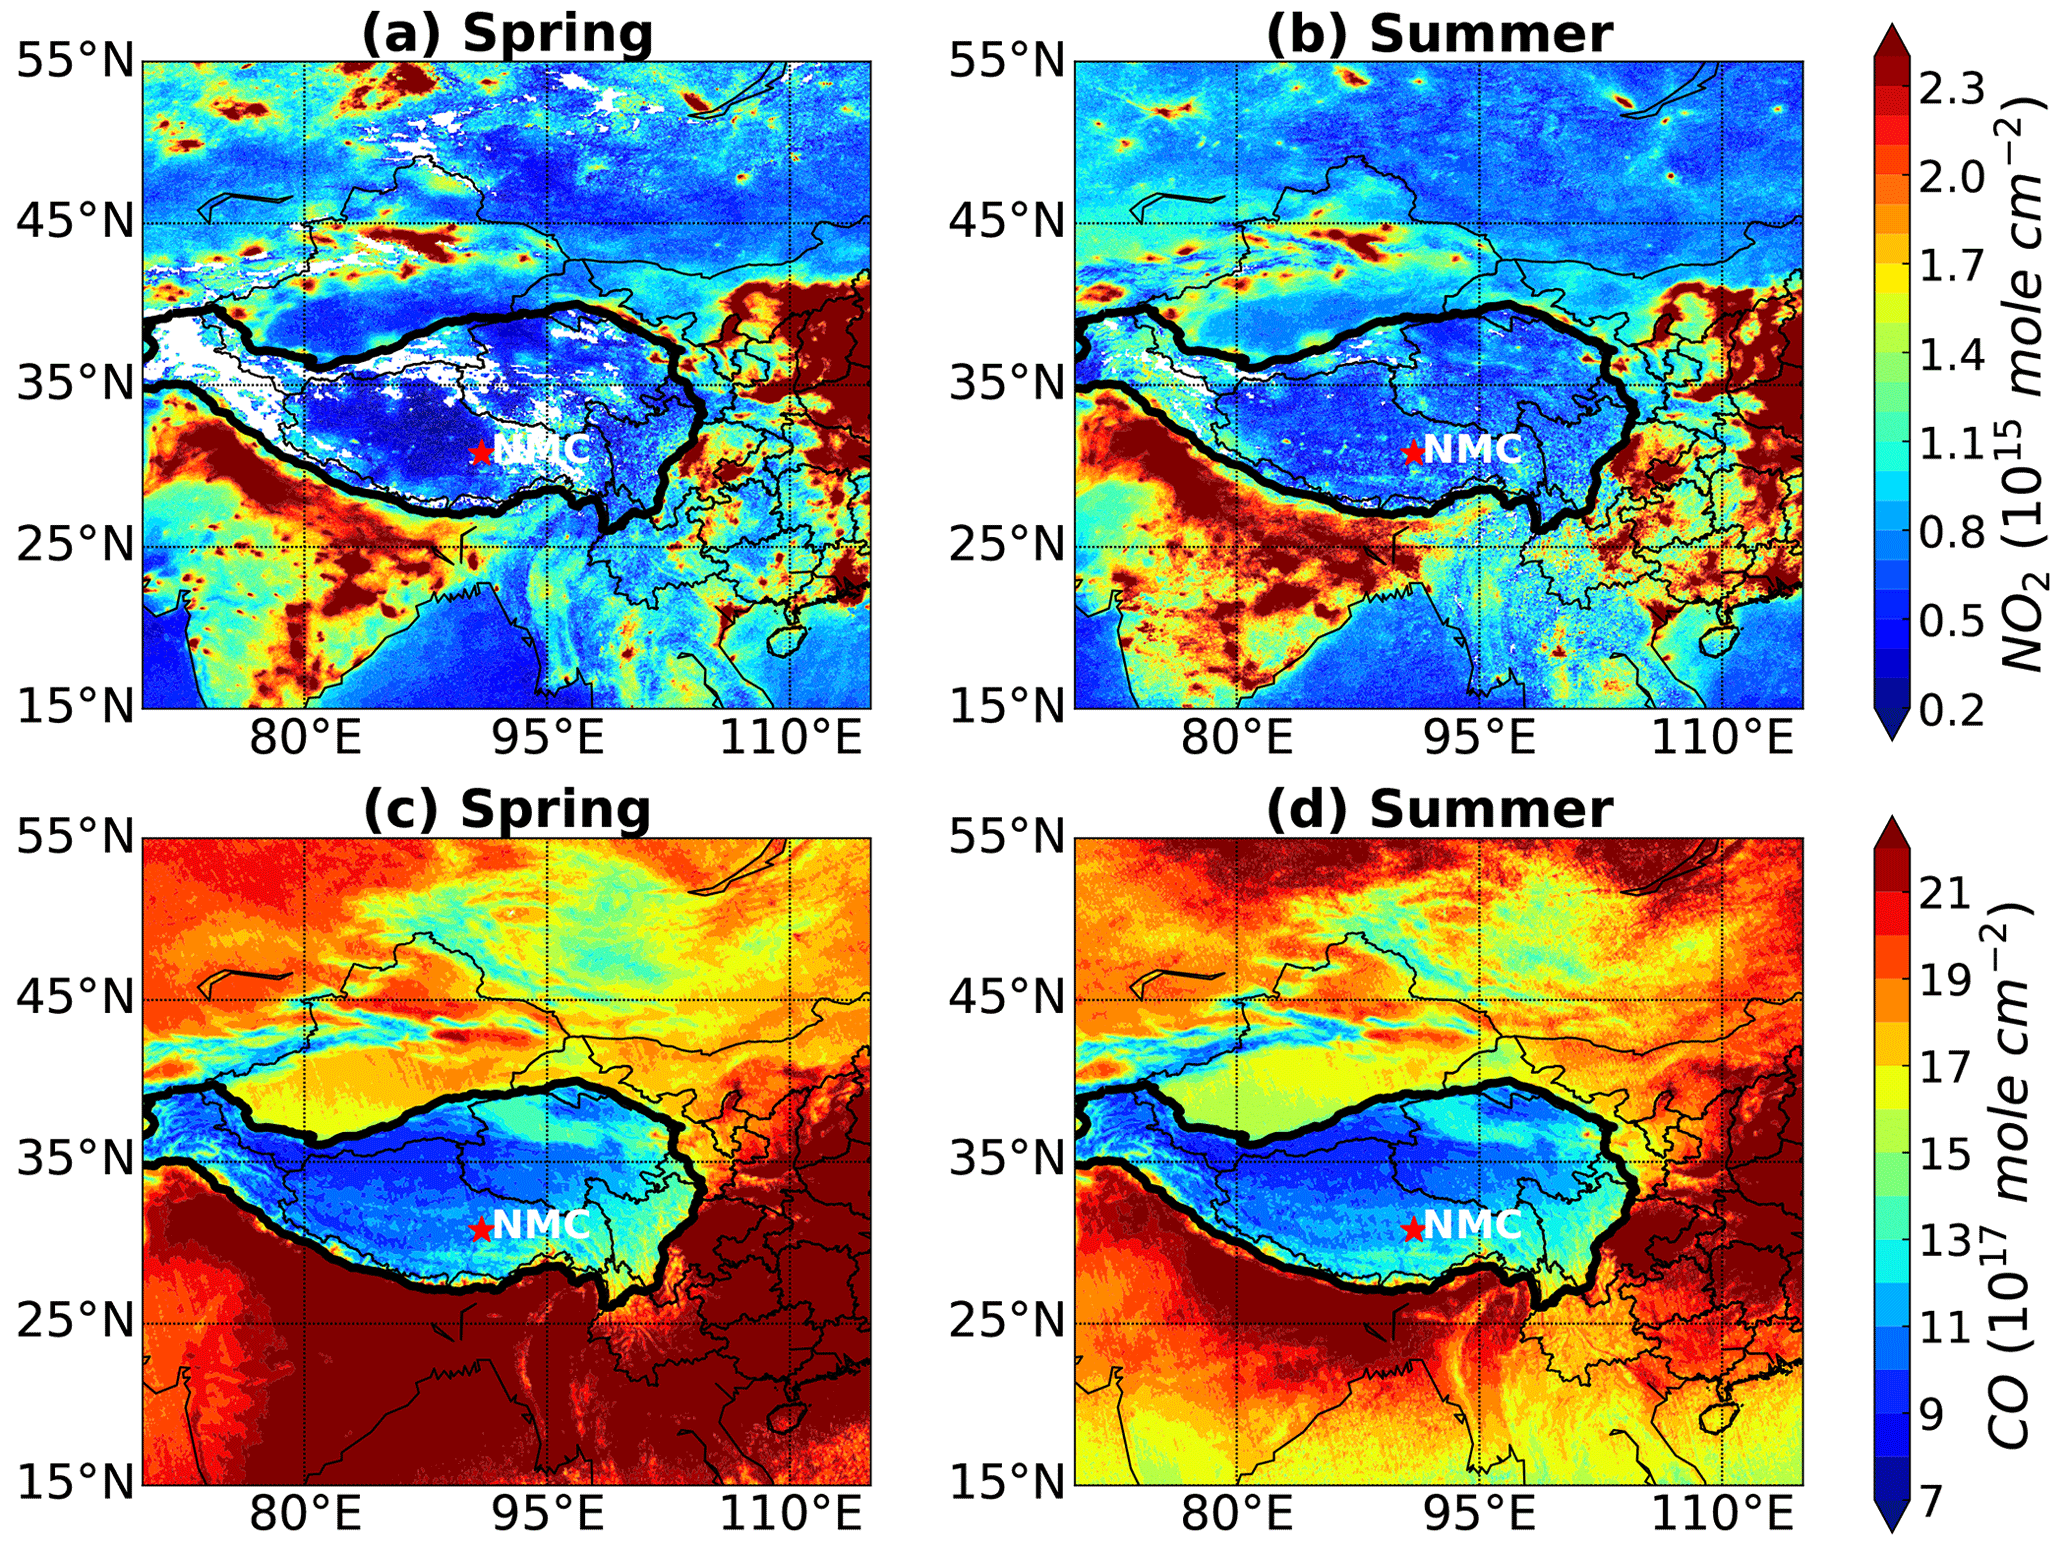
Figure 7TROPOMI NO2 (a, b) and CO (c, d) column concentration distributions averaged over spring (a, c) and summer (b, d) periods.
To further identify possible source regions for high O3 and PAN at NMC station, the PSCF for both gases was calculated for spring and summer, respectively (Fig. 8). Springtime high O3 concentrations were mainly associated with westerly trajectories, which crossed over northern India and Nepal before arriving at NMC (Fig. 8a). Although trajectories associated with high springtime O3 crossed over vast areas outside the southern TP border, they mainly entered the TP from two passageways: one from the west and another from the southeast (near the border of Bhutan). Before entering the TP, the majority of the air masses associated with high O3 came from higher altitudes (>6 km), diving downwards to heights of 3–6 km or even <3 km near the southern border of the TP, and then entering the TP mainly from the west or south (Fig. 9a1–3). Aside from that, trajectories from the NW mostly traveling within 0–6 km (above ground level) were also associated with high springtime O3. High springtime PAN, however, was only associated with trajectories crossing over South Asia and entering the TP from the southeastern border. In addition, air masses from the Indian Ocean that traveled within 0–3 km and crossed over Bangladesh and Bhutan were also associated with high PAN but not with high O3 (Figs. 8b and 9b1–3).
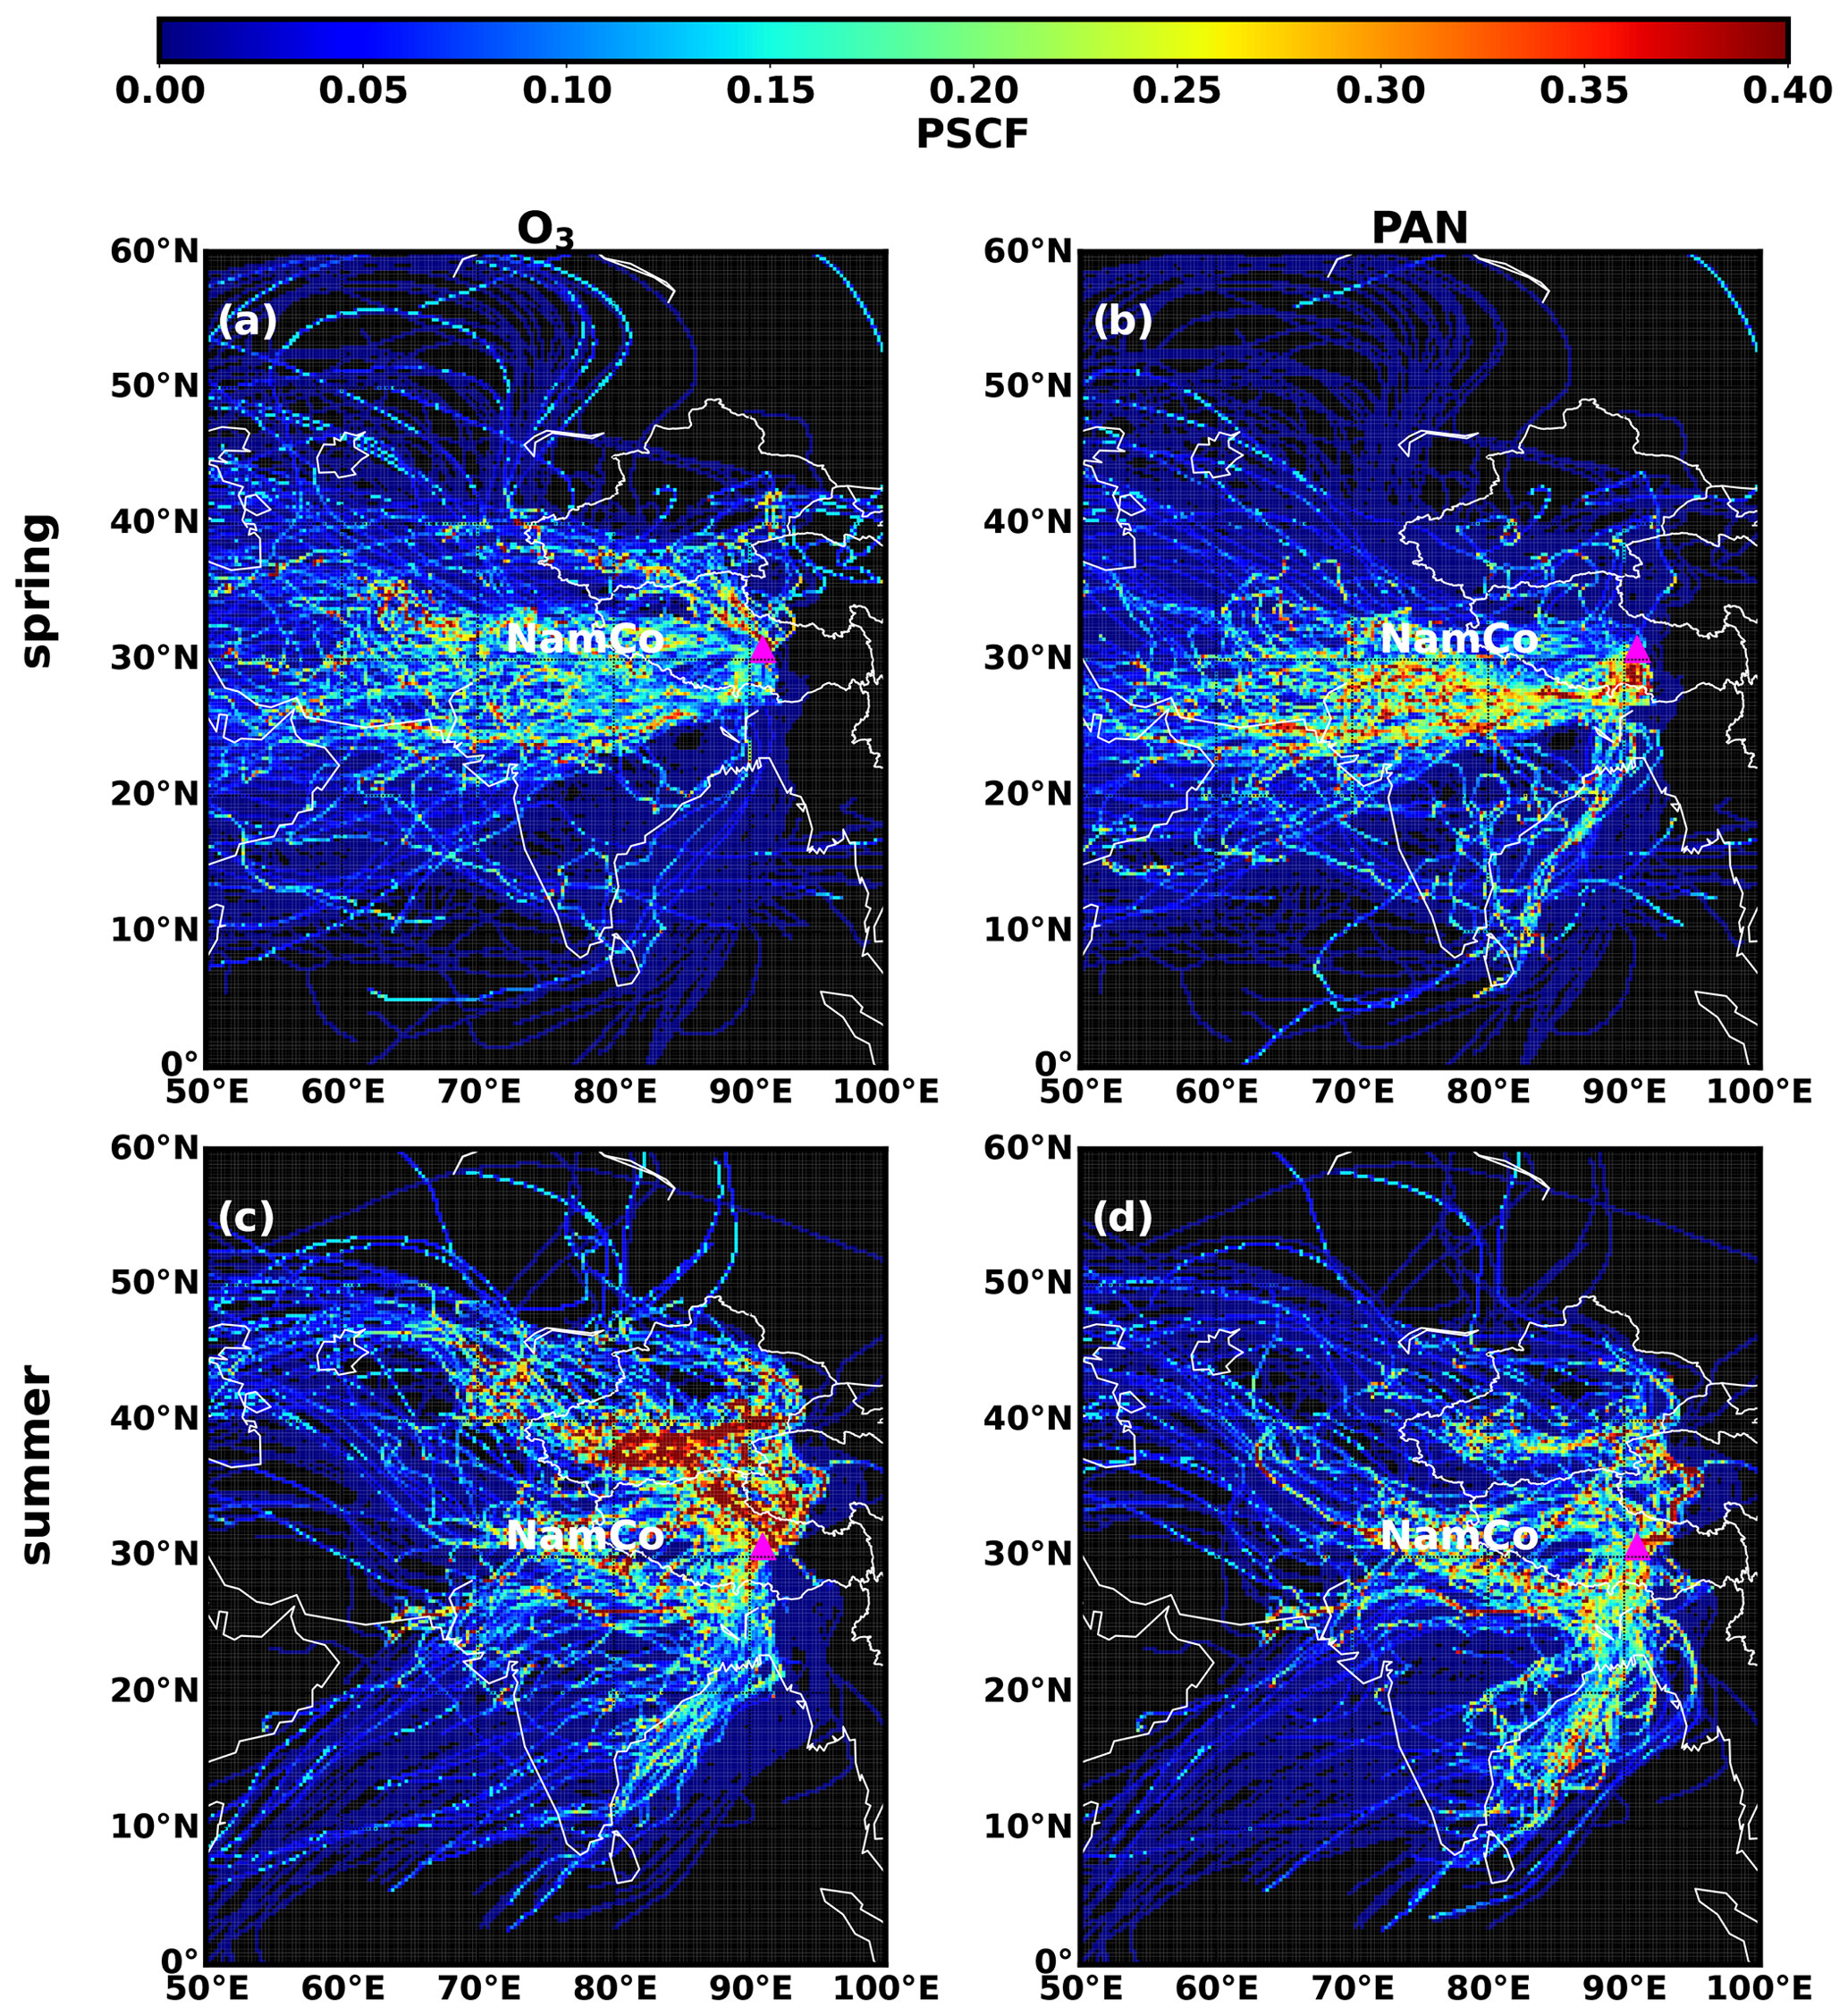
Figure 8Potential source contribution function (PSCF) of O3 (a, c) and PAN (b, d) during spring (a, b) and summer (c, d) periods.
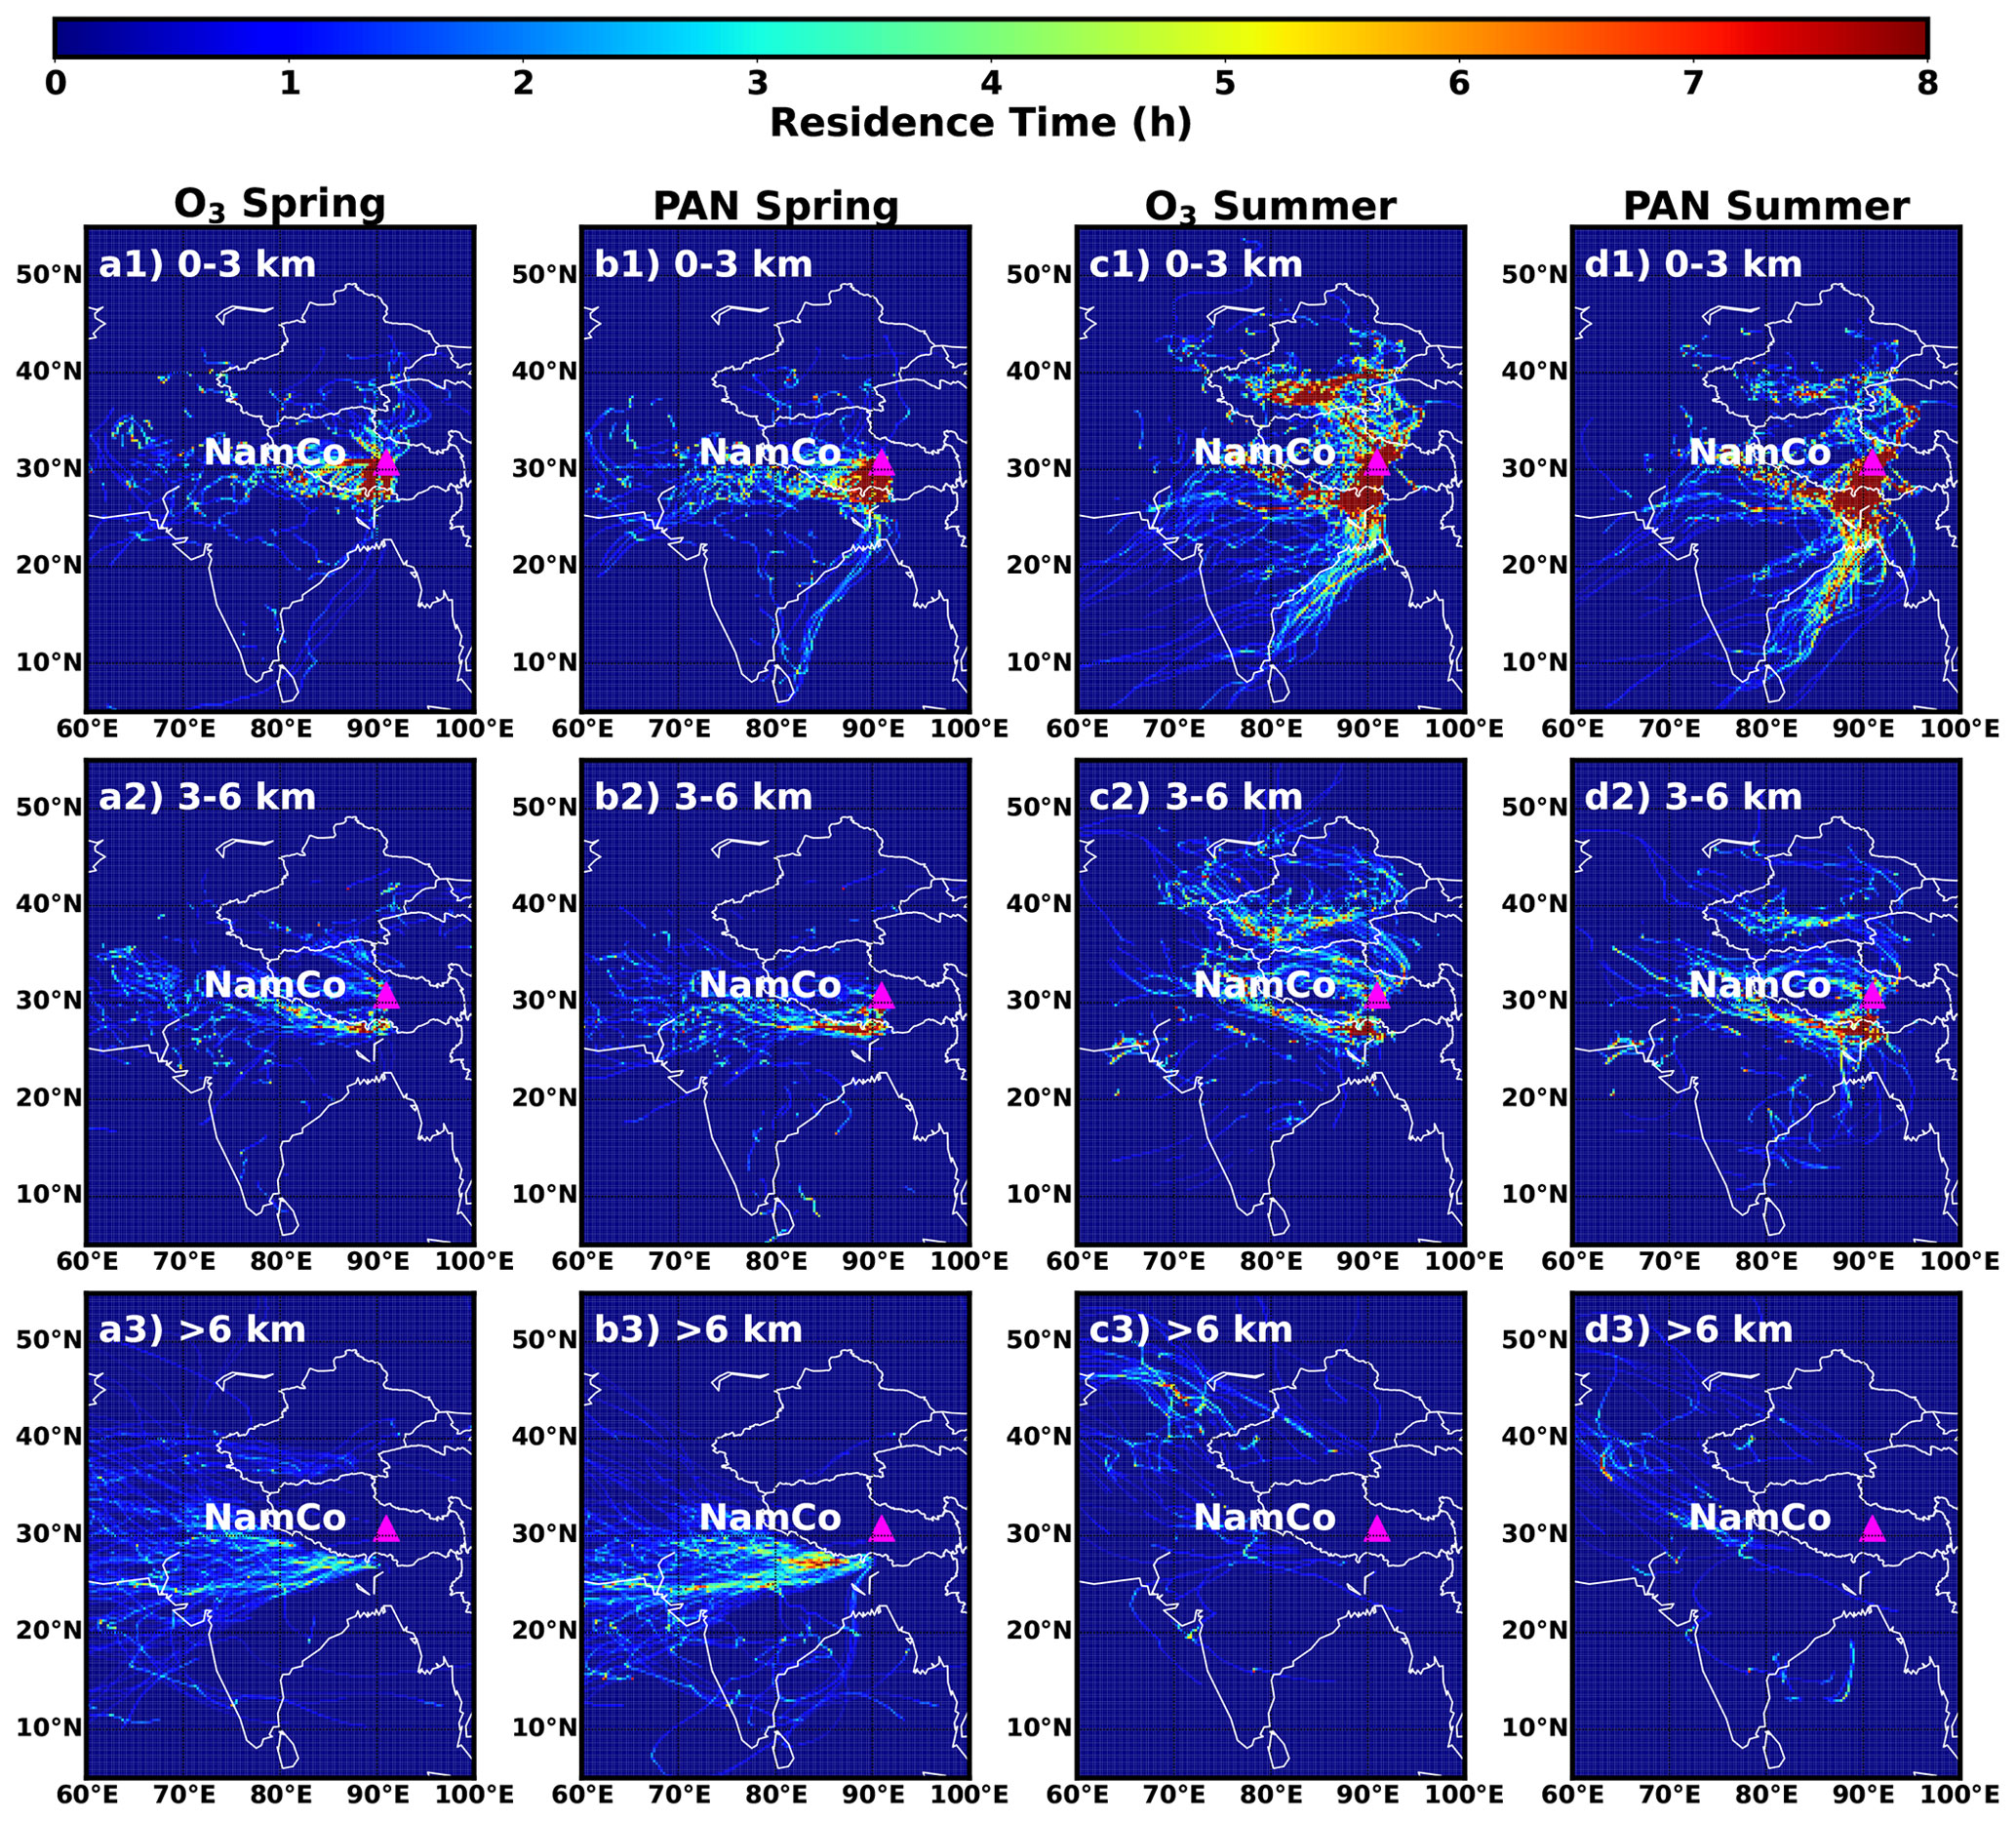
Figure 9Residence time of trajectories associated with O3 (a, c) and PAN (b, d) above their respective 67th percentiles during spring (a, b) and summer (c, d) periods within height ranges (above ground level) of (1) 0–3 km, (2) 3–6 km and (3) >6 km.
During summer, the PSCF of O3 revealed a largely different distribution from that in spring. High-altitude westerly air masses that entered the TP from the west in spring have not been seen in summer, while air masses sweeping along the southern border of the TP (Nepal and northern India) at altitudes below 6 km and approaching NMC from its south were still partly associated with high O3 during summer (Figs. 8c and 9c1–3). Southerly low-altitude (0–3 km) maritime air masses that traveled over Bangladesh and Bhutan before entering the TP were also sometimes linked to high O3 at NMC. However, the major summertime O3 source regions were located to the north of NMC, including southern Xinjiang province, northern Tibet and western Qinghai province (Fig. 8c). High O3 was mostly associated with low-altitude air masses from the NW and N directions (Fig. 9c1). Summertime PAN was only rarely associated with northerly air masses, but mostly linked to westerly trajectories that travel along the southern TP border (mostly within 0–3 km, small parts within 3–6 km altitude, Fig. 9d1–2) and southerly trajectories traveling over Bangladesh and Bhutan within 3 km altitude (Fig. 9d1).
Thus, O3 and PAN revealed distinct source regions in both spring and summer, while they also shared some common source regions. This explains why despite highly similar diel variation patterns, the day-to-day variation was often different between the two photochemical pollutants. Overall, springtime synoptic conditions resulted in a relatively monotone origin of air masses at NMC, mostly favoring the subsidence of high-altitude air masses under westerly airflows, which were rich in both O3 and PAN. With the onset of the South and East Asian monsoon during summer, circulations drastically changed and resulted in influences of various distinct air-mass origins at NMC. These vastly different air-mass origins also exhibited completely different O3 levels, with those originating in the north exhibiting even higher O3 levels than those observed during springtime and southerly air masses revealing much lower O3 levels than during springtime. PAN, however, was more linked to westerly and southerly air masses during summer.
Aside from changes in air mass origins at NMC, seasonal variations in large-scale synoptic conditions were also deterministic of STE and the overall spatial distribution of O3. Since the ERA5 reanalysis data have only considered simplified stratospheric O3 chemistry and the physical transport of O3, the O3 mixing ratio in the ERA5 dataset is a good indicator for the investigation of stratospheric influences. During the spring period, the averaged ERA5 500 hPa O3 revealed relatively lower mixing ratios in the TP region (especially in southeast TP) and higher mixing ratios outside the TP in the latitude band between 15 and 25∘ N. As was shown in previous studies, the downward transport of stratospheric O3 and its distribution is closely linked to the location of the subtropical jet stream (W. Xu et al., 2018) , which is typically located above the TP during the spring period (Fig. 10c1). Due to large-scale circulations, lower-stratospheric O3 is typically high in polar regions, decreasing with latitude and reaching its lowest level in the equatorial belt (Fig. 10c1). Deep stratospheric intrusion and O3 subsidence often occur along the lower edge of the subtropical jet stream, which is a slope extending from the lower stratosphere (150 hPa) between 38 and 42∘ N down to the middle or upper troposphere below 28∘ N. STE processes are especially promoted by fronts, which are accompanied by large-scale subsidence of cold air from above (Stohl et al., 2003). STE mostly increased the O3 levels in Southeast Asia to the west and south of the TP, which in turn could enhance O3 at NMC through the westerly air-mass transport passage (Fig. S6). Direct STE influence was also frequently observed during the spring period (on 5–8, 13, 23, 31 May and 3, 5 and 9 June, Figs. S7–S13), with NMC frequently located near low-pressure troughs behind cold fronts. These STE events were typically associated with high O3 and low PAN concentrations, except for 13 May, when stratospheric O3 was transported to lower latitudes and then back to NMC via southwesterly winds, which also carried along high PAN concentrations, suggesting that NMC experienced aged stratospheric air masses. During the summer period, with the northward shift of the subtropical jet stream, the high lower-stratospheric O3 concentrations were also confined within higher latitudes; 500 hPa ERA5 O3 revealed a clearly distinct distribution from that during spring, displaying higher O3 levels north of NMC (>30∘ N) and much lower ones in the tropical region. Thus, under the prevailing southerly winds during the summer season, air masses with lower-stratospheric O3 contents are transported to NMC. However, during two episodes on 7–9 and 21–25 July, northerly cold air masses in front of 500 hPa high-pressure systems over the TP brought stratospheric O3 down to the northern TP regions and transported them within lower altitudes to NMC, resulting in surface O3 levels even higher than those during springtime (Figs. S14 and S15), while PAN did not reveal significant increases.
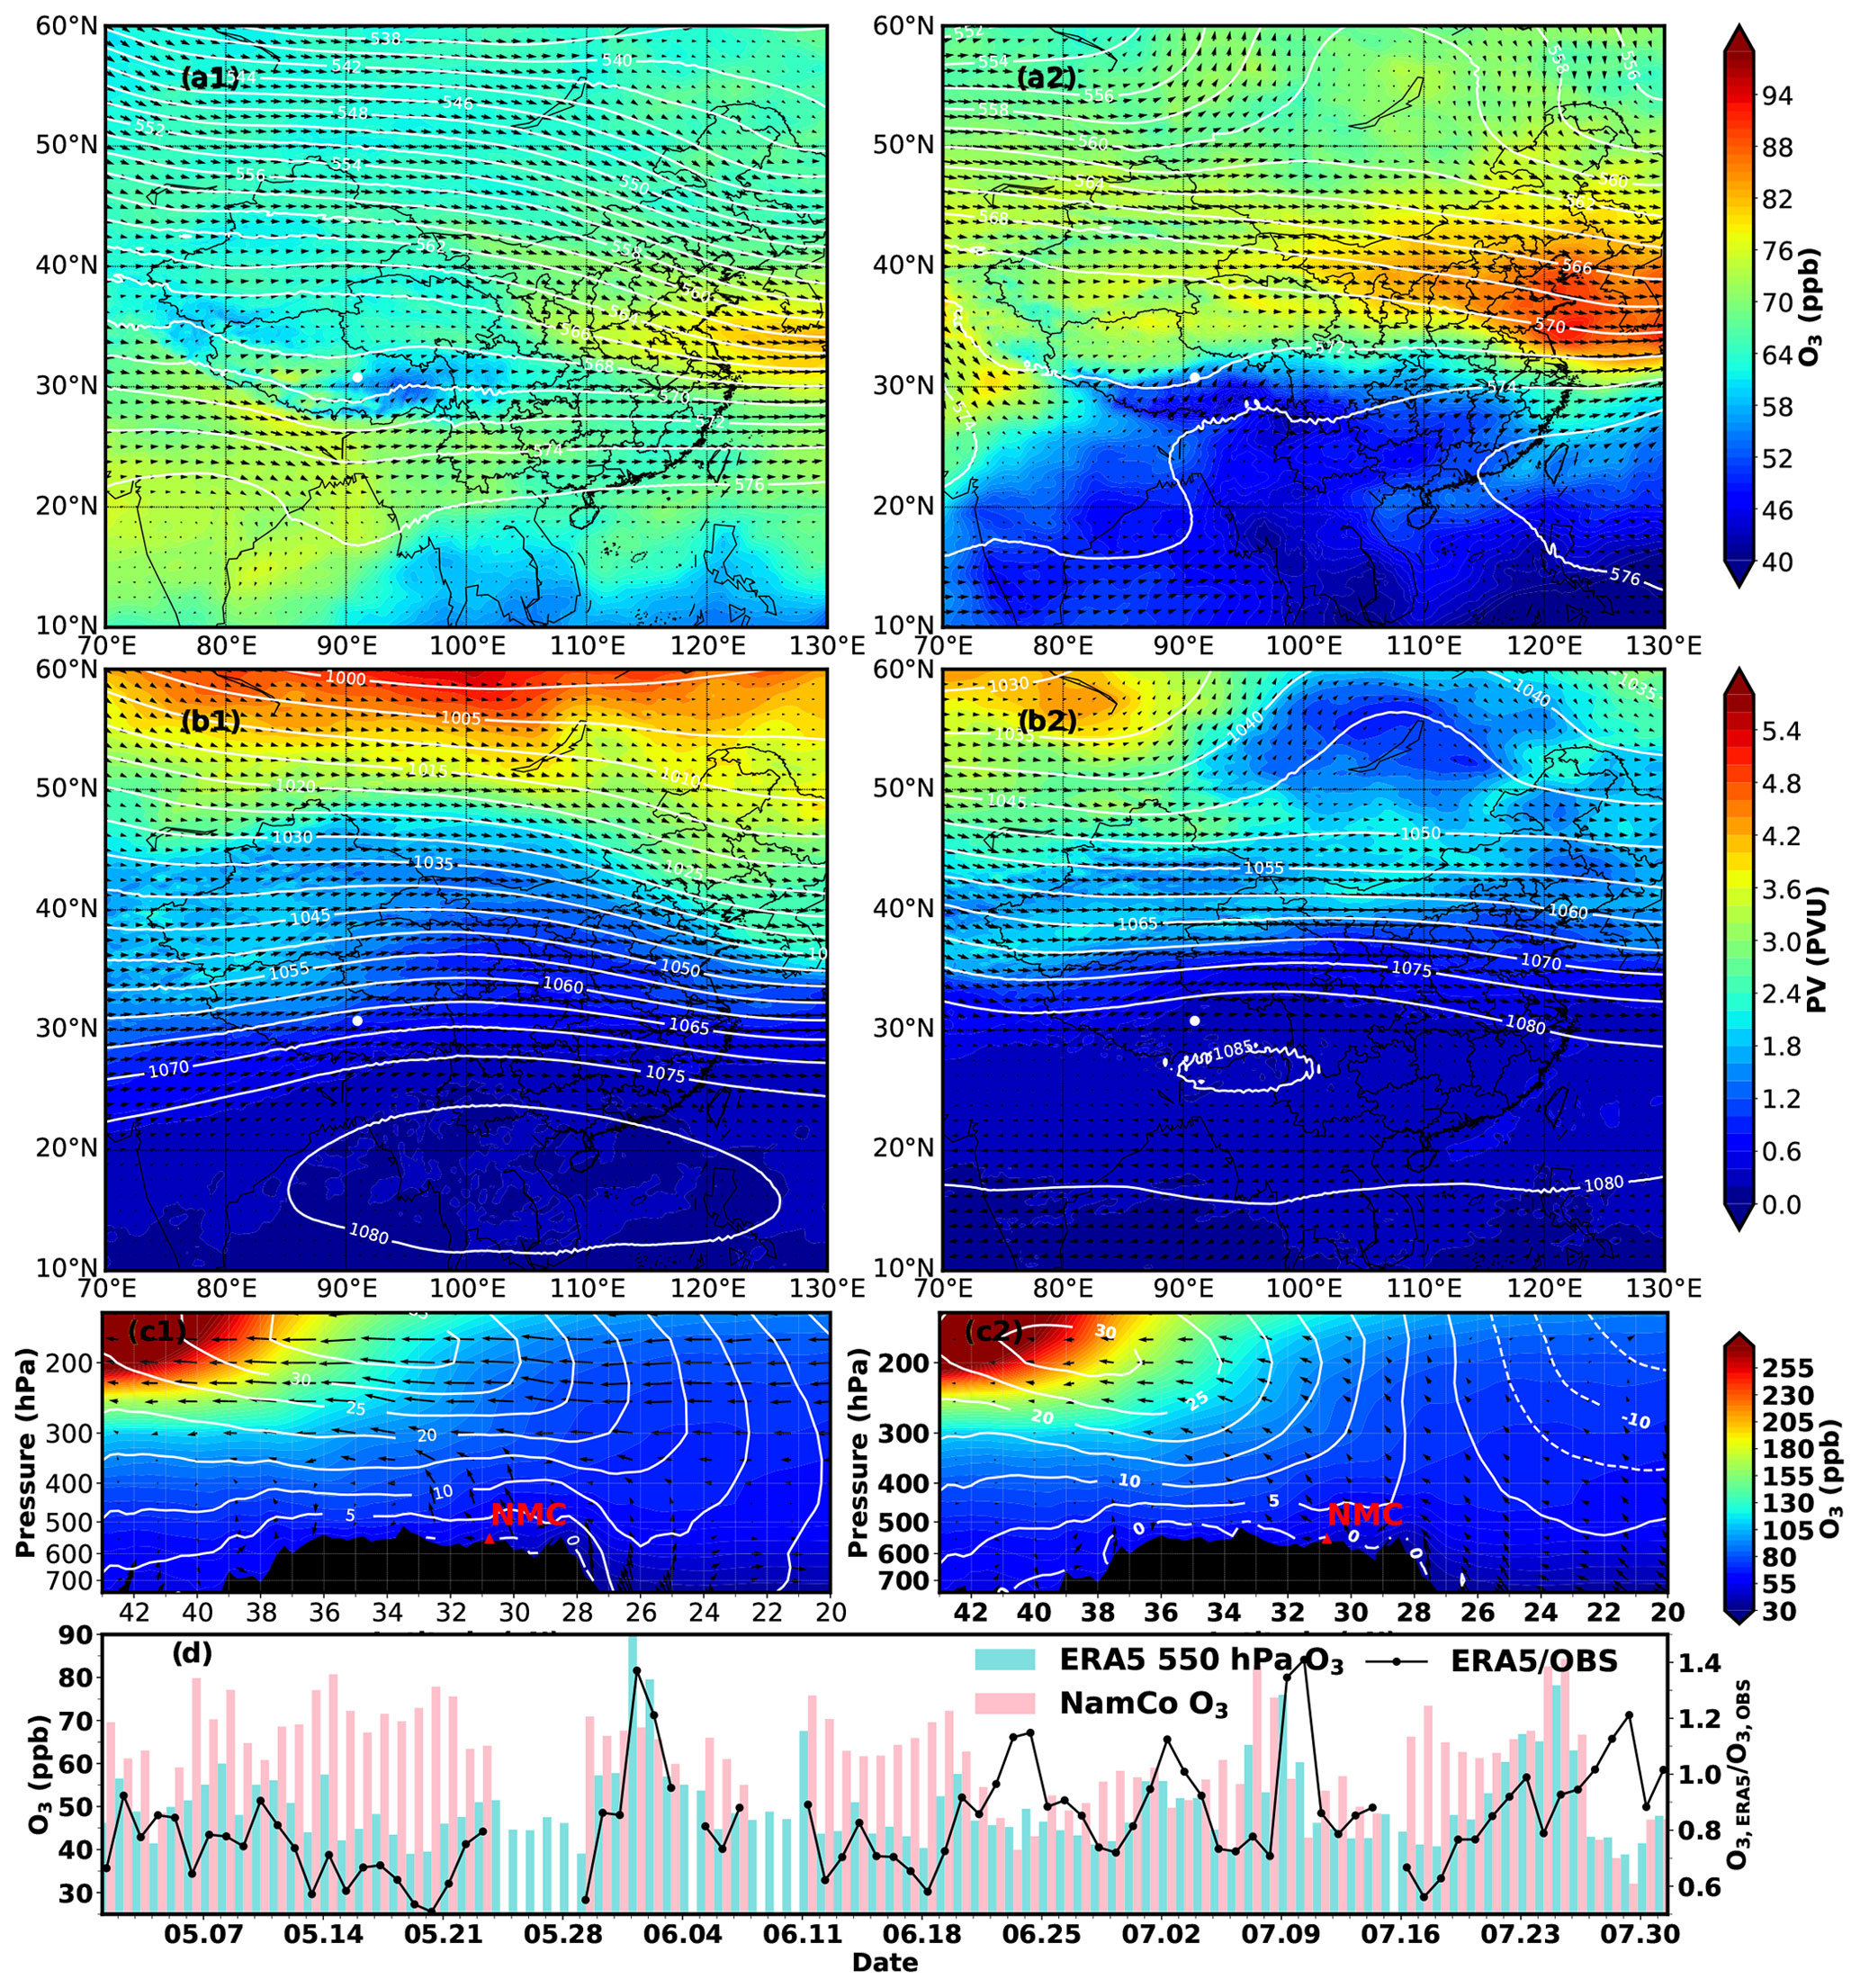
Figure 10Distribution of (a) ERA5 550 hPa O3 mixing ratio, geopotential height (white contour lines) and winds (black arrows), (b) 250 hPa potential vorticity, geopotential height and winds, (c) cross-section of O3 mixing ratio, u winds (white contour lines), v winds and vertical velocity (black arrows) at the longitude of Nam Co station, and (d) the comparison between daytime ERA5 550 hPa (blue bars) and observed O3 mixing ratio (pink bars) at Nam Co.
Statistically, O3,ERA5 only explained 0.1 % of the observed daytime O3 day-to-day variability during spring (r=0.033); however, it explained 22 % of the summertime O3,NMC variability (r=0.47), contributing on average 10 % during the entire observation period (Fig. S16), which was overall in accordance with previous results reported in Yin et al. (2017). It is also worth noting that observed O3 at NMC was typically higher than the 550 hPa ERA5 O3 mixing ratio, especially during spring and early summer (Fig. 10d). During the entire observation, stratospheric O3 transport explained 83 % of the observed daytime O3 concentration (OO3,NMC), with a lower contribution during spring (77 %) and a higher one during summer (88 %). This suggests that despite the small contributions of STE to the day-to-day variability of observed O3, the overall daytime O3 concentration was mainly maintained by the long-range transport of stratospheric O3 (as opposed to direct strike of stratospheric O3 during deep STE intrusions into the PBL). Additionally, the unexplained O3 concentration might indicate photochemical O3 formation aside from pure physical transport. However, whether it was caused by local photochemical production or the long-range transport of photochemically produced O3 still requires further investigation.
3.4 Impact of local photochemistry
As was already manifested, O3 has its natural sources and is more affected by STE processes at high-altitude locations such as NMC. O3 is highly reactive and can be easily depleted in regions with high NOx and VOC emissions; however it has a relatively longer lifetime in pristine background areas and can by directly or indirectly transported (transport of its precursors) over large distances, affecting O3 levels at remote locations (W. Xu et al., 2018). The impact of local photochemistry on the budget of O3, however, was often under debate in previous studies conducted in background areas of the TP. Under such pristine atmospheric conditions, it was manifested that O3 production was strongly NOx-limited, with NOx concentrations being the key factor determining whether O3 was net produced or destructed in local photochemistry (Ma et al., 2002). However, the lower detection limit and precision of commercial instruments can hardly meet the needs for NOx measurements in such clean environments, which made it difficult to determine whether there has been net O3 formation. At higher altitudes, PAN has a long lifetime and can be transported over long distances. PAN measurements have been previously conducted at Mt. Waliguan (northeastern TP) in 2006 (Xue et al., 2011) and at NMC station in the springs and summers of 2011 and 2012 (X. Xu et al., 2018). At both sites, PAN contributed substantially to reactive nitrogen and acted as a good indicator for regional and long-range transport of polluted air plumes. The photochemical formation of PAN requires the presence of peroxyl acetyl radical and NO2. The former is only formed in photochemical reactions of its precursor OVOCs, which are predominantly emitted within the boundary layer, while the latter is also mostly emitted near the surface, with the exception of lightning processes. Overall, the formation of PAN in comparison with O3 is more likely to occur near the surface and has no natural sources. Nevertheless, the impact of local PAN formation versus those of transport to observed concentration levels was not discussed before due to the lack of its precursor measurements.
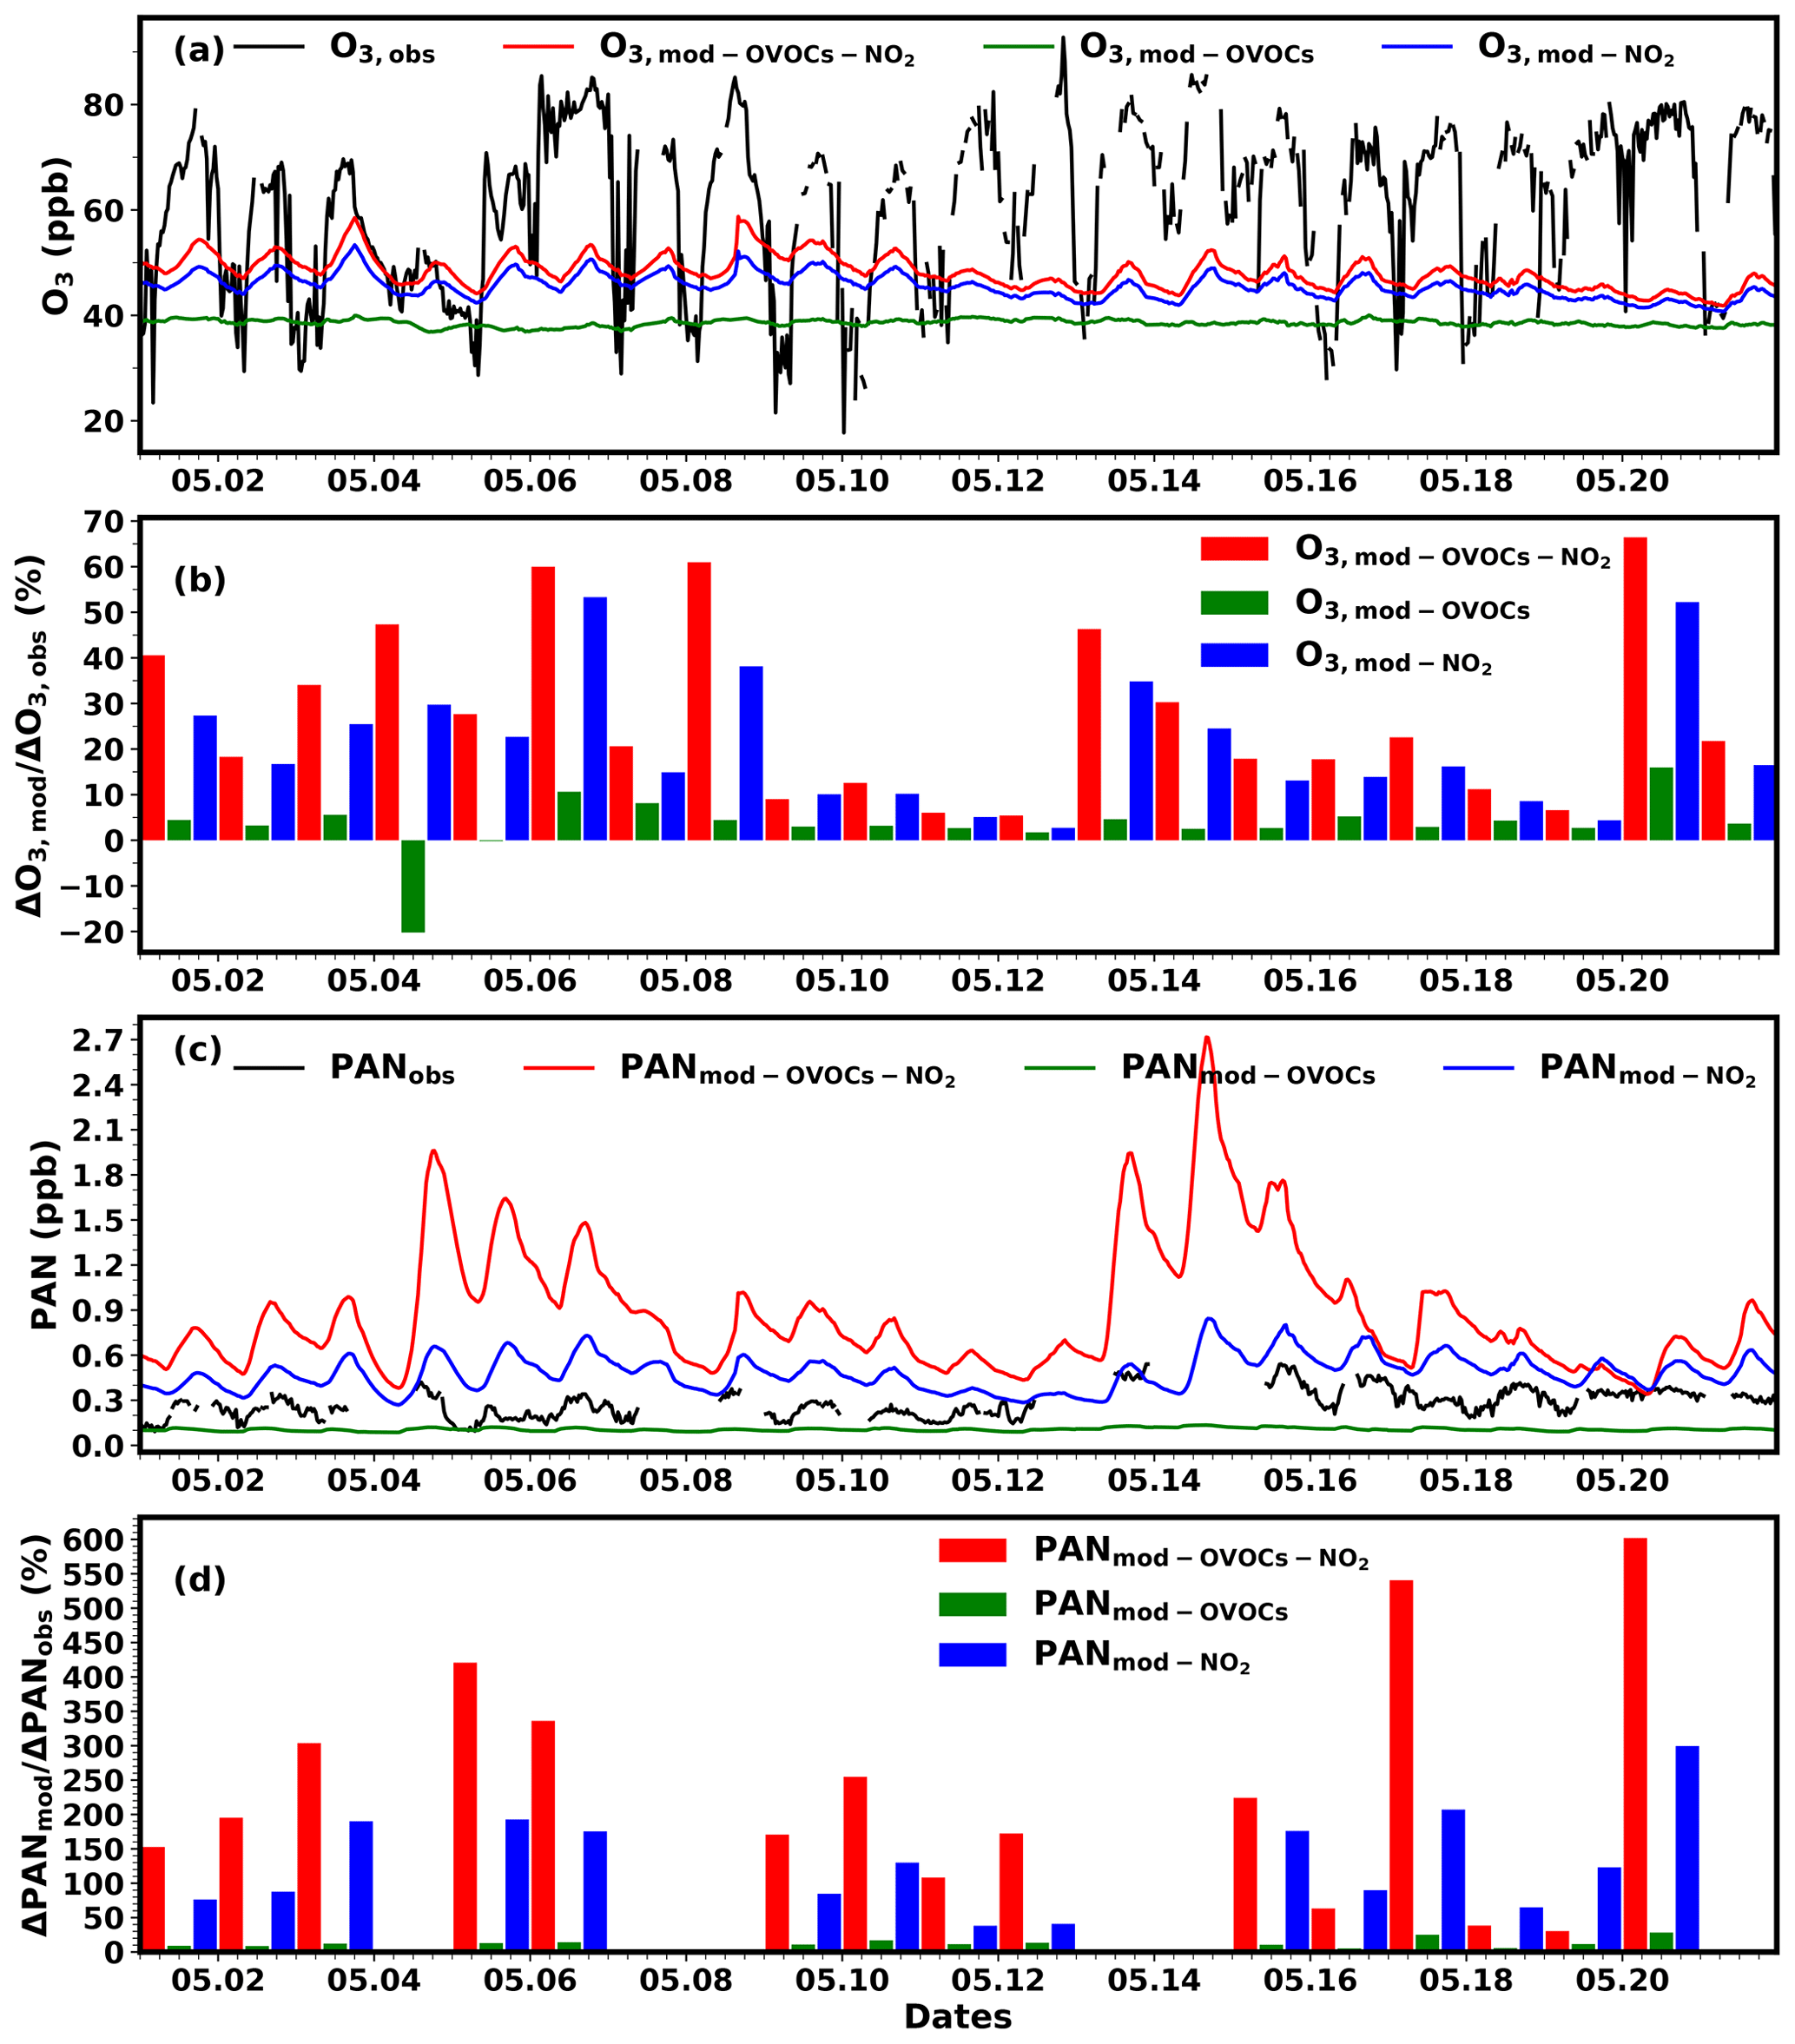
Figure 11(a) Observed (black) and modeled O3 using constraints on OVOCs (green), NO2 (blue) and both (red), (b) percentage of observed daytime O3 concentration increment (ΔO3,obs) that can be explained by those modeled under different constraints (ΔO3,mod), (c) observed (black) and modeled PAN under OVOCs (green), NO2 (blue) and both constraints (red), (d) percentage of observed daytime PAN concentration increment (ΔPANobs) that can be explained by those modeled under different constraints (ΔPANmod).
To evaluate the contribution of local photochemistry to observed O3 and PAN, simulations were performed using an MCM-based box model for the period of 1 to 21 May, when VOC measurements were available. Observed O3 revealed much larger fluctuations than those obtained from all three simulation scenarios, which respectively used measurement constraints on OVOCs, NO2 or both of them (Fig. 11a). With constraints on NO2, modeling results revealed significant daytime increases, indicating positive local net photochemical formation of O3 (Fig. 12a). However, when NO2 was unconstrained, modeled O3 concentrations were significantly lower and displayed very small variability, with very small positive net O3 production during the morning and mostly negative ones during the day (Fig. 12a). Nevertheless, none of the simulations could account for the large variability and steep morning increases within observed O3. With OVOCs and NO2 both constrained by measurements, modeling results could only explain 28±19 % (5 %–66 %) of the observed daytime increases (Fig. 11b), while even less could be explained when only OVOCs or NO2 was constrained (3±6 % and 21±14 %, respectively). Days with relatively stronger local photochemical O3 formation were not necessary days with high observed O3. In turn, days with high O3 were also often associated with weak photochemical net O3 formation. This indicates that physical transport and mixing processes were determinative of O3 diel cycle as well as the day-to-day O3 variability, while local photochemistry further added to the daytime O3 burden. Additionally, intercomparison among simulations also confirmed the high sensitivity of O3 formation towards NOx and the relatively weaker sensitivity to VOCs in such a pristine environment.
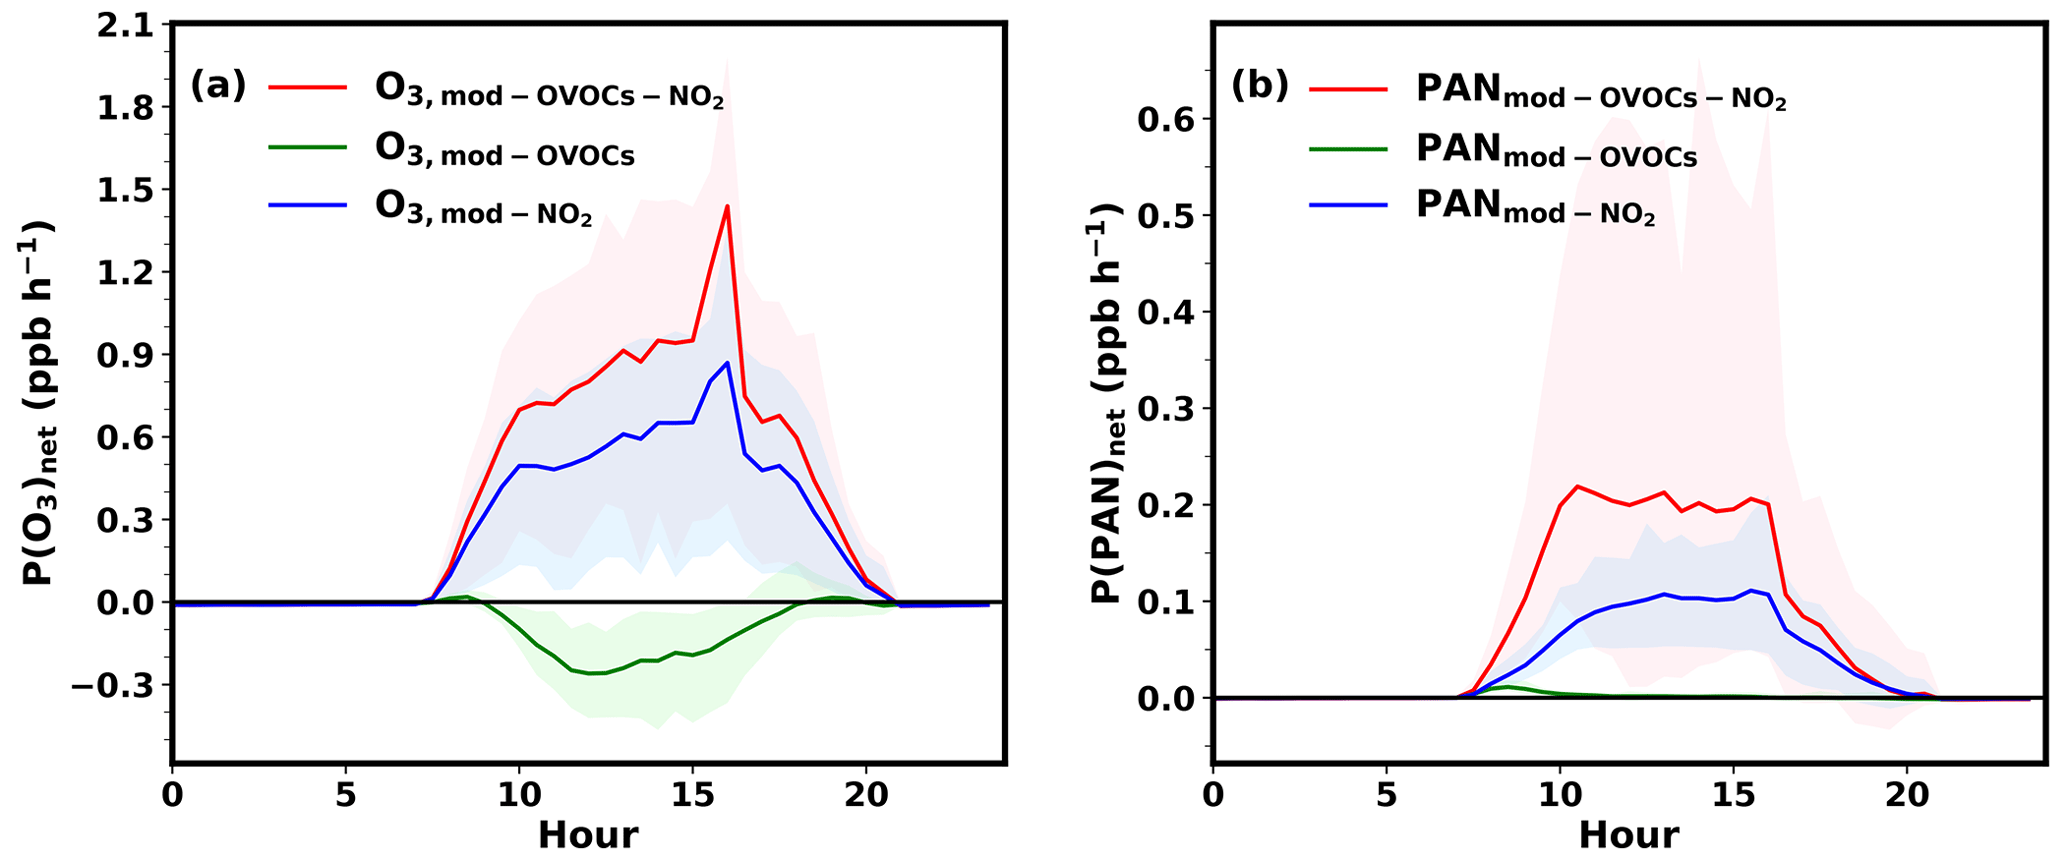
Figure 12Net production rate of (a) O3 and (b) PAN simulated under OVOCs (green), NO2 (blue) and OVOCs + NO2 combined (red) measurement constraints. Shaded areas represent calculated ranges of 5th to 95th percentiles.
Simulated PAN levels under NO2 constraints were, however, significantly higher than observed PAN concentrations, especially when OVOCs and NO2 were both constrained. However, when NO2 was unconstrained, PAN concentrations were mostly underestimated by simulations. Thermal decomposition of PAN was very weak under low springtime temperatures, and net photochemical PAN formation rates were positive under all simulation scenarios. However, only NO2-constrained cases revealed strong formation throughout daytime hours (08:00–20:00 LT), while unconstrained NO2 simulations only displayed a very weak morning time (07:00–09:00 LT) photochemical formation. Only NO2-constrained simulations overestimated PAN concentrations by a factor of 1.8 on average; however, they could reproduce observed daytime PAN increments by 94±84 %. Additionally, days with high simulated PAN photochemical production (4–6 and 13–17 May) corresponded to episodes with elevated observed PAN concentrations, which indicates that photochemical formation of PAN was determinative of its day-to-day variability. Compared to O3, PAN was sensitive to concentrations of both OVOCs and NO2, since some of the OVOCs are direct precursors of PA radicals, which combine with NO2 in PAN formation. According to modeling results in Fig. S17, acetaldehyde oxidation contributed majorly to PA radical formation at Nam Co (71.8 %), followed by methylglyoxal (9.0 %) and biacetyl (5.1 %). Still, NO2 was more decisive of the overall O3 and PAN production, since without its constraint, O3 net loss and negligible PAN net formation would be yielded.
It should also be noted that both observed O3 and PAN were not necessarily formed within the local boundary layer, since springtime winds in the TP were very strong, especially during daytime. Due to its relatively long lifetime, PAN might have been formed on the transport pathway to NMC, while O3 might undergo both destruction and production during air-mass transport. This might partly explain why PAN formation was overestimated by simulations representing surface conditions. But, overall, it could be concluded that O3 was mainly determined by physical transport, particularly STE processes, while PAN was largely determined by local photochemistry and that along the transport passageway. Fresh STE plumes reaching NMC from the north that are low in PAN concentrations result in depleted surface PAN, while relatively aged STE air masses crossing over polluted regions of the Indo-Gigantic Plain led to simultaneous enrichment in surface O3 and PAN. The high sensitivity of O3 and PAN formation towards NOx indicates that increased natural emission of NOx under global warming, enhanced anthropogenic emissions of NOx within the TP region due to the development of highways and transportation, and increased transport input from South Asia might greatly enhance O3 and PAN formation in background regions, while increased VOC emissions and regional transport promote PAN formation more than that of O3.
In this study, continuous measurements of O3 and PAN as well as their precursors were conducted during the spring and summer season at a very pristine high-altitude site in the southern TP (NMC station) to investigate the factors determining their variations. Due to the local topography, surface observations at NMC reflect free-tropospheric air conditions during daytime and nocturnal boundary layer conditions during nighttime. Both O3 and PAN revealed steep increases after sunrise and reached a flat plateau during daytime. While average diurnal variations of O3 and PAN highly resembled each other, their day-to-day variations were often different, suggesting that they might have been influenced by distinct physicochemical processes.
Backward trajectory modeling and PSCF analysis revealed distinct source regions connected to high O3 and PAN. During spring, air masses rich in O3 were mainly associated with high-altitude westerly air masses that either entered the TP from the west or from the south, while PAN was only rich in westerly air masses that transported along the polluted regions in northern India and Nepal before entering the TP from the south or in southerly air masses of maritime origin that crossed over polluted South Asian regions before entering the TP. During the summer monsoon season, air masses from the north were associated with the highest O3 levels, while westerly and southerly air masses revealed lower O3 levels. Elevated PAN concentrations, however, were still linked to westerly and southerly air masses crossing over polluted South Asian regions. O3 at NMC was strongly influenced by STE, which brought down high stratospheric O3 concentrations from the southwest route during spring and from the northwest during summer, explaining 77 % and 88 % of the observed O3 level in spring and summer, respectively. PAN concentrations were, however, typically lower in air masses with strong stratospheric influence, except if they transported over polluted regions south of the TP.
Photochemistry resulted in positive net formation of both O3 and PAN. While only 28±19 % of the observed daytime growth in O3 could be explained by photochemical simulations, the daytime growth of PAN was highly overestimated by the model if OVOCs and NO2 were both constrained. Photochemistry was not the factor determining the day-to-day variability of O3; however, it explained observed PAN variabilities well. While both O3 and PAN formation were highly sensitive to NOx levels, PAN was also quite sensitive to VOC concentrations. Therefore, future concentrations of O3 and PAN over the TP may be significantly impacted by increases in the concentrations of NOx, VOCs, and other precursors (Cui et al., 2016), which either originate from the surrounding regions (in particular South Asia) or from anthropogenic and natural sources within the TP. Special attention should be paid to PAN, which is mostly determined by photochemical processes sensitive to both NOx and VOCs and can be transported over very long distances.
The data used in this study are available on the @Tibet ftp server (http://at-tibet.quickconnect.cn/, Ye, 2023) and can be made available upon request to the corresponding authors (zhanggen@cma.gov.cn and c.ye@pku.edu.cn).
The supplement related to this article is available online at: https://doi.org/10.5194/acp-23-7635-2023-supplement.
WX and CY designed the experiment and led the research. WX, GZ, CY, YW, YZ, YB, WL, XX and ZM were responsible for the maintenance of trace gas and meteorology measurements in the experiment, and WX, YZ and YW processed the data. WX analyzed the data and wrote the paper with help from XZ, XX and GZ.
The contact author has declared that none of the authors has any competing interests.
Publisher's note: Copernicus Publications remains neutral with regard to jurisdictional claims in published maps and institutional affiliations.
This article is part of the special issue “In-depth study of the atmospheric chemistry over the Tibetan Plateau: measurement, processing, and the impacts on climate and air quality (ACP/AMT inter-journal SI)”. It is not associated with a conference.
We thank the Institute of Tibetan Plateau Research of the Chinese Academy of Sciences and the staff at the Nam Co site for their aid during the measurement campaign.
This research has been supported by the National Natural Science Foundation of China (grant nos. 41875159, 42275127, 42175127, 42075112, and 42105110) and the Beijing Municipal Natural Science Foundation (grant no. 8222078).
This paper was edited by Suvarna Fadnavis and reviewed by two anonymous referees.
Ara Begum, B., Kim, E., Jeong, C.-H., Lee, D.-W., and Hopke, P. K.: Evaluation of the potential source contribution function using the 2002 Quebec forest fire episode, Atmos. Environ., 39, 3719–3724, https://doi.org/10.1016/j.atmosenv.2005.03.008, 2005.
Benedict, K. B., Zhou, Y., Sive, B. C., Prenni, A. J., Gebhart, K. A., Fischer, E. V., Evanoski-Cole, A., Sullivan, A. P., Callahan, S., Schichtel, B. A., Mao, H., Zhou, Y., and Collett Jr., J. L.: Volatile organic compounds and ozone in Rocky Mountain National Park during FRAPPÉ, Atmos. Chem. Phys., 19, 499–521, https://doi.org/10.5194/acp-19-499-2019, 2019.
Cui, Y., Lin, J., Song, C., Liu, M., Yan, Y., Xu, Y., and Huang, B.: Rapid growth in nitrogen dioxide pollution over Western China, 2005–2013, Atmos. Chem. Phys., 16, 6207–6221, https://doi.org/10.5194/acp-16-6207-2016, 2016.
Ding, A. and Wang, T.: Influence of stratosphere-to-troposphere exchange on the seasonal cycle of surface ozone at Mount Waliguan in western China, Geophys. Res. Lett., 33, L03803, https://doi.org/10.1029/2005GL024760, 2006.
Draxler, R. R.: HYSPLIT4 user's guide, NOAA Tech. Memo, ERL ARL-230, NOAA Air Resources Laboratory, Silver Spring, MD, https://repository.library.noaa.gov/view/noaa/31315 (last access: 24 June 2023), 1999.
Draxler, R. R. and Hess, G. D.: Description of the HYSPLIT_4 modeling system, NOAA Tech. Memo, ERL ARL-224, NOAA Air Resources Laboratory, Silver Spring, MD, 24 pp., https://www.arl.noaa.gov/documents/reports/arl-224.pdf (last access: 24 June 2023), 1997.
Draxler, R. R., and Hess, G. D.: An overview of the HYSPLIT_4 modelling system for trajectories, dispersion and deposition, Aust. Meteorol. Mag., 47, 295–308, 1998.
Fischer, E. V., Jacob, D. J., Yantosca, R. M., Sulprizio, M. P., Millet, D. B., Mao, J., Paulot, F., Singh, H. B., Roiger, A., Ries, L., Talbot, R. W., Dzepina, K., and Pandey Deolal, S.: Atmospheric peroxyacetyl nitrate (PAN): a global budget and source attribution, Atmos. Chem. Phys., 14, 2679–2698, https://doi.org/10.5194/acp-14-2679-2014, 2014.
Hu, B., Liu, T., Hong, Y., Xu, L., Li, M., Wu, X., Wang, H., Chen, J., and Chen, J.: Characteristics of peroxyacetyl nitrate (PAN) in a coastal city of southeastern China: Photochemical mechanism and pollution process, Sci. Total Environ., 719, 137493, https://doi.org/10.1016/j.scitotenv.2020.137493, 2020.
Kleindienst, T. E., Shepson, P. B., and Smith, D. F.: Comparison of mutagenic activities of several peroxyacyl nitrates, Environ. Molec. Mutagen., 16, 70–80, 1990.
Kong, H., Lin, J., Zhang, Y., Li, C., Xu, C., Shen, L., Liu, X., Yang, K., Su, H., and Xu, W.: High natural nitric oxide emissions from lakes on Tibetan Plateau under rapid warming, Nat. Geosci., 16, 474–477, https://doi.org/10.1038/s41561-023-01200-8, 2023.
Langford, A. O.: Stratosphere-troposphere exchange at the subtropical jet: Contribution to the tropospheric ozone budget at midlatitudes, Geophys. Res. Lett., 26, 2449–2452, https://doi.org/10.1029/1999GL900556, 1999.
Lefohn, A. S., Malley, C. S., Simon, H., Wells, B., Xu, X., Zhang, L., and Wang, T.: Responses of human health and vegetation exposure metrics to changes in ozone concentration distributions in the European Union, United States, and China, Atmos. Environ., 152, 123–145, https://doi.org/10.1016/j.atmosenv.2016.12.025, 2017.
Lin, W., Xu, X., Zheng, X., Dawa, J., Baima, C., and Ma, J.: Two-year measurements of surface ozone at Dangxiong, a remote highland site in the Tibetan Plateau, J. Environ. Sci., 31, 133–145, https://doi.org/10.1016/j.jes.2014.10.022, 2015.
Liu, L., Wang, X., Chen, J., Xue, L., Wang, W., Wen, L., Li, D., and Chen, T.: Understanding unusually high levels of peroxyacetyl nitrate (PAN) in winter in Urban Jinan, China, J. Environ. Sci., 71, 249–260, https://doi.org/10.1016/j.jes.2018.05.015, 2018.
Liu, N., Ma, J., Xu, W., Wang, Y., Pozzer, A., and Lelieveld, J.: A modeling study of the regional representativeness of surface ozone variation at the WMO/GAW background stations in China, Atmos. Environ., 242, 117672, https://doi.org/10.1016/j.atmosenv.2020.117672, 2020.
Lucey, D., Hadjiiski, L., Hopke, P. K., Scudlark, J. R., and Church, T.: Identification of sources of pollutants in precipitation measured at the mid-Atlantic US coast using potential source contribution function (PSCF), Atmos. Environ., 35, 3979–3986, https://doi.org/10.1016/s1352-2310(01)00185-6, 2001.
Ma, J., Tang, J., Zhou, X., and Zhang, X.: Estimates of the Chemical Budget for Ozone at Waliguan Observatory, J. Atmos. Chem., 41, 21–48, https://doi.org/10.1023/A:1013892308983, 2002.
Ma, J., Lin, W. L., Zheng, X. D., Xu, X. B., Li, Z., and Yang, L. L.: Influence of air mass downward transport on the variability of surface ozone at Xianggelila Regional Atmosphere Background Station, southwest China, Atmos. Chem. Phys., 14, 5311–5325, https://doi.org/10.5194/acp-14-5311-2014, 2014.
Moxim, W. J., Levy II, H., and Kasibhatla, P. S.: Simulated global tropospheric PAN: Its transport and impact on NOx, J. Geophys. Res., 101, 12621–12638, https://doi.org/10.1029/96jd00338, 1996.
Mu, Y., Pang, X., Quan, J., and Zhang, X.: Atmospheric carbonyl compounds in Chinese background area: A remote mountain of the Qinghai-Tibetan Plateau, J. Geophys. Res.-Atmos., 112, D22302, https://doi.org/10.1029/2006JD008211, 2007.
Qiu, Y., Ma, Z., Li, K., Huang, M., Sheng, J., Tian, P., Zhu, J., Pu, W., Tang, Y., Han, T., Zhou, H., and Liao, H.: Measurement report: Fast photochemical production of peroxyacetyl nitrate (PAN) over the rural North China Plain during haze events in autumn, Atmos. Chem. Phys., 21, 17995–18010, https://doi.org/10.5194/acp-21-17995-2021, 2021.
Singh, H. B. and Hanst, P. L.: Peroxyacetyl nitrate (PAN) in the unpolluted atmosphere: An important reservoir for nitrogen oxides, Geophys. Res. Lett., 8, 941–944, https://doi.org/10.1029/GL008i008p00941, 1981.
Škerlak, B., Sprenger, M., and Wernli, H.: A global climatology of stratosphere–troposphere exchange using the ERA-Interim data set from 1979 to 2011, Atmos. Chem. Phys., 14, 913–937, https://doi.org/10.5194/acp-14-913-2014, 2014.
Sprenger, M. and Wernli, H.: A northern hemispheric climatology of cross-tropopause exchange for the ERA15 time period (1979–1993), J. Geophys. Res.-Atmos., 108, 8521, https://doi.org/10.1029/2002JD002636, 2003.
Sprenger, M., Wernli, H., and Bourqui, M.: Stratosphere–Troposphere Exchange and Its Relation to Potential Vorticity Streamers and Cutoffs near the Extratropical Tropopause, J. Atmos. Sci., 64, 1587–1602, https://doi.org/10.1175/jas3911.1, 2007.
Stohl, A., Bonasoni, P., Cristofanelli, P., Collins, W., Feichter, J., Frank, A., Forster, C., Gerasopoulos, E., Gäggeler, H., James, P., Kentarchos, T., Kromp-Kolb, H., Krüger, B., Land, C., Meloen, J., Papayannis, A., Priller, A., Seibert, P., Sprenger, M., Roelofs, G. J., Scheel, H. E., Schnabel, C., Siegmund, P., Tobler, L., Trickl, T., Wernli, H., Wirth, V., Zanis, P., and Zerefos, C.: Stratosphere-troposphere exchange: A review, and what we have learned from STACCATO, J. Geophys. Res.-Atmos., 108, 8516, https://doi.org/10.1029/2002JD002490, 2003.
Tang, Q., Prather, M. J., and Hsu, J.: Stratosphere-troposphere exchange ozone flux related to deep convection, Geophys. Res. Lett., 38, L03806, https://doi.org/10.1029/2010gl046039, 2011.
Taylor, O.: Importance of peroxyacetyl nitrate (PAN) as a phytotoxic air pollutant, J. Air Pollut. Contr. Assoc., 19, 347–351, 1969.
Wang, T., Wong, H. L. A., Tang, J., Ding, A., Wu, W. S., and Zhang, X. C.: On the origin of surface ozone and reactive nitrogen observed at a remote mountain site in the northeastern Qinghai-Tibetan Plateau, western China, J. Geophys. Res.-Atmos., 111, D08303, https://doi.org/10.1029/2005JD006527, 2006.
Wang, H., Wang, Y., Cai, K., Zhu, S., Zhang, X., and Chen, L.: Evaluating the Performance of Ozone Products Derived from CrIS/NOAA20, AIRS/Aqua and ERA5 Reanalysis in the Polar Regions in 2020 Using Ground-Based Observations, Remote Sens., 13, 4375, https://doi.org/10.3390/rs13214375, 2021.
Wei, W., Zang, J., Wang, X., and Cheng, S.: Peroxyacetyl nitrate (PAN) in the border of Beijing, Tianjin and Hebei of China: Concentration, source apportionment and photochemical pollution assessment, Atmos. Res., 246, 105106, https://doi.org/10.1016/j.atmosres.2020.105106, 2020.
Wolfe, G. M., Marvin, M. R., Roberts, S. J., Travis, K. R., and Liao, J.: The Framework for 0-D Atmospheric Modeling (F0AM) v3.1, Geosci. Model Dev., 9, 3309–3319, https://doi.org/10.5194/gmd-9-3309-2016, 2016.
Wu, F., Yu, Y., Sun, J., Zhang, J., Wang, J., Tang, G., and Wang, Y.: Characteristics, source apportionment and reactivity of ambient volatile organic compounds at Dinghu Mountain in Guangdong Province, China, Sci. Total Environ., 548–549, 347–359, https://doi.org/10.1016/j.scitotenv.2015.11.069, 2016.
Xu, W., Lin, W., Xu, X., Tang, J., Huang, J., Wu, H., and Zhang, X.: Long-term trends of surface ozone and its influencing factors at the Mt Waliguan GAW station, China – Part 1: Overall trends and characteristics, Atmos. Chem. Phys., 16, 6191–6205, https://doi.org/10.5194/acp-16-6191-2016, 2016.
Xu, W., Xu, X., Lin, M., Lin, W., Tarasick, D., Tang, J., Ma, J., and Zheng, X.: Long-term trends of surface ozone and its influencing factors at the Mt Waliguan GAW station, China – Part 2: The roles of anthropogenic emissions and climate variability, Atmos. Chem. Phys., 18, 773–798, https://doi.org/10.5194/acp-18-773-2018, 2018.
Xu, W., Zhang, G., Wang, Y., Tong, S., Zhang, W., Ma, Z., Lin, W., Kuang, Y., Yin, L., and Xu, X.: Aerosol Promotes Peroxyacetyl Nitrate Formation During Winter in the North China Plain, Environ. Sci. Technol., 55, 3568–3581, https://doi.org/10.1021/acs.est.0c08157, 2021.
Xu, X., Zhang, H., Lin, W., Wang, Y., Xu, W., and Jia, S.: First simultaneous measurements of peroxyacetyl nitrate (PAN) and ozone at Nam Co in the central Tibetan Plateau: impacts from the PBL evolution and transport processes, Atmos. Chem. Phys., 18, 5199–5217, https://doi.org/10.5194/acp-18-5199-2018, 2018.
Xue, L. K., Wang, T., Zhang, J. M., Zhang, X. C., Deliger, Poon, C. N., Ding, A. J., Zhou, X. H., Wu, W. S., Tang, J., Zhang, Q. Z., and Wang, W. X.: Source of surface ozone and reactive nitrogen speciation at Mount Waliguan in western China: New insights from the 2006 summer study, J. Geophys. Res., 116, D07306, https://doi.org/10.1029/2010jd014735, 2011.
Xue, L. K., Wang, T., Guo, H., Blake, D. R., Tang, J., Zhang, X. C., Saunders, S. M., and Wang, W. X.: Sources and photochemistry of volatile organic compounds in the remote atmosphere of western China: results from the Mt. Waliguan Observatory, Atmos. Chem. Phys., 13, 8551–8567, https://doi.org/10.5194/acp-13-8551-2013, 2013.
Yang, K., Wu, H., Qin, J., Lin, C., Tang, W., and Chen, Y.: Recent climate changes over the Tibetan Plateau and their impacts on energy and water cycle: A review, Global Planet. Change, 112, 79–91, https://doi.org/10.1016/j.gloplacha.2013.12.001, 2014.
Yao, Q., Ma, Z., Lin, W., Liu, J.-l., Wang, X., Cai, Z., and Han, S.: Transport Characteristics of PAN and O3 in the Lower Atmosphere of the Boundary Layer in Tianjin in Summer, Environ. Sci., 40, 67–75, https://doi.org/10.13227/j.hjkx.201805070, 2019.
Ye, C.: @Tibet ftp server, http://at-tibet.quickconnect.cn/, last access: 28 March 2023.
Yin, X., Kang, S., de Foy, B., Cong, Z., Luo, J., Zhang, L., Ma, Y., Zhang, G., Rupakheti, D., and Zhang, Q.: Surface ozone at Nam Co in the inland Tibetan Plateau: variation, synthesis comparison and regional representativeness, Atmos. Chem. Phys., 17, 11293–11311, https://doi.org/10.5194/acp-17-11293-2017, 2017.
Yukihiro, M., Hiramatsu, T., Bouteau, F., Kadono, T., and Kawano, T.: Peroxyacetyl nitrate-induced oxidative and calcium signaling events leading to cell death in ozone-sensitive tobacco cell-line, Plant Signal. Behav., 7, 113–120, https://doi.org/10.4161/psb.7.1.18376, 2012.
Zeng, Y. and Hopke, P. K.: A studyof the sources of acid precipitation in Ontario, Canada, Atmos. Environ., 23, 1499-1509, 1989.
Zhang, G., Xia, L., Zang, K., Xu, W., Zhang, F., Liang, L., Yao, B., Lin, W., and Mu, Y.: The abundance and inter-relationship of atmospheric peroxyacetyl nitrate (PAN), peroxypropionyl nitrate (PPN), O3, and NOy during the wintertime in Beijing, China, Sci. Total Environ., 718, 137388, https://doi.org/10.1016/j.scitotenv.2020.137388, 2020.
Zhang, G., Jing, S., Xu, W., Gao, Y., Yan, C., Liang, L., Huang, C., and Wang, H.: Simultaneous observation of atmospheric peroxyacetyl nitrate and ozone in the megacity of Shanghai, China: Regional transport and thermal decomposition, Environ. Pollut., 274, 116570, https://doi.org/10.1016/j.envpol.2021.116570, 2021.
Zhang, J. M., Wang, T., Ding, A. J., Zhou, X. H., Xue, L. K., Poon, C. N., Wu, W. S., Gao, J., Zuo, H. C., Chen, J. M., Zhang, X. C., and Fan, S. J.: Continuous measurement of peroxyacetyl nitrate (PAN) in suburban and remote areas of western China, Atmos. Environ., 43, 228–237, https://doi.org/10.1016/j.atmosenv.2008.09.070, 2009.
Zheng, X., Wan, G., Chen, Z., and Tang, J.: Measurement and meteorological analysis of 7Be and 210Pb in aerosol at Waliguan Observatory, Adv. Atmos. Sci., 25, 404–416, https://doi.org/10.1007/s00376-008-0404-y, 2008.
Zhou, L., Hopke, P. K., and Liu, W.: Comparison of two trajectory based models for locating particle sources for two rural New York sites, Atmos. Environ., 38, 1955–1963, https://doi.org/10.1016/j.atmosenv.2003.12.034, 2004.