the Creative Commons Attribution 4.0 License.
the Creative Commons Attribution 4.0 License.
 | 14 Jun 2023
The effect of anthropogenic emission, meteorological factors, and carbon dioxide on the surface ozone increase in China from 2008 to 2018 during the East Asia summer monsoon season
Danyang Ma
Tijian Wang
Hao Wu
Shu Li
Bingliang Zhuang
Mengmeng Li
Despite the implementation of the Clean Air Action Plan by the Chinese government in 2013, the issue of increasing surface ozone (O3) concentrations remains a significant environmental concern in China. In this study, we used an improved regional climate–chemistry–ecology model (RegCM-Chem-YIBs) to investigate the impact of anthropogenic emissions, meteorological factors, and CO2 changes on summer surface O3 levels in China from 2008 to 2018. Compared to its predecessor, the model has been enhanced concerning the photolysis of O3 and the radiative impacts of CO2 and O3. The investigations showed anthropogenic emissions were the primary contributor to the O3 increase in China, responsible for 4.08–18.51 ppb in the North China Plain. However, changed meteorological conditions played a crucial role in decreasing O3 in China and may have a more significant impact than anthropogenic emissions in some regions. Changed CO2 played a critical role in the variability of O3 through radiative forcing and isoprene emissions, particularly in southern China, inducing an increase in O3 on the southeast coast of China (0.28–0.46 ppb) and a decrease in southwest and central China (−0.51 to −0.11 ppb). Our study comprehensively analyzed O3 variation across China from various perspectives and highlighted the importance of considering CO2 variations when designing long-term O3 control policies, especially in high-vegetation-coverage areas.
- Article
(13875 KB) - Full-text XML
-
Supplement
(2527 KB) - BibTeX
- EndNote


O3 is a strong oxidant detrimental to human health (Lu et al., 2020; Liu et al., 2018a) and vegetation growth (Monks et al., 2015; Wang et al., 2017a). Furthermore, it is a crucial active compound influencing the earth's radiative balance, with an effective radiative forcing of up to 0.47 W m−2 in 2019 (IPCC, 2021). Tropospheric O3 has garnered significant attention over the past few decades due to its crucial role in air quality and climate change (Duan et al., 2017; Li et al., 2019; Ashmore and Bell, 1991; Lu et al., 2018).
With the rapid development in China, emissions of O3 precursors have been on the rise, leading to an annual increase in O3 concentrations since the beginning of the 20th century (Liu and Wang, 2020a; Ma et al., 2016). Surface O3 pollution has become a severe air quality concern in China (Verstraeten et al., 2016; Xu et al., 2018), particularly in major urban areas such as the North China Plain (NCP), Fenwei Plain (FWP), Yangtze River Delta (YRD), Pearl River Delta (PRD), and the Sichuan Basin (SCB) (Y. Wang et al., 2020; T. Wang et al., 2017a; Yin and Ma, 2020; Shen et al., 2019; Zhao et al., 2018; X. Wang et al., 2009). Although the Chinese government initialized the Clean Air Action Plan in 2013 to control air pollution, the concentration of O3 precursors and PM2.5 has significantly decreased (Zhai et al., 2019). However, surface O3 concentrations continue to increase in major urban areas.
Recent studies have suggested that regional meteorological conditions influence surface O3 levels through various pathways (Jacob and Winner, 2009; Shen et al., 2016; Lin et al., 2008). Modeling studies have shown that O3 levels are sensitive to temperature, humidity, wind speed, mixing height, and other meteorological conditions (Pfister et al., 2014; Sanchez-Ccoyllo et al., 2006). For instance, temperature affects the chemical formation rate of O3 (Lee et al., 2014), while precipitation reduces surface O3 concentrations through wet removal (Fang et al., 2011). Additionally, the elevated planetary boundary layer (PBL) height enhances upward movement, resulting in lower surface O3 concentrations (Haman et al., 2014). Therefore, long-term modeling of surface O3 levels must consider changes in meteorological conditions.
CO2 is the primary anthropogenic radiative force of the climate system (Gauss et al., 2003; Schimel et al., 2015). CO2 can impact regional air temperature and precipitation, leading to changes in surface O3 concentrations (Lu et al., 2013; Yang et al., 2014).
On the other hand, biogenic volatile organic compounds (BVOCs) are significant O3 precursors, and isoprene is the primary species among BVOCs that vegetation emits (Zheng et al., 2009; Fiore et al., 2011). In most of China, O3 is volatile organic compound (VOC) limited in the summer, especially in industrial cities (Li et al., 2018; Wu et al., 2018). Thus, it plays a significant role in modulating O3 levels and positively correlates with O3 concentrations in major urban areas of China. It is known that CO2 can enhance vegetation's photosynthesis (Sun et al., 2013; Heald et al., 2009; Tai et al., 2013; Monson and Fall, 1989), which may directly increase isoprene emission (Rapparini et al., 2004). Based on the observation, Rosenstiel et al. (2003) found that the isoprene emissions of plants grew by about 21 % and 41 % when CO2 reached 800 and 1200 ppm, respectively. However, Wilkinson et al. (2009) indicated that different vegetation types show varying responses in isoprene emission when CO2 increases. Isoprene emission was decreased by 30 %–40 % in Populus tremuloides Michx but increased by about 100 % in Quercus rubra when CO2 concentrations were grown (Sharkey et al., 1991). High concentrations of CO2 may inhibit the emission of isoprene by reducing the activity of BVOCs synthetase or decreasing the synthesis of adenosine triphosphate (Possell et al., 2005). Guenther et al. (1991) also indicated that isoprene emissions were significantly reduced when CO2 was increased from 100 to 600 µmol mol−1. In summary, the impact of elevated CO2 on isoprene emission may be positive or negative, mainly related to the relative size of the inhibition caused by elevated CO2 and promotion by enhanced photosynthesis.
Numerous studies have concluded that anthropogenic emissions are the primary drivers of surface O3 increases in different regions or years in China. Meanwhile, the effects of meteorological parameters can be substantial (Wang et al., 2019c; Lu et al., 2019; Dang et al., 2021; Liu and Wang, 2020a). For instance, Li et al. (2020) indicated that anthropogenic emissions were the primary cause of surface O3 increase in China from 2013 to 2019. Liu and Wang (2020a) suggested that anthropogenic emissions play a dominant role in the O3 variety in China, but the effects of meteorological conditions could be more significant in some regions. Han et al. (2020) analyzed the O3 changes in summer and suggested that meteorology can explain about 43 % of that in eastern China.
Previous studies have mainly focused on the impact of anthropogenic emissions and meteorological factors on the rise of O3 levels, with limited attention given to the role of CO2 variations. However, due to the rapid socioeconomic growth in China and the subsequent surge in energy consumption, CO2 emissions and concentrations have also increased significantly, particularly in the eastern coastal region (Lv et al., 2020; Ren et al., 2014). Furthermore, given the significant impact of CO2 on O3, it is crucial to evaluate the influence of changes in CO2 concentration on the maximum daily 8 h average (MDA8) O3 concentrations at the surface. Thus, a comprehensive assessment of the impact of anthropogenic emissions, meteorological factors, and CO2 on surface O3 is imperative.
Here, we employed an advanced regional climate–chemistry–ecology model to assess the impact of anthropogenic emissions, meteorological factors, and carbon dioxide variations during the summer monsoon period (May, June, July, and August) on surface O3 levels. Our findings can facilitate the development of a comprehensive O3 improvement strategy. Section 2 describes the methods and data, and the results and discussion are given in Sect. 3; finally, the conclusions are shown in Sect. 4.
2.1 Measurement data
We compared the simulated regional meteorological factors with the European Centre for Medium-Range Weather Forecasts Interim reanalysis data (ERA-Interim) at 37 vertical levels, which included temperature, relative humidity, and wind speed (Balsamo et al., 2015; Hoffmann et al., 2019). The observed surface O3 was taken from the China National Environmental Monitoring Center (CNEMC), which had more than 1400 environmental monitoring stations in 2018 (Wang et al., 2018; Kong et al., 2021; Zheng et al., 2014). The World Data Centre for Greenhouse Gases (WDCGG) data (Liu et al., 2009; Li et al., 2017) were applied to evaluate the simulated surface CO2 concentrations. The monitoring stations of O3 and CO2 are shown in Fig. 1.
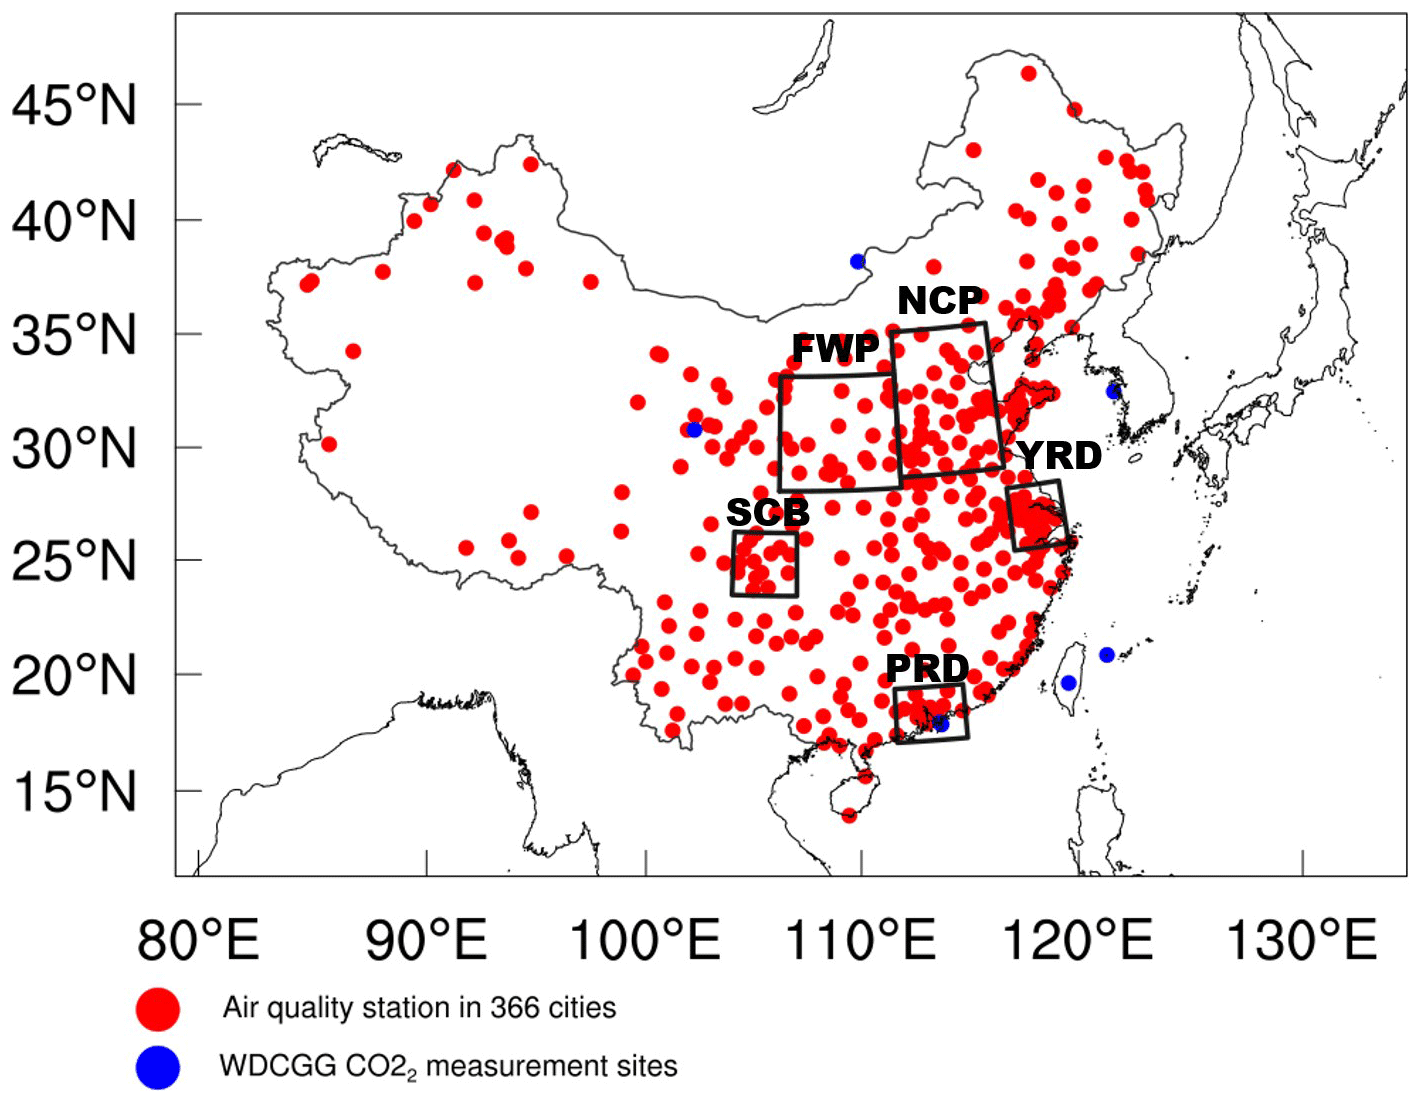
Figure 1Model domains for the RegCM-Chem-YIBs model. The regions with black boundaries are the North China Plain (34–41∘ N, 113–119∘ E), the Yangtze River Delta (30–33∘ N, 119–122∘ E), the Pearl River Delta (21.5–24∘ N, 112–115.5∘ E), the Sichuan Basin (28.5–31.5∘ N, 103.5–107∘ E), and the Fenwei Plain (33.5–39∘ N, 106–113∘ E) regions.
2.2 Model description
The RegCM-Chem-YIBs is a regional climate–chemistry–ecology model developed from the RegCM model. RegCM is a regional climate model initially developed by the International Centre for Theoretical Physics (ICTP) (Giorgi et al., 2012). Shalaby et al. (2012) integrated the Chem chemistry model into the RegCM model and incorporated the condensed version of the Carbon Bond Mechanism Z (CBM-Z) to enhance the model's capabilities. To further improve the model's performance, Yin et al. (2015) added a volatility basis set (VBS) scheme to simulate secondary organic aerosols (SOAs). Xie et al. (2020) further modified the model by incorporating CO2 as a tracer, which is subject to regulation by sources, sinks, and atmospheric transport processes. The model represents the four sources and sinks of CO2 as surface fluxes, including emissions from fossil fuels and biomass burning, air–sea CO2 exchange, and terrestrial biosphere CO2 fluxes. Additionally, the model incorporated the Yale Interactive Terrestrial Biosphere (YIBs), a land carbon cycle model that enables the simulation of ecological processes, including carbon assimilation, allocation, and autotrophic and heterotrophic respiration (Yue and Unger, 2015).
The ecological model (YIBs) was fully coupled into the regional climate–chemical model (RegCM-Chem) to reproduce the interactions between atmospheric composition and the ecosystem in the actual atmosphere (Xie et al., 2019). The meteorological factors and air components simulated by RegCM-Chem were input into the YIBs model to simulate vegetation physiological processes and calculate land surface parameters such as carbon dioxide flux, BVOCs emissions, and stomatal conductance. Conversely, the simulations of the YIBs model were fed back into the RegCM-Chem model to adjust the air qualities, temperature, humidity, circulation, and other meteorological fields. The RegCM-Chem-YIBs has been extensively applied to study surface O3, PM2.5, CO2, the summer monsoon, and the interactions between air quality and the ecosystem (Zhuang et al., 2018; Pu et al., 2017; Xu et al., 2022; Xie et al., 2018; Ma et al., 2023).
The RegCM model offers a variety of physical and chemical parameterization options. Here, the climatological chemical boundary conditions were driven by the Model for Ozone and Related Chemical Tracers (MOZART). The gas-phase chemistry employed the CBM-Z scheme (Zaveri and Peters, 1999). For the boundary layer scheme, the Holtslag PBL approach was utilized (Khayatianyazdi et al., 2021). The Grell cumulus convection scheme was employed to simulate convective processes (Grell, 1993). The CCM3 radiation scheme and CLM3.5 land surface module were used in the model (Collins et al., 2006; Giorgi and Mearns, 1999; Decker and Zeng, 2009).
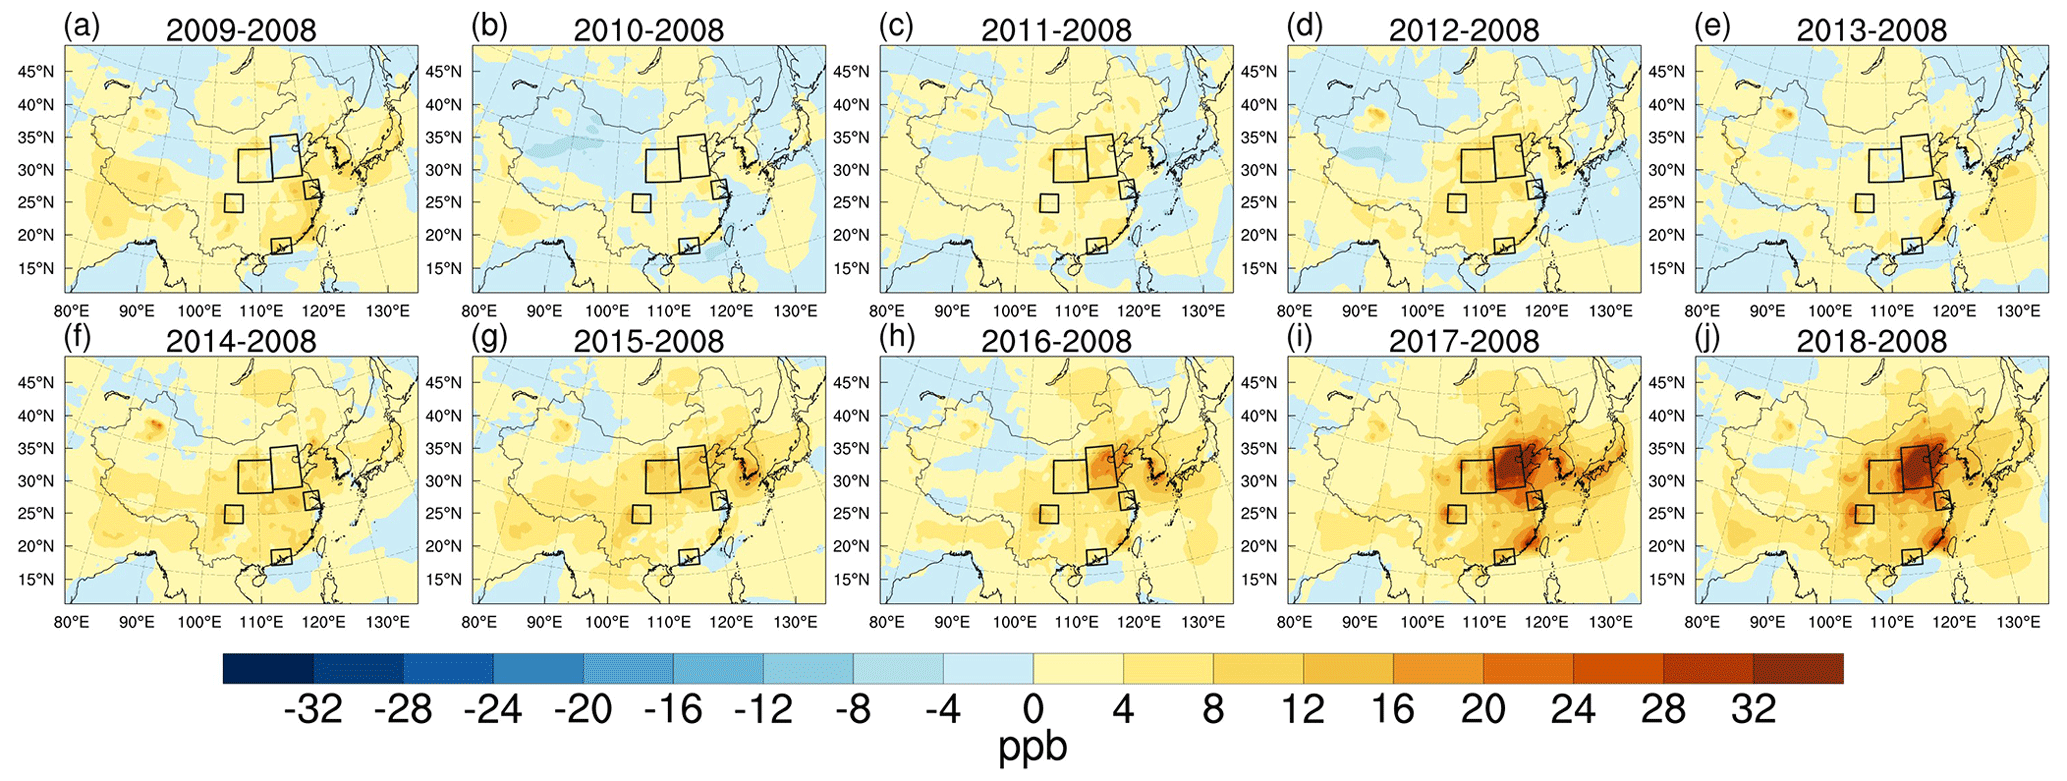
Figure 2Changes in the surface MDA8 O3 concentrations (units: ppb) during the summer monsoon period from 2009 (a), 2010 (b), 2011 (c), 2012 (d), 2013 (e), 2014 (f), 2015 (g), 2016 (h), 2017 (i), and 2018 (j) relative to 2008.
2.3 Model improvements
2.3.1 Radiation
In the previous version of the RegCM-Chem-YIBs model, radiative calculations only accounted for changes in the spatiotemporal distribution of particulate matter. To simplify the radiation calculations, the atmospheric CO2 and O3 concentrations were assumed to be constant throughout the year. However, atmospheric CO2 and O3 are subject to modulation by various sources, sinks, physical processes, and chemical processes (Ballantyne et al., 2012; Wang et al., 2019a). Additionally, rapid urbanization in China has led to an annual increase in CO2 and O3 concentrations (Guan et al., 2021; Wei et al., 2022), with elevated concentrations and growth rates primarily distributed in the eastern regions where urbanization is most prominent (Shi et al., 2016; Wang et al., 2017b). To more accurately simulate the atmospheric radiation balance and East Asian monsoon climate, it is necessary to incorporate spatiotemporal variations of CO2 and O3 concentrations into the radiation module. Therefore, we included the varying CO2 and O3 concentrations simulated by the model in the radiation module to calculate the corresponding radiative forcing.
2.3.2 Photolysis
The photolysis process was simulated using the Tropospheric Ultraviolet and Visible (TUV) model, which is commonly used to compute photolysis rates in various models (Tie et al., 2003; Shetter et al., 2002; Borg et al., 2011). The TUV model employs input parameters such as zenith angle, altitude, ozone column, SO2 column, NO2 column, aerosol optical depth (AOD), single scattering albedo (SSA), and albedo, among others, to calculate photolysis rates (Singh and Singh, 2004). However, in the TUV module of the RegCM-Chem-YIBs model, AOD and SSA were held constant. This is problematic as accurate aerosol optical parameters, such as AOD and SSA, play a crucial role in the photolysis of O3 (Lefer et al., 2003). To address this issue, we incorporated temporally and spatially varying AOD and SSA simulated by the RegCM-Chem-YIBs model into the photolysis rate calculations in the TUV module. This enabled us to accurately incorporate the extinction effect of the varying particles into the photolysis reaction, leading to more realistic simulations of air components and regional meteorology.
2.4 Emissions and Experiment settings
Anthropogenic emissions from 2008 to 2018 were obtained from the Multi-resolution Emission Inventory for China (MEIC), which has been compiled and maintained by Tsinghua University since 2010 (Zheng et al., 2018; Wang et al., 2014). CO2 emissions and boundary conditions were derived from the NOAA CarbonTracker CT2019 dataset (Jacobs et al., 2021). The initial meteorological boundary data, such as temperature, relative humidity, and wind, are derived from the ERA-Interim reanalysis dataset with a horizontal resolution of 0.125∘, a temporal resolution of 6 h, and 37 vertical levels (Liu et al., 2018b). The weekly mean sea surface temperature dataset was obtained from the National Ocean and Atmosphere Administration (NOAA) (Reynolds et al., 2002).
The simulation domain was illustrated in Fig. 1, with the target region centered at 36∘ N and 107∘ E and with a grid resolution of 60 km by 60 km. The model used 18 vertical levels, ranging from the surface to 50 hPa.
In the Base experiment, we incorporated interannual variations in anthropogenic emissions, meteorological fields, and CO2 emissions. Meteorological conditions (CO2 emissions) were kept constant at 2008 levels over 10 years, referred to as the SIMMET=2008 (SIM) experiment.
The changes in O3 concentrations relative to 2008 between 2009 and 2018 were determined by comparing simulations of different years with 2008 in the Base experiment (Eq. 1). The impact of changed meteorological conditions on O3 concentrations relative to 2008 was assessed by comparing results between SIMMET=2008 and the Base experiment in the same year (Eq. 2). The contribution of changed CO2 emissions was similarly estimated (Eq. 3). Finally, the influence of anthropogenic emissions was calculated by excluding the impact of meteorological factors and CO2 from the changes in O3 concentrations (Eq. 4). Table 1 shows the results of the numerical experiments.
ΔOi represents the changes in O3 concentrations in the year i relative to 2008. Basei represents the O3 concentrations in the Base experiment in the year i. ΔMi represents the changes in O3 concentrations in the year i due to meteorological factors variations. SIM represents the O3 concentrations in the SIMMET=2008 experiment in the year i. ΔCi represents the changes in O3 concentrations in the year i due to CO2 variations. SIM represents the O3 concentrations in the SIM experiment in the year i. ΔEi represents the changes in O3 concentrations in the year i due to anthropogenic emissions variations.
In this work, both meteorological and CO2 boundary conditions were kept consistent in base and sensitivity studies. We did not consider the impact of boundary conditions on O3 due to the following reasons. First, in general, the regional model was coupled with the global model to get a more realistic influence from the boundary. However, for long-term climate–chemistry modeling, such a coupling means a large computing resource. Second, the boundary conditions were derived from global models (Liu et al., 2017; Ban et al., 2014) and have to be prescribed in numerical experiments. Finally, fixed boundary conditions were widely used in some O3 studies in China (Liu and Wang, 2020a, b; Wang et al., 2019b). Moreover, regional emissions are the primary source of surface O3 in China, with contributions accounting for 80 % from May to August (Lu et al., 2019). Therefore, the impact of fixed boundary conditions can be ignored in the current stage.
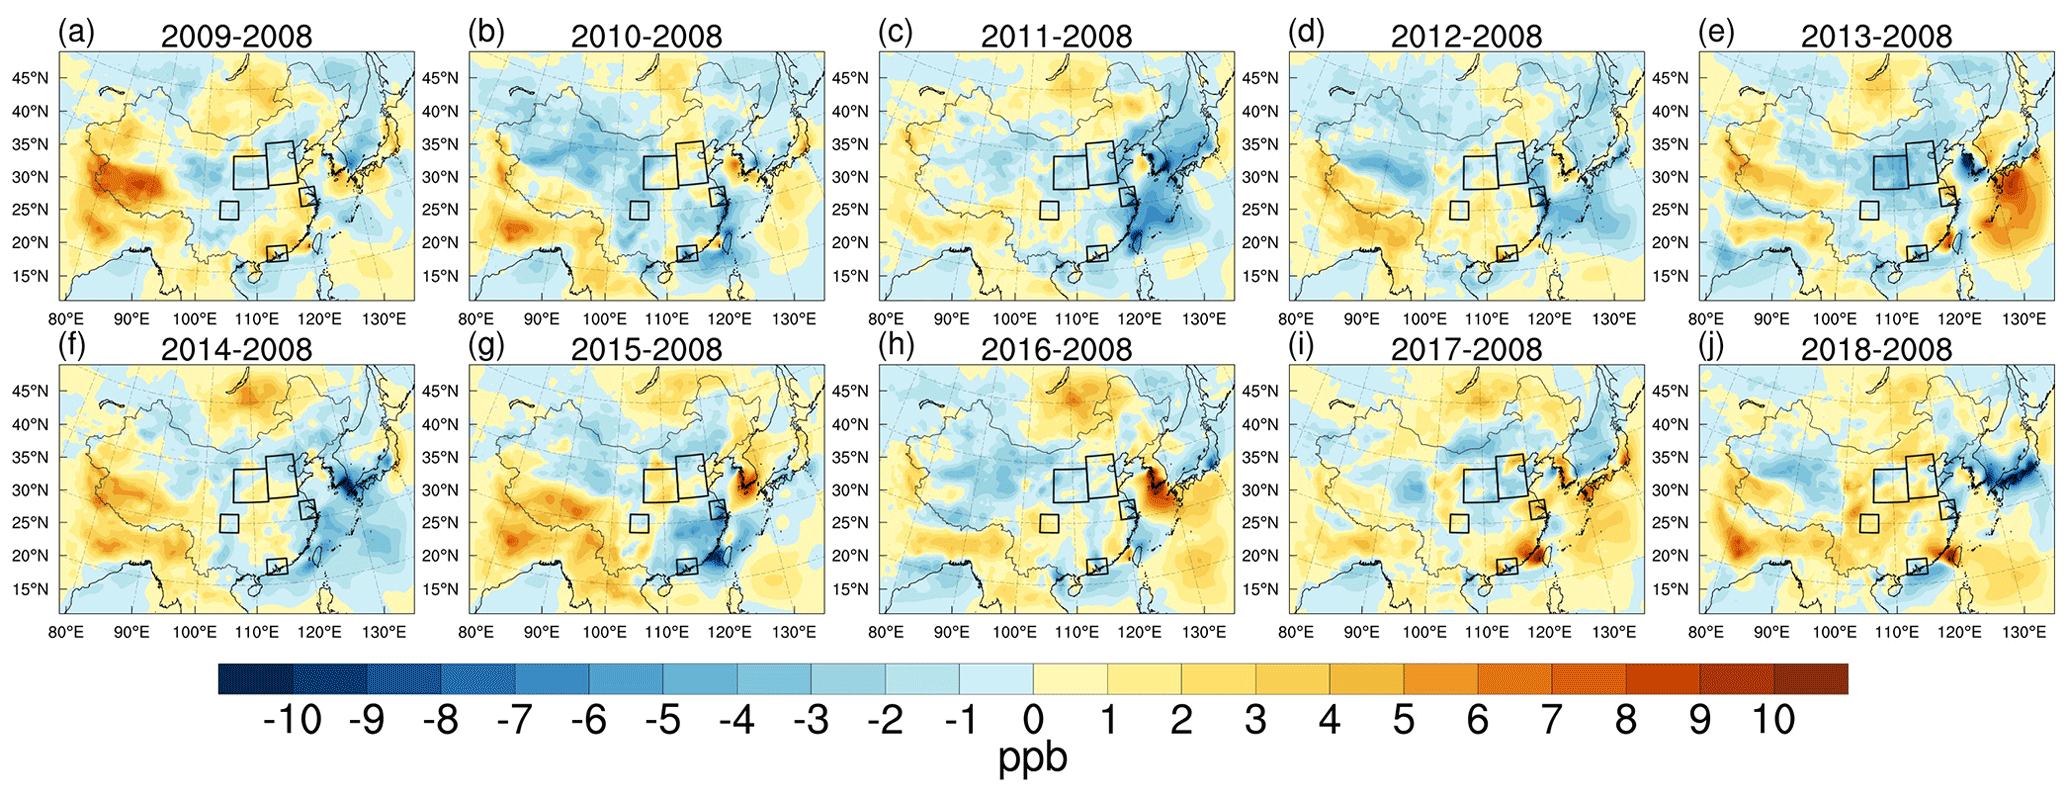
Figure 3The response of the surface MDA8 O3 mixing ratios (units: ppb) to variations in meteorological conditions during the summer monsoon period in 2009 (a), 2010 (b), 2011 (c), 2012 (d), 2013 (e), 2014 (f), 2015 (g), 2016 (h), 2017 (i), and 2018 (j) relative to 2008.
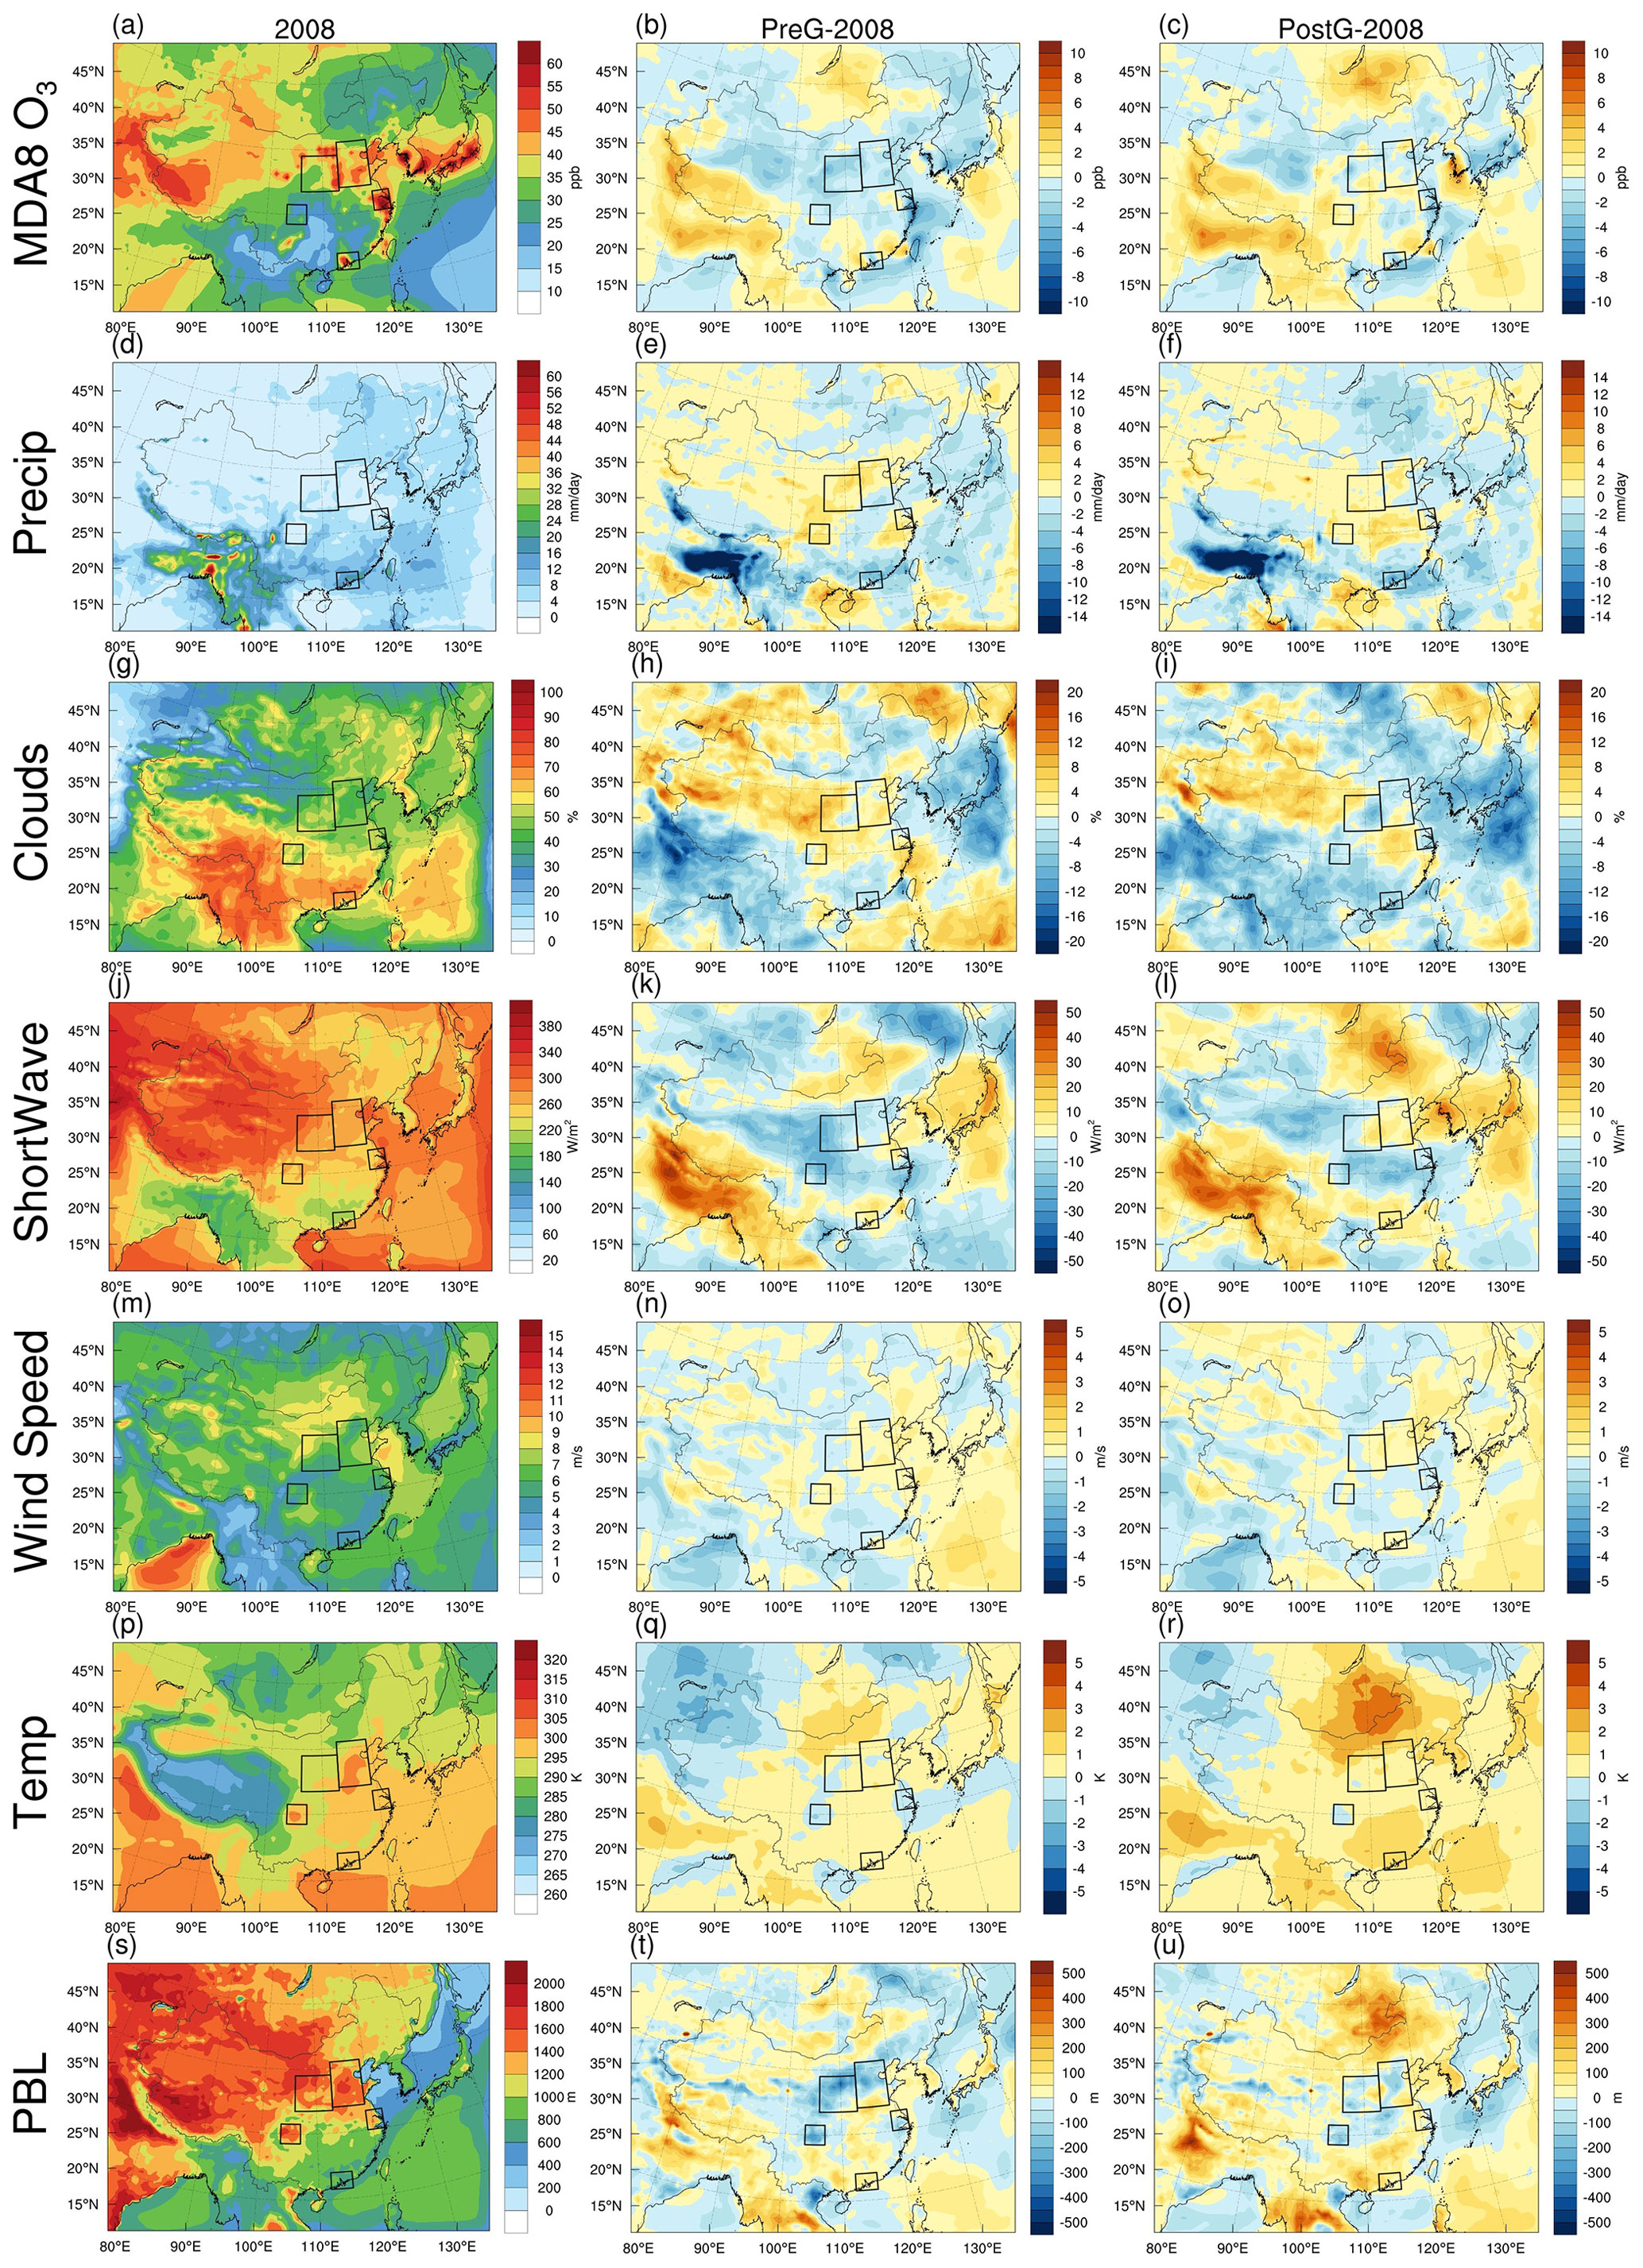
Figure 4The MDA8 O3 (a–c, units: ppb), precipitation (d–f, units: mm d−1), clouds (g–i, units: %), shortwave flux (j–l, units: W m−2), wind speed (m–o, units: m s−1), temperature (p–r, units: K), and planetary boundary layer height (s–u, units: m) during the summer monsoon period in 2008 from the base simulations (the left column) and their responses due to variations in meteorological conditions in PreG (2009–2013, the central column) and PostG (2014–2018, the right column) relative to 2008.
3.1 Model evaluation
The ability of RegCM to reproduce East Asian climate and air quality has been widely evaluated in recent years. Previous studies have demonstrated that RegCM was capable of the essential characteristics and interannual variations of air components and meteorological fields in East Asia (Xu et al., 2023; Ma et al., 2023; Zhuang et al., 2018). Given that the monitoring of near-surface O3 levels by CNEMC was initiated only in late 2013, the monitoring sites in 2013 and 2014 were limited, and the monitoring period was disjointed. As a result, in this study, we compared the simulated meteorological fields, O3, and CO2 levels with observations only from 2015 to 2018.
Figures S1–S4 demonstrated that the RegCM-Chem-YIBs model effectively captured the spatial distribution and magnitude of temperature, humidity, and wind over East Asia at 500, 850, and 1000 hPa between 2015 and 2018. However, due to the complex terrain's influence on the lower atmosphere, most models show better results at higher levels (Zhuang et al., 2018; Anwar et al., 2019; Xie et al., 2019). Thus, the simulations at 500 hPa were more consistent with the reanalysis data. At 1000 hPa, the simulated wind speed was slightly higher than the reanalysis data in eastern China. This difference may be due to common deficiencies in meteorological models, such as insufficient horizontal resolution, initial and boundary conditions, and physical parameterizations (Cassola and Burlando, 2012; Accadia et al., 2007), particularly in areas with low wind speeds (Carvalho et al., 2012).
Figures S5 and S6 demonstrated that the model accurately reproduced the observed increase in surface CO2 and O3 from 2015 to 2018, with high correlation coefficients ranging from 0.39 to 0.74 (Table 2). The model effectively captured the high concentrations of O3 in major urban areas such as the NCP, the YRD, the PRD, the SCB, and the FWP, while also successfully reproducing the gradient in CO2 concentrations between eastern and western China. However, the model slightly underpredicted MDA8 O3 concentrations (−4.02 to −3.21 ppb) and overestimated CO2 levels (3.32–7.07 ppm). These discrepancies are mainly attributed to uncertainties in the emissions inventory (Hong et al., 2017). Overall, the simulated meteorological factors and surface CO2 and O3 concentrations were deemed acceptable.
Table 2Evaluations of the surface CO2 (units: ppm) and MDA8 O3 (units: ppb) during the summer monsoon period in East Asia.
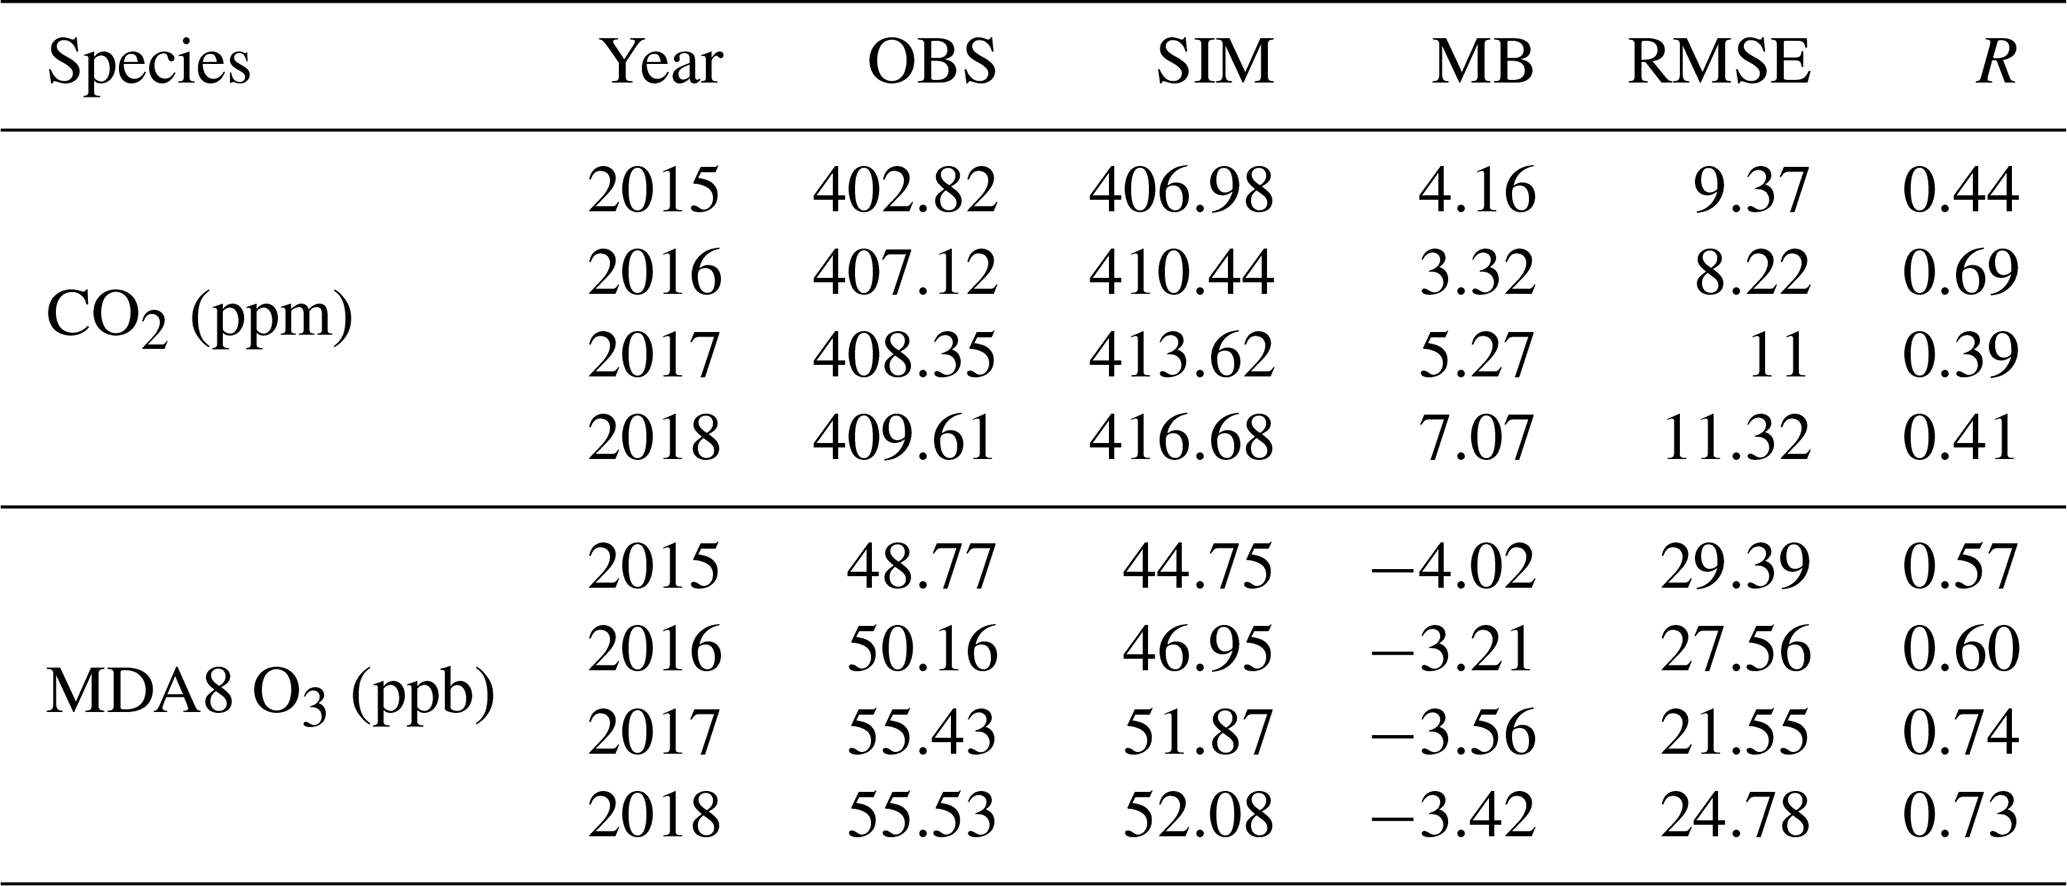
OBS: observation; SIM: simulation; MB: bias; RMSE: root mean square error; R: correlation coefficient. MDA8 O3: the maximum daily 8 h average O3.
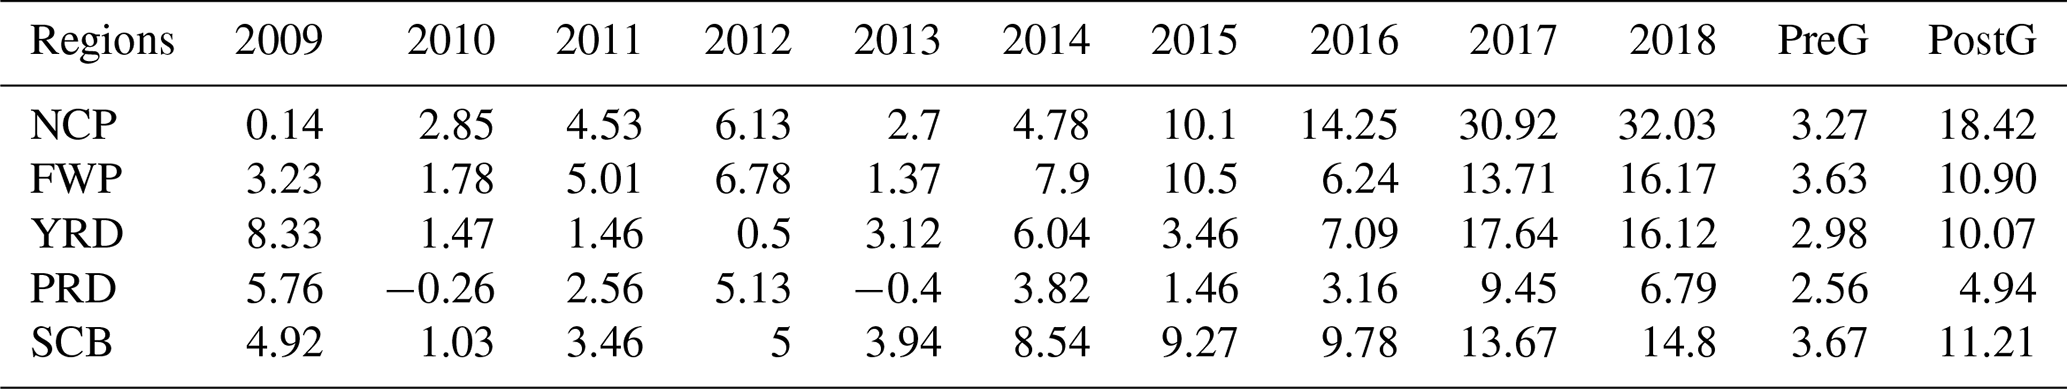
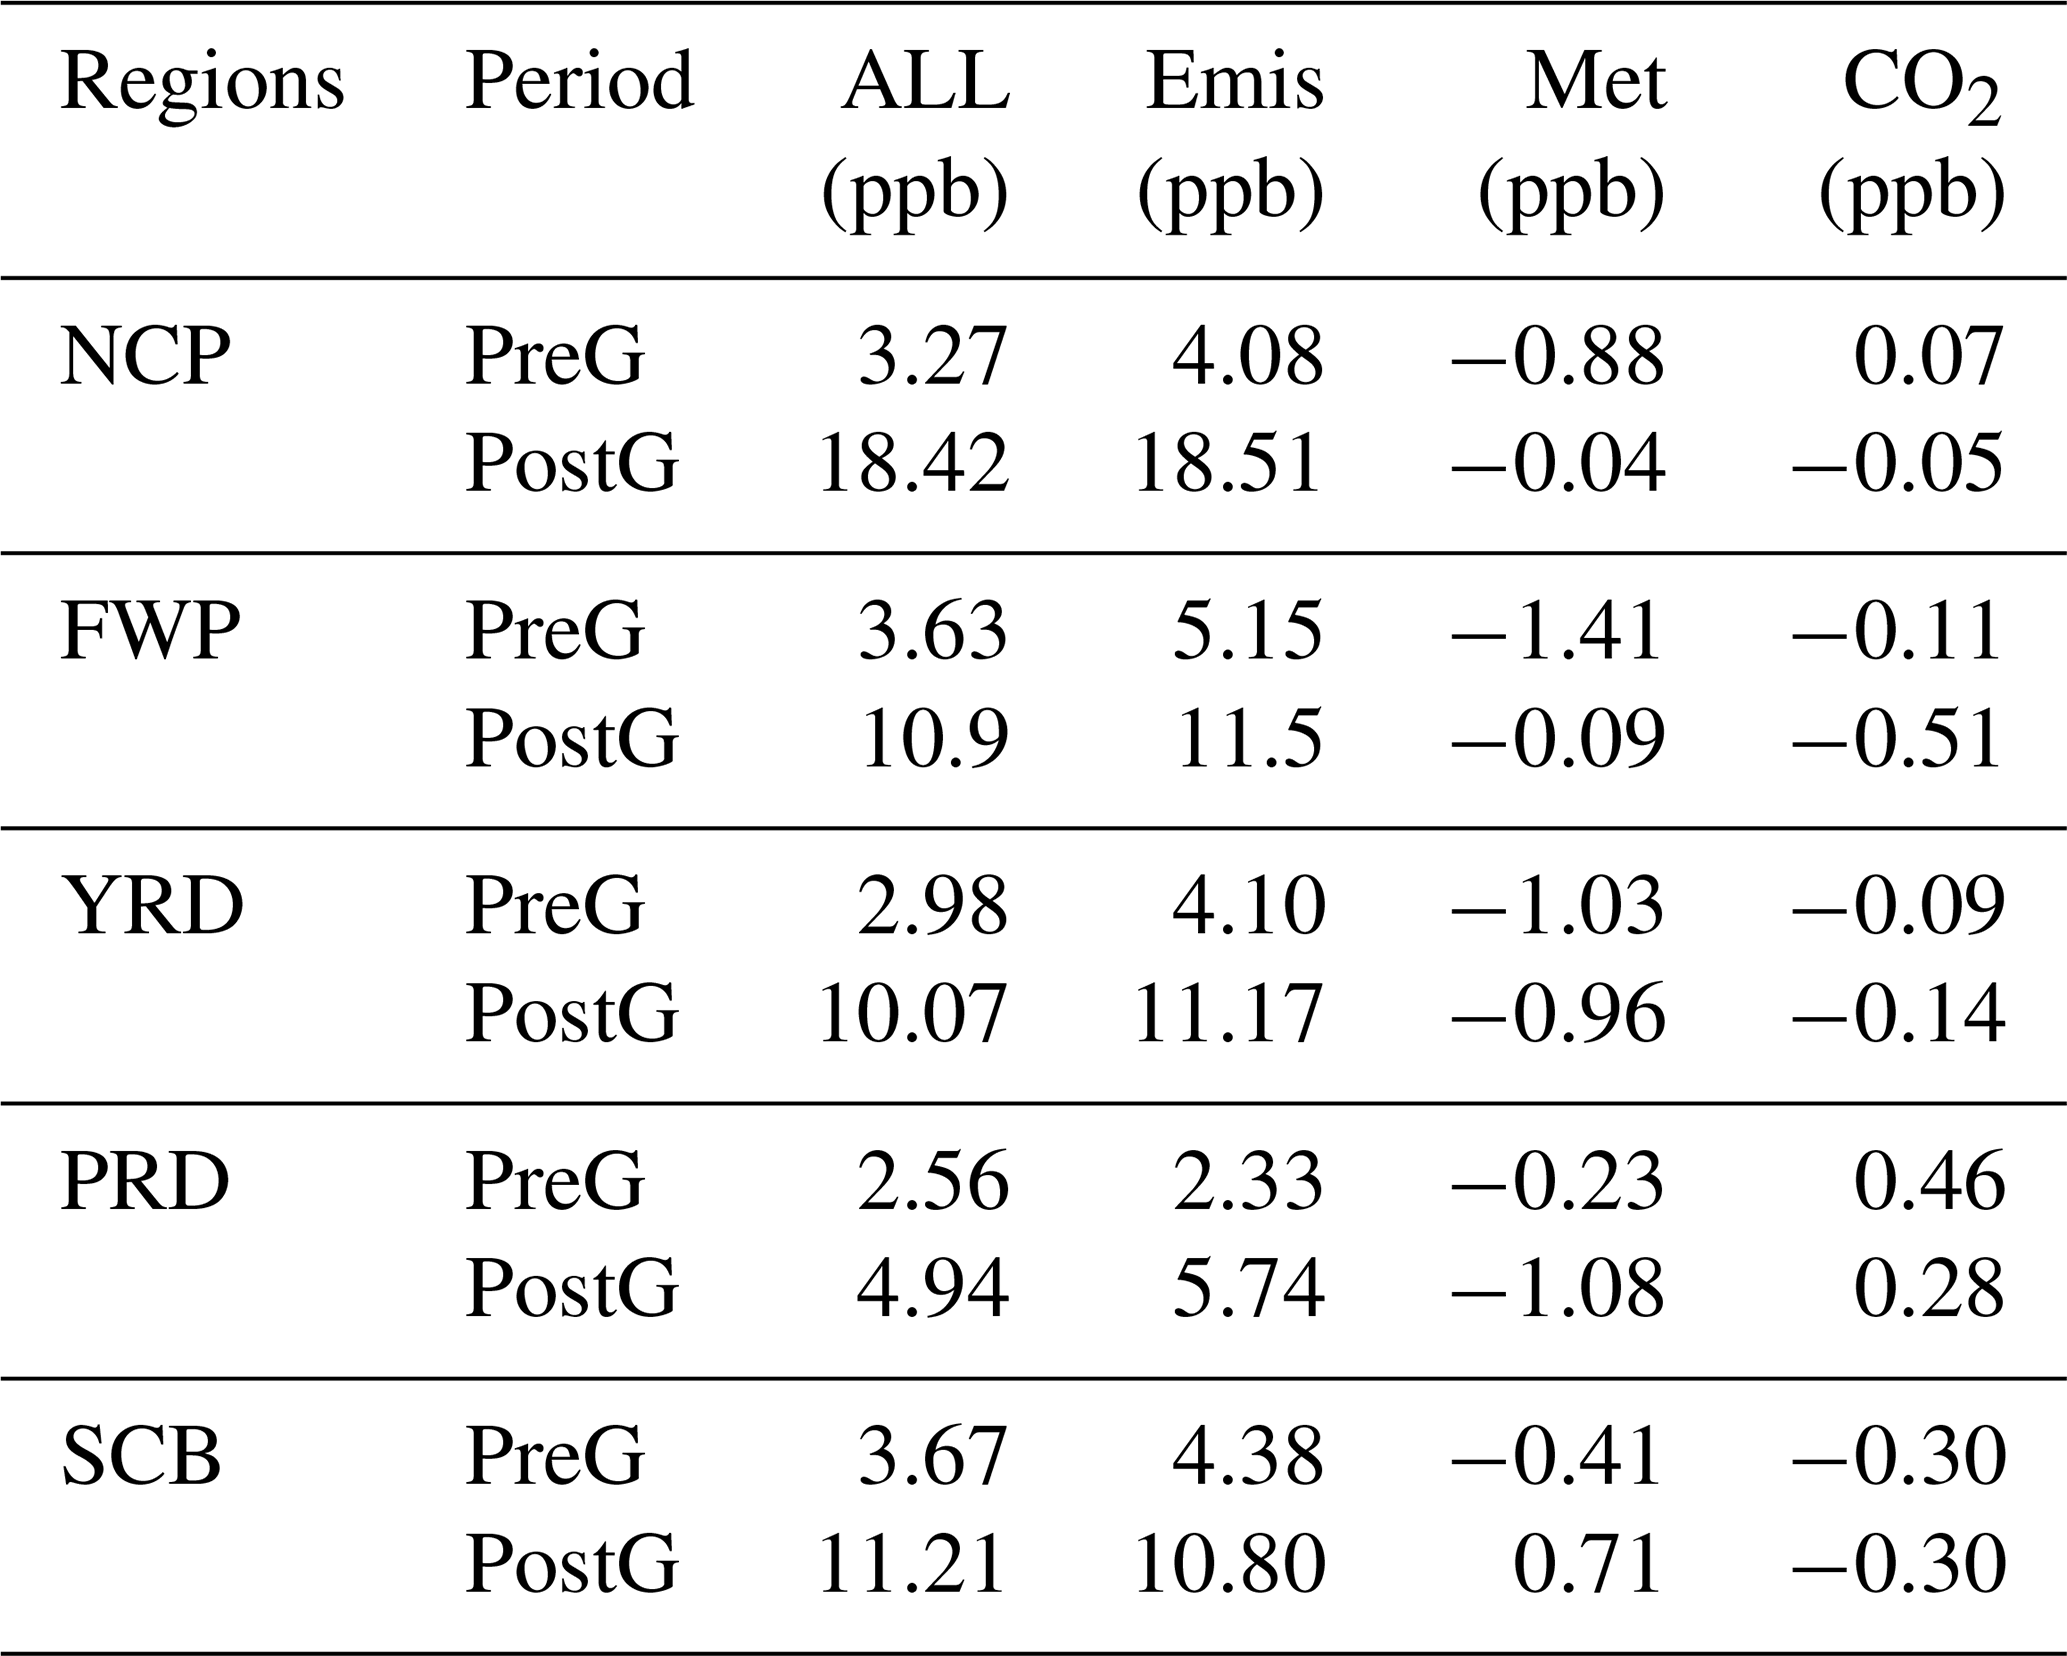
Table 3The changes of MDA8 O3 over the North China Plain, Fenwei Plain, Yangtze River Delta, Pearl River Delta, and Sichuan Basin during the summer monsoon period from 2009 to 2018 relative to 2008.
3.2 Ozone variation from 2008 to 2018
Figure S7 illustrates the mean seasonal MDA8 O3 concentrations in East Asia during the summer monsoon period from 2008 to 2018. High O3 concentrations appeared in eastern China, which can be attributed to increased emissions, high temperatures, high humidities, and intense radiation in the region (Gao et al., 2020; Mousavinezhad et al., 2021; Wei et al., 2022). Surface O3 increased annually in most of China between 2008 and 2018, with megacity clusters experiencing a more significant increase.
We conducted a regional analysis of surface O3 increases in five target regions: the NCP, the YRD, the PRD, the SCB, and the FWP. In 2018, the surface MDA8 O3 concentrations averaged 74 ppb in the NCP region, while the other areas had lower concentrations (ranging from 42 to 67 ppb in the FWP, YRD, PRD, and SCB). The lower surface O3 levels in the SCB and FWP regions were attributed to lower anthropogenic emissions. The YRD and PRD regions were more affected by meteorological factors, with the East Asian summer monsoon bringing in cleaner air and precipitation from the sea, leading to lower air pollution concentrations (He et al., 2012). The spatial distribution and increasing trend of surface MDA8 O3 concentrations in China were consistent with previous studies (Li et al., 2020; Shen et al., 2022).
Figure 2 and Table 3 illustrate the changes in surface MDA8 O3 concentrations from 2009 to 2018 relative to 2008. The surface MDA8 O3 concentrations in China increased drastically over the past decade, particularly in 2017 and 2018 (6.79–32.03 ppb). We divided the period from 2009 to 2018 into two phases based on the Clean Air Action Plan implemented in 2013: the pre-governance period (PreG, 2009–2013) and the post-governance period (PostG, 2014–2018). The surface MDA8 O3 concentration increased significantly in NCP (18.42 ppb), followed by SCB (11.21 ppb), FWP (10.9 ppb), and the YRD (10.07 ppb), while it increased slightly in PRD (4.94 ppb) in PostG relative to 2008. Our results were consistent with previous studies by Lu et al. (2020), Ma et al. (2016), and Mousavinezhad et al. (2021).
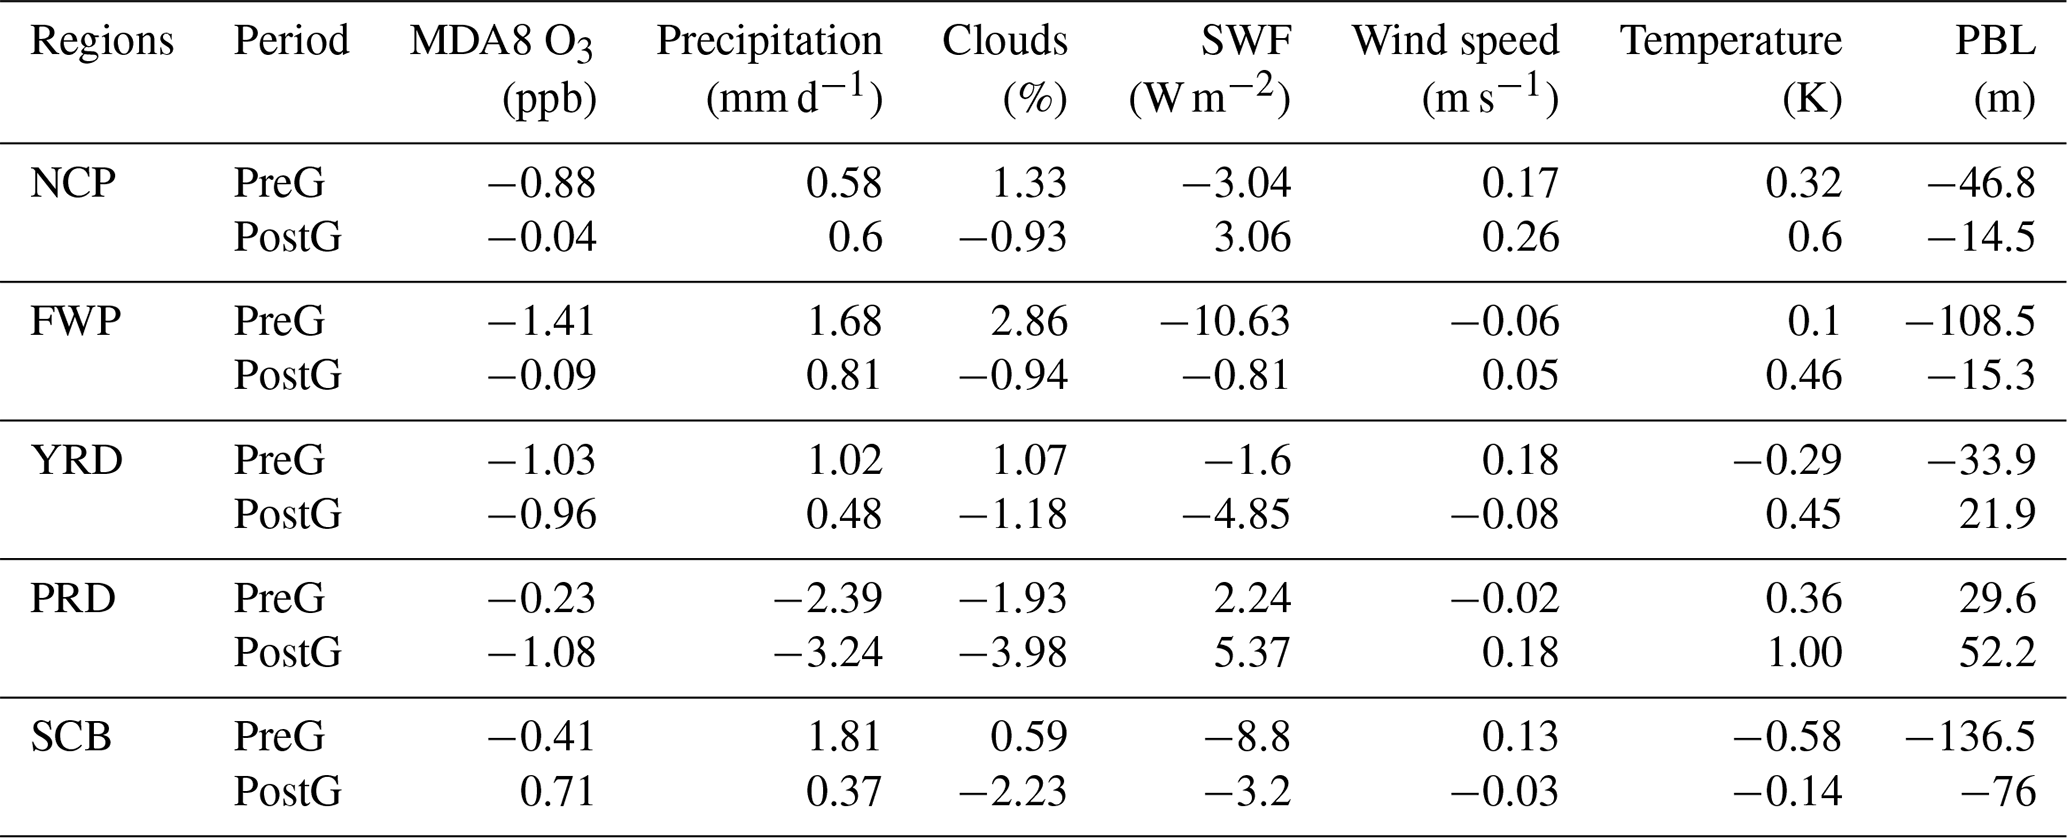
Table 4Response of the MDA8 O3 mixing ratios (units: ppb), precipitation (units: mm d−1), cloud fraction (units: %), shortwave flux (units: W m−2), wind speed (units: m s−1), temperature (units: K), and planetary boundary layer height (units: m) to the changes in meteorological conditions over the North China Plain, Fenwei Plain, Yangtze River Delta, Pearl River Delta, and Sichuan Basin during the summer monsoon period in PreG (2009–2013) and PostG (2014–2018) relative to 2008.
3.3 The effect of meteorology in the 2008–2018 ozone increase
Overall, the meteorological variations from 2008 to 2018 were unfavorable for the O3 increase during the EASM (East Asia summer monsoon) period, as illustrated in Fig. 3.
Based on Fig. 3 and Table 4, it is evident that meteorological conditions had a significant impact on surface MDA8 O3 in the NCP and FWP regions during the PostG period (−0.09 to −0.04 ppb) compared to the PreG period (−1.41 to −0.88 ppb). In the SCB region, the impact of meteorological fields was relatively weak (−0.41–0.71 ppb), attributed to the basin topography and stable atmospheric conditions. However, in the eastern and southeastern coastal areas of China, due to the significant influence of the EASM, the impact of meteorological conditions may be more critical than that of anthropogenic emissions. For instance, in the YRD and PRD regions, meteorological conditions significantly changed O3 levels (−1.29–1.3 ppb) compared to anthropogenic emissions (0.81–0.87 ppb) in 2013, indicating the significant influence of meteorological conditions on surface O3.
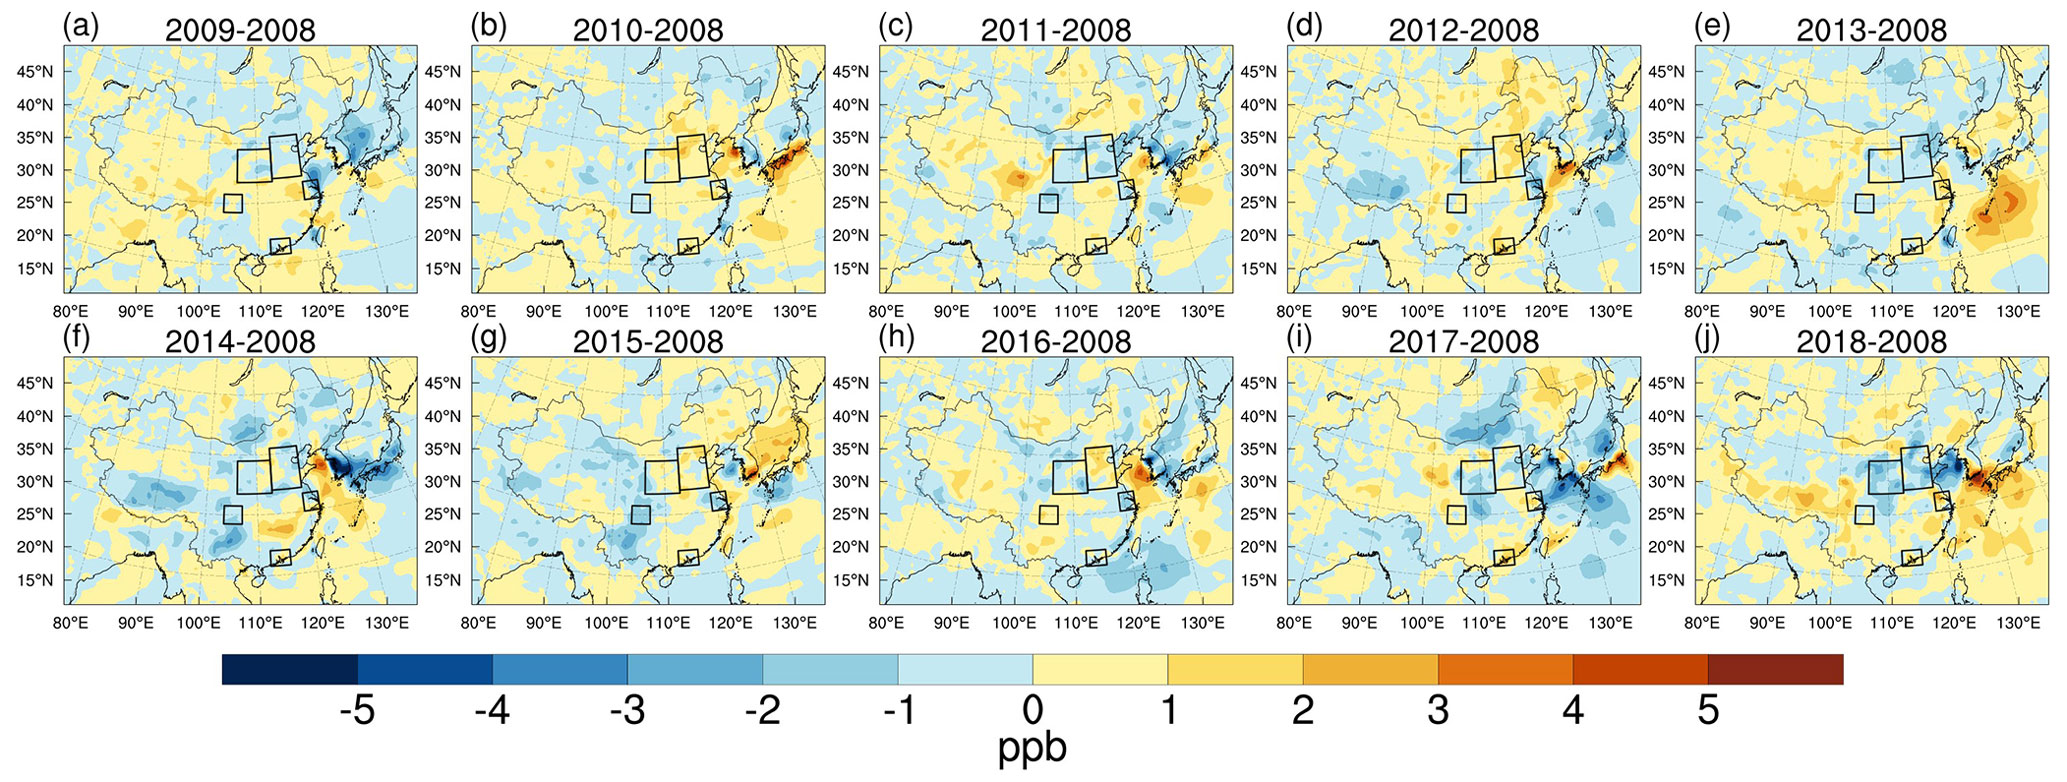
Figure 5Simulated responses of surface MDA8 O3 mixing ratios (units: ppb) to the variations in CO2 emissions during the summer monsoon period in 2009 (a), 2010 (b), 2011 (c), 2012 (d), 2013 (e), 2014 (f), 2015 (g), 2016 (h), 2017 (i), and 2018 (j) relative to 2008.
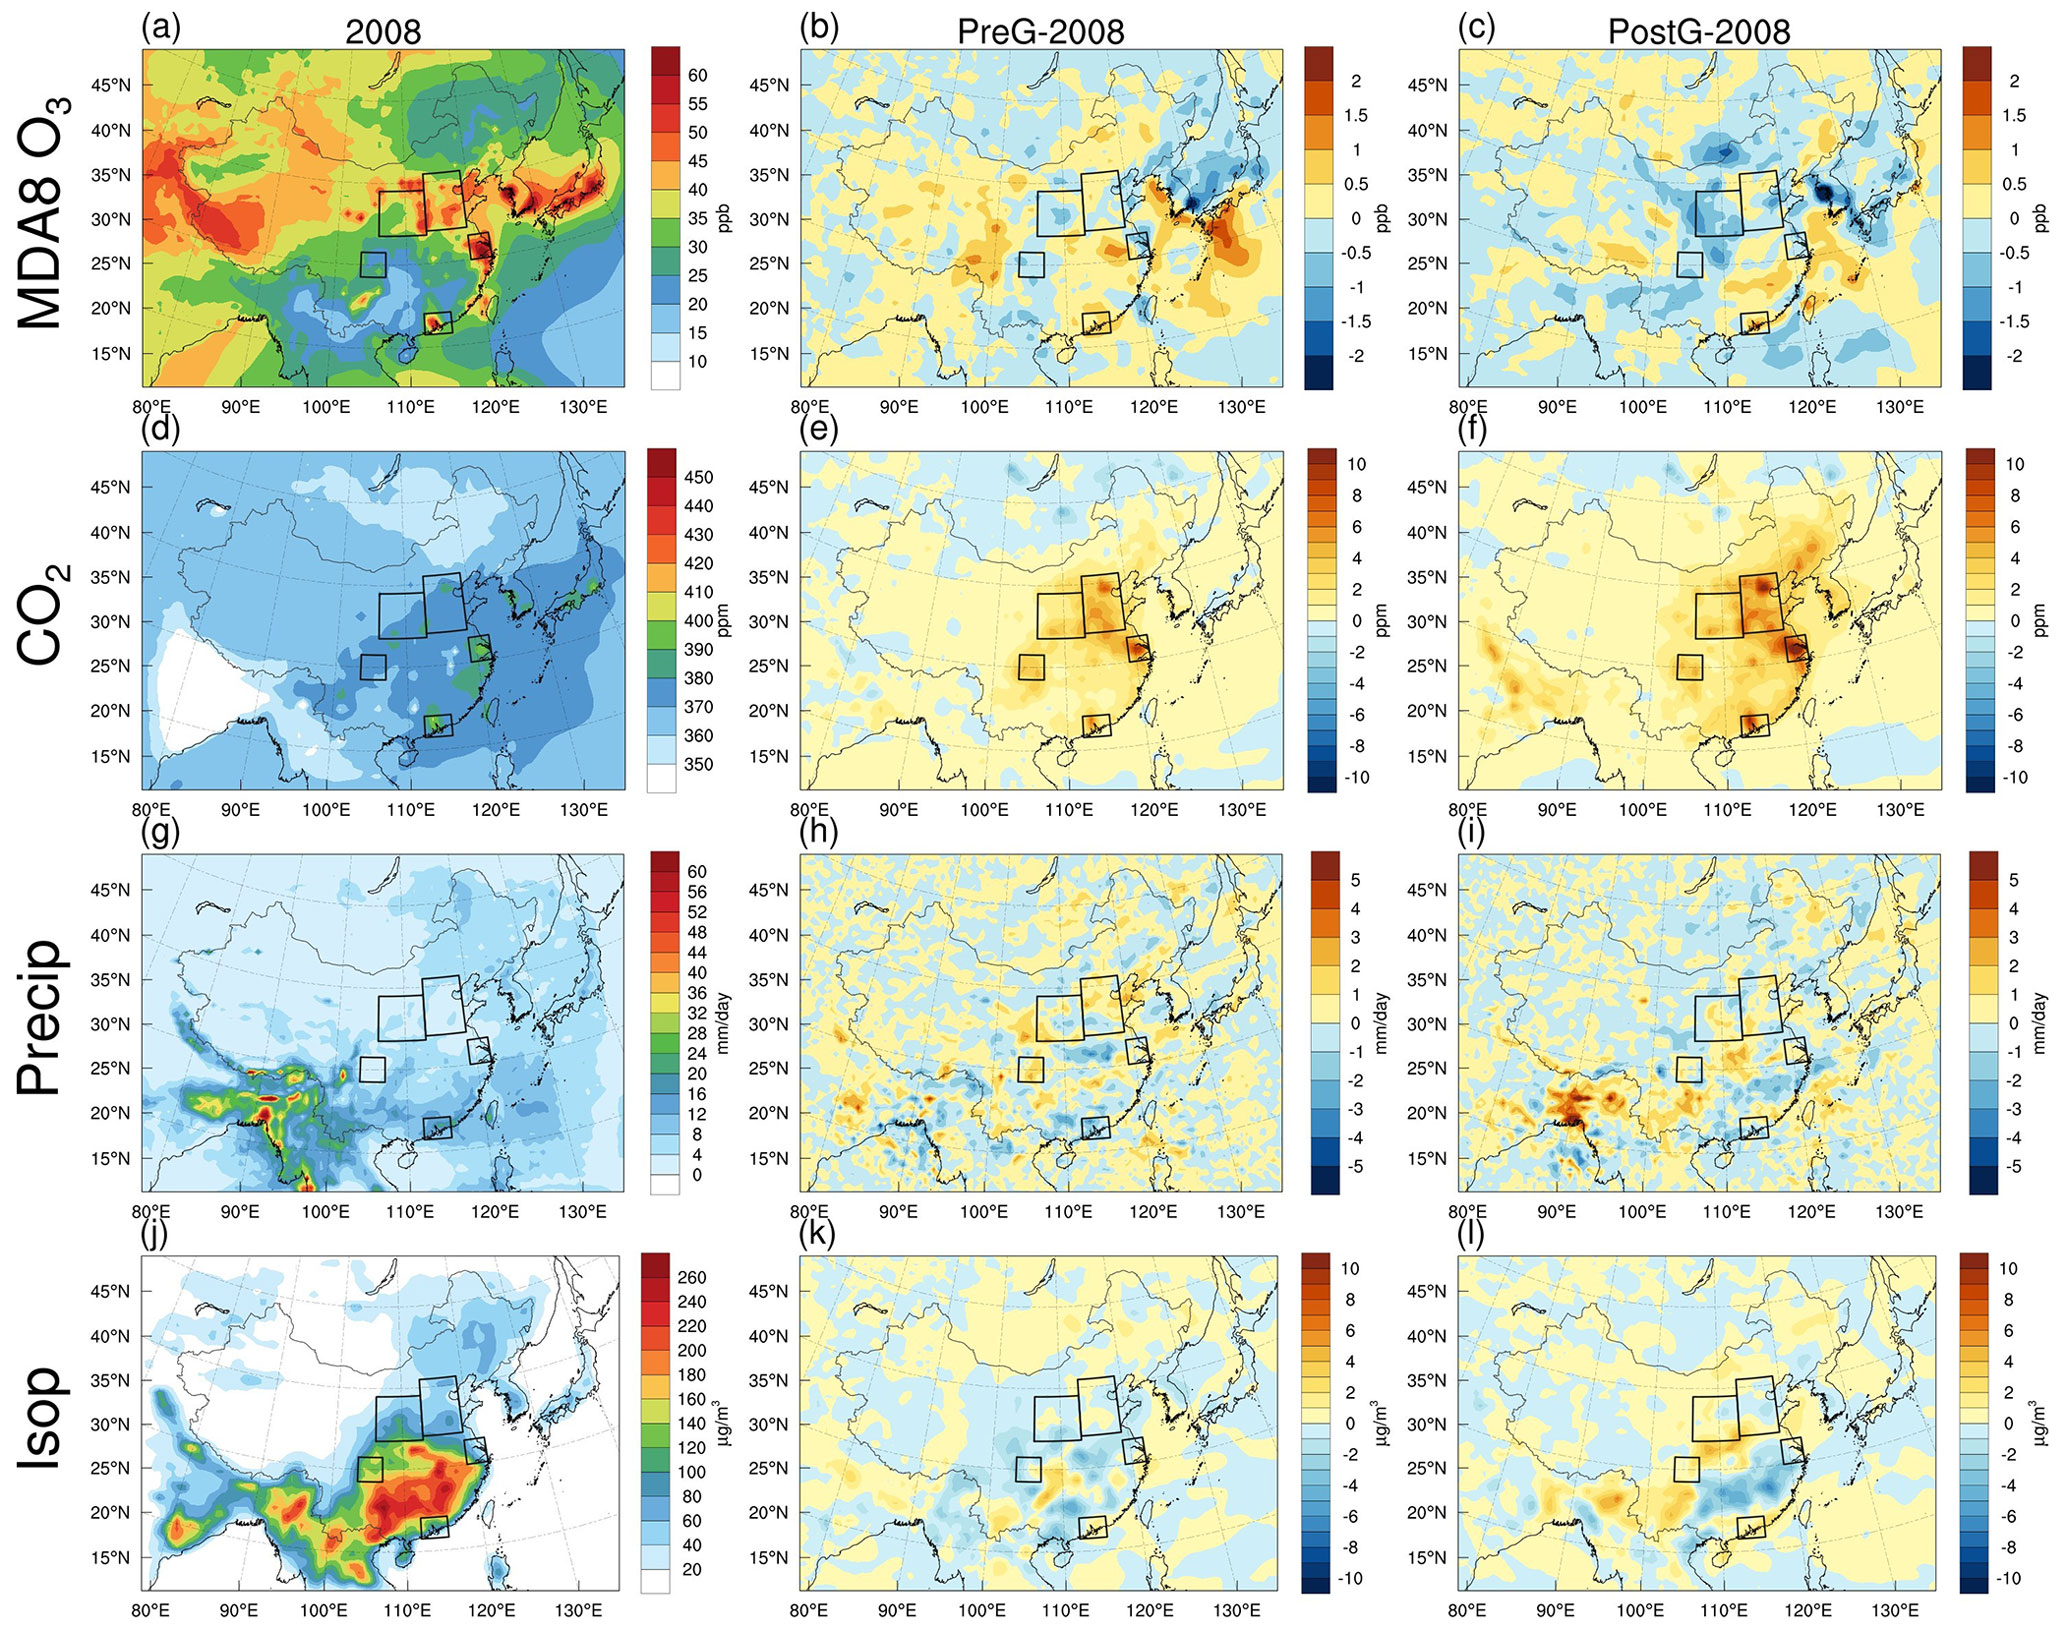
Figure 6The simulated averaged MDA8 O3 (a–c, units: ppb), CO2 (d–f, units: ppm), precipitation (g–i, units: mm d−1), and isoprene mixing ratios (j–l, units: µg m−3) in 2008 from the base simulations (the left column) and their changes due to variations in CO2 emissions in PreG (2009–2013, the central column) and PostG (2014–2018, the right column) relative to 2008.
Our findings are consistent with previous studies. Liu and Wang (2020a) reported a decrease in O3 in Shanghai from 2013 to 2017 due to changes in meteorological conditions. Chen et al. (2019) and Liu and Wang (2020a) also suggested that changed meteorological conditions had a negative impact on O3 formation in the NCP and FWP regions and that the influence of meteorology on surface-level O3 decreased in PostG. In addition, Cheng et al. (2019) found that the effects of meteorological conditions on long-term O3 variations were less than 3 %, which is similar to our study.
As we know, the formation of surface O3 is promoted by rising temperatures (Steiner et al., 2010). However, increased surface temperatures can also intensify turbulence within the planetary boundary layer (PBL), increasing PBL height (Guo et al., 2016). This increase in PBL height, coupled with the enhanced upward motion, can transport near-surface pollutants to the upper atmosphere, reducing their concentration in the lower atmosphere (Gao et al., 2016). Additionally, the upward motion can also facilitate cloud formation and precipitation, resulting in a reduction of near-surface atmospheric pollutants via precipitation washout (Yoo et al., 2014).
We have improved the accuracy of O3 photodissociation rate calculations by including varying AOD and SSA in the TUV module, as described in Sect. 2.3.2. As a result, the increase in cloud cover reduced the shortwave radiation flux and photochemical formation rates of near-surface O3, leading to decreased formation. Thus, the increase in near-surface temperature is often accompanied by an elevation in PBL height, enhanced cloud cover, precipitation, and reduced shortwave radiation. Moreover, higher wind speeds can enhance the dispersion of O3 (Gorai et al., 2015).
The variations of MDA8 O3, precipitation, clouds, shortwave flux (SWF), wind speed, temperature, and PBL height are presented individually in Fig. 4. The increase in SWF can accelerate O3 formation through photochemistry (Jiang et al., 2012; Lelieveld and Crutzen, 1990). Therefore, the increased cloud fraction reduced surface O3 by decreasing shortwave radiation, especially in NCP, FWP, YRD, and SCB in the PreG period (−10.63 to −1.6 W m−2). Furthermore, the enhanced precipitation in these regions (0.37–1.81 mm d−1) reduced surface O3 levels significantly. The significant increase in wind speed (0.17–0.26 m s−1) also contributed to the reduction of surface O3 in the NCP region (Table 4).
Another crucial factor is the elevated surface temperature (0–5 K), which intensified upward motion and raised the planetary boundary layer (PBL) height (0–500 m) across much of East Asia. Consequently, the increased temperature and PBL height could disperse surface-level O3, thereby reducing its concentration.
3.4 The effect of CO2 in the 2008–2018 ozone increase
The surface O3 in southern China, which includes the YRD, PRD, and SCB regions, was characterized by high precipitation, temperatures, and vegetation cover and was significantly impacted by CO2 (Fig. 5). Figure 6e and f demonstrate a marked rise in CO2 levels across East Asia, particularly in eastern China, which was attributable to extensive human activity.
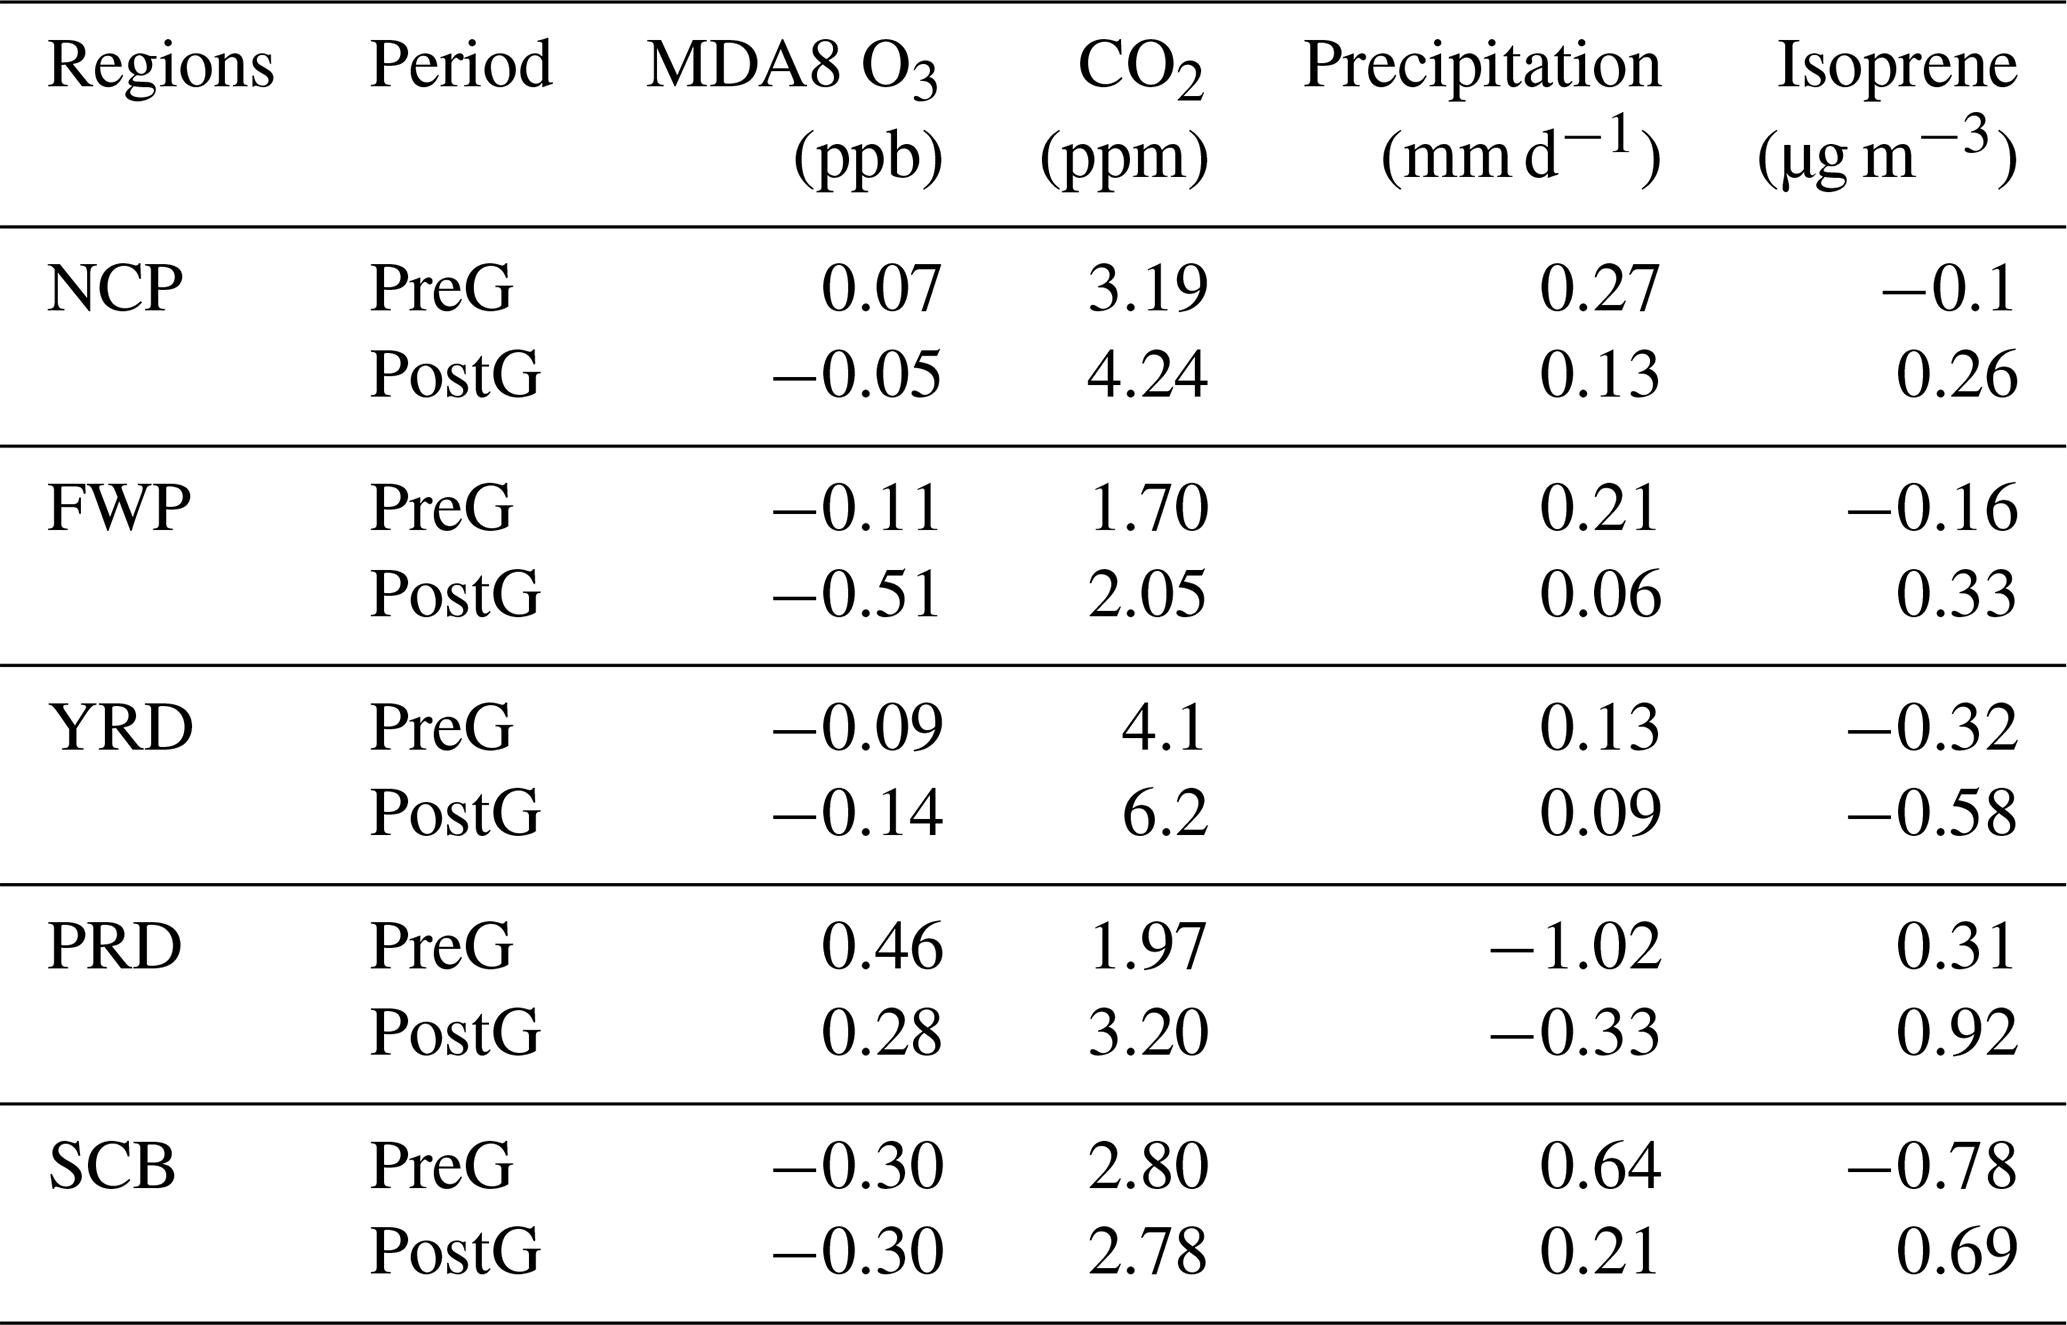
CO2 is a significant driver of climate change and alterations in biogenic emissions. As shown in Fig. 6b and c, the impact of CO2 on O3 levels varies across locations, with a positive effect of 0.28–0.46 ppb along the southeastern coast of China but a negative influence of −0.51 to −0.11 ppb in southwest and central China. CO2 affects O3 concentration by influencing both precipitation and isoprene emissions. In western and central China, CO2 primarily affects O3 concentration through its impact on precipitation (Table 5). Elevated CO2 concentrations lead to increased precipitation (0.06–0.64 mm d−1) in the FWP and SCB regions, resulting in a decrease in surface O3 (up to −0.51 ppb). In eastern and southern coastal China, where vegetation is abundant, CO2 has a greater impact on isoprene emissions. In the YRD region, decreased isoprene (−0.58 to −0.32 µg m−3) and increased precipitation (0.09–0.13 mm d−1) reduced MDA8 O3 levels (0.09–0.14 ppb). In PRD, increased isoprene levels (0.31–0.92 µg m−3) and decreased precipitation (−1.02 to −0.33 mm d−1) led to the enhancement of MDA8 O3 (0.28–0.46 ppb).
In some years, the impact of changed CO2 can be as significant as or even surpass that of anthropogenic emissions and meteorology (Fig. 10). For example, in 2013, CO2 caused an increase of 0.95 ppb in MDA8 O3 in the YRD region, which exceeded that of anthropogenic emissions (0.87 ppb). Similarly, in the PRD region in 2012, the effect of CO2, anthropogenic emissions, and meteorology was 1.41, 1.77, and 1.95 ppb, respectively. Even in the NCP in 2010, the impact of CO2 (0.75 ppb) was comparable to that of anthropogenic emissions (1.5 ppb). In summary, CO2 has a significant impact on surface O3 concentrations by influencing radiation and isoprene emissions, with more prominent effects in regions with abundant vegetation.
Table 5Simulated responses of MDA8 O3 mixing ratios (units: ppb), CO2 mixing ratios (units: ppm), precipitation (units: mm d−1), and isoprene mixing ratios to the changes in CO2 emissions over the North China Plain, Fenwei Plain, Yangtze River Delta, Pearl River Delta, and Sichuan Basin in PreG (2009–2013) and PostG (2014–2018) relative to 2008.
3.5 The effect of anthropogenic emission in the 2008–2018 ozone increase
Finally, we calculated the anthropogenic emissions' effect on the 2008–2018 O3 increase. Figure S8 and Table S1 illustrate that the levels of PM2.5, PM10, SO2, CO, and OC emissions remained consistently high during the PreG period. However, a linear decrease in emissions was observed after the implementation of the Clean Air Action Plan in 2013. Prior to 2013, the emission of VOCs increased steadily but subsequently stabilized. Similarly, the emission of nitrogen oxides (NOx) exhibited an upward trend before 2013, but since then, the emissions have shown a linear decrease, with each subsequent year exhibiting lower levels of NOx emissions. In comparison to other species, the emissions of ammonia (NH3) remained relatively stable from 2008 to 2018. Our analysis results of the emissions of different species align with those of Zheng et al. (2018), who computed the changes of each species in the MEIC inventory from 2010 to 2017.
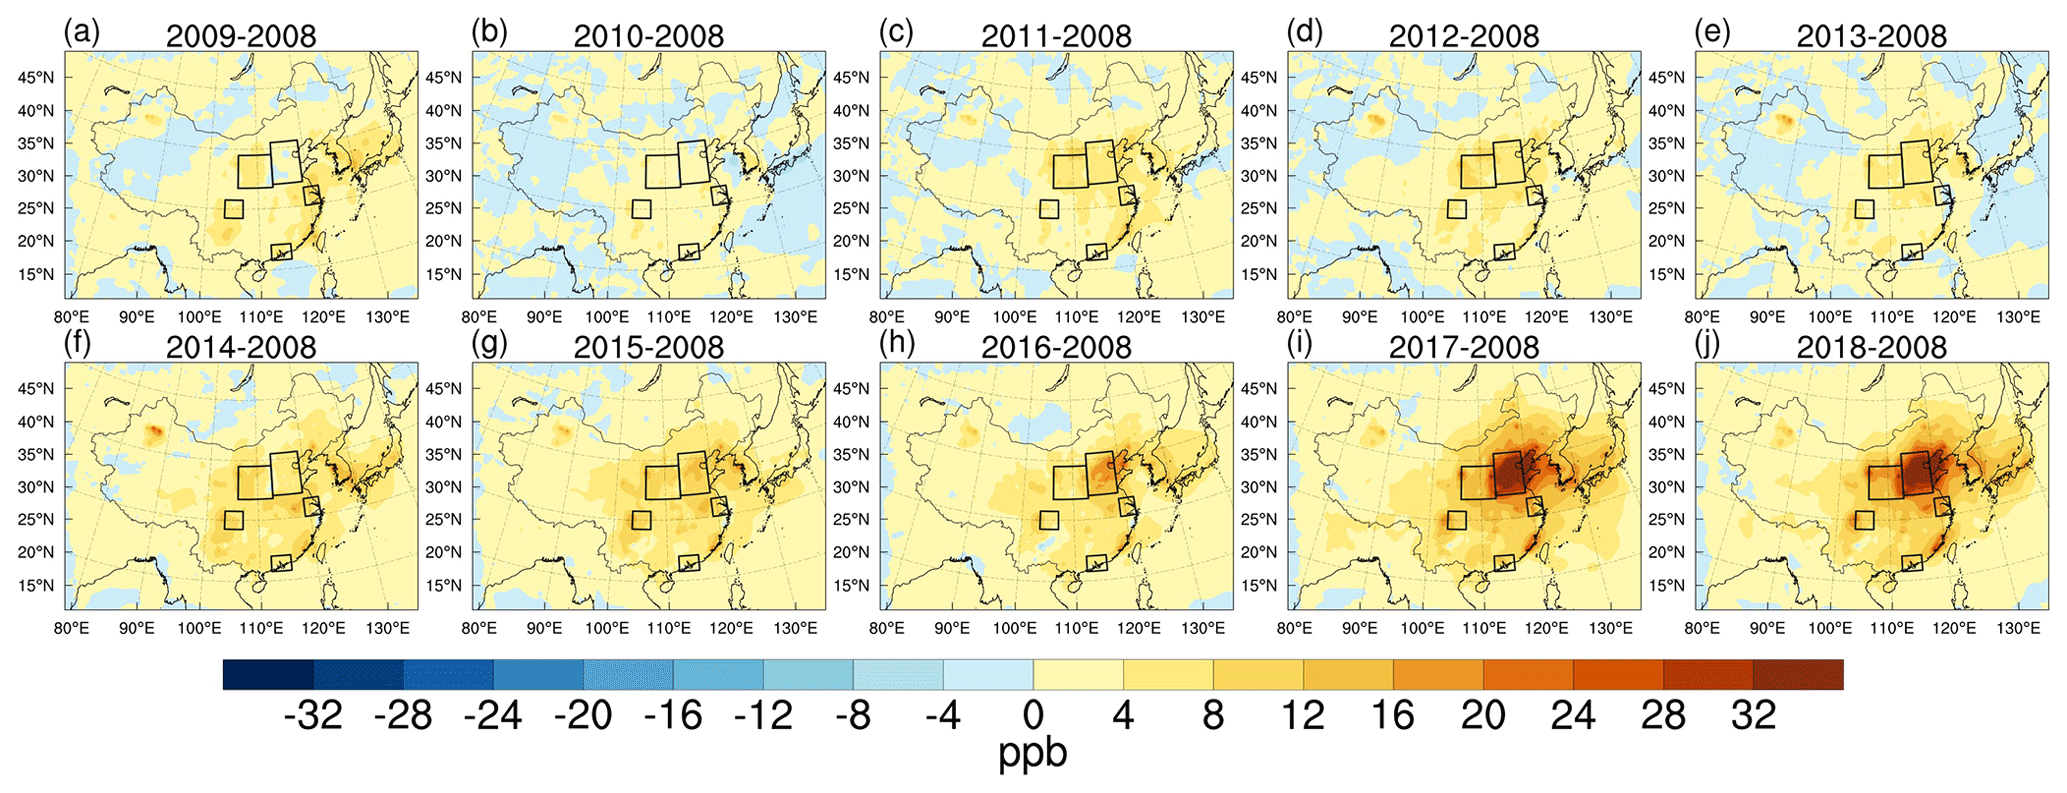
Figure 7Simulated responses of the surface MDA8 O3 mixing ratios (units: ppb) to variations in anthropogenic emissions in 2009 (a), 2010 (b), 2011 (c), 2012 (d), 2013 (e), 2014 (f), 2015 (g), 2016 (h), 2017 (i), and 2018 (j) relative to 2008.
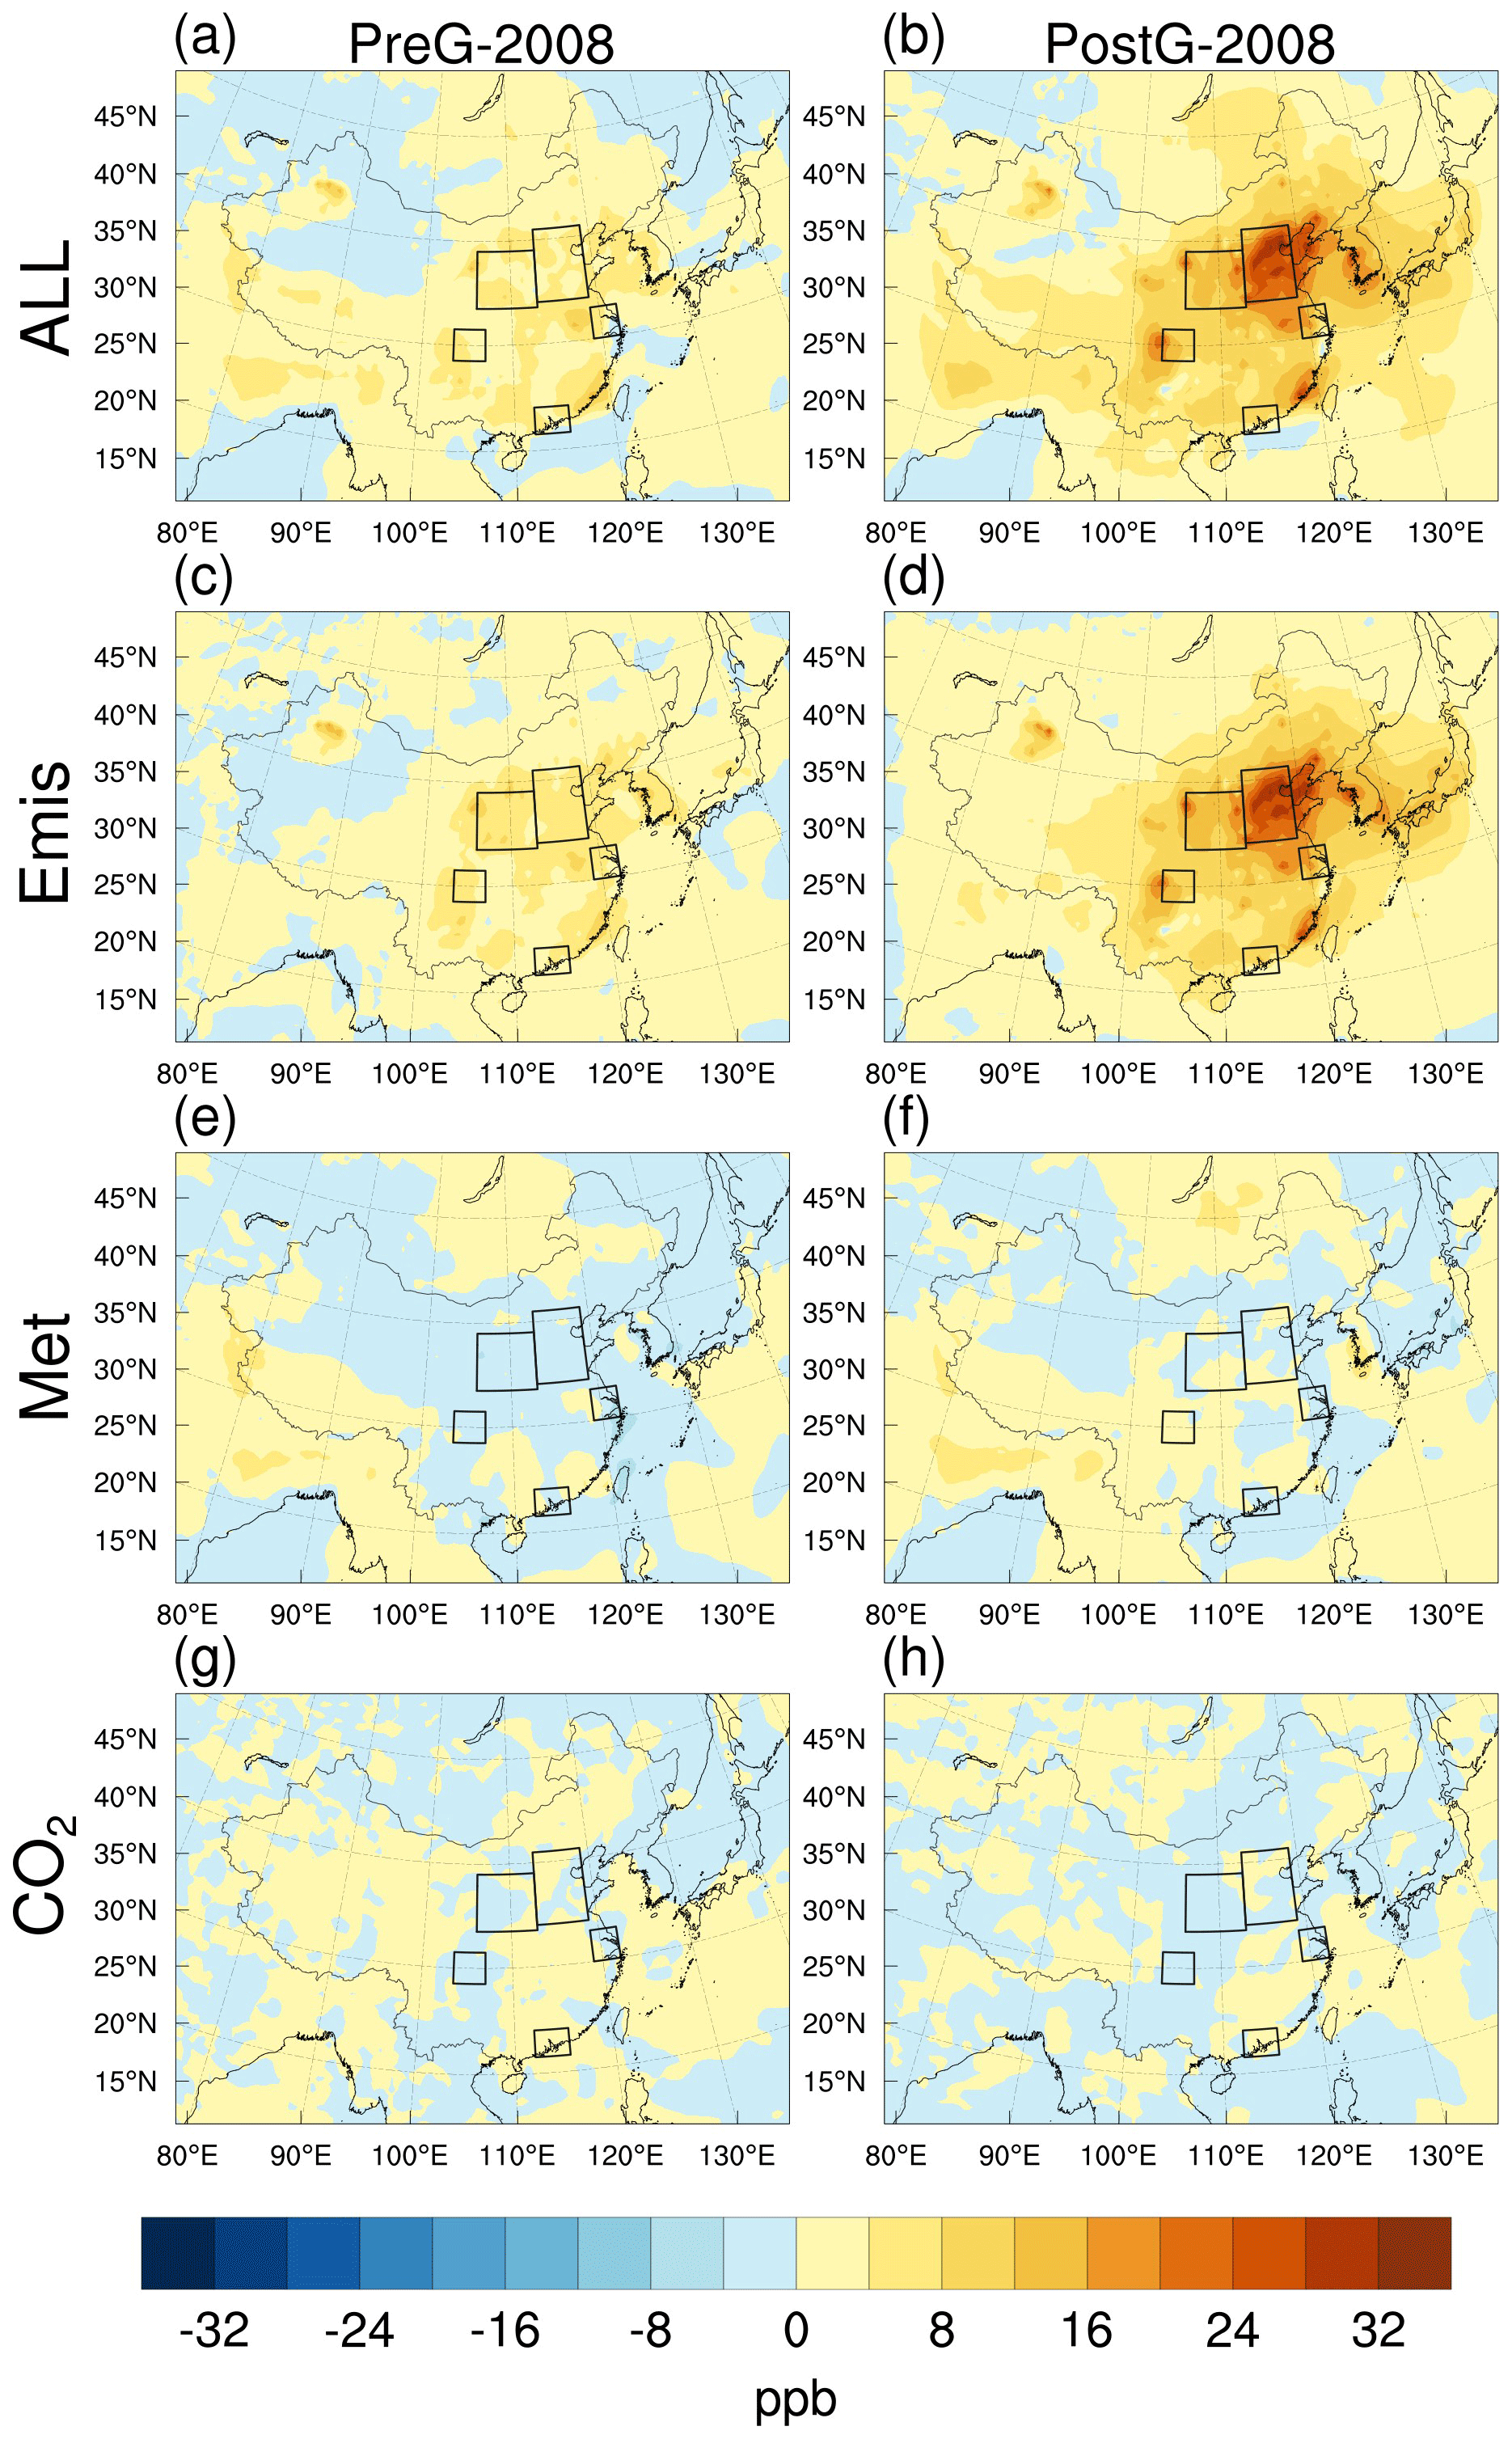
Figure 8Changes in the simulated surface MDA8 O3 mixing ratios (units: ppb) from the base simulation (All, a, b); those due to variations in anthropogenic emissions (Emis, c, d), meteorological conditions (Met, e, f), and CO2 emissions (CO2, g, h) in PreG (2009–2013, the left column) and PostG (2014–2018, the right column) relative to 2008.
Figure 7 illustrates that anthropogenic emissions have caused a notable increase in surface O3 levels across most of China, particularly in megacity clusters. The impact of anthropogenic emissions on O3 concentration ranged from 2.33 to 18.51 ppb in the five target regions.
Figure 8 and Table 6 illustrate that the changes in surface O3 caused by anthropogenic emissions are similar in magnitude and spatial distribution to the changes in the Base experiment. This suggests that anthropogenic emissions were the dominant factor driving the increase in surface O3 in China from 2008 to 2018. Notably, a high-impact center of anthropogenic emissions was simulated in northern China, with the NCP region experiencing the most significant increase in surface O3 (4.08–18.51 ppb), followed by the FWP, YRD, and SCB regions (4.10–11.5 ppb). In the PRD region, anthropogenic emissions led to a slight enhancement of O3 by 2.33–5.74 ppb.
The role of anthropogenic emissions increased linearly from 2008 to 2018, despite the implementation of the Clean Air Action Plan in 2013 (Table 6). For example, anthropogenic emissions significantly increased surface MDA8 O3 in the NCP region (4.08 ppb in PreG and 18.51 ppb in PostG). Similarly, FWP experienced increases of 5.15 and 11.5 ppb in the PreG and PostG periods, respectively. In the SCB region, the surface MDA8 O3 was mainly affected by variations in anthropogenic emissions due to the high levels of anthropogenic emissions in the complex basin topography. In the YRD and PRD regions, anthropogenic emissions resulted in changes to O3 of 2.33–11.17 ppb.
The reasons for this characteristic are multiple. Before 2013, the continuous increase in VOCs and NOx emissions (Fig. S8b, c) facilitated the rise of O3 levels. Following the implementation of the Clean Air Action Plan in 2013, the emissions of VOCs and NOx were regulated. However, with the decrease in PM2.5 levels, direct radiation increased, and scattered radiation decreased (Fig. 9), thereby promoting the photochemical formation of O3 (Bian et al., 2007). In addition, the reduced NO emission weakened the titration effect (Fig. S8b), thus increasing surface O3 (Li et al., 2022).
Our results are consistent with previous studies by Wang et al. (2019b) and Liu and Wang (2020b), which also showed the dominant and almost linear role of anthropogenic emissions in the increase in O3 from 2013 to 2015 in four major Chinese cities (Beijing, Shanghai, Guangzhou, and Chengdu).
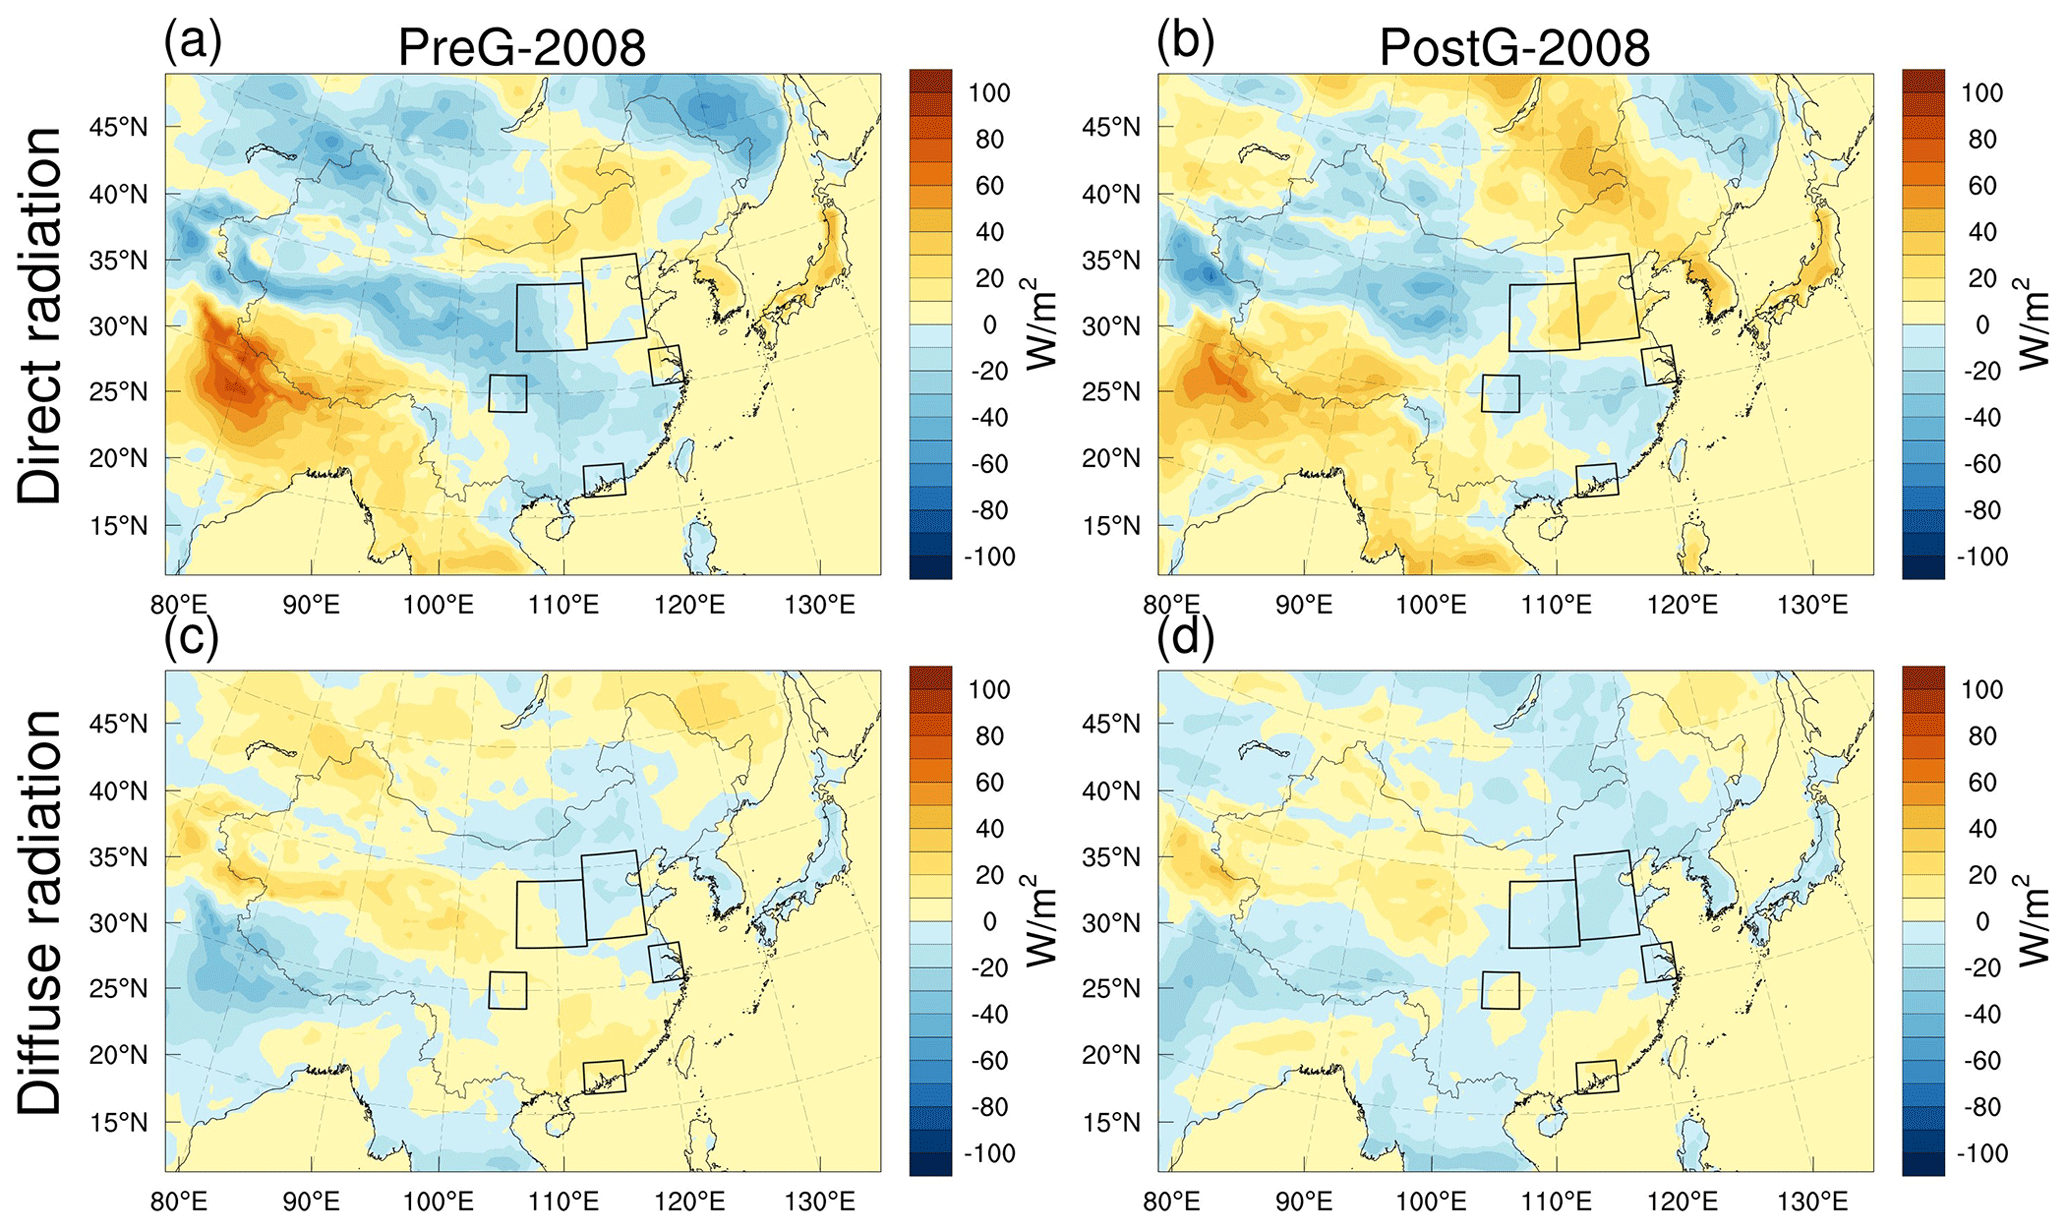
Figure 9The variations of the surface direct radiation (a, b, units: W m−2) and diffuse radiation (c, d, units: W m−2) in the PreG (2009–2013, a, c) and PostG (2014–2018, b, d) period relative to 2008.
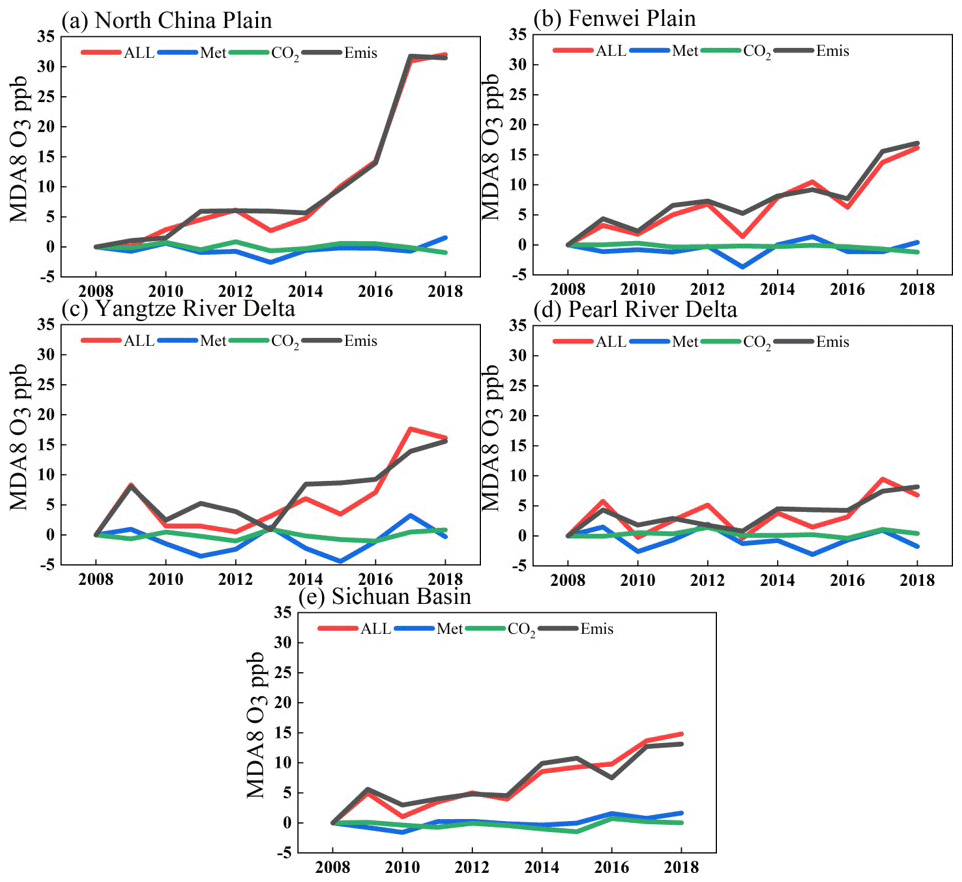
Figure 10Interannual variations of the surface MDA8 O3 mixing ratios (units: ppb) in the summer monsoon period (ALL) and the responses of variations in anthropogenic emissions (Emis), meteorological conditions (Met), and CO2 emissions (CO2) in the (a) North China Plain, (b) Fenwei Plain, (c) Yangtze River Delta, (d) Pearl River Delta, and (e) Sichuan Basin in 2008–2018 relative to 2008.
Table 6Simulated response of the MDA8 O3 mixing ratios (units: ppb) to the changes in anthropogenic emissions (Emis), meteorological conditions (Met), and CO2 emissions (CO2) over the North China Plain, Fenwei Plain, Yangtze River Delta, Pearl River Delta, and Sichuan Basin in PreG (2009–2013) and PostG (2014–2018) relative to 2008.
3.6 Attribution analysis of ozone changes in 2008–2018
Finally, we presented an attribution diagram depicting the changes in O3 concentration from 2008 to 2018. The total variation in O3 concentration can be attributed to the combined effects of meteorological changes, changes in CO2 concentration, and anthropogenic emissions (Fig. 10).
The primary driver of the O3 concentration variation from 2008 to 2018 was the changes in anthropogenic emissions, particularly in regions with high emissions, such as the NCP and FWP. Although the Clean Air Action Plan was implemented in 2013, it did not reduce the contribution of anthropogenic emissions to the O3 increase. Even in the PostG period, with the development of urbanization and industrialization, the impact of changed anthropogenic emissions on O3 has gradually become more prominent than changed meteorology and CO2. The contribution of changed meteorology to O3 was generally negative in the five regions, with a more significant impact in the YRD and PRD regions. This may be attributed to their proximity to the ocean and susceptibility to the summer monsoon influence. Changes in CO2 concentration affected O3 concentration by altering radiation and isoprene emissions, with a more significant impact in the YRD and PRD regions where vegetation was abundant. In some years, it even surpassed the effects of anthropogenic emissions. Therefore, we suggest that the influence of CO2 concentration changes on O3 concentration should be considered in regions with high vegetation coverage.
In this study. First, we improved the RegCM-Chem-YIBs model regarding the photolysis of O3 and the radiation effect of CO2 and O3. Second, we assessed the impacts of anthropogenic emissions, meteorological factors, and CO2 on the surface O3 increase in China during the EASM season from 2008 to 2018.
In the NCP and FWP regions. The increased surface O3 was primarily attributed to the changes in anthropogenic emissions (4.08–5.15 ppb in PreG and 11.5–18.51 ppb in PostG). Furthermore, the impact of anthropogenic emissions has increased linearly, despite the Clean Air Action Plan being implemented in 2013. In contrast, the effects of meteorological factors and CO2 on O3 were weak during the study period.
In the YRD and PRD regions. Ignoring the principal contributions of anthropogenic emissions, CO2 significantly impacted the O3 variations (−0.14–0.46 ppb). The varied CO2 led to surface MDA8 O3 changes of −0.09 to −0.14 ppb in the YRD and 0.28–0.46 ppb in the PRD by modulating the isoprene emissions and precipitation. On the other hand, the meteorological conditions played a more significant role in surface O3 than in the NCP, FWP, and SCB regions, resulting in a decrease in MDA8 O3 from 2008 to 2018 (−4.42–3.25 ppb).
In the SCB region. The increase in surface O3 from 2008 to 2018 was primarily driven by variations in anthropogenic emissions. The effect of meteorological conditions was weak due to the high level of emissions and basin topography. However, the changes in CO2 significantly impacted surface O3 levels and were unfavorable to O3 formation during the study period (−3.0 ppb in PreG and PostG).
In conclusion, anthropogenic emissions dominated the O3 increase in China from 2008 to 2018, and the effects of meteorological conditions on surface O3 could be more significant in some regions. Furthermore, we emphasize the significance of CO2 emissions, particularly in southern China, as a critical contributor to O3 variations. Therefore, it is vital to consider CO2 variability in future predictions of O3 concentrations. Such consideration would be helpful for designing long-term O3 control policies.
ERA-Interim data are available at https://apps.ecmwf.int/datasets/data/interim-full-daily/ (Dee et al., 2011). MEICv1.3 data are available at http://meicmodel.org/?page_id=560 (MEIC Team, 2012). CarbonTracker data are available at https://gml.noaa.gov/aftp/products/carbontracker/co2/CT2019/ (Peters et al., 2007). OISST data are available at https://downloads.psl.noaa.gov/Datasets/noaa.oisst.v2/ (Marullo et al., 2007). WDCGG CO2 data are available at https://gaw.kishou.go.jp/search/gas_species/co2/latest/ (Diao et al., 2017). CNEMC data are available at http://www.cnemc.cn/ (Zhai et al., 2019) but only in Chinese.
The supplement related to this article is available online at: https://doi.org/10.5194/acp-23-6525-2023-supplement.
DM: performed experiments; TW: designed the overall research; HW, YQ, JiL, JaL, and SL: reviewed and edited the manuscript; BZ, ML, and MX: contributed to the development of the RegCM-Chem-YIBs model.
The contact author has declared that none of the authors has any competing interests.
Publisher's note: Copernicus Publications remains neutral with regard to jurisdictional claims in published maps and institutional affiliations.
We would like to acknowledge the anthropogenic emissions inventory support from Tsinghua University and the observed data from the China National Environmental Monitoring Center. We also gratefully acknowledge a wide range of other institutional partners.
This work was supported by the National Natural Science Foundation of China (grant nos. 42077192 and 41621005), the National Key Basic Research and Development Program of China (grant nos. 2020YFA0607802 and 2019YFC0214603), the Creative talent exchange program for foreign experts in the Belt and Road countries, and the Emory University–Nanjing University Collaborative Research Grant.
This paper was edited by Frank Dentener and reviewed by two anonymous referees.
Accadia, C., Zecchetto, S., Lavagnini, A., and Speranza, A.: Comparison of 10-m wind forecasts from a regional area model and QuikSCAT Scatterometer wind observations over the Mediterranean Sea, Mon. Weather Rev., 135, 1945–1960, https://doi.org/10.1175/mwr3370.1, 2007.
Anwar, S. A., Zakey, A. S., Robaa, S. M., and Wahab, M. M. A.: The influence of two land-surface hydrology schemes on the regional climate of Africa using the RegCM4 model, Theor. Appl. Climatol., 136, 1549–1550, https://doi.org/10.1007/s00704-018-2588-0, 2019.
Ashmore, M. R. and Bell, J. N. B.: The role of ozone in global change, Ann. Bot.-London, 67, 39–48, https://doi.org/10.1093/oxfordjournals.aob.a088207, 1991.
Ballantyne, A. P., Alden, C. B., Miller, J. B., Tans, P. P., and White, J. W. C.: Increase in observed net carbon dioxide uptake by land and oceans during the past 50 years, Nature, 488, 7409, https://doi.org/10.1038/nature11299, 2012.
Balsamo, G., Albergel, C., Beljaars, A., Boussetta, S., Brun, E., Cloke, H., Dee, D., Dutra, E., Muñoz-Sabater, J., Pappenberger, F., de Rosnay, P., Stockdale, T., and Vitart, F.: ERA-Interim/Land: a global land surface reanalysis data set, Hydrol. Earth Syst. Sci., 19, 389–407, https://doi.org/10.5194/hess-19-389-2015, 2015.
Ban, N., Schmidli, J., and Schar, C.: Evaluation of the convection-resolving regional climate modeling approach in decade-long simulations, J. Geophys. Res.-Atmos., 119, 7889–7907, https://doi.org/10.1002/2014jd021478, 2014.
Bian, H., Han, S. Q., Tie, X. X., Sun, M. L., and Liu, A. X.: Evidence of impact of aerosols on surface ozone concentration in Tianjin, China, Atmos. Environ., 41, 4672–4681, https://doi.org/10.1016/j.atmosenv.2007.03.041, 2007.
Borg, I., Groenen, P. J. F., Jehn, K. A., Bilsky, W., and Schwartz, S. H.: Embedding the Organizational Culture Profile Into Schwartz's Theory of Universals in Values, J. Pers. Psychol., 10, 1–12, https://doi.org/10.1027/1866-5888/a000028, 2011.
Carvalho, D., Rocha, A., Gomez-Gesteira, M., and Santos, C.: A sensitivity study of the WRF model in wind simulation for an area of high wind energy, Environ. Model. Softw., 33, 23–34, https://doi.org/10.1016/j.envsoft.2012.01.019, 2012.
Cassola, F. and Burlando, M.: Wind speed and wind energy forecast through Kalman filtering of Numerical Weather Prediction model output, Appl. Energ., 99, 154–166 https://doi.org/10.1016/j.apenergy.2012.03.054, 2012.
Chen, Z., Zhuang, Y., Xie, X., Chen, D., Cheng, N., Yang, L., and Li, R.: Understanding long-term variations of meteorological influences on ground ozone concentrations in Beijing During 2006–2016, Environ. Pollut., 245, 29–37, https://doi.org/10.1016/j.envpol.2018.10.117, 2019.
Cheng, N., Li, R., Xu, C., Chen, Z., Chen, D., Meng, F., Cheng, B., Ma, Z., Zhuang, Y., He, B., and Gao, B.: Ground ozone variations at an urban and a rural station in Beijing from 2006 to 2017: Trend, meteorological influences and formation regimes, J. Clean. Prod., 235, 11–20, https://doi.org/10.1016/j.jclepro.2019.06.204, 2019.
Collins, W. D., Bitz, C. M., Blackmon, M. L., Bonan, G. B., Bretherton, C. S., Carton, J. A., Chang, P., Doney, S. C., Hack, J. J., Henderson, T. B., Kiehl, J. T., Large, W. G., McKenna, D. S., Santer, B. D., and Smith, R. D.: The Community Climate System Model version 3 (CCSM3), J. Clim., 19, 2122–2143, https://doi.org/10.1175/jcli3761.1, 2006.
Dang, R., Liao, H., and Fu, Y.: Quantifying the anthropogenic and meteorological influences on summertime surface ozone in China over 2012–2017, Sci. Total Environ., 754, 142394, https://doi.org/10.1016/j.scitotenv.2020.142394, 2021.
Decker, M. and Zeng, X. B.: Impact of Modified Richards Equation on Global Soil Moisture Simulation in the Community Land Model (CLM3.5), J. Adv. Model. Earth Syst., 1, https://doi.org/10.3894/james.2009.1.5, 2009.
Dee, D. P., Uppala, S. M., Simmons, A. J., Berrisford, P., Poli, P., Kobayashi, S., Andrae, U., Balmaseda, M. A., Balsamo, G., Bauer, P., Bechtold, P., Beljaars, A. C. M., van de Berg, L., Bidlot, J., Bormann, N., Delsol, C., Dragani, R., Fuentes, M., Geer, A. J., Haimberger, L., Healy, S. B., Hersbach, H., Hólm, E. V., Isaksen, L., Kãllberg, P., Köhler, M., Matricardi, M., McNally, A. P., Monge-Sanz, B. M., Morcrette, J.-J., Park, B.-K., Peubey, C., de Rosnay, P., Tavolato, C., Thépaut, J.-N., and Vitart, F.: The ERA-Interim reanalysis: configuration and performance of the data assimilation system, Q. J. Roy. Meteorol. Soc., 137, 553–597, https://doi.org/10.1002/qj.828, 2011 (data available at https://apps.ecmwf.int/datasets/data/interim-full-daily/, last access: 1 April 2022).
Diao, A. Y., Shu, J., Song, C., and Gao, W.: Global consistency check of AIRS and IASI total CO2 column concentrations using WDCGG ground-based measurements, Front. Earth Sci., 11, 1–10, https://doi.org/10.1007/s11707-016-0573-4, (data available at https://gaw.kishou.go.jp/search/gas_species/co2/latest/, last access: 15 April 2022), 2017.
Duan, X.-T., Cao, N.-W., Wang, X., Zhang, Y.-X., Liang, J.-S., Yang, S.-P., and Song, X.-Y.: Characteristics Analysis of the Surface Ozone Concentration of China in 2015, Huanjing Kexue, 38, 4976–4982, https://doi.org/10.13227/j.hjkx.201703045, 2017.
Fang, Y., Fiore, A. M., Horowitz, L. W., Gnanadesikan, A., Held, I., Chen, G., Vecchi, G., and Levy, H.: The impacts of changing transport and precipitation on pollutant distributions in a future climate, J. Geophys. Res.-Atmos., 116, D18303, https://doi.org/10.1029/2011jd015642, 2011.
Fiore, A. M., Levy II, H., and Jaffe, D. A.: North American isoprene influence on intercontinental ozone pollution, Atmos. Chem. Phys., 11, 1697–1710, https://doi.org/10.5194/acp-11-1697-2011, 2011.
Gao, M., Carmichael, G. R., Wang, Y., Saide, P. E., Yu, M., Xin, J., Liu, Z., and Wang, Z.: Modeling study of the 2010 regional haze event in the North China Plain, Atmos. Chem. Phys., 16, 1673–1691, https://doi.org/10.5194/acp-16-1673-2016, 2016.
Gao, M., Gao, J., Zhu, B., Kumar, R., Lu, X., Song, S., Zhang, Y., Jia, B., Wang, P., Beig, G., Hu, J., Ying, Q., Zhang, H., Sherman, P., and McElroy, M. B.: Ozone pollution over China and India: seasonality and sources, Atmos. Chem. Phy., 20, 4399–4414, https://doi.org/10.5194/acp-20-4399-2020, 2020.
Gauss, M., Myhre, G., Pitari, G., Prather, M. J., Isaksen, I. S. A., Berntsen, T. K., Brasseur, G. P., Dentener, F. J., Derwent, R. G., Hauglustaine, D. A., Horowitz, L. W., Jacob, D. J., Johnson, M., Law, K. S., Mickley, L. J., Muller, J. F., Plantevin, P. H., Pyle, J. A., Rogers, H. L., Stevenson, D. S., Sundet, J. K., van Weele, M., and Wild, O.: Radiative forcing in the 21st century due to ozone changes in the troposphere and the lower stratosphere, J. Geophys. Res.-Atmos., 108, 4292, https://doi.org/10.1029/2002jd002624, 2003.
Giorgi, F. and Mearns, L. O.: Introduction to special section: Regional climate modeling revisited, J. Geophys. Res.-Atmos., 104, 6335–6352, https://doi.org/10.1029/98jd02072, 1999.
Giorgi, F., Coppola, E., Solmon, F., Mariotti, L., Sylla, M. B., Bi, X., Elguindi, N., Diro, G. T., Nair, V., Giuliani, G., Turuncoglu, U. U., Cozzini, S., Guettler, I., O'Brien, T. A., Tawfik, A. B., Shalaby, A., Zakey, A. S., Steiner, A. L., Stordal, F., Sloan, L. C., and Brankovic, C.: RegCM4: model description and preliminary tests over multiple CORDEX domains, Clim. Res., 52, 7–29, https://doi.org/10.3354/cr01018, 2012.
Gorai, A. K., Tuluri, F., Tchounwou, P. B., and Ambinakudige, S.: Influence of local meteorology and NO2 conditions on ground-level ozone concentrations in the eastern part of Texas, USA, Air Qual. Atmos. Hlth., 8, 81–96, https://doi.org/10.1007/s11869-014-0276-5, 2015.
Grell, G. A.: Prognostic evaluation of assumptions used by cumulus parameterizations, Mon. Weather Rev., 121, 764–787, https://doi.org/10.1175/1520-0493(1993)121<0764:Peoaub>2.0.Co;2, 1993.
Guan, Y. R., Shan, Y. L., Huang, Q., Chen, H. L., Wang, D., and Hubacek, K.: Assessment to China's Recent Emission Pattern Shifts, Earths Future, 9, e2021EF002241, https://doi.org/10.1029/2021ef002241, 2021.
Guenther, A. B., Monson, R. K., and Fall, R.: Isoprene and monoterpene emission rate variability – observations with eucalyptus and emission rate algorithm development, J. Geophys. Res.-Atmos., 96, 10799–10808, https://doi.org/10.1029/91jd00960, 1991.
Guo, J. P., Miao, Y. C., Zhang, Y., Liu, H., Li, Z. Q., Zhang, W. C., He, J., Lou, M. Y., Yan, Y., Bian, L. G., and Zhai, P.: The climatology of planetary boundary layer height in China derived from radiosonde and reanalysis data, Atmos. Chem. Phys., 16, 13309–13319, https://doi.org/10.5194/acp-16-13309-2016, 2016.
Haman, C. L., Couzo, E., Flynn, J. H., Vizuete, W., Heffron, B., and Lefer, B. L.: Relationship between boundary layer heights and growth rates with ground-level ozone in Houston, Texas, J. Geophys. Res.-Atmos., 119, 6230–6245, https://doi.org/10.1002/2013jd020473, 2014.
Han, H., Liu, J., Shu, L., Wang, T., and Yuan, H.: Local and synoptic meteorological influences on daily variability in summertime surface ozone in eastern China, Atmos. Chem. Phys., 20, 203–222, https://doi.org/10.5194/acp-20-203-2020, 2020.
He, J. W., Wang, Y. X., Hao, J. M., Shen, L. L., and Wang, L.: Variations of surface O-3 in August at a rural site near Shanghai: influences from the West Pacific subtropical high and anthropogenic emissions, Environ. Sci. Pollut. Res., 19, 4016–4029, https://doi.org/10.1007/s11356-012-0970-5, 2012.
Heald, C. L., Wilkinson, M. J., Monson, R. K., Alo, C. A., Wang, G. L., and Guenther, A.: Response of isoprene emission to ambient CO2 changes and implications for global budgets, Glob. Change Biol., 15, 1127–1140, https://doi.org/10.1111/j.1365-2486.2008.01802.x, 2009.
Hoffmann, L., Gunther, G., Li, D., Stein, O., Wu, X., Griessbach, S., Heng, Y., Konopka, P., Muller, R., Vogel, B., and Wright, J. S.: From ERA-Interim to ERA5: the considerable impact of ECMWF's next-generation reanalysis on Lagrangian transport simulations, Atmos. Chem. Phys., 19, 3097–3124, https://doi.org/10.5194/acp-19-3097-2019, 2019.
Hong, C. P., Zhang, Q., He, K. B., Guan, D. B., Li, M., Liu, F., and Zheng, B.: Variations of China's emission estimates: response to uncertainties in energy statistics, Atmos. Chem. Phys., 17, 1227–1239, https://doi.org/10.5194/acp-17-1227-2017, 2017.
IPCC: Climate Change 2021: The Physical Science Basis. Contribution of Working Group I to the Sixth Assessment Report of the Intergovernmental Panel on Climate Change, edited by: Masson-Delmotte, V., Zhai, P., Pirani, A., Connors, S. L., Péan, C., Berger, S., Caud, N., Chen, Y., Goldfarb, L., Gomis, M. I., Huang, M., Leitzell, K., Lonnoy, E., Matthews, J. B. R., Maycock, T. K., Waterfield, T., Yelekçi, O., Yu, R., and Zhou, B., Cambridge University Press, Cambridge, United Kingdom and New York, NY, USA, in press, https://doi.org/10.1017/9781009157896, 2021.
Jacob, D. J. and Winner, D. A.: Effect of climate change on air quality, Atmos. Environ., 43, 51–63, https://doi.org/10.1016/j.atmosenv.2008.09.051, 2009.
Jacobs, N., Simpson, W. R., Graham, K. A., Holmes, C., Hase, F., Blumenstock, T., Tu, Q., Frey, M., Dubey, M. K., Parker, H. A., Wunch, D., Kivi, R., Heikkinen, P., Notholt, J., Petri, C., and Warneke, T.: Spatial distributions of X-CO2 seasonal cycle amplitude and phase over northern high-latitude regions, Atmos. Chem. Phys., 21, 16661–16687, https://doi.org/10.5194/acp-21-16661-2021, 2021.
Jiang, X., Wiedinmyer, C., and Carlton, A. G.: Aerosols from Fires: An Examination of the Effects on Ozone Photochemistry in the Western United States, Environ. Sci. Technol., 46, 11878–11886, https://doi.org/10.1021/es301541k, 2012.
KhayatianYazdi, F., Kamali, G., Mirrokni, S. M., and Memarian, M. H.: Sensitivity evaluation of the different physical parameterizations schemes in regional climate model RegCM4.5 for simulation of air temperature and precipitation over North and West of Iran, Dynam. Atmos. Ocean., 93, 101199, https://doi.org/10.1016/j.dynatmoce.2020.101199, 2021.
Kong, L., Tang, X., Zhu, J., Wang, Z., Li, J., Wu, H., Wu, Q., Chen, H., Zhu, L., Wang, W., Liu, B., Wang, Q., Chen, D., Pan, Y., Song, T., Li, F., Zheng, H., Jia, G., Lu, M., Wu, L., and Carmichael, G. R.: A 6-year-long (2013–2018) high-resolution air quality reanalysis dataset in China based on the assimilation of surface observations from CNEMC, Earth Syst. Sci. Data, 13, 529–570, https://doi.org/10.5194/essd-13-529-2021, 2021.
Lee, Y. C., Shindell, D. T., Faluvegi, G., Wenig, M., Lam, Y. F., Ning, Z., Hao, S., and Lai, C. S.: Increase of ozone concentrations, its temperature sensitivity and the precursor factor in South China, Tellus B, 66, 23455, https://doi.org/10.3402/tellusb.v66.23455, 2014.
Lefer, B. L., Shetter, R. E., Hall, S. R., Crawford, J. H., and Olson, J. R.: Impact of clouds and aerosols on photolysis frequencies and photochemistry during TRACE-P: 1. Analysis using radiative transfer and photochemical box models, J. Geophys. Res.-Atmos., 108, 8821, https://doi.org/10.1029/2002jd003171, 2003.
Lelieveld, J. and Crutzen, P. J.: Influences of cloud photochemical processes on tropospheric ozone, Nature, 343, 227–233, https://doi.org/10.1038/343227a0, 1990.
Li, J., Chen, X. S., Wang, Z. F., Du, H. Y., Yang, W. Y., Sun, Y. L., Hu, B., Li, J. J., Wang, W., Wang, T., Fu, P. Q., and Huang, H. L.: Radiative and heterogeneous chemical effects of aerosols on ozone and inorganic aerosols over East Asia, Sci. Total Environ., 622, 1327–1342, https://doi.org/10.1016/j.scitotenv.2017.12.041, 2018.
Li, K., Jacob, D. J., Liao, H., Shen, L., Zhang, Q., and Bates, K. H.: Anthropogenic drivers of 2013–2017 trends in summer surface ozone in China, P. Natl. Acad. Sci. USA, 116, 422–427, https://doi.org/10.1073/pnas.1812168116, 2019.
Li, K., Jacob, D. J., Shen, L., Lu, X., De Smedt, I., and Liao, H.: Increases in surface ozone pollution in China from 2013 to 2019: anthropogenic and meteorological influences, Atmos. Chem. Phys., 20, 11423–11433, https://doi.org/10.5194/acp-20-11423-2020, 2020.
Li, R., Zhang, M., Chen, L., Kou, X., and Skorokhod, A.: CMAQ simulation of atmospheric CO2 concentration in East Asia: Comparison with GOSAT observations and ground measurements, Atmos. Environ., 160, 176–185, https://doi.org/10.1016/j.atmosenv.2017.03.056, 2017.
Li, X. B., Yuan, B., Parrish, D. D., Chen, D. H., Song, Y. X., Yang, S. X., Liu, Z. J., and Shao, M.: Long-term trend of ozone in southern China reveals future mitigation strategy for air pollution, Atmos. Environ., 269, 118869, https://doi.org/10.1016/j.atmosenv.2021.118869, 2022.
Lin, J.-T., Patten, K. O., Hayhoe, K., Liang, X.-Z., and Wuebbles, D. J.: Effects of future climate and biogenic emissions changes on surface ozone over the United States and China, J. Appl. Meteorol. Climatol., 47, 1888–1909, https://doi.org/10.1175/2007jamc1681.1, 2008.
Liu, C. H., Ikeda, K., Rasmussen, R., Barlage, M., Newman, A. J., Prein, A. F., Chen, F., Chen, L., Clark, M., Dai, A. G., Dudhia, J., Eidhammer, T., Gochis, D., Gutmann, E., Kurkute, S., Li, Y. P., Thompson, G., and Yates, D.: Continental-scale convection-permitting modeling of the current and future climate of North America, Clim. Dynam., 49, 71–95, https://doi.org/10.1007/s00382-016-3327-9, 2017.
Liu, H., Liu, S., Xue, B., Lv, Z., Meng, Z., Yang, X., Xue, T., Yu, Q., and He, K.: Ground-level ozone pollution and its health impacts in China, Atmos. Environ., 173, 223–230, https://doi.org/10.1016/j.atmosenv.2017.11.014, 2018a.
Liu, L., Zhou, L., Zhang, X., Wen, M., Zhang, F., Yao, B., and Fang, S.: The characteristics of atmospheric CO2 concentration variation of four national background stations in China, Science China Ser. D, 52, 1857–1863, https://doi.org/10.1007/s11430-009-0143-7, 2009.
Liu, Y. and Wang, T.: Worsening urban ozone pollution in China from 2013 to 2017 – Part 1: The complex and varying roles of meteorology, Atmos. Chem. Phys., 20, 6305–6321, https://doi.org/10.5194/acp-20-6305-2020, 2020a.
Liu, Y. and Wang, T.: Worsening urban ozone pollution in China from 2013 to 2017 – Part 2: The effects of emission changes and implications for multi-pollutant control, Atmos. Chem. Phys., 20, 6323–6337, https://doi.org/10.5194/acp-20-6323-2020, 2020b.
Liu, Z., Liu, Y., Wang, S., Yang, X., Wang, L., Baig, M. H. A., Chi, W., and Wang, Z.: Evaluation of Spatial and Temporal Performances of ERA-Interim Precipitation and Temperature in Mainland China, J. Clim., 31, 4347–4365, https://doi.org/10.1175/jcli-d-17-0212.1, 2018b.
Lu, H., Yi, S., Liu, Z., Mason, J. A., Jiang, D., Cheng, J., Stevens, T., Xu, Z., Zhang, E., Jin, L., Zhang, Z., Guo, Z., Wang, Y., and Otto-Bliesner, B.: Variation of East Asian monsoon precipitation during the past 21 k.y. and potential CO2 forcing, Geology, 41, 1023–1026, https://doi.org/10.1130/g34488.1, 2013.
Lu, X., Zhang, L., Wang, X. L., Gao, M., Li, K., Zhang, Y. Z., Yue, X., and Zhang, Y. H.: Rapid Increases in Warm-Season Surface Ozone and Resulting Health Impact in China Since 2013, Environ. Sci. Technol. Lett., 7, 240–247, https://doi.org/10.1021/acs.estlett.0c00171, 2020.
Lu, X., Hong, J., Zhang, L., Cooper, O. R., Schultz, M. G., Xu, X., Wang, T., Gao, M., Zhao, Y., and Zhang, Y.: Severe Surface Ozone Pollution in China: A Global Perspective, Environ. Sci. Technol. Lett., 5, 487–494, https://doi.org/10.1021/acs.estlett.8b00366, 2018.
Lu, X., Zhang, L., Chen, Y. F., Zhou, M., Zheng, B., Li, K., Liu, Y. M., Lin, J. T., Fu, T. M., and Zhang, Q.: Exploring 2016–2017 surface ozone pollution over China: source contributions and meteorological influences, Atmos. Chem. Phys., 19, 8339–8361, https://doi.org/10.5194/acp-19-8339-2019, 2019.
Lv, Q., Liu, H. B., Wang, J. T., Liu, H., and Shang, Y.: Multiscale analysis on spatiotemporal dynamics of energy consumption CO2 emissions in China: Utilizing the integrated of DMSP-OLS and NPP-VIIRS nighttime light datasets, Sci. Total Environ., 703, ,134394, https://doi.org/10.1016/j.scitotenv.2019.134394, 2020.
Ma, D., Wang, T., Xu, B., Song, R., Gao, L., Chen, H., Ren, X., Li, S., Zhuang, B., and Li, M.: The mutual interactions among ozone, fine particulate matter, and carbon dioxide on summer monsoon climate in East Asia, Atmos. Environ., 299, 119668, https://doi.org/10.1016/j.atmosenv.2023.119668, 2023.
Ma, Z., Xu, J., Quan, W., Zhang, Z., Lin, W., and Xu, X.: Significant increase of surface ozone at a rural site, north of eastern China, Atmos. Chem. Phys., 16, 3969–3977, https://doi.org/10.5194/acp-16-3969-2016, 2016.
Marullo, S., Buongiorno Nardelli, B., Guarracino, M., and Santoleri, R.: Observing the Mediterranean Sea from space: 21 years of Pathfinder-AVHRR sea surface temperatures (1985 to 2005): re-analysis and validation, Ocean Sci., 3, 299–310, https://doi.org/10.5194/os-3-299-2007, 2007 (data available at https://downloads.psl.noaa.gov/Datasets/noaa.oisst.v2/, last access: 10 April 2022).
MEIC Team: The Multi-resolution Emission Inventory Model for Climate and Air Pollution Research, MEIC Model [data set], http://meicmodel.org/?page_id=560 (last access: 14 April 2022), 2012.
Monks, P. S., Archibald, A. T., Colette, A., Cooper, O., Coyle, M., Derwent, R., Fowler, D., Granier, C., Law, K. S., Mills, G. E., Stevenson, D. S., Tarasova, O., Thouret, V., von Schneidemesser, E., Sommariva, R., Wild, O., and Williams, M. L.: Tropospheric ozone and its precursors from the urban to the global scale from air quality to short-lived climate forcer, Atmos. Chem. Phys., 15, 8889–8973, https://doi.org/10.5194/acp-15-8889-2015, 2015.
Monson, R. K. and Fall, R.: Isoprene emission from aspen leaves – influence of environment and relation to photosynthesis and photorespiration, Plant Physiol., 90, 267–274, https://doi.org/10.1104/pp.90.1.267, 1989.
Mousavinezhad, S., Choi, Y., Pouyaei, A., Ghahremanloo, M., and Nelson, D. L.: A comprehensive investigation of surface ozone pollution in China, 2015–2019: Separating the contributions from meteorology and precursor emissions, Atmos. Res., 257, 105599, https://doi.org/10.1016/j.atmosres.2021.105599, 2021.
Peters, W., Jacobson, A. R., Sweeney, C., Andrews, A. E., Conway, T. J., Masarie, K., Miller, J. B., Bruhwiler, L. M. P., Petron, G., Hirsch, A. I., Worthy, D. E. J., van der Werf, G. R., Randerson, J. T., Wennberg, P. O., Krol, M. C., and Tans, P. P.: An atmospheric perspective on North American carbon dioxide exchange: CarbonTracker, P. Natl. Acad. Sci. USA, 104, 18925–18930, https://doi.org/10.1073/pnas.0708986104, 2007 (data available at https://gml.noaa.gov/aftp/products/carbontracker/co2/CT2019/, last access: 5 April 2022).
Pfister, G. G., Walters, S., Lamarque, J. F., Fast, J., Barth, M. C., Wong, J., Done, J., Holland, G., and Bruyere, C. L.: Projections of future summertime ozone over the US, J. Geophys. Res.-Atmos., 119, 5559–5582, https://doi.org/10.1002/2013jd020932, 2014.
Possell, M., Hewitt, C. N., and Beerling, D. J.: The effects of glacial atmospheric CO2 concentrations and climate on isoprene emissions by vascular plants, Glob. Change Biol., 11, 60–69, https://doi.org/10.1111/j.1365-2486.2004.00889.x, 2005.
Pu, X., Wang, T. J., Huang, X., Melas, D., Zanis, P., Papanastasiou, D. K., and Poupkou, A.: Enhanced surface ozone during the heat wave of 2013 in Yangtze River Delta region, China, Sci. Total Environ., 603, 807–816, https://doi.org/10.1016/j.scitotenv.2017.03.056, 2017.
Rapparini, F., Baraldi, R., Miglietta, F., and Loreto, F.: Isoprenoid emission in trees of Quercus pubescens and Quercus ilex with lifetime exposure to naturally high CO2 environment, Plant Cell Environ., 27, 381–391, https://doi.org/10.1111/j.1365-3040.2003.01151.x, 2004.
Ren, S. G., Yuan, B. L., Ma, X., and Chen, X. H.: International trade, FDI (foreign direct investment) and embodied CO2 emissions: A case study of Chinas industrial sectors, China Econ. Rev., 28, 123–134, https://doi.org/10.1016/j.chieco.2014.01.003, 2014.
Reynolds, R. W., Rayner, N. A., Smith, T. M., Stokes, D. C., and Wang, W. Q.: An improved in situ and satellite SST analysis for climate, J. Clim., 15, 1609–1625, https://doi.org/10.1175/1520-0442(2002)015<1609:Aiisas>2.0.Co;2, 2002.
Rosenstiel, T. N., Potosnak, M. J., Griffin, K. L., Fall, R., and Monson, R. K.: Increased CO2 uncouples growth from isoprene emission in an agriforest ecosystem, Nature, 421, 256–259, https://doi.org/10.1038/nature01312, 2003.
Sanchez-Ccoyllo, O. R., Ynoue, R. Y., Martins, L. D., and Andrade, M. D. F.: Impacts of ozone precursor limitation and meteorological variables on ozone concentration in Sao Paulo, Brazil, Atmos. Environ., 40, 552–562, https://doi.org/10.1016/j.atmosenv.2006.04.069, 2006.
Schimel, D., Stephens, B. B., and Fisher, J. B.: Effect of increasing CO2 on the terrestrial carbon cycle, P. Natl. Acad. Sci. USA, 112, 436–441, https://doi.org/10.1073/pnas.1407302112, 2015.
Shalaby, A., Zakey, A. S., Tawfik, A. B., Solmon, F., Giorgi, F., Stordal, F., Sillman, S., Zaveri, R. A., and Steiner, A. L.: Implementation and evaluation of online gas-phase chemistry within a regional climate model (RegCM-CHEM4), Geosci. Model Dev., 5, 741–760, https://doi.org/10.5194/gmd-5-741-2012, 2012.
Sharkey, T. D., Loreto, F., and Delwiche, C. F.: High-carbon dioxide and sun shade effects on isoprene emission from oak and aspen tree leaves, Plant Cell Environ., 14, 333–338, https://doi.org/10.1111/j.1365-3040.1991.tb01509.x, 1991.
Shen, L., Mickley, L. J., and Gilleland, E.: Impact of increasing heat waves on US ozone episodes in the 2050s: Results from a multimodel analysis using extreme value theory, Geophys. Res. Lett., 43, 4017–4025, https://doi.org/10.1002/2016gl068432, 2016.
Shen, L., Jacob, D. J., Liu, X., Huang, G., Li, K., Liao, H., and Wang, T.: An evaluation of the ability of the Ozone Monitoring Instrument (OMI) to observe boundary layer ozone pollution across China: application to 2005–2017 ozone trends, Atmos. Chem. Phys., 19, 6551–6560, https://doi.org/10.5194/acp-19-6551-2019, 2019.
Shen, L., Liu, J., Zhao, T., Xu, X., Han, H., Wang, H., and Shu, Z.: Atmospheric transport drives regional interactions of ozone pollution in China, Sci. Total Environ., 830, 154634, https://doi.org/10.1016/j.scitotenv.2022.154634, 2022.
Shetter, R. E., Cinquini, L., Lefer, B. L., Hall, S. R., and Madronich, S.: Comparison of airborne measured and calculated spectral actinic flux and derived photolysis frequencies during the PEM Tropics B mission, J. Geophys. Res.-Atmos., 108, PEM 6-1–PEM 6-12, https://doi.org/10.1029/2001jd001320, 2002.
Shi, K. F., Chen, Y., Yu, B. L., Xu, T. B., Chen, Z. Q., Liu, R., Li, L. Y., and Wu, J. P.: Modeling spatiotemporal CO2 (carbon dioxide) emission dynamics in China from DMSP-OLS nighttime stable light data using panel data analysis, Appl. Energ., 168, 523–533, https://doi.org/10.1016/j.apenergy.2015.11.055, 2016.
Singh, S. and Singh, R.: High-altitude clear-sky direct solar ultraviolet irradiance at Leh and Hanle in the western Himalayas: Observations and model calculations, J. Geophys. Res.-Atmos., 109, D19201, https://doi.org/10.1029/2004jd004854, 2004.
Steiner, A. L., Davis, A. J., Sillman, S., Owen, R. C., Michalak, A. M., and Fiore, A. M.: Observed suppression of ozone formation at extremely high temperatures due to chemical and biophysical feedbacks, P. Natl. Acad. Sci. USA, 107, 19685–19690, https://doi.org/10.1073/pnas.1008336107, 2010.
Sun, Z. H., Hve, K., Vislap, V., and Niinemets, U.: Elevated CO2 magnifies isoprene emissions under heat and improves thermal resistance in hybrid aspen, J. Exp. Bot., 64, 5509–5523, https://doi.org/10.1093/jxb/ert318, 2013.
Tai, A. P. K., Mickley, L. J., Heald, C. L., and Wu, S. L.: Effect of CO2 inhibition on biogenic isoprene emission: Implications for air quality under 2000 to 2050 changes in climate, vegetation, and land use, Geophys. Res. Lett., 40, 3479–3483, https://doi.org/10.1002/grl.50650, 2013.
Tie, X. X., Madronich, S., Walters, S., Zhang, R. Y., Rasch, P., and Collins, W.: Effect of clouds on photolysis and oxidants in the troposphere, J. Geophys. Res.-Atmos., 108, 4642, https://doi.org/10.1029/2003jd003659, 2003.
Verstraeten, W. W., Neu, J. L., Williams, J. E., Bowman, K. W., Worden, J. R., and Boersma, K. F.: Rapid increases in tropospheric ozone production and export from China, Nat. Geosci., 9, 643–643, https://doi.org/10.1038/ngeo2768, 2016.
Wang, L. T., Wei, Z., Yang, J., Zhang, Y., Zhang, F. F., Su, J., Meng, C. C., and Zhang, Q.: The 2013 severe haze over southern Hebei, China: model evaluation, source apportionment, and policy implications, Atmos. Chem. Phys., 14, 3151–3173, https://doi.org/10.5194/acp-14-3151-2014, 2014.
Wang, N., Lyu, X. P., Deng, X. J., Huang, X., Jiang, F., and Ding, A. J.: Aggravating O-3 pollution due to NOx emission control in eastern China, Sci. Total Environ., 677, 732–744, https://doi.org/10.1016/j.scitotenv.2019.04.388, 2019a.
Wang, P., Guo, H., Hu, J., Kota, S. H., Ying, Q., and Zhang, H.: Responses of PM2.5 and O-3 concentrations to changes of meteorology and emissions in China, Sci. Total Environ., 662, 297–306, https://doi.org/10.1016/j.scitotenv.2019.01.227, 2019b.
Wang, T., Dai, J., Lam, K. S., Nan Poon, C., and Brasseur, G. P.: Twenty-Five Years of Lower Tropospheric Ozone Observations in Tropical East Asia: The Influence of Emissions and Weather Patterns, Geophys. Res. Lett., 46, 11463–11470, https://doi.org/10.1029/2019gl084459, 2019c.
Wang, T., Xue, L., Brimblecombe, P., Lam, Y. F., Li, L., and Zhang, L.: Ozone pollution in China: A review of concentrations, meteorological influences, chemical precursors, and effects, Sci. Total Environ., 575, 1582–1596, https://doi.org/10.1016/j.scitotenv.2016.10.081, 2017a.
Wang, W. N., Cheng, T. H., Gu, X. F., Chen, H., Guo, H., Wang, Y., Bao, F. W., Shi, S. Y., Xu, B. R., Zuo, X., Meng, C., and Zhang, X. C.: Assessing Spatial and Temporal Patterns of Observed Ground-level Ozone in China, Sci. Rep., 7, 3651, https://doi.org/10.1038/s41598-017-03929-w, 2017b.
Wang, X., Chen, F., Wu, Z., Zhang, M., Tewari, M., Guenther, A., and Wiedinmyer, C.: Impacts of Weather Conditions Modified by Urban Expansion on Surface Ozone: Comparison between the Pearl River Delta and Yangtze River Delta Regions, Adv. Atmos. Sci., 26, 962–972, https://doi.org/10.1007/s00376-009-8001-2, 2009.
Wang, Y., Chen, H., Wu, Q., Chen, X., Wang, H., Gbaguidi, A., Wang, W., and Wang, Z.: Three-year, 5 km resolution China PM2.5 simulation: Model performance evaluation, Atmos. Res., 207, 1–13, https://doi.org/10.1016/j.atmosres.2018.02.016, 2018.
Wang, Y., Gao, W., Wang, S., Song, T., Gong, Z., Ji, D., Wang, L., Liu, Z., Tang, G., Huo, Y., Tian, S., Li, J., Li, M., Yang, Y., Chu, B., Petaja, T., Kerminen, V.-M., He, H., Hao, J., Kulmala, M., Wang, Y., and Zhang, Y.: Contrasting trends of PM2.5 and surface-ozone concentrations in China from 2013 to 2017, Natl. Sci. Rev., 7, 1331–1339, https://doi.org/10.1093/nsr/nwaa032, 2020.
Wei, J., Li, Z. Q., Li, K., Dickerson, R. R., Pinker, R. T., Wang, J., Liu, X., Sun, L., Xue, W. H., and Cribb, M.: Full-coverage mapping and spatiotemporal variations of ground-level ozone (O3) pollution from 2013 to 2020 across China, Remote Sens. Environ., 270, 112775, https://doi.org/10.1016/j.rse.2021.112775, 2022.
Wilkinson, M. J., Monson, R. K., Trahan, N., Lee, S., Brown, E., Jackson, R. B., Polley, H. W., Fay, P. A., and Fall, R.: Leaf isoprene emission rate as a function of atmospheric CO2 concentration, Glob. Change Biol., 15, 1189–1200, https://doi.org/10.1111/j.1365-2486.2008.01803.x, 2009.
Wu, W., Xue, W., Lei, Y., and Wang, J.: Sensitivity analysis of ozone in Beijing-Tianjin-Hebei (BTH) and its surrounding area using OMI satellite remote sensing data, China Environ. Sci., 38, 1201–1208, 2018.
Xie, X., Huang, X., Wang, T., Li, M., Li, S., and Chen, P.: Simulation of Non-Homogeneous CO2 and Its Impact on Regional Temperature in East Asia, J. Meteorol. Res., 32, 456–468, https://doi.org/10.1007/s13351-018-7159-x, 2018.
Xie, X., Wang, T., Yue, X., Li, S., Zhuang, B., and Wang, M.: Effects of atmospheric aerosols on terrestrial carbon fluxes and CO2 concentrations in China, Atmos. Res., 237, 104859, https://doi.org/10.1016/j.atmosres.2020.104859, 2020.
Xie, X., Wang, T., Yue, X., Li, S., Zhuang, B., Wang, M., and Yang, X.: Numerical modeling of ozone damage to plants and its effects on atmospheric CO2 in China, Atmos. Environ., 217, 116970, https://doi.org/10.1016/j.atmosenv.2019.116970, 2019.
Xu, B., Wang, T., Ma, D., Song, R., Zhang, M., Gao, L., Li, S., Zhuang, B., Li, M., and Xie, M.: Impacts of regional emission reduction and global climate change on air quality and temperature to attain carbon neutrality in China, Atmos. Res., 279, 106384, https://doi.org/10.1016/j.atmosres.2022.106384, 2022.
Xu, B. Y., Wang, T. J., Gao, L. B., Ma, D. Y., Song, R., Zhao, J., Yang, X. G., Li, S., Zhuang, B. L., Li, M. M., and Xie, M.: Impacts of meteorological factors and ozone variation on crop yields in China concerning carbon neutrality objectives in 2060, Environ. Pollut., 317, 120715, https://doi.org/10.1016/j.envpol.2022.120715, 2023.
Xu, W., Xu, X., Lin, M., Lin, W., Tarasick, D., Tang, J., Ma, J., and Zheng, X.: Long-term trends of surface ozone and its influencing factors at the Mt Waliguan GAW station, China – Part 2: The roles of anthropogenic emissions and climate variability, Atmos. Chem. Phys., 18, 773–798, https://doi.org/10.5194/acp-18-773-2018, 2018.
Yang, Y., Liao, H., and Li, J.: Impacts of the East Asian summer monsoon on interannual variations of summertime surface-layer ozone concentrations over China, Atmos. Chem. Phys., 14, 6867–6879, https://doi.org/10.5194/acp-14-6867-2014, 2014.
Yin, C., Wang, T., Solmon, F., Mallet, M., and Zhuang, B.: Assessment of direct radiative forcing due to secondary organic aerosol over China with a regional climate model, Tellus B, 67, 24634, https://doi.org/10.3402/tellusb.v67.24634, 2015.
Yin, Z. and Ma, X.: Meteorological conditions contributed to changes in dominant patterns of summer ozone pollution in Eastern China, Environ. Res. Lett., 15, 124062, https://doi.org/10.1088/1748-9326/abc915, 2020.
Yoo, J. M., Lee, Y. R., Kim, D., Jeong, M. J., Stockwell, W. R., Kundu, P. K., Oh, S. M., Shin, D. B., and Lee, S. J.: New indices for wet scavenging of air pollutants (O-3, CO, NO2, SO2, and PM10) by summertime rain, Atmos. Environ., 82, 226–237, https://doi.org/10.1016/j.atmosenv.2013.10.022, 2014.
Yue, X. and Unger, N.: The Yale Interactive terrestrial Biosphere model version 1.0: description, evaluation and implementation into NASA GISS ModelE2, Geosci. Model Dev., 8, 2399–2417, https://doi.org/10.5194/gmd-8-2399-2015, 2015.
Zaveri, R. A. and Peters, L. K.: A new lumped structure photochemical mechanism for large-scale applications, J. Geophys. Res.-Atmos., 104, 30387–30415, https://doi.org/10.1029/1999JD900876, 1999.
Zhai, S. X., Jacob, D. J., Wang, X., Shen, L., Li, K., Zhang, Y. Z., Gui, K., Zhao, T. L., and Liao, H.: Fine particulate matter (PM2.5) trends in China, 2013–2018: separating contributions from anthropogenic emissions and meteorology, Atmos. Chem. Phys., 19, 11031–11041, https://doi.org/10.5194/acp-19-11031-2019, 2019 (data available at http://www.cnemc.cn/, last access:1 May 2022),.
Zhao, S., Yu, Y., Yin, D., Qin, D., He, J., and Dong, L.: Spatial patterns and temporal variations of six criteria air pollutants during 2015 to 2017 in the city clusters of Sichuan Basin, China, Sci. Total Environ., 624, 540–557, https://doi.org/10.1016/j.scitotenv.2017.12.172, 2018.
Zheng, B., Tong, D., Li, M., Liu, F., Hong, C., Geng, G., Li, H., Li, X., Peng, L., Qi, J., Yan, L., Zhang, Y., Zhao, H., Zheng, Y., He, K., and Zhang, Q.: Trends in China's anthropogenic emissions since 2010 as the consequence of clean air actions, Atmos. Chem. Phys., 18, 14095–14111, https://doi.org/10.5194/acp-18-14095-2018, 2018.
Zheng, J., Shao, M., Che, W., Zhang, L., Zhong, L., Zhang, Y., and Streets, D.: Speciated VOC Emission Inventory and Spatial Patterns of Ozone Formation Potential in the Pearl River Delta, China, Environ. Sci. Technol., 43, 8580–8586 https://doi.org/10.1021/es901688e, 2009.
Zheng, S., Cao, C. X., and Singh, R. P.: Comparison of ground based indices (API and AQI) with satellite based aerosol products, Sci. Total Environ., 488, 400–414, https://doi.org/10.1016/j.scitotenv.2013.12.074, 2014.
Zhuang, B. L., Li, S., Wang, T. J., Liu, J., Chen, H. M., Chen, P. L., Li, M. M., and Xie, M.: Interaction between the Black Carbon Aerosol Warming Effect and East Asian Monsoon Using RegCM4, J. Clim., 31, 9367–9388, https://doi.org/10.1175/jcli-d-17-0767.1, 2018.