the Creative Commons Attribution 4.0 License.
the Creative Commons Attribution 4.0 License.
 | 12 Jun 2023
High contribution of anthropogenic combustion sources to atmospheric inorganic reactive nitrogen in South China evidenced by isotopes
Tingting Li
Zeyu Sun
Hongxing Jiang
Chongguo Tian
Gan Zhang
Due to the intense release of reactive nitrogen (Nr) from anthropogenic activity, the source layout of atmospheric nitrogen aerosol has changed. To comprehensively clarify the level, sources, and environmental fate of NH and NO, their concentrations and stable isotopes (δ15N) in fine particulate matter (PM2.5) were measured in a subtropical megacity of South China. The inorganic nitrogen (NH and NO was an essential part of atmospheric nitrogen aerosol, and the N-NH and N-NO contributed 45.8 % and 23.2 % to total nitrogen (TN), respectively. The source contributions of NH and NO were estimated by δ15N, suggesting that the dominant sources were from anthropogenic combustion activities, including coal combustion, biomass burning, and vehicles, contributing 63.2 % and 88.3 % to NH and NO, respectively. In particular, biomass burning was the predominant source of NH (27.9 %), whereas coal combustion was the dominant source of NO (40.4 %). This study emphasized the substantial impacts of human activities on inorganic Nr. With the rapid development of industry and transportation, nitrogen emissions will be even higher. The promotion of clean energy and efficient use of biomass would help to reduce nitrogen emissions and alleviate air pollution.
- Article
(1683 KB) - Full-text XML
-
Supplement
(1034 KB) - BibTeX
- EndNote


Nitrogenous aerosols are ubiquitous in environment and play an important role as nutrients in ecosystems (Bhattarai et al., 2019). With the massive combustion of fossil fuels and the development of livestock, the proportion of total nitrogen (TN) in particulate matter (PM) ranges from 1.2 % to 17.0 % and has shown a rapid increase in the last few decades (Bhattarai et al., 2019; Galloway et al., 2004; Holland et al., 1999). Mostly nitrogenous aerosols formed from atmospheric reactive nitrogen (Nr) will be deposited into terrestrial and aquatic ecosystems (Huang et al., 2015). Excessive external nitrogen deposition accelerates nitrogen loss in soil, decreases species diversity, disturbs terrestrial ecosystems, and leads to eutrophication in aquatic ecosystems (Breemen, 2002; Wedin and Tilman, 1996; Yang et al., 2015). Furthermore, nitrogenous aerosols have adverse impacts on the climate, air quality, and human health (Bhattarai et al., 2019; Song et al., 2021).
As inorganic Nr, N-NO and N-NH are dominant species in the deposition of nitrogen (Zhu et al., 2015); N-NH was the highest in nitrogen deposition, and NH was gradually considered to be an important component of secondary inorganic aerosols (SIA) (Sun et al., 2021). Ammonia (NH3), the precursor of NH, is a vital atmospheric alkaline gas, which can participate in nucleation to promote new particle generation, and can react with acid gas to produce ammonium sulfate and ammonium nitrate (Dunne et al., 2016; Fu et al., 2017). The excessive NH3 emission from anthropogenic sources will partially offset the benefits of reducing SO2 and NOx and trigger urban haze in China (Sun et al., 2021; Meng et al., 2018; Pan et al., 2018a). In many urban environments, NO has replaced sulfate as the component with the highest proportion in SIA. Nitrogen oxides (NOx), precursors of NO, are also closely related to the formation of atmospheric oxidants and exert important effects on atmospheric oxidation. In addition, NH4NO3 in PM plays an increasingly important role in promoting the formation of sulfate and organic matter, and it has profound effect on the physical and chemical properties of PM (Liu et al., 2021 2020; Hodas et al., 2014). Therefore, to mitigate nitrogen deposition and air pollution, the control of NH (NH3) and NO (NOx) should not be neglected.
Considerable efforts have been made to comprehensively understand the budget of atmospheric NH and NO; δ15N is effective to quantify source contributions of nitrogenous species (Elliott et al., 2007). The anthropogenic combustion sources (combustion of coal, biomass, and gasoline) play a key role in the emission of NO (NOx) in many regions of China, suggested by δ15N (Zong et al., 2020), which also have large effects on NH3 (Chen et al., 2022b). Ammonia (NH3) is released by agricultural sources (agricultural activity and livestock) and non-agricultural sources (fossil fuel combustion and vehicles) (Bhattarai et al., 2019). A previous study showed that agricultural sources were the dominant source (80 %–90 %) of NH3 in China (Kang et al., 2016). However, NH3 emissions from agricultural sources have been reduced due to intensive farming and efficient fertilization (Wang et al., 2022). The incomplete burning of biomass leads to massive NH3 emissions and is gradually becoming the second largest non-agricultural source of NH3 (Yu et al., 2020), which may be responsible for the lag of the decline in the deposition of air pollutants behind the reduction in emission of precursors (Zhao et al., 2022b). Biomass burning in the suburbs also has a potential impact on urban NH3 (Xiao et al., 2020). As for urban NH3, combustion sources (including coal combustion, vehicle emissions, and biomass burning) were gradually becoming dominant sources in recent years verified by δ15N–NHx (NH3+ NH (Xiao et al., 2020; Pan et al., 2018b). In addition, the super clean emission of coal-fired power plants and strict emission standards of vehicles will change the source layout of NH and NO. Selective catalytic reduction technology equipped with vehicles and industrial boilers reduces NOx but increases NH3 emissions (Meng et al., 2017; Pan et al., 2016). The occurrence of haze in North China was closely related to NH3 emissions from combustion sources (Pan et al., 2018a, b). As the main components of SIA, NH and NO play a vital role in the formation of secondary aerosol (Meng et al., 2017), so it is necessary to revisit their sources.
Reactive nitrogen (Nr) emissions from densely populated subtropical areas increased rapidly with the high development of industry and transportation (Wang et al., 2013). Guangzhou is the core megacity in the South subtropical region of China, where the atmospheric environment is complex and the atmospheric oxidation level is high (Tan et al., 2019). The high emissions of inorganic nitrogen from anthropogenic combustion sources have serious and profound impacts on the environment. In this study, we aimed to comprehensively clarify the level of inorganic Nr and revisit the source layout of atmospheric inorganic Nr.
2.1 Sampling and chemical concentration analysis
Fine particulate matter (PM2.5) samples (n=66) were collected from May 2017 to June 2018 in Guangzhou (23.13 ∘N, 113.27 ∘E). Details of the sample collection can be found in our previous study (Jiang et al., 2021a). The chemical components including water-soluble ions (i.e., NH, K+, Na+, Ca2+, Mg2+, Cl−, NO, and SO, organic carbon (OC), element carbon (EC), and organic molecular markers (e.g., levoglucosan) were analyzed in our previous studies (Sect. S1 in the Supplement) (Jiang et al., 2021a, b). Moreover, meteorological parameters (temperature, relative humidity (RH), atmospheric pressure, and wind speed) and the concentration of trace gases (CO, SO2, NO, NO2, and O3) were acquired by online instruments (details shown in Sect. S1). A circular punch (r=1 cm) of the sample filter was wrapped in a tin boat and then measured in an elemental analyzer to determine the concentrations of TN.
2.2 Isotope analysis
The δ15N–NO and δ18O–NO values in PM2.5 were analyzed by methods of nitrous oxide (N2O), which was described in a previous study in detail (Zong et al., 2017). Briefly, NO was reduced to NO using cadmium powder and an imidazole solution, and N2O was made by adding NaN3 to a NO solution. The production of 75 nmol N2O gas was needed for measurement. The N2O gas produced by above processes was measured by the MAT253 stable isotope mass spectrometer. The values of δ18O and δ15N were expressed in per mil (‰) shown in Eqs. (1) and (2), relative to the international oxygen and nitrogen isotope standard, respectively.
The δ15N–NH was measured by methods of hypobromite oxidation coupled with the reduction of hydroxylamine hydrochloride (Sun et al., 2021). Briefly, NH was oxidated to NO using alkaline hypobromite (BrO−), and N2O was made by adding sodium arsenite and hydrochloric acid to a NO solution. The production of 120 nmol N2O gas was needed for measurement. The N2O gas produced by above processes was measured by the MAT253 stable isotope mass spectrometer. The values of δ15N were expressed in per mil (‰) in Eq. (1). To ensure the stability of the instrument, standard samples were tested for every 10 samples. The standard deviation of replicates was generally less than 0.4 ‰, 0.8 ‰, and 0.5 ‰ for δ15N–NO, δ18O–NO, and δ15N–NH, respectively. The instrumental values of δ15N–NO and δ18O–NO were corrected by multi-point correction (δ18O r2=0.99, δ15N r2=0.999) based on international standards (IAEA-NO-3, USGS32, USGS34, and USGS35). The measured values of δ15N–NH were also corrected by multi-point correction (r2=0.999) based on international standards (IAEA-N1, USGS25, and USGS26). In addition, 7Be and 210Pb were acquired and details were shown in Sect. S1.
2.3 IsoSource and Bayesian mixing model
2.3.1 IsoSource model
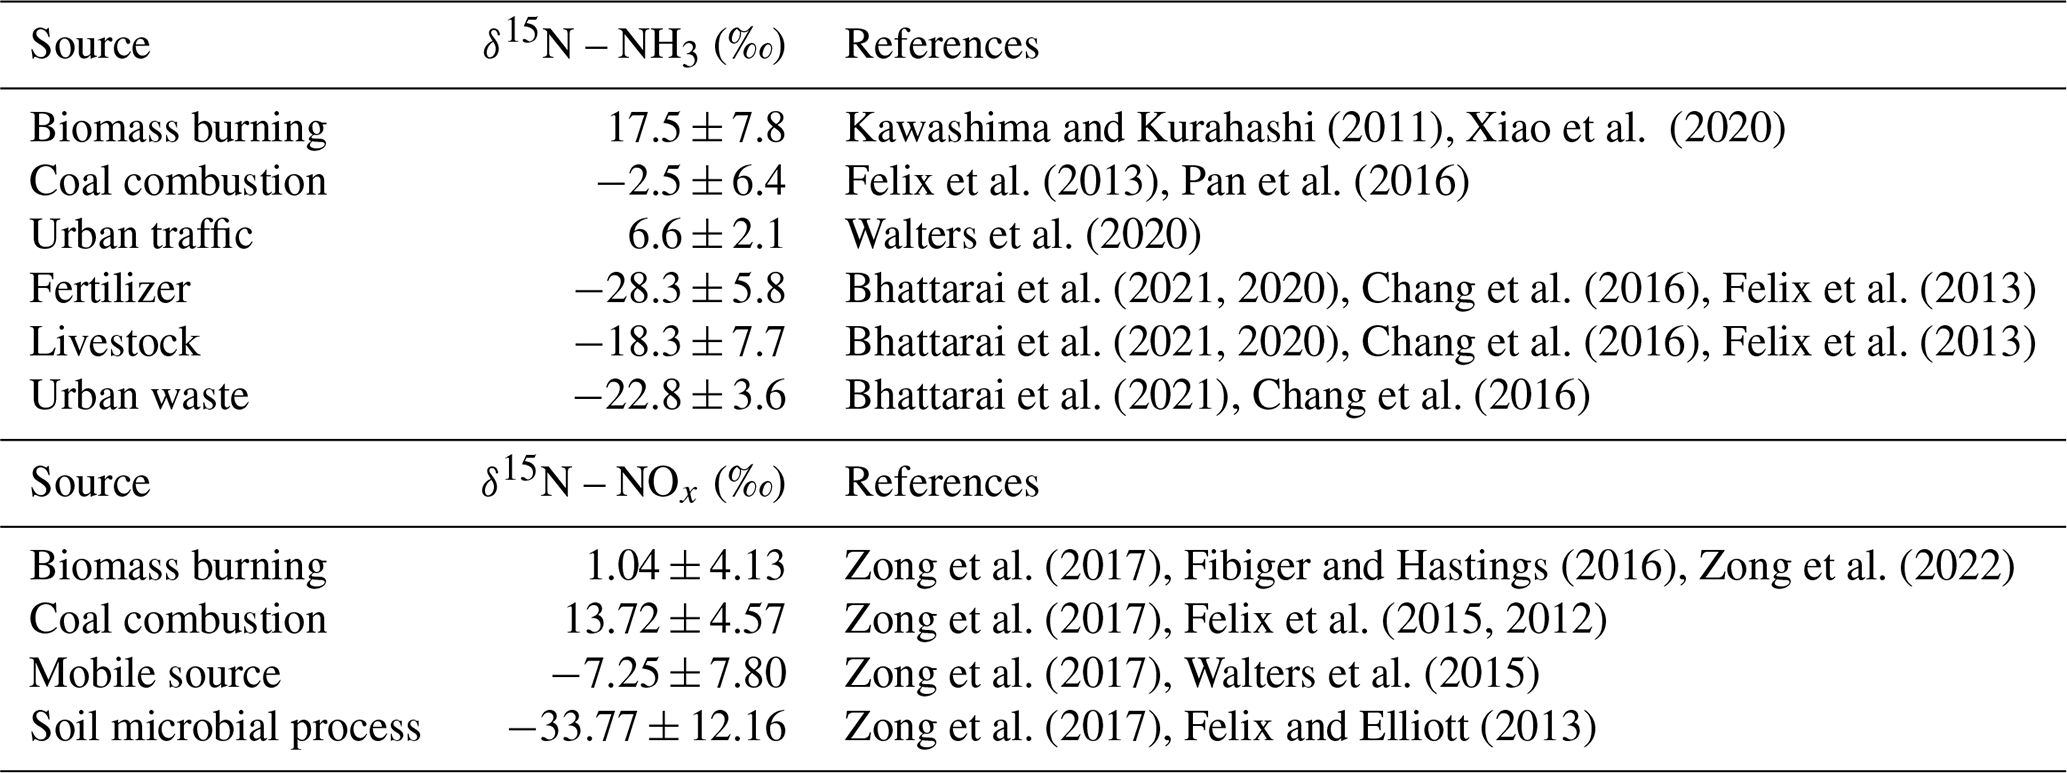
The IsoSource model, released by the Environmental Protection Agency (EPA), could calculate ranges of source contributions to a mixture based on the conservation of isotopic mass when the number of sources is too large to permit a unique solution and provide the distribution of source proportions (Phillips et al., 2005). The IsoSource model coupled with δ15N–NH3 of atmospheric initial and potential sources (shown in Table 1) were applied to quantify the contribution of various sources to NH3. Nitrogen fertilizer applications, livestock, human waste, biomass burning, coal combustion, and vehicles were considered as sources of NH3 in this study (details shown in Sect. S2). Atmospheric initial δ15N–NH3 was calculated by following Eq. (3).
where δ15N–NH and δ15N–NH3−initial represent the δ15N of particulate NH and atmospheric initial NH3, respectively; ε (NH–NH3) represents the isotope fractionation factor in the gaseous NH3 conversion to particulate NH in the atmosphere. The f value represents the proportion of the initial NH3 converted to NH, referring to NH3 and NH observed in Guangzhou (Liao et al., 2014).
The ε(NH–NH3) value is temperature dependent (Huang et al., 2019), which can be deduced from Urey (1947), as shown in Eq. (4). The atmospheric average temperature was 24.5 ∘C in our sampling period, and the corresponding ε(NH–NH3) value was 34.2 ‰ calculated by Eq. (4). In addition, the ε(NH–NH3) in Guangzhou was estimated to be 32.4 ‰ according to Eq. (8). Equation (8) was deduced by Eqs. (5)–(7). According to Eq. (8), a linear fitting equation was observed between fNH and δ15N–NH (Fig. S1), and the absolute value of the slope (32.4 ‰) was equal to ε(NH–NH3). The ε(NH–NH3) average of the two methods (34.2 ‰ and 32.4 ‰) was 33.3 ‰ and approximated to the experimental isotope enrichment factor (33 ‰) (Heaton et al., 1997). Therefore, 33 ‰ was used for deducing the δ15N of the initial NH3.
Here, T represents the atmospheric temperature (∘C); δ15N–NH and δ15N–NH3 represent the δ15N of particulate NH and atmospheric NH3, respectively; δ15N represents the sum of δ15N–NH and δ15N–NH3; fNH3 and fNH represent the proportion of atmospheric NH3 and particulate NH, respectively.
2.3.2 Bayesian mixing model
The δ15N were used for tracing sources based on the conservation of isotopic mass. The Bayesian mixing model improved upon linear mixing models by explicitly considering uncertainty in prior information and isotopic equilibrium fractionation. Recently, the Bayesian mixing model was applied to trace the sources of atmospheric pollutants (Zong et al., 2017, 2020). The model coupled with δ15N–NO and δ18O–NO was used to identify the formation process and quantify the source contributions of NO.
In the central Pearl River Delta (PRD), NO formed through ⋅OH and N2O5 pathways contributed to 94 % simulated by the Community Multiscale Air Quality (CAMQ) model (Qu et al., 2021). In this study, only ⋅OH and N2O5 formation pathways were considered. Details of the NO formation pathway were also shown in Sect. S2. The atmospheric δ18O–NO can be expressed by Eq. (9). The [δ18O–HNO3]OH can be further expressed by Eq. (10), assuming no kinetic isotope fractionation (Walters and Michalski, 2016), and [δ18O–HNO3] can be estimated by Eq. (11) (Walters and Michalski, 2016). The δ18O values in tropospheric H2O, NOx, O3, and OH were within a certain range. The tropospheric δ18O–H2O, δ18O–NOx, δ18O–O3, and δ18O–OH ranged from −25 ‰ to 0 ‰ (Baskaran et al., 2011; Walters and Michalski, 2016), 112 ‰ to 122 ‰ (Michalski et al., 2014; Walters and Michalski, 2016), 90 ‰ to 122 ‰, and −15 ‰ to 0 ‰, respectively (Fang et al., 2011; Johnston and Thiemens, 1997). Therefore, the γ (the contribution of the ⋅OH formation pathway) can be estimated by fNO2 and the oxygen isotope fractionation i.e., αNO NO, αOH H2O, and αN2O5 NO2. The oxygen isotope fractionations are temperature dependent and can be estimated by Eq. (13) and Table S1. The fNO2 varied from 0.20 to 0.95 (Zong et al., 2017; Walters et al., 2016). Based on δ18O–NO, δ18O–H2O, δ18O–NOx, δ18O–O3, and temperature (Eqs. 9–13), γ (maximum γ and minimum γ) was estimated by Monte Carlo simulation nested in the Bayesian mixing model (Zong et al., 2017). Assuming no kinetic isotope fractionation, the nitrogen isotope fractionation value in the formation process of NO (εN) was calculated by Eqs. (13)–(16) combined with γ and temperature (Zong et al., 2017; Walters and Michalski, 2016; Walters et al., 2016). The εN value in our sampling period was 5.1±2.5 ‰, which was comparable to that in Beijing(average 6.5 ‰) (Fan et al., 2020). The contributions of different sources to atmospheric NOx were quantified by the Bayesian mixing model coupled with εN, δ15N–atmospheric-NO, and δ15N–NOx endmembers shown in Table 1. We considered coal combustion, mobile traffic sources, biomass burning, and soil microbial process as dominant atmospheric NOx sources in Guangzhou (details shown in Sect. S2). The specific details of the Bayesian mixing model were reported by our previous studies (Zong et al., 2017, 2020).
Here, γ is the contribution of the ⋅OH formation pathway to NO, and εN is the nitrogen isotope fractionation value. In the total NOx, fNO2 is the fraction of NO2; 18α, 18α2O, and 18αN2 are the oxygen isotope equilibrium fractionation factors between NO2 and NO, ⋅OH and H2O, and N2O5 and NO2, respectively. The nitrogen isotope equilibrium fractionation factors between NO2 and NO and N2O5 and NO2 are 15α and 15αN2, respectively.
Table 1The estimation of δ15N–NH3 and δ15N–NOx from various sources.
3.1 Concentration and seasonal variation of NH and NO
The concentration of NH and NO in PM2.5 was 1.6±1.3 µg m−3 and 2.8±3.4 µg m−3, contributing 18.7 % and 32.6 % to SIA. The concentration of N-NH and N-NO was 1.2±1.0 µg m−3 and 0.6±0.8 µg m−3, contributing 45.8 % and 23.2 % to TN, respectively. Thus, NH and NO were an essential part of nitrogen aerosols; NH and NO showed similar seasonal variations with higher concentrations in winter than in summer (Fig. 1). During winter, the air mass was often dry and cold with low wind speed, which meant the decrease of the atmospheric self-purification capability. In addition, primary combustion sources related to fossil fuel and biomass burning always showed significant increase in North China during winter, which greatly increased the concentration of atmospheric pollutants in Guangzhou by long-range transportation. However, during summer, the air mass from the sea was relatively clean with high wind speed facilitating the diffusion of pollutants. Moreover, high temperature in summer was conducive to the decomposition of NH4NO3 (Song et al., 2008). Thus, the levels of NH and NO were lower in summer. In addition, concentrations of NH and NO in our study were lower than in North China (Beijing – Wu et al., 2019; Fan et al., 2022; Tianjin – Xiang et al., 2022; Shijiazhuang – Xiang et al., 2022; and Harbin – Sun et al., 2021), East China (Nanchang – Xiao et al., 2020), and Central China (Wuhan and Changsha – Xiao et al., 2020; Zong et al., 2020), suggesting that the level of air pollution in Guangzhou has been alleviated to a certain extent. Therefore, it is necessary to conduct a comprehensive study on the emission sources of NH and NO to take more effective measures to mitigate air pollution.
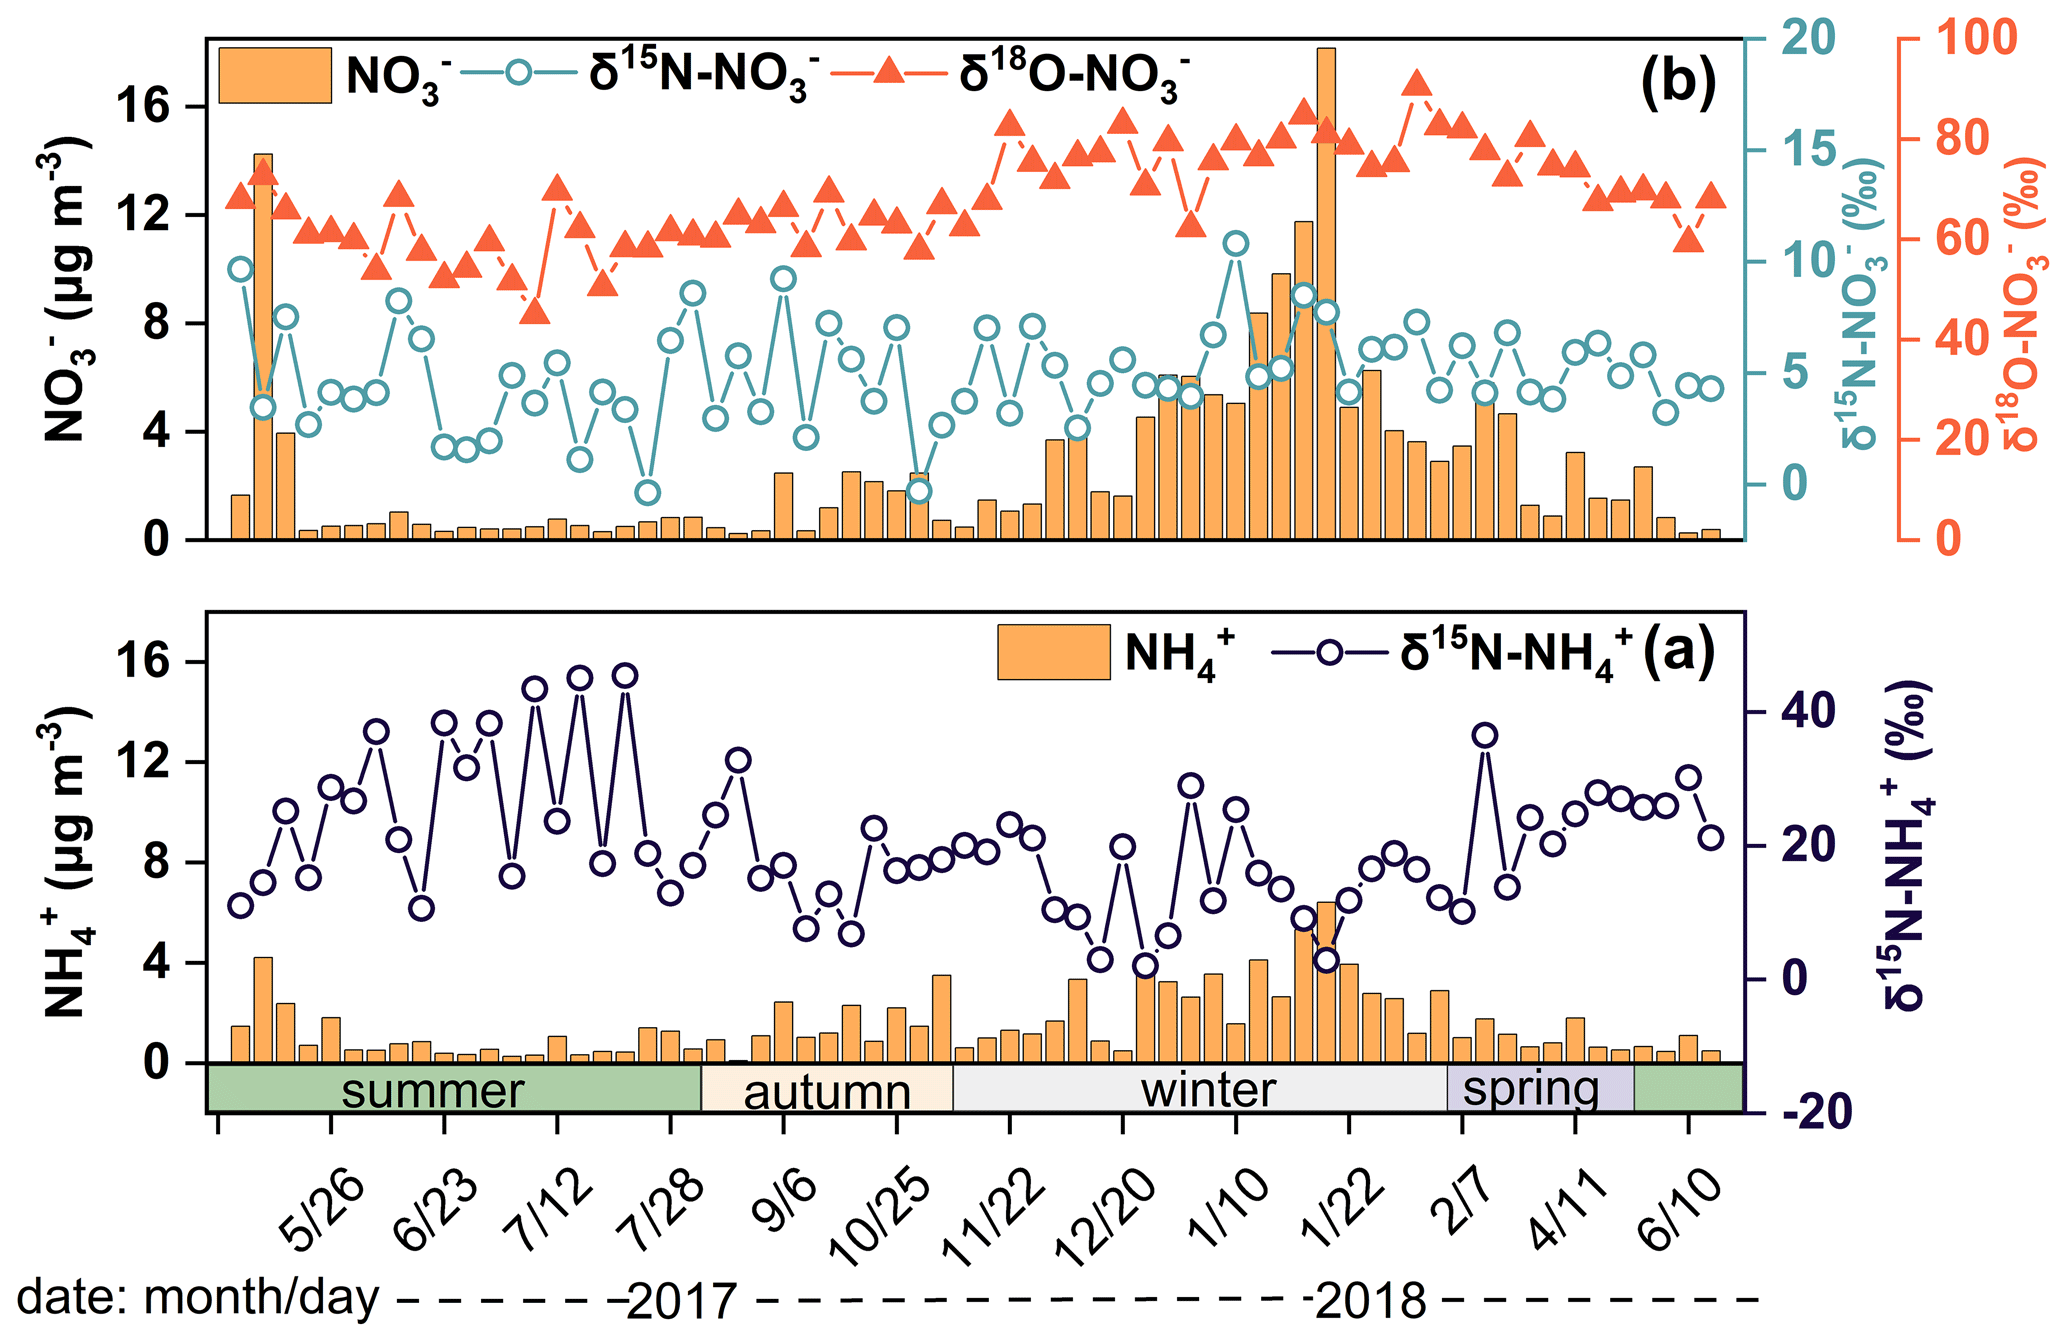
Figure 1(a) The concentration and δ15N of NH and (b) the concentration and δ15N and δ18O of NO.
3.2 Characteristic and seasonal variation in δ15N–NH and source apportionment of NH
The δ15N–NH values over Guangzhou ranged from 2.1 ‰ to 45.5 ‰, with an annual mean of 20.2 ‰±10.1 ‰. In our study, the δ15N–NH values were comparable to those at suburban sites (Fig. S2) such as sites in Japan (22.1 ‰±8.3 ‰, 16.1 ‰±6.6 ‰; Kawashima and Kurahashi, 2011) and Korea (Jeju Island, 17.4 ‰±4.9 ‰; Kundu et al., 2010) but heavier than those in polluted regions, such as Guangzhou during the summer haze (average 7.17 ‰; Liu et al., 2018) and Beijing (−37.1 ‰ to 5.8 ‰; Pan et al., 2016). The δ15N–NH values were lower in autumn (17.3 ‰) and winter (14.4 ‰) than in spring (22.5 ‰) and summer (25.7 ‰), which was similar to the trends in Japan (Kawashima and Kurahashi, 2011).
The seasonal differences in δ15N–NH values were significant between warm (summer and spring) and cold seasons (winter and autumn) (p<0.05). The δ15N–NH was affected by the ratio of NH (NH3+NH (Eq. 8 and Fig. S1). A linear fitting equation was observed between NH (NH3+NH and δ15N–NH, and the absolute value of the slope (32.4) approximated the isotope equilibrium fractionation value (33 %) between atmospheric NH3 and NH (Fig. S1). The linear fitting suggested that the lower the NH proportion was, the heavier the δ15N–NH value was. The lower NH level was in accordance with the higher δ15N–NH in summer, which was the opposite of winter. In addition, a previous study suggested that the marked variation in δ15N–NH values was largely controlled by the emission sources of NH3, the precursor gas of NH (Liu et al., 2018). According to the δ15N–NH results, the source of NH was assigned as biomass burning (27.9 % ± 16.4 %), coal combustion (16.0 % ± 3.9 %), vehicles (19.8 % ± 5.3 %), fertilizer (10.9 % ± 6.1 %), livestock (12.7 % ± 5.8 %), and urban waste (11.9 % ± 6.1 %) as shown in Fig. 2a.
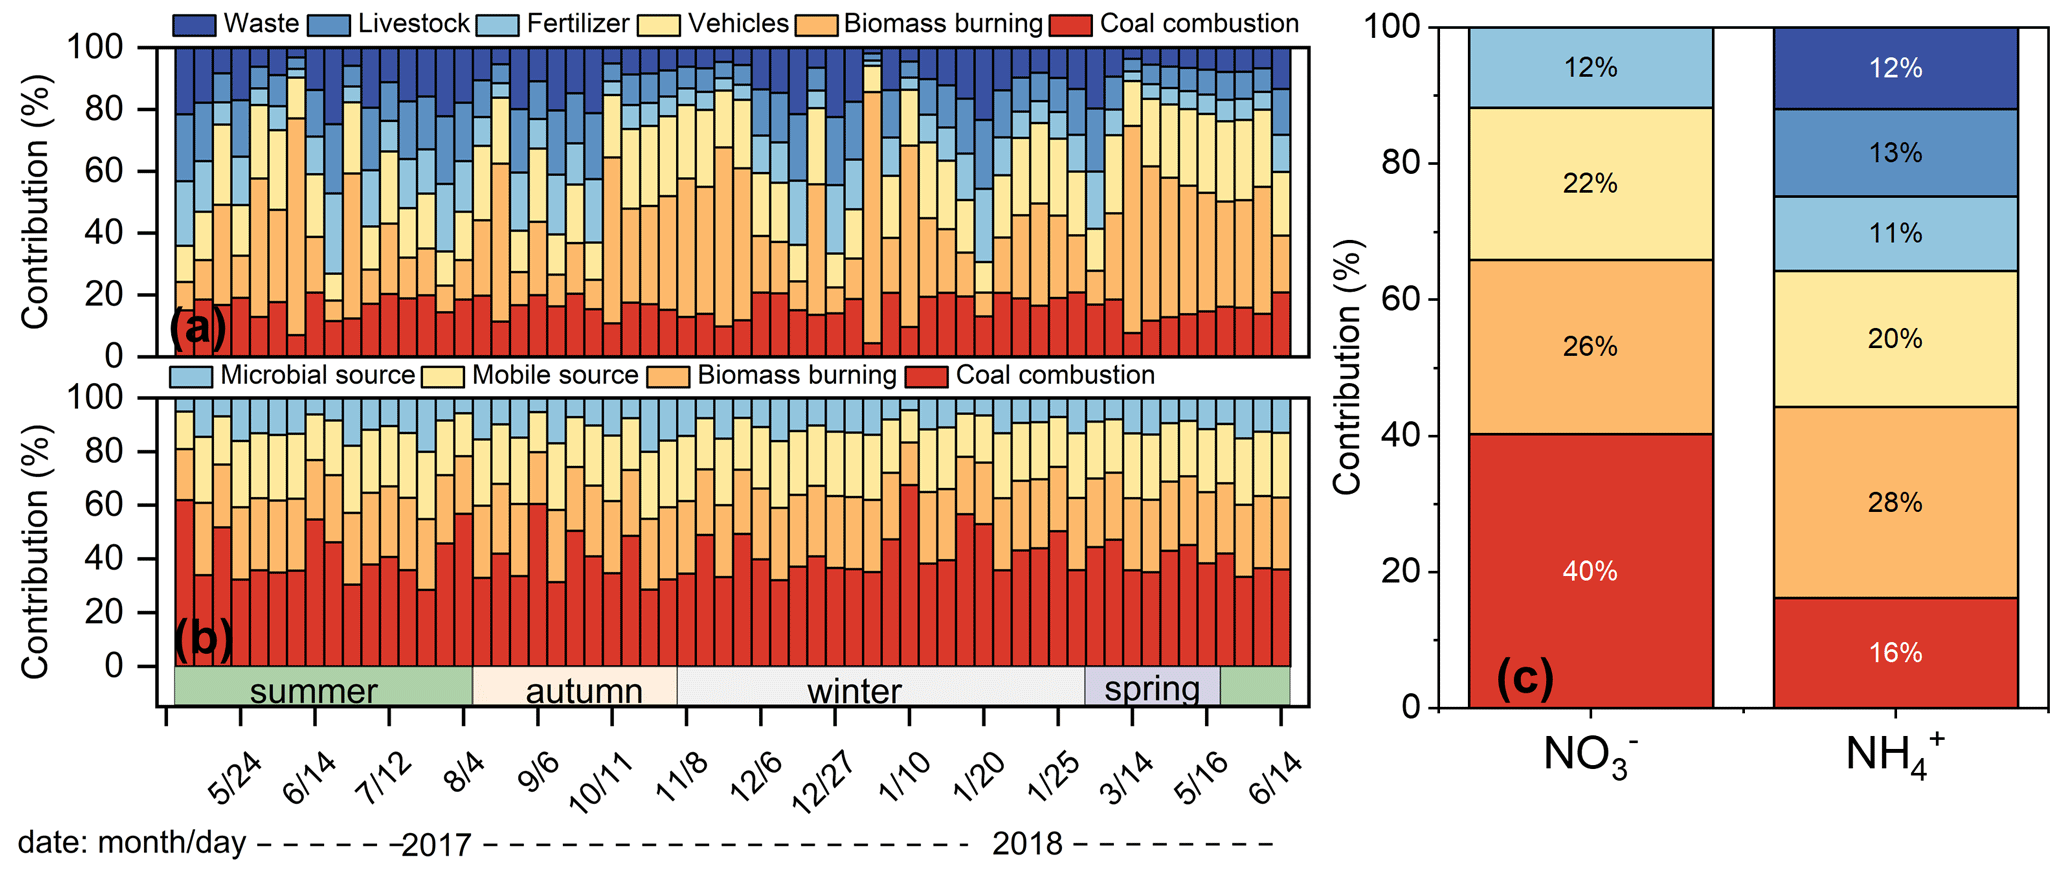
Figure 2The source apportionment results of atmospheric NH (a) and NO (b) in Guangzhou, and the comparison of sources results between NH and NO (c).
In our study, non-agriculture sources were the dominators of NH (75.6 %). Unexpectedly, the contribution of biomass burning was the highest. In particular, from late June to July, the contribution of biomass burning enhanced, which possibly resulted from sugarcane leaf burning. The δ15N in sugarcane leaves was as high as 38 ‰ (Martinellia et al., 2002). The δ15N of NH formed from NH3 released by sugarcane leaf burning was 44.1 ‰ (Sect. S3), which was consistent with the highest δ15N–NH values (45.5 ‰ and 45.1 ‰) in July. In PRD, south winds prevail in July and the sampling site is located downwind of sugarcane planting area. Therefore, the air mass to the sampling site might carry the pollutants related to sugarcane leaf burning. K+ is a typical biomass burning tracer (Cui et al., 2018). Considering the impact of primary emission intensity, [NH EC] and [K+ EC] were used to calculate the correlation coefficient (r = 0.435, p < 0.01), which verified that NH was influenced by biomass burning. In recent years, biomass burning has been gradually identified as an important source of NH (Meng et al., 2017; Xiao et al., 2020). The results based on emission inventories showed that the contribution of residential biomass combustion to NH3 ranged from 33 % to 53 % in China (Meng et al., 2017). According to δ15N, biomass burning contributed 18 % (Harbin, Northeast China – Sun et al., 2021), 46 % (Wuhan, Central China), 40 % (Changsha, South Central China – Xiao et al., 2020), 35 % (Nanchang, East China – Xiao et al., 2020), and 23 % (Guangzhou, South China – Chen et al., 2022a) to NH. Particularly, in Guangzhou, the contribution of biomass burning in the ground was higher than that in the Guangzhou tower with a height of 488 m, suggesting the influence of regional biomass burning (Chen et al., 2022a). Furthermore, 7Be mainly originates from upper atmosphere, whereas 210Pb is derived from terrestrial surface (Jiang et al., 2021b). High levels of 7Be observed in the ground suggested the sink influence of the upper atmosphere; 7Be and 210Pb are chemically stable and with unique sources, which can effectively reflect the transport of continental air mass and the air exchange between stratosphere and troposphere. In our study, the correlation coefficient between NH and 210Pb (r=0.701, p<0.01) was higher than that between NH and 7Be (r=0.432, p<0.01), suggesting that NH was mainly affected by regional emission. Therefore, biomass burning exerted essential influence on NH levels, which should no longer be ignored.
In addition, with the acceleration of urbanization, combustion sources related to fossil fuels have become the main sources of NH3. In previous studies, the source of NHx (NH3+ NH was mainly from agricultural activity due to the rough way of farming (Chang et al., 2016; Pan et al., 2020). However, with the improvement of efficient fertilization practices, agricultural NH3 decreased significantly (Wang et al., 2022). Fossil fuels, such as coal and gasoline, are major energies for production and domestic use, and their contribution to NH3 has become increasingly important. In North China, fossil fuel combustion contributed 92 % to NH3 during hazes (Zhang et al., 2020; Pan et al., 2016). In a previous study of Guangzhou, the contribution of NH3 from fossil sources in ground observations (43 %) was higher than that observed in the Guangzhou tower (18 %), indicating the importance of locally related fossil fuel combustion sources (Chen et al., 2022a). In our study, vehicle emission and coal combustion contributed 19.8 % ± 5.3 % and 16.0 % ± 3.9 % of NH, respectively, which was lower than that in North China but higher than agricultural sources. The share of NH3 from vehicle exhaust emissions was estimated to be 18.8 % based on the emission factor of NH3 from on-road vehicles in Guangzhou, which was similar to our results (Liu et al., 2014). The selective catalytic reduction process for vehicles can reduce NOx but increase the emission of NH3, which has been confirmed as an important source of NH3 (Heeb et al., 2006; Meng et al., 2017). Despite the efforts of government to promote electric vehicles in recent years, their share is still relatively low (about 5 %). As car ownership increases, this has an important impact on atmospheric NH3. Coal combustion was the second most important source of fossil combustion after vehicle emissions in our study, although the contribution was lower than in North China (Wu et al., 2019; Zhang et al., 2020; Pan et al., 2016). The absence of heating in Guangzhou may explain the lower contribution of coal combustion compared to North China. On an annual basis, the contribution of fossil-fuel-related combustion sources in our study (35.8 %) was comparable to that in North China (37 %–52 %) (Pan et al., 2018a).
The source contributions of NH in our study were compared to other regions (shown in Fig. S3). The combustion-related sources (biomass burning, coal combustion, and vehicle) have gradually become the dominant source of urban atmospheric NH3. Biomass burning and vehicle emissions could emit massive carbon monoxide (CO) (Li and Wang, 2007; Wang et al., 2005). In Guangzhou, NH was positively related to CO (r=0.637, p<0.01), which confirmed that combustion sources played a key role in NH. From a historical perspective, NH3 emissions from anthropogenic combustion and industry have been steadily increasing since 1960 (Meng et al., 2017). The optimization of energy structure and encouragement of the development of new energy vehicles would be hopeful to reduce NH3. The results of this study would be conducive to reducing NH3 scientifically and effectively and would relieve the pressure on the reduction from agricultural sources.
3.3 Characteristic and seasonal variation in δ18O–NO and δ15N–NO and source apportionment of NO
3.3.1 Seasonal variation of δ18O–NO
The δ18O–NO in Guangzhou was 68.1 ± 9.7 ‰ (44.9 ‰ to 90.5 ‰) comparable to that in precipitation (66.3 ‰, ranging from 33.4 ‰ to 86.2 ‰) (Fang et al., 2011), but lower than those regions with weak light intensity, such as Beihuangcheng Island (ranging from 49.4 ‰ to 103.9 ‰) (Zong et al., 2017) and the Bermuda islands (cold season 76.9 ‰±6.3 ‰) (Hastings et al., 2003). In this study, δ18O–NO was higher in winter and spring than in summer and autumn, which was similar to the seasonal variation in δ18O–NO in previous studies (Fang et al., 2011; Gobel et al., 2013). On the one hand, the δ18O–NO value was associated with the formation pathways of NO. The results simulated by the Bayesian mixing model suggested that the contributions of the N2O5 channel to NO were 56.8 %, 58.9 %, 29.2 %, and 27.0 % in winter, spring, autumn, and summer, respectively. The δ18O value of NO formed by the N2O5 channel is higher than that by the ⋅OH pathway (Sect. S2). The nights in cold seasons were longer than those in warm seasons, which favored NO formation through the N2O5 channel. In addition, the illumination intensity was weakened in cold seasons compared with that in warm seasons, which constrained the production of ⋅OH (Zong et al., 2020; Tan et al., 2019; Wang et al., 2017). Thus, the contribution of the N2O5 channel in cold seasons was higher than that in warm seasons. Furthermore, concentration of NO was high when contribution of the N2O5 channel enhanced (Fig. 3), suggesting that NO pollution was related to the N2O5 hydrolysis pathway. The air mass to Guangzhou was derived from the South China Sea in summer and the North Continental Region in winter. The higher δ18O–NO and NO concentration might be affected by long-range and high-altitude transport from North China, which might carry abundant precursors. Massive NO could be formed by N2O5 hydrolysis at high altitude and transported to the ground. The index of f (7Be,210Pb) was expressed in Sect. S1 and could reflect the influence of atmospheric dynamic transport on aerosol pollutants (Jiang et al., 2021b). Generally, air masses with low values of f(7Be,210Pb) suggested that pollutants were associated with continental surface emission, whereas high f(7Be, 210Pb) were influenced by long-range transport from upper air masses. The contribution of the N2O5 channel was positively correlated with f(7Be,210Pb) (r=0.319, p<0.05), indicating the long-range transport influence of upper air mass on the N2O5 channel. For example, on 25 January 2018, the contribution of the N2O5 channel (nitrate) was 81.1 % (3.6 µg m−3) when the upper air mass was from North China. However, on 7 July 2017, the N2O5 channel (nitrate) contributed only 5.7 % (0.5 µg m−3), corresponding to the air mass mainly from the South China Sea transported at low altitude (Fig. S4).
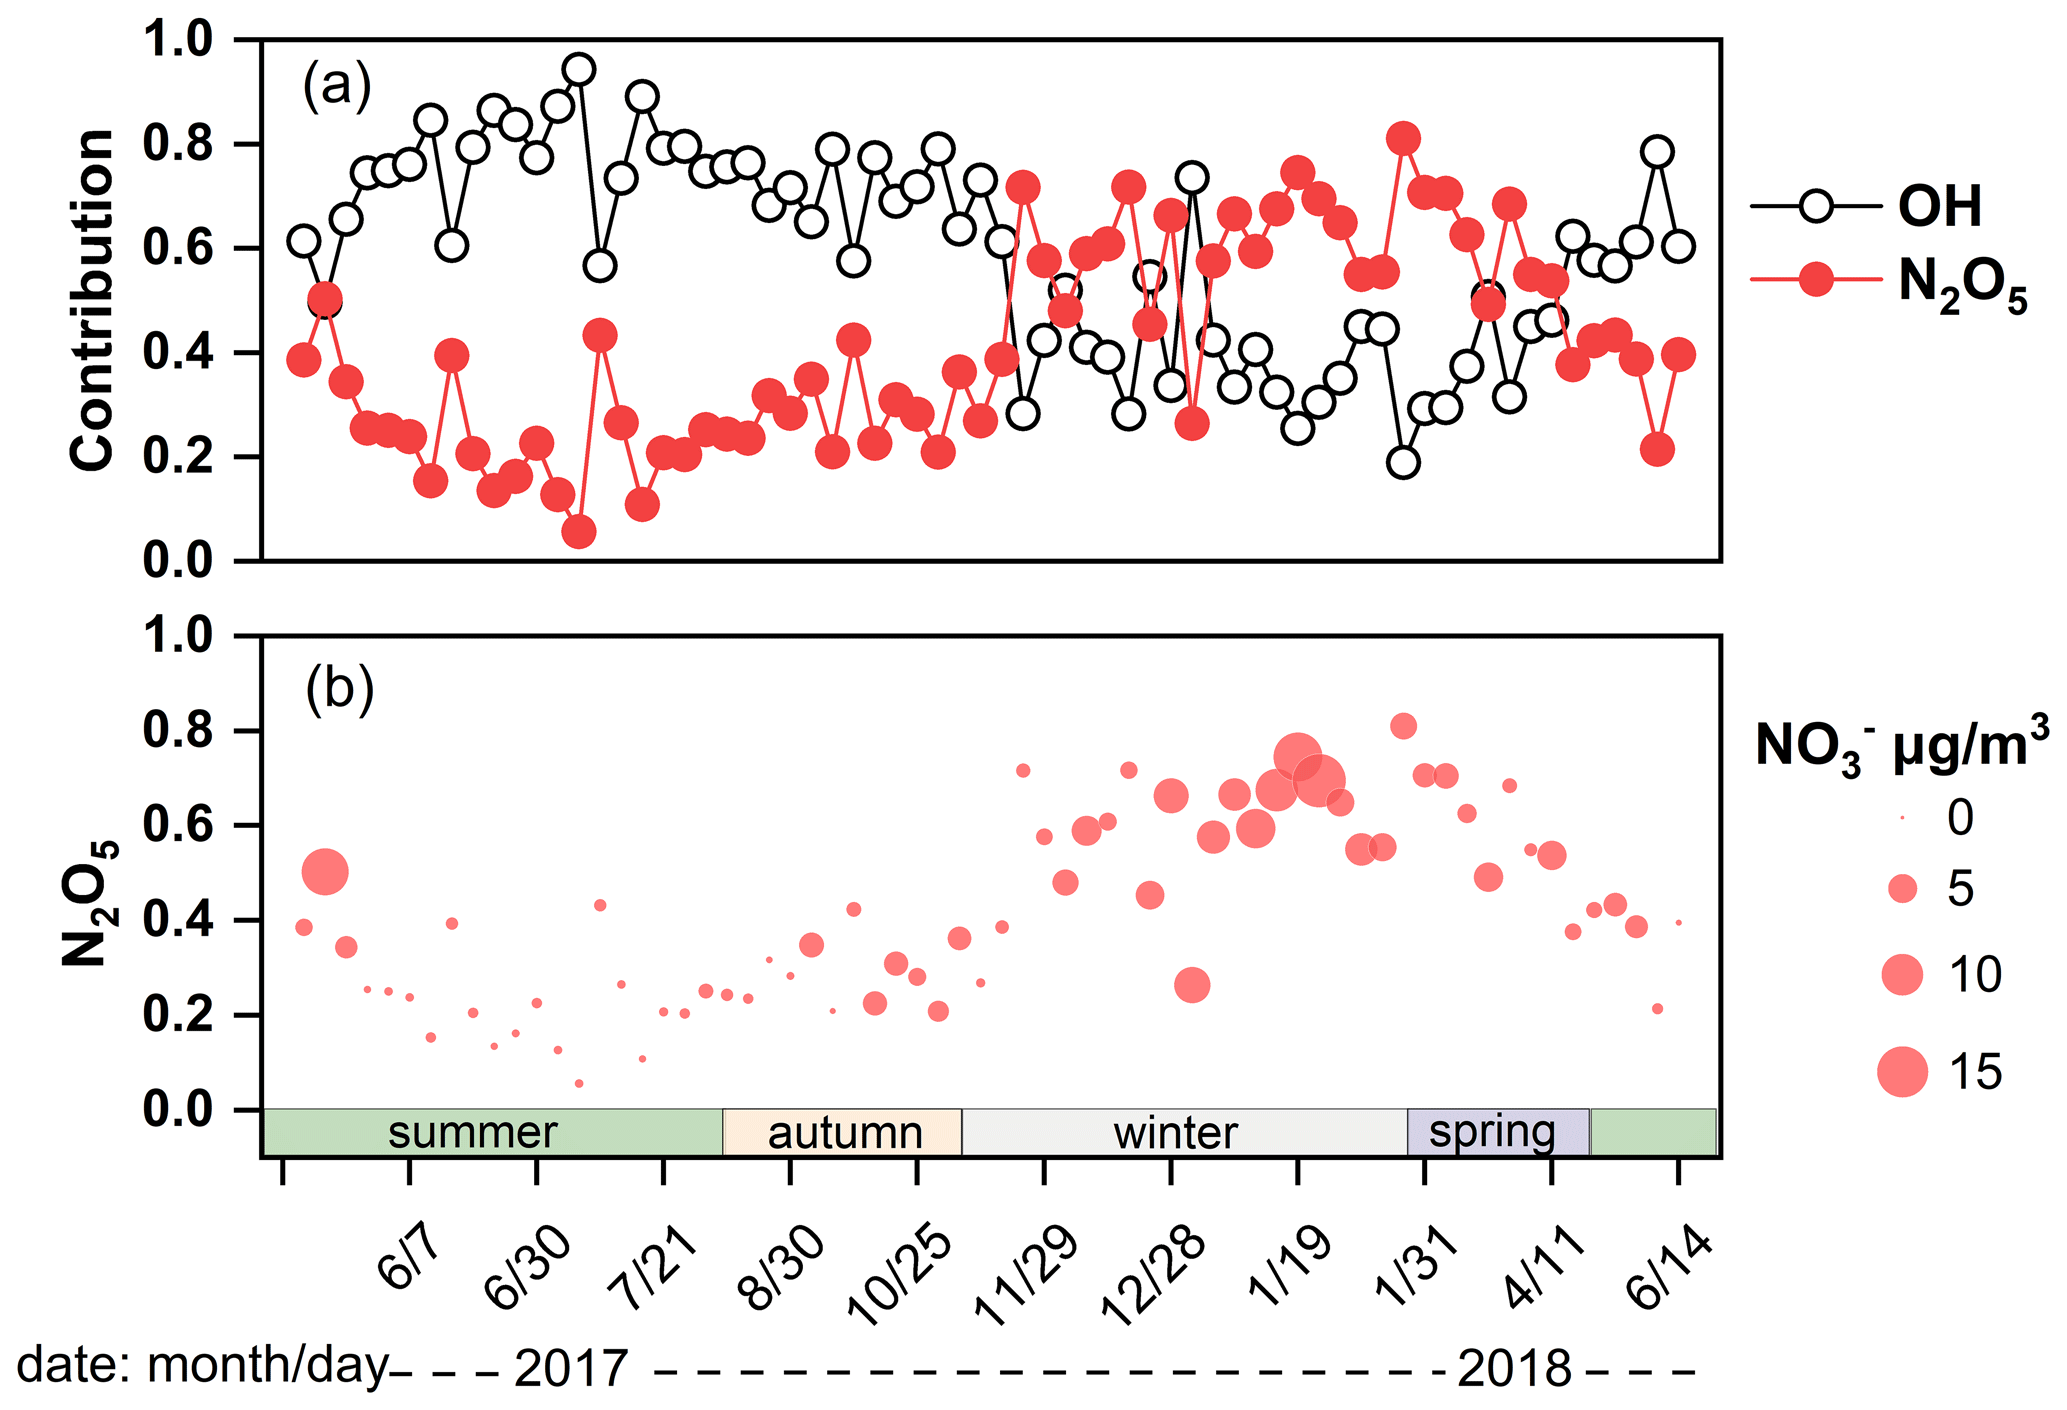
Figure 3(a) The contribution of the OH radical oxidation and N2O5 hydrolysis pathway to NO. (b) The vertical position of dots corresponded to the contribution of N2O5 pathway and the size of the dots corresponded to the concentration of NO.
The δ18O–NO decreased from 76.7 ‰ in 2014 to 68.1 ‰ in 2017–2018 (Zong et al., 2020), which indicated that the ⋅OH channel became more important in Guangzhou. The enhanced contribution of the ⋅OH pathway indicated the increasing atmospheric oxidation capacity. In recent years, although the concentration of PM2.5 in Guangzhou has significantly decreased, the photochemical pollution caused by high O3 concentrations was not optimistic (Tan et al., 2019). The O3 concentration in the PRD showed a fluctuating upward trend from 2013 to 2020; especially in 2017–2018, O3 concentrations were at high levels (Environmental Status Bulletin of Guangdong Province Fig. S5). In our study, the NO formation pathway inferred from δ18O–NO proved the enhancement of the atmospheric oxidation capacity.
3.3.2 Seasonal variation of δ15N–NO and source apportionment of NO
Seasonal variation of δ15N–NO
The δ15N–NO in Guangzhou was 4.9 ‰±2.2 ‰ (−0.4 ‰ to 10.8 ‰), which was similar to the wet deposition (Fang et al., 2011). The δ15N–NO was comparable to that from the northeastern United States (6.8 ‰) (Elliott et al., 2009) and lower than regions in China, where NO was predominantly derived from anthropogenic sources, such as Heshan in Guangdong (7.50 ‰±3.30 ‰) (Su et al., 2020), Beihuangcheng Island (8.2 ‰±6.2 ‰) (Zong et al., 2017), and Beijing (12.1 ‰±3.3 ‰) (Fan et al., 2022). Nevertheless, the δ15N–NO in this study was significantly higher than those from clean background regions, where NO was mainly from natural sources, such as the coast of Antarctica () (Savarino et al., 2007) and Bermuda ( warm season, cold season) (Hastings et al., 2003). The values of δ15N–NO in winter, spring, summer, and autumn were 5.6 ‰, 5.3 ‰, 4.4 ‰, and 4.5 ‰, respectively. The δ15N–NO in winter and summer showed significant difference (p<0.05). The values of δ15N–NO were influenced by atmospheric processes and emission sources (Elliott et al., 2009). For the N2O5 channel, NO is characterized by higher δ15N values (Freyer et al., 1993; Elliott et al., 2009). The N2O5 channel was the predominant formation pathway of NO in winter, which was in accordance with the seasonal variation in δ15N–NO. In addition, the difference in δ15N–NO reflected the variation in the emission source of NO. The δ15N–NOx from coal combustion was relatively high. In winter, the higher δ15N–NO was probably related to long-range transport from North China, where coal combustion enhanced during winter.
Source apportionment of NO
Based on the Bayesian mixing model coupled with δ15N–NO, NO sources were assigned as coal combustion 40.4 % ± 8.7 %, biomass burning 25.6 % ± 2.1 %, mobile sources (vehicles) 22.3 % ± 3.1 %, and microbial process 11.7 % ± 3.8 %. Figures 2b and S6 showed the source contribution of NO in Guangzhou and other regions in China, respectively. Compared to earlier periods (2013–2014), the concentration of NO from vehicles and coal combustion decreased significantly (Zong et al., 2020), which resulted from the stricter vehicle emission standard, promotion of new energy electric vehicles, and ultraclean transformation of coal combustion (Guangdong Province, 2014; http://www.gd.gov.cn/gkmlpt/content/0/142/5 mpost_142687.html, last access: 14 February 2014; Tang et al., 2019). However, almost all production and domestic segments rely on energy generated from coal combustion, which was still the dominant source of NO in 2017–2018. Coal combustion was affected not only by local emissions but also external air mass transmission. The contribution of coal combustion was higher in winter than in summer, which probably related to the long-range transportation from North China. Taking 10 January 2018 as an example, the contribution of coal combustion sources to NO was 67.5 %, and the corresponding air mass was from North China and transmitted to Guangzhou through high altitude. However, the air mass on 26 July 2017 was mainly from the South China Sea, which was transmitted through low altitude to Guangzhou. The contribution of coal burning to NO on 26 July 2017 was 28.5 % lower than that on 10 January 2018.
As a non-fossil combustion source, biomass burning was also an important source of NO and accounted for 25.6 %. The contribution of biomass burning and vehicles was stable throughout a year. Generally, high intensity biomass burning occurred in winter in the Guangdong province (dry season, i.e., from November to March) (Xu et al., 2019); K+ is a typical tracer of biomass burning. The concentration of K+ enhanced in winter (0.4 µg m−3) was higher than that in summer (0.2 µg m−3) and autumn (0.2 µg m−3), respectively, indicating enhancement of biomass burning intensity. Also, NO concentration of biomass burning remarkably enhanced in winter (1.2 µg m−3) and was higher than that in summer (0.4 µg m−3) and autumn (0.3 µg m−3), respectively. However, coal combustion also enhanced in winter due to the demand for heating in North China. Our sampling site was influenced by the air mass with a high coal combustion contribution from the north by long-range transportation, which may relatively reduce the contribution of biomass burning. Thus, the contribution of biomass burning showed stability compared with coal combustion. Another non-fossil source is related to soil microbial activity and only contributed 11.7 % to NO, which was unexpectedly lower than the results in earlier periods (2013–2014). Generally, the microorganisms in soil emit NO through nitrification or denitrification, which was affected by the amount of carbon and nitrogen nutrients in soil (Hall and Matson, 1996). In earlier periods, due to the higher level of aerosols, the amount of nutrients settling in soil was also higher, which was exemplified by the observation of dry and wet deposition in Guangzhou (He et al., 2022; Zheng et al., 2020). In addition, the reduction of cultivated land from 2013 to 2018 might also reduce the contribution of microbial source emissions. Therefore, emissions from natural sources were also influenced by human activities to some extent. The contribution of microbial processes was higher in summer than in winter. In summer, higher RH and temperature were favorable for the intense activity of soil microorganisms (Zong et al., 2017). The contributions of microbial processes to NO also decreased in winter compared with summer at regional background sites and five Chinese megacities, including Guangzhou (Zong et al., 2017, 2020).
The source comparisons between NO and NH were shown in Fig. 2c. Coal combustion, biomass burning, and vehicles were three significant sources of NO and NH. Coal combustion and biomass burning were the dominant sources of NO and NH, respectively. The vehicles were also an important source of atmospheric inorganic Nr that contributed to 22.3 % and 19.8 % of NO and NH, respectively. Recently, the government has actively taken many measures to reduce the pollution from vehicles, such as stricter automobile emission standards and the promotion of new energy vehicles. However, due to the large vehicle ownership base, the pollutants emitted from vehicles are not optimistic. In addition, vehicle emissions could contribute half of the fresh secondary organic aerosol in urban environments (Zhang et al., 2022; Zhao et al., 2022a).
A year-long field observation was conducted in Guangzhou to clarify the atmospheric fate of inorganic nitrogen aerosol. Inorganic nitrogen species were the most essential component of TN including NH (45.8 %) and NO (23.2 %), which are also dominant components of SIA and play a key role in China hazes. The δ15N is a powerful tool to quantify the source contribution of NH and NO, which suggested that anthropogenic combustion sources (coal combustion, biomass burning, and vehicles) were the dominant sources.
Anthropogenic combustion sources contributed 63.2 % to NH, which is more than the 23.6 % contribution from agricultural sources. Ammonia (NH3) largely facilitates the formation of sulfate and nitrate. Meanwhile, sulfate and nitrate promote each other with the positive feedback effect, which could trigger hazes. In megacities of China, the focus of NH3 reduction should be on anthropogenic combustion sources, especially on biomass burning, which might be responsible for the lag of the decline in the deposition of air pollutants behind the reduction in emission (Zhao et al., 2022b). In addition, anthropogenic combustion sources accounted for 88.3 % of NO. Coal combustion and vehicles contributed 40.4 % and 22.3 % to NO, respectively. Despite a series of measures to reduce emissions of NOx, fossil fuels, as the main energy source for production and living, will still inevitably emit a large amount of NOx. Our results emphasized that the emission of atmospheric inorganic nitrogen is largely related to anthropogenic combustion sources. The development and promotion of clean energy and efficient use of biomass are conducive to the deep reduction of atmospheric nitrogen.
The original data of this research (stable nitrogen isotopes and inorganic nitrogen concentrations) are available at Mendeley data (https://doi.org/10.17632/yck5xy22w2.1; Li and Li, 2023). The IsoSource model was downloaded from the Environmental Protection Agency via their website: https://www.epa.gov/sites/default/files/2015-11/isosourcev1_3_1.zip (last access: 24 August 2022; Phillips and Gregg, 2003).
The supplement related to this article is available online at: https://doi.org/10.5194/acp-23-6395-2023-supplement.
Funding acquisition: JL. Investigation: TL, ZS, and HJ. Methodology: TL, ZS, HJ, JL, and CT. Project administration: JL. Resources: JL, CT, and GZ. Software: TL, ZS, and CT. Validation: TL and JL. Writing – original draft: TL. Writing – review and editing: JL.
The contact author has declared that none of the authors has any competing interests.
Publisher’s note: Copernicus Publications remains neutral with regard to jurisdictional claims in published maps and institutional affiliations.
This study was supported by the Natural Science Foundation of China (NSFC; grant no. 41977177), the Basic and Applied Basic Research Foundation of Guangdong Province (grant no. 2021A1515011456), and the Guangdong Science and Technology Innovation Foundation (grant nos. 2017BT01Z134 and 2020B1212060053).
This paper was edited by Katye Altieri and reviewed by Xueyan Liu and one anonymous referee.
Action Plan for Air Pollution Control of Guangdong Province (2014–2017): http://www.gd.gov.cn/gkmlpt/content/0/142/mpost_142687.html, last access: 14 February 2014.
Baskaran, M., Michalski, G., Bhattacharya, S. K., and Mase, D. F.: Oxygen isotope dynamics of atmospheric nitrate and its precursor molecules, in: Handbook of Environmental Isotope Geochemistry, Springer-Verlag Berlin Heidelberg, 613–635, 2011.
Bhattarai, H., Zhang, Y. L., Pavuluri, C. M., Wan, X., Wu, G., Li, P., Cao, F., Zhang, W., Wang, Y., Kang, S., Ram, K., Kawamura, K., Ji, Z., Widory, D., and Cong, Z.: Nitrogen speciation and isotopic composition of aerosols collected at Himalayan Forest (3326 m a.s.l.): seasonality, sources, and implications, Environ. Sci. Technol., 53, 12247–12256, https://doi.org/10.1021/acs.est.9b03999, 2019.
Bhattarai, N., Wang, S., Xu, Q., Dong, Z., Chang, X., Jiang, Y., and Zheng, H.: Sources of gaseous NH3 in urban Beijing from parallel sampling of NH3 and NH, their nitrogen isotope measurement and modeling, Sci. Total Environ., 747, 141361, https://doi.org/10.1016/j.scitotenv.2020.141361, 2020.
Bhattarai, N., Wang, S., Pan, Y., Xu, Q., Zhang, Y., Chang, Y., and Fang, Y.: δ15N-stable isotope analysis of NHx: An overview on analytical measurements, source sampling and its source apportionment, Front. Environ. Sci. Eng., 15, 126, https://doi.org/10.1007/s11783-021-1414-6, 2021.
Breemen, N. V.: Nitrogen cycle natural organic tendency, Nature, 415, 381–382, https://doi.org/10.1038/415381a, 2002.
Chang, Y., Liu, X., Deng, C., Dore, A. J., and Zhuang, G.: Source apportionment of atmospheric ammonia before, during, and after the 2014 APEC summit in Beijing using stable nitrogen isotope signatures, Atmos. Chem. Phys., 16, 11635–11647, https://doi.org/10.5194/acp-16-11635-2016, 2016.
Chen, Z., Pei, C., Liu, J., Zhang, X., Ding, P., Dang, L., Zong, Z., Jiang, F., Wu, L., Sun, X., Zhou, S., Zhang, Y., Zhang, Z., Zheng, J., Tian, C., Li, J., and Zhang, G.: Non-agricultural source dominates the ammonium aerosol in the largest city of South China based on the vertical δ15N measurements, Sci. Total Environ., 848, 157750, https://doi.org/10.1016/j.scitotenv.2022.157750, 2022a.
Chen, Z. L., Song, W., Hu, C. C., Liu, X. J., Chen, G. Y., Walters, W. W., Michalski, G., Liu, C. Q., Fowler, D., and Liu, X. Y.: Significant contributions of combustion-related sources to ammonia emissions, Nat. Commun., 13, 7710, https://doi.org/10.1038/s41467-022-35381-4, 2022b.
Cui, M., Chen, Y., Zheng, M., Li, J., Tang, J., Han, Y., Song, D., Yan, C., Zhang, F., Tian, C., and Zhang, G.: Emissions and characteristics of particulate matter from rainforest burning in the Southeast Asia, Atmos. Environ., 191, 194–204, https://doi.org/10.1016/j.atmosenv.2018.07.062, 2018.
Dunne, E. M., Gordon, H., Kürten, A., Almeida, J., Duplissy, J., Williamson, C., Ortega, I. K., Pringle, K. J., Adamov, A., and Schobesberger, S.: Global atmospheric particle formation from cern cloud measurements, Science, 354, 1119–1123, https://doi.org/10.1126/science.aaf2649, 2016.
Elliott, E. M., Kendall, C., Wankel, S. D., Burns, D. A., Boyer, E. W., Harlin, K., Bain, D. J., and Butler, T. J.: Nitrogen isotopes as indicators of NOx source contributions to atmospheric nitrate deposition across the midwestern and Northeastern United States, Environ. Sci. Technol., 41, 7661–7667, https://doi.org/10.1021/es070898t, 2007.
Elliott, E. M., Kendall, C., Boyer, E. W., Burns, D. A., Lear, G. G., Golden, H. E., Harlin, K., Bytnerowicz, A., Butler, T. J., and Glatz, R.: Dual nitrate isotopes in dry deposition: Utility for partitioning NOx source contributions to landscape nitrogen deposition, J. Geophys. Res., 114, G04020, https://doi.org/10.1029/2008JG000889, 2009.
Fan, M. Y., Zhang, Y. L., Lin, Y. C., Cao, F., Zhao, Z. Y., Sun, Y., Qiu, Y., Fu, P., and Wang, Y.: Changes of emission sources to nitrate aerosols in Beijing after the clean air actions: evidence from dual isotope compositions, J. Geophys. Res.-Atmos., 125, 031998, https://doi.org/10.1029/2019jd031998, 2020.
Fan, M.-Y., Zhang, Y.-L., Hong, Y., Lin, Y.-C., Zhao, Z.-Y., Cao, F., Sun, Y., Guo, H., and Fu, P.: Vertical differences of nitrate sources in urban boundary layer based on tower measurements, Environ. Sci. Technol. Lett., 9, 2c00600, https://doi.org/10.1021/acs.estlett.2c00600, 2022.
Fang, Y. T., Koba, K., Wang, X. M., Wen, D. Z., Li, J., Takebayashi, Y., Liu, X. Y., and Yoh, M.: Anthropogenic imprints on nitrogen and oxygen isotopic composition of precipitation nitrate in a nitrogen-polluted city in southern China, Atmos. Chem. Phys., 11, 1313–1325, https://doi.org/10.5194/acp-11-1313-2011, 2011.
Felix, J. D. and Elliott, E. M.: The agricultural history of human-nitrogen interactions as recorded in ice core δ15N-NO, Geophys. Res. Lett., 40, 1642–1646, https://doi.org/10.1002/grl.50209, 2013.
Felix, J. D., Elliott, E. M., and Shaw, S. L.: Nitrogen isotopic composition of coal-fired power plant NOx: influence of emission controls and implications for global emission inventories, Environ. Sci. Technol., 46, 3528–3535, https://doi.org/10.1021/es203355v, 2012.
Felix, J. D., Elliott, E. M., Gish, T. J., McConnell, L. L., and Shaw, S. L.: Characterizing the isotopic composition of atmospheric ammonia emission sources using passive samplers and a combined oxidation-bacterial denitrifier approach, Rapid Commun. Mass Spectrom., 27, 2239–2246, https://doi.org/10.1002/rcm.6679, 2013.
Felix, J. D., Elliott, E. M., Avery, G. B., Kieber, R. J., Mead, R. N., Willey, J. D., and Mullaugh, K. M.: Isotopic composition of nitrate in sequential Hurricane Irene precipitation samples: Implications for changing NOx sources, Atmos. Environ., 106, 191–195, https://doi.org/10.1016/j.atmosenv.2015.01.075, 2015.
Fibiger, D. L. and Hastings, M. G.: First Measurements of the Nitrogen Isotopic Composition of NOx from Biomass Burning, Environ. Sci. Technol., 50, 11569–11574, https://doi.org/10.1021/acs.est.6b03510, 2016.
Freyer, H. D., Kley, D., Volz-Thomas, A., and Kobel, K.: On the interaction of isotopic exchange processes with photochemical reactions in atmospheric oxides of nitrogen, J. Geophys. Res., 98, 14791–714796, https://doi.org/10.1029/93JD00874, 1993.
Fu, X., Wang, S., Xing, J., Zhang, X., Wang, T., and Hao, J.: Increasing ammonia concentrations reduce the effectiveness of particle pollution control achieved via SO2 and NOX emissions reduction in East China, Environ. Sci. Technol. Lett., 4, 221–227, https://doi.org/10.1021/acs.estlett.7b00143, 2017.
Galloway, J. N., Dentener, F. J., Capone, D. G., Boyer, E. W., Howarth, R. W., Seitzinger, S. P., Asner, G. P., Cleveland, C. C., Green, P. A., Holland, E. A., Karl, D. M., Michaels, A. F., Porter, J. H., Townsend, A. R., and Vörösmarty, C. J.: Nitrogen cycles past present and future, Biogeochemistry, 70, 153–226, https://doi.org/10.1007/s10533-004-0370-0, 2004.
Gobel, A. R., Altieri, K. E., Peters, A. J., Hastings, M. G., and Sigman, D. M.: Insights into anthropogenic nitrogen deposition to the North Atlantic investigated using the isotopic composition of aerosol and rainwater nitrate, Geophys. Res. Lett., 40, 5977–5982, https://doi.org/10.1002/2013gl058167, 2013.
Hall, S. J. and Matson, P. A.: NOx emissions from soil: implications for air quality modeling in agricultural regions, Annu. Rev. Energy Environ., 21, 311–346, https://doi.org/10.1146/annurev.energy.21.1.311, 1996.
Hastings, M. G., Sigman, D. M., and Lipschultz, F.: Isotopic evidence for source changes of nitrate in rain at Bermuda, J. Geophys. Res.-Atmos., 108, 1–12, https://doi.org/10.1029/2003jd003789, 2003.
He, S., Huang, M., Zheng, L., Chang, M., Chen, W., Xie, Q., and Wang, X.: Seasonal variation of transport pathways and potential source areas at high inorganic nitrogen wet deposition sites in southern China, J. Environ. Sci. (China), 114, 444–453, https://doi.org/10.1016/j.jes.2021.12.024, 2022.
Heaton, T. H. E., Spiro, B., and Robertson, S. M. C.: Potential canopy influences on the isotopic composition of nitrogen and sulphur in atmospheric deposition, Oecologia, 109, 600–607, 1997.
Heeb, N. V., Forss, A.-M., Brühlmann, S., Lüscher, R., Saxer, C. J., and Hug, P.: Three-way catalyst-induced formation of ammonia-velocity- and acceleration-dependent emission factors, Atmos. Environ., 40, 5986–5997, https://doi.org/10.1016/j.atmosenv.2005.12.035, 2006.
Hodas, N., Sullivan, A. P., Skog, K., Keutsch, F. N., Collett Jr., J. L., Decesari, S., Facchini, M. C., Carlton, A. G., Laaksonen, A., and Turpin, B. J.: Aerosol liquid water driven by anthropogenic nitrate: implications for lifetimes of water-soluble organic gases and potential for secondary organic aerosol formation, Environ. Sci. Technol., 48, 11127–11136, https://doi.org/10.1021/es5025096, 2014.
Holland, E. A., Dentener, F. J., Braswell, B. H., and Sulzman, J. M.: Contemporary and pre-industrial global reactive nitrogen budgets, Biogeochemistry, 46, 7–43, https://doi.org/10.1007/BF01007572, 1999.
Huang, S., Elliott, E. M., Felix, J. D., Pan, Y., Liu, D., Li, S., Li, Z., Zhu, F., Zhang, N., Fu, P., and Fang, Y.: Seasonal pattern of ammonium 15N natural abundance in precipitation at a rural forested site and implications for NH3 source partitioning, Environ. Pollut., 247, 541–549, https://doi.org/10.1016/j.envpol.2019.01.023, 2019.
Huang, Z., Wang, S., Zheng, J., Yuan, Z., Ye, S., and Kang, D.: Modeling inorganic nitrogen deposition in Guangdong province, China, Atmos. Environ., 109, 147–160, https://doi.org/10.1016/j.atmosenv.2015.03.014, 2015.
Jiang, H., Li, J., Sun, R., Tian, C., Tang, J., Jiang, B., Liao, Y., Chen, C., and Zhang, G.: Molecular dynamics and light absorption properties of atmospheric dissolved organic matter, Environ. Sci. Technol., 55, 10268–10279, https://doi.org/10.1021/acs.est.1c01770, 2021a.
Jiang, H., Li, J., Sun, R., Liu, G., Tian, C., Tang, J., Cheng, Z., Zhu, S., Zhong, G., Ding, X., and Zhang, G.: Determining the sources and transport of brown carbon using radionuclide tracers and modeling, J. Geophys. Res.-Atmos., 126, e2021JD034616, https://doi.org/10.1029/2021jd034616, 2021b.
Johnston, J. C. and Thiemens, M. H.: The isotopic composition of tropospheric ozone in three environments, J. Geophys. Res.-Atmos., 102, 25395–25404, https://doi.org/10.1029/97jd02075, 1997.
Kang, Y., Liu, M., Song, Y., Huang, X., Yao, H., Cai, X., Zhang, H., Kang, L., Liu, X., Yan, X., He, H., Zhang, Q., Shao, M., and Zhu, T.: High-resolution ammonia emissions inventories in China from 1980 to 2012, Atmos. Chem. Phys., 16, 2043–2058, https://doi.org/10.5194/acp-16-2043-2016, 2016.
Kawashima, H. and Kurahashi, T.: Inorganic ion and nitrogen isotopic compositions of atmospheric aerosols at Yurihonjo, Japan: implications for nitrogen sources, Atmos. Environ., 45, 6309–6316, https://doi.org/10.1016/j.atmosenv.2011.08.057, 2011.
Kundu, S., Kawamura, K., and Lee, M.: Seasonal variation of the concentrations of nitrogenous species and their nitrogen isotopic ratios in aerosols at Gosan, Jeju Island: Implications for atmospheric processing and source changes of aerosols, J. Geophys. Res., 115, D20305, https://doi.org/10.1029/2009jd013323, 2010.
Li, T. and Li, J.: High contribution of anthropogenic combustion sources to atmospheric inorganic reactive nitrogen in south China evidenced by isotopes, Mendeley data [data set], https://doi.org/10.17632/yck5xy22w2.1, 2023.
Li, X. H. and Wang, S. X.: Particulate and trace gas emissions from open burning of wheat straw and corn stover in China, Environ. Sci. Technol., 41, 6052–6058, https://doi.org/10.1021/es0705137, 2007.
Liao, B., Wu, D., Chang, Y., Lin, Y., Wang, S., and Li, F.: Characteristics of particulate SO, NO, NH, and related gaseous pollutants in Guangzhou (in Chinese), Acta Sci. Circumst., 34, 1551–1559, https://doi.org/10.13671/j.hjkxxb.2014.0218, 2014.
Liu, J., Ding, P., Zong, Z., Li, J., Tian, C., Chen, W., Chang, M., Salazar, G., Shen, C., Cheng, Z., Chen, Y., Wang, X., Szidat, S., and Zhang, G.: Evidence of rural and suburban sources of urban haze formation in China: a case study from the Pearl River Delta region, J. Geophys. Res.-Atmos., 123, 4712–4726, https://doi.org/10.1029/2017jd027952, 2018.
Liu, T., Wang, X., Wang, B., Ding, X., Deng, W., Lü, S., and Zhang, Y.: Emission factor of ammonia (NH3) from on-road vehicles in China: tunnel tests in urban Guangzhou, Environ. Res. Lett., 9, 064027, https://doi.org/10.1088/1748-9326/9/6/064027, 2014.
Liu, Y., Zhang, Y., Lian, C., Yan, C., Feng, Z., Zheng, F., Fan, X., Chen, Y., Wang, W., Chu, B., Wang, Y., Cai, J., Du, W., Daellenbach, K. R., Kangasluoma, J., Bianchi, F., Kujansuu, J., Petäjä, T., Wang, X., Hu, B., Wang, Y., Ge, M., He, H., and Kulmala, M.: The promotion effect of nitrous acid on aerosol formation in wintertime in Beijing: the possible contribution of traffic-related emissions, Atmos. Chem. Phys., 20, 13023–13040, https://doi.org/10.5194/acp-20-13023-2020, 2020.
Liu, Y., Feng, Z., Zheng, F., Bao, X., Liu, P., Ge, Y., Zhao, Y., Jiang, T., Liao, Y., Zhang, Y., Fan, X., Yan, C., Chu, B., Wang, Y., Du, W., Cai, J., Bianchi, F., Petäjä, T., Mu, Y., He, H., and Kulmala, M.: Ammonium nitrate promotes sulfate formation through uptake kinetic regime, Atmos. Chem. Phys., 21, 13269–13286, https://doi.org/10.5194/acp-21-13269-2021, 2021.
Martinellia, L. A., Camargoa, P. B., Laraa, L. B. L. S., Victoriaa, R. L., and Artaxo, P.: Stable carbon and nitrogen isotopic composition of bulk aerosol particles in a C4 plant landscape of southeast Brazil, Atmos. Environ., 36, 2427–2432, https://doi.org/10.1016/S1352-2310(01)00454-X, 2002.
Meng, W., Zhong, Q., Yun, X., Zhu, X., Huang, T., Shen, H., Chen, Y., Chen, H., Zhou, F., Liu, J., Wang, X., Zeng, E. Y., and Tao, S.: Improvement of a global high-resolution ammonia emission inventory for combustion and industrial sources with new data from the residential and transportation sectors, Environ. Sci. Technol., 51, 2821–2829, https://doi.org/10.1021/acs.est.6b03694, 2017.
Meng, Z., Xu, X., Lin, W., Ge, B., Xie, Y., Song, B., Jia, S., Zhang, R., Peng, W., Wang, Y., Cheng, H., Yang, W., and Zhao, H.: Role of ambient ammonia in particulate ammonium formation at a rural site in the North China Plain, Atmos. Chem. Phys., 18, 167–184, https://doi.org/10.5194/acp-18-167-2018, 2018.
Michalski, G., Bhattacharya, S. K., and Girsch, G.: NOx cycle and the tropospheric ozone isotope anomaly: an experimental investigation, Atmos. Chem. Phys., 14, 4935–4953, https://doi.org/10.5194/acp-14-4935-2014, 2014.
Pan, Y., Tian, S., Liu, D., Fang, Y., Zhu, X., Zhang, Q., Zheng, B., Michalski, G., and Wang, Y.: Fossil fuel combustion-related emissions dominate atmospheric ammonia sources during severe haze episodes: evidence from 15N-stable isotope in size-resolved aerosol ammonium, Environ. Sci. Technol., 50, 8049–8056, https://doi.org/10.1021/acs.est.6b00634, 2016.
Pan, Y., Tian, S., Liu, D., Fang, Y., Zhu, X., Gao, M., Gao, J., Michalski, G., and Wang, Y.: Isotopic evidence for enhanced fossil fuel sources of aerosol ammonium in the urban atmosphere, Environ. Pollut., 238, 942–947, https://doi.org/10.1016/j.envpol.2018.03.038, 2018a.
Pan, Y., Tian, S., Liu, D., Fang, Y., Zhu, X., Gao, M., Wentworth, G. R., Michalski, G., Huang, X., and Wang, Y.: Source Apportionment of Aerosol Ammonium in an Ammonia-Rich Atmosphere: An Isotopic Study of Summer Clean and Hazy Days in Urban Beijing, J. Geophys. Res.-Atmos., 123, 5681–5689, https://doi.org/10.1029/2017jd028095, 2018b.
Pan, Y., Gu, M., He, Y., Wu, D., Liu, C., Song, L., Tian, S., Lü, X., Sun, Y., Song, T., Walters, W. W., Liu, X., Martin, N. A., Zhang, Q., Fang, Y., Ferracci, V., and Wang, Y.: Revisiting the concentration observations and source apportionment of atmospheric ammonia, Adv. Atmos. Sci., 37, 933–938, https://doi.org/10.1007/s00376-020-2111-2, 2020.
Phillips, D. L. and Gregg, J. W.: Source partitioning using stable isotopes: coping with too many sources, Oecologia, 136, 261–269, https://doi.org/10.1007/s00442-003-1218-3, 2003.
Phillips, D. L., Newsome, S. D., and Gregg, J. W.: Combining sources in stable isotope mixing models: alternative methods, Oecologia, 144, 520–527, https://doi.org/10.1007/s00442-004-1816-8, 2005.
Qu, K., Wang, X., Xiao, T., Shen, J., Lin, T., Chen, D., He, L. Y., Huang, X. F., Zeng, L., Lu, K., Ou, Y., and Zhang, Y.: Cross-regional transport of PM2.5 nitrate in the Pearl River Delta, China: Contributions and mechanisms, Sci. Total Environ., 753, 142439, https://doi.org/10.1016/j.scitotenv.2020.142439, 2021.
Savarino, J., Kaiser, J., Morin, S., Sigman, D. M., and Thiemens, M. H.: Nitrogen and oxygen isotopic constraints on the origin of atmospheric nitrate in coastal Antarctica, Atmos. Chem. Phys., 7, 1925–1945, https://doi.org/10.5194/acp-7-1925-2007, 2007.
Song, W., Liu, X. Y., Hu, C. C., Chen, G. Y., Liu, X. J., Walters, W. W., Michalski, G., and Liu, C. Q.: Important contributions of non-fossil fuel nitrogen oxides emissions, Nat. Commun., 12, 243, https://doi.org/10.1038/s41467-020-20356-0, 2021.
Song, Y., Dai, W., Wang, X., Cui, M., Su, H., Xie, S., and Zhang, Y.: Identifying dominant sources of respirable suspended particulates in Guangzhou, China, Environ. Eng. Sci., 25, 959–968, https://doi.org/10.1089/ees.2007.0146, 2008.
Su, T., Li, J., Tian, C., Zong, Z., Chen, D., and Zhang, G.: Source and formation of fine particulate nitrate in South China: Constrained by isotopic modeling and online trace gas analysis, Atmos. Environ., 231, 117563, https://doi.org/10.1016/j.atmosenv.2020.117563, 2020.
Sun, X., Zong, Z., Li, Q., Shi, X., Wang, K., Lu, L., Li, B., Qi, H., and Tian, C.: Assessing the emission sources and reduction potential of atmospheric ammonia at an urban site in Northeast China, Environ. Res., 198, 111230, https://doi.org/10.1016/j.envres.2021.111230, 2021.
Tan, Z., Lu, K., Jiang, M., Su, R., Wang, H., Lou, S., Fu, Q., Zhai, C., Tan, Q., Yue, D., Chen, D., Wang, Z., Xie, S., Zeng, L., and Zhang, Y.: Daytime atmospheric oxidation capacity in four Chinese megacities during the photochemically polluted season: a case study based on box model simulation, Atmos. Chem. Phys., 19, 3493–3513, https://doi.org/10.5194/acp-19-3493-2019, 2019.
Tang, L., Qu, J., Mi, Z., Bo, X., Chang, X., Anadon, L. D., Wang, S., Xue, X., Li, S., Wang, X., and Zhao, X.: Substantial emission reductions from Chinese power plants after the introduction of ultra-low emissions standards, Nat. Energy, 4, 929–938, https://doi.org/10.1038/s41560-019-0468-1, 2019.
Urey, H. C.: The thermodynamic properties of isotopic substances, J. Chem. Soc., Apr., 562–581, https://doi.org/10.1039/jr9470000562, 1947.
Walters, W. W. and Michalski, G.: Theoretical calculation of oxygen equilibrium isotope fractionation factors involving various NOy molecules, OH, and H2O and its implications for isotope variations in atmospheric nitrate, Geochim. Cosmochim. Ac., 191, 89–101 https://doi.org/10.1016/j.gca.2016.06.039, 2016.
Walters, W. W., Tharp, B. D., Fang, H., Kozak, B. J., and Michalski, G.: Nitrogen Isotope Composition of Thermally Produced NOx from Various Fossil-Fuel Combustion Sources, Environ. Sci. Technol., 49, 11363–11371, https://doi.org/10.1021/acs.est.5b02769, 2015.
Walters, W. W., Simonini, D. S., and Michalski, G.: Nitrogen isotope exchange between NO and NO2 and its implications for δ15N variations in tropospheric NOx and atmospheric nitrate, Geophys. Res. Lett., 43, 440–448, https://doi.org/10.1002/2015gl066438, 2016.
Walters, W. W., Song, L., Chai, J., Fang, Y., Colombi, N., and Hastings, M. G.: Characterizing the spatiotemporal nitrogen stable isotopic composition of ammonia in vehicle plumes, Atmos. Chem. Phys., 20, 11551–11567, https://doi.org/10.5194/acp-20-11551-2020, 2020.
Wang, C., Duan, J., Ren, C., Liu, H., Reis, S., Xu, J., and Gu, B.: Ammonia emissions from croplands decrease with farm size in China, Environ. Sci. Technol., 56, 9915–9923, https://doi.org/10.1021/acs.est.2c01061, 2022.
Wang, T., Xue, L., Brimblecombe, P., Lam, Y. F., Li, L., and Zhang, L.: Ozone pollution in China: a review of concentrations, meteorological influences, chemical precursors, and effects, Sci. Total Environ., 575, 1582–1596, https://doi.org/10.1016/j.scitotenv.2016.10.081, 2017.
Wang, X., Carmichael, G., Chen, D., Tang, Y., and Wang, T.: Impacts of different emission sources on air quality during March 2001 in the Pearl River Delta (PRD) region, Atmos. Environ., 39, 5227–5241, https://doi.org/10.1016/j.atmosenv.2005.04.035, 2005.
Wang, X., Wu, Z., Shao, M., Fang, Y., Zhang, L., Chen, F., Chan, P.-w., Fan, Q., Wang, Q., Zhu, S., and Bao, R.: Atmospheric nitrogen deposition to forest and estuary environments in the Pearl River Delta region, southern China, Tellus B: Chem. Phys. Meteorol., 65, 20480, https://doi.org/10.3402/tellusb.v65i0.20480, 2013.
Wedin, D. A. and Tilman, D.: Influence of nitrogen loading and species composition on the carbon balance of grasslands, Science, 274, 1720–1723, https://doi.org/10.1126/science.274.5293.1720, 1996.
Wu, L., Ren, H., Wang, P., Chen, J., Fang, Y., Hu, W., Ren, L., Deng, J., Song, Y., Li, J., Sun, Y., Wang, Z., Liu, C.-Q., Ying, Q., and Fu, P.: Aerosol ammonium in the urban boundary layer in Beijing: insights from nitrogen isotope ratios and simulations in summer 2015, Environ. Sci. Technol. Lett., 6, 389–395, https://doi.org/10.1021/acs.estlett.9b00328, 2019.
Xiang, Y.-K., Dao, X., Gao, M., Lin, Y.-C., Cao, F., Yang, X.-Y., and Zhang, Y.-L.: Nitrogen isotope characteristics and source apportionment of atmospheric ammonium in urban cities during a haze event in Northern China Plain, Atmos. Environ., 269, 118800, https://doi.org/10.1016/j.atmosenv.2021.118800, 2022.
Xiao, H. W., Wu, J. F., Luo, L., Liu, C., Xie, Y. J., and Xiao, H. Y.: Enhanced biomass burning as a source of aerosol ammonium over cities in central China in autumn, Environ. Pollut., 266, 115278, https://doi.org/10.1016/j.envpol.2020.115278, 2020.
Xu, Y., Huang, Z., Jia, G., Fan, M., Cheng, L., Chen, L., Shao, M., and Zheng, J.: Regional discrepancies in spatiotemporal variations and driving forces of open crop residue burning emissions in China, Sci. Total Environ., 671, 536–547, https://doi.org/10.1016/j.scitotenv.2019.03.199, 2019.
Yang, Y., Li, P., He, H., Zhao, X., Datta, A., Ma, W., Zhang, Y., Liu, X., Han, W., Wilson, M. C., and Fang, J.: Long-term changes in soil pH across major forest ecosystems in China, Geophys. Res. Lett., 42, 933–940, https://doi.org/10.1002/2014gl062575, 2015.
Yu, X., Shen, L., Hou, X., Yuan, L., Pan, Y., An, J., and Yan, S.: High-resolution anthropogenic ammonia emission inventory for the Yangtze River Delta, China, Chemosphere, 251, 126342, https://doi.org/10.1016/j.chemosphere.2020.126342, 2020.
Zhang, Z., Zeng, Y., Zheng, N., Luo, L., Xiao, H., and Xiao, H.: Fossil fuel-related emissions were the major source of NH3 pollution in urban cities of northern China in the autumn of 2017, Environ. Pollut., 256, 113428, https://doi.org/10.1016/j.envpol.2019.113428, 2020.
Zhang, Z., Zhu, W., Hu, M., Wang, H., Tang, L., Hu, S., Shen, R., Yu, Y., Song, K., Tan, R., Chen, Z., Chen, S., Canonaco, F., Prevot, A. S. H., and Guo, S.: Secondary organic aerosol formation in China from urban-lifestyle sources: Vehicle exhaust and cooking emission, Sci. Total Environ., 857, 159340, https://doi.org/10.1016/j.scitotenv.2022.159340, 2022.
Zhao, Y., Tkacik, D. S., May, A. A., Donahue, N. M., and Robinson, A. L.: Mobile sources are still an important source of secondary organic aerosol and fine particulate matter in the los angeles region, Environ. Sci. Technol., 56, 15328–15336, https://doi.org/10.1021/acs.est.2c03317, 2022a.
Zhao, Y., Xi, M., Zhang, Q., Dong, Z., Ma, M., Zhou, K., Xu, W., Xing, J., Zheng, B., Wen, Z., Liu, X., Nielsen, C. P., Liu, Y., Pan, Y., and Zhang, L.: Decline in bulk deposition of air pollutants in China lags behind reductions in emissions, Nat. Geosci., 15, 190–195, https://doi.org/10.1038/s41561-022-00899-1, 2022b.
Zheng, L., Chen, W., Jia, S., Wu, L., Zhong, B., Liao, W., Chang, M., Wang, W., and Wang, X.: Temporal and spatial patterns of nitrogen wet deposition in different weather types in the Pearl River Delta (PRD), China, Sci. Total Environ., 740, 139936, https://doi.org/10.1016/j.scitotenv.2020.139936, 2020.
Zhu, J., He, N., Wang, Q., Yuan, G., Wen, D., Yu, G., and Jia, Y.: The composition, spatial patterns, and influencing factors of atmospheric wet nitrogen deposition in Chinese terrestrial ecosystems, Sci. Total Environ., 511, 777–785, https://doi.org/10.1016/j.scitotenv.2014.12.038, 2015.
Zong, Z., Wang, X., Tian, C., Chen, Y., Fang, Y., Zhang, F., Li, C., Sun, J., Li, J., and Zhang, G.: First assessment of NOx sources at a regional background site in North China using isotopic analysis linked with modeling, Environ. Sci. Technol., 51, 5923–5931, https://doi.org/10.1021/acs.est.6b06316, 2017.
Zong, Z., Tan, Y., Wang, X., Tian, C., Li, J., Fang, Y., Chen, Y., Cui, S., and Zhang, G.: Dual-modelling-based source apportionment of NOx in five Chinese megacities: providing the isotopic footprint from 2013 to 2014, Environ. Int., 137, 105592, https://doi.org/10.1016/j.envint.2020.105592, 2020.
Zong, Z., Shi, X., Sun, Z., Tian, C., Li, J., Fang, Y., Gao, H., and Zhang, G.: Nitrogen isotopic composition of NOx from residential biomass burning and coal combustion in North China, Environ. Pollut., 304, 119238, https://doi.org/10.1016/j.envpol.2022.119238, 2022.