the Creative Commons Attribution 4.0 License.
the Creative Commons Attribution 4.0 License.
 | 22 May 2023
Impact of HO2 aerosol uptake on radical levels and O3 production during summertime in Beijing
Joanna E. Dyson
Lisa K. Whalley
Eloise J. Slater
Robert Woodward-Massey
Chunxiang Ye
James D. Lee
Freya Squires
James R. Hopkins
Rachel E. Dunmore
Marvin Shaw
Jacqueline F. Hamilton
Alastair C. Lewis
Stephen D. Worrall
Asan Bacak
Archit Mehra
Thomas J. Bannan
Carl J. Percival
Bin Ouyang
C. Nicholas Hewitt
Roderic L. Jones
Leigh R. Crilley
Louisa J. Kramer
W. Joe F. Acton
William J. Bloss
Supattarachai Saksakulkrai
Jingsha Xu
Zongbo Shi
Roy M. Harrison
Simone Kotthaus
Sue Grimmond
Weiqi Xu
Siyao Yue
Lianfang Wei
Pingqing Fu
Xinming Wang
Stephen R. Arnold
The impact of heterogeneous uptake of HO2 on aerosol surfaces on radical concentrations and the O3 production regime in Beijing in summertime was investigated. The uptake coefficient of HO2 onto aerosol surfaces, , was calculated for the AIRPRO campaign in Beijing, in summer 2017, as a function of measured aerosol soluble copper concentration, [Cu2+]eff, aerosol liquid water content, [ALWC], and particulate matter concentration, [PM]. An average across the entire campaign of 0.070±0.035 was calculated, with values ranging from 0.002 to 0.15, and found to be significantly lower than the value of , commonly used in modelling studies. Using the calculated values for the summer AIRPRO campaign, OH, HO2 and RO2 radical concentrations were modelled using a box model incorporating the Master Chemical Mechanism (v3.3.1), with and without the addition of , and compared to the measured radical concentrations. The rate of destruction analysis showed the dominant HO2 loss pathway to be HO2 + NO for all NO concentrations across the summer Beijing campaign, with HO2 uptake contributing <0.3 % to the total loss of HO2 on average. This result for Beijing summertime would suggest that under most conditions encountered, HO2 uptake onto aerosol surfaces is not important to consider when investigating increasing O3 production with decreasing [PM] across the North China Plain. At low [NO], however, i.e. <0.1 ppb, which was often encountered in the afternoons, up to 29 % of modelled HO2 loss was due to HO2 uptake on aerosols when calculated was included, even with the much lower values compared to 0.2, a result which agrees with the aerosol-inhibited O3 regime recently proposed by Ivatt et al. (2022). As such it can be concluded that in cleaner environments, away from polluted urban centres where HO2 loss chemistry is not dominated by NO but where aerosol surface area is high still, changes in PM concentration and hence aerosol surface area could still have a significant effect on both overall HO2 concentration and the O3 production regime.
Using modelled radical concentrations, the absolute O3 sensitivity to NOx and volatile organic compounds (VOCs) showed that, on average across the summer AIRPRO campaign, the O3 production regime remained VOC-limited, with the exception of a few days in the afternoon when the NO mixing ratio dropped low enough for the O3 regime to shift towards being NOx-limited. The O3 sensitivity to VOCs, the dominant regime during the summer AIRPRO campaign, was observed to decrease and shift towards a NOx-sensitive regime both when NO mixing ratio decreased and with the addition of aerosol uptake. This suggests that if [NOx] continues to decrease in the future, ozone reduction policies focussing solely on NOx reductions may not be as efficient as expected if [PM] and, hence, HO2 uptake to aerosol surfaces continue to decrease. The addition of aerosol uptake into the model, for both the calculated from measured data and when using a fixed value of , did not have a significant effect on the overall O3 production regime across the campaign. While not important for this campaign, aerosol uptake could be important for areas of lower NO concentration that are already in a NOx-sensitive regime.
- Article
(9189 KB) - Full-text XML
-
Supplement
(1474 KB) - BibTeX
- EndNote


Climate change and air quality are two significant environmental issues faced by society today, with the drive to net zero emissions by 2050 becoming increasingly important to remain consistent with the long-term anthropogenic temperature warming outcome of below 1.5 ∘C as set out by the Paris Agreement in 2016. Increasing anthropogenic emissions have caused not only an increase in atmospheric warming but also a deterioration in atmospheric air quality: a concern due to both short- and long-term negative health effects seen as a product of poor air quality such as respiratory and cardiovascular diseases and cancer (Brauer et al., 2016; Gakidou et al., 2017), in addition to a variety of negative effects on the environment such as increased soil acidification and the ensuing damage to vegetation and crop yield as a by-product of increasing acidity of rain (Forster et al., 2007).
Ambient air pollution has become a serious issue globally, specifically in large urban areas effected by anthropogenic emission sources. Due to rapid industrialization, Chinese megacities in particular face significant environmental and health challenges from the decline in air quality following urbanization, with areas such as the Beijing–Tianjin–Hebei area in the North China Plain (NCP) suffering from seasonal extreme pollution episodes as a consequence (Wang, 2021; Jin et al., 2016). In terms of human health, the most important pollutants in many regions are ground-level O3, NOx (NO2 and NO) and particulate matter. Nitrogen dioxide (NO2) can be directly emitted into the atmosphere from high-temperature combustion sources or can be formed via the reaction of nitrogen monoxide (NO) with an oxidizing species in the troposphere, such as HO2, leading to the formation of the hydroxyl radical (OH) (Ye et al., 2017). Ozone, while vital in the stratosphere to protect the earth from harmful UV radiation and excessive planetary heating, is toxic to both plant and human life at ground level and can react with NO to form NO2. Particulate matter is emitted anthropogenically and biogenically and can play a role in the warming and cooling of the atmosphere due to the ability of aerosols to absorb or scatter IR radiation depending on their composition. High levels of particulate matter, NOx and tropospheric O3 in areas of low atmospheric mixing lead to photochemical smog and the reduction of visibility characteristic of extreme pollution episodes.
The concentration of pollutants and trace gases in the troposphere is controlled not only by emission levels but also by the oxidation capacity of the atmosphere, which is determined largely by the concentration of the hydroxyl radical (OH) and the closely coupled hydroperoxyl (HO2) radical, referred to collectively as HOx radicals. Known for their role in chemical oxidation processes in the atmosphere, OH and HO2 are vital species when considering climate change and air pollution. The OH radical is the main daytime tropospheric oxidant, with a major role as a source of ground-level ozone (O3) (Levy, 1971) and as a sink for both atmospheric pollutants, such as methane, and other radical species. The OH radical also has a role in the formation of secondary pollutants including secondary organic aerosols (SOAs) formed via the oxidation of volatile organic compounds (VOCs). OH and HO2 radicals are closely linked, due to the recycling of HO2 to give OH, either via the reaction with NO or CO, with the dominant loss pathway of HO2 in polluted regions being the reaction with NO to form OH (for example, as shown in Beijing by Slater et al., 2020; Whalley et al., 2021). As such, understanding the sources and sinks of both OH and HO2 within the troposphere is crucial to fully understand the concentration and distribution of trace atmospheric species associated with climate change and poor air quality.
Observed HO2 concentrations from field measurements frequently cannot be fully explained by atmospheric chemistry models which often have a tendency to over-predict HO2 in low NOx conditions (Kanaya et al., 2007; Commane et al., 2010; Whalley et al., 2010, 2021; Slater et al., 2020; Sommariva et al., 2004). Following the ClearfLo campaign in London in 2012, zero-dimensional modelling showed an over-prediction of HO2 by up to a factor of 10 at low NOx, which was attributed to uncertainties in the degradation mechanism of complex biogenic and diesel-related VOC species at low NOx (Whalley et al., 2018). Over-prediction of HO2 is also commonly thought to be due, in part, to lack of understanding of HO2 uptake onto aerosol surfaces. A 2014 modelling study by Xue et al. (2014) focussing on the transport, heterogeneous chemistry and precursors of ground-level ozone in Beijing, Shanghai, Guangzhou and Lanzhou identified HO2 uptake as a source of uncertainty when considering ozone production, with uptake onto aerosols having the largest effect on HO2 concentration in Beijing where aerosol loadings were the highest.
While the impact of HO2 uptake on HOx concentrations has been calculated to vary from ∼10 %–40 % (Jacob, 2000; Whalley et al., 2010, 2021; Slater et al., 2020; Mao et al., 2010; Li et al., 2018, 2019) globally, often a single value of is used within models, as recommended by Jacob (2000). Previous experimental studies report uptake coefficients which span several orders of magnitude, however, and vary largely based on the state of the aerosol and whether transition metal ion catalysis is involved. For dry inorganic salt aerosols, values as low as have been reported (Cooper and Abbatt, 1996; Taketani et al., 2008; George et al., 2013), increasing to up to for aqueous aerosols (Thornton and Abbatt, 2005; Taketani et al., 2008; George et al., 2013). Previous experimental studies report much higher for Cu-doped aqueous aerosols (Thornton and Abbatt, 2005; Mozurkewich et al., 1987; Taketani et al., 2008; George et al., 2013; Lakey et al., 2016). Recently, larger values of have been measured experimentally from samples taken offline at Mt. Tai (0.13–0.34) and Mt. Mang (0.09–0.40) in China by Taketani et al. (2012), while another study in Kyoto, Japan, directly measured values under ambient conditions from 0.08 to 0.36 (Zhou et al., 2020). With , HO2 concentrations can be significantly influenced particularly in areas of low [NO] and/or high aerosol loadings (Lakey et al., 2015; Matthews et al., 2014; Mao et al., 2013; Zhou et al., 2021; Martinez et al., 2003).
Following multiple policies implemented across China in response to the poor air quality “crisis”, a number of studies have reported a decrease in NOx and PM2.5 emissions in China (Jin et al., 2016). Liu et al. (2017) reported NOx (NO2 + NO) emissions over 48 Chinese cities to have decreased by 21 % in the period of 2011–2015, supported by observed declines in NOx emissions reported by other studies (Krotkov et al., 2016; Liu et al., 2016; Miyazaki et al., 2017; van der A et al., 2017). Ma et al. (2016b) reported a mean annual decrease in PM2.5 of 0.46 µg m−3 between 2008–2013, while Lin et al. (2018) reported an average decrease of 0.65 µg m−3 yr−1 between 2006–2010 increasing to a decline of 2.33 µg m−3 yr−1 for the period of 2011–2015. In contrast to the observed decrease in NOx and PM2.5 emissions, several studies have reported increasing O3 levels. Ma et al. (2016a) reported a maximum daily average 8 h mean (MDA8) increase in O3 concentrations of 1.13 ppb yr−1 for the period between 2003–2015 at a rural site north of Beijing, while satellite observations suggested ground-level ozone had increased ∼7 % for the period between 2005–2010 (Verstraeten et al., 2015). A recent study by Silver et al. (2018) also observed a significant increase in O3 concentrations with median MDA8 increasing at a rate of 4.6 µg m−3 yr−1 across China.
A 2018 modelling study using the regional model GEOS-Chem by Li et al. (2018) suggested the increase in O3 across China between 2013–2017 could be attributed to the decrease in PM2.5, with changes in PM2.5 being a more important driver of increasing O3 trends than NOx and VOC emissions for the period studied. It was proposed that a decrease in PM2.5 emissions had led to a decrease in loss of HO2 via aerosol uptake resulting in an increase in HO2 concentration and a proportional increase in the loss of HO2 via NO leading to NO2, which, when photolysed, forms O3 leading to an increase in O3 (Li et al., 2018). However, analysis of measured radical budget from a field campaign in the North China Plain in summer 2014, with a calculated of 0.08±0.13, showed no evidence for a significant impact of HO2 heterogeneous chemistry on radical concentrations in North China Plain, concluding that reduced HO2 uptake was unlikely to therefore be the cause of increasing O3 levels in the North China Plain (Tan et al., 2020). Using a novel parameterization developed by Song et al. (2020) in the framework of the resistor model to take into account the influence of aerosol soluble copper, aerosol liquid water content and particulate matter concentration on HO2 uptake and the Multiphase Chemical Kinetic box model (PKU-MARK) to assess the impact of HO2 uptake on the O3 budget for the Wangdu campaign in 2014, Song et al. (2022) concluded that HO2 heterogeneous processes could decrease the O3 production rates by up to 6 ppbv h−1, particularly in the morning VOC-limited regime.
In this study, the new parameterization introduced by Song et al. (2020), hereafter referred to solely as the Song parameterization, coupled with measured data from the summer AIRPRO campaign in Beijing 2017 was used to calculate a time series of the HO2 uptake coefficient, which was then used to investigate the impact of heterogeneous uptake of HO2 onto aerosol surfaces on the HO2 radical budget in summertime in Beijing using the Master Chemical Mechanism and the impact on the O3 regime. We will test the hypothesis that reduced HO2 uptake due to a reduction in PM2.5 concentration is a significant driver of the recent increase in ozone concentrations in China.
2.1 Campaign overview and site description
As part of the “Atmospheric Pollution and Human Health (APHH) in a Chinese Megacity” programme, the University of Leeds took simultaneous measurements of OH, HO2, RO2 and OH reactivity (kOH), in addition to measurements of HCHO and photolysis rates, during two field campaigns at an urban site in winter 2016 and summer 2017 in Beijing, with the aim to study the chemical and physical processes governing gas and particle pollution and meteorological dynamics in the Beijing region and the links between the two (Shi et al., 2019; Slater et al., 2020; Whalley et al., 2021). The two field campaigns in Beijing were part of the AIRPRO (the integrated study of AIR pollution PROcesses in Beijing) project within the APHH programme, described fully by Shi et al. (2019).
For the summer AIRPRO campaign, the official study period was from 23 May to 22 June 2017, with observations taking place at the Institute of Atmospheric Physics (IAP) within the Chinese Academy of Sciences, located between the third and fourth ring roads in central Beijing within 100 m of a major road, making local traffic emission sources an important source of pollution during the measurement period. All instrumentation for the campaign was located at this site, housed within nine shipping containers surrounding a meteorological tower. Further details of the instrumentation and measurement site can be found in Shi et al. (2019). A detailed description of the University of Leeds fluorescence assay by gas expansion (FAGE) instrument used to make the measurements of OH, HO2 and RO2 radicals discussed in further sections can be found in Sect. S1.1 in the Supplement.
2.2 Determination of aerosol soluble copper concentration through ICP-MS analysis
The soluble copper ion concentration was determined by analysing the effluent extracted from quartz filter samples taken daily for the entire campaign using inductively coupled plasma mass spectrometry (ICP-MS). A 6 cm2 punch from each large quartz filter PM2.5 sample was cut and put in a 15 mL extraction tube and extracted with 10 mL ultrapure water (18.2 MΩ cm) under ultrasonication for 60 min at below 35 ∘C. The sample was then shaken by a temperature-controlled shaker at 4 ∘C for 3 h at approximately 60 cycles per minute. After filtering through a filter syringe, 8 mL of effluent was transferred to a new 15 mL metal free tube, and 2 mL of 10 % HNO3 was added to make a 10 mL 2 % HNO3 extract solution, which was then analysed to determine the soluble copper ion concentration using ICP-MS.
2.3 MCM v3.3.1 box model description
The Master Chemical Mechanism (MCM v3.3.1) is a near-explicit mechanism which describes the gas-phase degradation of a series of primary emitted VOCs in the troposphere. The mechanism considers the degradation of 143 VOCs and contains ∼17 000 elementary reactions of 6700 species (Whalley et al., 2013).
Table 1Full description of measured species during the summer AIRPRO campaign constrained within the model.

The model was constrained to measurements of NO, NO2, O3, CO, HCHO, HNO3, HONO, PAN, H2O vapour, temperature, pressure, j(O1D), j(HONO), j(NO2), j(ClNO2), j(HOCl), j(ClONO2) and specific VOC species measured using GC-FID (gas chromatography with flame ionization) and PTR-ToF-MS (proton-transfer reaction time of flight mass spectrometry). The measured species were input into the model at a time resolution of 15 min, with species measured at a higher time resolution averaged up to 15 min and those measured at a lower time resolution interpolated to give a value every 15 min. The full list of all species constrained in the model is shown in Table 1.
The different model scenarios referred to in this study are described in full below:
-
MCM_base, the base model run constrained to species described in Table 1;
-
MCM_gamma, the base model including heterogeneous HO2 uptake onto aerosols with calculated from parameterization developed by Song et al. (2020);
-
MCM_SA, the base model including heterogeneous HO2 uptake, this time with fixed at 0.2, as commonly used within models and recommended by Jacob (2000).
2.4 Calculation of and absolute O3 sensitivity
First introduced by Kleinman et al. (1997), is the ratio of radical loss via NOx to total primary radical production and is used as a means of determining O3 production sensitivity to VOCs and NOx (Kleinman, 2000; Kleinman et al., 1997, 2001). This method was then built on by Sakamoto et al. (2019), who included loss of peroxy radicals (XO2 = HO2 + RO2) onto aerosol surfaces within the calculation of O3 sensitivity.
The only source of tropospheric O3 is by the reaction of peroxy radicals with NO, while the main source of XO2 species is via the reaction of OH with VOCs.
The O3 production rate in the troposphere is therefore
where and are the bimolecular rate constants for the reaction of HO2 and RO2 with NO.
The production rate of OH, HO2 and RO2 radicals, Q, must equal the loss rate:
where LP is the loss rate of radicals onto aerosol particles, LN is the loss rate of radicals via reaction with NOx species and LRis the loss rate of radicals via radical–radical reactions to give peroxides.
where is the rate constant for the loss of HO2 onto aerosol surfaces, is the rate constant for the loss of RO2 onto aerosol surfaces, is the bimolecular rate constant for the reaction of NO2 with OH, is the bimolecular rate constant for the self-reaction of HO2 and is the bimolecular rate constant for the reaction of RO2 with HO2.
For radical loss onto aerosol surfaces, the rate constant is given as a function of the reactive uptake coefficient, ; aerosol particle surface area (cm2 cm−3); and mean thermal velocity (cm s−1), given by with R, T and M as the gas constant, the absolute temperature and the molar mass of species respectively.
According to the method described in Sakamoto et al. (2019), the ratio of radical loss to NOx to primary O3 production including radical loss via aerosol uptake, , is defined as follows:
where kOH+VOC is the bimolecular rate constant for the loss of OH via reaction with VOCs, and (1−α) is the fraction of XO2 that is HO2.
The relative sensitivity of O3 production to NOx and VOCs is described by
where . The O3 regime transition point, where , is given by .
Absolute O3 sensitivity was introduced by Sakamoto et al. (2019) and allows for the assessment of how reduction in O3 precursors could contribute to reduction in P(O3) by integrating over time and area. The absolute sensitivity of O3 production to VOCs and NOx is then described by
where [X] is NOx or VOCs.
2.5 Description of the “Song parameterization”
A large uncertainty in determining the effect of HO2 uptake onto the surface of aerosol particles is the lack of understanding of the dependence of on Cu (II)/transition metal ion concentration within aerosols. Experimentally this dependence is quite well known from laboratory studies (Mozurkewich et al., 1987; Thornton and Abbatt, 2005; George et al., 2013; Mao et al., 2013), however the effective concentrations in ambient aerosols and the impact on of aerosol liquid water concentration, [ALWC], has not been incorporated into models before. A novel parameterization was developed by Song et al. (2020) in the framework of the resistor model to include the influence of aerosol soluble copper on the uptake of HO2. The new parameterization for the uptake coefficient of HO2 onto aerosols, as given in Song et al. (2020), is as follows:
where is the uptake coefficient of HO2 onto aerosols, is the mass accommodation coefficient of HO2, is the mean molecular speed (in cm s−1), Rd is the count median radius of the aerosol (in cm), Heff is the effective Henry's law constant calculated from , where is the physical Henry's law constant for HO2 (i.e. 3900; Thornton et al., 2008) (in M atm−1), Keq is the equilibrium constant for HO2 dissociation (M), [H+] is the hydrogen ion concentration within the aerosol calculated from the pH (M), R is the gas constant (in cm3 atm K−1 mol−1) (i.e. 82.05), T is the temperature (in K), [ALWC] is the aerosol liquid water content (in µg m−3) (which is related to the ambient relative humidity), [PM] is the mass concentration of PM2.5 (in µg m−3) and [Cu2+]eff is the effective aerosol condensed-phase soluble copper (II) ion concentration (in mol L−1).
The Song parameterization can reportedly be used for urban environmental conditions of aerosol mass concentrations between 10–300 µg m−3, aqueous copper (II) concentrations of 10−5–1 mol L−1 and relative humidity between 40 %–90 %. However, for the summer AIRPRO campaign data, the minimum [ALWC] supported by the parameterization was 14 µg m−3, below which the parameterization returned negative values for . As such, despite the average calculated [ALWC] for the campaign being 6.9±10 µg m−3, a fixed value of 14 µg m−3 was used to calculate across the entire campaign.
3.1 Overview of field observations during summer AIRPRO campaign
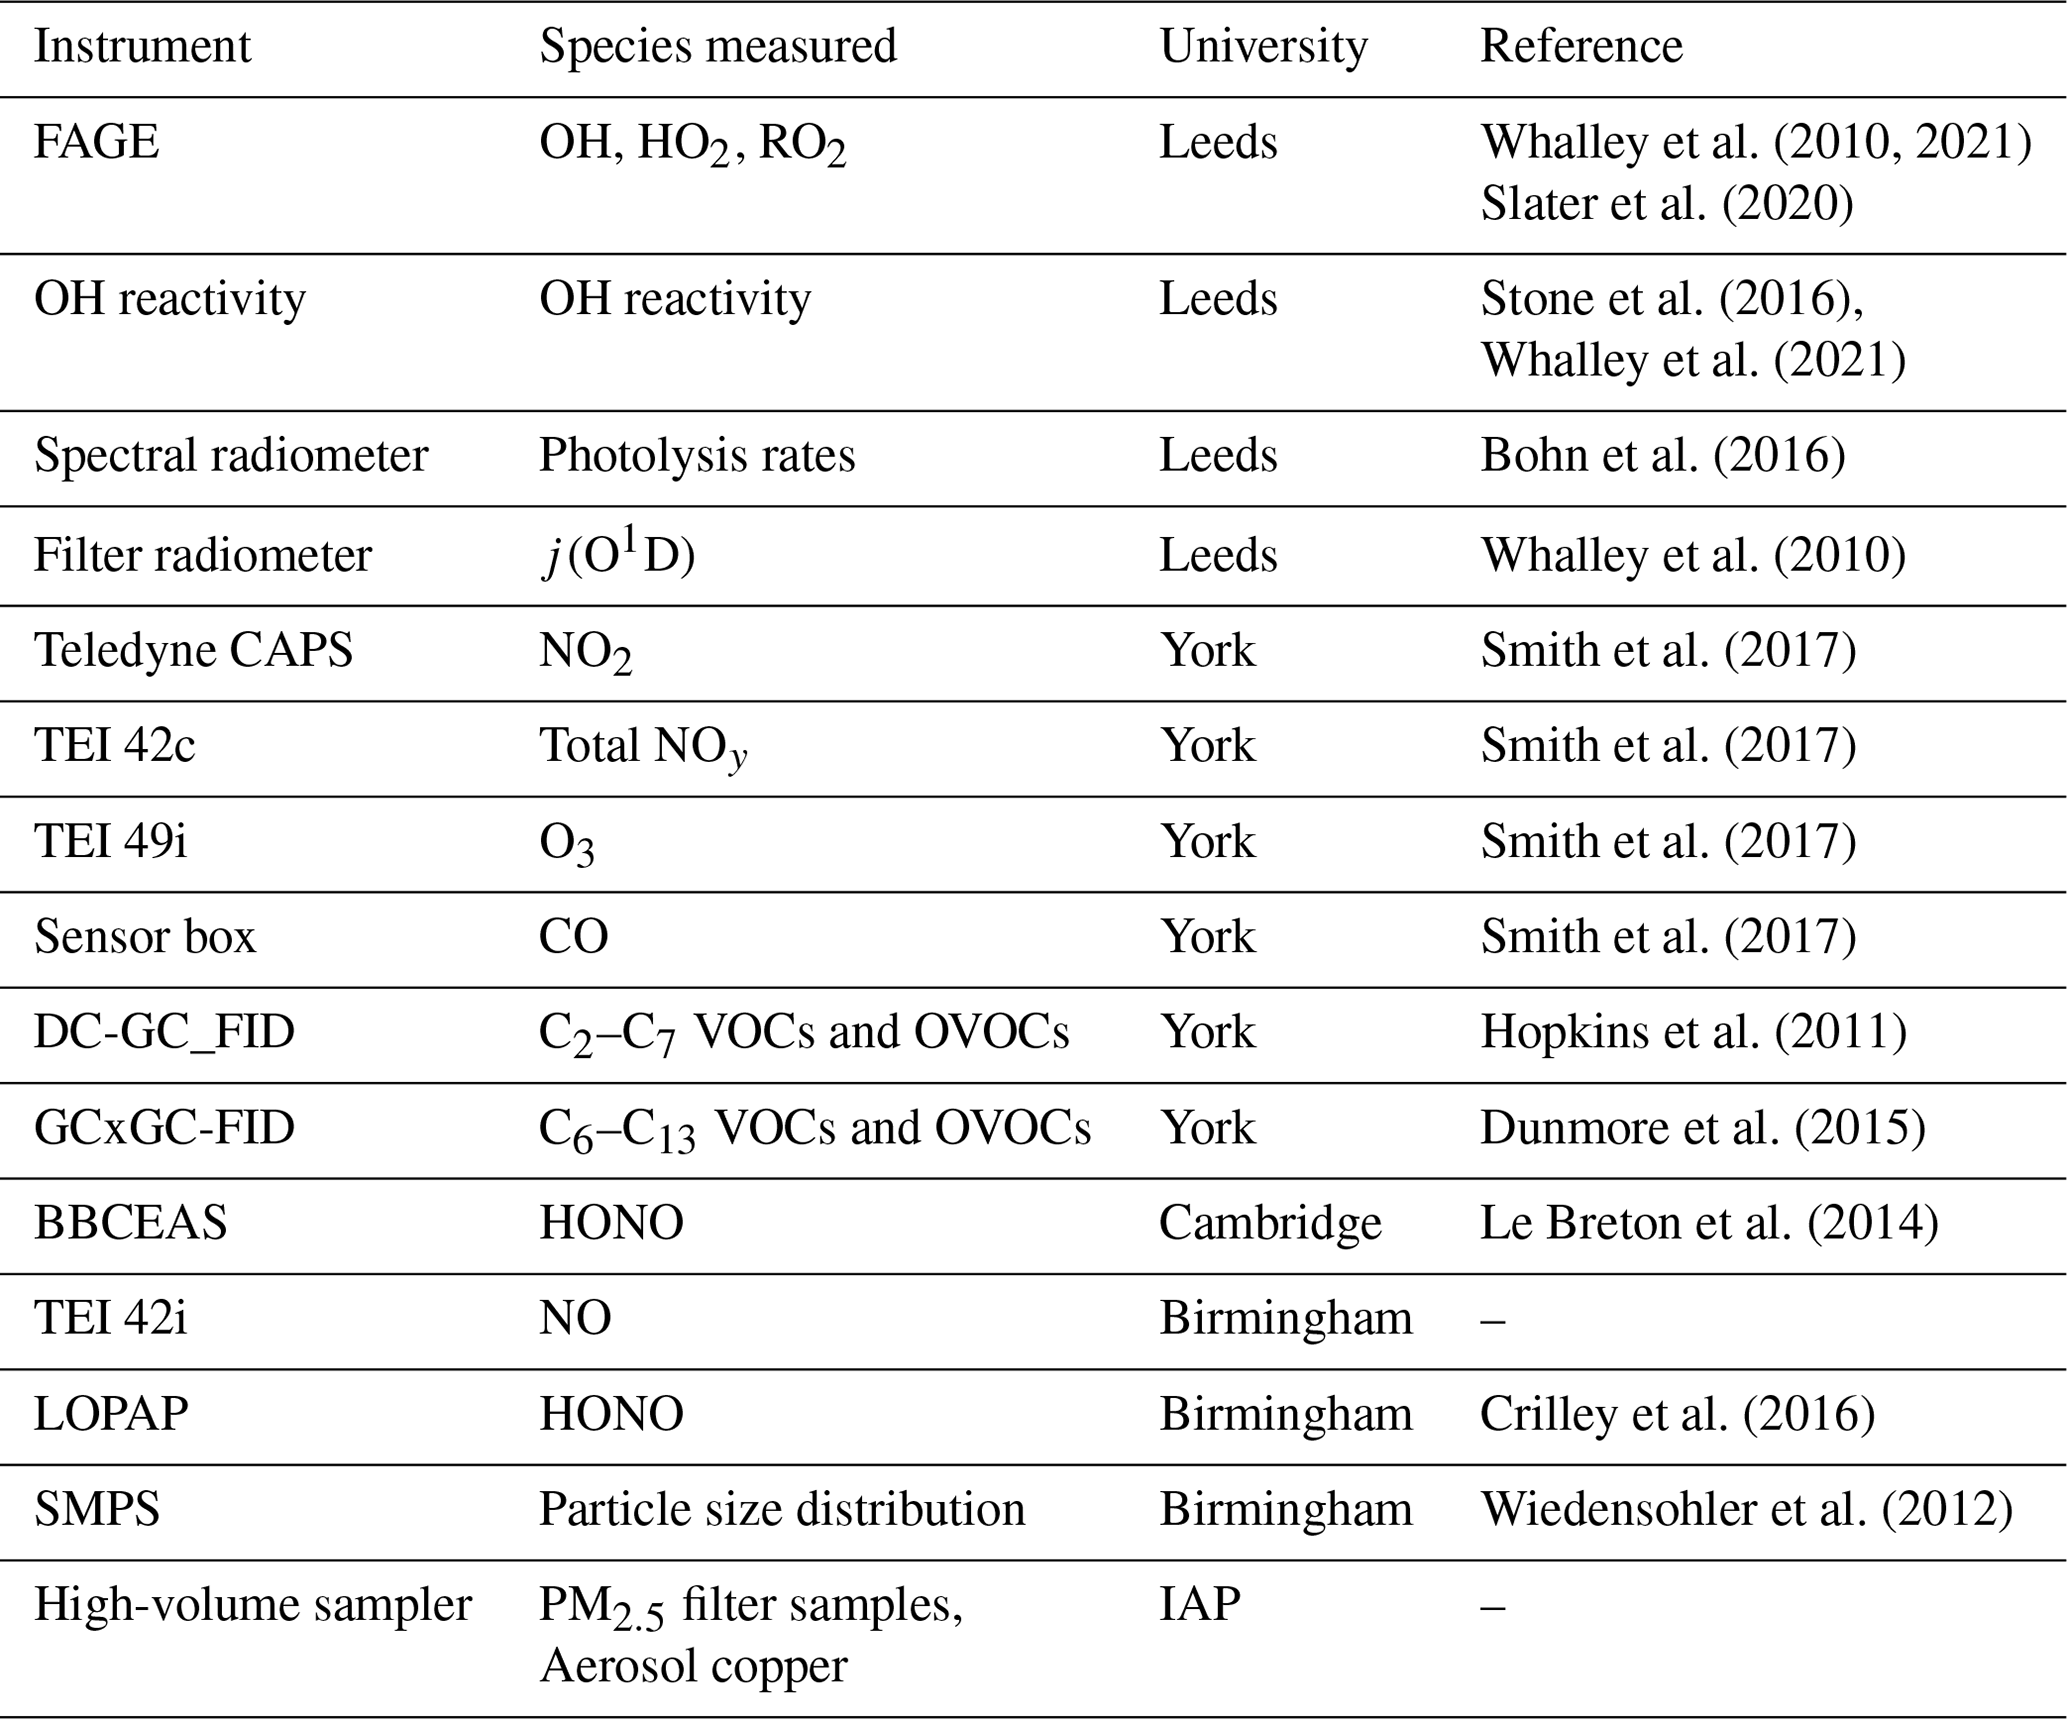
Radical concentration measurements were taken throughout the official study period of the summer campaign, from 23 May to 22 June 2017, using the fluorescence assay by gas expansion technique. Alongside the radical observations and photolysis rate measurements made by the University of Leeds, there was a varied suite of supporting measurements operated by several universities and institutions. The supporting measurements used for the analysis and discussion in this study were provided chiefly by the universities of York, Birmingham and Cambridge, as detailed in Table 2.
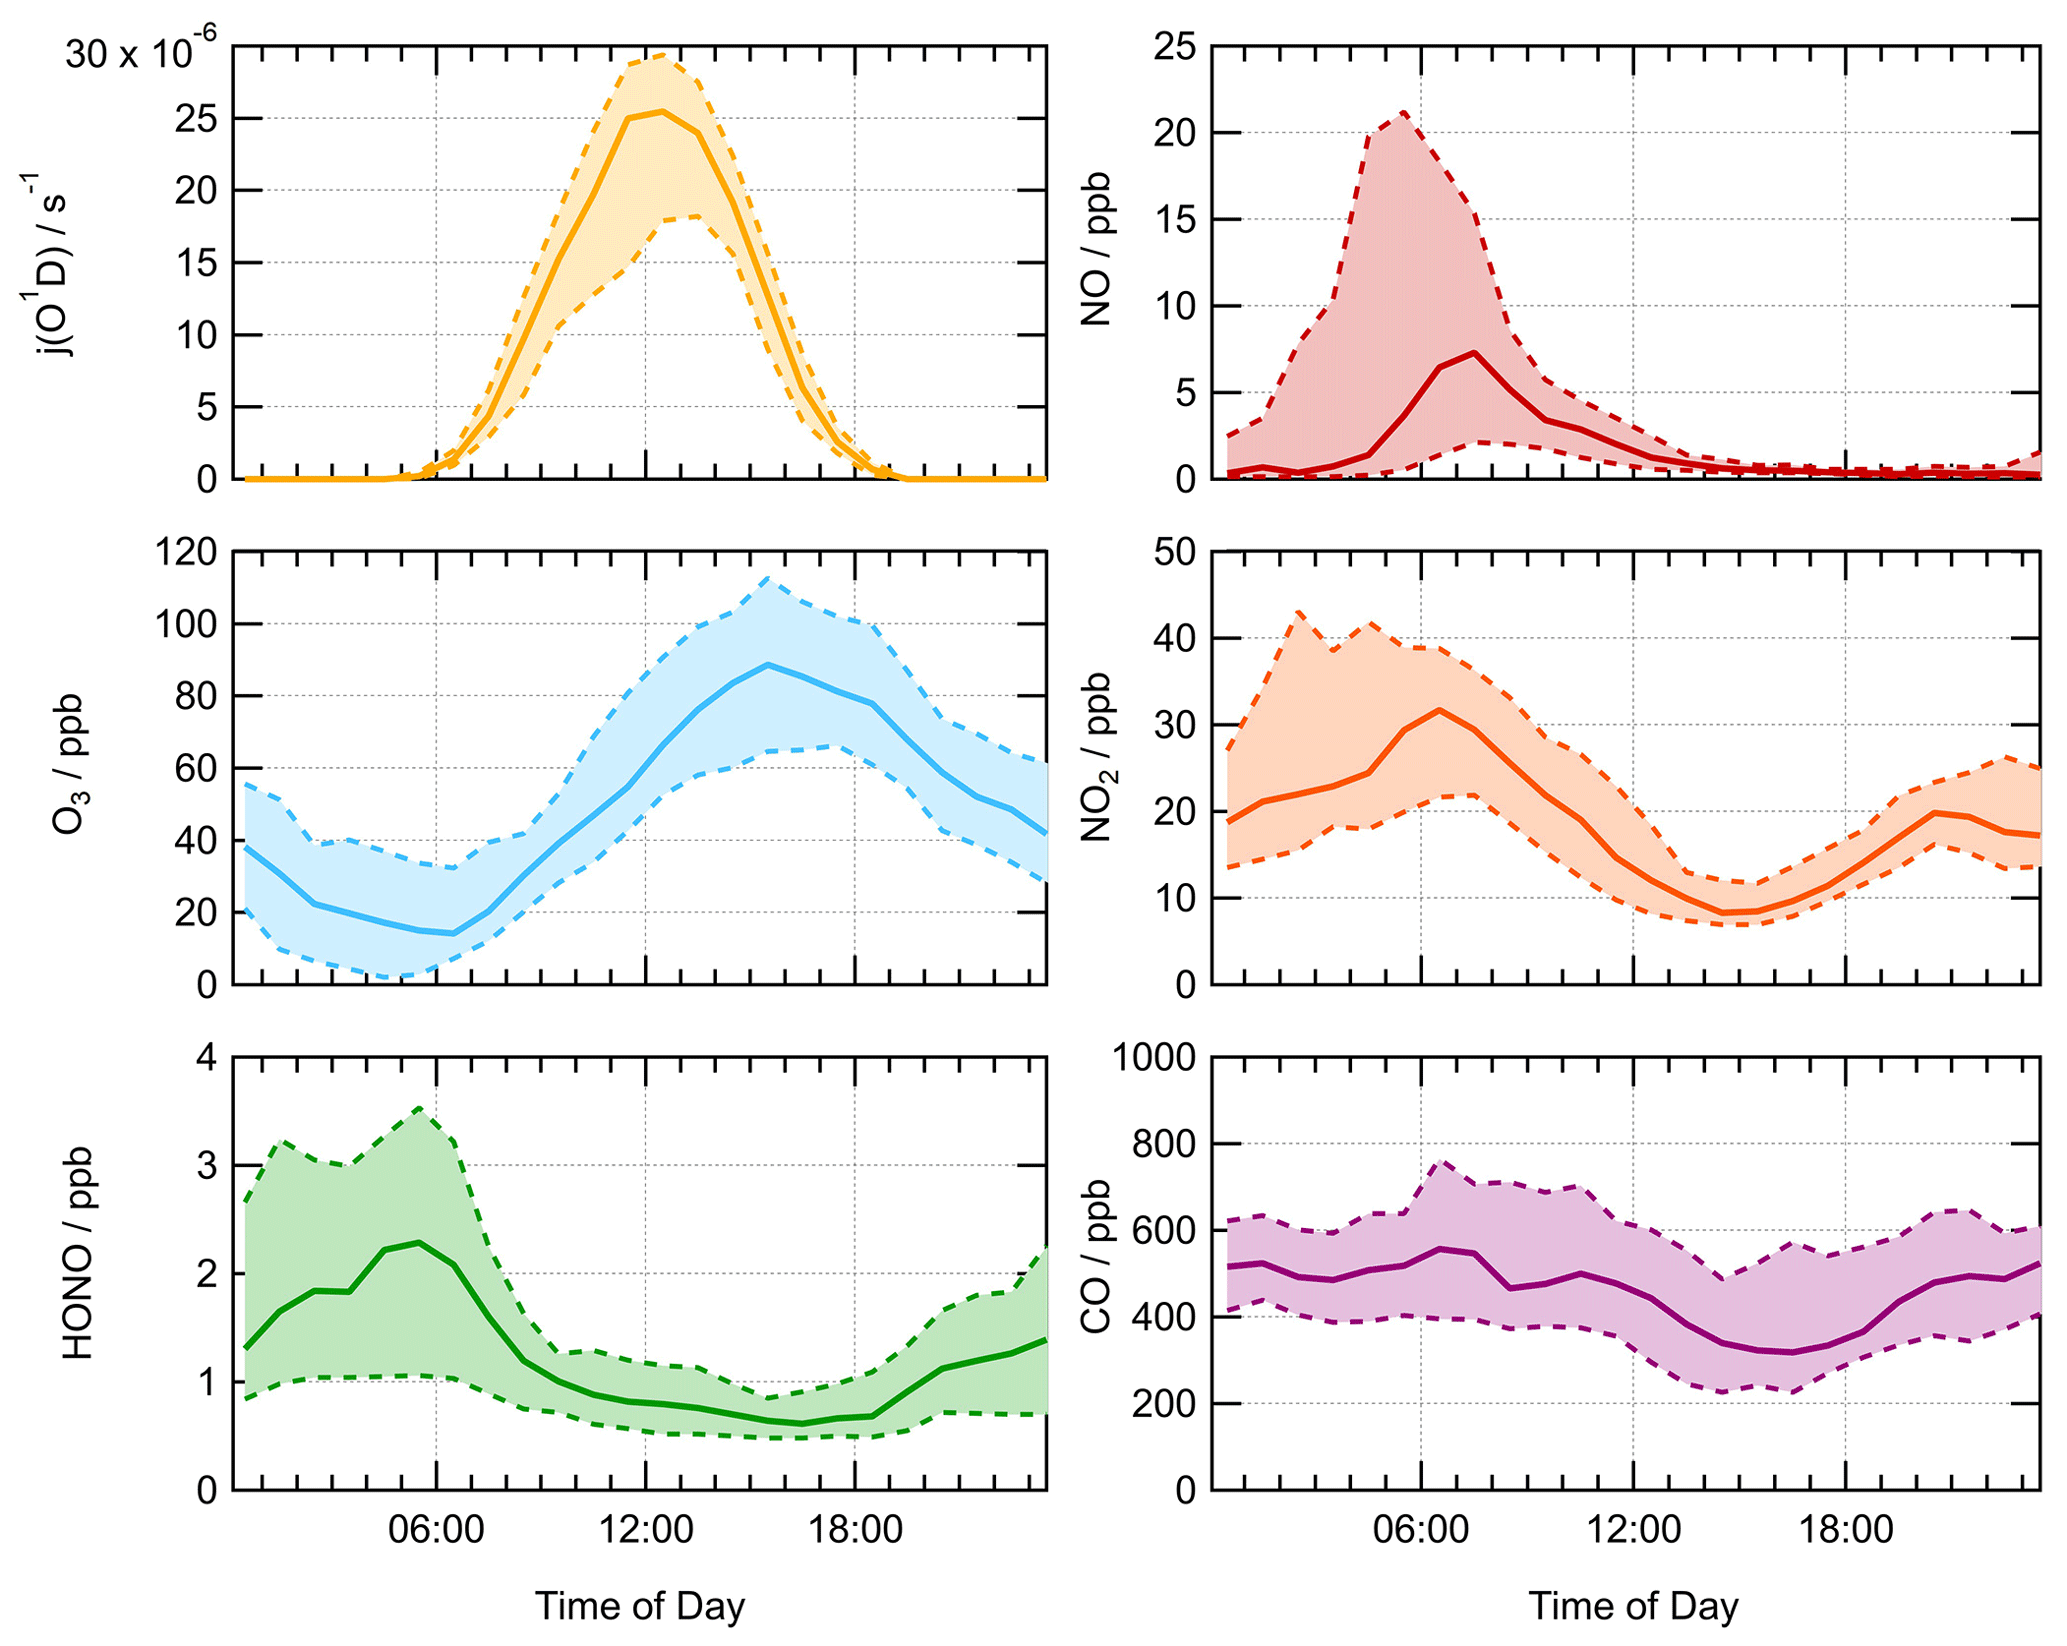
Figure 1Average median diurnal profile for measured j(O1D) (s−1), O3 (ppb), HONO (ppb), NO (ppb), NO2 (ppb) and CO (ppb) for the summer AIRPRO campaign. The dashed lines with shaded regions represent the 25th and 75th percentiles. Diurnal profiles show 60 min averages, taken over the entire measurement period.
The median average diurnal profiles for important gas-phase species (ppb) and j(O1D) (s−1) measured during the summer campaign are shown in Fig. 1. j(O1D) showed a maximum at solar noon peaking at s−1. The diurnal variation in both NO and NO2 was very distinct, with a peak in NO at rush hour (∼ 08:00 LT) of ∼8 ppb. NO decreased into the afternoon following this morning peak to a minimum of 0.3 ppb. The low values of NO mixing ratio observed in the afternoon were a result of high levels of O3, peaking at 89 ppb at ∼ 15:30 LT, leading to increased titration of NO + O3 to give NO2, the diurnal profile of which can be seen to peak in the morning at ∼32 ppb at 06:30 LT, coinciding with peak in traffic emissions. Conversely, the O3 mixing ratio was at a minimum of ∼14 ppb during the morning traffic peak in NO. Due to the expected accumulation of HONO overnight, the HONO mixing ratio is highest in the morning, peaking before 07:30 LT at ∼7 ppb, after which HONO is lost rapidly via photolysis to give OH + NO. This study will use these measured observations to compare modelled and measured concentrations of OH, HO2 and RO2 radicals and investigate the effect of HO2 uptake on radical concentrations.
Table 2Measurements taken by universities and institutions during the Beijing summer AIRPRO campaign. These species are directly referred to in this chapter: a full description of every instrument and measurement taken can be found in Slater (2020). IAP: Institute of Atmospheric Physics, Beijing. OVOCs: oxygenated VOCs. Time resolution of all instruments was averaged up to or interpolated down to 15 min for modelling purposes with the exception of the PM2.5 filter samples, of which there was only one sample taken a day.
The majority of the summer Beijing campaign occurred during a non-haze period, meaning PM2.5 concentrations remained below 75 µg m−3, only exceeding this on 28 and 31 May and 5, 7, 17 and 18 June 2017. The average median diurnal profile of PM2.5 surface area (cm2 cm−3) is shown in Fig. 2. PM2.5 surface area concentration was available at a higher resolution due to the use of online particle sizers compared to filter samples taken daily to give PM2.5 mass concentration. PM2.5 surface area was then averaged up to a time resolution of 15 min to be used in the model. Online particle sizers were run without a drying inlet to ensure aerosol measurements were as close to real ambient size distributions as possible, and therefore correction for hygroscopic growth was not necessary. No strong diurnal trend was seen, with an average across the campaign of cm2 cm−3, with a maximum surface area of cm2 cm−3.
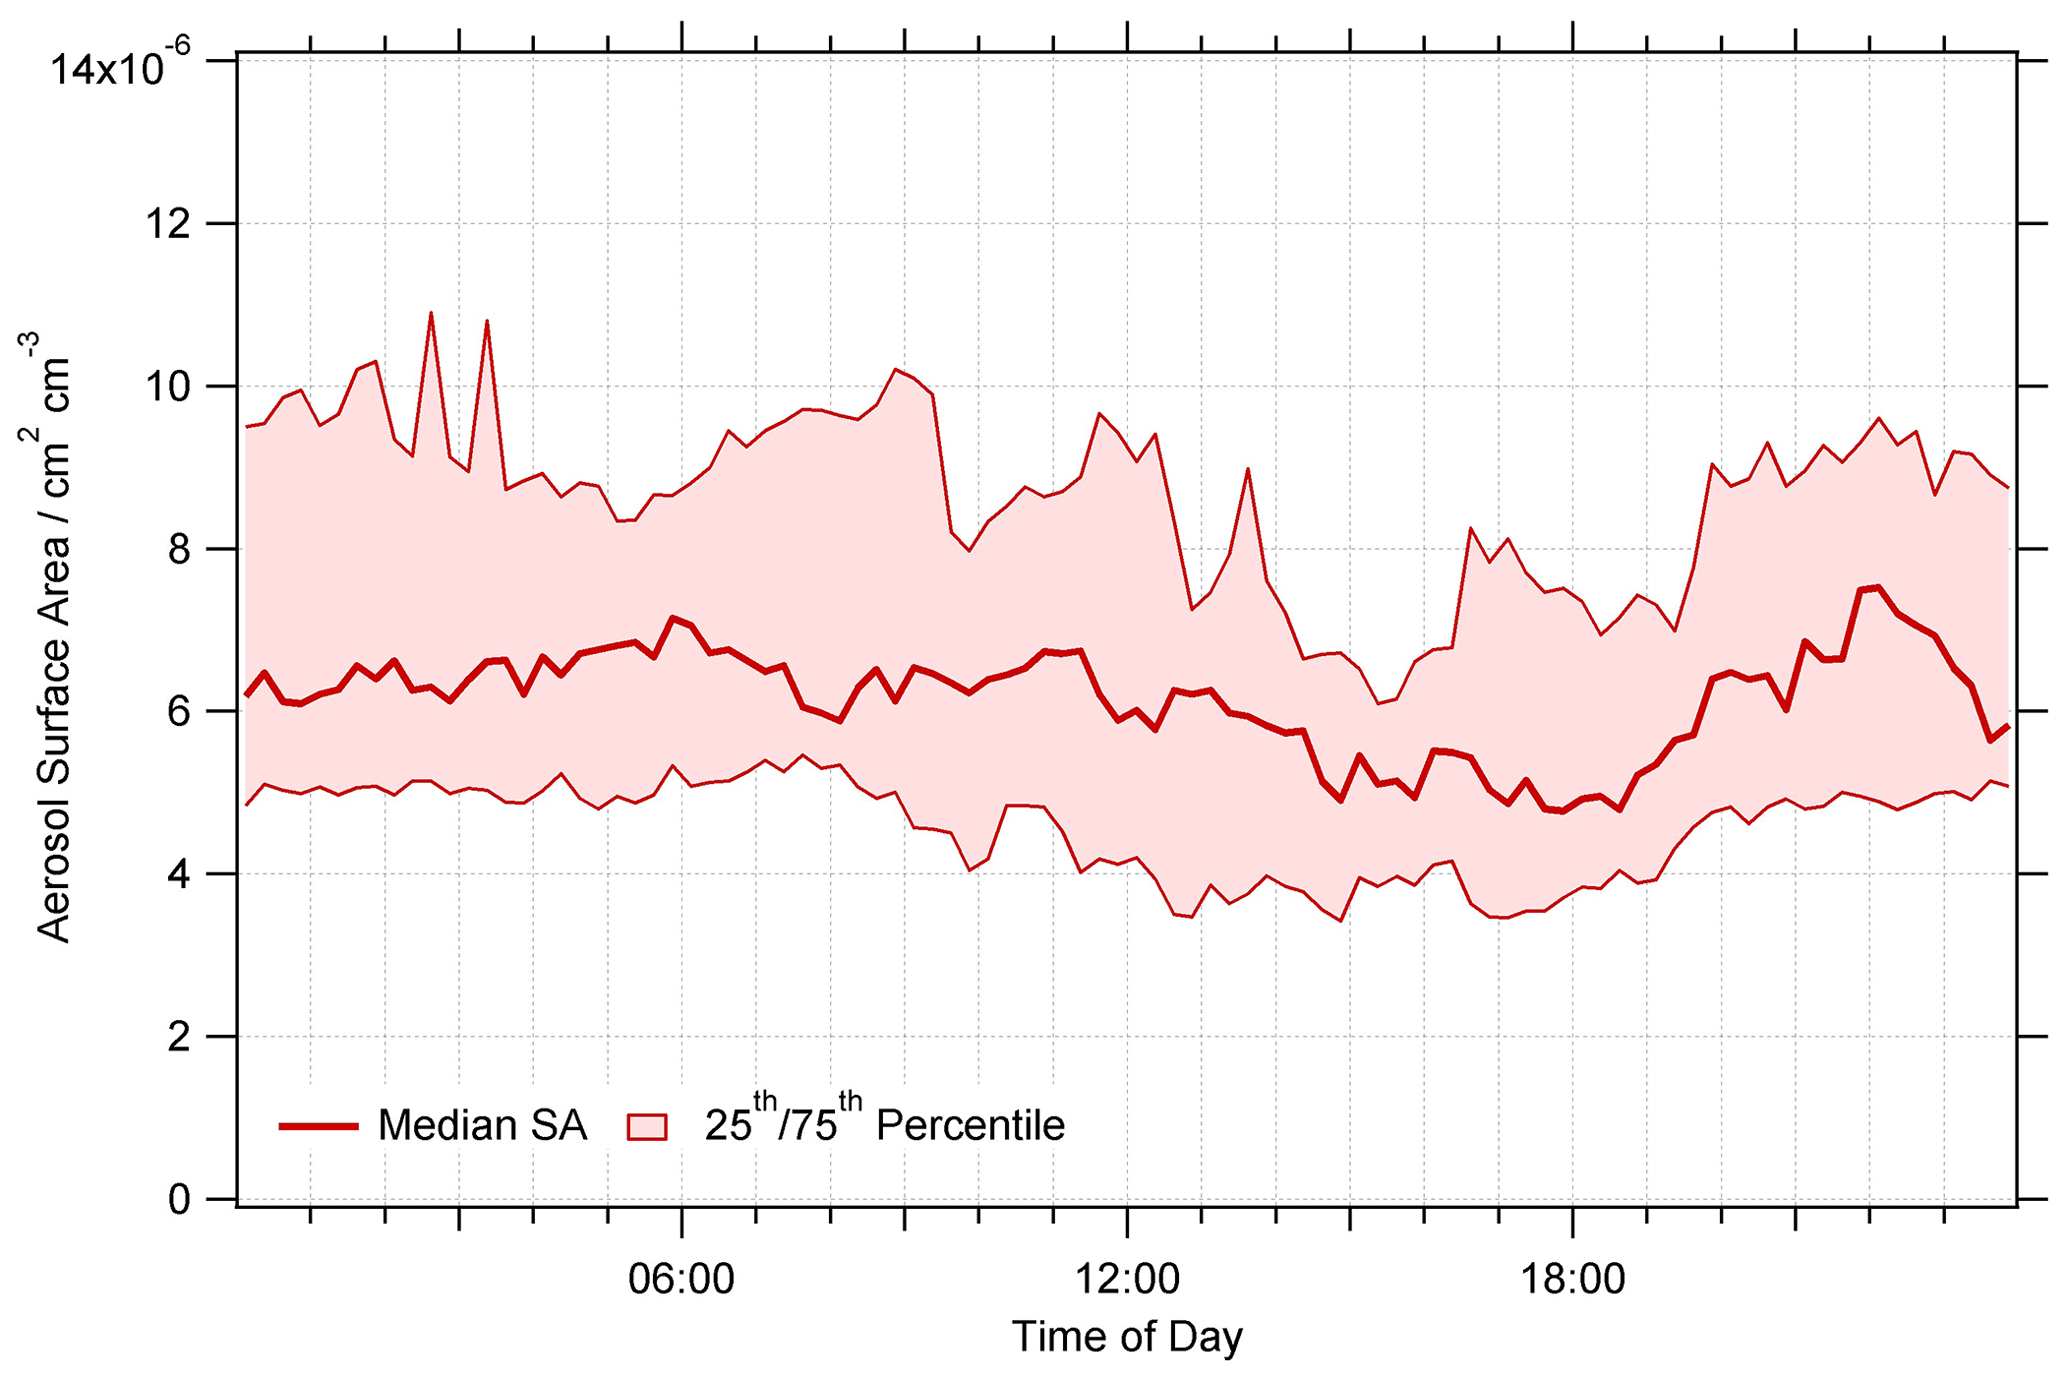
Figure 2Average median diurnal profile of PM2.5 aerosol surface area (cm2 cm−3) for the summer AIRPRO campaign. Data averaged up to 15 min time resolution. The dashed lines with shaded regions represent the 25th and 75th percentiles.
During haze periods in Beijing, it is expected that a strong correlation would exist between PM2.5 and NOx, as seen in winter Beijing AIRPRO campaign in 2016 (Slater et al., 2020). However, during the summer campaign, no strong correlation between PM2.5 and NOx was seen. The time series of NO (ppb) and PM2.5 (cm2 cm−3) is shown in Fig. 3. A correlation plot of PM2.5 aerosol surface area (cm2 cm−3) versus NO and NO2 mixing ratio (ppb) is shown in Fig. S1 in the Supplement.
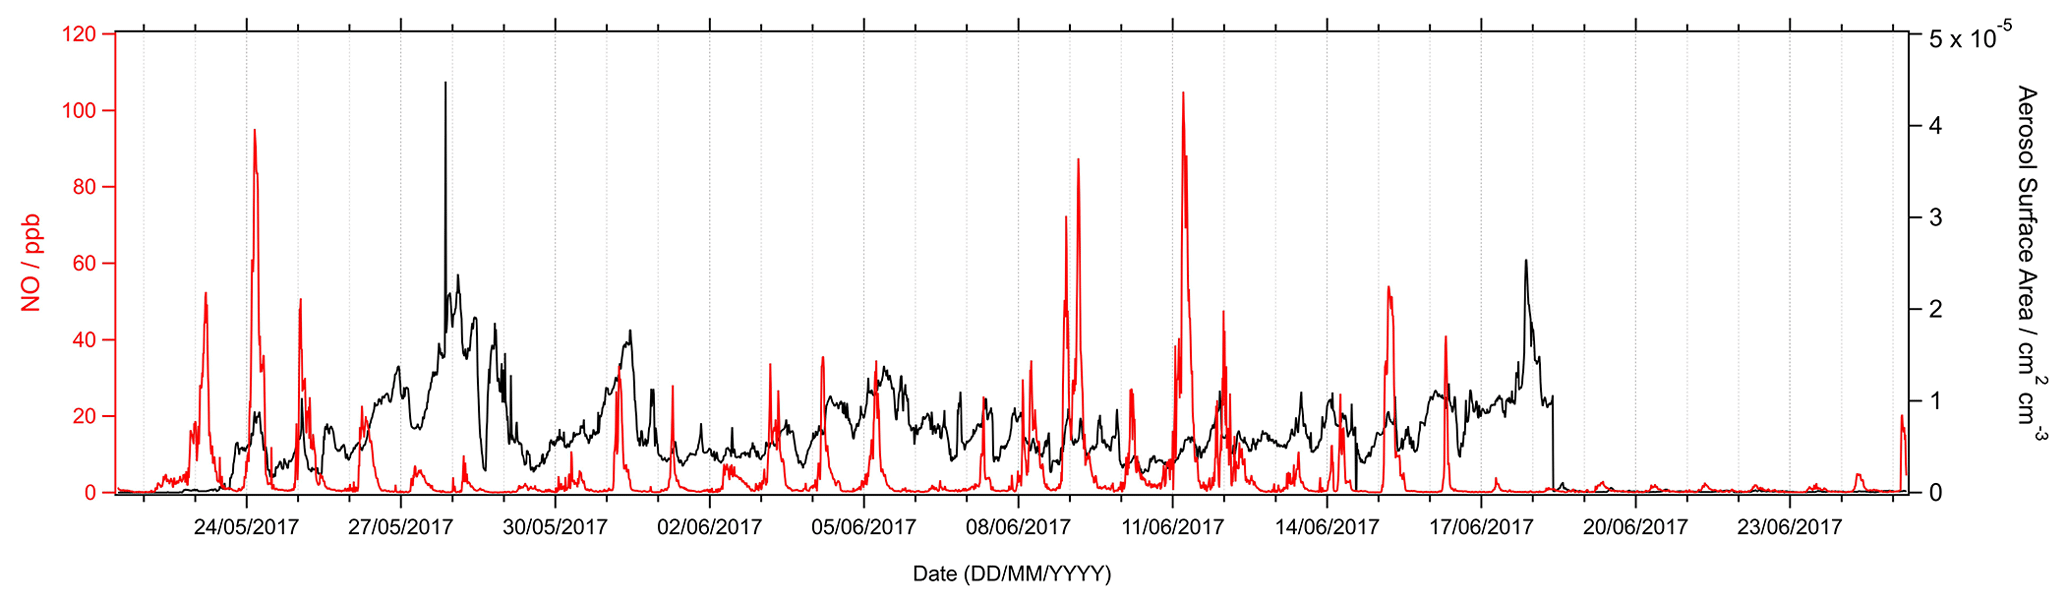
Figure 3Time series of measured NO (ppb) and PM2.5 (cm2 cm−3) across the entire summer AIRPRO campaign in Beijing.
3.2 Calculated for summer AIRPRO campaign
Measured values of [PM], copper (II) ion concentration and aerosol pH (used to calculate Heff in Eq. 12) and values of [ALWC] estimated using the ISORROPIA-II thermodynamic equilibrium model (Fountoukis and Nenes, 2007) were input into the parameterization at a time resolution of 1 d. PM2.5 mass concentration and Cu (II) ion concentration values were measured by extraction from filter samples offline, with one filter sample taken every day. As such all measured values input into the parameterization were averaged up to this time resolution. Rd was calculated from the measured aerosol size distribution across the entire campaign. A value of 0.5 was chosen for the mass accommodation coefficient, , to reflect values previously measured for copper doped inorganic salts (Thornton and Abbatt, 2005; George et al., 2013; Taketani et al., 2008) and to allow for better comparison with results from Song et al. (2020). For the summer AIRPRO campaign, the soluble copper ion concentration was measured by extracting Cu (II) ions from filter samples and analysing the effluent using inductively coupled plasma mass spectrometry (ICP-MS). As in Song et al. (2020), the total copper (II) mass concentration (ng m−3 converted to g m−3) was divided by the aerosol volume concentration (nm3 cm−3 converted to dm3 m−3) and the molar mass of copper (g mol−1) to give the total copper molar concentration in the aerosol, [Cu2+]eff (mol L−1), which was then used in Eq. (12). The average values across the summer AIRPRO campaign for parameters used in Eq. (12) are shown in Table 3.
Table 3Average values for the summer AIRPRO campaign in Beijing 2017 for parameters in Eq. (12). * This was a fixed minimum value of ALWC for the parameterization to be used for this data set, fully explained in Sect. 3.4. Cu (II) ion concentration is given in both moles per litre (mol L−1) and nanograms per cubic metre (ng m−3), due to mol L−1 being used in Eq. (12) but ng m−3 being the more atmospherically relevant unit.
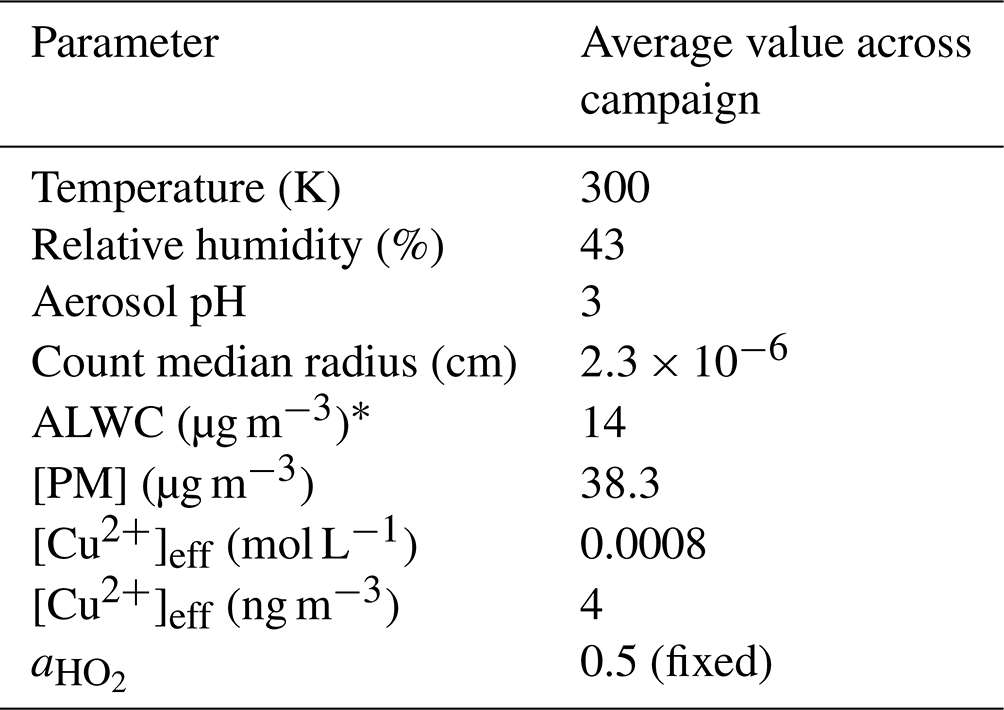
For the Beijing summer AIRPRO campaign, an average value of (1σ) was calculated across the entire campaign, with values ranging from 0.002 to 0.15. The time series for the calculated , Rd (cm), [PM] ( µg m−3), [ALWC] (µg m−3) and [Cu2+]eff (mol L−1) is shown in Fig. 4.
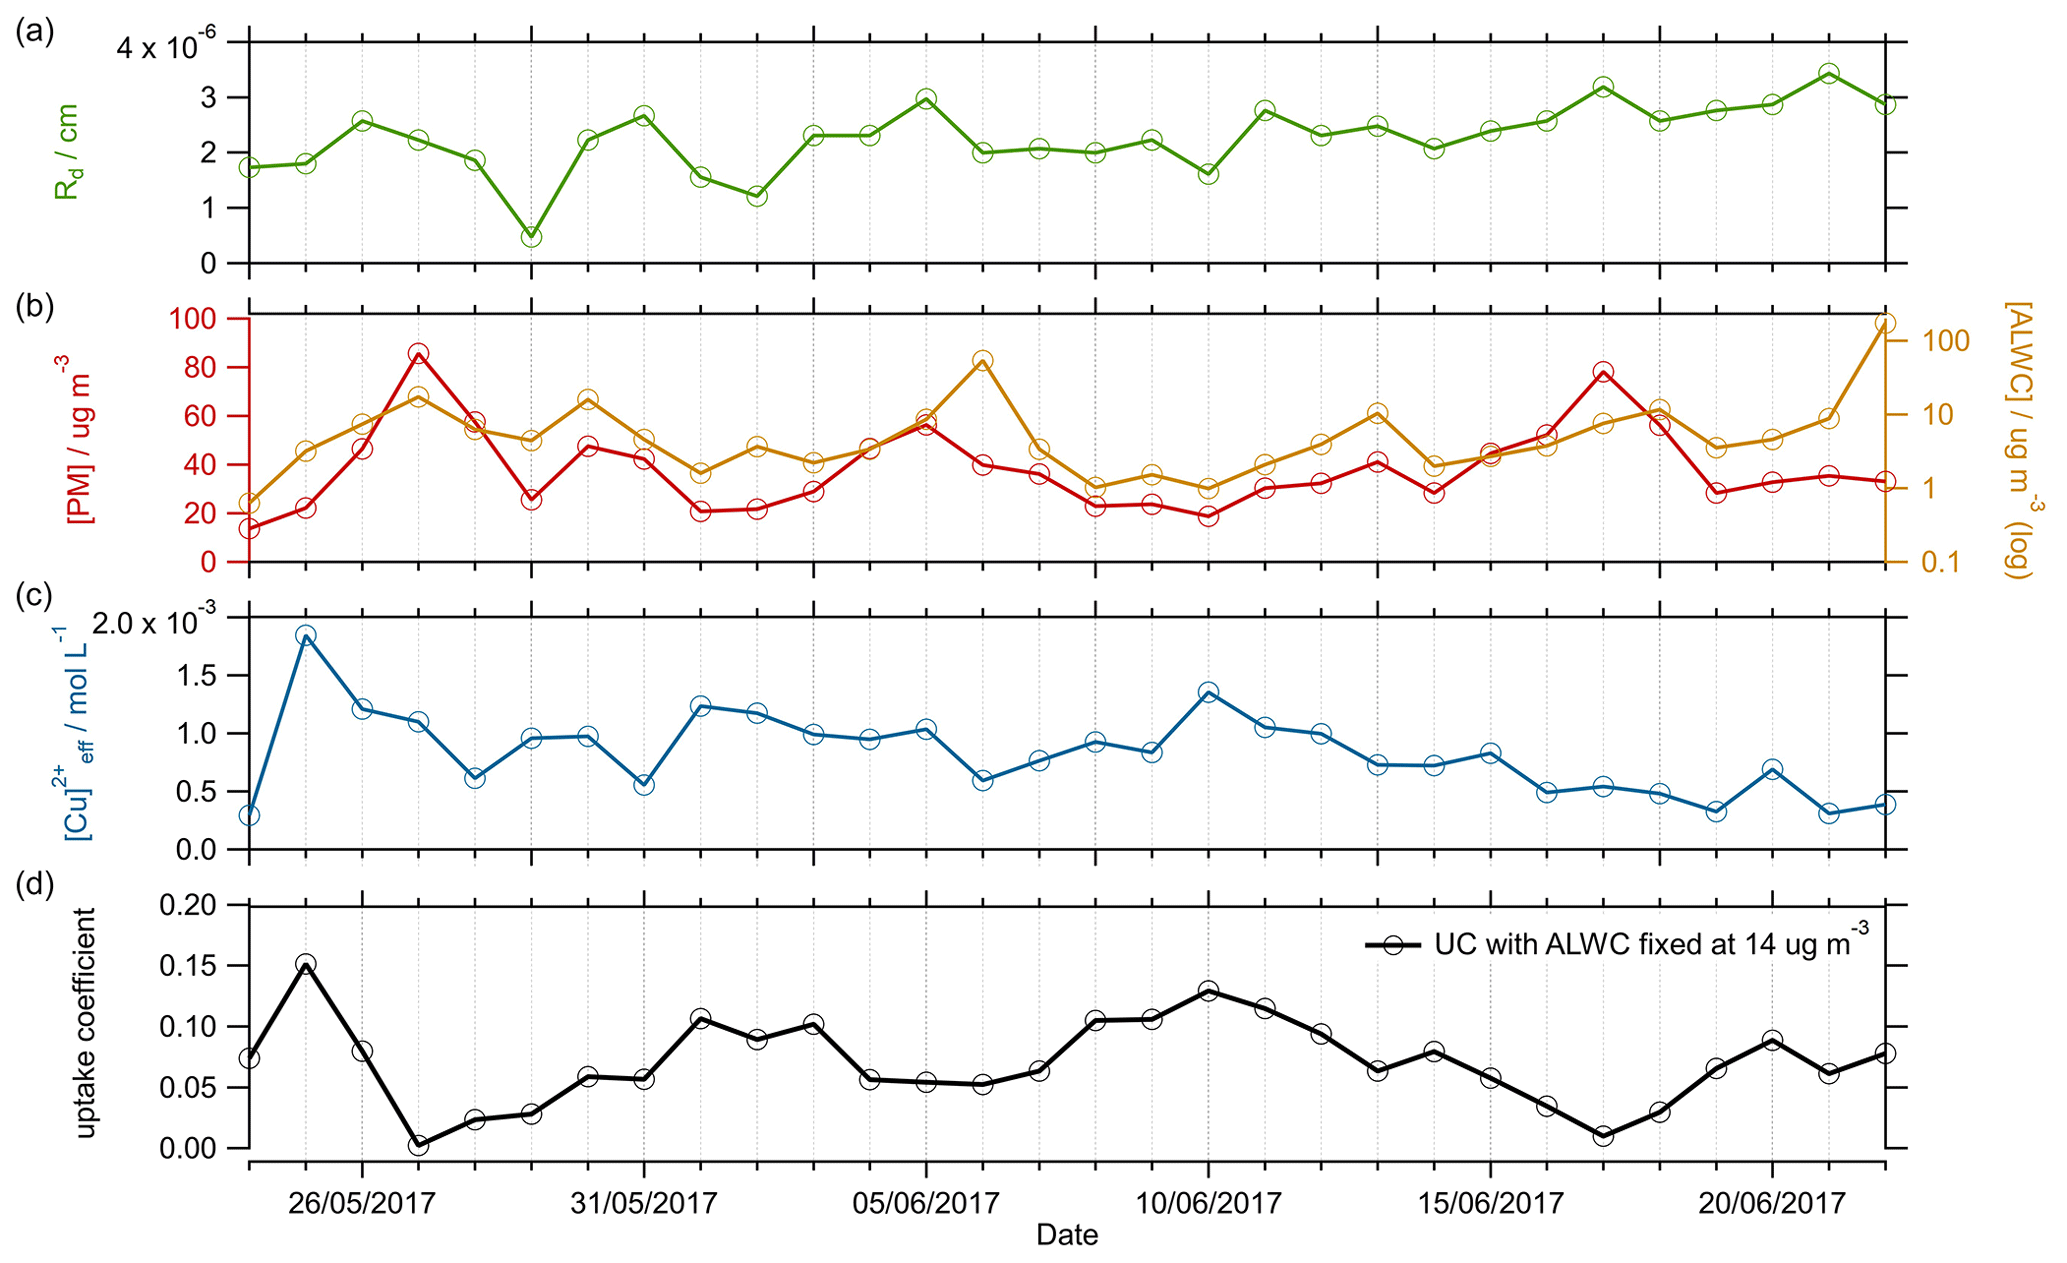
Figure 4Time series of (a) Rd (cm, orange), (b) [PM] (µg m−3, red) and [ALWC] (µg m−3, yellow), and (c) [Cu2+]eff (mol L−1, blue), parameters used in Eq. (12) to calculate (d). Each parameter has been averaged up to a time resolution of 1 d to match the lowest-resolution measurement. The calculated is shown in the bottom panel, for a fixed [ALWC] = 14 µg m−3 (solid black line).
As fully described in the Supplement of Song et al. (2020), the uncertainty in the calculation of using Eq. (12) comes mainly from the uncertainty in [ALWC] (∼10 %–20 %, calculated using ISORROPIA-II; Fountoukis and Nenes, 2007), the uncertainty in the mass accommodation coefficient (varying within the parameterization from 0.1 to 1 increased the calculated from 0.042 to 0.077; however, by this dependence has begun to plateau with when ) and the uncertainty of the model calculations used to formulate the parameterization (∼40 % as explained in Song et al., 2020). Uncertainties in measured parameters, i.e. temperature, [PM], [Cu2+] and count median radius are due to associated instrumental error which are assumed small in comparison.
To examine the effect within the Song parameterization of [PM] and [ALWC] on as a function of copper molarity, the uptake coefficient was calculated by varying the [Cu2+]eff concentration within the parameterization with alternatively fixed values of [PM] or [ALWC]. For a given value of [Cu2+]eff, at fixed [ALWC], an increase in [PM] causes a decrease in the curvature of vs. [Cu2+]eff, whereas at a fixed [PM], an increase in [ALWC] leads to an increase in for a given [Cu2+]eff. As shown in Fig. 5, [AWLC] and [PM] have the greatest effect on between [Cu2+] M before the curve levels off towards the mass accommodation coefficient of 0.5, as input into the model. For context within the Beijing campaign, the curve of vs. [Cu2+]eff is plotted in Fig. 5 using the average values for the AIRPRO summer campaign fixed at [ALWC] = 14 µg m−3 and [PM] = 38.3 µg m−3. For the average AIRPRO summer campaign values, an increase [Cu2+]eff has the most effect on between [Cu2+]–10−1 M, with the average [Cu2+]eff for the campaign being M (values ranged from to M across the campaign).
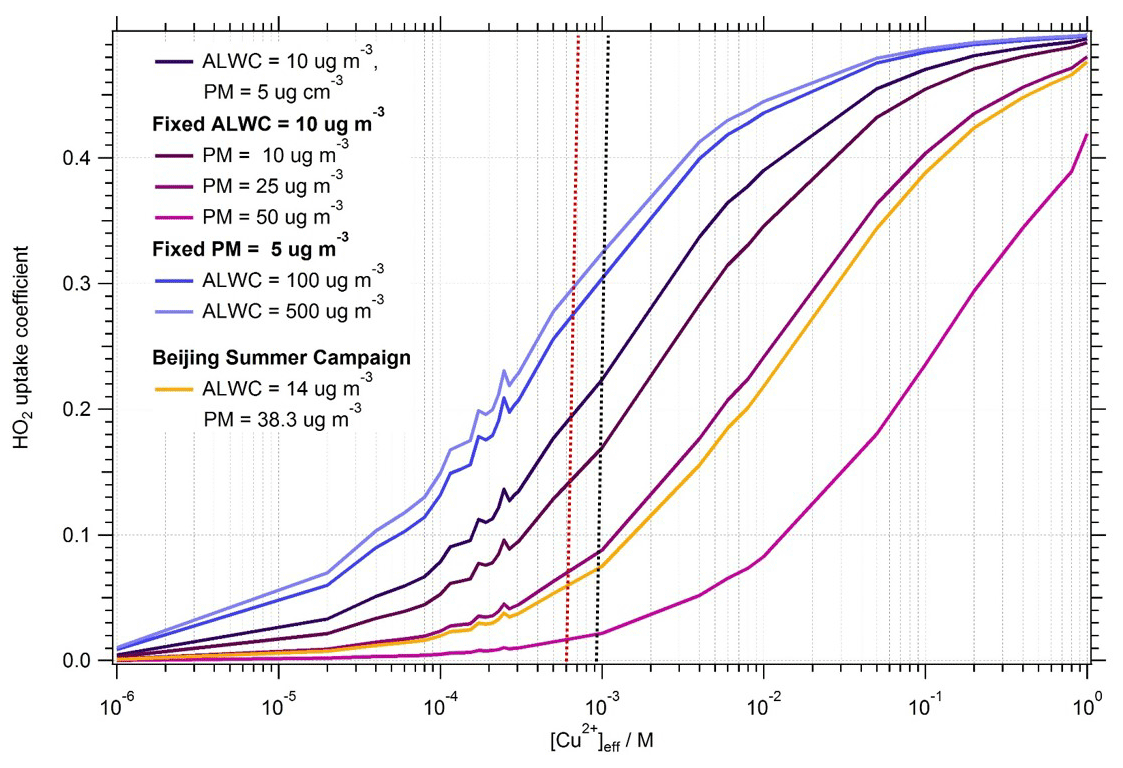
Figure 5Dependence of uptake coefficient, , on aerosol copper concentration, [Cu2+]eff (M), showing the effect of varying [PM] with fixed [ALWC] and vice versa. Pink to purple lines show the effect on uptake coefficient of varying [PM] from 5–50 µg m−3 with a fixed [ALWC] of 10 g cm−3. Blue to dark blue lines show the effect on of varying [ALWC] from 10–500 µg m−3 (much higher than typically seen atmospherically) with a fixed [PM] of 5 µg m−3. The yellow line shows the effect on the of varying [Cu2+]eff, with [ALWC] and [PM] taken as the averages from the Beijing campaign, i.e. [ALWC] = 14 µg m−3 and [PM] = 38.8 µg m−3. Black dashed line indicates the average [Cu2+]eff for Beijing summer campaign. Red dashed line indicates the average [Cu2+]eff for the Wangdu campaign. Note that the [PM] and [ALWC] are both higher for the Wangdu campaign compared to the Beijing campaign.
3.3 Box modelling results
3.3.1 Effect of calculated on modelled AIRPRO summer radical concentrations
As reported in Whalley et al. (2021), radical concentrations were high during the AIRPRO summer campaign with maximum measured concentrations of OH, HO2 and RO2 of 2.8×10⁷, 1×10⁹ and 5.5×10⁹ molec. cm−3 on the afternoons of 30 May and 9 and 15 June respectively. The time series of measured OH, HO2 and RO2 for the entire summer campaign as measured by the Leeds FAGE instrument with MCM_base model outputs for OH, HO2 and RO2 can be found in Whalley et al. (2021). Using the MCM and the calculated for the summer Beijing campaign with the Song parameterization, the effect of HO2 uptake on the concentration of OH, HO2 and RO2 radicals was investigated and compared to the base model.
The MCM_base-model-predicted radical concentrations are shown as average diurnal profiles compared to both the measured diurnal profiles and the MCM_gamma model in Fig. 6. A detailed description of the diurnal variation in measured and modelled OH, HO2 and RO2 radicals for the summer Beijing campaign is given in Whalley et al. (2021), so only a brief summary will be given here.
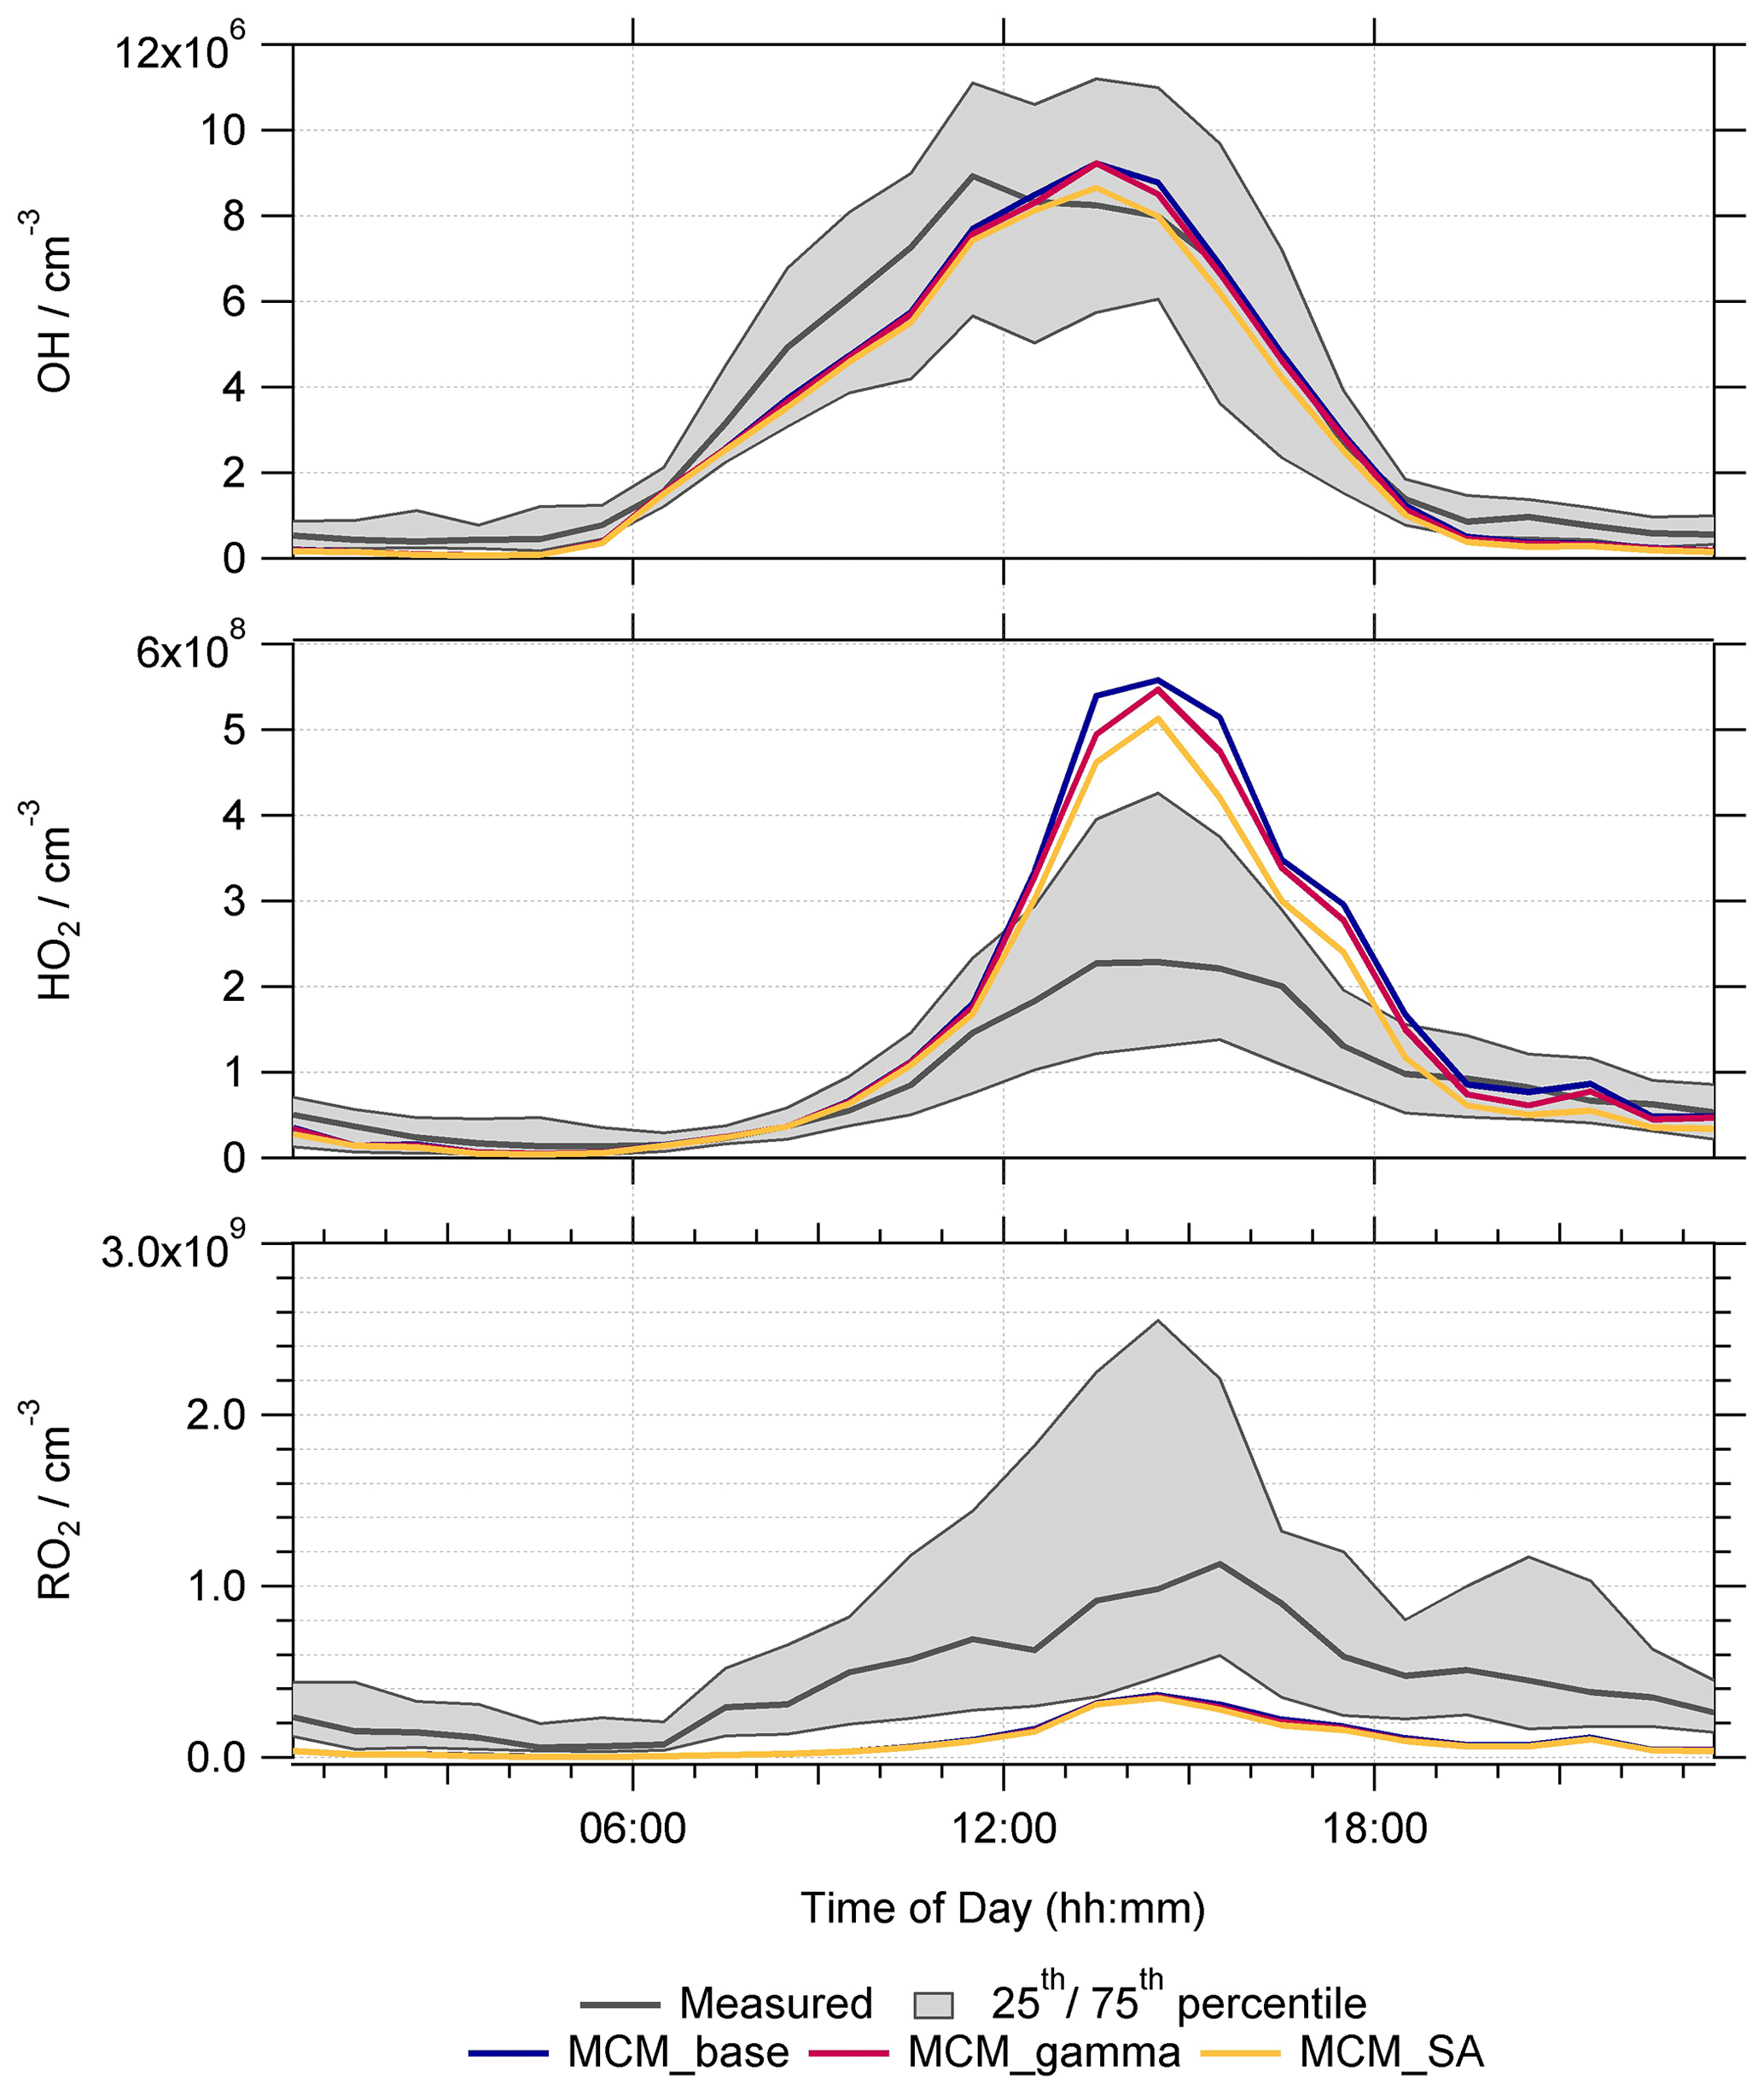
Figure 6Average median diurnal profiles for measured radical concentrations (grey) and modelled OH, HO2 and total RO2 radical concentrations (in molec. cm−3) for MCM_base (blue), MCM_gamma (dark pink) and MCM_SA (yellow) model runs. All diurnal profiles are 60 min averages, taken over the entire measurement period. Shaded grey regions represent the 25th and 75th percentiles of measured radical data.
The average diurnal profiles show that the MCM_base model can reproduce the measured OH concentrations relatively well; however the modelled peak in OH is shifted to the afternoon with a peak at ∼ 14:00 LT compared to the midday peak in the observations. In comparison, HO2 is over-predicted, particularly during the day with the exception being when NO was high from 9–12 June. Daytime HO2 is over-predicted on average by MCM_base by up to a factor of ∼2.9 with a peak in the diurnal profile at ∼ 14:30 LT. In comparison, daytime RO2 concentration is under-predicted on average by MCM_base by up to a factor of ∼7.5, with a larger under-prediction in the morning between ∼ 06:30–10:30 LT when NO levels were highest. At the peak of the RO2 diurnal profile, on average the concentration was under-predicted by MCM_base by a factor of ∼2.7. While the MCM_base model is able to reproduce measured OH concentrations reasonably well, the inability of this model to reproduce HO2 and RO2 suggests missing key reactions. In Whalley et al. (2021), budget analysis highlighted a missing source of OH, in addition to a missing RO2 production reaction which could partially explain the under-prediction of RO2 by the MCM_base model. It was also suggested that the over-prediction of HO2 could be due, in part, to the propagation rate of RO2 to HO2 being significantly slower than currently included in the model. This could be due to a lack of understanding of the rate of reaction of RO2 with NO to produce different RO2 species, i.e. RO2 + NO → RO, which would lead to propagation of RO2 to different, more oxidized RO2 species, competing with the recycling of RO2 via RO2 to give HO2. It is also possible that the overestimation in the propagation rate of RO2 to HO2 could be due to a lack of RO2 autoxidation pathways included within the model, which could lead to the formation of highly oxygenated molecules as opposed to HO2. The higher, measured RO2 concentrations could, therefore, suggest that the lifetime of total RO2 is longer than currently considered within the model.
As stated in Sect. 3.2, for the Beijing summer AIRPRO campaign, values of calculated varied, ranging from 0.002 to 0.15, giving an average value of (1σ) across the campaign. These values calculated on a daily time resolution were added into the MCM_base model to give the MCM_gamma model. The average median diurnal profiles of modelled OH, HO2 and RO2 (molec. cm−3) for MCM_base, MCM_gamma (with ranging from 0.002–0.15) and MCM_SA (with fixed at 0.2) are shown in Fig. 6.
Due to a combination of the calculated uptake coefficient being smaller, on average, than usually used within models (i.e. <0.2), and the high NOx levels, little effect on average radical diurnal profiles was seen by adding in HO2 aerosol uptake into the model. Figure 6 shows that the OH and RO2 radical concentrations were not significantly affected on average across the campaign by the addition of aerosol uptake. The average median diurnal profile of HO2 can be seen as slightly decreased; i.e. the over-prediction of HO2 is slightly less for MCM_gamma compared to MCM_base, with the over-prediction decreasing from a factor of ∼2.9 to ∼2.4 at the 14:30 LT peak in the diurnal profile.
Due to the recycling of RO2 to HO2 and then back to OH by NO, it is important to consider the dependency of radicals on NO and whether the addition of the HO2 uptake coefficient has an effect on the model's ability to predict the dependency of radical concentrations on NO. The dependency of measured/modelled OH, HO2 and RO2 on NO mixing ratio is discussed fully for the MCM_base model in Whalley et al. (2021) and is compared to MCM_gamma in Fig. S2.
To showcase any effect adding HO2 aerosol uptake would have on HO2 loss pathways as a whole, and thereby make a judgement on the effect of decreased PM2.5 and hence HO2 loss via aerosol surfaces on the O3 production within Beijing, a rate of destruction analysis (RODA) was done for MCM_gamma. The loss pathways of HO2 within MCM_gamma are shown in Fig. 7 as an average median diurnal profile and as a function of NO mixing ratio (ppb), in addition to the percentage contribution of HO2 uptake to the overall loss of HO2 within the model.
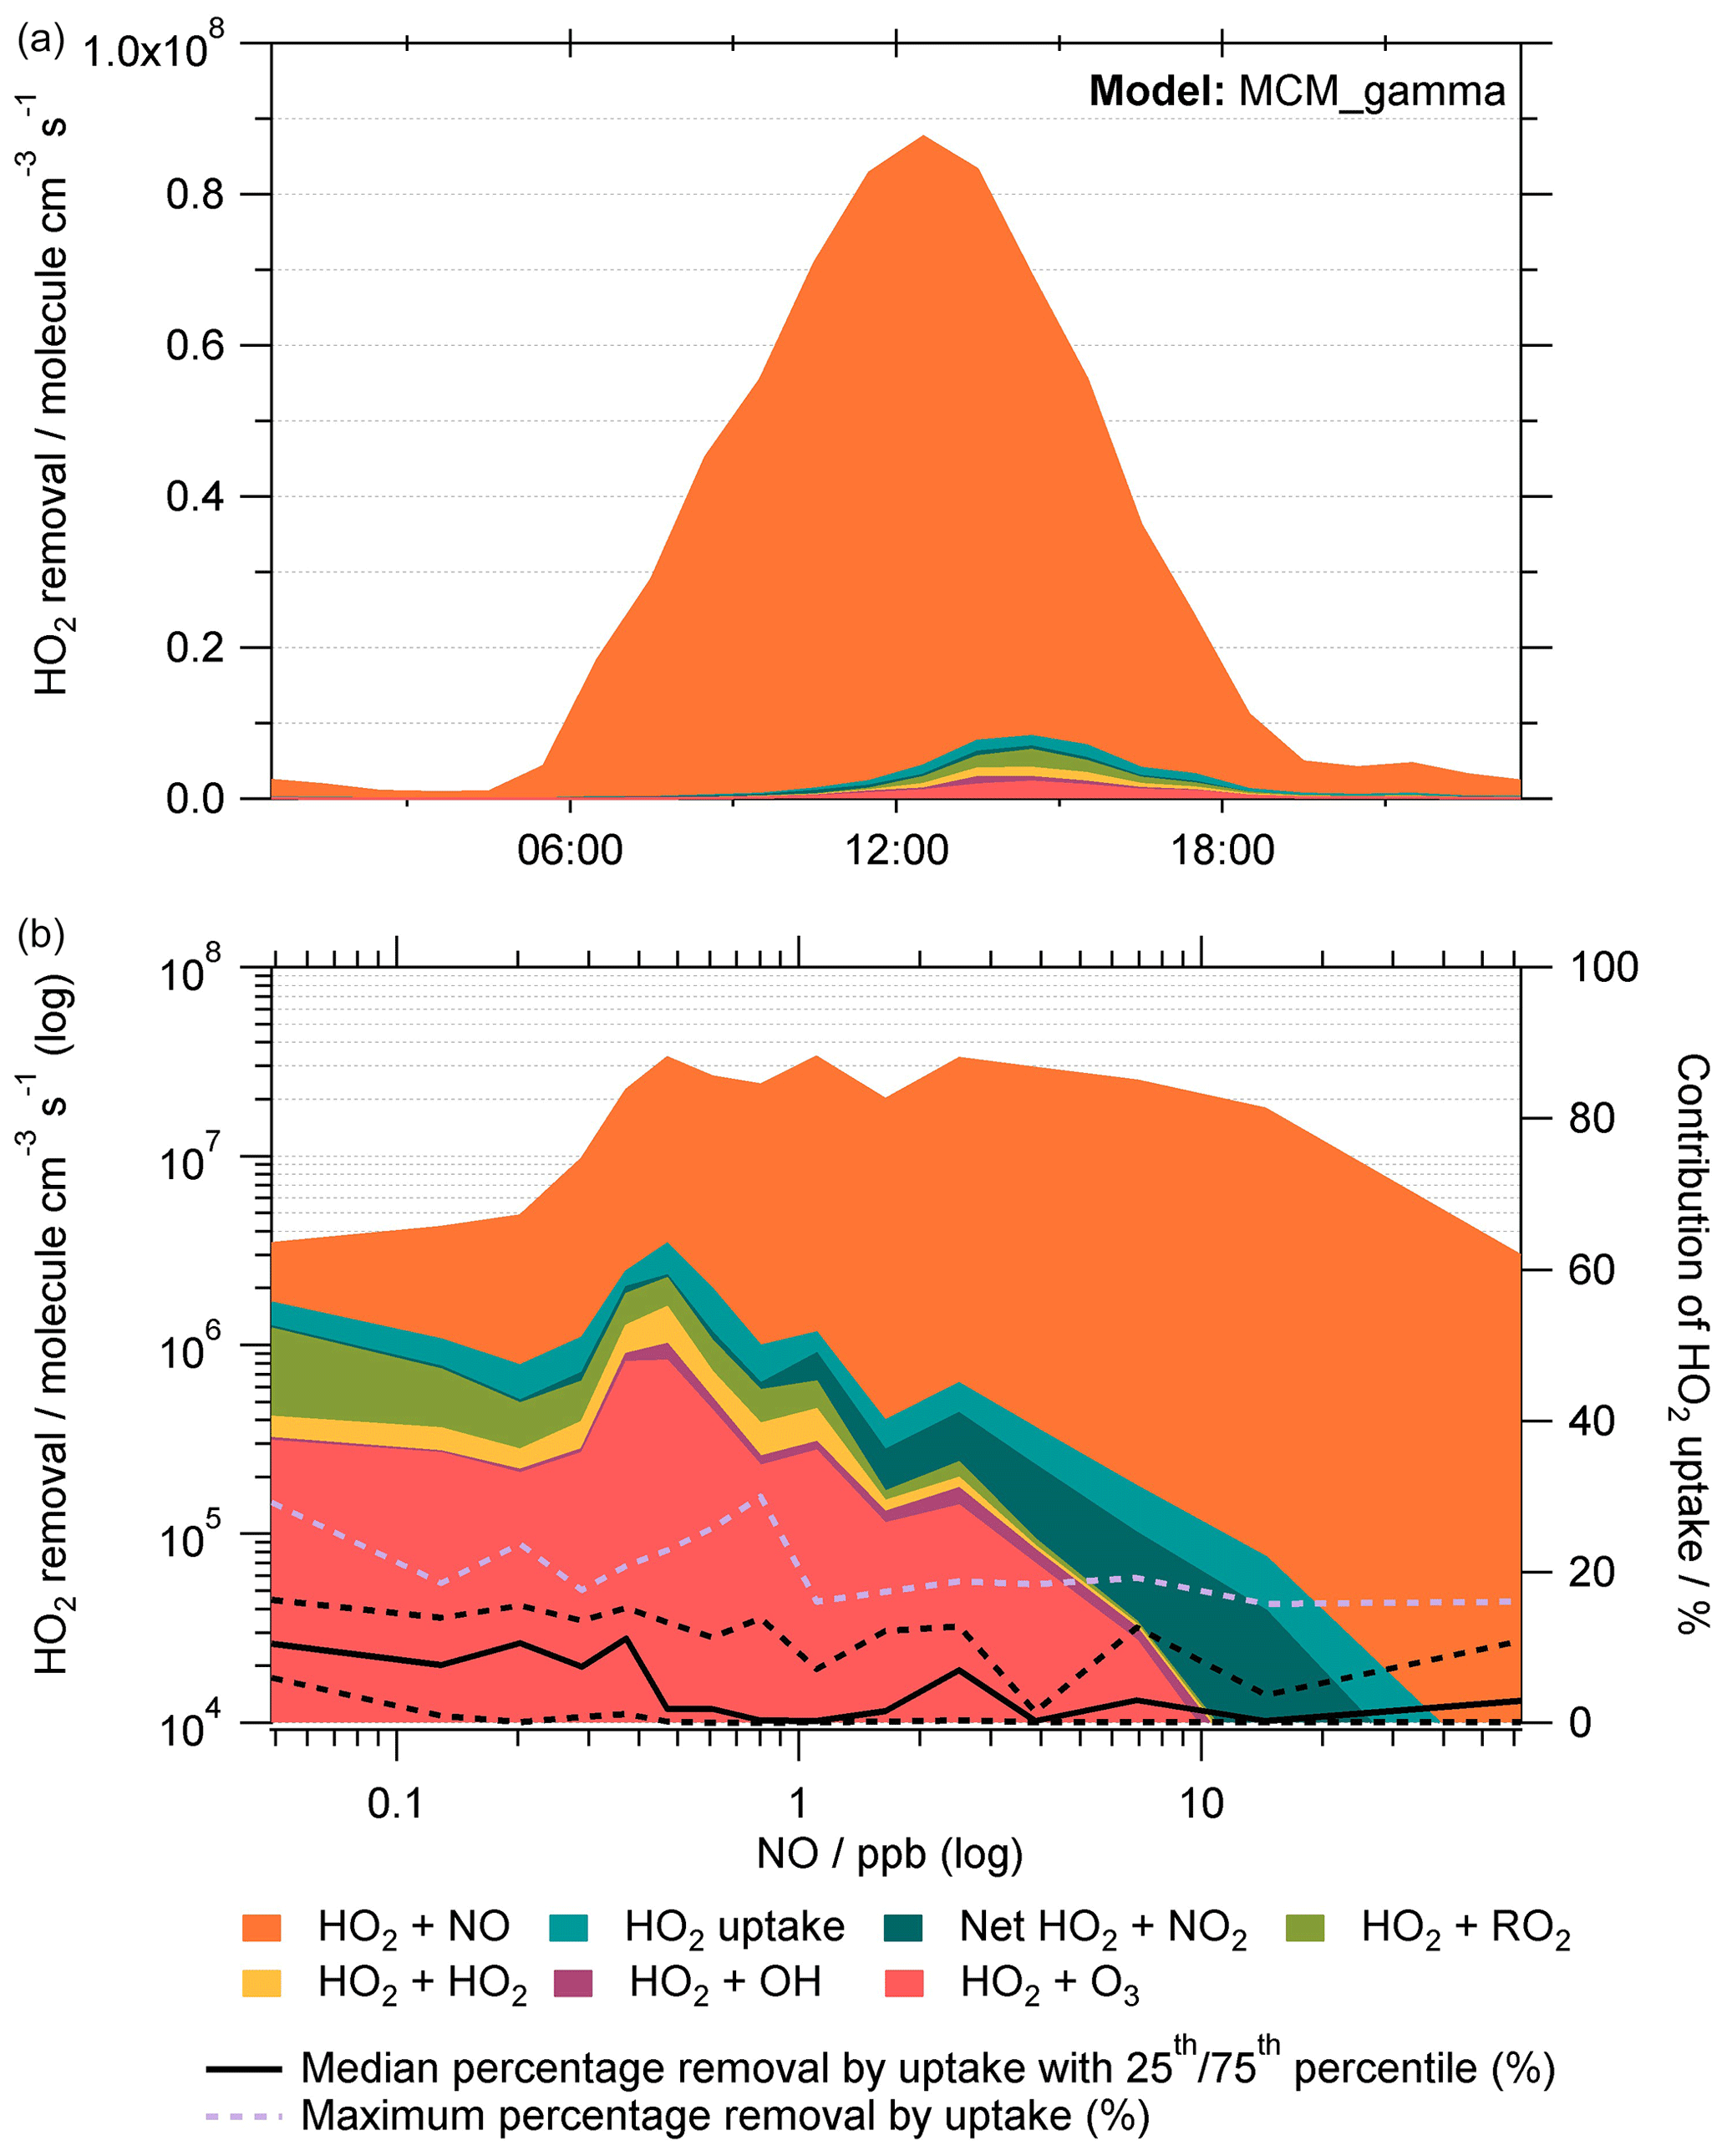
Figure 7Rate of destruction analysis (RODA) showing the dominant loss pathways of HO2 within MCM_gamma shown (a) as a diurnal variation and (b) as a function of NO mixing ratio (ppb). Median removal of HO2 by uptake (%) as a function of NO (ppb) is shown as solid black line in (b), with 25th and 75th percentiles shown as the black dashed lines. Maximum percentage removal by uptake for a given NO mixing ratio is shown as a lilac dashed line.
As shown in the RODA, the dominant loss pathway of HO2 is HO2 + NO across the entire campaign (90±14 % of total loss), followed by HO2 + RO2 (3.5±8.1 % of total loss). This is expected due to high levels of NOx in Beijing, especially during the day. As seen in the RODA diurnal profile, the HO2 + NO loss pathway peaks at midday following the morning peak in the NO mixing ratio due to rush hour traffic. As the NO mixing ratio decreases, the relative importance of other loss pathways of HO2 increases. At the lowest NO mixing ratio, i.e. <0.1 ppb NO, the loss pathways of HO2 within MCM_gamma with the largest contribution to total loss were HO2 + NO (55±19 %), HO2 + RO2 (23±17 %) and HO2 + O3 (9.3±4.1 %). It is worth noting that as the NO mixing ratio decreases, the relative importance of HO2 removal by O3 increases, presumably due to the titration reaction of O3 with NO decreasing (and hence higher observed [O3]). This could be important when considering policy changes with NOx pollution in China decreasing in recent years. The contribution of the various loss pathways of HO2 to total HO2 loss within MCM_gamma under low (<0.1 ppb) and high (>0.1 ppb) NO is compared in Table 4.
Table 4Average relative percentage contribution of individual HO2 loss pathways to the total loss of HO2 within MCM_gamma, averaged for days when NO was low (<0.1 ppb) and high (>0.1 ppb). Net HO2 + NO2 refers to HO2 + NO2 → HO2NO2 minus HO2NO2 → HO2 + NO2.

Though there is not a strong dependence of HO2 aerosol uptake loss pathway on the NO mixing ratio for the calculated (avg. 0.07±0.035) within MCM_gamma, it can be seen that at the lowest NO mixing ratios an average of ∼7 % of total HO2 loss is due to uptake, with a maximum at the lowest NO of ∼29 % (shown as lilac dashed line in Fig. 7). This is a significant loss of HO2, especially on days where the NO mixing ratio is low and the aerosol surface area is high, highlighting that the uptake of HO2 onto aerosols could be important and will be increasingly so at lower NO.
3.3.2 Comparison to fixed at 0.2
While the maximum calculated using the Song parameterization for the summer AIRPRO campaign was 0.15, to provide context with previous modelling studies, the commonly used fixed value of was added into the MCM_base model to give the MCM_SA model. The average median diurnal profiles of modelled OH, HO2 and RO2 (molec. cm−3) for MCM_base, MCM_gamma and MCM_SA are shown in Fig. 6.
In comparison to calculated in MCM_gamma, a fixed had a more significant effect on radical concentrations. While the median diurnal profile shows that the RO2 concentration was not significantly affected by the addition of HO2 uptake, the over-prediction seen in the average median HO2 concentration compared to the measurements at the 14:30 LT peak decreased from a factor of ∼2.9 in MCM_base to ∼2.3. A plot of measured to modelling ratio of HO2 as a function of aerosol surface area is shown in Fig. S4 for both MCM_gamma and MCM_SA. OH radical concentrations were still relatively well reproduced, with early-afternoon OH concentrations predicted better, though this is due to a shift in the modelled peak compared to the measured concentration peaking at midday. The ability of the model to reproduce the NO dependence of radical concentrations with the addition of is discussed in Sect. S1.3.
Table 5Average relative percentage contribution of individual HO2 loss pathways to the total loss of HO2 within MCM_SA (fixed ), averaged for days when NO was low (<0.1 ppb) and high (>0.1 ppb). Net HO2 + NO2 refers to HO2 + NO2 → HO2NO2 minus HO2NO2 → HO2 + NO2.

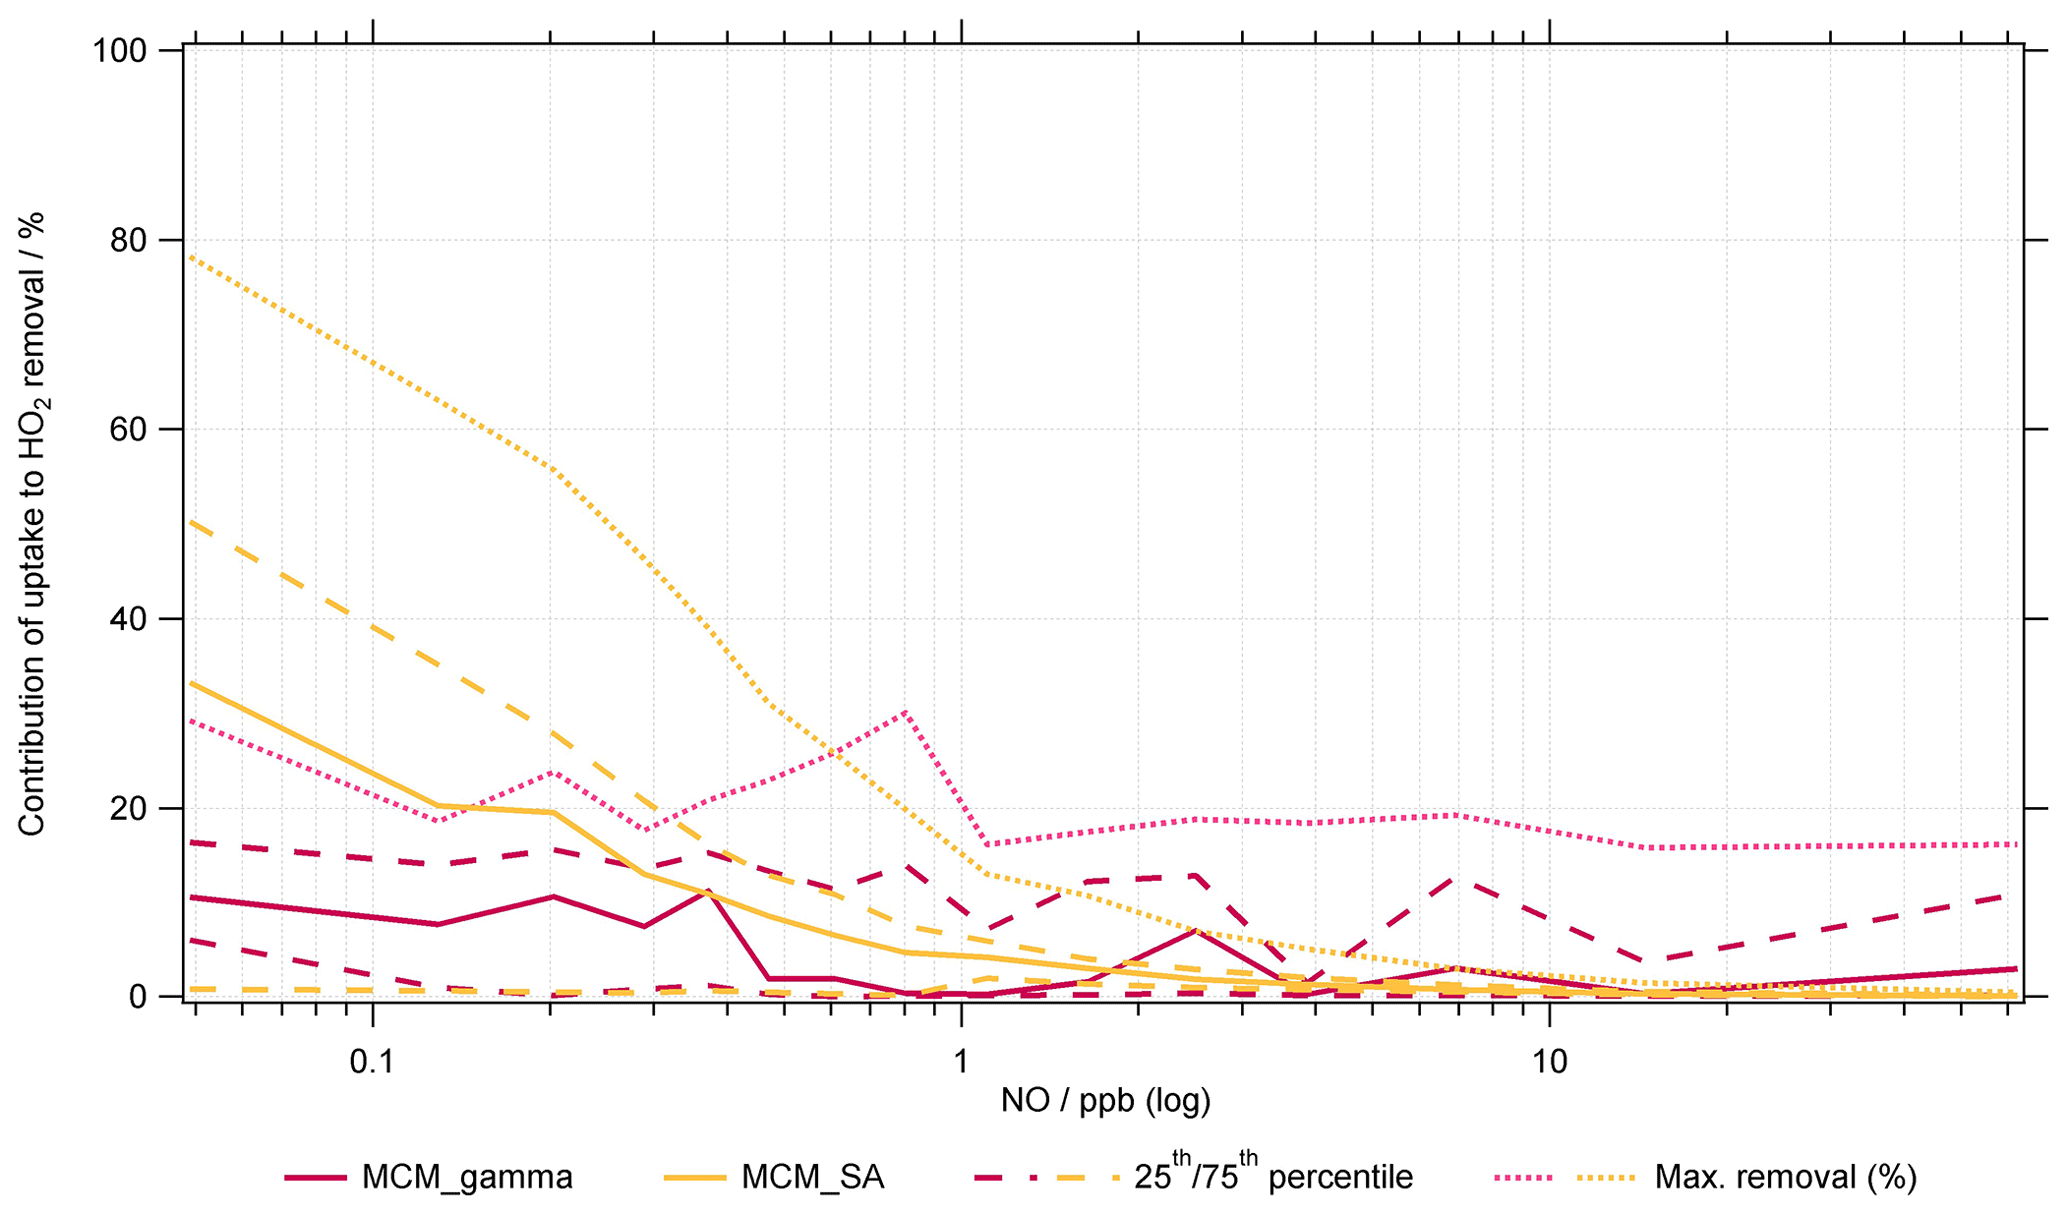
Figure 8Average percentage contribution of HO2 uptake to total HO2 removal within MCM_gamma (pink line, ) and MCM_SA model (yellow line, ) for summer AIRPRO campaign plotted as a function of NO mixing ratio (ppb). Dashed lines represent the 25th and 75th percentiles. Dotted lines represent maximum removal.
Analysis of the RODA for MCM_SA shows that with , HO2 aerosol uptake is a significant contributor to total loss of HO2 (8.1±13 %, averaged for all NO mixing ratios). However, for all NO mixing ratios, HO2 + NO is still the dominant loss pathway (86±18 %), as expected. At the lowest NO mixing ratios (i.e. <0.1 ppb), an average of ∼29 % of total HO2 loss is due to uptake, with a maximum at the lowest NO of ∼78 %, shown in Fig. 8. The contribution of the various loss pathways of HO2 to total HO2 loss within MCM_gamma under low (<0.1 ppb) and high (>0.1 ppb) NO is compared in Table 5. The comparison of percentage contribution of HO2 uptake to total HO2 removal binned against NO mixing ratio (ppb) for MCM_gamma and MCM_SA RODA is shown in Fig. 8.
3.3.3 Effect of on the O3 regime
was calculated for all model runs, MCM_base, MCM_gamma and MCM_SA using modelled [HO2] and [RO2] concentrations but measured values of [NO] and [NO2], to investigate the effect on the O3 regime of adding HO2 aerosol uptake into the model. The time series of calculated for all models, in addition to the regime transition point, , for the entire campaign is shown in Fig. 9.
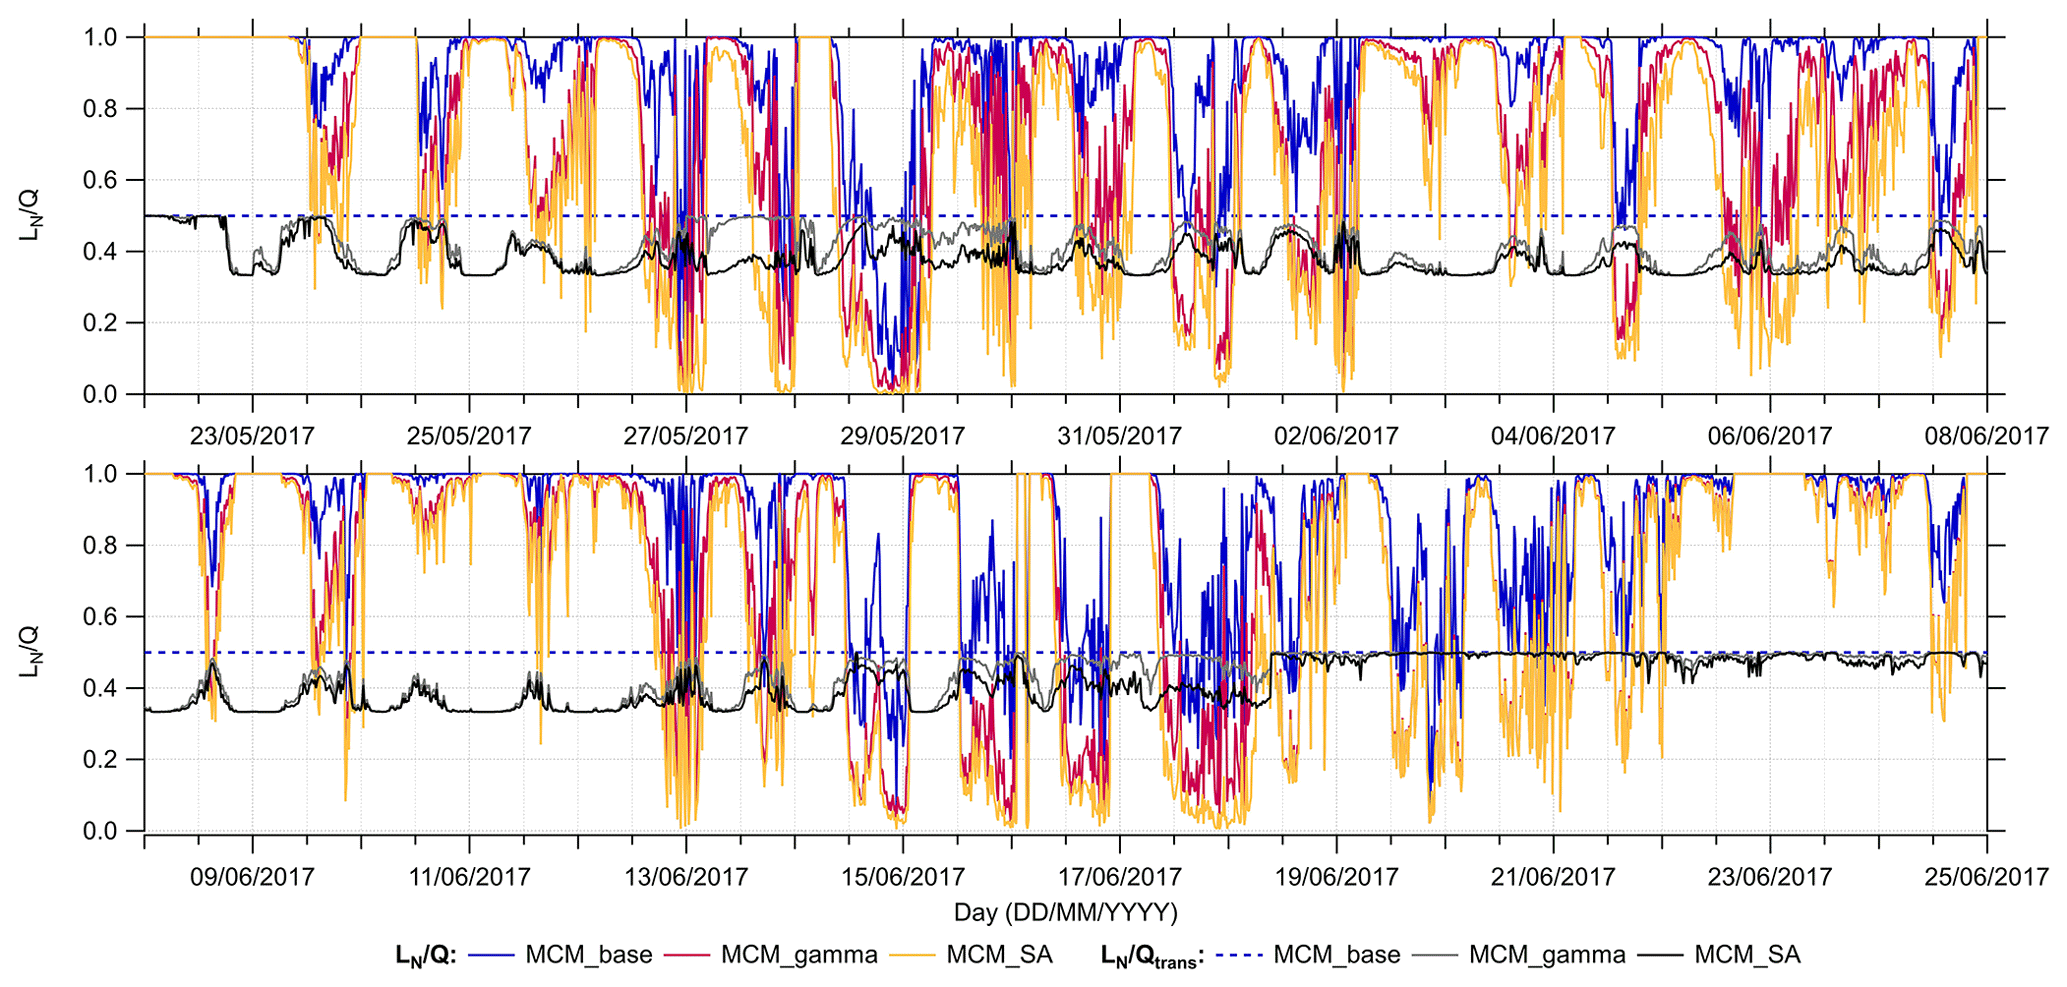
Figure 9Time series of calculated and values for MCM_base (blue), MCM_gamma (pink) and MCM_SA (yellow) models across the entire summer AIRPRO campaign. for MCM_gamma is shown as a grey line, while for MCM_SA is the black line.
When , this is defined as a NOx-sensitive regime, meaning that small changes in NOx will affect the rate of in situ O3 production. This can be seen on a few days across the campaign, specifically in the afternoon, due to NOx peaking in the morning due to traffic emissions before rapidly decreasing in the afternoon, which pushes the O3 regime on certain days from being VOC-limited to NOx-limited. However, for the majority of the campaign, the O3 production regime is VOC-limited, for all models, meaning that O3 production rates will not be significantly affected by small changes in NOx.
Binning against NO mixing ratio (ppb), in Fig. 10, shows the change from being a VOC- to NOx-limited regime at very low NO mixing ratios for MCM_base, MCM_gamma and MCM_SA. As aerosol uptake is added, the transition to NOx-limited regime occurs at higher NO, with the average median transition point occurring at ∼0.2 ppb NO for MCM_gamma (average ) and at ∼0.5 ppb NO for MCM_SA (fixed ). This suggests that a reduction in PM (and therefore uptake of HO2 onto aerosols) would delay the transition to a NOx-sensitive regime until lower NOx levels are reached. Therefore, any emissions policy aimed at reduced NOx to decrease O3 levels would not be as effective if PM is decreasing at the same time.
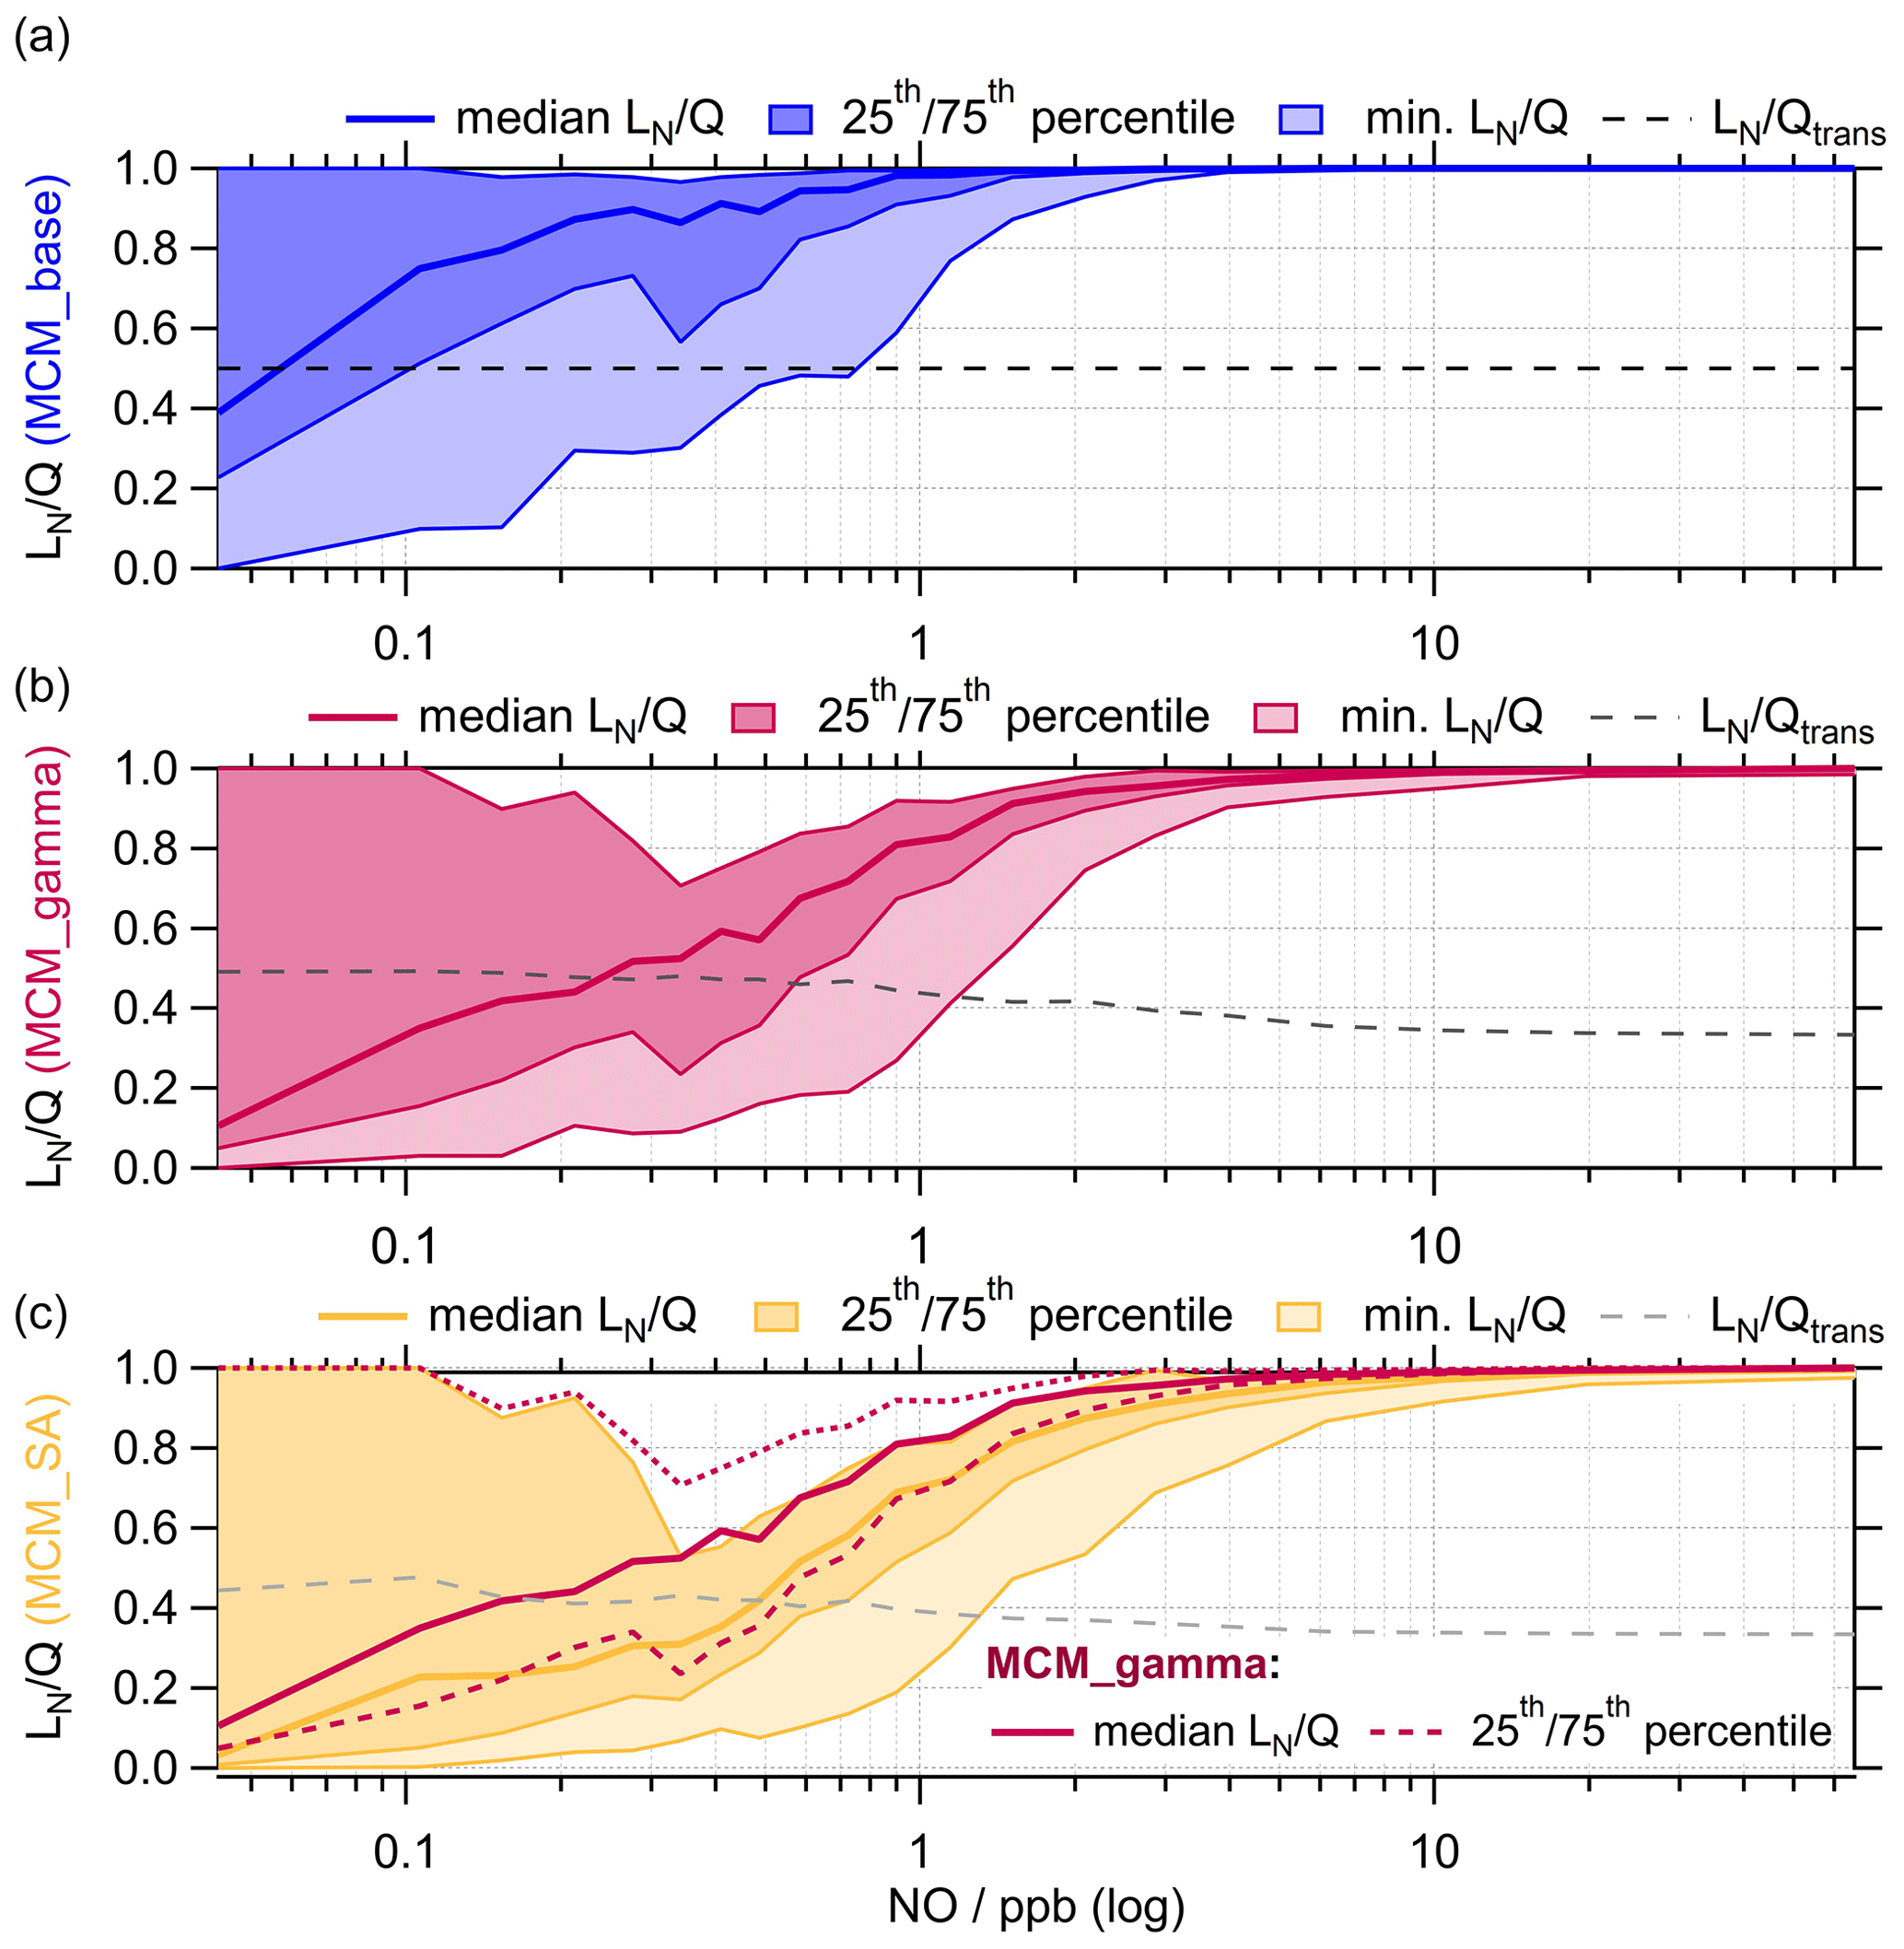
Figure 10 for MCM_base (blue, a), MCM_gamma (pink, b) and MCM_SA (yellow, c) binned against the log of measured NO mixing ratio for the entire summer AIRPRO campaign. for MCM_base (black dashed line) taken as 0.5 for the entire range of NO mixing ratios. for MCM_gamma (dark-grey dashed line) and MCM_SA (light-grey dashed line) calculated using Eq. (10). The 25th and 75th percentiles and minimum are plotted to show the full spread of data for each model scenario.
The average median diurnal profile of absolute P(O3), , for the MCM_gamma and MCM_SA over the entire campaign is shown in Fig. 11. The time series of absolute P(O3), averaged up to a daily time resolution, across the entire measurement period can be found in Fig. S5.
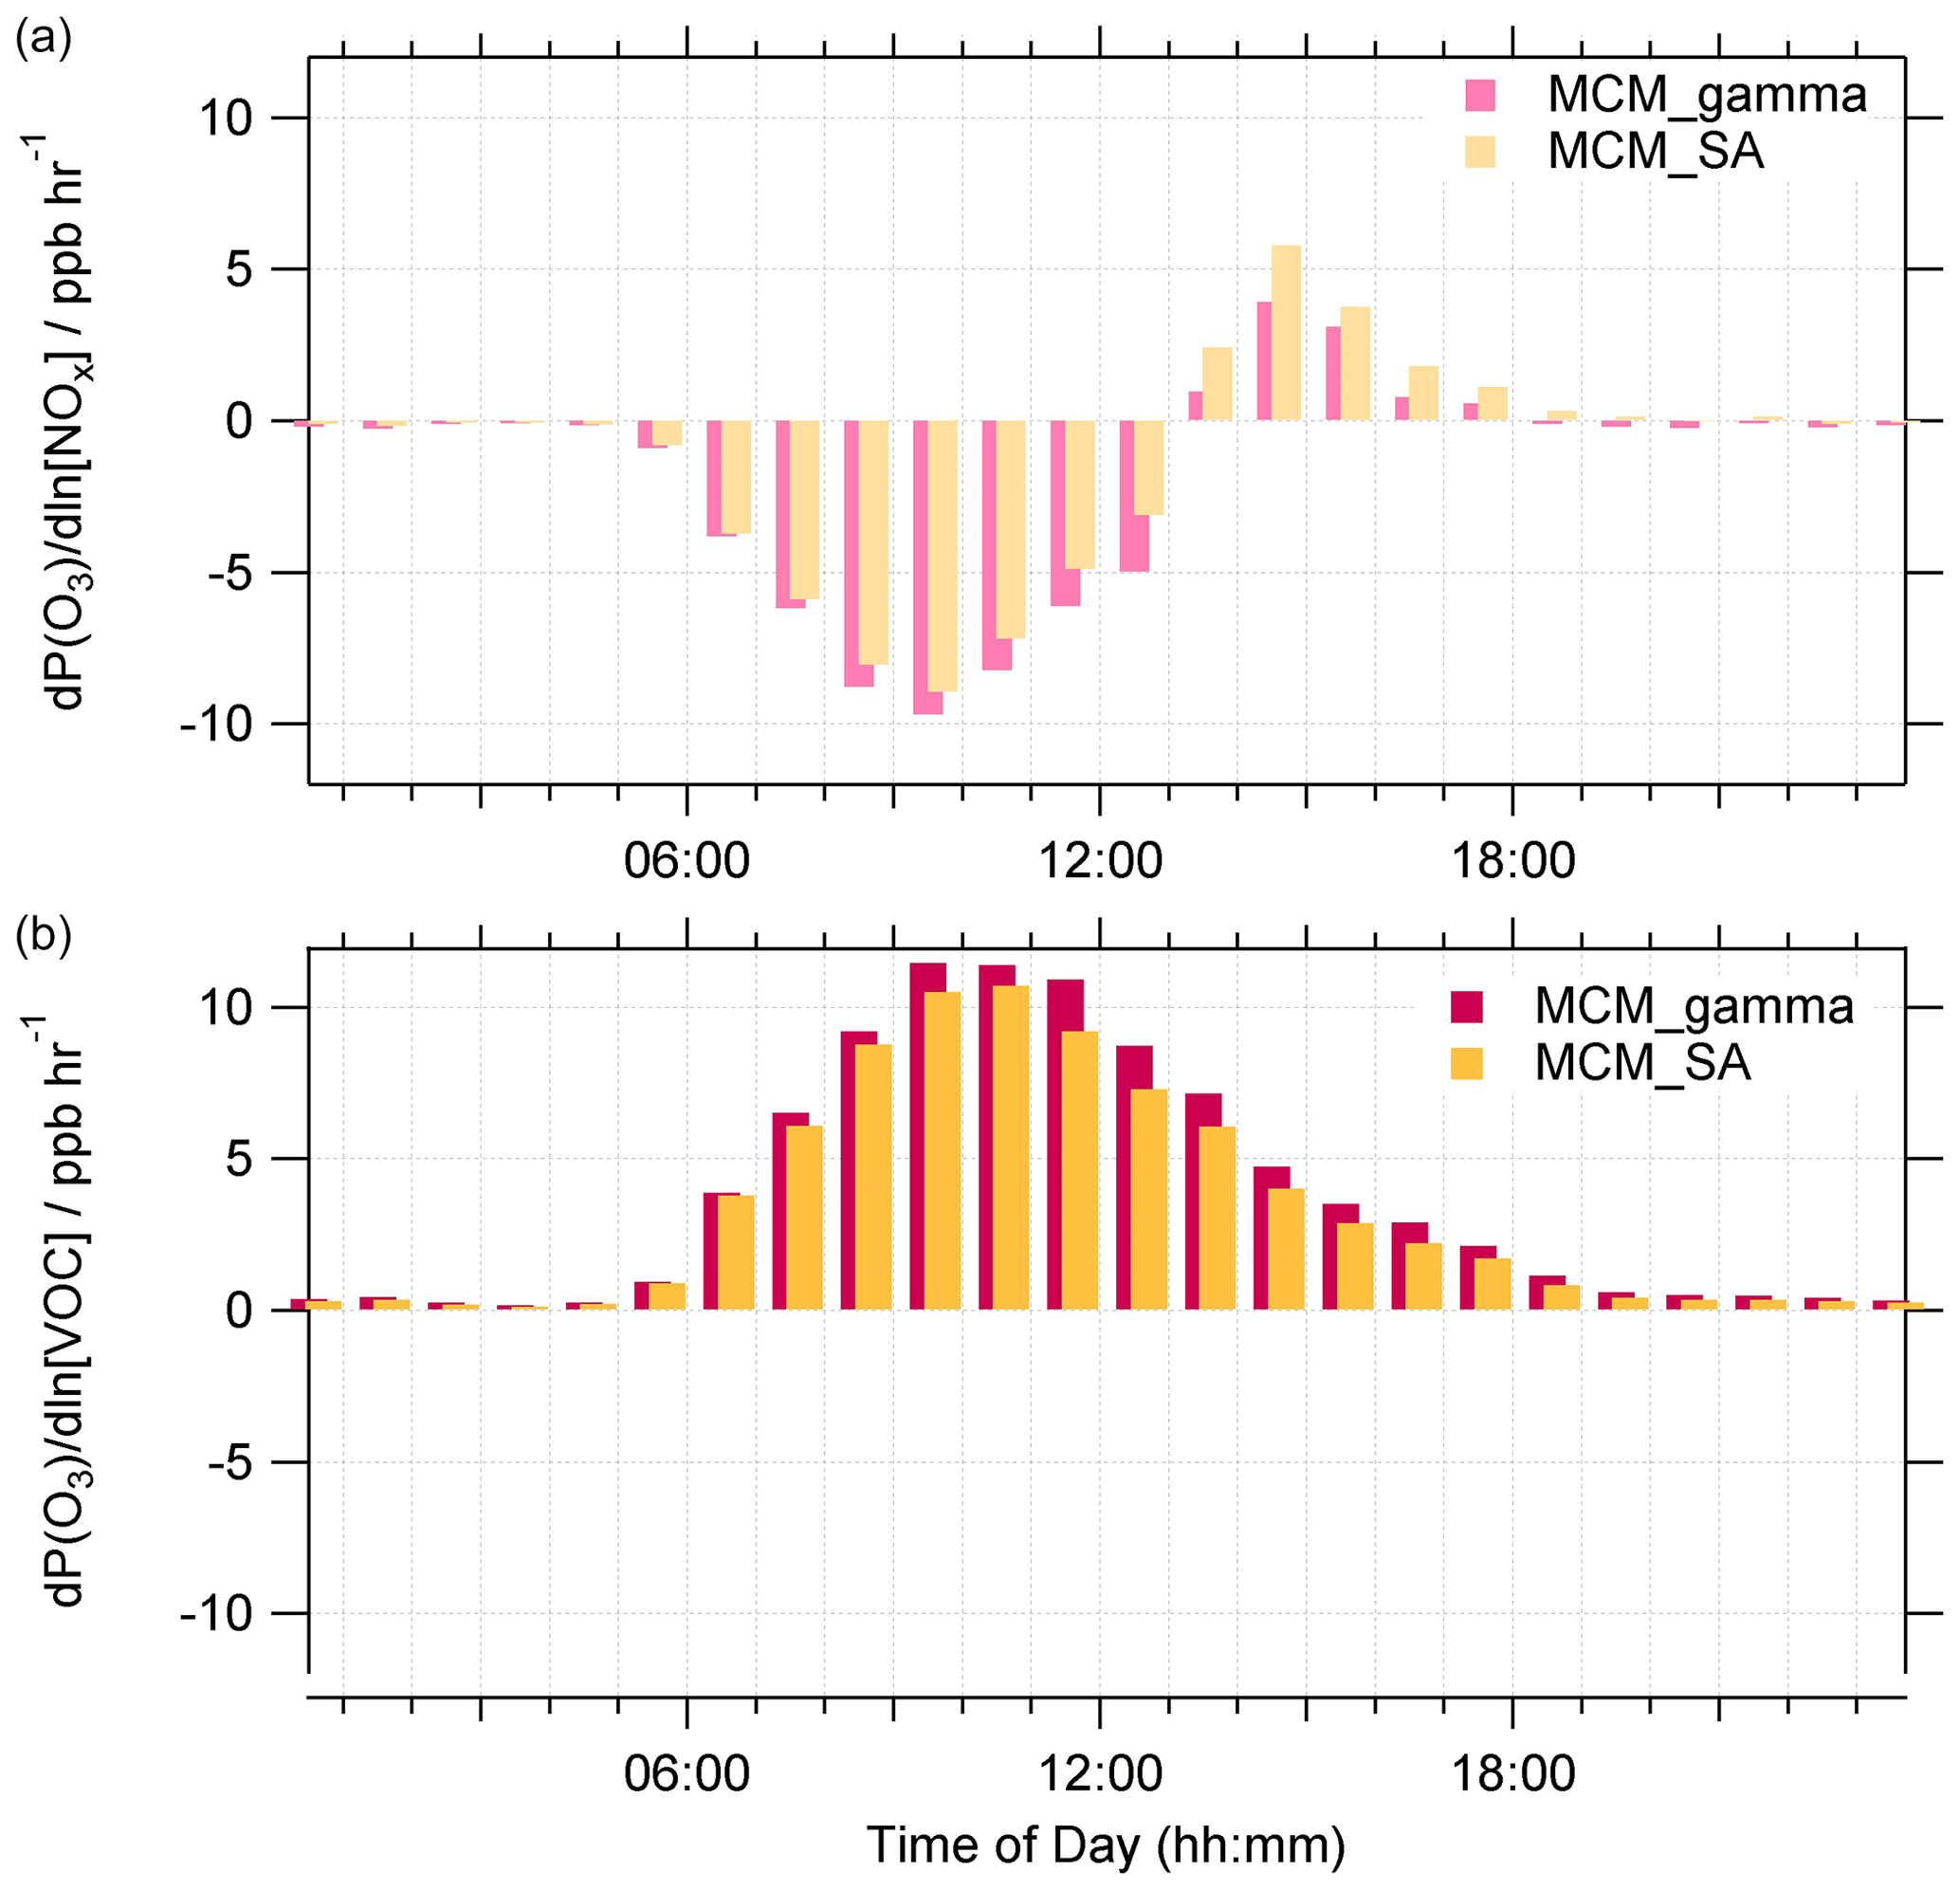
Figure 11Average median diurnal profile of absolute O3 sensitivity to NOx (a) and VOCs (b) (in ppbV h−1) for MCM_gamma (pink) and MCM_SA (yellow) across the entire summer AIRPRO campaign. MCM_gamma includes calculated using the Song parameterization (avg. 0.070±0.035), while MCM_SA includes at a fixed value of 0.2. All diurnal profiles are 60 min averages.
As expected from calculations, calculations of absolute O3 production sensitivity showcase that for both MCM_gamma and MCM_SA, on average, the O3 regime was VOC-sensitive throughout the day, with NOx sensitivity increasing in the afternoons. On a few days, when low NO mixing ratio coincided with high SA, the O3 regime can be seen shifting from being VOC- to NOx-limited. An example of this can be found in Fig. S6, for 17 and 18 June 2017 when the average NO mixing ratio was 0.41±0.50 ppb and the average SA was cm2 cm−3. With an increase in between MCM_gamma and MCM_SA, the sensitivity of the O3 regime to VOCs decreased, but sensitivity to NOx increased. This effect could be important for areas where the O3 production regime is NOx-sensitive or less strongly VOC-sensitive. With NOx levels reportedly decreasing across China in recent years (Krotkov et al., 2016; Liu et al., 2016; Miyazaki et al., 2017; van der A et al., 2017), O3 production regimes would be expected to move more towards NOx-sensitive regimes in urban China. However, with concomitant reduction in PM (Ma et al., 2016b; Lin et al., 2018), this transition to a NOx-sensitive regime may be delayed until lower NOx levels are reached.
Our results for the Beijing campaign are consistent with the results of Song et al. (2022), which concluded that for the conditions of the Wangdu campaign the addition of HO2 uptake does not change the overall O3 sensitivity regime throughout the campaign. However, the shift in O3 sensitivity regime from being VOC-limited to NOx-limited from the consideration of HO2 uptake could be important for areas with lower NOx and high aerosol particle loading.
Using the Song parameterization, the heterogeneous uptake coefficient of HO2, , was calculated for the summer AIRPRO campaign in Beijing in 2017 as a function of measured [Cu2+]eff, [ALWC] and [PM]. The calculated average (ranging from 0.002 to 0.15 across the campaign) was significantly lower than the fixed value of commonly used in modelling studies. This calculated value was similar, however, to values calculated for the Wangdu 2014 summer campaign in China (Tan et al., 2020; Song et al., 2020). Using the calculated , the OH, HO2 and RO2 radical concentrations were modelled using the Master Chemical Mechanism and compared to the measured campaign values, with and without the addition of HO2 aerosol uptake. Due to the low calculated value of , and the high levels of NO, the rate of destruction analysis showed the dominant HO2 loss pathway to be HO2 + NO for all NO mixing ratios, with HO2 uptake not contributing significantly to the loss of HO2 (<2 %). However, at the lowest NO mixing ratios (i.e. <0.1 ppb), HO2 loss onto aerosols contributed up to a maximum of 29 % of the total HO2 loss. Using the modelled HO2 and RO2 radical concentrations for model scenarios with and without HO2 uptake showed that on average the O3 production regime was VOC-limited across the entire campaign, with the exception of several days with low NO mixing ratio where the regime tended towards NOx-limited, meaning that small changes in NOx would not have a large effect on the O3 production for this summer period in Beijing, though changes in HO2 uptake could. While the addition of the calculated uptake coefficient did not change the overall O3 regime across the campaign, with the O3 production regime remaining strongly VOC-limited, the transition from a VOC-sensitive to NOx-sensitive O3 regime occurs at higher NOx. This means that for Beijing, where the O3 production regime is strongly VOC-sensitive and NOx levels are high, any policy looking to reduce O3 via the reduction of NOx needs to consider concurrent PM reduction policies which may affect HO2 uptake. In cleaner environments, where NOx levels are lower, but aerosol surface area is still high, lower values of , i.e. less than 0.2, could have a more significant effect on both overall HO2 concentration and the O3 production regime.
Data presented in this study can be obtained from the authors upon request (d.e.heard@leeds.ac.uk).
The supplement related to this article is available online at: https://doi.org/10.5194/acp-23-5679-2023-supplement.
LKW, EJS, RWM, CY and DEH carried out the radical measurements. LKW and EJS developed the model, and JED performed the calculations. JDL, FS, JRH, RED, MS, JFH, ACL, AM, SDW, AB, TJB, HC, BO, CJP, CNH, RLJ, LRC, LJK, WJFA, WJB, SS, JX, TV, ZS, RMH, SK, SG, YS, WX, SY, LW, PF and XW provided logistical support and supporting data to constrain the model. JED prepared the manuscript with contributions from all co-authors.
The contact author has declared that none of the authors has any competing interests.
Publisher's note: Copernicus Publications remains neutral with regard to jurisdictional claims in published maps and institutional affiliations.
Joanna Dyson, Eloise Slater, Robert Woodward-Massey, Freya Squires and Archit Mehra acknowledge NERC SPHERES PhD studentships. We would like to thank Likun Xue and co-authors for providing the chlorine chemistry module used in the MCM. We acknowledge the support from Zifa Wang and Jie Li from the Institute of Applied Physics (IAP), Chinese Academy of Sciences, for hosting the APHH-Beijing campaign. We thank Liangfang Wei, Hong Ren, Qiaorong Xie, Wanyu Zhao, Linjie Li, Ping Li, Shengjie Hou and Qingqing Wang from IAP, Kebin He and Xiaoting Cheng from Tsinghua University, and James Allan from the University of Manchester for providing logistic and scientific support for the field campaigns and Tuan Vu from Imperial College London for providing supervision and supporting data. We would also like to thank other participants in the APHH field campaign.
This research has been supported by the UK Research and Innovation (SPHERES PhD Studentship and grant no. NE/S006680/1).
This paper was edited by Christopher Cantrell and reviewed by two anonymous referees.
Bohn, B., Heard, D. E., Mihalopoulos, N., Plass-Dülmer, C., Schmitt, R., and Whalley, L. K.: Characterisation and improvement of j(O1D) filter radiometers, Atmos. Meas. Tech., 9, 3455–3466, https://doi.org/10.5194/amt-9-3455-2016, 2016.
Brauer, M., Freedman, G., Frostad, J., van Donkelaar, A., Martin, R. V., Dentener, F., Dingenen, R. v., Estep, K., Amini, H., Apte, J. S., Balakrishnan, K., Barregard, L., Broday, D., Feigin, V., Ghosh, S., Hopke, P. K., Knibbs, L. D., Kokubo, Y., Liu, Y., Ma, S., Morawska, L., Sangrador, J. L. T., Shaddick, G., Anderson, H. R., Vos, T., Forouzanfar, M. H., Burnett, R. T., and Cohen, A.: Ambient Air Pollution Exposure Estimation for the Global Burden of Disease 2013, Environ. Sci. Technol., 50, 79–88, https://doi.org/10.1021/acs.est.5b03709, 2016.
Commane, R., Floquet, C. F. A., Ingham, T., Stone, D., Evan, M. J., and Heard, D. E.: Observations of OH and HO2 radicals over West Africa, Atmos. Chem. Phys., 10, 8783–8801, https://doi.org/10.5194/acp-10-8783-2010, 2010.
Cooper, P. L. and Abbatt, J. P. D.: Heterogeneous Interactions of OH and HO2 Radicals with Surfaces Characteristic of Atmospheric Particulate Matter, J. Phys. Chem., 100, 2249–2254, https://doi.org/10.1021/jp952142z, 1996.
Crilley, L. R., Kramer, L., Pope, F. D., Whalley, L. K., Cryer, D. R., Heard, D. E., Lee, J. D., Reed, C., and Bloss, W. J.: On the interpretation of in situ HONO observations via photochemical steady state, Faraday Discuss., 189, 191–212, https://doi.org/10.1039/c5fd00224a, 2016.
Dunmore, R., Hopkins, J., Lidster, R., Lee, J., Evans, M., Rickard, A., Lewis, A., and Hamilton, J.: Diesel-related hydrocarbons can dominate gas phase reactive carbon in megacities, Atmos. Chem. Phys., 15, 9983–9996, https://doi.org/10.5194/acp-15-9983-2015, 2015.
Forster, P., Ramaswamy, V., Artaxo, P., Berntsen, T., Betts, R., Fahey, D. W., Haywood, J., Lean, J., Lowe, D. C., Myhre, G., Nganga, J., Prinn, R., Raga, G., Schulz, M., and Dorland, R. V.: Chapter 2. Changes in atmospheric constituents and in radiative forcing, Climate Change 2007, The Physical Science Basis, Cambridge University Press, Cambridge, UK and New York, NY, https://www.ipcc.ch/site/assets/uploads/2018/02/ar4-wg1-chapter2-1.pdf (last access: 12 May 2023), 2007.
Fountoukis, C. and Nenes, A.: ISORROPIA II: a computationally efficient thermodynamic equilibrium model for K+–Ca2+–Mg2+–NH–Na+–SO–NO–Cl−–H2O aerosols, Atmos. Chem. Phys., 7, 4639–4659, https://doi.org/10.5194/acp-7-4639-2007, 2007.
Gakidou, E., Afshin, A., Abajobir, A. A., Abate, K. H., Abbafati, C., Abbas, K. M., Abd-Allah, F., Abdulle, A. M., Abera, S. F., and Aboyans, V.: Global, regional, and national comparative risk assessment of 84 behavioural, environmental and occupational, and metabolic risks or clusters of risks, 1990–2016: a systematic analysis for the Global Burden of Disease Study 2016, Lancet, 390, 1345–1422, https://doi.org/10.1016/S0140-6736(18)32279-7, 2017.
George, I. J., Matthews, P. S. J., Whalley, L. K., Brooks, B., Goddard, A., Baeza-Romero, M., and Heard, D. E.: Measurements of uptake coefficients for heterogeneous loss of HO2 onto submicron inorganic salt aerosols, Phys. Chem. Chem. Phys., 15, 12829–12845, https://doi.org/10.1039/c3cp51831k, 2013.
Hopkins, J. R., Jones, C. E., and Lewis, A. C.: A dual channel gas chromatograph for atmospheric analysis of volatile organic compounds including oxygenated and monoterpene compounds, J. Environ. Monit., 13, 2268–2276, https://doi.org/10.1039/C1EM10050E, 2011.
Ivatt, P. D., Evans, M. J., and Lewis, A. C.: Suppression of surface ozone by an aerosol-inhibited photochemical ozone regime, Nat. Geosci, 15, 536–540, https://doi.org/10.1038/s41561-022-00972-9, 2022.
Jacob, D. J.: Heterogeneous chemistry and tropospheric ozone, Atmos. Environ., 34, 2131–2159, https://doi.org/10.1016/S1352-2310(99)00462-8, 2000.
Jin, Y., Andersson, H., and Zhang, S.: Air Pollution Control Policies in China: A Retrospective and Prospects, Int. J. Environ. Res. Publ. Health, 13, 1219, https://doi.org/10.3390/ijerph13121219, 2016.
Kanaya, Y. G., Cao, R. Q., Kato, S. G., Miyakawa, Y. K., Kajii, Y., Tanimoto, H., Yokouchi, Y., Mochida, M., Kawamura, K., and Akimoto, H.: Chemistry of OH and HO2 radicals observed at Rishiri Island, Japan, in September 2003: Missing daytime sink of HO2 and positive nighttime correlations with monoterpenes, J. Geophys. Res.-Atmos., 112, D11308, https://doi.org/10.1029/2006JD007987, 2007.
Kleinman, L. I.: Ozone process insights from field experiments – part II: Observation-based analysis for ozone production, Atmos. Environ., 34, 2023–2033, https://doi.org/10.1016/S1352-2310(99)00457-4, 2000.
Kleinman, L. I., Daum, P. H., Lee, J. H., Lee, Y.-N., Nunnermacker, L. J., Springston, S. R., Newman, L., Weinstein-Lloyd, J., and Sillman, S.: Dependence of ozone production on NO and hydrocarbons in the troposphere, Geophys. Res. Lett., 24, 2299–2302, https://doi.org/10.1029/97GL02279, 1997.
Kleinman, L. I., Daum, P. H., Lee, Y.-N., Nunnermacker, L. J., Springston, S. R., Weinstein-Lloyd, J., and Rudolph, J.: Sensitivity of ozone production rate to ozone precursors, Geophys. Res. Lett., 28, 2903–2906, https://doi.org/10.1029/2000GL012597, 2001.
Krotkov, N. A., McLinden, C. A., Li, C., Lamsal, L. N., Celarier, E. A., Marchenko, S. V., Swartz, W. H., Bucsela, E. J., Joiner, J., Duncan, B. N., Boersma, K. F., Veefkind, J. P., Levelt, P. F., Fioletov, V. E., Dickerson, R. R., He, H., Lu, Z., and Streets, D. G.: Aura OMI observations of regional SO2 and NO2 pollution changes from 2005 to 2015, Atmos. Chem. Phys., 16, 4605–4629, https://doi.org/10.5194/acp-16-4605-2016, 2016.
Lakey, P. S. J., George, I. J., Whalley, L. K., Baeza-Romero, M., and Heard, D. E.: Measurements of HO2 uptake coefficients onto single component organic aerosols, Environ. Sci. Technol., 49, 4878–4885, https://doi.org/10.1021/acs.est.5b00948, 2015.
Lakey, P. S. J., George, I. J., Baeza-Romero, M., Whalley, L. K., and Heard, D. E.: Organics substantially reduce HO2 uptake onto aerosols containing transition metal ions, J. Phys. Chem. A, 120, 1421–1430, https://doi.org/10.1021/acs/jpca.5b06316, 2016.
Le Breton, M., Bacak, A., Muller, J. B. A., Bannan, T. J., Kennedy, O., Ouyang, B., Xiao, P., Bauguitte, S. J. B., Shallcross, D. E., Jones, R. L., Daniels, M. J. S., Ball, S. M., and Percival, C. J.: The first airborne comparison of N2O5 measurements over the UK using a CIMS and BBCEAS during the RONOCO campaign, Anal. Meth., 6, 9731–9743, https://doi.org/10.1039/C4AY02273D, 2014.
Levy, H.: Normal atmosphere: large radical and formaldehyde concentrations predicted, Science, 173, 141-143, https://doi.org/10.1126/science.173.3992.141, 1971.
Li, H., Wang, D., Cui, L., Gao, Y., Huo, J., Wang, X., Zhang, Z., Tan, Y., Huang, Y., Cao, J., and Chow, J. C.:Characteristics of atmospheric PM2.5 composition during the implementation of stringent pollution control measures in shanghai for the 2016 G20 summit, Sci. Total Environ., 648, 1121–1129, 2019.
Li, K., Jacob, D. J., Liao, H., Shen, L., Zhang, Q., and Bates, K.: Anthropogenic drivers of 2013-2017 trends in summer surface ozone in China, P. Natl. Acad. Sci. USA, 116, 422–427, https://doi.org/10.1073/pnas.1812168116, 2018.
Lin, C. Q., Liu, G., Lau, A. K. H., Li, Y., Li, C. C., Fung, J. C. H., and Lao, X. Q.: High-resolution satellite remote sensing of provincial PM2.5 trends in China from 2001 to 2015, Atmos. Environ., 180, 110–116, https://doi.org/10.1016/j.atmosenv.2018.02.045, 2018.
Liu, F., Zhang, Q., van der A, R. J., Zheng, B., Tong, D., Yan, L., Zheng, Y., and He, K.: Recent reduction in NOx emissions over China: synthesis of satellite observations and emission inventories, Environ. Res. Lett., 11, 114002, https://doi.org/10.1088/1748-9326/11/11/114002, 2016.
Liu, Y.-H., Liao, W.-Y., Lin, X.-F., Li, L., and Zeng, X.-l.: Assessment of Co-benefits of vehicle emission reduction measures for 2015–2020 in the Pearl River Delta region, China, Environ. Pollut., 223, 62–72, https://doi.org/10.1016/j.envpol.2016.12.031, 2017.
Ma, Z., Xu, J., Quan, W., Zhang, Z., Lin, W., and Xu, X.: Significant increase of surface ozone at a rural site, north of eastern China, Atmos. Chem. Phys., 16, 3969–3977, https://doi.org/10.5194/acp-16-3969-2016, 2016a.
Ma, Z., Hu, X., Sayer, A. M., Levy, R., Zhang, Q., Xue, Y., Tong, S., Bi, J., Huang, L., and Liu, Y.: Satellite-Based Spatiotemporal Trends in PM2.5 Concentrations: China, 2004–2013, Environ. Health Perspect., 124, 184–192, https://doi.org/10.1289/ehp.1409481, 2016b.
Mao, J., Jacob, D. J., Evans, M. J., Olson, J. R., Ren, X., Brune, W. H., Chair, J. M. S., Crounse, J. D., Spencer, K. M., Beaver, M. R., Wennberg, P. O., Cubison, M. J., Jimenez, J. L., Fried, A., Weibring, P., Walega, J. G., Hall, S. R., Weinheimer, A. J., Cohen, R. C., Chen, G., Crawford, J. H., McHaughton, C., Clarke, A. D., Jaegle, L., Fisher, J. K., Yantosca, R. M., LeSager, P., and Carouge, C.: Chemsitry of hydrogen oxide radicals (HOx) in the artic troposphere in spring, Atmos. Chem. Phys., 10, 5823–5838, https://doi.org/10.5194/acp-10-5823-2010, 2010.
Mao, J., Fan, S., Jacob, D. J., and Travis, K. R.: Radical loss in the atmosphere from Cu-Fe redox coupling in aerosols, Atmos. Chem. Phys., 13, 509–519, https://doi.org/10.5194/acp-13-509-2013, 2013.
Martinez, M., Harder, H., Kovacs, T. A., Simpas, J. B., Bassis, J., Lesher, R., Brune, W. H., Frost, G. J., Williams, E. J., Stroud, C. A., Jobson, B. T., Roberts, J. M., Hall, S. R., Shetter, R. E., Wert, B., Fried, A., Alicke, B., Stutz, J., Young, V. L., White, A. B., and Zamora, R. J.: OH and HO2 concentrations, sources, and loss rates during the Southern Oxidants Study in Nashville, Tennessee, summer 1999, J. Geophys. Res.-Atmos., 108, 4617, https://doi.org/10.1029/2003JD003551, 2003.
Matthews, P. S. J., Baeza-Romero, M., Whalley, L. K., and Heard, D. E.: Uptake of HO2 radicals onto Arizona test dust particles using an aerosol flow tube, Atmos. Chem. Phys., 14, 7397–7408, https://doi.org/10.5194/acp-14-7397-2014, 2014.
Miyazaki, K., Eskes, H., Sudo, K., Boersma, K. F., Bowman, K., and Kanaya, Y.: Decadal changes in global surface NOx emissions from multi-constituent satellite data assimilation, Atmos. Chem. Phys., 17, 807–837, https://doi.org/10.5194/acp-17-807-2017, 2017.
Mozurkewich, M., McMurry, P. H., Gupta, A., and Calvert, J. G.: Mass accommodation coefficient for HO2 radicals on aqueous particles, J. Geophys. Res., 92, 4163–4170, https://doi.org/10.1029/JD092iD04p04163, 1987.
Sakamoto, Y., Sadanaga, Y., Li, J., Matsuoka, K., Takemura, M., Fujii, T., Nakagawa, M., Kohno, N., Nakashima, Y., Sato, K., Nakayama, T., Kato, S., Takami, A., Yoshino, A., Murano, K., and Kajii, Y.: Relative and Absolute Sensitivity Analysis on Ozone Production in Tsukuba, a City in Japan, Environ. Sci. Technol., 53, 13629–13635, https://doi.org/10.1021/acs.est.9b03542, 2019.
Shi, Z., Vu, T., Kotthaus, S., Harrison, R. M., Grimmond, S., Yue, S., Zhu, T., Lee, J., Han, Y., Demuzere, M., Dunmore, R. E., Ren, L., Liu, D., Wang, Y., Wild, O., Allan, J., Acton, W. J., Barlow, J., Barratt, B., Beddows, D., Bloss, W. J., Calzolai, G., Carruthers, D., Carslaw, D. C., Chan, Q., Chatzidiakou, L., Chen, Y., Crilley, L., Coe, H., Dai, T., Doherty, R., Duan, F., Fu, P., Ge, B., Ge, M., Guan, D., Hamilton, J. F., He, K., Heal, M., Heard, D., Hewitt, C. N., Hollaway, M., Hu, M., Ji, D., Jiang, X., Jones, R., Kalberer, M., Kelly, F. J., Kramer, L., Langford, B., Lin, C., Lewis, A. C., Li, J., Li, W., Liu, H., Liu, J., Loh, M., Lu, K., Lucarelli, F., Mann, G., McFiggans, G., Miller, M. R., Mills, G., Monk, P., Nemitz, E., O'Connor, F., Ouyang, B., Palmer, P. I., Percival, C., Popoola, O., Reeves, C., Rickard, A. R., Shao, L., Shi, G., Spracklen, D., Stevenson, D., Sun, Y., Sun, Z., Tao, S., Tong, S., Wang, Q., Wang, W., Wang, X., Wang, X., Wang, Z., Wei, L., Whalley, L., Wu, X., Wu, Z., Xie, P., Yang, F., Zhang, Q., Zhang, Y., Zhang, Y., and Zheng, M.: Introduction to the special issue “In-depth study of air pollution sources and processes within Beijing and its surrounding region (APHH-Beijing)”, Atmos. Chem. Phys., 19, 7519–7546, https://doi.org/10.5194/acp-19-7519-2019, 2019.
Silver, B., Reddington, C. L., Arnold, S. R., and Spracklen, D. V.: Substantial changes in air pollution across China during 2015–2017, Environ. Res. Lett., 13, 114012, https://doi.org/10.1088/1748-9326/aae718, 2018.
Slater, E. J.: Understanding radical chemistry in Beijing through observations and modelling, School of Chemistry, University of Leeds, Leeds, https://etheses.whiterose.ac.uk/27477/ (last access: 12 May 2023), 2020.
Slater, E. J., Whalley, L. K., Woodward-Massey, R., Ye, C., Lee, J. D., Squires, F., Hopkins, J. R., Dunmore, R. E., Shaw, M., Hamilton, J. F., Lewis, A. C., Crilley, L. R., Kramer, L., Bloss, W., Vu, T., Sun, Y., Xu, W., Yue, S., Ren, L., Acton, W. J. F., Hewitt, C. N., Wang, X., Fu, P., and Heard, D. E.: Elevated levels of OH observed in haze events during wintertime in central Beijing, Atmos. Chem. Phys., 20, 14847–14871, https://doi.org/10.5194/acp-20-14847-2020, 2020.
Smith, K. R., Edwards, P. M., Evans, M. J., Lee, J. D., Shaw, M. D., Squires, F., Wilde, S., and Lewis, A. C.: Clustering approaches to improve the performance of low cost air pollution sensors, Faraday Discuss., 200, 621–637, https://doi.org/10.1039/C7FD00020K, 2017.
Sommariva, R., Haggerstone, A. L., Carpenter, L. J., Carslaw, N., Creasey, D. J., Heard, D. E., Lee, J. D., Lewsi, A. C., Pilling, M. J., and Zador, J.: OH and HO2 chemistry in clean marine air during SOAPEX-2, Atmos. Chem. Phys., 4, 839–856, https://doi.org/10.5194/acp-4-839-2004, 2004.
Song, H., Chen, X., Lu, K., Zou, Q., Tan, Z., Fuchs, H., Wiedensohler, A., Moon, D. R., Heard, D. E., Baeza-Romero, M. T., Zheng, M., Wahner, A., Kiendler-Scharr, A., and Zhang, Y.: Influence of aerosol copper on HO2 uptake: a novel parameterized equation, Atmos. Chem. Phys., 20, 15835–15850, https://doi.org/10.5194/acp-20-15835-2020, 2020.
Song, H., Lu, K., Dong, H., Tan, Z., Chen, S., Zeng, L., and Zhang, Y.: Reduced Aerosol Uptake of Hydroperoxyl Radical May Increase the Sensitivity of Ozone Production to Volatile Organic Compounds, Environ. Sci. Techol. Lett., 9, 22–29, https://doi.org/10.1021/acs.estlett.1c00893, 2022.
Stone, D., Whalley, L. K., Ingham, T., Edwards, P. M., Cryer, D. R., Brumby, C. A., Seakins, P. W., and Heard, D. E.: Measurement of OH reactivity by laser flash photolysis coupled with laser-induced fluorescence spectroscopy, Atmos. Meas. Tech., 9, 2827–2844, https://doi.org/10.5194/amt-9-2827-2016, 2016.
Taketani, F., Kanaya, Y., and Akimoto, H.: Kinetics of heterogeneous reactions of HO2 radical at ambient concentration levels with (NH4)2SO4 and NaCl aerosol particles., J. Phys. Chem. A, 112, 2370–2377, https://doi.org/10.1021/jp0769936, 2008.
Taketani, F., Kanaya, Y., Pocharnart, P., Liu, Y., Li, J., Okuzawa, K., Kawamura, K., Wang, Z., and Akimoto, H.: Measurement of overall uptake coefficients for HO2 radicals by aerosol particles sampled from ambient air at Mts. Tai and Mang (China). Atmos. Chem. Phys., 12, 11907–11916, https://doi.org/10.5194/acp-12-11907-2012, 2012.
Tan, Z., Hofzumahaus, A., Lu, K., Brown, S. S., Holland, F., Huey, L. G., Kiendler-Scharr, A., Li, X., Liu, X., Ma, N., Min, K.-E., Rohrer, F., Shao, M., Wahner, A., Wang, Y., Wiedensohler, A., Wu, Y., Wu, Z., Zeng, L., Zhang, Y., and Fuchs, H.: No Evidence for a Significant Impact of Heterogeneous Chemistry on Radical Concentrations in the North China Plain in Summer 2014, Environ. Sci. Technol., 54, 5973–5979, https://doi.org/10.1021/acs.est.0c00525, 2020.
Thornton, J. A. and Abbatt, J. P. D.: Measurements of HO2 uptake of aqueous aerosol: Mass accommodation coefficients and net reactive loss, J. Geophys. Res., 110, D08309, https://doi.org/10.1029/2004JD005402, 2005.
Thornton, J. A., Jaeglé, L., and McNeill, V. F.: Assessing known pathways for HO2 loss in aqueous atmospheric aerosols: Regional and global impacts on tropospheric oxidants, J. Geophys. Res., 113, D05303, https://doi.org/10.1029/2007JD009236, 2008.
van der A, R. J., Mijling, B., Ding, J., Koukouli, M. E., Liu, F., Li, Q., Mao, H., and Theys, N.: Cleaning up the air: effectiveness of air quality policy for SO2 and NOx emissions in China, Atmos. Chem. Phys., 17, 1775–1789, https://doi.org/10.5194/acp-17-1775-2017, 2017.
Verstraeten, W. W., Neu, J. L., Williams, J. E., Bowman, K. W., Worden, J. R., and Boersma, K. F.: Rapid increases in tropospheric ozone production and export from China, Nat. Geosci, 8, 690–695, https://doi.org/10.1038/ngeo2493, 2015.
Wang, P.: China's air pollution policies: Progress and challenges, Curr. Opin. Environ. Sci. Health, 19, 100227, https://doi.org/10.1016/j.coesh.2020.100227, 2021.
Whalley, L. K., Furneaux, K. L., Goddard, A., Lee, J. D., Mahajan, A., Oetjen, H., Read, K. A., Kaaden, N., Carpenter, L. J., Lewis, A. C., Plane, J. M. C., Saltzman, E. S., Wiedensohler, A., and Heard, D. E.: The chemistry of OH and HO2 radicals in the boundary layer over the tropical Atlantic Ocean, Atmos. Chem. Phys., 10, 1555–1576, https://doi.org/10.5194/acp-10-1555-2010, 2010.
Whalley, L. K., Blitz, M. A., Desservattez, M., Seakins, P. W., and Heard, D. E.: Reporting the sensitivity of laser-induced fluorescence instruments used for HO2 detection to an interference from RO2 radicals and introducing a novel approach that enables HO2 and certain RO2 types to be selectively measured, Atmos. Meas. Tech., 6, 3425–3440, https://doi.org/10.5194/amt-6-3425-2013, 2013.
Whalley, L. K., Stone, D., Dunmore, R., Hamilton, J., Hopkins, J. R., Lee, J. D., Lewis, A. C., Williams, P., Kleffmann, J., Laufs, S., Woodward-Massey, R., and Heard, D. E.: Understanding in situ ozone production in the summertime through radical observations and modelling studies during the Clean air for London project (ClearfLo), Atmos. Chem. Phys., 18, 2547–2571, https://doi.org/10.5194/acp-18-2547-2018, 2018.
Whalley, L. K., Slater, E. J., Woodward-Massey, R., Ye, C., Lee, J. D., Squires, F., Hopkins, J. R., Dunmore, R. E., Shaw, M., Hamilton, J. F., Lewis, A. C., Mehra, A., Worrall, S. D., Bacak, A., Bannan, T. J., Coe, H., Percival, C. J., Ouyang, B., Jones, R. L., Crilley, L. R., Kramer, L. J., Bloss, W. J., Vu, T., Kotthaus, S., Grimmond, S., Sun, Y., Xu, W., Yue, S., Ren, L., Acton, W. J. F., Hewitt, C. N., Wang, X., Fu, P., and Heard, D. E.: Evaluating the sensitivity of radical chemistry and ozone formation to ambient VOCs and NOx in Beijing, Atmos. Chem. Phys., 21, 2125–2147, https://doi.org/10.5194/acp-21-2125-2021, 2021.
Wiedensohler, A., Birmili, W., Nowak, A., Sonntag, A., Weinhold, K., Merkel, M., Wehner, B., Tuch, T., Pfeifer, S., Fiebig, M., Fjäraa, A. M., Asmi, E., Sellegri, K., Depuy, R., Venzac, H., Villani, P., Laj, P., Aalto, P., Ogren, J. A., Swietlicki, E., Williams, P., Roldin, P., Quincey, P., Hüglin, C., Fierz-Schmidhauser, R., Gysel, M., Weingartner, E., Riccobono, F., Santos, S., Grüning, C., Faloon, K., Beddows, D., Harrison, R., Monahan, C., Jennings, S. G., O'Dowd, C. D., Marinoni, A., Horn, H. G., Keck, L., Jiang, J., Scheckman, J., McMurry, P. H., Deng, Z., Zhao, C. S., Moerman, M., Henzing, B., de Leeuw, G., Löschau, G., and Bastian, S.: Mobility particle size spectrometers: harmonization of technical standards and data structure to facilitate high quality long-term observations of atmospheric particle number size distributions, Atmos. Meas. Tech., 5, 657–685, https://doi.org/10.5194/amt-5-657-2012, 2012.
Xue, L. K., Wang, T., Gao, J., Ding, A. J., Zhou, X. H., Blake, D. R., Wang, X. F., Saunders, S. M., Fan, S. J., Zuo, H. C., Zhang, Q. Z., and Wang, W. X.: Ground-level ozone in four Chinese cities: precursors, regional transport and heterogeneous processes, Atmos. Chem. Phys., 14, 13175–13188, https://doi.org/10.5194/acp-14-13175-2014, 2014.
Ye, C., Heard, D. E., and Whalley, L. K.: Evaluation of novel routes for NOx formation in remote regions, Environ. Sci. Technol., 51, 7442–7449, 2017.
Zhou, J., Murano, K., Kohno, N., Sakamoto, Y., and Kajii, Y.: Real-time quantification of the total HO2 reactivity of ambient air and HO2 uptake kinetics onto ambient aerosols in Kyoto (Japan), Atmos. Environ., 223, 117189, https://doi.org/10.1016/j.atmosenv.2019.117189, 2020.
Zhou, J., Sato, K., Bai, Y., Fukusaki, Y., Kousa, Y., Ramasamy, S., Takami, A., Yoshino, A., Nakayama, T., Sadanaga, Y., Nakashima, Y., Li, J., Murano, K., Kohno, N., Sakamoto, Y., and Kajii, Y.: Kinetics and impacting factors of HO2 uptake onto submicron atmospheric aerosols during the 2019 Air QUAlity Study (AQUAS) in Yokohama, Japan, Atmos. Chem. Phys., 21, 12243–12260, https://doi.org/10.5194/acp-21-12243-2021, 2021.