the Creative Commons Attribution 4.0 License.
the Creative Commons Attribution 4.0 License.
 | 16 May 2023
Multiple pathways for the formation of secondary organic aerosol in the North China Plain in summer
Yifang Gu
Ru-Jin Huang
Jing Duan
Chunshui Lin
Haobin Zhong
Ying Wang
Haiyan Ni
Ruiguang Xu
Litao Wang
Yong Jie Li
Secondary organic aerosol (SOA) has been identified as a major contributor to fine particulate matter (PM2.5) in the North China Plain (NCP). However, the chemical mechanisms involved are still unclear due to incomplete understanding of its multiple formation processes. Here we report field observations in summer in Handan of the NCP, based on high-resolution online measurements. Our results reveal the formation of SOA via photochemistry and two types of aqueous-phase chemistry, the latter of which include nocturnal and daytime processing. The photochemical pathway is the most important under high-Ox (i.e., O3 + NO2) conditions (65.1 ± 20.4 ppb). The efficient SOA formation from photochemistry (Ox-initiated SOA) dominated the daytime (65 % to OA), with an average growth rate of 0.8 . During the high-relative-humidity (RH; 83.7 ± 12.5 %) period, strong nocturnal aqueous-phase SOA formation (aqSOA) played a significant role in SOA production (45 % to OA), with a nighttime growth rate of 0.6 . Meanwhile, an equally fast growth rate of 0.6 of Ox-initiated SOA from daytime aqueous-phase photochemistry was also observed, which contributed 39 % to OA, showing that photochemistry in the aqueous phase is also a non-negligible pathway in summer. The primary-related SOA (SOA attributed to primary particulate organics) and aqSOA are related to residential coal combustion activities, supported by distinct fragments from polycyclic aromatic hydrocarbons (PAHs). Moreover, the conversion and rapid oxidation of primary-related SOA to aqSOA were possible in the aqueous phase under high-RH conditions. This work sheds light on the multiple formation pathways of SOA in ambient air of complex pollution and improves our understanding of ambient SOA formation and aging in summer with high oxidation capacity.
- Article
(4820 KB) - Full-text XML
-
Supplement
(2326 KB) - BibTeX
- EndNote


Rapid economic growth and urbanization processes have led to severe particulate air pollution in China, affecting air quality, climate, and human health (Huang et al., 2014; Cohen et al., 2017; An et al., 2019). Organic aerosol (OA) is a major component of aerosol particles, consisting of 20 %–90 % of fine particle mass (Jimenez et al., 2009; Zhang et al., 2011). OA is either emitted directly from primary sources (referred to as primary OA, POA) such as traffic, cooking, coal combustion, and biomass burning or produced through gas-to-particle conversion (referred to as secondary OA, SOA) in the atmosphere. In recent years, with the implementation of control measures, the POA fraction has been decreasing, and the SOA fraction has been increasing in the North China Plain (NCP), indicating that SOA is becoming more critical for urban air quality (Huang et al., 2019; Xu et al., 2019; Gu et al., 2020). However, our understanding of the formation mechanisms and evolution processes of SOA is still limited.
Generally, SOA can be formed through gas-phase photochemical oxidation of volatile organic compounds (VOCs) followed by nucleation or condensation of oxidation products onto the preexisting particles (Donahue et al., 2006). Herndon et al. (2008) showed that oxygenated organic aerosol (OOA), a surrogate of SOA, was well correlated with odd oxygen (Ox = O3 + nitrogen dioxide, NO2) during photochemical processing. SOA can also be formed in the aqueous phase on wet aerosols, clouds, and fogs through further chemical processes of water-soluble organic compounds or organic products of gas-phase photochemistry (Ervens et al., 2011, 2014). A growing number of laboratory studies and field measurements have indicated that aqueous-phase processes contribute efficiently to the formation of SOA (Gilardoni et al., 2016; Bikkina et al., 2017). However, how photochemistry and aqueous-phase chemistry coordinate to affect the formation of SOA is still unclear, despite numerous measurements to explore this question using an aerosol chemical speciation monitor (ACSM) or aerosol mass spectrometer (AMS) (Hu et al., 2016b, 2017; Sun et al., 2016, 2018b; Li et al., 2017; Huang et al., 2019; Gu et al. 2020; Kuang et al., 2020). Field measurements in Beijing suggested that gas-phase photochemical oxidation can play a dominant role in SOA formation (Sun et al., 2016; Hu et al., 2016a). Xu et al. (2017) showed that less-oxidized OOA (LO-OOA) was mainly formed through photochemical oxidation, while more-oxidized OOA (MO-OOA) was dominantly formed by aqueous-phase chemistry in Beijing for different seasons. Kuang et al. (2020) investigated the effects of gas-phase and aqueous-phase photochemical processes on the formation of SOA and found that photochemical aqueous-phase SOA formation dominantly contributed to daytime OOA formation in winter in Gucheng, located between Beijing (∼ 100 km) and Baoding (∼ 40 km) in the NCP. We found that photochemical processing was attributed mostly to MO-OOA in summertime in Beijing (Gu et al., 2020). Although these studies provided important insights into SOA formation processes, our understanding of the photochemical and aqueous-phase formation pathways for SOA and their impacts on oxidation degree is far from complete. This lack of understanding is especially clear under the conditions that atmospheric oxidative capacity and pollution characteristics have been largely changing in China due to the large reduction in direct emissions of air pollutants.
In this study, we investigated the photochemical versus aqueous-phase processing for SOA composition and oxidation degree of OA in the summertime in Handan, which is a typical industrialized city in the NCP region. The city is located at the intersectional area of Hebei, Shanxi, Henan, and Shandong – four heavily urbanized and industrialized provinces (Fig. S1 in the Supplement), and it is therefore an ideal site to investigate the SOA formation pathways in the NCP region. The multiple formation pathways, evolution of SOA composition, and oxidation degree under different meteorological conditions were discussed, which sheds light on the aqueous-phase chemistry and photochemical processing in SOA formation in the NCP region of China.
2.1 Sampling site
Measurements were conducted from 10 August 2019 to 17 September 2019 on the campus of Hebei University of Engineering (36.57∘ N, 114.50∘ E), located at the southeast edge of urban Handan (Fig. S1). The site is surrounded by a school and residential areas, ∼ 300 m north of South Ring Road and ∼ 400 m northeast of the Handan highway (S313). The sampling site is on the rooftop of a four-floor building, approximately 12 m above the ground.
2.2 Instrumentation
Real-time non-refractory PM2.5 composition was measured by a soot particle long time-of-flight aerosol mass spectrometer (SP-LToF-AMS; Aerodyne Research Inc.) with a time resolution of 1 min. The detailed instrument description and operation of the AMS were reported in Onasch et al. (2012). Compared to the conventional AMS, the LToF mass analyzer can provide much better mass resolution of ∼ 8000. During the campaign, the instrument was operated in the “laser off” mode, and only the standard tungsten vaporizer was applied. Therefore, only non-refractory PM2.5 components (NR-PM2.5) were measured, including organics (Org), nitrate (NO3), sulfate (SO4), ammonium (NH4), and chloride (Chl). Ambient air was sampled and dried by a Nafion dryer (MD-700-24S, Perma Pure, Inc.) at a flow rate of 5 L min−1 and then subsampled into the SP-LToF-AMS at a flow rate of ∼ 0.1 L min−1. An aerodynamic PM2.5 lens was used to focus the particle into a beam, which was then impacted on the heated tungsten surface (∼ 600 ∘C) and flash-vaporized. Electron ionization with 70 eV was used to ionize the vaporized gases. The ionization efficiency (IE) and the relative ionization efficiency (RIE) calibrations (Jimenez et al., 2003) were conducted using 350 nm ammonium nitrate (NH4NO3) and ammonium sulfate ((NH4)2SO4) particles.
Gaseous pollutants including SO2 (9850 SO2 analyzer, Ecotech), NO2 (Model 42i NO-NO2-NOx analyzer, Thermo Scientific), CO (Model 48i carbon monoxide analyzer, Thermo Scientific), and O3 (Model 49i ozone analyzer, Thermo Scientific) and meteorological parameters including RH and temperature were also measured during the observation period. Furthermore, an aethalometer (Model AE-33, Magee Scientific) was deployed to measure the mass concentration of black carbon (BC) at a time resolution of 1 min.
2.3 Data analysis
The data analysis software (SQUIRREL, version 1.63I and PIKA, 1.23I) within Igor Pro 6.37 (WaveMetrics) was used to analyze the AMS data. The experimental RIE values of 4 (NH4) and 1.2 (SO4) and the standard RIE values of 1.4 (Org), 1.1 (NO3), and 1.3 (Chl) were used. The composition-dependent collection efficiency (CDCE; Middlebrook et al., 2012) was used to compensate for the incomplete detection caused by particle bounce on the vaporizer. An improved ambient (I-A) method was adopted for the elemental ratio analysis of high-resolution (HR) OA mass spectra, such as oxygen-to-carbon (O:C) and hydrogen-to-carbon (H:C) ratios (Canagaratna et al., 2015), which reflect the relative composition and oxidation degree for different OA sources. In our study, positive matrix factorization (PMF) was performed on HR mass spectra of OA for ions with values of 12–120, together with the signals from integer values between 121 and 300 (i.e., unit mass resolution, UMR) using SoFi (version 6.3) in Igor Pro (Paatero, 1999; Canonaco et al., 2013). The data and error matrices were preprocessed according to Elser et al. (2016), and a detailed description of PMF analysis was given elsewhere (Canonaco et al., 2013; Elser et al., 2016). Unconstrained PMF solutions with varied factor numbers were analyzed, and six factors were resolved, including two primary and four secondary organic factors (Fig. 3). The six-factor solution was preferred because the five-factor solution was not able to separate the high signal of 44 (which represents a high oxidation state) from primary organic aerosol (POA) factors, while the seven-factor solution added additional OOA factors with similar profiles and noisy time series for which no physical interpretation could be found. The two POA factors consisted of a traffic-related factor (hydrocarbon-like OA, HOA) and a cooking-related factor (COA), which had been resolved in previous summer studies in the NCP (Elser et al., 2016; Hu et al., 2016b; Sun et al., 2016; Huang et al., 2019). AMS source apportionment studies often report one or two oxygenated organic aerosol (OOA) factors that are distinguished by the extent of oxygenation and linked to volatility or oxidation degree. Owing to the higher mass resolution of the LToF-AMS and the inclusion of integer-mass signals for from 121 to 300 for high-molecular-weight species such as polycyclic aromatic hydrocarbons (PAHs), we herein resolved four SOA factors. These four SOA factors include aqueous-phase SOA (aqSOA) attributable to aqueous-phase chemistry, Ox-initiated SOA attributable to photochemistry, primary-related SOA attributable to prompt oxidation of POA during emission, and fresh SOA with a lower ratio (fraction of 44 and 43 in OA).
2.4 Aerosol liquid water content
The aerosol liquid water content (ALWC) was simulated by the ISORROPIA-II model (Fountoukis and Nenes, 2007; Hennigan et al., 2015) using the measurements of ambient inorganic species (NO3, SO4, NH4, and Chl) and meteorological parameters (temperature and RH). The simulation was run in “metastable” mode, where all components are assumed to be deliquescent and contain no solid matter. The concentrations and speciation (if dissociated) of those inorganic species in thermodynamic equilibrium were then simulated by the model, and then the ALWC was calculated. The inorganic cations such as Na+, K+, Ca2+, and Mg2+ were not measured and included in the simulation on account of that these crustal ions constituted relatively small fractions of aerosol and had relatively weak effects on ALWC accumulation (Fountoukis and Nenes, 2007; Su et al., 2022). The ISORROPIA-II model does not consider the contribution to ALWC from organics, since inorganic aerosols dominate the water uptake by ambient particles with a contribution of approximate > 80 % of the total ALWC (Huang et al., 2020).
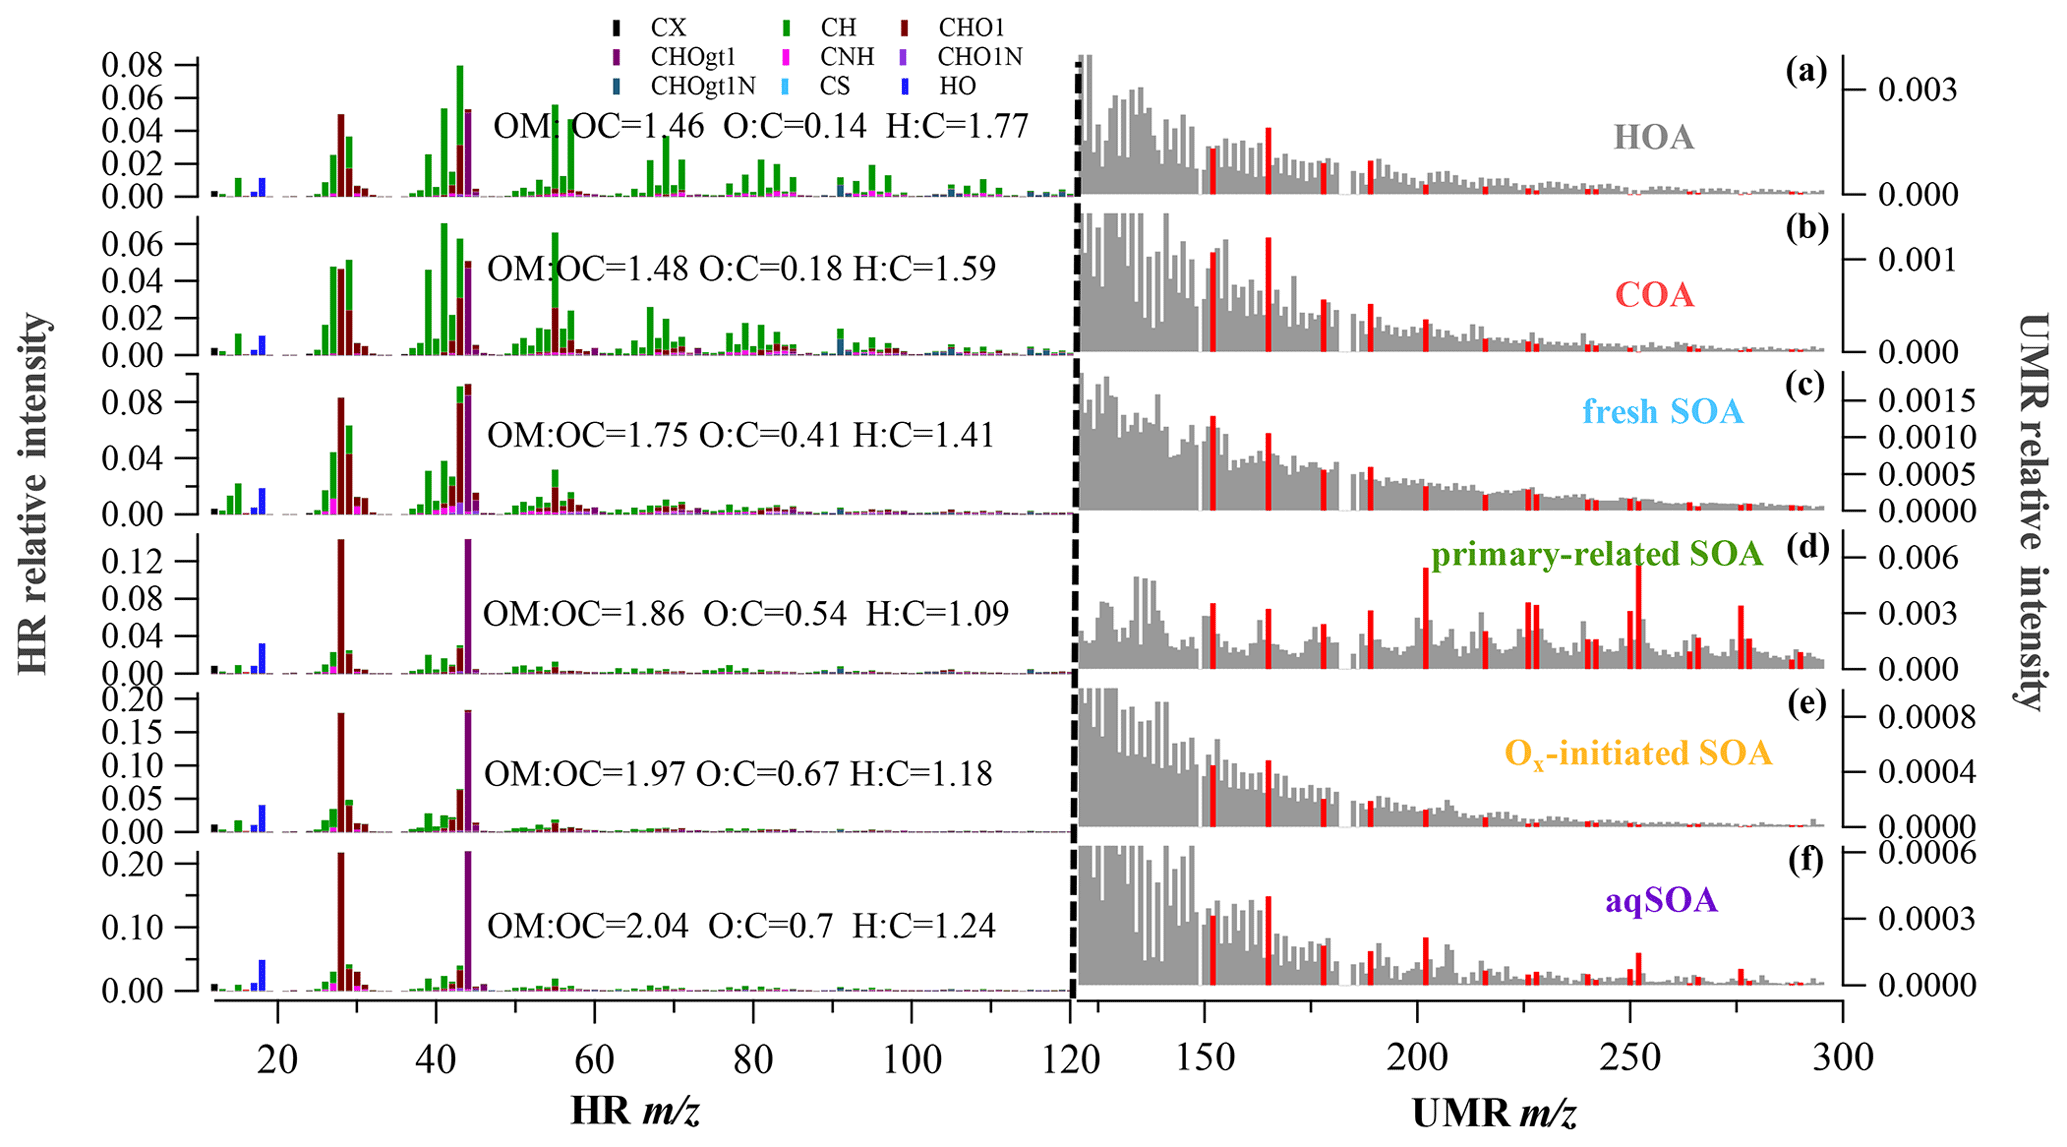
Figure 1HR and UMR mass spectra of OA factors: (a) HOA, (b) COA, (c) fresh SOA, (d) primary-related SOA, (e) Ox-initiated SOA, and (f) aqSOA. Mass spectra signals less than 120 amu are colored by nine ion categories, signals equal to or greater than 120 amu are in unit mass resolution, and polycyclic aromatic hydrocarbons (PAHs) signals are in red on the right panels.

Figure 2Time series of (a) relative humidity (RH) and wind speed (WS), (b) Ox and Ox-initiated SOA, (c) fresh SOA, aqSOA and ALWC, (d) primary-related SOA, and (e) the O:C ratio and H:C ratio. The time series were categorized to be three typical periods based on total SOA mass concentrations and meteorology conditions: the reference period (P1), the high-Ox period (P2), and the high-RH period (P3).
3.1 SOA sources
In our study, SOA accounted for 69 % (13.5 µg m−3) of the total OA (19.6 µg m−3), representing the dominant fraction in OA in summer in Handan. Among the four PMF-resolved SOA sources (Fig. 1), Ox-initiated SOA dominated (31 % to total OA), followed by fresh SOA (18 %), aqSOA (15 %), and primary-related SOA (5 %). Since we focus on SOA formation in this study, detailed descriptions of the HOA (12 %) and COA (19 %) are provided in Sect. S1.1 in the Supplement. The mass spectral profiles of the six OA source factors are shown in Fig. 1, while the time series of the SOA factors are shown in Fig. 2. In particular, a remarkable continuous growth of aqSOA concentration (from ∼ 0.3 to 25.2 µg m−3) and ALWC (from 3.1 to 486.1 µg m−3) occurred on 24–28 August (Fig. 2d). Meanwhile, the O:C ratio indicative of OA oxidation state displayed a continuous increase from 0.52 to a maximum of 0.93 during this time (Fig. 2e), consistent with the continuous increase in RH (reaching over 95 %). This observation hints that during this period, aqueous-phase processing might have played an important role in aqSOA formation. This role of aqueous-phase processing in SOA formation is not just specific to this particular event but also important in the whole campaign, which is discussed in detail in Sect. 3.3 later.
SOA factors were resolved depending on the oxidation state, which correspond to aged SOA and fresh SOA, respectively (Jimenez et al., 2009). One factor is attributed to aqueous-phase chemistry (aqSOA) and the other to photochemistry (Ox-initiated SOA), while the fresher factor is produced by a fresh source (fresh SOA) with a lower ratio, and the other is considered an oxidized primary source, denoted as primary-related SOA. Although all of the SOA factors were characterized by higher 44 () and 28 (CO+) signal compared with POA factors, their mass spectrum and temporal trends were noticeably distinguishable, corresponding to different formation mechanisms, which will be discussed in the following section.
As shown in Fig. S3 in the Supplement, the aqSOA was identified as it increased with ALWC but decreased with Ox, which might be produced/influenced by aqueous-phase chemistry and is defined as aqSOA. This indicates that aqSOA was either formed via aqueous-phase reactions or absorbed/dissolved into aerosol liquid water. It exhibits the highest O:C ratios of all factors (0.7) and a higher to the total signal of 21.7 % but a low H:C ratio of 1.24 (Fig. 1). The Ox-initiated SOA in our study is photochemical-production SOA, whose formation is initiated with the presence of Ox. As Ox has been shown to be a conserved tracer to during photochemical processing (Xu et al., 2017), the relationship between Ox and Ox-initiated SOA can represent a metric to characterize SOA formation mechanisms associated with ozone production chemistry SOA (Herndon et al., 2008). Ox-initiated SOA presented an opposite trend, with a significant increase as a function of Ox but a decrease as a function of ALWC (Fig. S3), suggesting the dominant role of photochemical processing in the formation of Ox-initiated SOA.
The fresh SOA showed a substantial increase as ALWC increased, similar to aqSOA, whereas it also showed a slight increasing trend following Ox when Ox < 100 ppb (Fig. S3). Therefore, both aqueous-phase chemistry and photochemical processing were thought to have positive impacts on the formation of fresh SOA synchronously. In this study, the fresh SOA had the lowest atomic O:C ratio of 0.41 and the highest atomic H:C ratio of 1.41 among the four SOA factors, corresponding with the of 8.3 %; these characteristics are consistent with the global average O:C ratio of LO-OOA of 0.35 ± 0.14 (Ng et al., 2010), demonstrating that it is fresher SOA. Although the primary-related SOA constituted a small fraction and showed little variation, this SOA source is also of particular interest because of its distinctive fragments with high values in the mass spectrum (Fig. 1d). At < 120, the primary-related SOA had higher intensities for 43 (mainly C2H3O+) and 44 (mainly ) than those in POA, indicating a typical nature of less-oxidized SOA. At > 120, PAH-derived fragments are clearly evident in the mass spectrum of the primary-related SOA, as indicated by PAH-like ions (described in Sect. S1.2 in the Supplement) (Dzepina et al., 2007). Previous AMS studies have observed pronounced peaks of PAH ions in POA mass spectra, such as those in coal combustion organic aerosol (CCOA) and biomass burning organic aerosol (BBOA) (Hu et al., 2016b; Zhao et al., 2019), but rarely in SOA. This observation implies that the factor may be related to the POA originated from domestic coal combustion, and here it is termed as primary-related SOA (Xu et al., 2006). Moreover, this SOA factor exhibited relatively better correlations with some gaseous pollutants (Fig. S4 in the Supplement), such as CO (R = 0.6) and NO2 (R = 0.5), and also with HOA (R = 0.4). These observations suggest that the primary-related SOA might be transformed from locally emitted POA as a non-negligible source to SOA.
To further investigate the SOA formation mechanism, the dataset was segregated into three periods according to different features depends on meteorological parameters (Fig. 2), i.e., the reference period (P1), the high-Ox period (P2), and the high-RH period (P3). Briefly, the reference period, P1, was characterized by a low average OA concentration (15.4 ± 3.2 µg m−3) and was mainly affected by clean air from southwest of the sampling site and precipitation activities (Table S1 in the Supplement). The high-Ox period (P2) was featured by a high-Ox concentration (65.1 ± 20.4 ppb) and warmer temperatures (26.4 ± 4.0 ∘C) but lower RH (57.7 ± 17.5 %). The mass loadings of OA (19.8 ± 4.7 µg m−3) and other pollutants in P2 were higher than those in P1 (Table S1). P3 was designated as a high-RH period because of the noticeably high RH (83.7 ± 12.5 %) and high ALWC (95.4 ± 114.2 µg m−3). Winds were weak (< 1.0 m s−1) throughout this period, indicative of stagnant conditions, which facilitated pollutant accumulation and resulted in the highest average OA concentrations (25.0 ± 6.2 µg m−3).
During the reference period (P1), SOA had the lowest contribution to OA (57 %), and the Ox-initiated SOA and aqSOA constituted 22 % and 21 % of the total OA, respectively. For the high-Ox period (P2), enhanced SOA formation was found, with the SOA fraction increased to 71 % of the total OA. The Ox-initiated SOA showed the highest mass loading of 7.3 µg m−3 and highest contribution of 37 % to total OA. These increases suggest that the high-Ox condition facilitated the production of SOA by photochemistry, making the Ox-initiated SOA a major source of SOA during P2. During the high-RH period (P3), SOA fraction continually increased, approaching 79 % in total OA, and the SOA was mainly constituted of aqSOA and fresh SOA. The mass contribution of aqSOA increased dramatically from 9 % to total OA during P2 to 33 % during P3 (Fig. S2 in the Supplement) and average mass concentrations from 1.8 to 8.3 µg m−3, which suggests rapid SOA production through the aqueous-phase chemistry. Comparatively, the contribution of fresh SOA was about ∼ 20 % in both P2 and P3 but lower in P1 (9 %), suggesting that the formation of fresh SOA was affected by both high Ox and high RH. It should also be noted that the O:C ratio increased in the succession from P1 (0.73) to P2 (0.74) and further to P3 (0.77), accompanied by a continual decrease of the H:C ratio from 1.64 to 1.56 and to 1.53 (Fig. 3), suggesting an increase in the OA oxidation degree. As a result, the high Ox in P2 and high RH in P3 (as compared to P1) promoted the formation of SOA, specifically Ox-initiated SOA (in P2) and aqSOA (in P3), leading to an increase in the degree of oxygenation in total OA.
Overall, our results suggest that SOA could be formed through different pathways, in particular photochemistry, aqueous-phase chemistry, and conversion of POA to SOA, contributing to SOA formation.
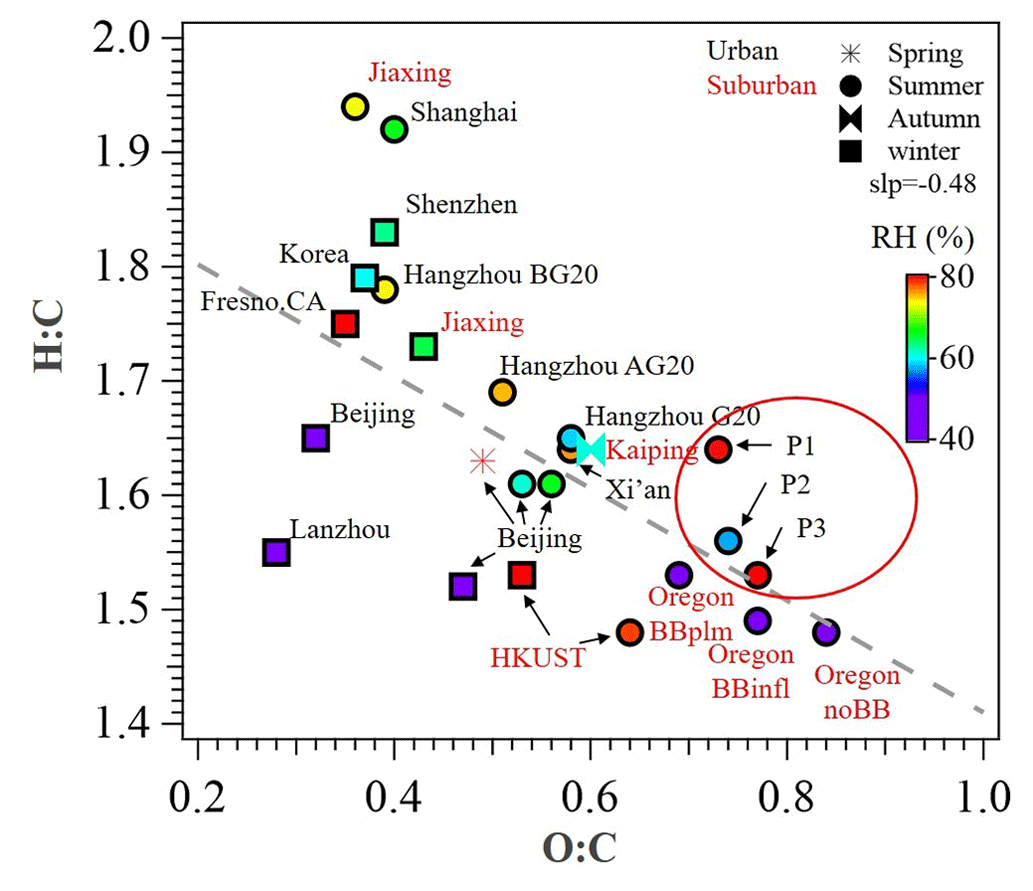
Figure 3Van Krevelen plot for OA of urban and suburban sites in China and other nations. Data points are colored by RH (%). P1, P2, and P3 in red circles represent the different periods in this study. All the data and related references can be found in Table S3 in the Supplement.
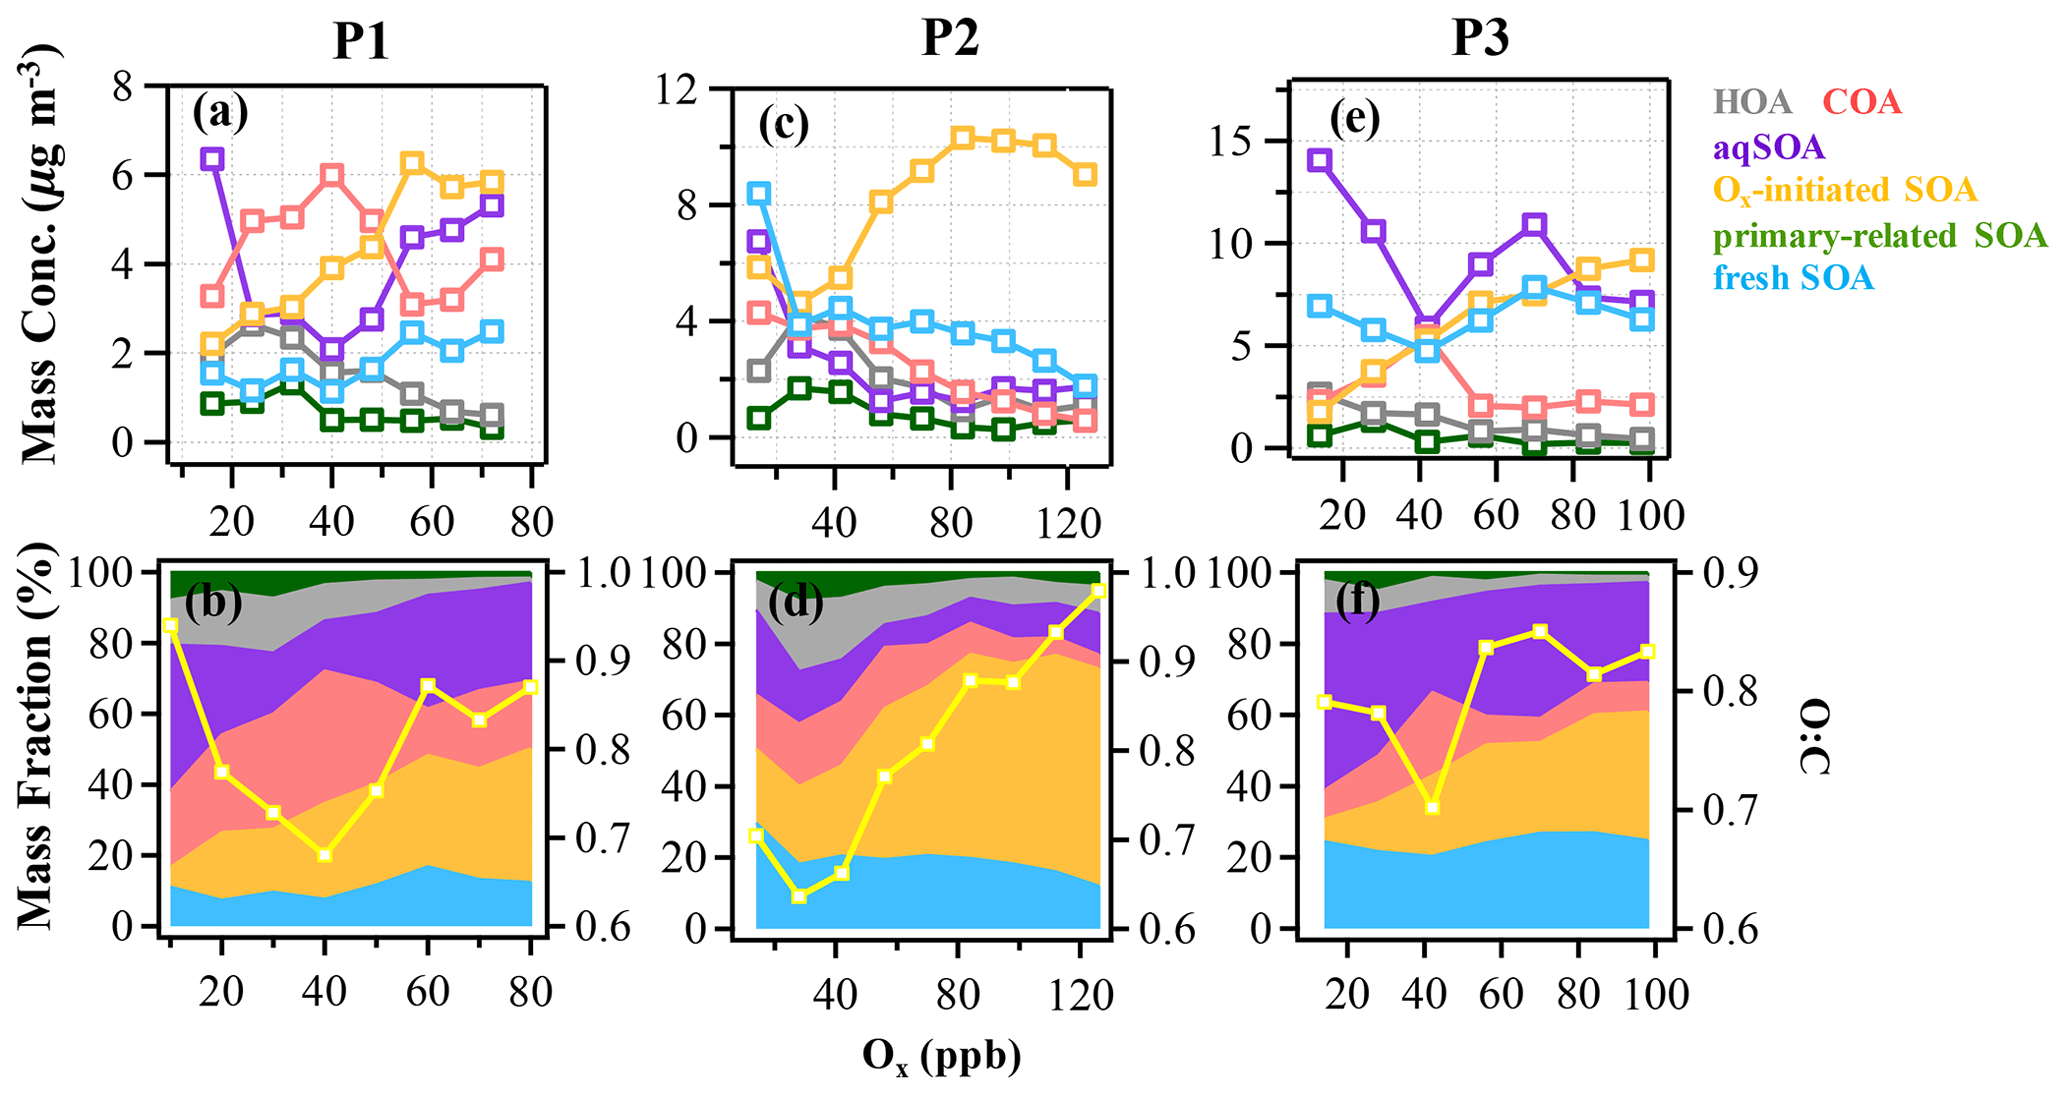
Figure 4The mass concentration and contribution of OA factors as functions of Ox in the reference period (P1: a and b), the high-Ox period (P2: c and d), and the high-RH period (P3: e and f) during this campaign. The yellow curves represent the O:C ratio vs. Ox. The data were binned according to Ox concentration (10 ppb increment in P1, 14 ppb increment in P2 and P3).
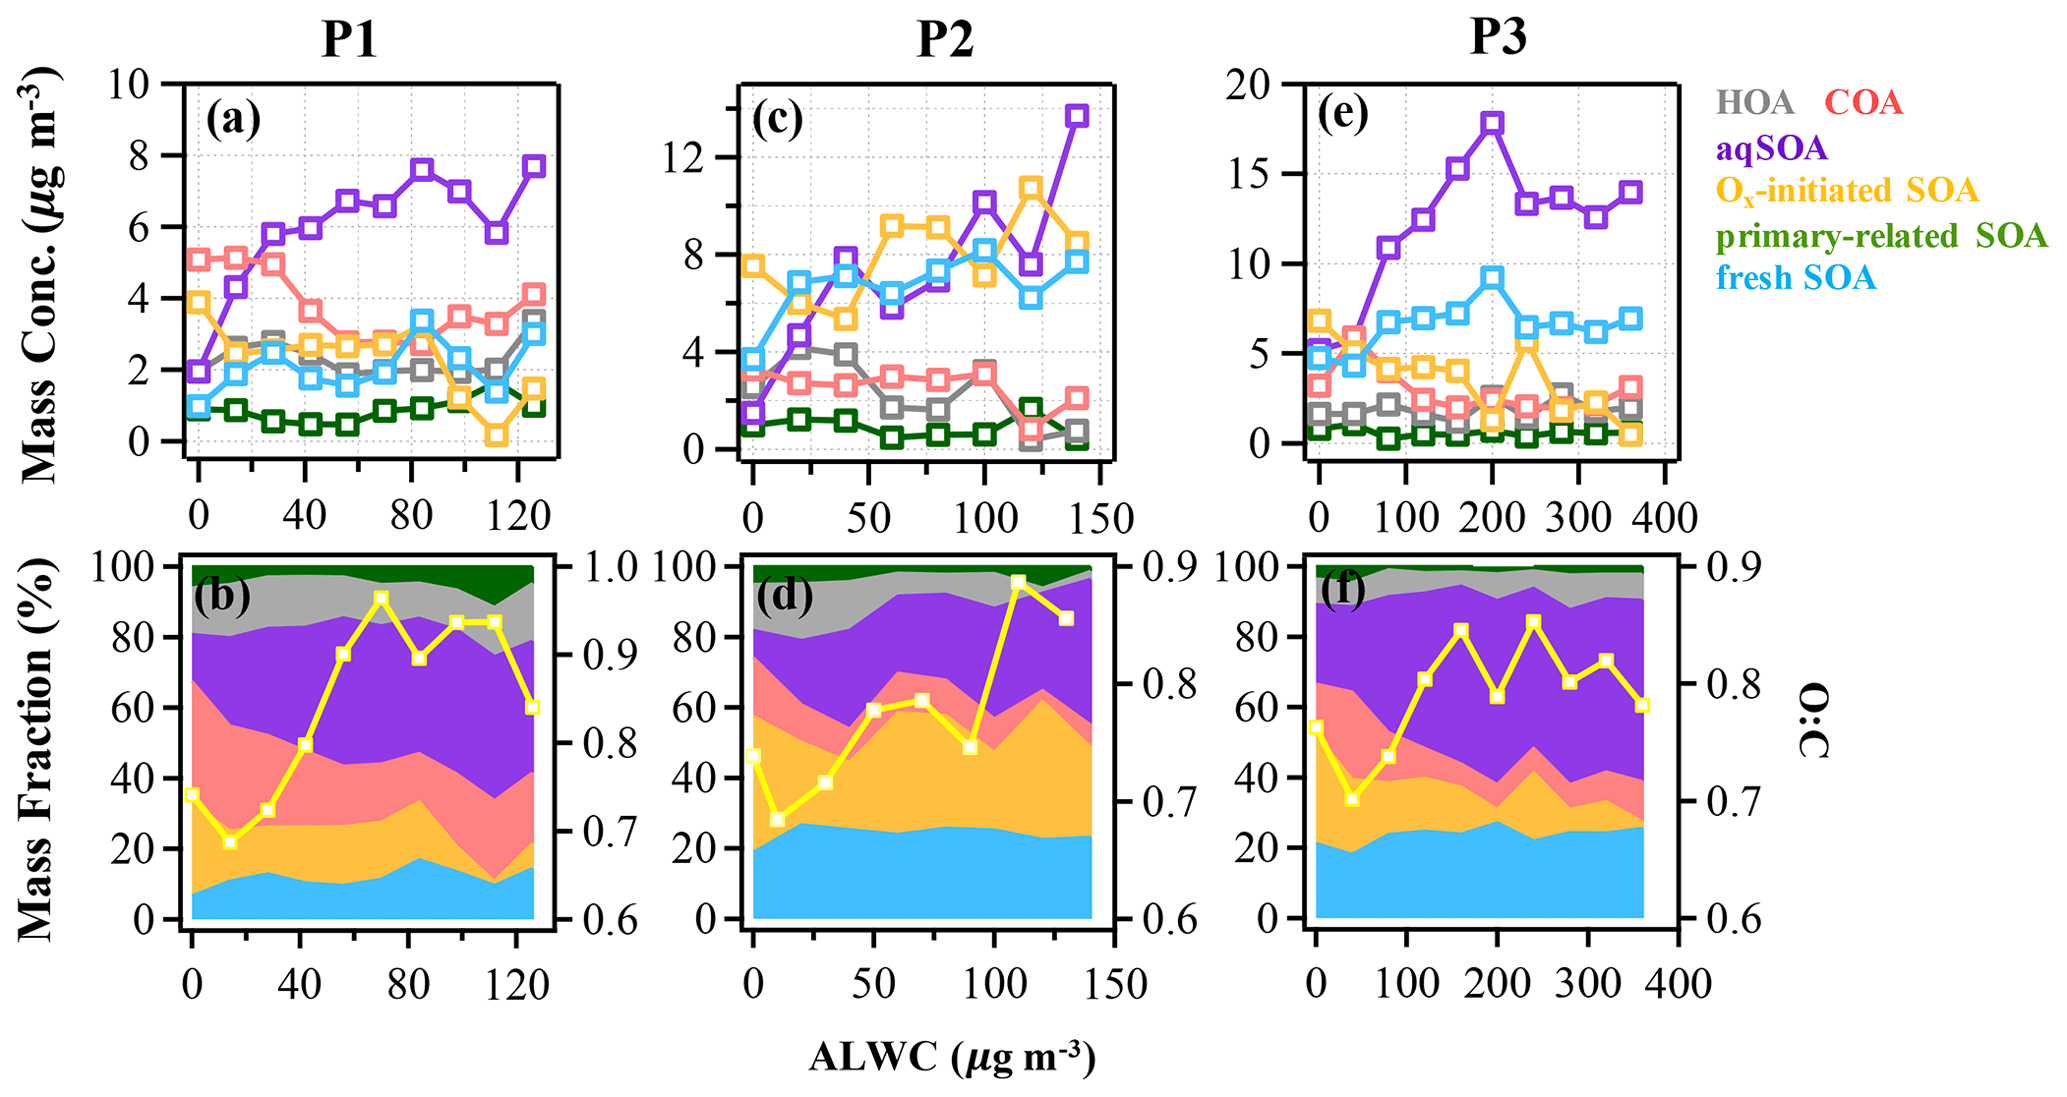
Figure 5The mass concentration and contribution of OA factors as functions of ALWC in the reference period (P1: a and b), the high-Ox period (P2: c and d), and the high-RH period (P3: e and f) during this campaign. The yellow curves represent the O:C ratio vs. ALWC. The data were binned according to the ALWC concentration (14, 20, and 40 µg m−3 increment in P1, P2, and P3).
3.2 Photochemistry
As expected for summertime, photochemistry associated with Ox has significant impacts on the formation and evolution of SOA. Herein, the relationships between OA factors and Ox were investigated to offer insights into the formation mechanisms of SOA associated with the ozone production chemistry (Herndon et al., 2008). During P2, as Ox increased, the mass loadings of Ox-initiated SOA showed a substantially increasing trend when Ox was > 30 ppb and eventually saturated when Ox was > 100 ppb, raising the contribution of Ox-initiated SOA from 20 % to 61 % of total OA (Fig. 4). This observation indicates the importance of photochemistry in the formation of Ox-initiated SOA in summer, in which high-Ox concentration as well as temperature corresponding to strong atmospheric oxidative capacity, can accelerate the photochemical formation (Duan et al., 2021). As a comparison, the mass concentrations of other OA factors except Ox-initiated SOA showed decreasing trends as Ox increased (Fig. 4c). Such differences between SOA factors are likely due to the enhanced secondary production/transformation from POA and fresher SOA factors to the more aged Ox-initiated SOA. Note that the O:C ratio presented a faster increasing rate as a function of Ox (from 0.6 to 1.0, Fig. 4d) than those in P1 and P3, suggesting that photochemistry might result in higher OA oxidation state during P2.
The typical episode of the high-Ox period (P2) was dominated by a series of daytime photochemical evolution. To evaluate the relative contributions of photochemical and aqueous-phase processing production and the transformation of these SOA factors in different meteorological stages, the average diurnal variations of OA factors, O:C ratios, Ox, temperature, ALWC, and primary gas pollutants during different periods are shown for comparison. Figure 6 shows that Ox increased rapidly from 06:00 to 14:00 local time (LT) in all periods but was highest in P2. Correspondingly, a lower mean value of ALWC (8.4 µg m−3) was also observed in P2 than in P1 and P3. During P2, Ox-initiated SOA was produced quickly and played a dominant role during daytime, while its concentration typically decreased during nighttime. The average concentration of Ox-initiated SOA increased continually from 4.2 µg m−3 at 07:00 LT to 10.4 µg m−3 at 15:00 LT in 8 h, with the maximum Ox-initiated SOA mass fraction in OA reaching 65 % at 15:00 LT (Fig. S6c in the Supplement). This high average growth rate of 0.8 in Ox-initiated SOA corresponded to the high-Ox concentration, high temperature and strong solar radiation in daytime, suggesting enhanced photochemistry reaction. In contrast, the concentrations and the contributions of other SOA factors deceased continuously at the same time (Fig. 6). The opposite trends between Ox-initiated SOA and other OA factors from 07:00 to 15:00 LT suggest that some part of POA and fresh SOA may convert to Ox-initiated SOA by photochemical oxidation. This conclusion is consistent with findings reported by Li et al. (2020) in urban Beijing, where less-oxidized SOA may transform to more-oxidized SOA through photochemical processing as well. The O:C ratio of OA presented a significant increasingly diurnal variation with an afternoon peak around 14:00–16:00 LT in P2, which had the highest value of 0.74 compared with P1 and P3, suggesting that the potential transformation from POA factors and fresh SOA factors to Ox-initiated SOA could also noticeably affect OA characteristics such as oxidation state in summer daytime. It is further indicated by a small afternoon peak of the more-oxidized tracer ( 44) and the decrease in a less-oxidized tracer C2H3O+ ( 43) (Fig. 7b). As a result, the mass spectra, which were initially fresh SOA products, evolved to become aged SOA products as the photochemical age increased. Overall, with little water in the particles, the high solar radiation and high Ox concentration during daytime associated with a relatively high degree of oxygenation of OA suggest that gas-phase oxidation and partitioning processes are probably the dominating process in SOA formation during P2.
In addition, these results further support the idea that during the high-Ox period of summer, photochemistry has significant impacts on SOA formation, especially on Ox-initiated SOA. Note that the role of photochemistry in the formation of Ox-initiated SOA is not only limited to the gas-phase photochemistry but can also occur in the aqueous phase (Kuang et al., 2020). This is the case for P3 in our study, which is discussed further in Sect. 3.3.
3.3 Aqueous-phase chemistry
The aqueous-phase chemistry has imposed significant impacts on SOA formation during this field campaign. To further explore the formation mechanism of SOA associated with aqueous-phase chemistry, the relationships between different OA factors and ALWC were investigated. During P3, the mass concentration of aqSOA increased from 5 to 17 µg m−3, yet its fraction showed a particularly pronounced rise from 22.5 % to 52 % of total OA when ALWC increased from 0.3 to 200 µg m−3 (Fig. 5e and f). Note that there are still consistent mass concentrations of aqSOA even when ALWC is very low (data interval ranging from 0–40 µg m−3), which is due to over 80 % of ALWC mass concentration being loaded in the first interval, leading to a higher mean value of aqSOA mass concentration. Actually ALWC showed quite low mass loading in most periods but increased dramatically during P3, yet the time series of aqSOA and ALWC were remarkably well correlated throughout the entire campaign (R = 0.7, Fig. S4) rather than a strong correlation observed only in P3. This general correlation further confirms the important role of aqueous-phase chemistry in the formation of aqSOA and characterized the aqueous-phase formation of aqSOA throughout the campaign rather than only in the high-RH event as shown in Sect. 3.1 earlier. We also found that the concentration and fraction of aqSOA became stable when ALWC was > 200 µg m−3, which is probably attributable to the aqSOA formation within droplets being soon outweighed by the scavenging processes when RH was high enough (> 95 %). The O:C ratio shows an obvious increase from 0.7 to around 0.85 when ALWC increases to 200 µg m−3, after which it remains relatively stable (0.85) as the ALWC increases further (Fig. 5). These results suggest that aqueous-phase chemistry can affect the oxidation degree of OA by changing SOA composition, especially the enhanced contribution of aqSOA. However, the growth rate of O:C ratios as ALWC increases in P3 was lower than that in P2 (up to 1 as Ox increases). Also, the correlation between O:C and Ox in P2 (R = 0.6) was stronger than between O:C and ALWC (R = 0.3) (Fig. S8 in the Supplement).
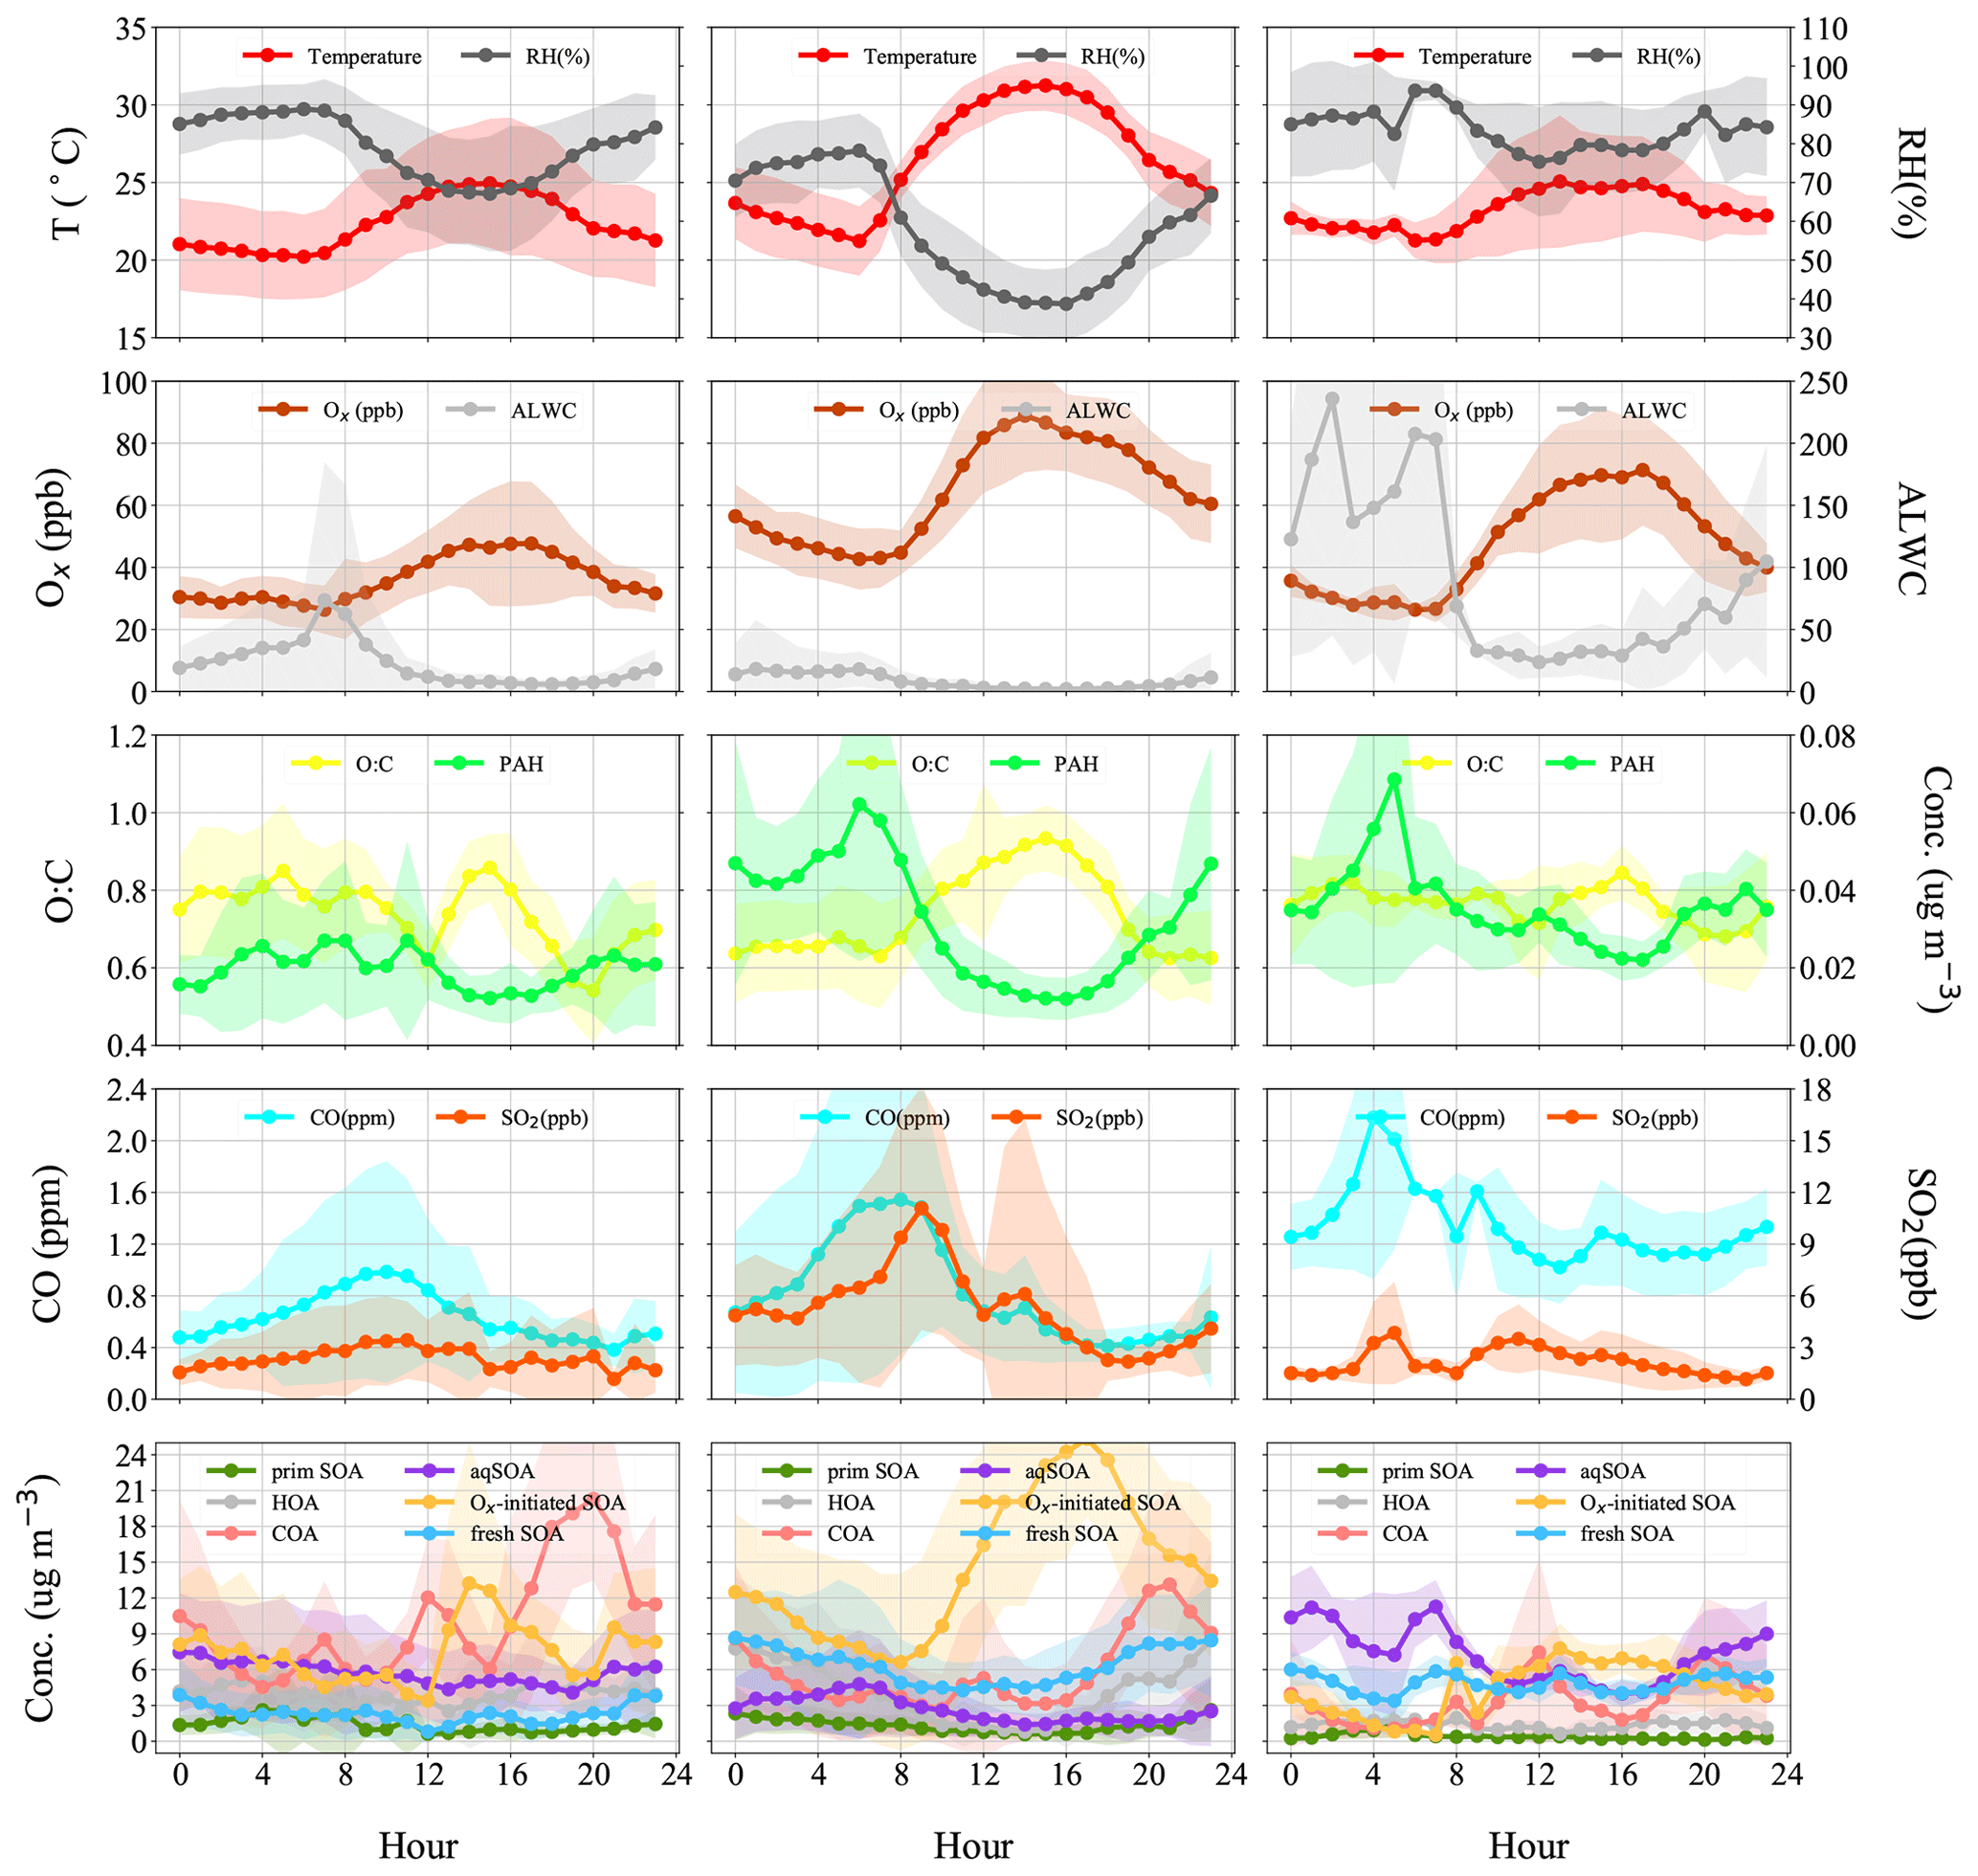
Figure 6Diurnal patterns of meteorological parameters (T, RH), gaseous species (Ox, CO, SO2), ALWC (liquid water content), O:C (oxygen-to-carbon elemental ratio), polycyclic aromatic hydrocarbon (PAH) fragments, and OA factors in the reference period (P1), the high-Ox period (P2), and the high-RH period (P3) in this campaign.

Figure 7Evolution of high-resolution organic mass spectra on changes in relative intensities (mass fraction) of oxygen-containing ions: C2H3O+ ( 43) and ( 44) in the reference period (P1: a), the high-Ox period (P2: b), and the high-RH period (P3: c) in this campaign.
Figure 6 illustrates the different types of aqueous-phase chemistry in daytime and nighttime. During the nighttime in P3, aqueous-phase oxidation was also enhanced (19:00–07:00 LT). As shown in Fig. 6, O:C ratio (0.76) at nighttime in P3 was higher than in P2, while it exhibited a much smaller peak during daytime. Compared with the low ALWC in P2, the much higher ALWC concentration (peak value of 235.9 µg m−3 at 02:00 LT) and higher RH (peak value of 93.7 % at 06:00 LT) during nighttime in P3 suggested a dominant contribution by aqueous-phase processing. The aqSOA shows quite a clear and unique diurnal pattern in P3, with much higher mass concentration during the whole day (especially at nighttime) than in P1 and P2. After 17:00 LT, aqSOA started to increase from 4.7 to 12.7 µg m−3 at 07:00 LT, which showed a rapid nighttime growth rate of 0.6 , indicating enhanced SOA formation through aqueous-phase chemistry at night, whereas Ox-initiated SOA decreased rapidly from 8.2 µg m−3 at 17:00 LT until it reached its lowest concentration of 2.6 µg m−3 by the morning, suggesting gas-to-particle partitioning at night under high-ALWC conditions. Furthermore, this transformation could be supported by the increase in ( 44) and the decrease in a less-oxidized tracer C2H3O+ ( 43) at night (Fig. 7c). This is because when the ALWC is sufficiently high, many of the precursor organics and oxidants were accommodated to low-volatility products through aqueous-phase oxidation. In addition, the dark aqueous-phase SOA formation was likely strong enough to counteract the nighttime scavenging processes under high-RH conditions. Therefore, the dark aqueous-phase chemistry forming aqSOA shows a dominant role (over 40 % to OA) during nighttime in P3.
However, during the daytime, the mass concentration of aqSOA decreased from 07:00 to 17:00 LT in P3, coinciding with an obvious increase trend of Ox-initiated SOA at the same time with an average growth rate of 0.6 (Fig. 6). This phenomenon suggests photochemical processing can also occur in the aqueous phase when RH and ALWC were still high. Both aqueous-phase and gas-phase photochemical reactions can contribute substantially to the SOA formation in polluted areas of the NCP, and during haze days with high-RH and ALWC, the aqueous-phase photochemical processes played a dominant role in daytime SOA formation (Kuang et al., 2020). The rapid daytime Ox-initiated SOA formation in our study possibly occurred on the particle surface and in the aerosol liquid water (Ervens et al., 2011) under humid conditions with high ALWC but driven by gas-phase direct photolysis and oxidation by photooxidants under high-Ox conditions. Under such a high RH level (RH > 80 %), the water-soluble species produced from photochemistry in the gas phase can also partition into the aqueous phase and be further oxidized to form low-volatility products (Carlton et al., 2007; Sullivan et al., 2016). Previous studies have demonstrated that gas-phase oxidants such as OH radicals and H2O2 can also partition to the aqueous phase to further oxidize dissolved the oxidized VOCs (OVOCs) into aqSOA (Ye et al., 2018). Other studies also revealed that photochemical reactions in the aqueous droplets can occur through direct photolysis or through oxidation by oxidants (Ervens et al., 2011, 2014; Ye et al., 2018). Therefore, in our campaign, dark aqueous-phase chemistry is responsible for rapid aqSOA formation during nighttime, while the aqueous-phase photochemistry during daytime is likely to prevail by rapid daytime Ox-initiated SOA formation during P3. This comparison demonstrates that the nocturnal aqueous-phase chemistry and daytime aqueous-phase photochemistry are both important pathways in the total SOA growth. The aqueous-phase chemistry related to fresh SOA is more complicated, requiring both daytime radiative conditions and certain amounts of ALWC at nighttime. For example, Fig. 5e shows that the fresh SOA has a similar increasing trend to aqSOA as ALWC increased; however, it also increased slightly as Ox increased (Fig. 4e), hinting that both ALWC and the oxidants are critical for fresh SOA formation, and both the aqueous-phase chemistry and the photochemistry (including that in the aqueous phase) participated in producing fresh SOA simultaneously. It is worth noting that three peaks were found in the diurnal variation of fresh SOA in P3. The peaks at around 6:00 and 19:00 LT at night were similar to those of aqSOA and lower than it, while the peak at around 13:00 LT is consistent with the peak in the diurnal cycle of Ox (Fig. 6). Although there is also a smaller peak around 13:00 LT in P3, the whole pattern of aqSOA is characterized by a decreasing trend at daytime. These results suggest that fresh SOA could be formed through dark nighttime aqueous-phase reactions, which are partially reversible upon the evaporation of aerosol liquid water and also formed through photochemical aqueous-phase reactions during daytime. Different from aqSOA, which is highly correlated and limited with ALWC, two types of aqueous-phase chemistry in daytime and nighttime are dominant pathways to the fresh SOA growth. Our analysis on formation pathways of these SOA factors suggested the potential interactive roles of gas-phase oxidation, gas–particle partitioning, and aqueous-phase oxidation in the formation of SOA.
3.4 SOA from POA transformation
The photochemistry and aqueous-phase chemistry show distinct effects on POA evolution and SOA formation. The relationships between Ox-initiated SOA or aqSOA and other POA-related components (HOA + COA + primary-related SOA) are plotted in Fig. S9 in the Supplement. A strong negative correlation (R = −0.8) between POA-related components and Ox-initiated SOA was observed (Fig. S9c), consistent with the decrease in mass concentration of POA-related components during P2. This observation suggests that the production of Ox-initiated SOA was at least partly facilitated by photochemical transformation of other OA components. However, the better diffusion conditions in P2 might also attribute a great extent to the negative correlation, as the formation period of Ox-initiated SOA usually occurred during the afternoon when the boundary layer was more developed, while the POA usually decreased via horizontal and vertical diffusion. In comparison, POA-related components and aqSOA correlate weakly. When ALWC (< 20 µg m−3) and nitrate concentrations were lower (< 3 µg m−3), mostly during P1 and P2, POA-related components and aqSOA showed almost no correlation (R = 0.1and R = −0.1). However, when ALWC concentration and nitrate concentration were higher than those thresholds above (data points with yellow/red colors, mostly during P3), they had a relatively good negative correlation (R = −0.5) (Fig. S9f), indicating the importance of ALWC and nitrate in aqueous-phase chemistry. This is consistent with results in winter Beijing (Wang et al., 2021), where POA factor had strong negative correlations with aqSOA, suggesting that these POA factors might produce aqSOA by aqueous-phase oxidation. In addition, under high-ALWC conditions, nitrate had similar formation mechanisms to aqSOA. Or there is another possibility that high nitrate supports the potential formation/transformation from POA-related components to aqSOA, which is consistent with the results in Sect. 3.3. The phenomenon of negative correlation between POA-related components and SOA at high Ox and ALWC further emphasizes the importance of conversion from POA to SOA.

Figure 8(a) Van Krevelen diagram for the O:C and H:C ratios of different OA factors (marked with squares) and bulk of OA during summer (marked with plus signs and colored by the carbon oxidation state, OSc) and (b) mass fractions of ion fragments indicative of aqueous-phase processing and oxygenated functional groups (alcohols, carboxylic acids) as a function of ALWC.
As shown in the Van Krevelen (VK) plot (Fig. 8a), O:C and H:C both increase in the succession from primary-related SOA to Ox-initiated SOA and eventually to aqSOA, supporting a successive oxidation sequence from primary-related SOA to aqSOA. Generally, H:C shows a decreasing trend as O:C increases for organic compounds during oxidation in other studies (Ng et al., 2011; Gilardoni et al., 2016; Lee et al., 2017: Zhao et al., 2019; Chen et al., 2021), suggesting a general negative correlation between H:C and O:C. This positive relationship of O:C and H:C evolution during oxidative aging in this study is interesting. It might be caused by ring-breaking reactions which could further promote the transformation of aromatic POA to aqSOA. Previous studies in both laboratory (Huang et al., 2018; Wang et al., 2020) and field (Hu et al., 2016a) demonstrated that the OH-initiated ring-breaking reactions of aromatic species can occur in the aqueous phase and form highly oxidized oxygenated compounds. For example, Hems and Abbatt (2018) suggested that nitrophenol molecules could react rapidly with OH radicals in aqueous solutions with the addition of OH functional groups to the aromatic ring at the initial stage, followed by fragmentation to multifunctional organic species with high H:C and O:C ratios. Wang et al. (2021) found that the ring-breaking oxidation of aromatic FF-POA was the mechanism for aqSOA formation. Similar to those in primary-related SOA, PAH-like ions were also found in the mass spectrum of aqSOA at > 150, albeit less pronounced, consistent with a previous study in Beijing (Wang et al., 2021). This is likely due to the oxidation of PAHs in the conversion of primary-related SOA and aqSOA, which is caused by enhanced hydroxylation of the aromatic ring and increased yields of carboxylic acids in OH-initiated reactions (Sun et al., 2010). This kind of ring-breaking oxidation of aromatic POA could thus lead to aqSOA formation (Huang et al., 2018; Wang et al., 2021). In addition, the locations of aqSOA and the slope of overall OA are near the line with the slope of −1 in the VK plot, indicating more carboxylic acid formation with the replacement of a hydrogen atom with a carboxylic acid group (−COOH) (Heald et al., 2010; Ng et al., 2011). This observation supports that oxidation of PAHs was probably involved in the conversion of primary-related SOA to aqSOA through aqueous-phase chemistry, leading to functionalization as carbonyls and carboxylic acids.
Specifically, the organic fragments and mass spectrum evolution of OA were analyzed to illuminate the transformation in photochemical processing and aqueous-phase chemistry. Fig. 8b shows the mass fractions of , CH3SO+, , and ion fragments in OA as a function of ALWC. The aqSOA was tightly correlated with (R2 = 0.81) at 46 and CH3SO (R2 = 0.78) at 63 (Fig. S10 in the Supplement). Consistently, both of them showed increasing trends as ALWC increased, similar to aqSOA, which indicated typical fragment characteristics of ions of aqueous-phase processing products (Tan et al., 2009; Sun et al., 2016; Duan et al., 2021). The intensities of ( 45), a common fragment ion of carboxylic acids, are associated with aqueous oxidation of aromatic compounds. C2H2 ( 58) is a tracer ion for glyoxal, which could be a ring-breaking product from the aqueous-phase oxidation of PAHs. The increasing trends of these ions with ALWC suggest that water-soluble organic species such as carboxylic acids and glyoxal are produced as components of aqSOA following aromatic oxidation and ring breaking. Moreover, the concentration of PAHs increased with the increase of ALWC (Fig. S11 in the Supplement), consistent with the oxidation of PAHs from ring-breaking reactions that can take place in the aqueous phase and are involved in the conversion to aqSOA.
The sources and formation mechanisms of SOA were investigated by online aerosol mass spectrometry and statistical (PMF) analysis from August to September of 2019 in Handan, a mid-sized industrialized city in the NCP of China. Four specific SOA factors were resolved, including aqSOA (15 % to total OA), Ox-initiated SOA (31 %), fresh SOA (18 %), and primary-related SOA (5 %). By studying the formation of these SOA factors in different selected periods (P1–P3) against Ox and ALWC, we found multiple pathways leading to their formation, sometimes with mixed pathways for one type of SOA.
Both photochemistry and aqueous-phase chemistry resulted in an enhanced OA oxidation state. During the high-Ox period, photochemistry imposed significant impacts on the formation and evolution of SOA in summertime. The Ox-initiated SOA contributed up to 65 % to total OA in the daytime, with a high average growth rate of 0.8 , suggesting the efficient daytime formation of SOA from photochemistry. Rapid increases of the concentration and contribution (up to 61 %) of Ox-initiated SOA were found as Ox increased, while all the other OA factors showed decreasing trends with Ox concentration increasing. The difference suggests enhanced secondary transformation from POA and fresh SOA factors to the more aged Ox-initiated SOA under high-Ox conditions. However, during the high-RH period, two types of aqueous-phase chemistry were both important pathways for the SOA growth. During nighttime and under high-RH conditions, dark aqueous-phase chemistry played a significant role in rapid aqSOA formation (up to 45 % in total OA), while the aqueous-phase photochemistry was more important in rapid Ox-initiated SOA formation during daytime (up to 39 % in total OA). The primary-related SOA was evidently linked to the POA originated from coal combustion activities, as indicated by the PAH-like ion peaks. Although it constituted a small fraction of 5 %, the potential transformation and conversion from primary-related SOA to aqSOA could also be an important pathway via hydroxylation of the aromatic ring or ring-breaking oxidation of aromatic POA species through aqueous-phase chemistry. This study highlights the multiple reaction pathways, on top of multiple precursor types, for the formation of SOA in industrialized regions and calls for more in-depth study on the interactive roles of these formation pathways.
Raw data used in this study are archived at the Institute of Earth Environment, Chinese Academy of Sciences, and are available on request by contacting the corresponding author.
The supplement related to this article is available online at: https://doi.org/10.5194/acp-23-5419-2023-supplement.
RJH designed the study. Data analysis and source apportionment were done by YG and RJH. YG and RJH wrote the manuscript. YG and RJH interpreted data and prepared display items. All authors commented on and discussed the manuscript.
The contact author has declared that none of the authors has any competing interests.
Publisher's note: Copernicus Publications remains neutral with regard to jurisdictional claims in published maps and institutional affiliations.
This work was supported by the National Natural Science Foundation of China (no. 41925015), the Key Research Program of Frontier Sciences from the Chinese Academy of Sciences (no. ZDBS-LY-DQC001), the Strategic Priority Research Program of the Chinese Academy of Sciences (no. XDB40000000), and SKLLQG (no. SKLLQGTD1801).
This paper was edited by Samara Carbone and reviewed by two anonymous referees.
An, Z., Huang, R. J., Zhang, R., Tie, X., Li, G., Cao, J., Zhou, W., Shi, Z., Han, Y., Gu, Z., and Ji, Y.: Severe haze in northern China: A synergy of anthropogenic emissions and atmospheric processes, P. Natl. Acad. Sci. USA, 116, 8657–8666, https://doi.org/10.1073/pnas.1900125116, 2019.
Bikkina, S., Kawamura, K., and Sarin, M.: Secondary Organic Aerosol Formation over Coastal Ocean: Inferences from Atmospheric Water-Soluble Low Molecular Weight Organic Compounds, Environ. Sci. Technol., 51, 4347–4357, https://doi.org/10.1021/acs.est.6b05986, 2017.
Canagaratna, M. R., Jimenez, J. L., Kroll, J. H., Chen, Q., Kessler, S. H., Massoli, P., Hildebrandt Ruiz, L., Fortner, E., Williams, L. R., Wilson, K. R., Surratt, J. D., Donahue, N. M., Jayne, J. T., and Worsnop, D. R.: Elemental ratio measurements of organic compounds using aerosol mass spectrometry: characterization, improved calibration, and implications, Atmos. Chem. Phys., 15, 253–272, https://doi.org/10.5194/acp-15-253-2015, 2015.
Canonaco, F., Crippa, M., Slowik, J. G., Baltensperger, U., and Prévôt, A. S. H.: SoFi, an IGOR-based interface for the efficient use of the generalized multilinear engine (ME-2) for the source apportionment: ME-2 application to aerosol mass spectrometer data, Atmos. Meas. Tech., 6, 3649–3661, https://doi.org/10.5194/amt-6-3649-2013, 2013.
Carlton, A. G., Turpin, B. J., Altieri, K. E., Seitzinger, S., Reff, A., Lim, H. J., and Ervens, B.: Atmospheric oxalic acid and SOA production from glyoxal: Results of aqueous photooxidation experiments, Atmos. Environ., 41, 7588–7602, https://doi.org/10.1016/j.atmosenv.2007.05.035, 2007.
Chen, W., Ye, Y., Hu, W., Zhou, H., Pan, T., Wang, Y., Song, W., Song, Q., Ye, C., Wang, C., Wang, B., Huang, S., Yuan, B., Zhu, M., Lian, X., Zhang, G., Bi, X., Jiang, F., Liu, J., Canonaco, F., Prevot, A. S. H., Shao, M., and Wang, X.: Real-time characterization of aerosol compositions, sources and aging processes in Guangzhou during PRIDE-GBA 2018 campaign, J. Geophys. Res.-Atmos., 126, e2021JD035114, https://doi.org/10.1029/2021jd035114, 2021.
Cohen, A. J., Brauer, M., Burnett, R., Anderson, H. R., Frostad, J., Estep, K., Balakrishnan, K., Brunekreef, B., Dandona, L., Dandona, R., Feigin, V., Freedman, G., Hubbell, B., Jobling, A., Kan, H., Knibbs, L., Liu, Y., Martin, R., Morawska, L., Pope, C. A., Shin, H., Straif, K., Shaddick, G., Thomas, M., van Dingenen, R., van Donkelaar, A., Vos, T., Murray, C. J. L., and Forouzanfar, M. H.: Estimates and 25-year trends of the global burden of disease attributable to ambient air pollution: an analysis of data from the Global Burden of Diseases Study 2015, Lancet, 389, 1907–1918, https://doi.org/10.1016/S0140-6736(17)30505-6, 2017.
Donahue, N. M., Robinson, A. L., Stanier, C. O., and Pandis, S. N.: Coupled partitioning, dilution, and chemical aging of semivolatile organics, Environ. Sci. Technol., 40, 2635–2643, https://doi.org/10.1021/es052297c, 2006.
Duan, J., Huang, R. J., Gu, Y., Lin, C., Zhong, H., Wang, Y., Yuan, W., Ni, H., Yang, L., Chen, Y., Worsnop, D. R., and O'Dowd, C.: The formation and evolution of secondary organic aerosol during summer in Xi'an: Aqueous phase processing in fog-rain days, Sci. Total Environ., 756, 144077, https://doi.org/10.1016/j.scitotenv.2020.144077, 2021.
Dzepina, K., Arey, J., Marr, L. C., Worsnop, D. R., Salcedo, D., Zhang, Q., Onasch, T. B., Molina, L. T., Molina, M. J., and Jimenez, J. L.: Detection of particle-phase polycyclic aromatic hydrocarbons in Mexico City using an aerosol mass spectrometer, Int. J. Mass Spectrom., 263, 152–170, https://doi.org/10.1016/j.ijms.2007.01.010, 2007.
Elser, M., Huang, R.-J., Wolf, R., Slowik, J. G., Wang, Q., Canonaco, F., Li, G., Bozzetti, C., Daellenbach, K. R., Huang, Y., Zhang, R., Li, Z., Cao, J., Baltensperger, U., El-Haddad, I., and Prévôt, A. S. H.: New insights into PM2.5 chemical composition and sources in two major cities in China during extreme haze events using aerosol mass spectrometry, Atmos. Chem. Phys., 16, 3207–3225, https://doi.org/10.5194/acp-16-3207-2016, 2016.
Ervens, B., Turpin, B. J., and Weber, R. J.: Secondary organic aerosol formation in cloud droplets and aqueous particles (aqSOA): a review of laboratory, field and model studies, Atmos. Chem. Phys., 11, 11069–11102, https://doi.org/10.5194/acp-11-11069-2011, 2011.
Ervens, B., Armin, S., B., L. Y., and J., and T. B.: Key parameters controlling OH-initiated formation of secondary organic aerosol in the aqueous phase (aqSOA), J. Geophys. Res., 119, 3997–4016, https://doi.org/10.1002/2013JD021021, 2014.
Fountoukis, C. and Nenes, A.: ISORROPIA II: a computationally efficient thermodynamic equilibrium model for K+–Ca2+–Mg2+––Na+–––Cl−–H2O aerosols, Atmos. Chem. Phys., 7, 4639–4659, https://doi.org/10.5194/acp-7-4639-2007, 2007.
Gilardoni, S., Massoli, P., Paglione, M., Giulianelli, L., Carbone, C., Rinaldi, M., Decesari, S., Sandrini, S., Costabile, F., and Gobbi, G. P.: Direct observation of aqueous secondary organic aerosol from biomass-burning emissions, P. Natl. Acad. Sci. USA, 113, 10013–10018, https://doi.org/10.1073/pnas.1602212113, 2016.
Gu, Y., Huang, R. J., Li, Y., Duan, J., Chen, Q., Hu, W., Zheng, Y., Lin, C., Ni, H., Dai, W., Cao, J., Liu, Q., Chen, Y., Chen, C., Ovadnevaite, J., Ceburnis, D., and O'Dowd, C.: Chemical nature and sources of fine particles in urban Beijing: Seasonality and formation mechanisms, Environ. Int., 140, 105732, https://doi.org/10.1016/j.envint.2020.105732, 2020.
Heald, C. L., Kroll, J. H., Jimenez, J. L., Docherty, K. S., Decarlo, P. F., Aiken, A. C., Chen, Q., Martin, S. T., Farmer, D. K., and Artaxo, P.: A simplified description of the evolution of organic aerosol composition in the atmosphere, Geophys. Res. Lett., 37, L08803, https://doi.org/10.1029/2010GL042737, 2010.
Hems, R. F. and Abbatt, J. P. D.: Aqueous Phase Photo-oxidation of Brown Carbon Nitrophenols: Reaction Kinetics, Mechanism, and Evolution of Light Absorption, ACS Earth Sp. Chem., 2, 225–234, https://doi.org/10.1021/acsearthspacechem.7b00123, 2018.
Hennigan, C. J., Izumi, J., Sullivan, A. P., Weber, R. J., and Nenes, A.: A critical evaluation of proxy methods used to estimate the acidity of atmospheric particles, Atmos. Chem. Phys., 15, 2775–2790, https://doi.org/10.5194/acp-15-2775-2015, 2015.
Herndon, S. C., Onasch, T. B., Wood, E. C., Kroll, J. H., Canagaratna, M. R., Jayne, J. T., Zavala, M. A., Knighton, W. B., Mazzoleni, C., Dubey, M. K., Ulbrich, I. M., Jimenez, J. L., Seila, R., de Gouw, J. A., de Foy, B., Fast, J., Molina, L. T., Kolb, C. E., and Worsnop, D. R.: Correlation of secondary organic aerosol with odd oxygen in Mexico City, Geophys. Res. Lett., 35, L15804, https://doi.org/10.1029/2008GL034058, 2008.
Hu, W., Hu, M., Hu, W.-W., Niu, H., Zheng, J., Wu, Y., Chen, W., Chen, C., Li, L., Shao, M., Xie, S., and Zhang, Y.: Characterization of submicron aerosols influenced by biomass burning at a site in the Sichuan Basin, southwestern China, Atmos. Chem. Phys., 16, 13213–13230, https://doi.org/10.5194/acp-16-13213-2016, 2016a.
Hu, W., Hu, M., Hu, W., Jimenez, J. L., Yuan, B., Chen, W., Wang, M., Wu, Y., Chen, C., Wang, Z., Peng, J., Zeng, L., and Shao, M.: Chemical composition, sources, and aging process of submicron aerosols in Beijing: Contrast between summer and winter, J. Geophys. Res.-Atmos., 121, 1955–1977, https://doi.org/10.1002/2015JD024020, 2016b.
Hu, W., Hu, M., Hu, W.-W., Zheng, J., Chen, C., Wu, Y., and Guo, S.: Seasonal variations in high time-resolved chemical compositions, sources, and evolution of atmospheric submicron aerosols in the megacity Beijing, Atmos. Chem. Phys., 17, 9979–10000, https://doi.org/10.5194/acp-17-9979-2017, 2017.
Huang, D. D., Zhang, Q., Cheung, H. H. Y., Yu, L., Zhou, S., Anastasio, C., Smith, J. D., and Chan, C. K.: Formation and Evolution of aqSOA from Aqueous-Phase Reactions of Phenolic Carbonyls: Comparison between Ammonium Sulfate and Ammonium Nitrate Solutions, Environ. Sci. Technol., 52, 9215–9224, https://doi.org/10.1021/acs.est.8b03441, 2018.
Huang, R. J., Zhang, Y., Bozzetti, C., Ho, K. F., Cao, J. J., Han, Y., Daellenbach, K. R., Slowik, J. G., Platt, S. M., Canonaco, F., Zotter, P., Wolf, R., Pieber, S. M., Bruns, E. A., Crippa, M., Ciarelli, G., Piazzalunga, A., Schwikowski, M., Abbaszade, G., Schnelle-Kreis, J., Zimmermann, R., An, Z., Szidat, S., Baltensperger, U., El Haddad, I., and Prévôt, A. S. H.: High secondary aerosol contribution to particulate pollution during haze events in China, Nature, 514, 218–222, https://doi.org/10.1038/nature13774, 2014.
Huang, R.-J., Wang, Y., Cao, J., Lin, C., Duan, J., Chen, Q., Li, Y., Gu, Y., Yan, J., Xu, W., Fröhlich, R., Canonaco, F., Bozzetti, C., Ovadnevaite, J., Ceburnis, D., Canagaratna, M. R., Jayne, J., Worsnop, D. R., El-Haddad, I., Prévôt, A. S. H., and O'Dowd, C. D.: Primary emissions versus secondary formation of fine particulate matter in the most polluted city (Shijiazhuang) in North China, Atmos. Chem. Phys., 19, 2283–2298, https://doi.org/10.5194/acp-19-2283-2019, 2019.
Huang, R.-J., He, Y., Duan, J., Li, Y., Chen, Q., Zheng, Y., Chen, Y., Hu, W., Lin, C., Ni, H., Dai, W., Cao, J., Wu, Y., Zhang, R., Xu, W., Ovadnevaite, J., Ceburnis, D., Hoffmann, T., and O'Dowd, C. D.: Contrasting sources and processes of particulate species in haze days with low and high relative humidity in wintertime Beijing, Atmos. Chem. Phys., 20, 9101–9114, https://doi.org/10.5194/acp-20-9101-2020, 2020.
Jimenez, J. L., Jayne, J. T., Shi, Q., Kolb, C. E., Worsnop, D. R., Yourshaw, I., Seinfeld, J. H., Flagan, R. C., Zhang, X., Smith, K. A., Morris, J. W., and Davidovits, P.: Ambient aerosol sampling using the Aerodyne aerosol mass spectrometer, J. Geophys. Res.-Atmos., 108, 1–13, https://doi.org/10.1029/2001jd001213, 2003.
Jimenez, J. L., Canagaratna, M. R., Donahue, N. M., Prevot, A. S. H., Zhang, Q., Kroll, J. H., DeCarlo, P. F., Allan, J. D., Coe, H., Ng, N. L., Aiken, A. C., Docherty, K. S., Ulbrich, I. M., Grieshop, A. P., Robinson, A. L., Duplissy, J., Smith, J. D., Wilson, K. R., Lanz, V. A., Hueglin, C., Sun, Y. L., Tian, J., Laaksonen, A., Raatikainen, T., Rautiainen, J., Vaattovaara, P., Ehn, M., Kulmala, M., Tomlinson, J. M., Collins, D. R., Cubison, M. J., Dunlea, E. J., Huffman, J. A., Onasch, T. B., Alfarra, M. R., Williams, P. I., Bower, K., Kondo, Y., Schneider, J., Drewnick, F., Borrmann, S., Weimer, S., Demerjian, K., Salcedo, D., Cottrell, L., Griffin, R., Takami, A., Miyoshi, T., Hatakeyama, S., Shimono, A., Sun, J. Y., Zhang, Y. M., Dzepina, K., Kimmel, J. R., Sueper, D., Jayne, J. T., Herndon, S. C., Trimborn, A. M., Williams, L. R., Wood, E. C., Middlebrook, A. M., Kolb, C. E., Baltensperger, U., and Worsnop, D. R.: Evolution of organic aerosols in the atmosphere, Science (80-), 326, 1525–1529, https://doi.org/10.1126/science.1180353, 2009.
Kuang, Y., He, Y., Xu, W., Yuan, B., Zhang, G., Ma, Z., Wu, C., Wang, C., Wang, S., Zhang, S., Tao, J., Ma, N., Su, H., Cheng, Y., Shao, M., and Sun, Y.: Photochemical Aqueous-Phase Reactions Induce Rapid Daytime Formation of Oxygenated Organic Aerosol on the North China Plain, Environ. Sci. Technol., 54, 3849–3860, https://doi.org/10.1021/acs.est.9b06836, 2020.
Lee, A. K. Y., Chen, C.-L., Liu, J., Price, D. J., Betha, R., Russell, L. M., Zhang, X., and Cappa, C. D.: Formation of secondary organic aerosol coating on black carbon particles near vehicular emissions, Atmos. Chem. Phys., 17, 15055–15067, https://doi.org/10.5194/acp-17-15055-2017, 2017.
Li, H., Zhang, Q., Zhang, Q., Chen, C., Wang, L., Wei, Z., Zhou, S., Parworth, C., Zheng, B., Canonaco, F., Prévôt, A. S. H., Chen, P., Zhang, H., Wallington, T. J., and He, K.: Wintertime aerosol chemistry and haze evolution in an extremely polluted city of the North China Plain: significant contribution from coal and biomass combustion, Atmos. Chem. Phys., 17, 4751–4768, https://doi.org/10.5194/acp-17-4751-2017, 2017.
Li, J., Liu, Z., Gao, W., Tang, G., Hu, B., Ma, Z., and Wang, Y.: Insight into the formation and evolution of secondary organic aerosol in the megacity of Beijing, China, Atmos. Environ., 220, 117070, https://doi.org/10.1016/j.atmosenv.2019.117070, 2020.
Middlebrook, A. M., Bahreini, R., Jimenez, J. L., and Canagaratna, M. R.: Evaluation of composition-dependent collection efficiencies for the Aerodyne aerosol mass spectrometer using field data, Aerosol Sci. Technol., 46, 258–271, https://doi.org/10.1080/02786826.2011.620041, 2012.
Ng, N. L., Canagaratna, M. R., Zhang, Q., Jimenez, J. L., Tian, J., Ulbrich, I. M., Kroll, J. H., Docherty, K. S., Chhabra, P. S., Bahreini, R., Murphy, S. M., Seinfeld, J. H., Hildebrandt, L., Donahue, N. M., DeCarlo, P. F., Lanz, V. A., Prévôt, A. S. H., Dinar, E., Rudich, Y., and Worsnop, D. R.: Organic aerosol components observed in Northern Hemispheric datasets from Aerosol Mass Spectrometry, Atmos. Chem. Phys., 10, 4625–4641, https://doi.org/10.5194/acp-10-4625-2010, 2010.
Ng, N. L., Canagaratna, M. R., Jimenez, J. L., Chhabra, P. S., Seinfeld, J. H., and Worsnop, D. R.: Changes in organic aerosol composition with aging inferred from aerosol mass spectra, Atmos. Chem. Phys., 11, 6465–6474, https://doi.org/10.5194/acp-11-6465-2011, 2011.
Onasch, T. B., Trimborn, A., Fortner, E. C., Jayne, J. T., Kok, G. L., Williams, L. R., Davidovits, P., and Worsnop, D. R.: Soot particle aerosol mass spectrometer: Development, validation, and initial application, Aerosol Sci. Technol., 46, 804–817, https://doi.org/10.1080/02786826.2012.663948, 2012.
Paatero, P.: The Multilinear Engine—A Table-Driven, Least Squares Program for Solving Multilinear Problems, Including the n-Way Parallel Factor Analysis Model, J. Comput. Graph. Stat., 8, 854–888, https://doi.org/10.1080/10618600.1999.10474853, 1999.
Sullivan, A. P., Hodas, N., Turpin, B. J., Skog, K., Keutsch, F. N., Gilardoni, S., Paglione, M., Rinaldi, M., Decesari, S., Facchini, M. C., Poulain, L., Herrmann, H., Wiedensohler, A., Nemitz, E., Twigg, M. M., and Collett Jr., J. L.: Evidence for ambient dark aqueous SOA formation in the Po Valley, Italy, Atmos. Chem. Phys., 16, 8095–8108, https://doi.org/10.5194/acp-16-8095-2016, 2016.
Su, J., Zhao, P., Ge, S., and Ding, J.: Aerosol liquid water content of PM2.5 and its influencing factors in Beijing, China, Sci. Total Environ., 839, 156342, https://doi.org/10.1016/j.scitotenv.2022.156342, 2022.
Sun, Y., Chen, C., Zhang, Y., Xu, W., Zhou, L., Cheng, X., Zheng, H., Ji, D., Li, J., Tang, X., Fu, P., and Wang, Z.: Rapid formation and evolution of an extreme haze episode in Northern China during winter 2015, Sci. Rep., 6, 27151, https://doi.org/10.1038/srep27151, 2016.
Sun, Y., Xu, W., Zhang, Q., Jiang, Q., Canonaco, F., Prévôt, A. S. H., Fu, P., Li, J., Jayne, J., Worsnop, D. R., and Wang, Z.: Source apportionment of organic aerosol from 2-year highly time-resolved measurements by an aerosol chemical speciation monitor in Beijing, China, Atmos. Chem. Phys., 18, 8469–8489, https://doi.org/10.5194/acp-18-8469-2018, 2018.
Sun, Y. L., Zhang, Q., Anastasio, C., and Sun, J.: Insights into secondary organic aerosol formed via aqueous-phase reactions of phenolic compounds based on high resolution mass spectrometry, Atmos. Chem. Phys., 10, 4809–4822, https://doi.org/10.5194/acp-10-4809-2010, 2010.
Tan, Y., Perri, M. J., Seitzinger, S. P., and Turpin, B. J.: Effects of precursor concentration and acidic sulfate in aqueous Glyoxal-OH radical oxidation and implications for secondary organic aerosol, Environ. Sci. Technol., 43, 8105–8112, https://doi.org/10.1021/es901742f, 2009.
Wang, J., Ye, J., Zhang, Q., Zhao, J., Wu, Y., Li, J., Liu, D., Li, W., Zhang, Y., Wu, C., Xie, C., Qin, Y., Lei, Y., Huang, X., Guo, J., Liu, P., Fu, P., Li, Y., Lee, H. C., Choi, H., Zhang, J., Liao, H., Chen, M., Sun, Y., Ge, X., Martin, S. T., and Jacob, D. J.: Aqueous production of secondary organic aerosol from fossil-fuel emissions in winter Beijing haze, P. Natl. Acad. Sci. USA, 118, 1–6, https://doi.org/10.1073/pnas.2022179118, 2021.
Wang, S., Newland, M. J., Deng, W., Rickard, A. R., Hamilton, J. F., Muñoz, A., Ródenas, M., Vázquez, M. M., Wang, L., and Wang, X.: Aromatic Photo-oxidation, A New Source of Atmospheric Acidity, Environ. Sci. Technol., 54, 7798–7806, https://doi.org/10.1021/acs.est.0c00526, 2020.
Xu, S., Liu, W., and Tao, and S.: Emission of polycyclic aromatic hydrocarbons in China, Environ. Sci. Technol., 40, 702–708, https://doi.org/10.1021/es0517062, 2006.
Xu, W., Han, T., Du, W., Wang, Q., Chen, C., Zhao, J., Li, J., Fu, P., Wang, Z., Worsnop, D. R., and Sun, Y.: Effects of Aqueous-phase and Photochemical Processing on Secondary Organic Aerosol Formation and Evolution in Beijing, China, Environ. Sci. Technol., 51, 762–770, https://doi.org/10.1021/acs.est.6b04498, 2017.
Xu, W., Sun, Y., Wang, Q., Zhao, J., Wang, J., Ge, X., Xie, C., Zhou, W., Du, W., Li, J., Fu, P., Wang, Z., Worsnop, D. R., and Coe, H.: Changes in Aerosol Chemistry From 2014 to 2016 in Winter in Beijing: Insights From High-Resolution Aerosol Mass Spectrometry, J. Geophys. Res.-Atmos., 124, 1132–1147, https://doi.org/10.1029/2018JD029245, 2019.
Ye, C., Liu, P., Ma, Z., Xue, C., Zhang, C., Zhang, Y., Liu, J., Liu, C., Sun, X., and Mu, Y.: High H2O2 Concentrations Observed during Haze Periods during the Winter in Beijing: Importance of H2O2 Oxidation in Sulfate Formation, Environ. Sci. Technol. Lett., 5, 757–763, https://doi.org/10.1021/acs.estlett.8b00579, 2018.
Zhang, Q., Jimenez, J. L., Canagaratna, M. R., Ulbrich, I. M., Ng, N. L., Worsnop, D. R., and Sun, Y.: Understanding atmospheric organic aerosols via factor analysis of aerosol mass spectrometry: A review, Anal. Bioanal. Chem., 401, 3045–3067, https://doi.org/10.1007/s00216-011-5355-y, 2011.
Zhao, J., Qiu, Y., Zhou, W., Xu, W., Wang, J., Zhang, Y., Li, L., Xie, C., Wang, Q., Du, W., Worsnop, D. R., Canagaratna, M. R., Zhou, L., Ge, X., Fu, P., Li, J., Wang, Z., Donahue, N. M., and Sun, Y.: Organic Aerosol Processing During Winter Severe Haze Episodes in Beijing, J. Geophys. Res.-Atmos., 124, 10248–10263, https://doi.org/10.1029/2019JD030832, 2019.