the Creative Commons Attribution 4.0 License.
the Creative Commons Attribution 4.0 License.
 | 03 May 2023
Measurement report: Atmospheric fluorescent bioaerosol concentrations measured during 18 months in a coniferous forest in the south of Sweden
Madeleine Petersson Sjögren
Malin Alsved
Tina Šantl-Temkiv
Thomas Bjerring Kristensen
Jakob Löndahl
Biological aerosol particles affect human health, are essential for microbial and gene dispersal, and have been proposed as important agents for atmospheric processes. However, the abundance and size distributions of atmospheric biological particles are largely unknown. In this study we used a laser-induced fluorescence instrument to measure fluorescent biological aerosol particle (FBAP) concentrations for 18 months (October 2020–April 2022) at a rural, forested site in Sweden. The aim of this study was to investigate FBAP number concentrations (NFBAP) over time and analyze their relationship with meteorological parameters.
NFBAP was highest in summer and lowest in winter, exhibiting a ∼ 5-fold difference between these seasons. The median NFBAP was 0.0050, 0.0025, 0.0027, and 0.0126 cm−3 in fall, winter, spring, and summer, respectively, and constituted ∼ 0.1–0.5 % of the total supermicron particle number concentration. NFBAP was dominated by the smallest measured size fraction (1–3 µm), suggesting that the main portions of the biological particles measured were due to single bacterial cells, fungal spores, and bacterial agglomerates. NFBAP was significantly correlated with increasing air temperature (P<0.01) in all seasons. For most of the campaign NFBAP was seen to increase with wind speed (P<0.01), while the relationship with relative humidity was for most of the campaign nonsignificant (46 %) but for a large part (30 %) negative (P<0.05). Our results indicate that NFBAP was highest during warm and dry conditions when wind speeds were high, suggesting that a major part of the FBAP in spring and summer was due to mechanical aerosol generation and release mechanisms. In fall, relative humidity may have been a more important factor in bioaerosol release. This is one of the longest time series of atmospheric FBAPs, which are greatly needed for estimates of bioaerosol background concentrations in comparable regions.
- Article
(6367 KB) - Full-text XML
-
Supplement
(1613 KB) - BibTeX
- EndNote


Primary biological aerosol particles (PBAPs), also called bioaerosols, make up a diverse set of particles. They constitute airborne fungal cells and spores, bacteria, pollen, plant, and animal debris as well as biomolecules present on their own or attached to other particles. Bioaerosols are emitted into the atmosphere, from every region and ecosystem of the planet, and range in size from a few nanometers to 100 µm (Despres et al., 2012; Womack et al., 2015).
They can influence climate and potentially the hydrological cycle by acting as ice-nucleating particles (INPs) (Pöschl et al., 2010; Prenni et al., 2009b; Hill et al., 2016). Diverse microorganisms, including bacteria, fungi, microalgae, pollen, and lichens, are known to produce high-temperature ice-nucleating compounds and have therefore been proposed to influence cloud formation (Diehl et al., 2001; Lohmann and Feichter, 2005; Bowers et al., 2009; Pratt et al., 2009; Prenni et al., 2009a). Bioaerosols transmit pathogens, spread diseases, and can have toxic, infectious, and allergic effects in humans, animals, crops, and ecosystems. They can cause human respiratory diseases when inhaled or deposited in mucus in the eyes (Franze et al., 2005; Lacey and Dutkiewicz, 1994; Kim et al., 2018; Brown and Hovmøller, 2002). Despite their large size, bioaerosols are aerodynamically buoyant and can spread thousands of kilometers across land and oceans (Griffin et al., 2007; Burrows et al., 2009a). Atmospheric dispersal of bioaerosols depends on particle size and meteorological parameters, including wind, humidity, temperature, convection, and turbulence (Norros et al., 2014; Madelin, 1994; Jones and Harrison, 2004).
Bioaerosols have traditionally been collected and measured with offline techniques, but continuous online measurements are needed to increase time resolution and improve understanding of variability driven by meteorological factors and diurnal or seasonal cycles (Huffman et al., 2019; Šantl-Temkiv et al., 2020). The offline methods incorporate filter collection, impactors, impingers, and electrostatic precipitators. While these measurements promote specificity by determining the identities and properties of bioaerosols, they lack sensitivity with respect to time and size resolution. Progress in the detection of bioaerosols with higher time resolution has been made by utilizing laser-induced fluorescence (LIF) (Hill et al., 1995).
LIF is based on the intrinsic fluorescence light emission of organic molecules that contain fluorophores such as amino acids, coenzymes, vitamins, biopolymers, and cell-wall compounds (Li et al., 2019). Instruments with LIF provide continuous and quantitative measurements of fluorescent biological aerosol particles (FBAPs). While this method cannot offer specificity or imaging capabilities comparable to downstream laboratory analysis, it offers real-time detection and discrimination of bioaerosols with high time and size resolution. Such real-time measurements promote understanding of the temporal variations in abundance, sources, and emission factors of bioaerosols. Model studies emphasize the need for more and continuous data to constrain models on emission and transport of atmospheric bioaerosols (Burrows et al., 2009b, a; Heald and Spracklen, 2009).
Apart from LIF, new hybrid instruments that combine different detection methods with machine learning have become available in the last 4–5 years. These include Poleno (Swisens, Switzerland), Rapid-E (Plair, Switzerland), and POMO-BAA500e (Helmut Hund GmbH, Germany). These new methods show promising results in real-time bioaerosol identification and particle counting and may be more specific for bioaerosol identification (Sauvageat et al., 2020; Šaulienė et al., 2019; Schiele et al., 2019).
Despite the wide-ranging influence of bioaerosols on climate, agriculture, and public health, long-term real-time data on bioaerosols are limited. Table 1 summarizes the eight continuous real-time FBAP number concentration (NFBAP) measurements longer than 4 weeks that have been made. These studies were conducted in a wide range of environments (remote, rural, urban, tropical, and high-altitude) in Asia, North America, South America, and Europe, with measurement periods ranging from a few weeks to a maximum of 20 months (Huffman et al., 2010, 2012, 2013; Schumacher et al., 2013; Toprak and Schnaiter, 2013; Saari et al., 2015; Gosselin et al., 2016; Valsan et al., 2016). The most common commercially available instruments used for LIF measurement of NFBAP are the ultraviolet aerodynamic particle sizer (UV-APS; TSI Inc., St. Paul, Minnesota, USA) and the wideband integrated bioaerosol sensor (WIBS; DMT, Longmont, Colorado, USA). The UV-APS was discontinued in 2014. Other LIF instruments include the BioScout (Environics Oy, Finland) and the BioTrak® real-time viable particle counter (TSI Inc. St. Paul, Minnesota, USA). In the studies listed in Table 1, the bioaerosol concentrations were reported as averages over the indicated time periods. In these studies, NFBAP ranged between 0.0053 cm−3, measured in the winter in Colorado (Schumacher et al., 2013), and 0.073 cm−3, measured in the Amazonian tropical rainforest (Huffman et al., 2012). Only two studies were long enough to consider seasonal variations. For these, NFBAP was clearly highest in the summer and lowest in the winter (Schumacher et al., 2013; Toprak and Schnaiter, 2013). Based on the eight studies listed in Table 1, the NFBAP made up between 1.1 % and 24 % of the total supermicron (particle diameters: 1–10 µm) concentration (Valsan et al., 2016; Huffman et al., 2012). Several studies showed that increased relative humidity (RH) was positively correlated with FBAP concentrations, while air temperature was negatively correlated (Huffman et al., 2010, 2012; Schumacher et al., 2013; Toprak and Schnaiter, 2013; Saari et al., 2015; Valsan et al., 2016). In some cases, rain events were associated with significant increases in NFBAP (Huffman et al., 2012; Schumacher et al., 2013), but the pattern is inconsistent (Toprak and Schnaiter, 2013). No clear patterns have been observed for the effect of wind speed and wind direction on NFBAP, although several studies have addressed it (Huffman et al., 2010; Schumacher et al., 2013; Valsan et al., 2016). Clear 24 h cycles (also referred to as diurnal cycles) have been identified (Huffman et al., 2010, 2012; Schumacher et al., 2013; Toprak and Schnaiter, 2013; Saari et al., 2015; Valsan et al., 2016). An extended version of Table 1, also including shorter LIF-FBAP measurements, is included in the Supplement.
The aim of this study was to investigate short- and long-term drivers behind FBAPs, as a proxy for PBAPs, in rural boundary-layer air for a period covering all seasons in southern Sweden. We used a LIF instrument (BioTrak, TSI Inc., St. Paul, Minnesota, USA) for counting and sizing of FBAPs during 18 months between October 2020 and April 2022 at the Hyltemossa Aerosols, Clouds, and Trace gases Research InfraStructure (ACTRIS) and Integrated Carbon Observation System (ICOS) station. Thus, this is one of the longest multi-month ambient measurement studies for real-time bioaerosol detection using a LIF instrument.
Table 1Summary of previous long-term (>4 weeks) continuous measurements of NFBAP with real-time detection, with identified associations and correlations with meteorological parameters and cycles in NFBAP. When no average NFBAP or was reported, this is indicated by a hyphen. When both mean and median values were reported, they are listed as mean/median.
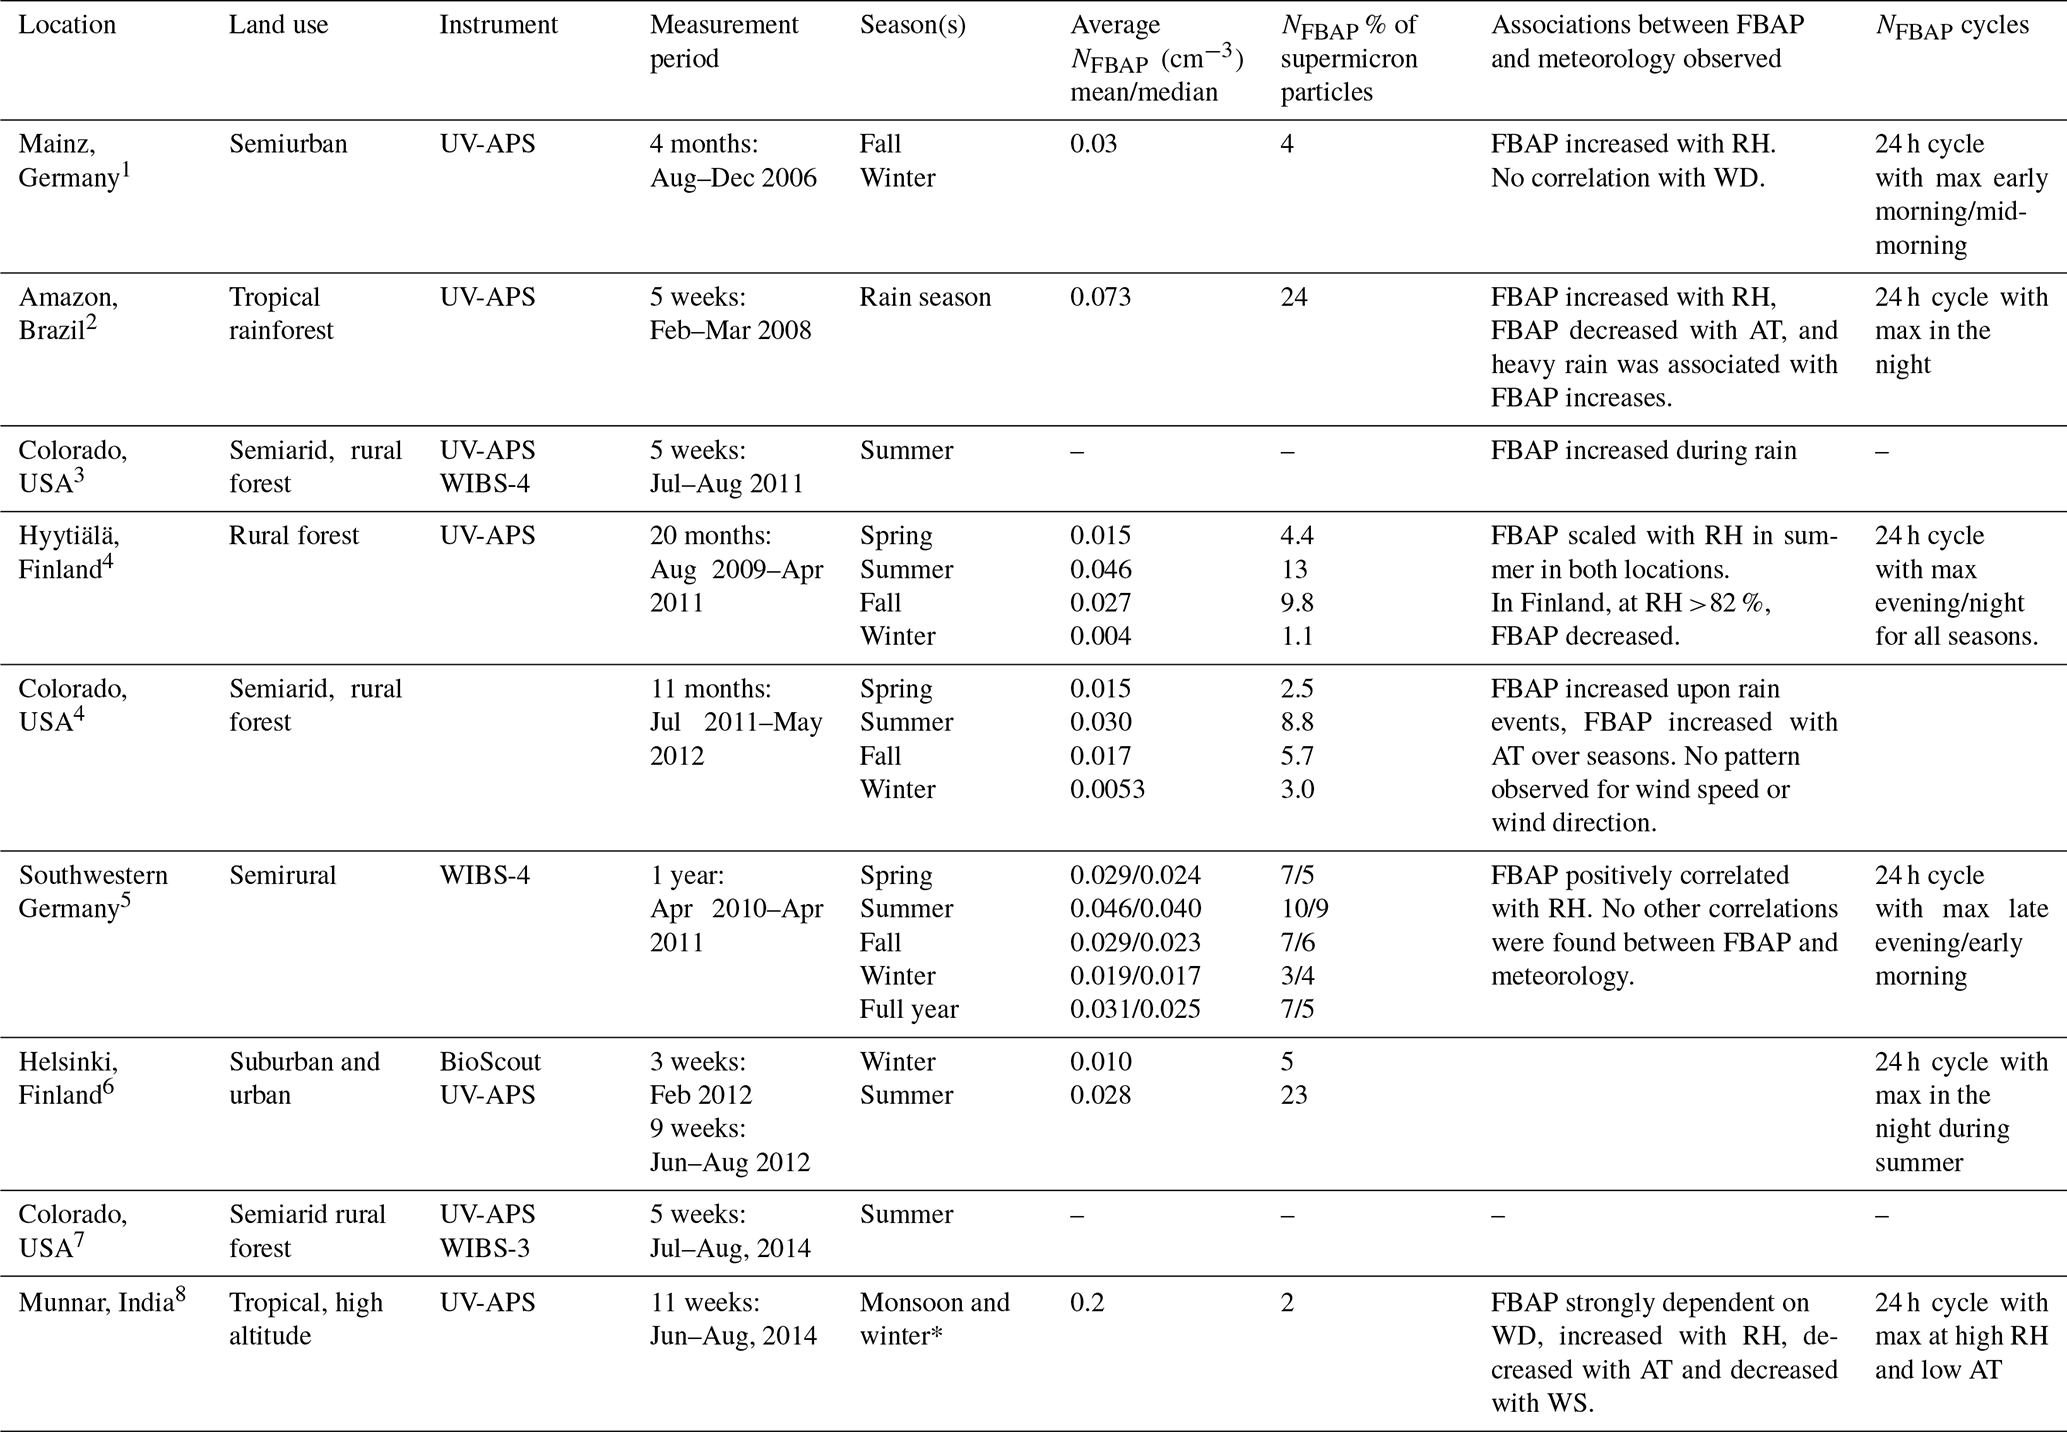
Huffman et al. (2010, 2012, 2013); 4 Schumacher et al. (2013); 5 Toprak and Schnaiter (2013); 6 Saari et al. (2015); 7 Gosselin et al. (2016); 8 Valsan et al. (2016). * Results were only reported for the monsoon period and not for the winter. Abbreviations: relative humidity RH; air temperature AT; wind direction WD; wind speed WS; total aerosol particles TAPs; fluorescent biological aerosol particle FBAP.
2.1 Hyltemossa research site
The measurements were performed at the Hyltemossa research station, situated at latitude 56∘5′52′′ N and longitude 13∘25′8′′ E, from 6 October 2020 until 1 April 2022. The sampling site, established in 2014, is located in a managed coniferous forest. Sections of the forest are clear-cut every 50 years, and the trees grow about 35 m in 100 years. The vegetation is dominated by Norway spruce (Picea abies) with a low fraction of birch trees (Betula sp.) and some Scots pine (Pinus sylvestris). The average tree canopy height at the sampling site is ∼ 20 m. The forest floor is covered by a thick moss layer, and very little shrub life grows under the trees.
2.2 Fluorescent biological aerosol measurement
We used a BioTrak® real-time viable particle counter (TSI Inc., US) for continuous measurement of atmospheric NFBAP and total supermicron (1–12 µm) aerosol particle number concentration (NTAP). The instrument combines an optical particle counter (OPC) system with a fluorescence detector to determine whether a particle is biologically based on a built-in discrimination algorithm. The BioTrak® particle counter has a sample flow of 28.3 L min−1. The sample airflow first passes the OPC, where size and total particle number concentration are determined using single-particle light scattering from a 660 nm laser. The BioTrak OPC has six size channels with lower cutoff diameters of 0.5, 0.7, 1, 3, 5, and 10 µm. Particles are concentrated, and the airflow is lowered down to 1 L min−1 with a concentrator to enable measurement of low-intensity fluorescence with the LIF detector. Most of the smallest particles (<1 µm) will follow the exhaust flow in the virtual impactor, and hence primarily particles >1 µm reach the LIF detector. In the LIF detector, single particles are illuminated by a 405 nm collimated laser, and three independent optical signals are collected. The first signal is scattered light detected with an avalanche photo detector (APD) that gives the particle size. The second and third signals are the emitted fluorescence light that is collimated and separated into two wavelength bands at 405–500 and 500–600 nm, respectively, collected with two separate photomultiplier tubes. The three independent signals are converted to electrical signals, digitized, and fed to a detection algorithm that classifies the particle as biological (fluorescent) or not. This is the first application of the BioTrak for measurement of ambient air.
For comparison of results between different studies of ambient air bioaerosol measurements (in particular with more used techniques such as UV-APS and WIBS), it should be noted that the BioTrak's fluorescence excitation and fluorescence emission operates at partly different wavelengths compared to both the WIBS and the UV-APS. Therefore, data are not completely comparable. The WIBS-5 instrument has fluorescence excitation at 280 and 370 nm and measures fluorescence emission in two ranges: 310 nm and 420–650 nm. Moreover, the WIBS-5 measures fluorescent particles down to 0.3 µm, which is not possible with the BioTrak. The UV-APS measures bioaerosols down to 0.5 µm with an excitation wavelength of 355 nm and measured fluorescence emission in a band from 410 to 600 nm. Therefore, it can be assumed that the three LIF instruments measure and classify bioaerosols somewhat differently. The instruments also operate at different flow rates. The WIBS and the UV-APS sample air at 0.3 and 1 L min−1, respectively, and the BioTrak at 28 L min−1.
Ambient air was drawn through a PM10 inlet designed for an airflow of 38.3 L min−1 (compared with an airflow of 28 L min−1 in the BioTrak), which made the cutoff diameter increase from 10 µm to ∼ 12 µm. The BioTrak instrument was placed inside the Hyltemossa research station with a vertical ∼ 4 m-long sampling tube to the inlet located about 5 m above ground level. The NFBAP and NTAP were sampled with a frequency of 5 min. Note that, in the following, we use “supermicron” to refer to particle sizes 1–12 µm.
The BioTrak flow rate was regularly checked with an external flow meter (TSI 4000 Series thermal mass flow meter) and was within 3 % of the given flow rate. Sampling was interrupted 1–2 h each month when data were downloaded, and the instrument was checked and cleaned. A total of 7 d of data are missing in December 2021 (1 December until 8 December) due to overloaded memory of the instrument.
2.3 Meteorological data
Instruments measuring air temperature, relative humidity, wind speed, and wind direction are operated continuously by ICOS Sweden at the Hyltemossa research station at 30, 70, and 150 m above ground. For the comparisons with the data on biological aerosol concentrations, we used the measurements at both 30 and 70 m, which gave very similar results: the air temperature was on average 1.8 ∘C higher at 30 m compared to at 70 m height. The relative humidity was on average 4 % higher at 30 m compared to at 70 m. In the following, we used the 70 m meteorological data for comparisons with particle data. Meteorological measurements were hourly mean values. Precipitation was measured cumulatively every 30 min. Reported accuracies for the meteorological measurements made at the site were as follows: air temperature ±0.1 ∘C; RH ±0.8 %; wind speed ±2 %; wind direction ±5∘; precipitation ±1 %.
2.4 Data processing and statistical analysis
Measurement periods were averaged into seasons as defined meteorologically by the Swedish Meteorological and Hydrological Institute (SMHI): fall begins after 5 consecutive days with daily mean temperature below 10.0 ∘C, and 1 August is the earliest allowed date for fall to start. Winter begins after 5 consecutive days with daily mean temperatures at 0.0 ∘C or below. Spring begins after 7 consecutive days with daily mean temperatures above 0.0 ∘C, with the earliest allowed date on 15 February. Summer begins after 5 consecutive days with daily mean temperatures above 10.0 ∘C. In 2020, 2021, and 2022, the seasons were as follows: fall (8 October 2020–12 January 2021), winter (13 January–16 February 2021), spring (17 February–7 May 2021), summer (8 May–5 October 2021), fall (6 October–25 November 2021), winter (26 November 2021–15 February 2022), spring (started 15 February 2022) (https://www.smhi.se/, last access: 20 December 2022). It should be noted that there are other ways to define the seasons. It can be argued that sunlight and/or day length would be more appropriate for studying bioaerosol drivers, since sunlight is very important for vegetation phenology, which could be a main driver of bioaerosol emissions. Differences between monthly and seasonal concentrations were assessed with Kruskal–Wallis tests and post hoc Mann–Whitney tests with Bonferroni corrections since NFBAP distributions were skewed. In the following, medians were used to represent data if not otherwise stated.
To study the relationship between NFBAP and meteorological parameters, NFBAP data were binned based on meteorological parameters. For air temperature, 21 bins were constructed between −10 and 31 ∘C. For relative humidity, 10 bins were constructed between 0 % and 100 %. For wind speed, 13 bins were constructed between 0 and 13 m s−1. Bins that contained less than 0.1 % of the total particle counts within the given season were removed to ensure that only statistically significant observations were included in the detailed analysis. Spearman's rank coefficient (ρ) and Pearson's linear regression coefficient (r) with associated P values were used to assess the degree of association and linearity between NFBAP-binned data and meteorological parameters. Rolling Pearson correlation coefficients with associated P values were calculated to assess the linear relationship between NFBAP throughout the full campaign period. Weekly rolling correlations were calculated for hourly mean values of meteorological parameters and NFBAP.
Statistical distributions of NFBAP, NTAP, and were presented as box–whisker plots showing the arithmetic mean, the median, the 25th and 75th percentiles, and the 5th and 95th percentiles. Daily cycles in NFBAP, , and meteorological parameters were explored by averaging the data for each hour of the day. NFBAP abundance differences between days and nights were assessed by distinguishing NFBAP based on local sunrise and sunset times. Particle mass concentrations were calculated for each size channel by multiplication by the aerodynamically equivalent sphere with the geometric midpoint diameter assuming a density of 1 g cm−3 and a shape factor of 1 for NFBAP, NTAP, and .
Rain events were identified on an hourly basis as all consecutive hours with precipitation equal to or higher than 0.5 mm h−1. For each rain event, NFBAP was assessed right before, during, and right after the rain event. The lengths of the period before and after rainfall were defined as being the same length as the rain duration. The longest rain event recorded lasted 21 h.
3.1 General trends
3.1.1 Monthly and seasonal trends in fluorescent biological aerosol particles
The NFBAP exhibited clear seasonal patterns, with the overall highest NFBAP concentrations in the summer and the lowest ones in the winter, respectively (P<0.0001). The NFBAP data covered approximately two full fall seasons, two winter seasons, approximately one-and-a-half spring seasons, and one full summer season (see Table 2). Figure 1 shows NFBAP at a 5 min sampling resolution (green) and 7 d median (magenta). Seasons according to the SMHI are delimited by vertical lines.
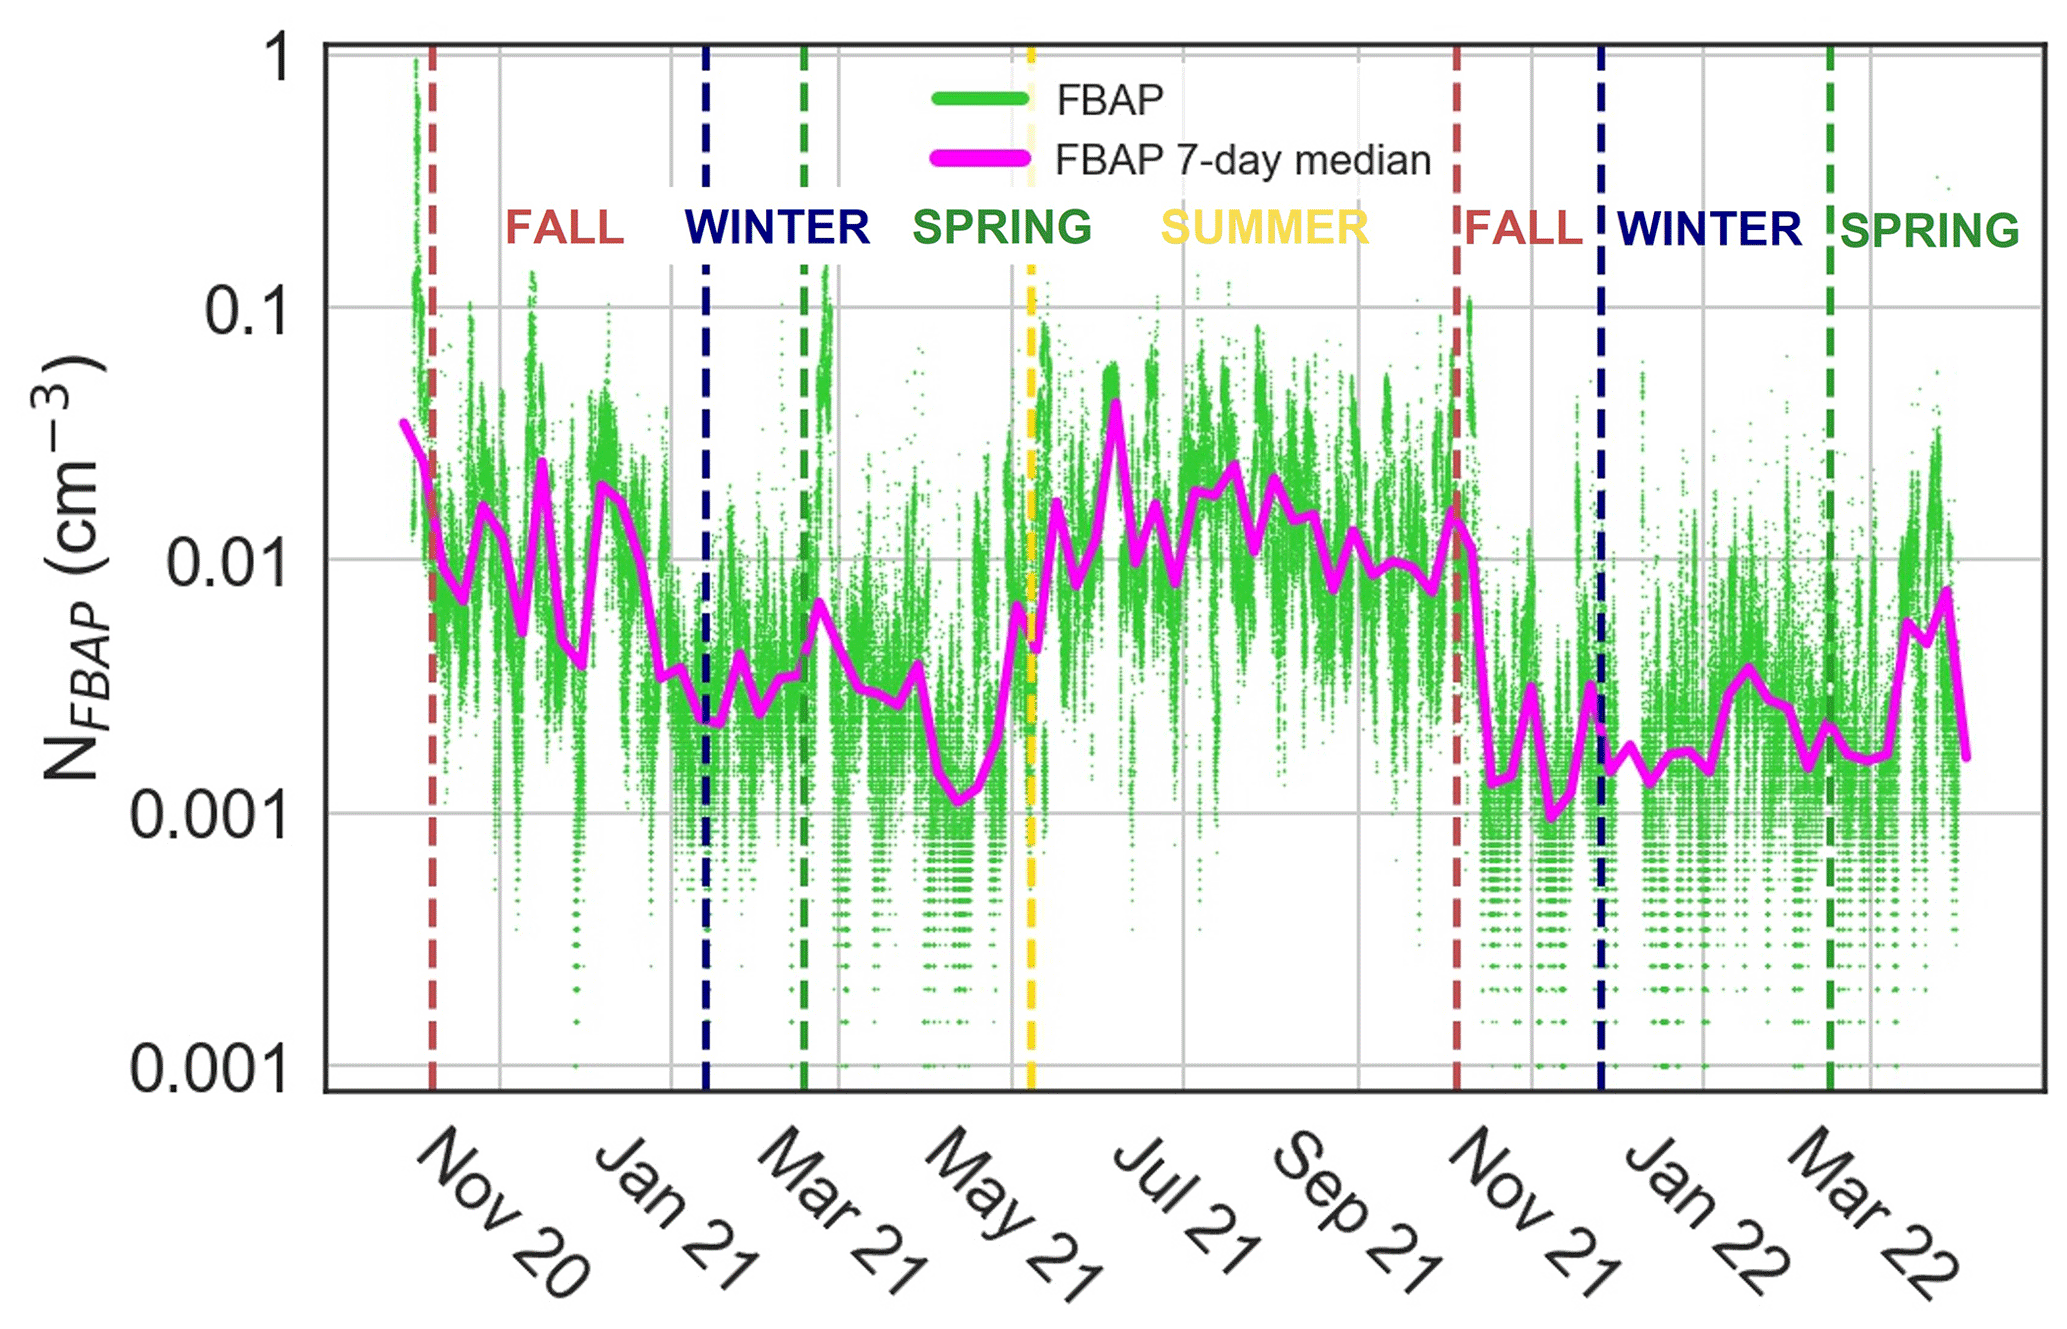
Figure 1Overview of fluorescent biological aerosol particle number concentration (NFBAP) between 6 October 2020 and 1 April 2022. Green dots represent individual NFBAP 5 min data averages, and the magenta curve shows running 7 d median values. Vertical dashed lines indicate the first day of each season as identified by the Swedish Meteorological and Hydrological Institute. NFBAP abundance is seen to increase steeply at the intersection of spring and summer (∼ 8 May 2021) and decrease steeply in the beginning of fall (∼ 6 October 2021). The highest NFBAP concentrations were measured in the summer, and the lowest concentrations were measured in the winter periods.
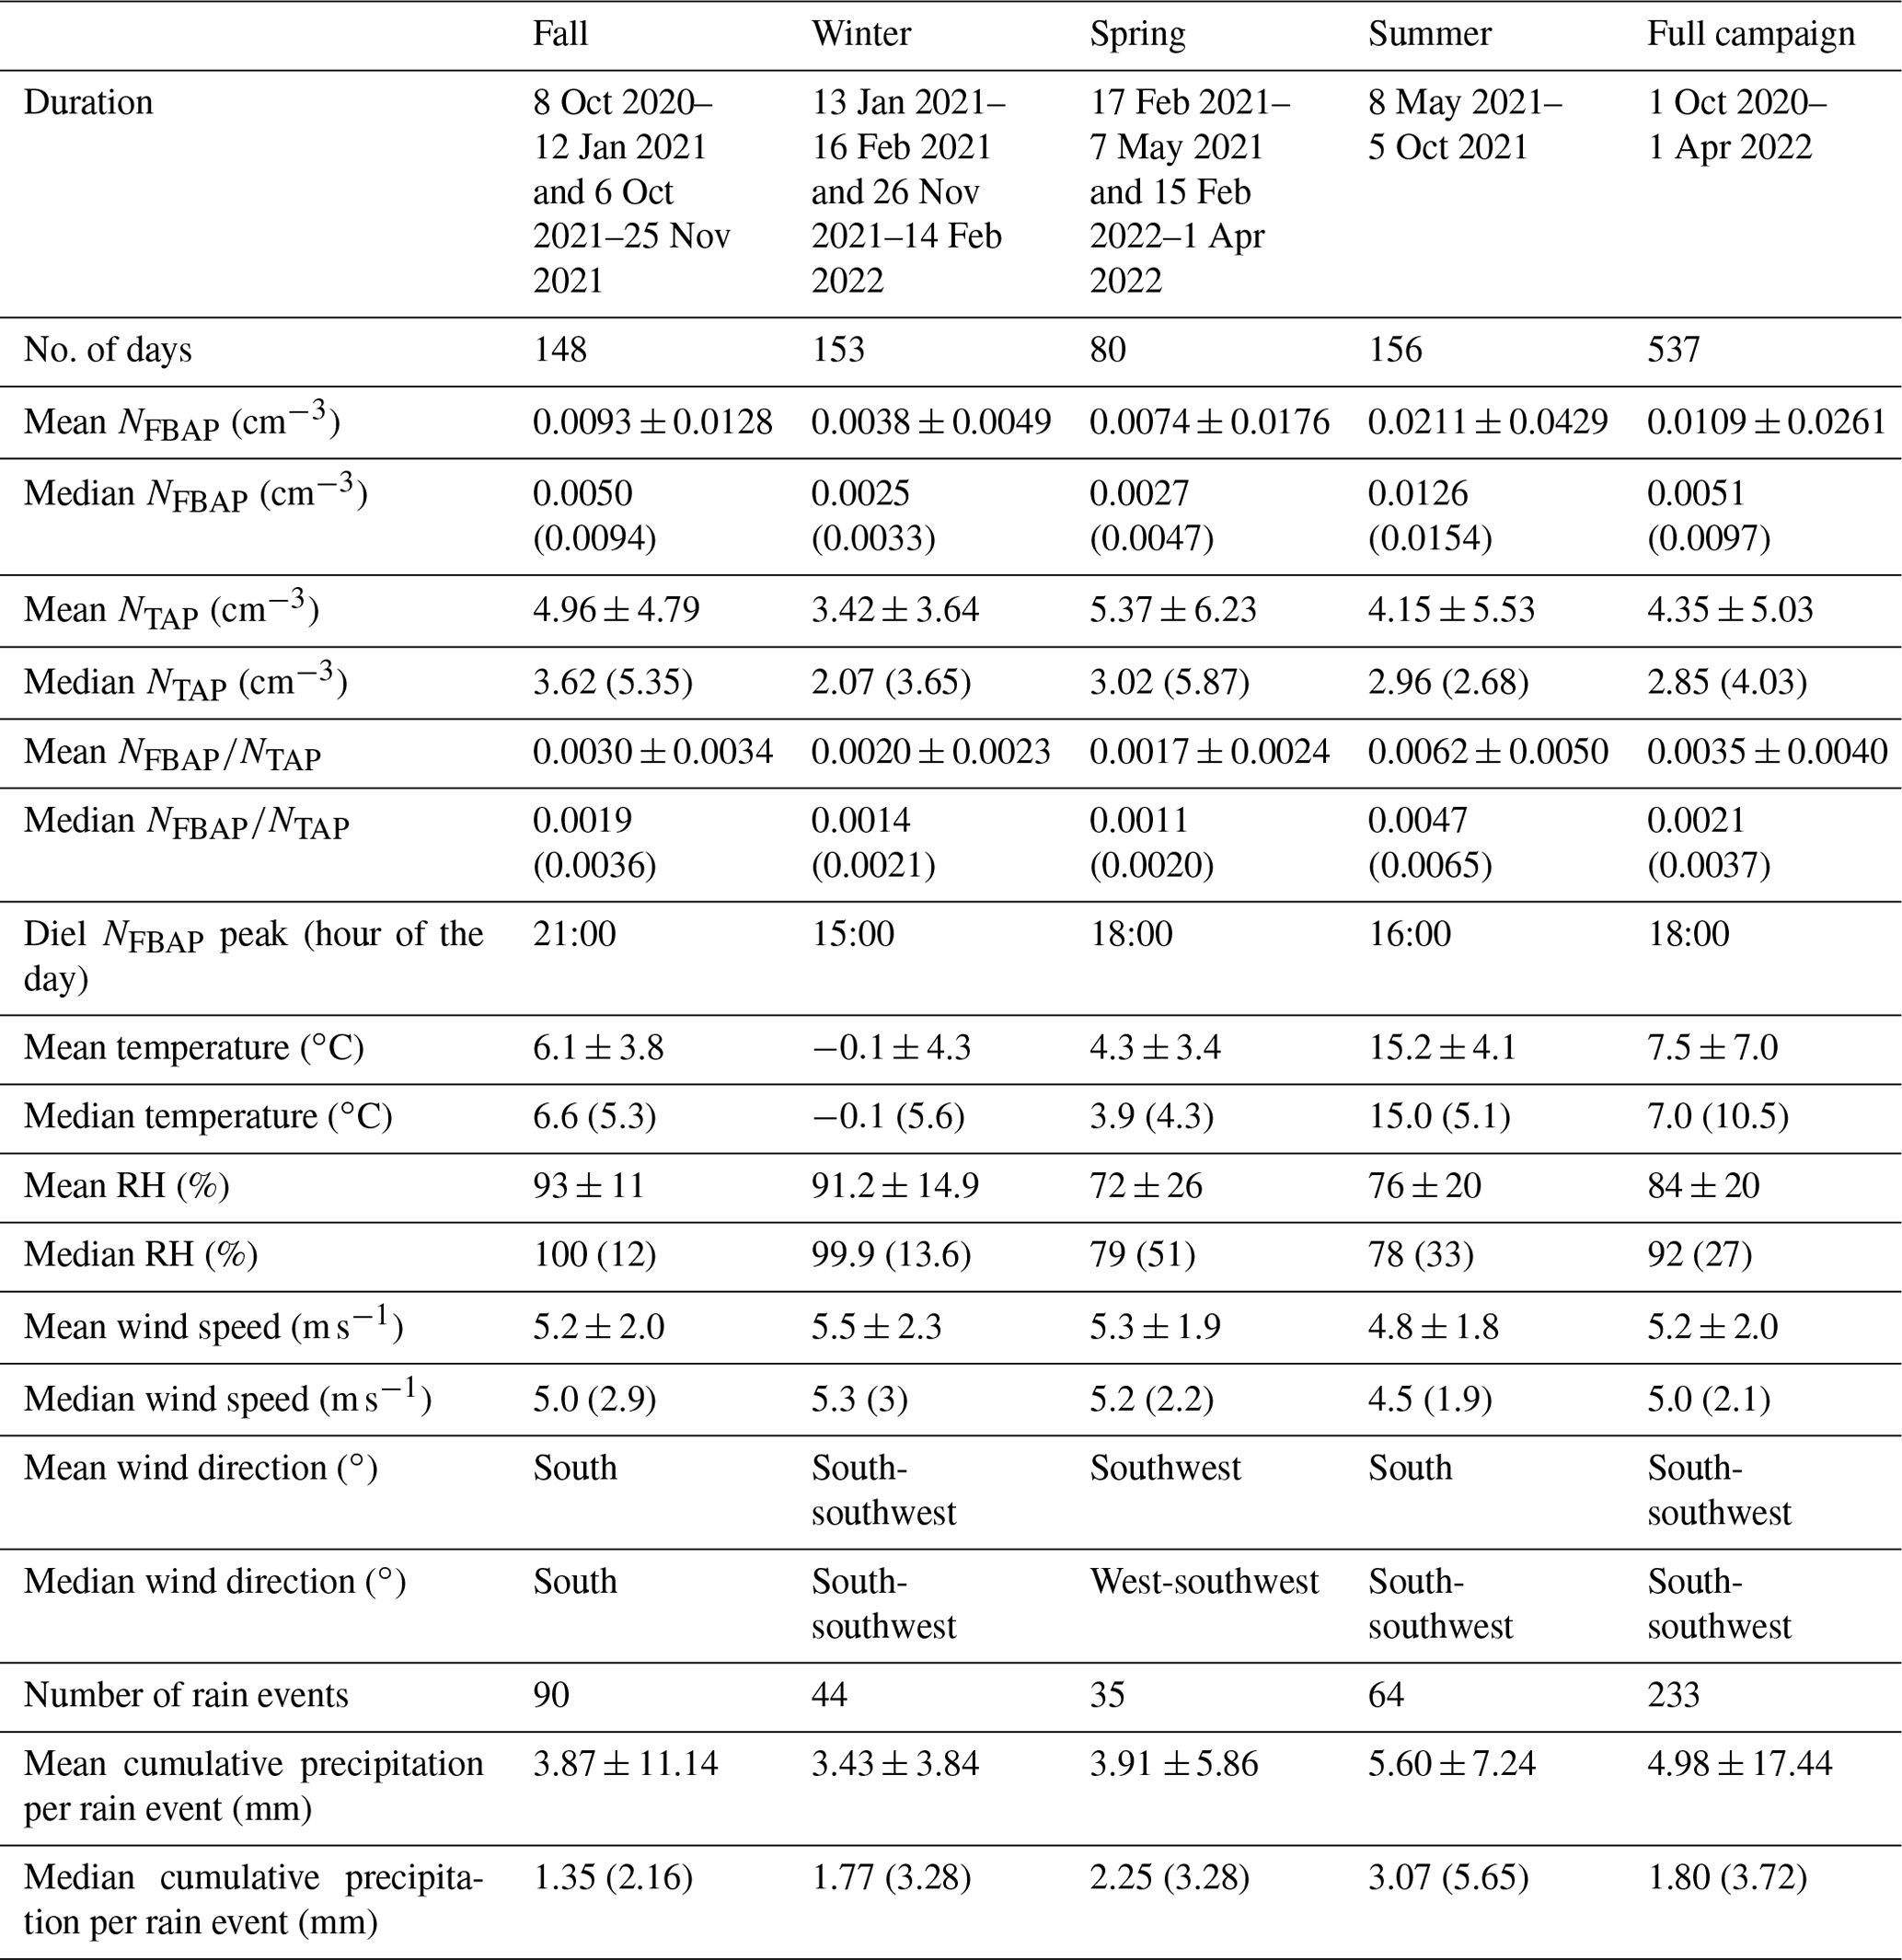
Table 2Seasonal and full-campaign comparisons between fluorescent biological aerosol particle number concentration (NFBAP), total supermicron aerosol particle number concentration (NTAP), and biological aerosol particle ratio (). Particle concentrations are shown as arithmetic means and medians with the associated standard deviations ±SD and inter-quartile range (IQR) in parentheses for median values over entire seasons and for the full campaign. Average temperatures, relative humidity, wind speeds, and precipitation are also listed with the diel NFBAP peak hour of the day per season.
The median monthly NFBAP concentration over the full campaign was 0.005 cm−3 but varied significantly (P<0.0001) over the full campaign. Monthly and seasonal distributions of NFBAP, NTAP, and are shown in Figs. 2 and 3 (Fig. S2 in the Supplement shows the full time series with seasons indicated). The monthly median varied by a factor of ∼ 13, from a minimum of 0.0015 cm−3 in December 2021 to a maximum of 0.019 cm−3 in July 2021. The period with the highest NFBAP abundance was initiated by a steep increase in May, where NFBAP increased by a factor of ∼ 8 over a few weeks. The period with high NFBAP ended with a steep decrease over a few weeks between November and December 2021, when the concentration decreased by a factor of ∼ 8. A similar decrease by a factor of ∼ 4 was observed in winter 2020. NFBAP varied a lot over the summer months but was more stable during fall and winter, when the concentrations were lower. The overall NFBAP agreed with other long-term measurements conducted in Finland, the USA, Germany, France, India, and China (Huffman et al., 2010; Schumacher et al., 2013; Toprak and Schnaiter, 2013; Valsan et al., 2016; Yu et al., 2016). The NFBAP concentrations in winters were, as expected, lower compared to the other seasons. Cold temperatures, lowered biological activity, low absolute humidity, and snow coverages are suggested to cause a lower generated amount of bioaerosols in winter but also reduce bioaerosols' abilities to be lofted into the air (Schumacher et al., 2013; Toprak and Schnaiter, 2013; Saari et al., 2015; Huffman et al., 2010). At the beginning of fall, spores from fungi are dispersed in the air, which increases the fall NFBAP (Schumacher et al., 2013; Toprak and Schnaiter, 2013). This also explains the pattern observed here, where an increase in bioaerosols in fall is plausibly due to a combination of pollen dispersed from the late summer in combination with fungi and spores in late summer and early fall (September–October primarily).
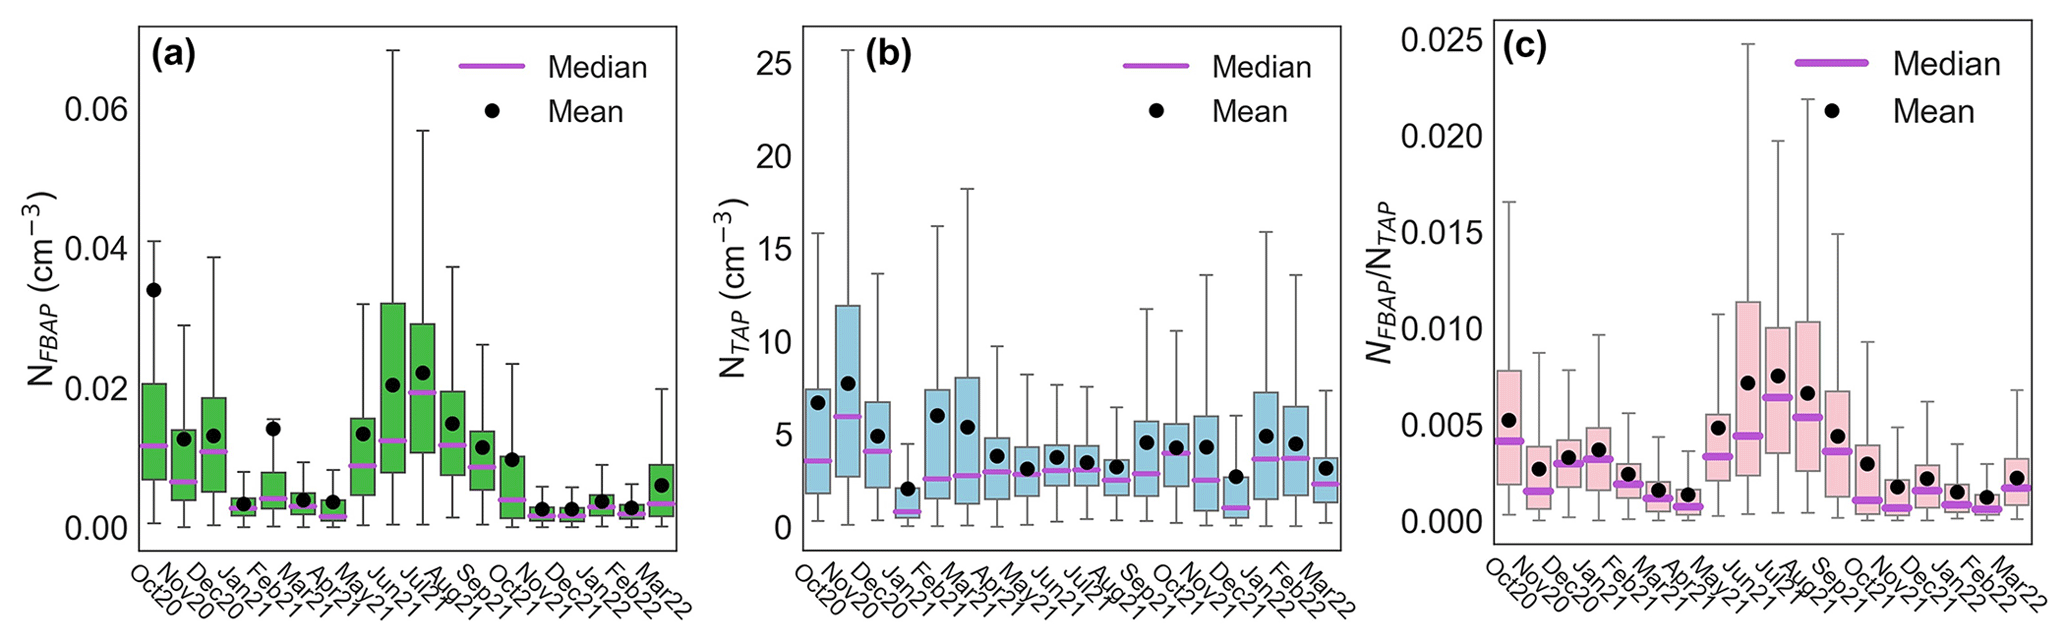
Figure 2Statistical distribution of monthly fluorescent biological aerosol particle number concentration (a), total supermicron aerosol particle number concentration (b), and their ratio (c) as box–whisker plots. The lower and upper limits of each box represent the 25th and 75th percentiles, respectively. Vertical bars at the end of the lower and upper vertical bars represent the 5th and 95th percentiles, respectively. Outliers were removed from the plots to make them easier to read.
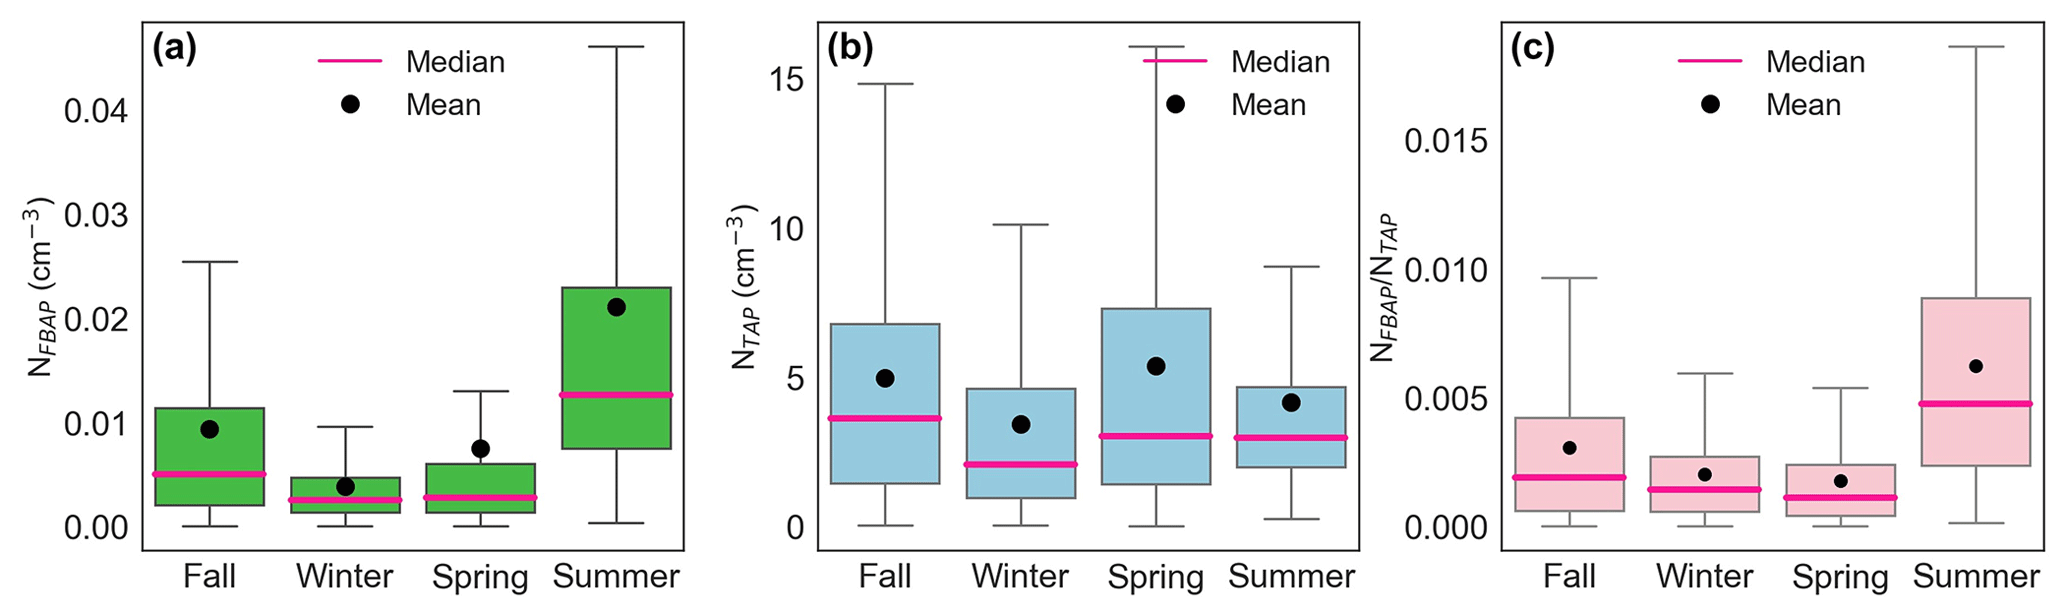
Figure 3Seasonal statistical distribution of fluorescent biological aerosol particle number concentration (a), total supermicron aerosol particle number concentration (b), and their ratio (c) as box–whisker plots. The lower and upper limits of the box represent the 25th and 75th percentiles, respectively. Vertical bars at the ends of the lower and upper vertical bars represent the 5th and 95th percentiles, respectively. Outliers were removed from the plots to make them easier to read.
Not all biological material will have a sufficiently strong fluorescence signal to be detected as FBAPs. This is because the fluorescence signal is a function of the concentration of fluorophores in PBAPs, the ability to be excited by the laser of the instrument, and the presence of opaque or absorbing material that may fluoresce only very weakly. Moreover, the detection threshold of ∼ 1 µm biases the reported FBAPs low. Therefore, fluorescence measurements, such as the ones made here, have the risk of underestimating the total biological material present, and the NFBAP measurements should be viewed as lower limits of PBAPs. This was also suggested by Huffman et al. (2012, 2010) when using a UV-APS for FBAP measurements. Also, further investigations are needed to better understand the response of BioTrak to different types of biogenic aerosol particles and to quantity potential interferences with non-biogenic particles.
The BioTrak instrument remains to be further characterized through comparisons with other bioaerosol monitoring instruments using well-characterized fluorescent particles and by comparison to other offline techniques. Atmospheric NFBAP depends a lot on local sources. Moreover, NFBAP discrepancies between different studies (see Table 1) can also be explained by differences between different types of instruments. To understand how the bioaerosol data collected here compare to other long-term studies would require thorough intercomparisons between the different types of instruments that have been employed in different studies. The UV-APS measures autofluorescence between 420 and 575 nm after excitation with a 355 nm laser at a flow rate of 1 L min−1, while the WIBS measures autofluorescence between 310–400 and 400–600 nm upon excitation with 280 and 370 nm xenon lamps at a flow rate of 0.3 L min−1. The BioScout excites particles with a 405 nm laser and measures autofluorescence at >442 nm with an adjustable flow rate and a default value of 2 L min−1. The BioScout has been suggested to detect ambient bioaerosols more efficiently than the UV-APS (Saari et al., 2014). BioTrak was developed for the purpose of detecting bioaerosols in pharmaceutical production and clean environments; thus, it operates at a higher flow rate, 28 L min−1, than other LIF instruments. To further understand the potential of using the BioTrak in future studies, the BioTrak needs to be compared to other new technologies for automatic bioaerosol monitoring. Recently a potential standardized validation method for assessment of counting efficiency and fluorescent measurement of bioaerosol instruments that could be used for validation of the BioTrak instrument was presented (Lieberherr et al., 2021). Validations could also be performed with calibration techniques for optical particle counters (Iida et al., 2014). To fully understand how the BioTrak data compare to other bioaerosol measurement techniques, BioTrak measurements need to be benchmarked against offline filter analyses.
3.1.2 Monthly and seasonal trends in total supermicron aerosol particles
Total aerosol particle number concentration did not exhibit the same patterns as the NFBAP concentrations. The NTAP concentrations are shown on monthly and seasonal scales in Figs. 2b and 3b (Fig. S1 in the Supplement shows the full NTAP time series with the seasons indicated). Compared to the NFBAP concentrations, the TAP concentrations were more homogeneous over the full campaign. No distinct peak of NTAP during warmer periods was observed. The average highest NTAP was measured in October and November 2020 and in February and March 2021. The lowest NTAP was observed in January 2021 and in December 2022. The NTAP varied more in fall and winter compared to summer, as indicated by the 5th and 95th percentiles in Fig. 3b. No significant difference in NTAP was observed over the seasons. The ratio had its highest values in June, July, August, and September. The average highest relative contribution of FBAPs (0.006) was observed in July.
The seasonal-average NTAP was between 3.42 and 4.96 cm−3, which is higher than in most other similar studies where both NFBAP and NTAP have been measured. For instance, Schumacher et al. (2013) reported an average NTAP between 0.41 and 0.47 cm−3 in Finland and between 0.20 and 0.73 cm−3 in the USA measured with a UV-APS. Valsan et al. (2016) reported a mean NTAP between 0.96 and 2.66 cm−3 on a monthly scale in India measured with a UV-APS, and Toprak et al. (2012, 2013) reported a mean NTAP between 0.47 and 0.69 cm−3 in Germany measured with a WIBS-4. Comparisons suggest that our NTAP measurements were about ∼ 2–10 times higher than the NTAP previously reported in combination with NFBAP measurements. Note that these differences also influence the difference in ratios between NFBAP and NTAP. One factor that could possibly help explain these differences is that the BioTrak instrument operates at a higher sample flow (28 L min−1) compared to other LIF instruments, which commonly have sample flows ranging from 0.3 to 2 L min−1. However, a comparison made between the BioTrak and a Grimm OPC showed that the BioTrak was closely correlated with the TAP concentrations measured with the Grimm OPC (see Figs. S7 and S8 in the Supplement). Therefore, the major difference between the TAP measured in this campaign and previous long-term bioaerosol and TAP measurements is presumably due to local sources of the particle concentrations. It should also be noted that we only counted particles with diameters between 1 and 12 µm, which means that results from studies where other particle diameter ranges were studied might not be adequately comparable. To understand these differences in more detail, further analysis of local and regional sources is needed. Since the measurement site is an integrated ACTRIS and ICOS station, there are other aerosol measurements available. However, these measurements are only of fine particles (≤1 µm) and therefore are not eligible for comparison with the NTAP and NFBAP measurements. There are plans to also install micron-sized aerosol measurements at the site. In the future we will continuously compare BioTrak measurements to these.
3.1.3 Diel patterns
Variations in the daily bioaerosol concentrations were studied by averaging the hourly NFBAP abundance for each season (see Figs. S3 and S4 in the Supplement). Daytime NFBAP was not significantly different from NFBAP measured during the night, and the daily variations were numerically very small. On an hourly basis, daily NFBAP and peaked in the afternoon or evening, when relative humidity was relatively low and the temperature high in winter, spring, and summer. In fall, NFBAP peaked later in the evening.
Overall, the daily relative humidity curve was smooth and repeated the same pattern in all the seasons: relative humidity was low in daytime and increasing at night due to the decrease in temperature. In summer, the minimum relative humidity was aligned with the NFBAP peak. In fall and spring, however, the NFBAP peak was preceded by the minimum relative humidity. The wind speed maximum was on average aligned with the daily temperature peak, and average wind directions were on average coming from the south in the morning and more from the southwest later during the day, the evening, and the night.
3.1.4 Sizes of fluorescent biological aerosol particles
Over the full campaign, the smallest particles, 1–3 µm, on average made up ∼ 70 % of the total NFBAP. As a comparison, particles with sizes 3–5 and 5–12 µm contributed ∼ 25 % and ∼ 5 %, respectively. The contributions from larger particles, 3–12 µm, were higher in spring and summer compared to fall and winter. The constantly elevated NFBAP in the 1–3 µm range was consistent with previous observations (Artaxo and Hansson, 1995; Huffman et al., 2010; Schumacher et al., 2013; Healy et al., 2014; Valsan et al., 2016). The seasonal difference also agreed with previously reported results (Schumacher et al., 2013; Huffman et al., 2010). Figure 4 displays the NFBAP particle size distribution for all seasons divided into the three differently sized bins.
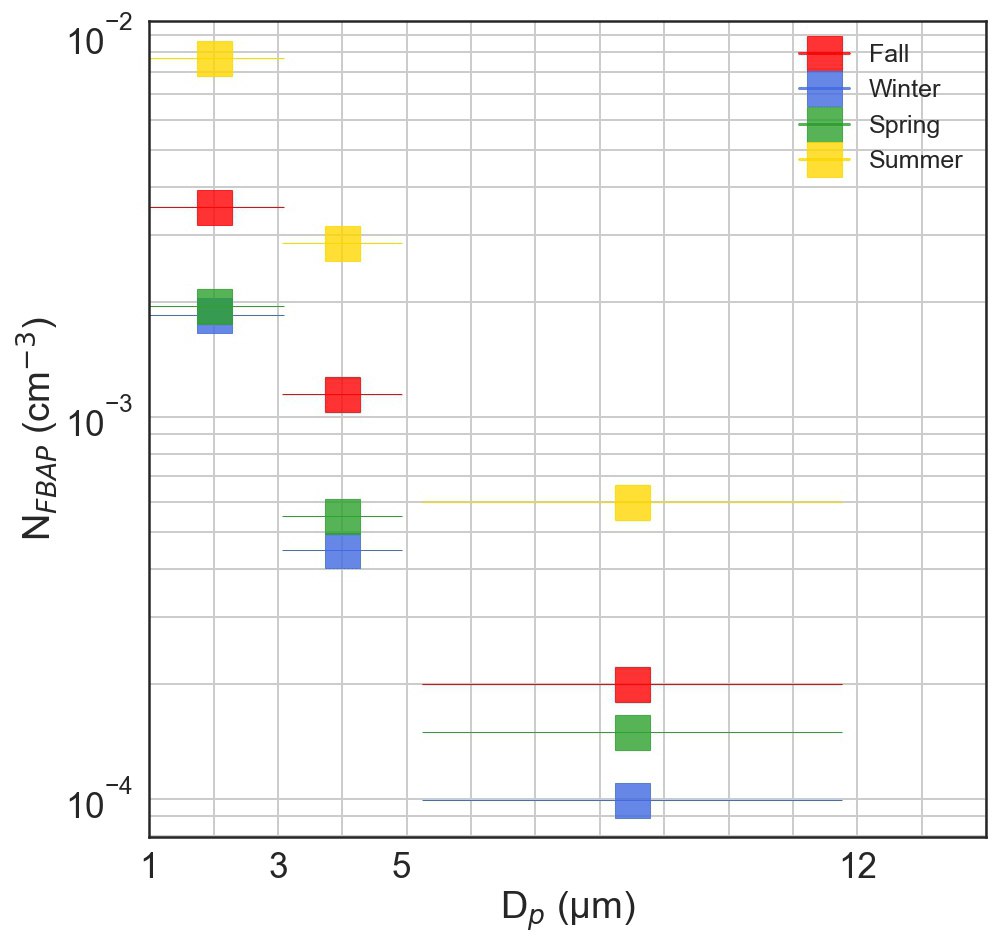
Figure 4Fluorescence biological aerosol particle (FBAP) number size distribution for the full campaign for three differently sized bins: 1–3, 3–5, and 5–12 µm.
While LIF measurements do not distinguish between different bioaerosol types, particle size can give some indication of the kind of particle. Single bacterial and fungal cells and fungal spores typically have sizes of 1–3 µm. Particles with sizes 3–5 and 5–12 µm correspond to the sizes of larger fungal spores and smaller-sized pollen grains, although most pollen is too large to be sampled by the instrumentation used. The higher contribution of larger particles during spring and summer can potentially be explained by the spread of pollen during these seasons. Further confirmation and identification of the origin and the sizes of the bioaerosols measured at Hyltemossa will be performed in follow-up studies with microscopic analysis but are beyond the scope of this work.
3.2 Meteorological effects
The meteorological conditions can have a variety of effects on the release and generation of biological aerosol particles into the atmosphere. In the following section, we investigate possible associations between NFBAP and air temperature, relative humidity, wind (magnitude and direction), and precipitation. It should be noted that we only consider the local and rapid changes in the parameters measured, while, for instance, atmospheric circulation has not been considered. Delays between changes in parameters and for instance changes in particle concentrations have also not been considered.
3.2.1 Air temperature effects
The air temperatures ranged from −2 to 20 ∘C in fall, from −10 to 10 ∘C in winter, from −2 to 18 ∘C in spring, and from 6 to 30 ∘C in summer. Figure 5 shows the observed relationship between NFBAP and temperature: median NFBAP binned based on air temperature separately for each season (Fig. 5a) and the 7 d Pearson rolling correlation coefficient r for NFBAP with air temperature for the full campaign (Fig. 5b). From the air-temperature-binned data, NFBAP was significantly positively correlated with increasing ambient air temperature in spring (r=0.88, P<0.01; ρ=0.83, P<0.01) and summer (r=0.88, P<0.0001; ρ=0.94, P<0.0001). No significant associations between NFBAP and air temperature were identified in fall and winter. The 7 d rolling correlation coefficient r, based on hourly mean values shown in Fig. 5b, indicates that for most of the campaign (60 % of the rolling correlation periods studied) NFBAP increases were significantly (P<0.05) correlated with increasing air temperatures. It should be noted that the correlation coefficient for the most part indicated only a moderate correlation (r between 0.25 and 0.5), and the correlation was rarely strong (r above 0.7). Negative correlations between NFBAP and air temperature were rarely observed (only in 13 % of the periods studied) but consistently only observed during winter months. The rolling correlation was nonsignificant during a considerable part of the campaign (27 %). The presence of positive, negative, and nonsignificant correlations between NFBAP and temperature in fall and winter can explain why no overall consistent relationship between air temperature and NFBAP was observed. The data presented in Fig. 5 suggest that the processes that determine the release of FBAPs are strongly dependent on season and on mechanisms that potentially require a minimum temperature or that are at least correlated with increasing air temperatures.
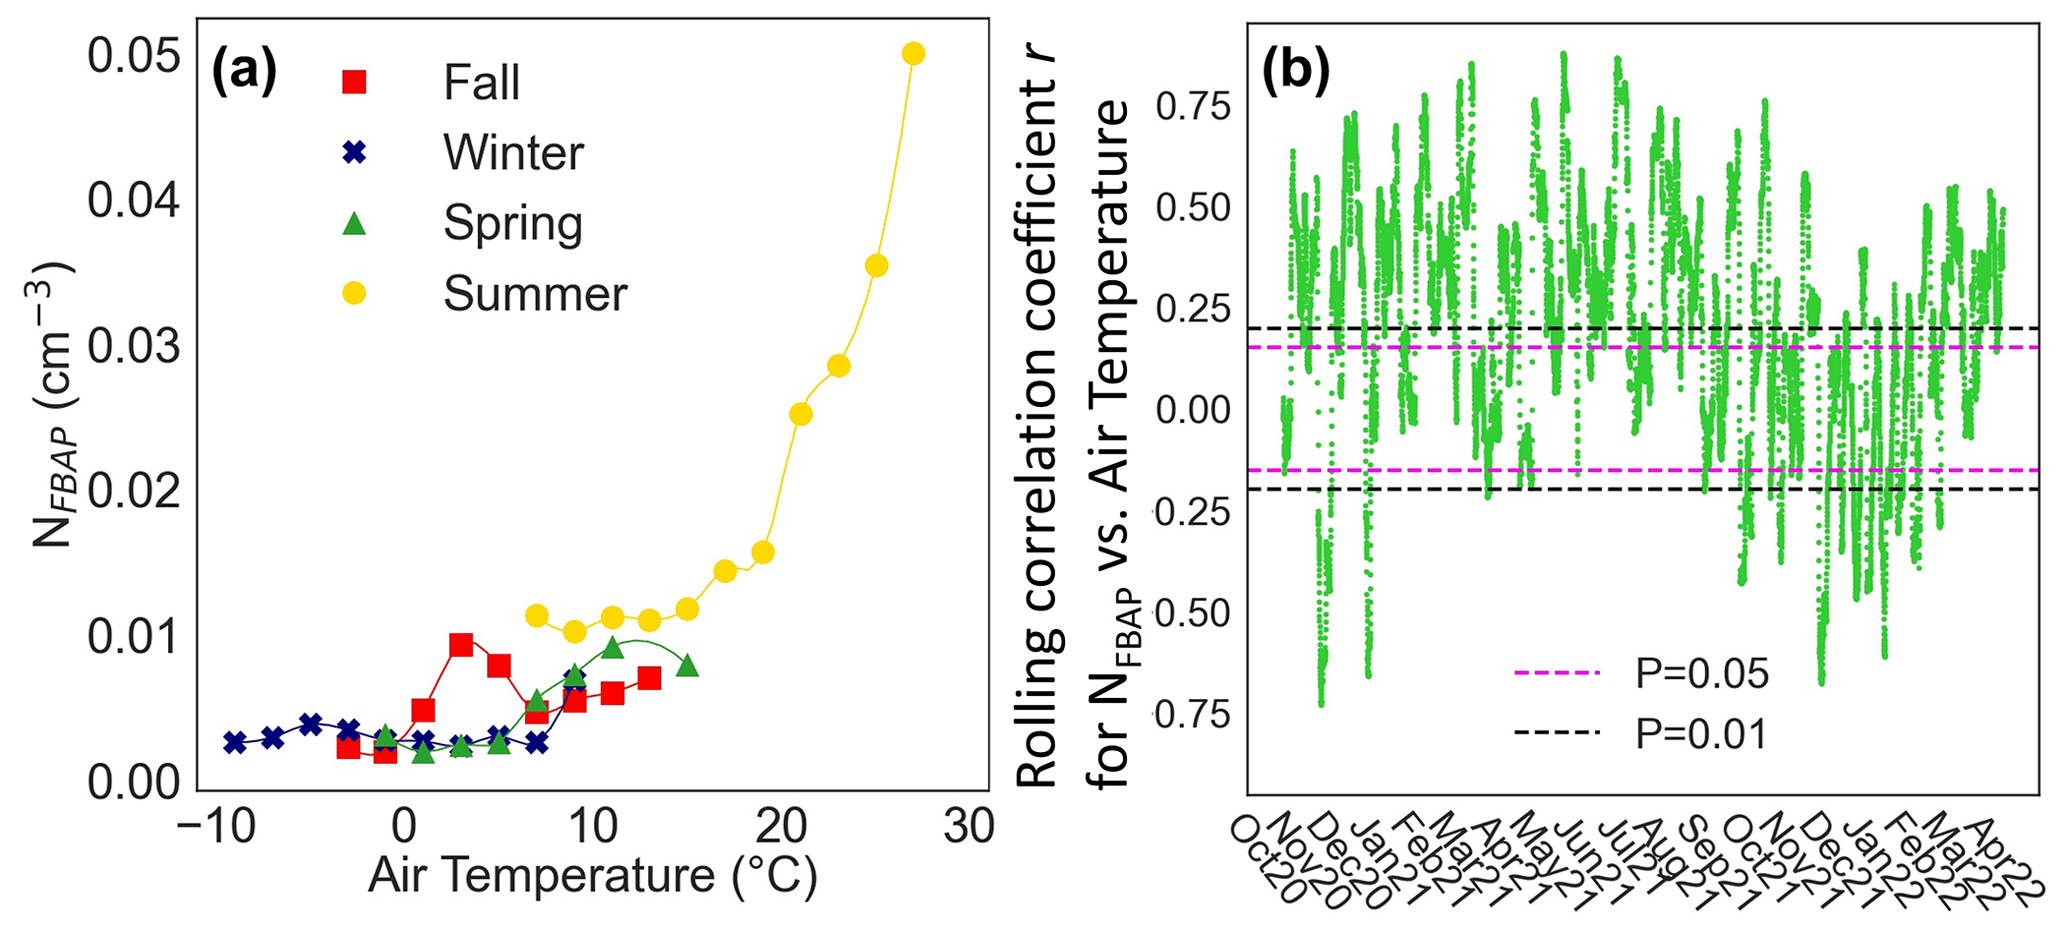
Figure 5Relationship between NFBAP and air temperature. Median seasonal relationship between NFBAP and air temperature (a). Data were averaged into 21 bins between −10 and 31 ∘C. Bins that contained less than 0.1 % of the total data points were removed. Fitted curves are included to guide the eye. Both NFBAP and air temperature variations were highest in the summer, as is also suggested in Figs. 2 and 3: the 7 d rolling correlation coefficient r for hourly mean NFBAP with air temperature for the full campaign. Horizontal dashed lines indicate the range at which the correlation was nonsignificant at levels 0.05 (magenta) and 0.01 (black). In most cases a significant and positive correlation was observed between NFBAP and air temperature.
3.2.2 Relative humidity effects
The observed relationship between NFBAP and relative humidity was complex and calls for more detailed studies. Figure 6 displays the average relationship between NFBAP and relative humidity, with NFBAP binned based on relative humidity (6a) and the 7 d rolling correlation coefficient for NFBAP and relative humidity (6b). On a seasonal level, NFBAP was positively correlated with relative humidity (r=0.21, P<0.05; ρ=0.26, P<0.05) in fall but negatively correlated with relative humidity in summer (, P<0.05; , P<0.0001) and in winter (, P<0.05; ; P<0.05), while no correlation was found between relative humidity and NFBAP in spring. The observed positive correlation between NFBAP and relative humidity in fall may indicate that the bioaerosols detected in fall were potentially generated or ejected due to relative humidity-dependent mechanisms. On the other hand, the negative correlation between NFBAP and relative humidity in winter and summer suggests that the high relative air humidity may be a limiting factor in the release of bioaerosols during those seasons. In particular, the high NFBAP at relative humidity ∼ 20 %–40 % suggests that relatively dry conditions increase the concentrations of bioaerosols generated in the summer. The aerosol particles were not dried prior to BioTrak sampling, which in high outdoor temperature and humidity could lead to particle growth and hence particles being classified as larger than their actual size.
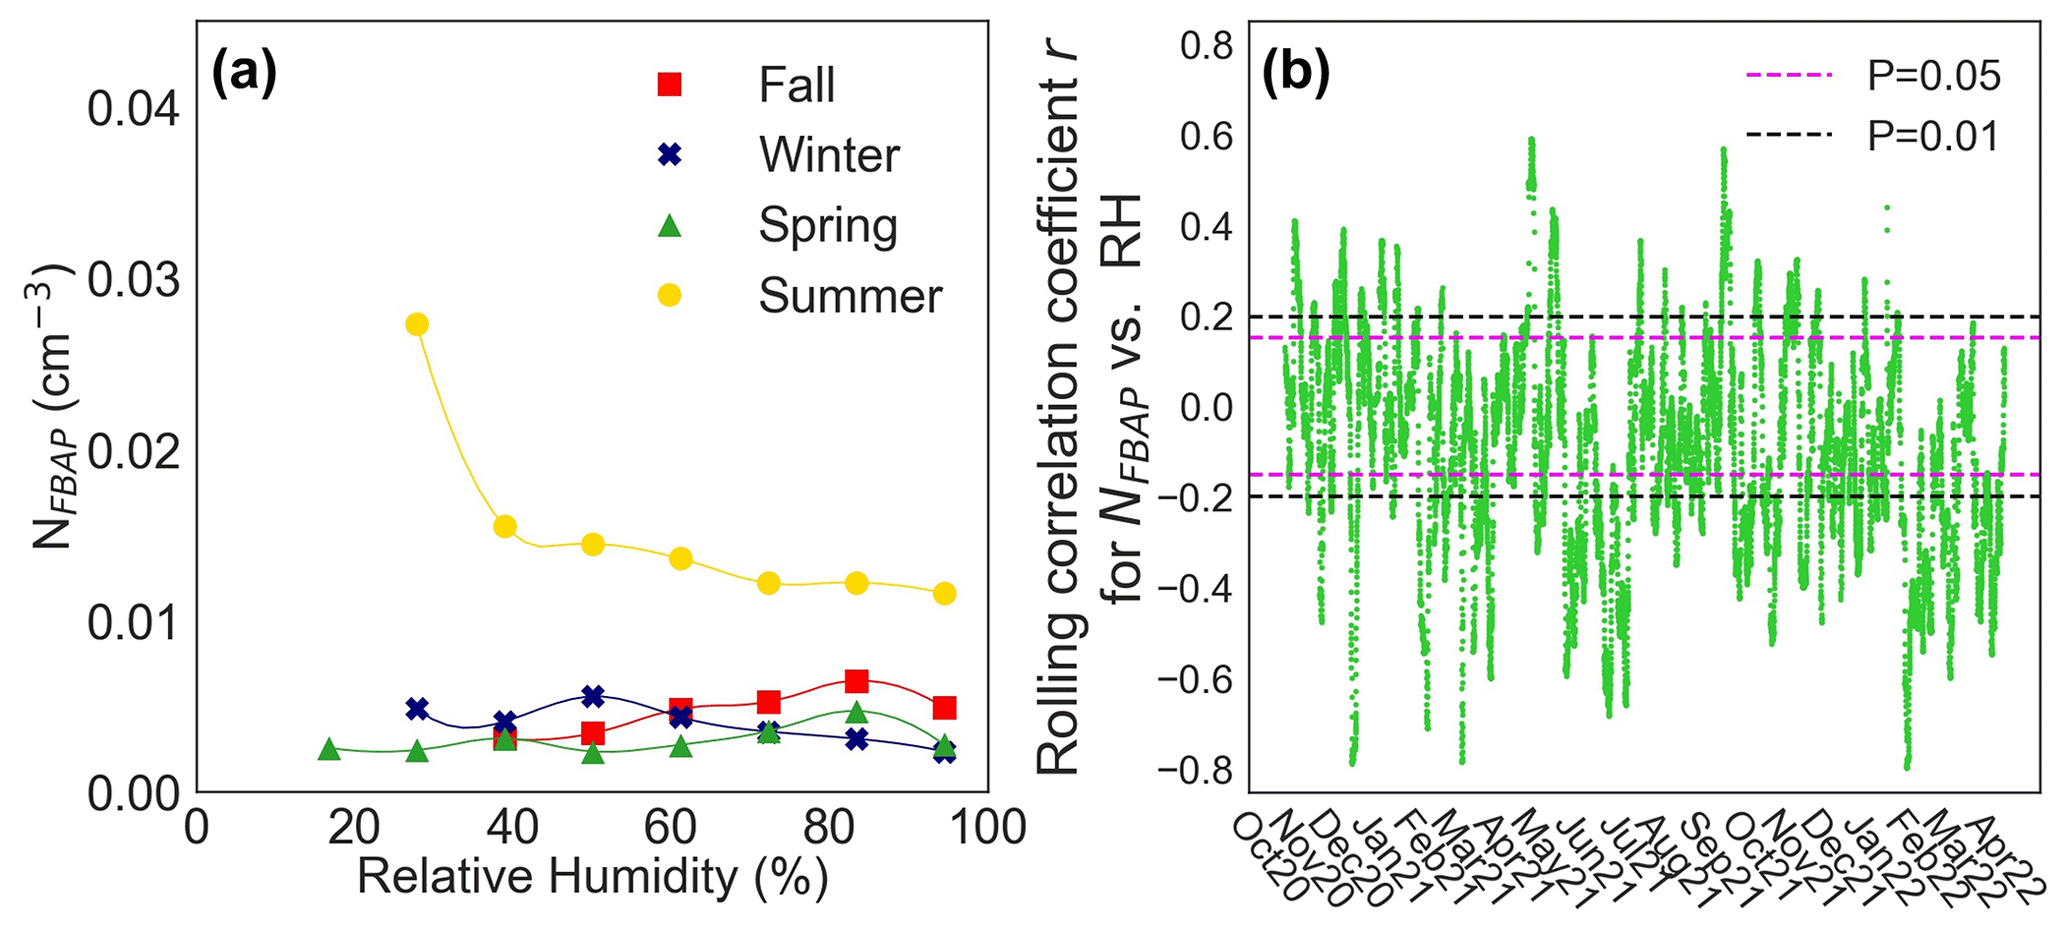
Figure 6Seasonal association between NFBAP concentrations and relative humidity. Median NFBAP concentration as a function of relative humidity for each season (a) and the 7 d rolling correlation coefficient r for hourly mean NFBAP and relative humidity (RH) for the full campaign (b). Horizontal dashed lines indicate the range at which the correlation was nonsignificant at levels 0.05 (magenta) and 0.01 (black). In most cases (46 %) the relationship observed was nonsignificant with very low correlation coefficients.
From the 7 d rolling correlation coefficient r between NFBAP and relative humidity for the full campaign, one can see that the correlation between NFBAP and relative humidity was mostly nonsignificant (46 %), while it was negative and significant for a large part of the campaign (39 %) and only rarely positive (14 %). The observed relationship that NFBAP and relative humidity are uncorrelated or negatively correlated is in contrast to what other studies report. In other long-term studies, the connection between NFBAP and relative humidity has been reported as overall positive (Huffman et al., 2010, 2012; Schumacher et al., 2013; Toprak and Schnaiter, 2013; Valsan et al., 2016), although in some of the cases only low correlation coefficients (but not reported how low) were identified (Huffman et al., 2010), in other cases correlation coefficients and significance levels were not reported (Huffman et al., 2012), and the NFBAP and RH relationship was inconsistent (Schumacher et al., 2013).
Relative humidity correlates inversely with air temperature since the temperature affects the saturation water vapor pressure in air. This relationship was also observed for the relative humidity and air temperatures measured (, P<0.0001; , P<0.0001), and the relationship can be observed in the daily trends in Fig. S3. Based on the positive relationship NFBAP had been observed to have with increasing air temperatures, it might be plausible to think that part of the negative correlation observed between relative humidity and NFBAP could be related to the relationship between relative humidity and air temperature. However, the relationships are complex, and the causality between the different effects can only be interpreted after more detailed studies. The data reported here underline the need for further studies of the relationship between relative humidity and NFBAP under different conditions and in different types of environments, especially since different types of bioaerosols have been observed to be both positively and negatively correlated with relative humidity.
3.2.3 Wind effects
The NFBAP was positively correlated with increasing wind speed. Figure 7 displays the average relationship between NFBAP and wind speed for the four seasons (a) and for most of the campaign as assessed with the 7 d rolling correlation between NFBAP and wind speed (b). The NFBAP was positively significantly correlated with wind speed in the winter (r=0.89, P<0.0001; ρ=0.95, P<0.0001), spring (r=0.70, P<0.05), and summer (r=0.64, P=0.05; ρ=0.76, P<0.05). In fall a similar but nonsignificant correlation was observed (r=0.58, P=0.08; ρ=0.46, P=0.18). These correlations were also confirmed by the rolling correlation coefficient. Figure 7b shows that for a large part of the campaign time the relationship between NFBAP and wind speed was nonsignificant (42 %) or positive (39 %), and only rarely was there a negative and significant relationship (15 %).
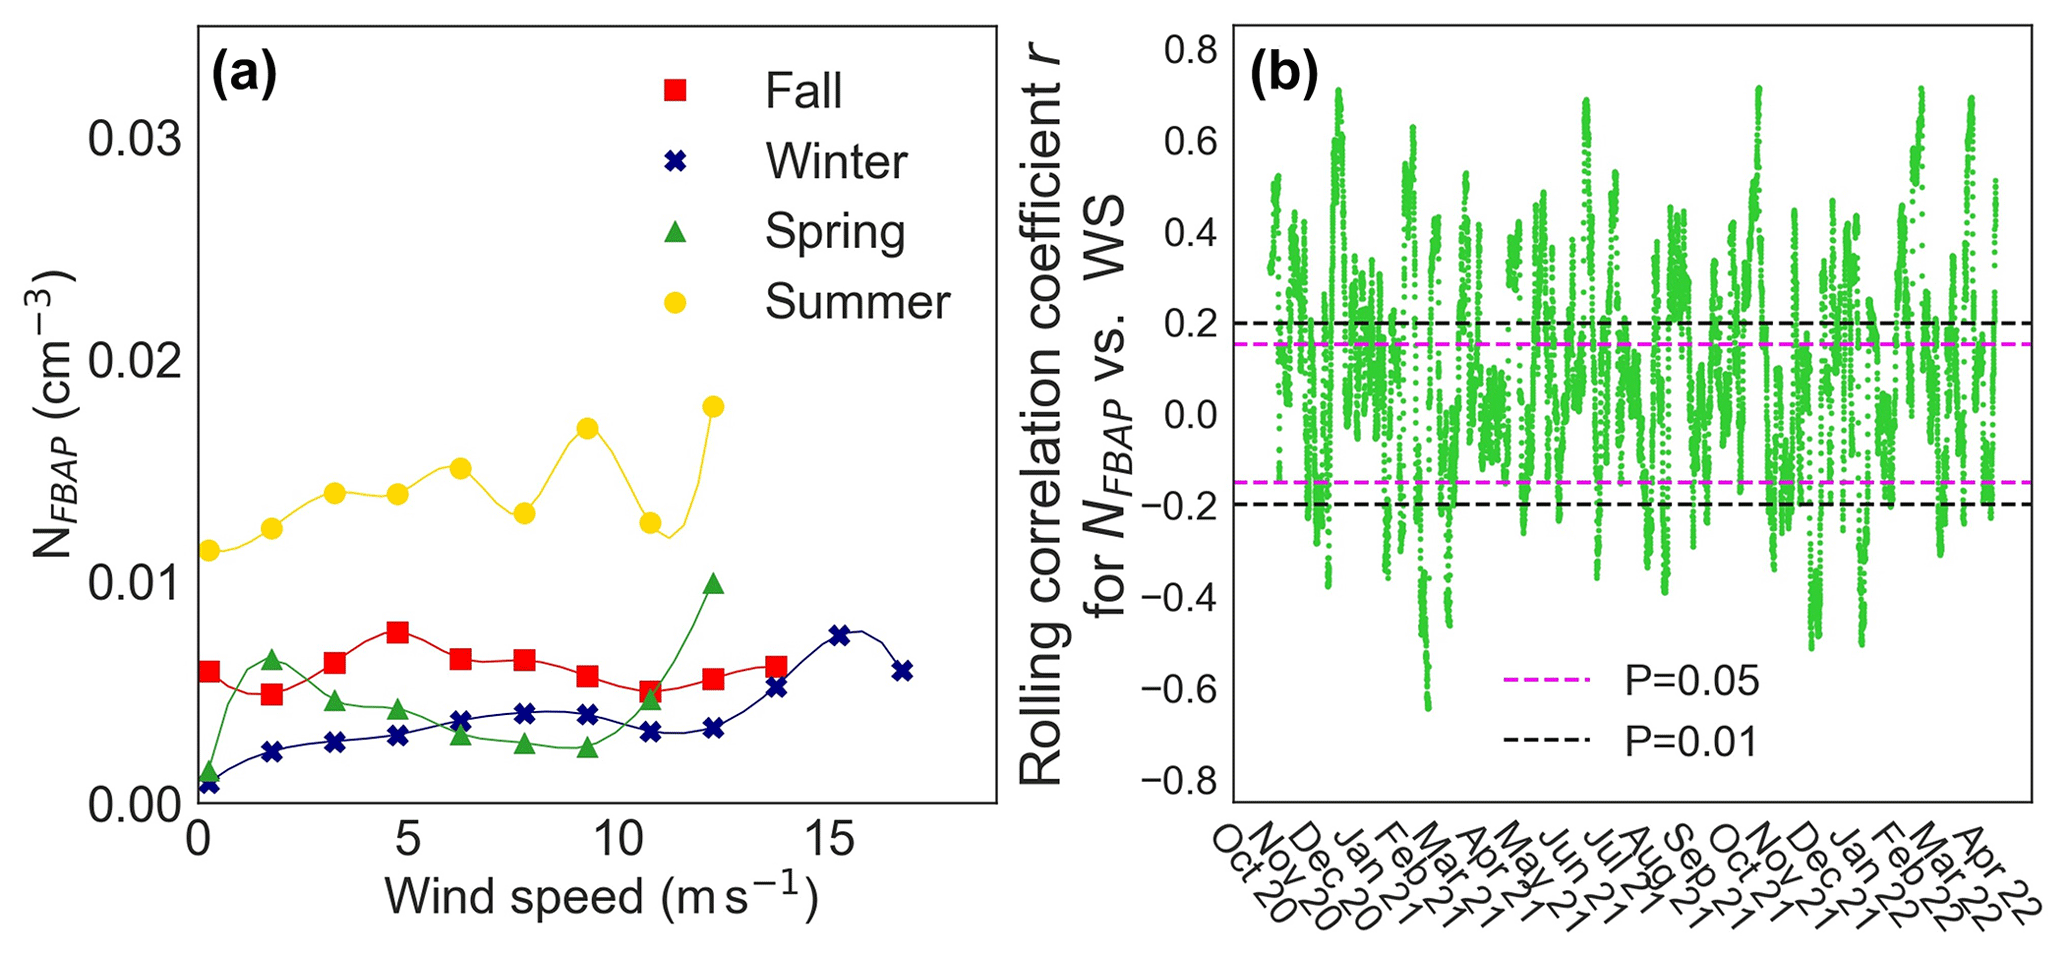
Figure 7The relationship between FBAP number concentrations and wind speed on a seasonal basis (a) and the rolling correlation for the relationship over the full campaign (b). An overall positive relationship was observed between NFBAP and wind speed for all seasons, which can be observed in both figures, but in many cases the relationship was nonsignificant.
Figure 8 shows NFBAP as a function of wind direction. For all seasons, the winds coming from northeast to southeast were correlated with the highest NFBAP abundances. Meanwhile, winds from southwest to northeast were in general associated with the lowest NFBAP. It was also noted in the data that in fall and winter the coldest air temperatures were correlated with winds from the north, while air temperatures in the spring and summer were more independent of wind directions. While NFBAP was not significantly different depending on wind direction, the types of bioaerosols may still vary with wind directions. Studies on long-range transport of air masses were beyond the scope of this study but could have been indicative of a better understanding of these data.
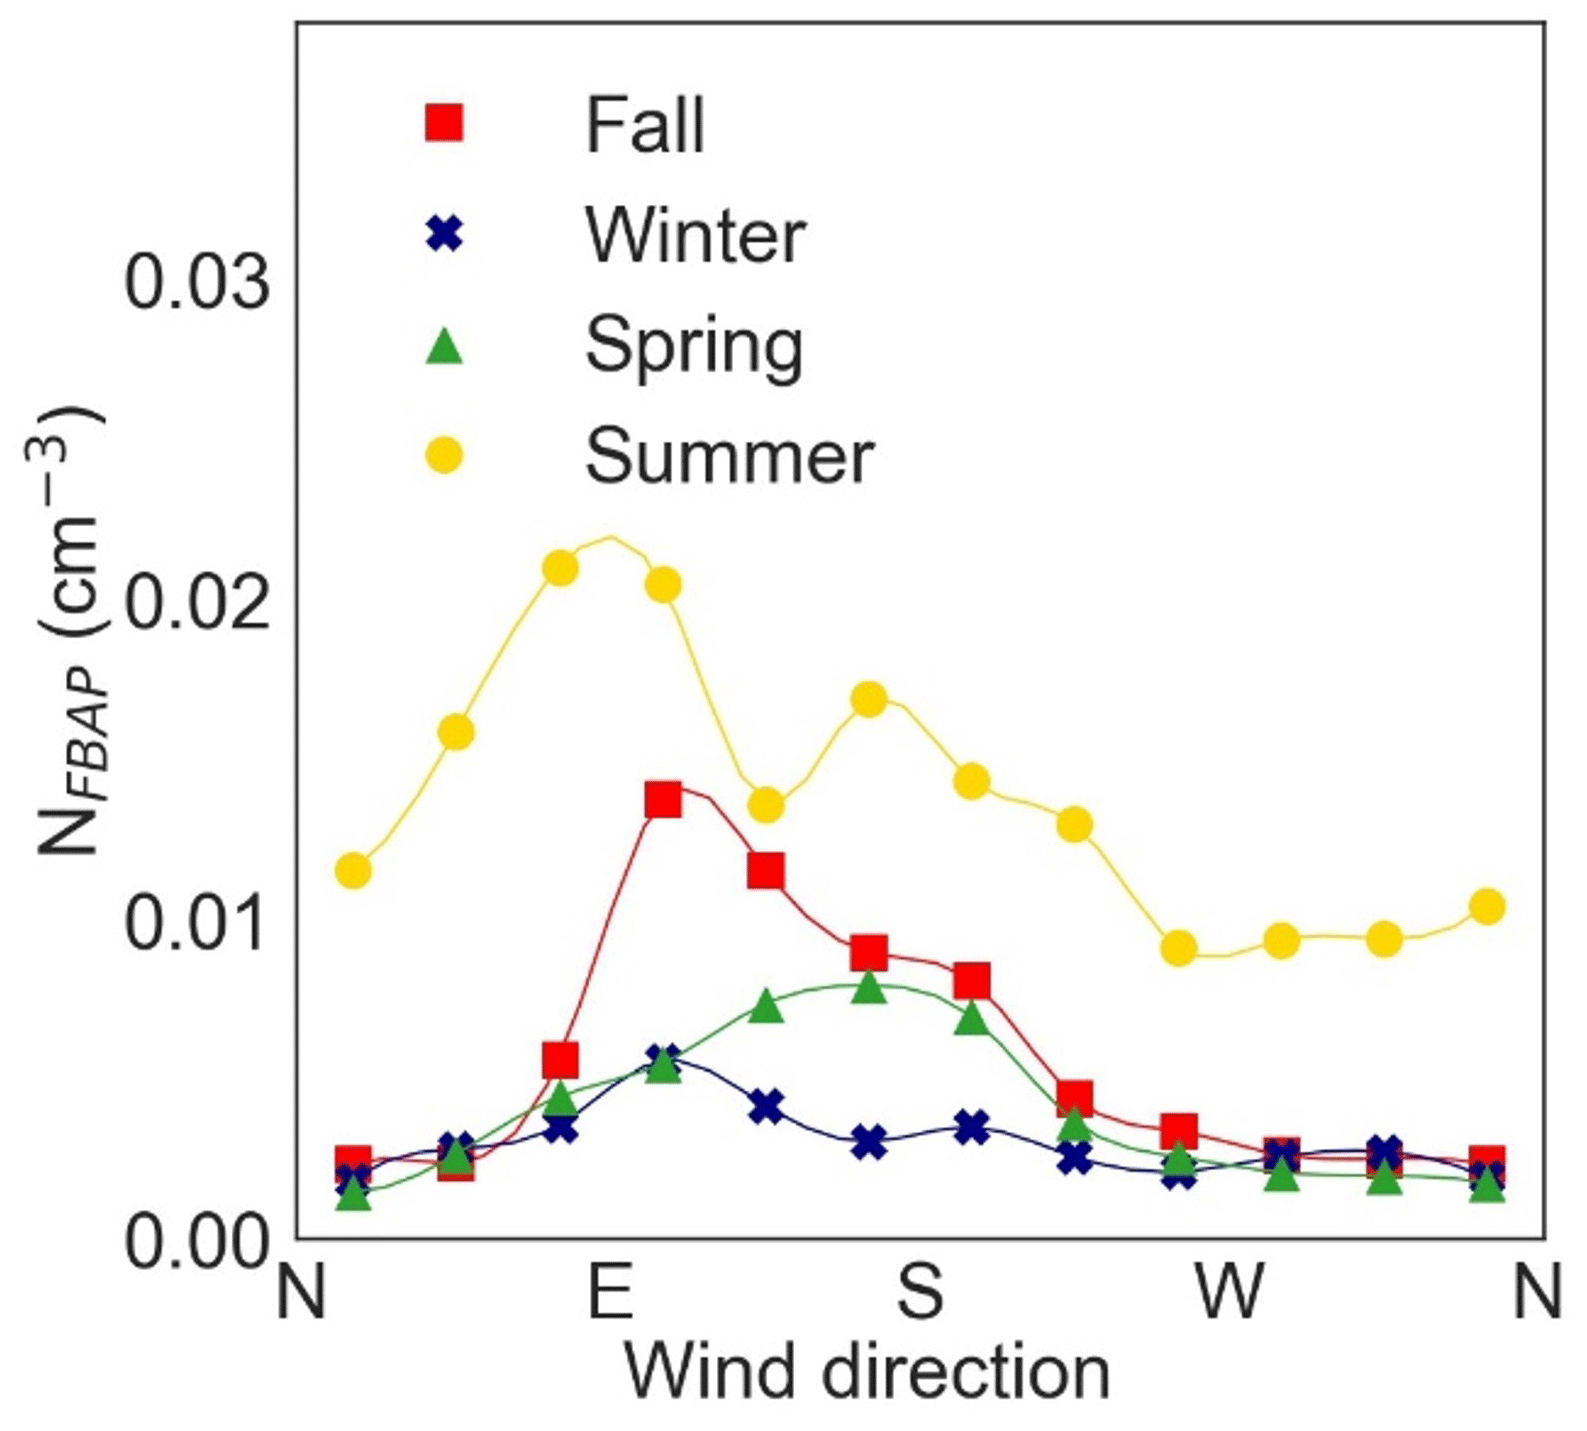
Figure 8The effect of wind direction on NFBAP abundance on a seasonal basis. The highest NFBAP concentrations were measured for winds from the east. The lowest NFBAP were measured when the wind blew from north to west.
3.2.4 Precipitation effects
In some cases of rain, but not consistently for all rain events, a substantial increase in FBAP number concentrations was observed before, during, and right after rain. To test the robustness of the analysis, a rain event was defined by the threshold of 0.5 mm h−1. Although we also applied other thresholds (including 1 and 2 mm h−1), none of the thresholds that were used indicated a significant correlation between precipitation and NFBAP. For certain rain events, the FBAP concentration was observed to increase by a factor of 4–10 when compared to NFBAP outside of the rain event. The pattern was seen for all the seasons. A total number of 90, 44, 35, and 64 individual rain events were identified in fall, winter, spring, and summer, respectively. In about 50 % of all cases of a rain event, an immediate but not lasting increase in NFBAP concentrations was observed, but the effect was not statistically significant. The NFBAP concentrations varied a lot both before and after rain events, and sharp increases in NFBAP were also observed unrelated to rain. Overall, the FBAP concentration variations were large, and therefore sudden and instantaneous variations, which could plausibly be explained by rainfall, were not significant over full seasons. Figures S5 and S6 in the Supplement show examples of rain events and the distribution of NFBAP before, during, and after rain and when there is no rain. In these figures high-precipitation peaks were followed by, or occurred simultaneously with, peaks in NFBAP.
Only local rain was accounted for, and, therefore, the effect of rain upwind and possible transport of FBAPs to the measurement site was not detangled. On average, a rain event lasted a few hours, but during certain periods, the frequency of such rain events was high. The overall number of rain events and the increased relative humidity associated with such events could very well have a larger and longer-ranging effect than distinguished here. The relationships between biological aerosol particles and rain have been reported on for a long time (Gregory and Hirst, 1957; Hirst and Stedman, 1963) and call for standardized methods for the association between PBAPs and precipitation. Rainfall can be important for both scavenging of bioaerosols and the bioaerosol release.
3.2.5 Connecting fluorescent biological aerosol-particle-release mechanisms with meteorological effects
Connecting the observed results in this study with mechanisms for aerosolization and release of biological particles allows a greater understanding of seasonal variations in NFBAP. In summer, there was a positive correlation with air temperature and wind speed, while the relationship was mostly nonsignificant or negative with relative humidity. This suggests that wind-induced bioaerosol generation was favored under dry and warm conditions. This was likely the case during spring as well, when NFBAP correlated positively with air temperature and wind speed.
During fall, the highest number of rain events was observed as well as a small positive correlation between NFBAP and relative humidity. Bioaerosols can be generated and dispersed by mechanical ejections and bubble-bursting processes when raindrops impact surfaces (Alsved et al., 2019; Kim et al., 2019), which could explain the, in some cases strong, association between NFBAP and rain events. However, rainfalls are also known to clean the air from aerosol particles in the lower troposphere (Moore et al., 2020), which can explain the inconsistent association between NFBAP and rain events. Although many studies have found a generally negative correlation between airborne spore concentrations and relative humidity, some fungal species absorb water from the air, causing swelling of the mucilage and subsequent explosive release of spores (Grinn-Gofron and Bosiacka, 2015). High relative humidity is also known to cause pollen to rupture, resulting in the release of smaller pollen fragments (Taylor et al., 2004). It is also noteworthy that different types of bioaerosols can have different relationships with humidity and air temperature, so that the common effects are masked. As noted by Oliviera et al. (2009), while some spore types have been observed to be negatively correlated with temperature but positively correlated with relative humidity, other spores showed the opposite correlations (Oliveira et al., 2009).
The lowest levels and variations of NFBAP were found during winter (Fig. 3a), likely due to the lower temperatures, sunlight, and biological activity during this season. Again, low relative humidity and wind speed were correlated with higher NFBAP, indicating wind-induced aerosolization. In southern Sweden, cold temperatures are often correlated with northern winds, which was observed for fall and winter in the meteorological data studied here. This agrees well with the lowest NFBAP levels found when winds came from the north. It should also be noted that the difference in wind direction could be indicative of different sources of bioaerosols.
For further understanding of the data, FBAP release mechanisms, and FBAP sources, detailed biological analyses, including fluorescence microscopy of PBAP filter sampling, are needed to identify the different types of bioaerosols that are present during different seasons.
3.3 Using the BioTrak for ambient air measurements
This is the first study where the BioTrak has been used for ambient air measurements. Prior to the field campaign, the BioTrak was sent for calibration with Brookhaven Instruments in Sweden. After the campaign, the built-in OPC in the BioTrak was validated with a Grimm dust decoder OPC D-11. The Grimm OPC was connected to the same inlet as the BioTrak at the Hyltemossa station for 25 h in December 2022 (Fig. S7 in the Supplement). The comparison showed that the BioTrak and the Grimm OPC continuously measured the same trends in particle concentrations during the 25 h. Figure S8 in the Supplement shows the Grimm OPC TAP number concentration as a function of TAP measured with the BioTrak. This comparison also confirmed that the BioTrak and the Grimm OPC measurements were linearly correlated. The BioTrak showed on average 15 % higher values, with a standard deviation of 10 % over 5 min. The bioaerosol identification was not validated in this work other than by calibration by the manufacturer. Previous accuracy tests and validations by the manufacturer showed that the BioTrak underestimates the bioaerosol concentration but correctly classifies biological material with an efficiency ranging between 40 % and 70 %, depending on the size of the particles and on the type of bioaerosols (TSI, BioTrak Summary of validation tests, 2015).
Fluorescent bioaerosols, in the size range 1–12 µm, were measured continuously in real time during 18 months in southern Sweden using the BioTrak. To our knowledge, this is the first report of this instrument being operated for outdoor measurements and for such a long period of time. Large variations in both fluorescent biological aerosol particle concentrations and supermicron particle number concentrations were observed. Over the full measurement period, the average NFBAP concentration was 0.005 cm−3, and the monthly average varied between 0.001 and 0.020 cm−3. The NFBAP concentration was highest in the summer (median 0.01 cm−3) and lowest in the winter (median 0.0025 cm−3). The pattern in the NFBAP concentrations deviated significantly from the TAP concentrations, as can be seen in Figs. 2 and 3. While TAP concentrations had no obvious seasonal dependence, NFBAP concentrations varied significantly depending on the season.
Total aerosol particle concentrations did not follow the same trends as the NFBAP concentrations. Instead, NTAP remained relatively constant throughout the year. These data indicate that the sources of fluorescent bioaerosols were not the same as for the non-fluorescent particles. It can also be assumed that local meteorology affected the sources in different ways. No differences were found between daytime and nighttime NFBAP concentrations, and overall daily variations were minimal compared to variations over seasons. The 1–3 µm NFBAP particles made up on average 70 % of the total NFBAP abundance, which suggests that the largest number contribution to PBAPs was the occurrence of single bacterial and fungal cells, fungal spores, and agglomerated bacteria.
Overall, these long-term measurements confirm that the emission and abundance of biological aerosol particles in rural environments were closely related to meteorological parameters. Over the full campaign, NFBAP was positively correlated with air temperature (P<0.01) and wind speed (P<0.01), while the relationship was more complex and more negatively correlated between NFBAP and relative humidity (P<0.05). No significant relationship was observed between rain events and NFBAP over the seasons; however, several rain events gave rise to immediate and strong increases in NFBAP over short time periods. Our measurements indicate that bioaerosols were emitted due to mechanical wind release during the warmer seasons but also suggest that bioaerosol generation increased under wet conditions and increasing relative humidity in fall. It is plausible that the balancing of two effects is present when the environment is wet: scavenging of bioaerosols due to rainfall and generation and release due to rainfall. The data presented here in our study suggest that biological aerosol release was inhibited in the winter.
Long-term data on biological aerosol particles are lacking from the north of Europe but also from all over the globe. This study presents a first attempt to analyze and understand 18 months of data on atmospheric fluorescent biological aerosol particles measured with a LIF instrument.
The code used to produce the results of this study is available from the first author (MPS) upon qualified request.
The meteorological data are publicly available from the carbon portal (https://www.icos-cp.eu/observations/carbon-portal, L. U. Centre for Environmental and Climate Research, 2023). The data are available at https://hdl.handle.net/11676/jW7oCGwqLrA4JsrPH5dh78On (Heliasz and Biermann, 2022a) and at https://hdl.handle.net/11676/L27iDe53nai2M5MSKRaZM6Jo (Heliasz and Biermann, 2022b). The BioTrak data are available at https://doi.org/10.5281/zenodo.7801591 (Petersson Sjögren et al., 2023).
The supplement related to this article is available online at: https://doi.org/10.5194/acp-23-4977-2023-supplement.
MPS was responsible for data taking, performed the analysis, produced the figures, and wrote the initial draft of the manuscript. MA significantly contributed with guidance, analysis input, and manuscript writing. TST contributed with expertise and input on analysis and the manuscript. TBK significantly contributed to the performed analysis, advised on the analysis, and contributed significantly to the manuscript writing. JL was overall responsible for the study, advised on the analysis, and contributed significantly to the manuscript.
The contact author has declared that none of the authors has any competing interests.
Publisher’s note: Copernicus Publications remains neutral with regard to jurisdictional claims in published maps and institutional affiliations.
The authors would like to thank the Aerosols, Clouds, and Trace gases Research InfraStructure (ACTRIS) for letting us put up the instrument at their site and the Integrated Carbon Observation System (ICOS) for providing meteorological data for this study. We thank Patrik Nilsson, Design Sciences, Lund University, for helping with the instrument installation, Jonas Jakobsson, Erik Ahlberg, and Adam Kristensson, Department of Physics, Lund University, and Marcin Jackowicz-Korczynski, Department of Physical Geography, Lund University, for helping with data taking at Hyltemossa. We thank Erik Swietlicki for input and comments on the manuscript. We thank ICOS Sweden for provisioning of data (pid: 11676/tAq_SRIWDxBoVJp7_klS8ZbA), and we would like to thank Tobias Biermann and Michal Heliasz at the Centre for Environmental and Climate Science (CEC) and ICOS Sweden for assistance. ICOS Sweden is funded by the Swedish Research Council as a national research infrastructure.
This research has been supported by the Swedish Research Council for Sustainable Development FORMAS (grant nos. 2017-00383 and 2020-01490) and AFA Insurance (grant nos. 180113 and 200109).
This paper was edited by Luis A. Ladino and reviewed by two anonymous referees.
Alsved, M., Bourouiba, L., Duchaine, C., Löndahl, J., Marr, L. C., Parker, S. T., Prussin, A. J., and Thomas, R. J.: Natural sources and experimental generation of bioaerosols: Challenges and perspectives, Aerosol Sci. Technol., 54, 547–571, https://doi.org/10.1080/02786826.2019.1682509, 2019.
Artaxo, P. and Hansson, H.-C.: Size distribution of biogenic aerosol particles from the amazon basin, Atmos. Environ., 29, 393–402, https://doi.org/10.1016/1352-2310(94)00178-N, 1995.
Bowers, R. M., Lauber, C. L., Wiedinmyer, C., Hamady, M., Hallar, A. G., Fall, R., Knight, R., and Fierer, N.: Characterization of airborne microbial communities at a high-elevation site and their potential to act as atmospheric ice nuclei, Appl. Environ. Microbiol., 75, 5121–5130, https://doi.org/10.1128/aem.00447-09, 2009.
Brown, J. K. M. and Hovmøller, M. S.: Aerial Dispersal of Pathogens on the Global and Continental Scales and Its Impact on Plant Disease, Science, 297, 537–541, https://doi.org/10.1126/science.1072678, 2002.
Burrows, S. M., Elbert, W., Lawrence, M. G., and Pöschl, U.: Bacteria in the global atmosphere – Part 1: Review and synthesis of literature data for different ecosystems, Atmos. Chem. Phys., 9, 9263–9280, https://doi.org/10.5194/acp-9-9263-2009, 2009a.
Burrows, S. M., Butler, T., Jöckel, P., Tost, H., Kerkweg, A., Pöschl, U., and Lawrence, M. G.: Bacteria in the global atmosphere – Part 2: Modeling of emissions and transport between different ecosystems, Atmos. Chem. Phys., 9, 9281–9297, https://doi.org/10.5194/acp-9-9281-2009, 2009b.
Despres, V. R., Huffman, J. A., Burrows, S. M., Hoose, C., Safatov, A. S., Buryak, G., Frohlich-Nowoisky, J., Elbert, W., Andreae, M. O., Poschl, U., and Jaenicke, R.: Primary biological aerosol particles in the atmosphere: a review, Tellus B, 64, 15598 https://doi.org/10.3402/tellusb.v64i0.15598, 2012.
Diehl, K., Quick, C., Matthias-Maser, S., Mitra, S. K., and Jaenicke, R.: The ice nucleating ability of pollen: Part I: Laboratory studies in deposition and condensation freezing modes, Atmos. Res., 58, 75–87, https://doi.org/10.1016/S0169-8095(01)00091-6, 2001.
Franze, T., Weller, M. G., Niessner, R., and Pöschl, U.: Protein nitration by polluted air, Environ. Sci. Technol., 39, 1673–1678, https://doi.org/10.1021/es0488737, 2005.
Gosselin, M. I., Rathnayake, C. M., Crawford, I., Pöhlker, C., Fröhlich-Nowoisky, J., Schmer, B., Després, V. R., Engling, G., Gallagher, M., Stone, E., Pöschl, U., and Huffman, J. A.: Fluorescent bioaerosol particle, molecular tracer, and fungal spore concentrations during dry and rainy periods in a semi-arid forest, Atmos. Chem. Phys., 16, 15165–15184, https://doi.org/10.5194/acp-16-15165-2016, 2016.
Gregory, P. H. and Hirst, J. M.: The Summer Air-Spora at Rothamsted in 1952, Microbiology, 17, 135–152, https://doi.org/10.1099/00221287-17-1-135, 1957.
Griffin, D. W., Kubilay, N., Koçak, M., Gray, M. A., Borden, T. C., and Shinn, E. A.: Airborne desert dust and aeromicrobiology over the Turkish Mediterranean coastline, Atmos. Environ., 41, 4050–4062, https://doi.org/10.1016/j.atmosenv.2007.01.023, 2007.
Grinn-Gofron, A. and Bosiacka, B.: Effects of meteorological factors on the composition of selected fungal spores in the air, Aerobiologia (Bologna), 31, 63–72, https://doi.org/10.1007/s10453-014-9347-1, 2015.
Heald, C. L. and Spracklen, D. V.: Atmospheric budget of primary biological aerosol particles from fungal spores, Geophys. Res. Lett., 36, L09806, https://doi.org/10.1029/2009GL037493, 2009.
Healy, D. A., Huffman, J. A., O'Connor, D. J., Pöhlker, C., Pöschl, U., and Sodeau, J. R.: Ambient measurements of biological aerosol particles near Killarney, Ireland: a comparison between real-time fluorescence and microscopy techniques, Atmos. Chem. Phys., 14, 8055–8069, https://doi.org/10.5194/acp-14-8055-2014, 2014.
Heliasz, M. and Biermann, T.: ICOS ATC NRT Meteo growing time series, Hyltemossa (70.0 m), 2022-03-01–2022-08-14, ICOS RI [data set], https://hdl.handle.net/11676/jW7oCGwqLrA4JsrPH5dh78On, 2022a.
Heliasz, M. and Biermann, T.: ICOS ATC Meteo Release, Hyltemossa (70.0 m), 2017-09-26–2022-02-28, ICOS RI [data set], https://hdl.handle.net/11676/L27iDe53nai2M5MSKRaZM6Jo, 2022b.
Hill, S. C., Pinnick, R. G., Nachman, P., Chen, G., Chang, R. K., Mayo, M. W., and Fernandez, G. L.: Aerosol-fluorescence spectrum analyzer: real-time measurement of emission spectra of airborne biological particles, Appl. Opt., 34, 7149–7155, https://doi.org/10.1364/ao.34.007149, 1995.
Hill, T. C. J., DeMott, P. J., Tobo, Y., Fröhlich-Nowoisky, J., Moffett, B. F., Franc, G. D., and Kreidenweis, S. M.: Sources of organic ice nucleating particles in soils, Atmos. Chem. Phys., 16, 7195–7211, https://doi.org/10.5194/acp-16-7195-2016, 2016.
Hirst, J. M. and Stedman, O. J.: DRY LIBERATION OF FUNGUS SPORES BY RAINDROPS, J. Gen. Microbiol., 33, 335–344, https://doi.org/10.1099/00221287-33-2-335, 1963.
Huffman, J. A., Treutlein, B., and Pöschl, U.: Fluorescent biological aerosol particle concentrations and size distributions measured with an Ultraviolet Aerodynamic Particle Sizer (UV-APS) in Central Europe, Atmos. Chem. Phys., 10, 3215–3233, https://doi.org/10.5194/acp-10-3215-2010, 2010.
Huffman, J. A., Sinha, B., Garland, R. M., Snee-Pollmann, A., Gunthe, S. S., Artaxo, P., Martin, S. T., Andreae, M. O., and Pöschl, U.: Size distributions and temporal variations of biological aerosol particles in the Amazon rainforest characterized by microscopy and real-time UV-APS fluorescence techniques during AMAZE-08, Atmos. Chem. Phys., 12, 11997–12019, https://doi.org/10.5194/acp-12-11997-2012, 2012.
Huffman, J. A., Prenni, A. J., DeMott, P. J., Pöhlker, C., Mason, R. H., Robinson, N. H., Fröhlich-Nowoisky, J., Tobo, Y., Després, V. R., Garcia, E., Gochis, D. J., Harris, E., Müller-Germann, I., Ruzene, C., Schmer, B., Sinha, B., Day, D. A., Andreae, M. O., Jimenez, J. L., Gallagher, M., Kreidenweis, S. M., Bertram, A. K., and Pöschl, U.: High concentrations of biological aerosol particles and ice nuclei during and after rain, Atmos. Chem. Phys., 13, 6151–6164, https://doi.org/10.5194/acp-13-6151-2013, 2013.
Huffman, J. A., Perring, A. E., Savage, N. J., Clot, B., Crouzy, B., Tummon, F., Shoshanim, O., Damit, B., Schneider, J., Sivaprakasam, V., Zawadowicz, M. A., Crawford, I., Gallagher, M., Topping, D., Doughty, D. C., Hill, S. C., and Pan, Y. L.: Real-time sensing of bioaerosols: Review and current perspectives, Aerosol Sci. Tech., 54, 465–495, https://doi.org/10.1080/02786826.2019.1664724, 2019.
Iida, K., Sakurai, H., Saito, K., and Ehara, K.: Inkjet aerosol generator as monodisperse particle number standard, Aerosol Sci. Tech., 48, 789–802, 2014.
Jones, A. M. and Harrison, R. M.: The effects of meteorological factors on atmospheric bioaerosol concentrations–a review, Sci. Total Environ., 326, 151–180, https://doi.org/10.1016/j.scitotenv.2003.11.021, 2004.
Kim, K.-H., Kabir, E., and Jahan, S. A.: Airborne bioaerosols and their impact on human health, J. Environ. Sci. (China), 67, 23–35, https://doi.org/10.1016/j.jes.2017.08.027, 2018.
Kim, S., Park, H., Gruszewski, H. A., Schmale, D. G., and Jung, S.: Vortex-induced dispersal of a plant pathogen by raindrop impact, P. Natl. Acad. Sci. USA, 116, 4917–4922, https://doi.org/10.1073/pnas.1820318116, 2019.
Lacey, J. and Dutkiewicz, J.: Bioaerosols and occupational lung disease, J. Aerosol Sci., 25, 1371–1404, https://doi.org/10.1016/0021-8502(94)90215-1, 1994.
Li, X., Huang, S., and Sun, Z.: Technology and equipment development in laser-induced fluorescence-based remote and field detection of biological aerosols, Journal of Biosafety and Biosecurity, 1, 113–122, https://doi.org/10.1016/j.jobb.2019.08.005, 2019.
Lieberherr, G., Auderset, K., Calpini, B., Clot, B., Crouzy, B., Gysel-Beer, M., Konzelmann, T., Manzano, J., Mihajlovic, A., Moallemi, A., O'Connor, D., Sikoparija, B., Sauvageat, E., Tummon, F., and Vasilatou, K.: Assessment of real-time bioaerosol particle counters using reference chamber experiments, Atmos. Meas. Tech., 14, 7693–7706, https://doi.org/10.5194/amt-14-7693-2021, 2021.
Lohmann, U. and Feichter, J.: Global indirect aerosol effects: a review, Atmos. Chem. Phys., 5, 715–737, https://doi.org/10.5194/acp-5-715-2005, 2005.
L. U. Centre for Environmental and Climate Research (CEC): Meteorological – NRT data, https://www.icos-cp.eu/observations/carbon-portal, last access: 24 April 2023.
Madelin, T. M.: Fungal aerosols: A review, J. Aerosol Sci., 25, 1405–1412, https://doi.org/10.1016/0021-8502(94)90216-X, 1994.
Moore, R. A., Hanlon, R., Powers, C., Schmale, D. G., and Christner, B. C.: Scavenging of Sub-Micron to Micron-Sized Microbial Aerosols during Simulated Rainfall, Atmosphere, 11, 80, https://doi.org/10.3390/atmos11010080, 2020.
Norros, V., Rannik, Ü., Hussein, T., Petäjä, T., Vesala, T., and Ovaskainen, O.: Do small spores disperse further than large spores?, Ecology, 95, 1612–1621, 2014.
Oliveira, M., Ribeiro, H., Delgado, J. L., and Abreu, I.: The effects of meteorological factors on airborne fungal spore concentration in two areas differing in urbanisation level, Int. J. Biometeorol., 53, 61–73, https://doi.org/10.1007/s00484-008-0191-2, 2009.
Petersson Sjögren, M., Alsved, M., Šantl-Temkiv, T., Bjerring Kristensen, T., and Löndahl, J.: Petersson Sjögren et al 2023 Biotrak Data Hyltemossa, Zenodo [data set], https://doi.org/10.5281/zenodo.7801591, 2023.
Pratt, K. A., DeMott, P. J., French, J. R., Wang, Z., Westphal, D. L., Heymsfield, A. J., Twohy, C. H., Prenni, A. J., and Prather, K. A.: In situ detection of biological particles in cloud ice-crystals, Nat. Geosci., 2, 398–401, https://doi.org/10.1038/ngeo521, 2009.
Prenni, A. J., Petters, M. D., Kreidenweis, S. M., Heald, C. L., Martin, S. T., Artaxo, P., Garland, R. M., Wollny, A. G., and Pöschl, U.: Relative roles of biogenic emissions and Saharan dust as ice nuclei in the Amazon basin, Nat. Geosci., 2, 402, https://doi.org/10.1038/ngeo517, 2009a.
Prenni, A. J., Petters, M. D., Kreidenweis, S. M., Heald, C. L., Martin, S. T., Artaxo, P., Garland, R. M., Wollny, A. G., and Pöschl, U.: Relative roles of biogenic emissions and Saharan dust as ice nuclei in the Amazon basin, Nat. Geosci., 2, 402–405, https://doi.org/10.1038/ngeo517, 2009b.
Pöschl, U., Martin, S. T., Sinha, B., Chen, Q., Gunthe, S. S., Huffman, J. A., Borrmann, S., Farmer, D. K., Garland, R. M., Helas, G., Jimenez, J. L., King, S. M., Manzi, A., Mikhailov, E., Pauliquevis, T., Petters, M. D., Prenni, A. J., Roldin, P., Rose, D., Schneider, J., Su, H., Zorn, S. R., Artaxo, P., and Andreae, M. O.: Rainforest aerosols as biogenic nuclei of clouds and precipitation in the Amazon, Science, 329, 1513–1516, https://doi.org/10.1126/science.1191056, 2010.
Saari, S., Reponen, T., and Keskinen, J.: Performance of Two Fluorescence-Based Real-Time Bioaerosol Detectors: BioScout vs. UVAPS, Aerosol Sci. Tech., 48, 371–378, https://doi.org/10.1080/02786826.2013.877579, 2014.
Saari, S., Niemi, J., Rönkkö, T., Kuuluvainen, H., Järvinen, A., Pirjola, L., Aurela, M., Hillamo, R., and Keskinen, J.: Seasonal and Diurnal Variations of Fluorescent Bioaerosol Concentration and Size Distribution in the Urban Environment, Aerosol Air Qual. Res., 15, 572–581, https://doi.org/10.4209/aaqr.2014.10.0258, 2015.
Šantl-Temkiv, T., Sikoparija, B., Maki, T., Carotenuto, F., Amato, P., Yao, M., Morris, C. E., Schnell, R., Jaenicke, R., Pöhlker, C., DeMott, P. J., Hill, T. C. J., and Huffman, J. A.: Bioaerosol field measurements: Challenges and perspectives in outdoor studies, Aerosol Sci. Tech., 54, 520–546, https://doi.org/10.1080/02786826.2019.1676395, 2020.
Šaulienė, I., Šukienė, L., Daunys, G., Valiulis, G., Vaitkevičius, L., Matavulj, P., Brdar, S., Panic, M., Sikoparija, B., Clot, B., Crouzy, B., and Sofiev, M.: Automatic pollen recognition with the Rapid-E particle counter: the first-level procedure, experience and next steps, Atmos. Meas. Tech., 12, 3435–3452, https://doi.org/10.5194/amt-12-3435-2019, 2019.
Sauvageat, E., Zeder, Y., Auderset, K., Calpini, B., Clot, B., Crouzy, B., Konzelmann, T., Lieberherr, G., Tummon, F., and Vasilatou, K.: Real-time pollen monitoring using digital holography, Atmos. Meas. Tech., 13, 1539–1550, https://doi.org/10.5194/amt-13-1539-2020, 2020.
Schiele, J., Rabe, F., Schmitt, M., Glaser, M., Häring, F., Brunner, J. O., Bauer, B., Schuller, B., Traidl-Hoffmann, C., and Damialis, A.: Automated classification of airborne pollen using neural networks, Annual International Conference of the IEEE Engineering in Medicine and Biology Society, IEEE Engineering in Medicine and Biology Society, Annual International Conference, 2019, 4474–4478, https://doi.org/10.1109/EMBC.2019.8856910, 2019.
Schumacher, C. J., Pöhlker, C., Aalto, P., Hiltunen, V., Petäjä, T., Kulmala, M., Pöschl, U., and Huffman, J. A.: Seasonal cycles of fluorescent biological aerosol particles in boreal and semi-arid forests of Finland and Colorado, Atmos. Chem. Phys., 13, 11987–12001, https://doi.org/10.5194/acp-13-11987-2013, 2013.
Taylor, P. E., Flagan, R. C., Miguel, A. G., Valenta, R., and Glovsky, M. M.: Birch pollen rupture and the release of aerosols of respirable allergens, Clin. Exp. Allergy, 34, 1591–1596, https://doi.org/10.1111/j.1365-2222.2004.02078.x, 2004.
Toprak, E. and Schnaiter, M.: Fluorescent biological aerosol particles measured with the Waveband Integrated Bioaerosol Sensor WIBS-4: laboratory tests combined with a one year field study, Atmos. Chem. Phys., 13, 225–243, https://doi.org/10.5194/acp-13-225-2013, 2013.
Valsan, A. E., Ravikrishna, R., Biju, C. V., Pöhlker, C., Després, V. R., Huffman, J. A., Pöschl, U., and Gunthe, S. S.: Fluorescent biological aerosol particle measurements at a tropical high-altitude site in southern India during the southwest monsoon season, Atmos. Chem. Phys., 16, 9805–9830, https://doi.org/10.5194/acp-16-9805-2016, 2016.
Womack, A. M., Artaxo, P. E., Ishida, F. Y., Mueller, R. C., Saleska, S. R., Wiedemann, K. T., Bohannan, B. J. M., and Green, J. L.: Characterization of active and total fungal communities in the atmosphere over the Amazon rainforest, Biogeosciences, 12, 6337–6349, https://doi.org/10.5194/bg-12-6337-2015, 2015.
Yu, X., Wang, Z., Zhang, M., Kuhn, U., Xie, Z., Cheng, Y., Pöschl, U., and Su, H.: Ambient measurement of fluorescent aerosol particles with a WIBS in the Yangtze River Delta of China: potential impacts of combustion-related aerosol particles, Atmos. Chem. Phys., 16, 11337–11348, https://doi.org/10.5194/acp-16-11337-2016, 2016.