the Creative Commons Attribution 4.0 License.
the Creative Commons Attribution 4.0 License.
 | 14 Apr 2023
Global warming will largely increase waste treatment CH4 emissions in Chinese megacities: insight from the first city-scale CH4 concentration observation network in Hangzhou, China
Junqing Zhang
Rongguang Du
Xiaofei Xu
Haoyu Xiong
Huili Liu
Xinyue Ai
Yiyi Peng
Wei Xiao
Atmospheric CH4 is the second-largest anthropogenic contributor to global warming. However, its emissions, components, spatial–temporal variations and projected changes still remain largely uncertain from city to national scales. CH4 emissions from waste treatment (including solid waste landfills, solid waste incineration and sewage) account for >50 % of total anthropogenic CH4 emissions at the city scale, and considering the high temperature sensitivity of CH4 emission factors (EFs) to biological-process-based sources such as waste treatment, large differences will occur when estimating future CH4 emissions under different global warming scenarios. Furthermore, the relationships between temperature and waste treatment CH4 emissions have only been studied in a few site-specific studies and lack representativity for whole cities, which contain various biophysical conditions and show heterogeneous distribution. The above factors cause uncertainty in the evaluation of city-scale CH4 emissions (especially from waste treatments), and projected changes still remain unexplored. Here we conduct the first tower-based CH4 observation network with three sites in Hangzhou, which is located in the developed Yangtze River Delta (YRD) area and ranks as one of the largest megacities in China. We found the a priori total annual anthropogenic CH4 emissions and those from waste treatment were overestimated by 36.0 % and 47.1 % in Hangzhou, respectively. In contrast, the total emissions in the larger region, i.e., Zhejiang Province or the YRD area, were slightly underestimated by 7.0 %. Emissions from waste treatment showed obvious seasonal patterns following air temperature. By using the linear relationship constructed between monthly waste treatment CH4 emissions and air temperature, we find the waste treatment EFs increase by 38 %–50 % with temperature increases of 10 ∘C. Together with projected temperature changes from four climate change scenarios, the global-warming-induced EFs in Hangzhou will increase at the rates of 2.2 %, 1.2 %, 0.7 % and 0.5 % per decade for IPCC AR5 (Intergovernmental Panel on Climate Change, the Fifth Assessment Report) RCP (Representative Concentration Pathway) 8.5, RCP6.0, RCP4.5 and RCP2.6 scenarios, respectively. And the EFs will finally increase by 17.6 %, 9.6 %, 5.6 % and 4.0 % at the end of this century. Additionally, the derived relative changes in China also show high heterogeneity and indicate large uncertainty in projecting future national total CH4 emissions. Hence, we strongly suggest temperature-dependent EFs and the positive feedback between global warming and CH4 emissions should be considered in future CH4 emission projections and climate change models.
- Article
(12043 KB) - Full-text XML
-
Supplement
(2823 KB) - BibTeX
- EndNote


As CH4 is the second-largest anthropogenic greenhouse gas, reduction in CH4 emissions is considered an effective way to mitigate future climate change on short timescales (Henne et al., 2016; Lin et al., 2021). Accurate estimation of CH4 emissions from the main CH4 sources is the basis of related policy-making. However, recent studies have found there still remain large uncertainties regarding CH4 total emissions, components, spatial–temporal variations and projected changes at the city scale, especially for megacities in China (USEPA, 2013; Cai et al., 2018; Lin et al., 2021). CH4 emission from waste treatment (mainly including sewage and solid waste by landfills and incineration) has been ranked as the world's third-largest anthropogenic source after fuel exploitation and livestock and is responsible for ∼13 % of global anthropogenic CH4 emissions of 371 (±26) Tg a−1 (Lu et al., 2021). It also ranks as the fourth-largest anthropogenic source in China, the biggest anthropogenic-CH4-emitting country, and accounts for ∼14 % of national total anthropogenic emissions of 65 (±22) Tg a−1 (Saunois et al., 2020; Lu et al., 2021; Chen et al., 2022). Furthermore, its contribution is even larger than 50 % at the city scale, especially for megacities, where both active and closed household waste facilities (including landfills and wastewater systems) are located and classified as super-emitters (Williams et al., 2022; Maasakkers et al., 2022). A large number of Chinese landfills were constructed in suburbs more than 5–10 years ago, and most landfills have no gas collection systems; with the urban area expanding in recent decades, the locations of many landfills are now within the urban scope (Zhejiang Statistical Yearbook 2018–2019). In addition, the decreasing area of the agricultural sector (rice paddies and husbandry) in megacities also makes their emissions negligible when compared with waste treatment. Therefore, accurate quantification of CH4 emissions from waste treatment in urban area has become increasingly important.
Although some progress has been made in measuring site-scale CH4 emissions from waste treatment, the estimated emissions still show large discrepancies due to many factors such as the amount of waste and its composition, relative proportions of landfills and incineration, the degradable organic carbon ratio, CH4 oxidation efficiency, and landfill gas collection and due to meteorological conditions including temperature, water content and atmospheric pressure (Masuda et al., 2018; Cai et al., 2018; X. Zhao et al., 2019; Hua et al., 2022; Bian et al., 2022; Maasakkers et al., 2022; Kissas et al., 2022).
Furthermore, CH4 emissions from sewage and landfills result from microbial processes, especially from methanogens, and their emission factors (EFs) are highly sensitive to temperature. Available studies were mainly conducted at some specific sites with measured EFs varying widely (Du et al., 2017, 2018; Cai et al., 2014, 2018; X. Zhao et al., 2019; NBSC, 2015; Wang et al., 2015; De La Cruz and Barlaz, 2010; Tolaymat et al., 2010; Hua et al., 2022). The lack of detailed information and related discrepancies for all the above factors and their uncertainties have led to considerable difficulty in estimating CH4 emissions for the most up-to-date inventories (Höglund-Isaksson, 2012; USEPA, 2013; Cai et al., 2018; Lin et al., 2021; Maasakkers et al., 2022).
China, the developing country with the largest anthropogenic CH4 emissions, is expected to increase its emissions because of projected rapid economic development, urbanization and generated waste (Cai et al., 2018). Increasing waste treatment emissions in eastern China have also been found to comprise the second-largest sector in driving national total anthropogenic CH4 emissions since 2000 (Lin et al., 2021). In addition, the mitigation potential of waste treatment in developing countries is thought to be 4 times that of developed countries (USEPA, 2013). Therefore, mitigating CH4 emissions from waste treatment in China is a robust and cost-effective way to reduce total national anthropogenic greenhouse gas emissions.
Many previous studies have estimated the waste treatment CH4 emissions for China by both “bottom-up” and “top-down” approaches, with results varying 2.5-fold from 4.3 to 10.4 Tg CH4 a−1 and accounting for 8.1 %–24.2 % of national total anthropogenic CH4 emissions (USEPA, 2013; Peng et al., 2016; Miller et al., 2019; Lin et al., 2021; Lu et al., 2021; Chen et al., 2022). For these bottom-up approaches, the high uncertainties were directly attributed to omission of many small point sources and discrepancies of observed site-specific EFs, which varied largely by climate and management technology, such as the efficiency of gas collection systems (X. Zhao et al., 2019; Hua et al., 2022). Previous studies have most commonly used the EDGAR (Emissions Database for Global Atmospheric Research) inventory, using the Intergovernmental Panel on Climate Change (IPCC)-recommended default EF value of 15.0 % (Höglund-Isaksson, 2012; Lin et al., 2021; Bian et al., 2022), but this value is around 5–7 times higher than those EFs used in China by Zhang and Chen (2014). A recent study comparing waste treatment CH4 emissions among different inventories also reported that the EDGAR v5.0 and CEDS (Community Emissions Data System) inventories were 21 %–53 % higher than other inventories, and EDGAR v5.0 tended to assign more emissions to urban areas, especially for provincial capitals. In addition, emissions from wastewater were found to be overestimated by higher emission factors or chemical oxygen demand (Peng et al., 2016; Lin et al., 2021).
For the top-down atmospheric inversion approaches, a few studies have constrained anthropogenic sources including waste treatment, where the most widely used concentrations were from satellite observations (Miller et al., 2019; Lu et al., 2021; Chen et al., 2022). The satellite observations have the advantage of easy data access and global coverage. But as already noted, the constrained emissions results are highly dependent on the availability of observed concentrations, which are largely influenced by weather conditions and cloud coverage. As was illustrated in a recently published study by Chen et al. (2022), although the number of grid cells () based on year-round satellite observations was more than 1000 in northern China, the available number of satellite observations was less than 10 (even including grid cells without any observations) in most of central, western, eastern and southern China. Such sparse distribution of available data may not provide robust constraints on waste treatment emissions for some Chinese cities without enough observations, especially considering waste treatment is co-located with high-population-density megacities in the developed area of eastern and southern China. Furthermore, there should be large temperature-induced monthly variations for waste treatment CH4 emissions (Börjesson et al., 1997), but almost all satellite-based inversions were conducted at the annual scale without seasonal variations. Besides, given the strong influence from atmospheric pressure on landfill CH4 emissions (Kissas et al., 2022), satellite observations are too sparse to be upscaled to estimate annual totals because satellite observations are mostly available only in clear-sky conditions and cannot represent atmospheric pressure and CH4 emissions on cloudy or rainy days. There was only one recent study which focused on urban waste treatment CH4 emissions: it found annual CH4 emissions from four cities were 1.4 to 2.6 times larger than inventories in India and Pakistan, where landfills contributed to 6 %–50 % of total emissions, and indicated large bias in our understanding of waste treatment CH4 emissions (Maasakkers et al., 2022).
The tower-based atmospheric inversion approach, which is based on hourly atmospheric concentration observations within the planetary boundary layer, can be used independently to constrain CH4 emissions and their main components. Besides, compared with bottom-up approaches, the top-down method can avoid using the factors that lead to large uncertainties in CH4 emissions, especially from waste treatment. And to our best knowledge, there are few tower-based observation inversion studies which focus on waste treatment emissions at the city scale or much larger regional scales, especially in China. Only one study in Los Angeles, USA, used tower-based CH4 concentrations and found the influence of a landfill site closure on CH4 emissions, which was not included in an a priori inventory (Yadav et al., 2019). In addition, the influences of global warming on city-scale (or higher regional-scale) emissions are still unclear and have not been considered in future-emission projections (USEPA, 2013; Cai et al., 2018). In general, previous studies which have predicted future waste treatment CH4 emissions have only used activity data changes without considering the effects of climate change on the EFs. Considering the potentially high sensitivity of waste treatment CH4 emissions to projected global warming, how these emissions will change with increasing temperature is still unknown, especially within megacities where more waste is generated and where the urban heat island effect will lead to a much stronger warming climate (K. Zhang et al., 2022).
Here, we established three tower-based CH4 concentration observation sites in Hangzhou, one of the largest megacities in China. To our best knowledge, it is the first city-scale tower-based CH4 concentration observation network in China. We present our work on urban CH4 emission inversion and aim to (1) constrain CH4 emissions from waste treatment alongside total anthropogenic emissions in Hangzhou and (2) derive the temperature sensitivity of waste treatment CH4 emissions at the city scale and quantify the projected emission changes in future climate change scenarios. One-year hourly CH4 concentration observations from 1 December 2020 to 30 November 2021 were combined with an atmospheric transport model and Bayesian inversion approach to constrain monthly CH4 emission inventories. The constructed relationship between monthly temperature and a posteriori waste treatment CH4 emissions will be used with future temperature projection to quantify how the EFs will change in different global warming scenarios.
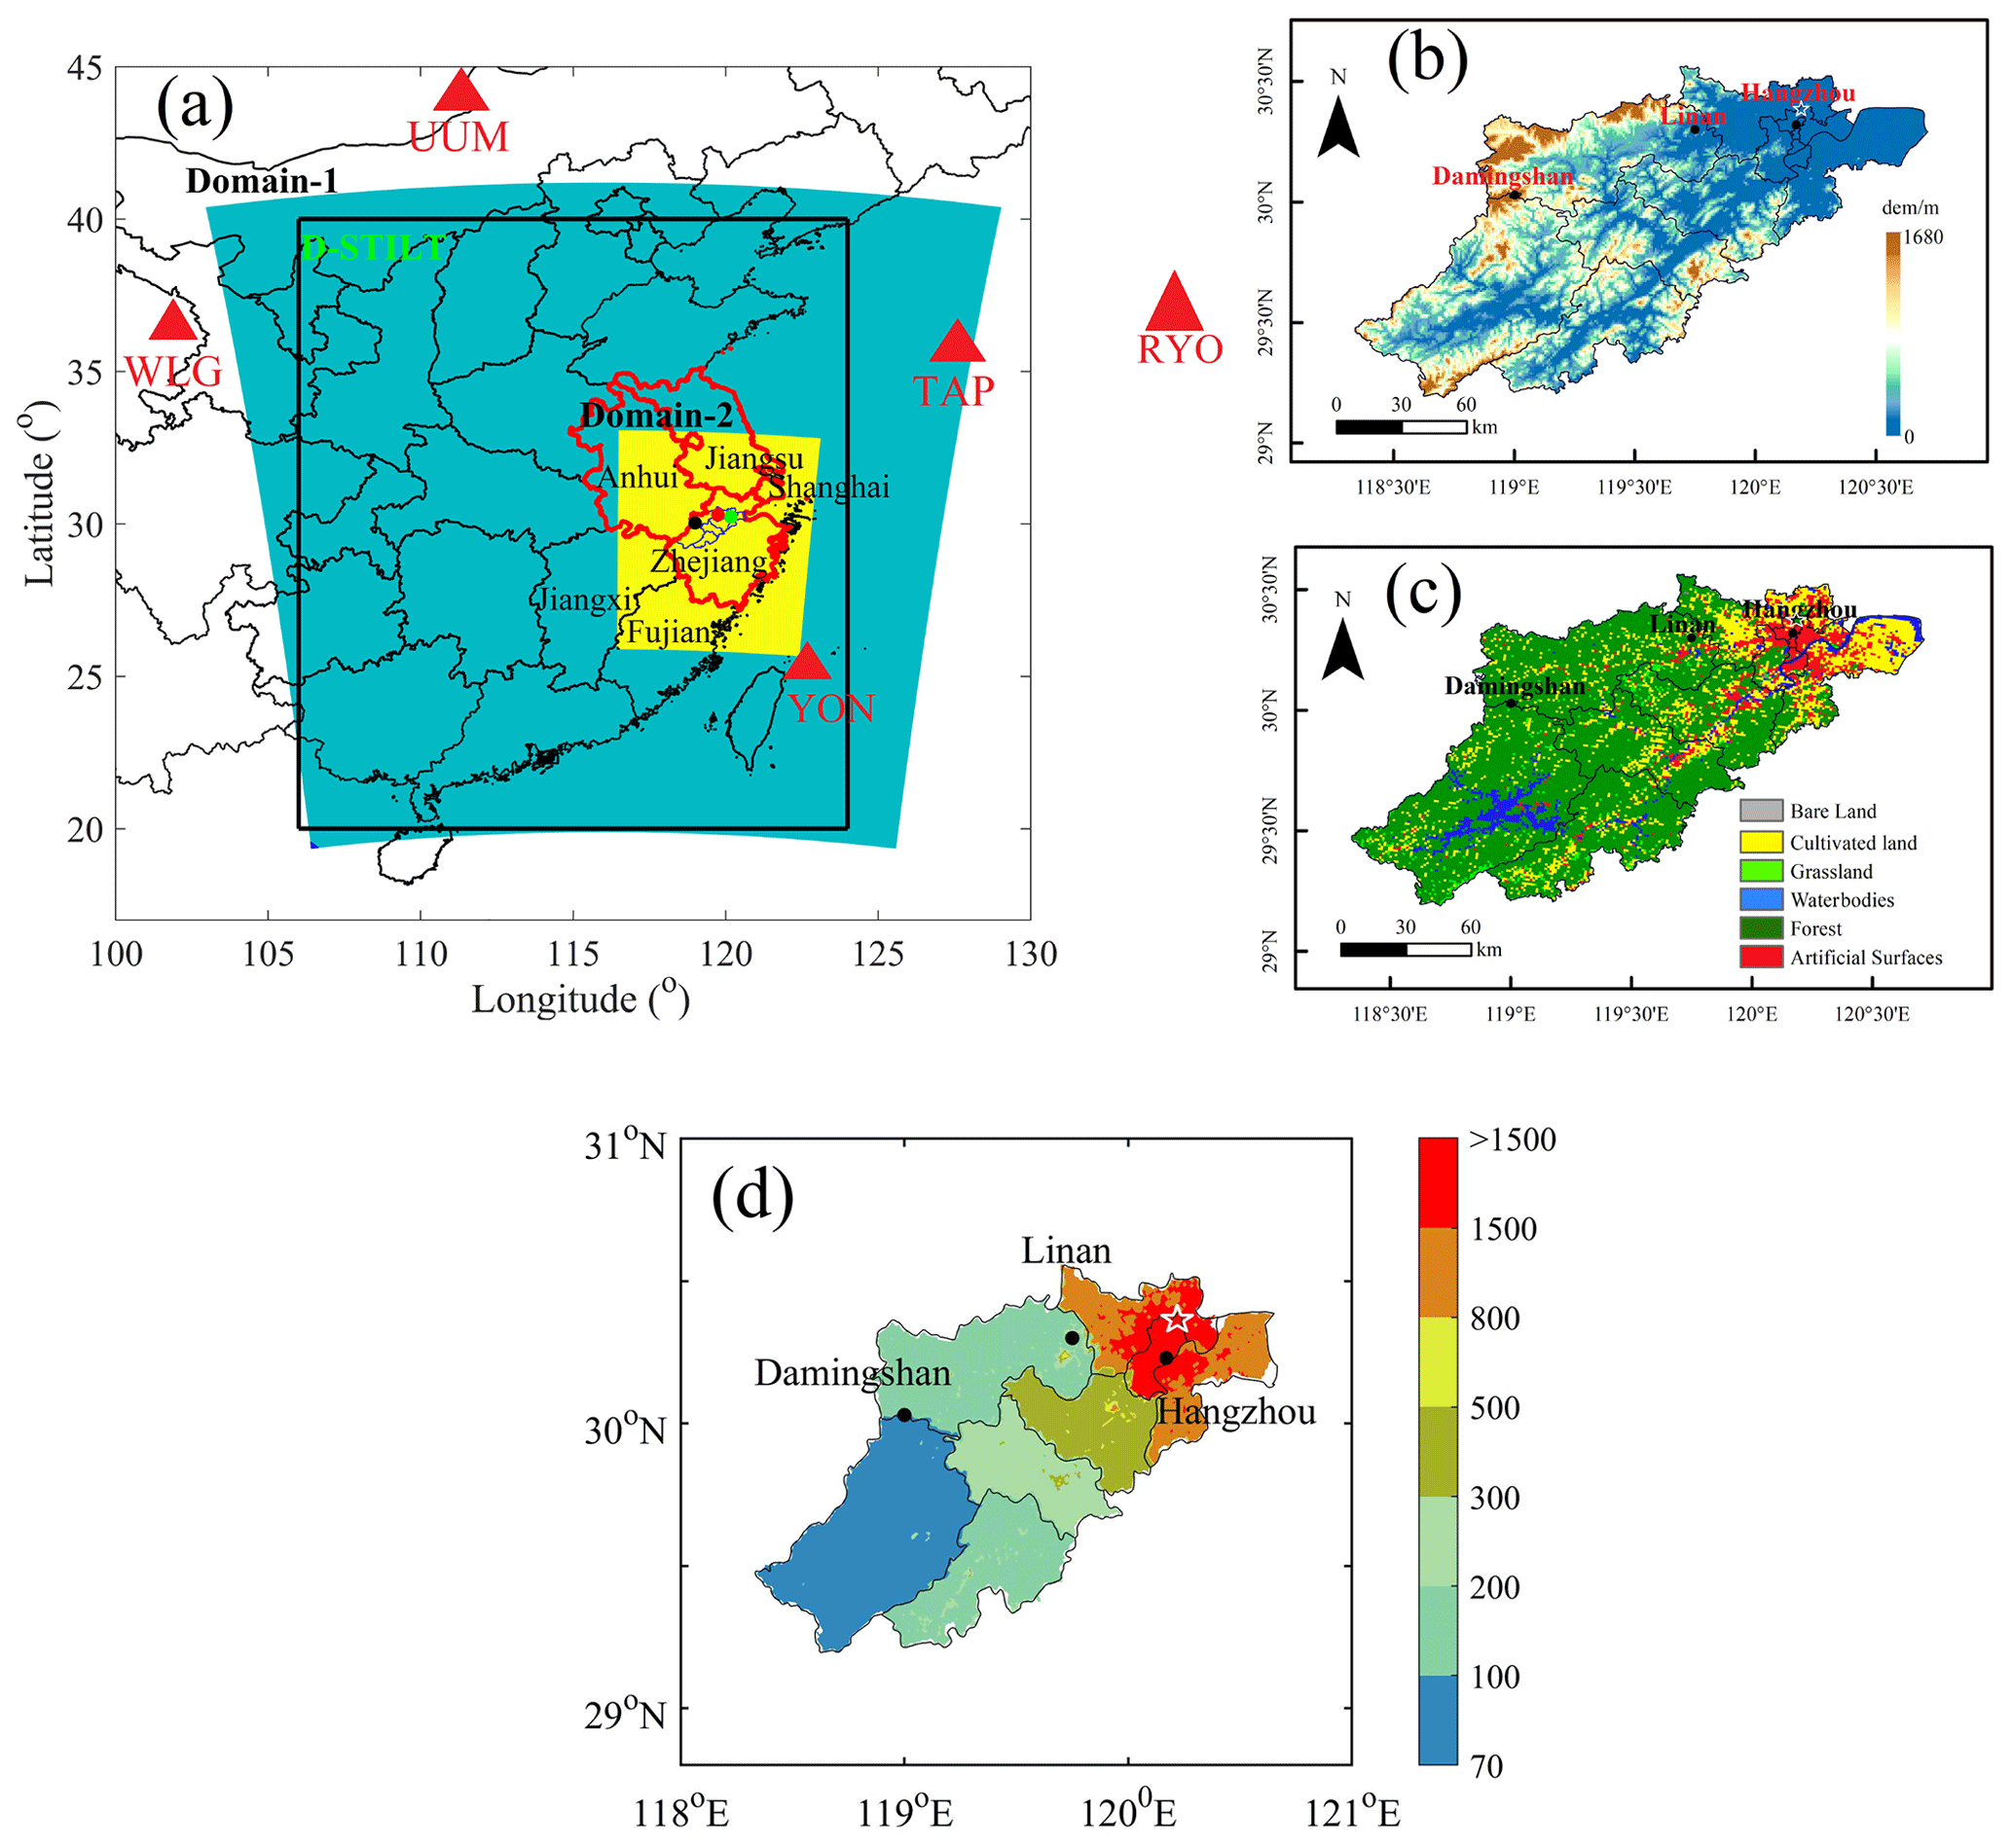
Figure 1(a) WRF-STILT (WRF – Weather Research and Forecasting, version 4.2.2, and STILT – Stochastic Time-Inverted Lagrangian Transport) model domain setups, three CH4 concentration observation sites in Hangzhou, and five CH4 background sites; note the green, red and black dots represent locations for the Hangzhou site, Linan site and Damingshan site, respectively; the Yangtze River Delta region is displayed in the red boundary; and the black rectangle represents the domain in the STILT model. (b) Geophysical height within Hangzhou. (c) Land surface categories in Hangzhou. (d) Population density in Hangzhou for the year 2019, (units: people per km2); the location of landfills in Hangzhou is displayed with a white star.
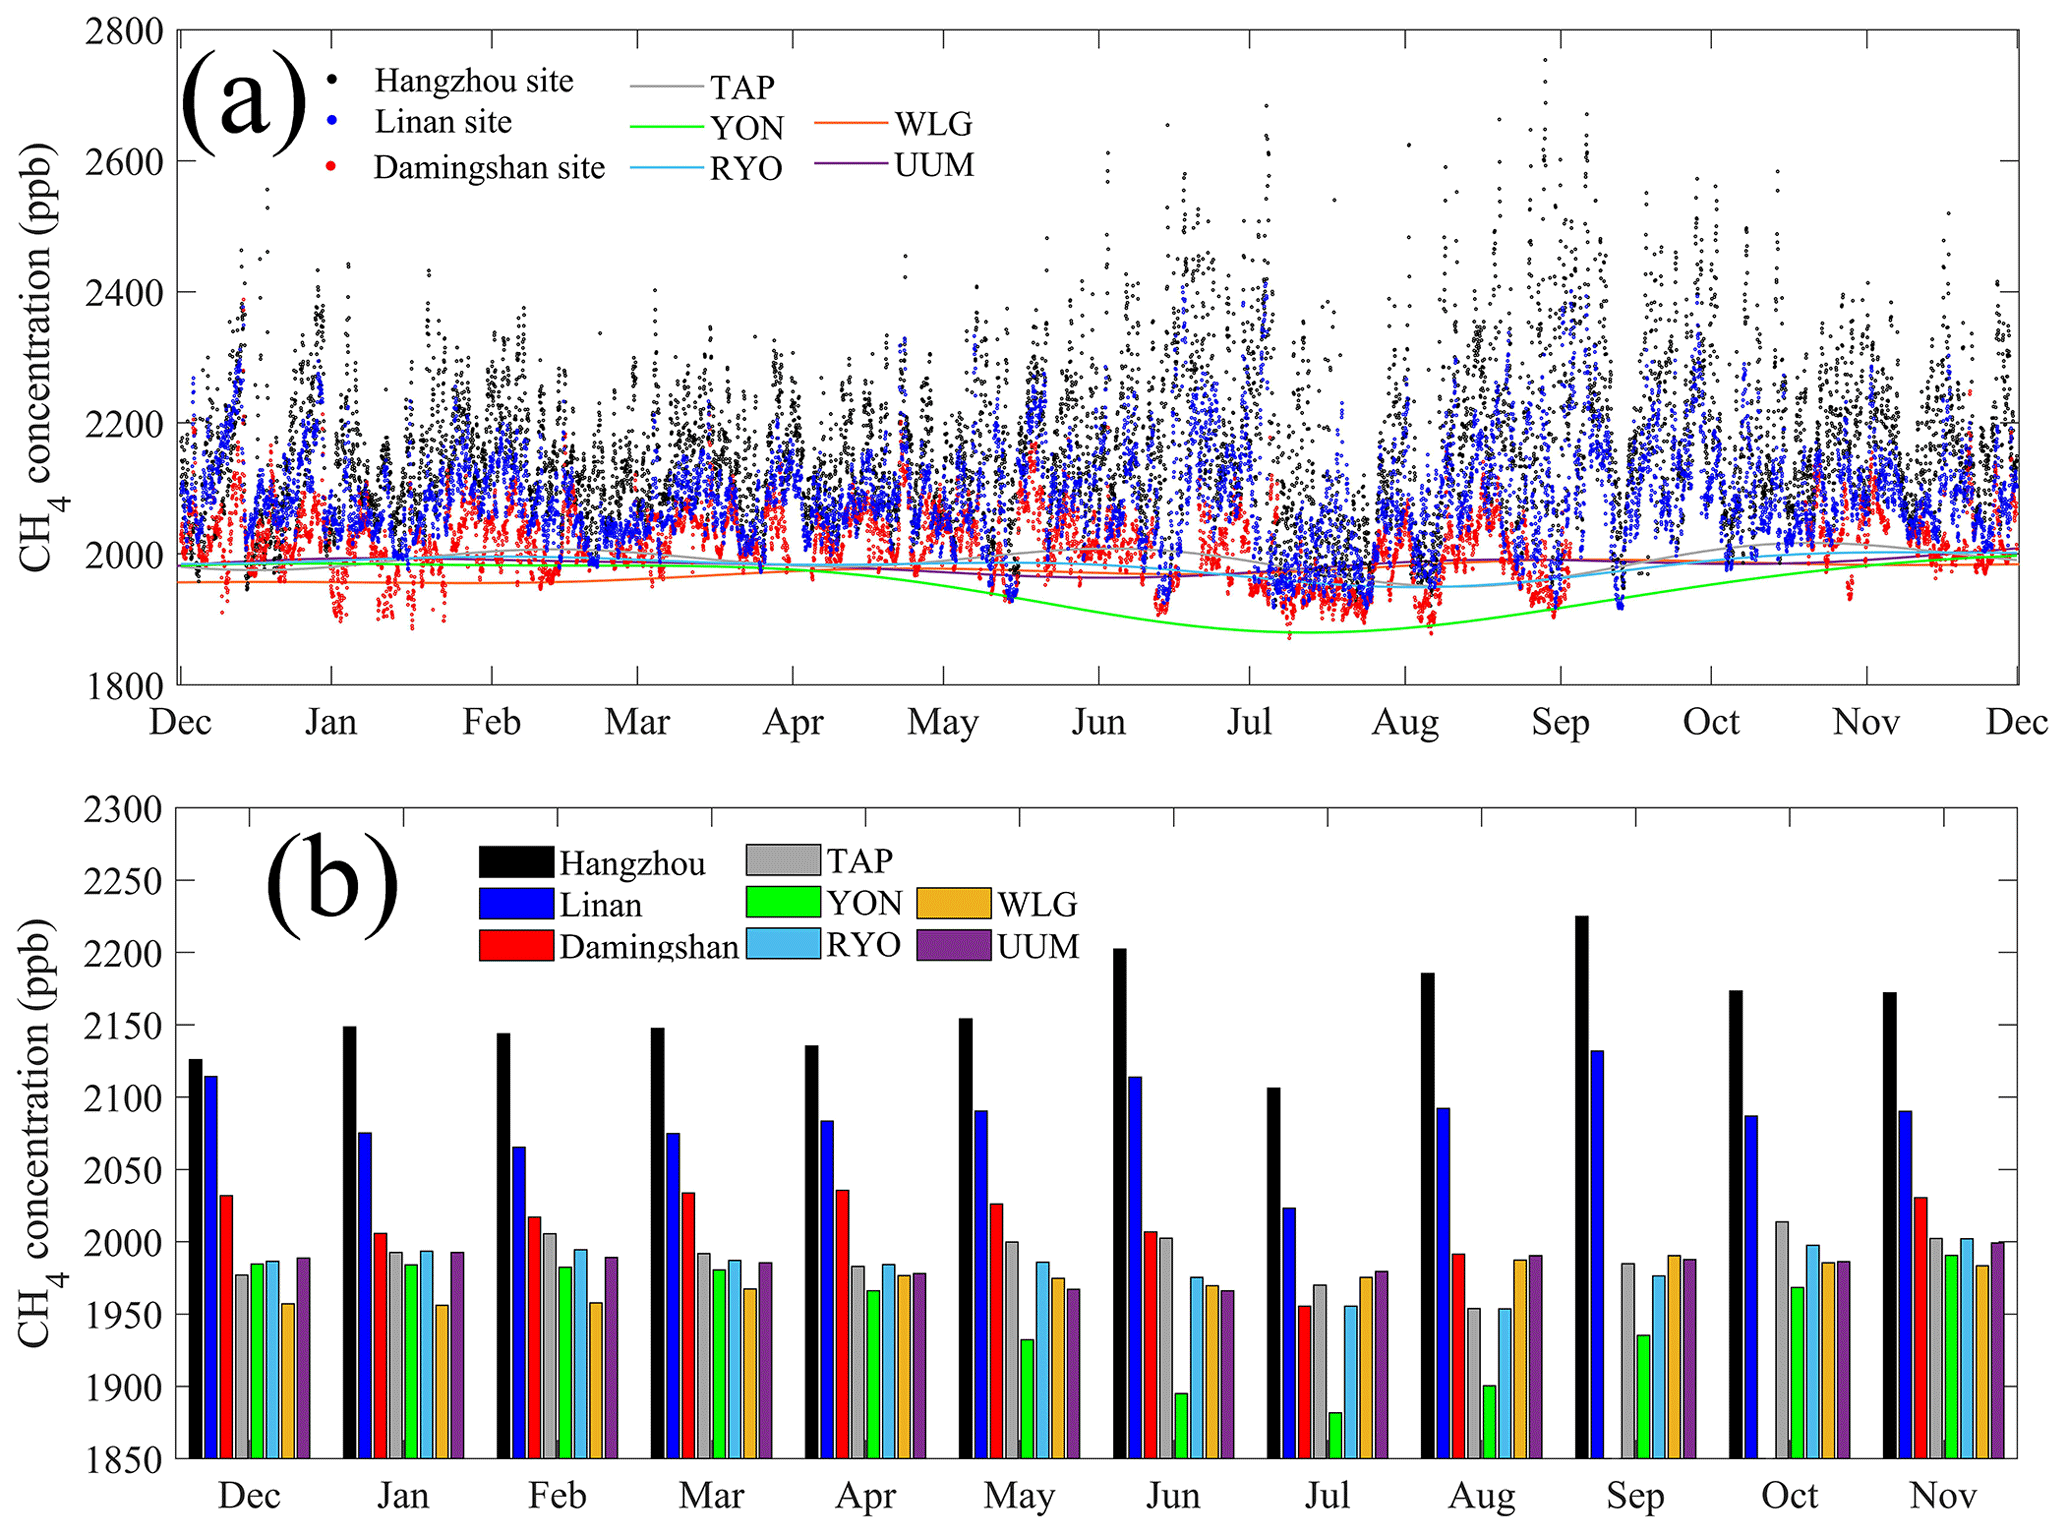
Figure 2(a) Hourly CH4 concentrations at three sites within Hangzhou – the Hangzhou site, Linan site and Damingshan site – and the CH4 background based on the CCGCRV (a digital filtering and curve-fitting program developed by Carbon Cycle Group, NOAA, USA) regression method at five background sites – TAP, YON, RYO, WLG and UUM. (b) Monthly mean of CH4 concentrations for the above eight sites. Note the CH4 background is smoothed by using the CCGCRV fitting method on weekly or hourly observations, which can filter large fluctuations caused by sudden and unidentified sources.
2.1 Tower-based CH4 observation network and the Supplement
The city of Hangzhou, which has a population of 12.2 million and area of 1.7×10⁴ km2 (core urban area of 8.3×10³ km2), is the capital of Zhejiang Province and is located in the middle of eastern China (Fig. 1a). As displayed in Figs. S1–S2 in the Supplement, eastern China accounts for the majority of the national total population and waste treatment CH4 emissions. Hangzhou is ranked in the top 10 megacities in China, with annual solid waste of around 5×10⁶ t in 2021. The tower-based CH4 concentration observation network includes three observation sites (Fig. 1a–d): (1) the Hangzhou site (30.23∘ N, 120.17∘ E; 43.2 m a.s.l.), which is located in the core urban region; (2) the Linan site (30.30∘ N, 119.72∘ E; 138.6 m a.s.l.), a regional background site with no obvious emission sources within a 10 km radius; and (3) the Damingshan site (30.03∘ N, 119.00∘ E; 1485.0 m a.s.l.), which is built on the top of a ca. 1500 m mountain and represents background from much more diluted regional emission signals. The distance is around 50 km between the Hangzhou site and Linan site and around 150 km between the Hangzhou site and Damingshan site. These three sites represent distinct points on obvious gradients from the east with a densely populated area (Fig. 1c–d) and anthropogenic emissions to the west with much weaker anthropogenic influence and background conditions. Based on the wind direction for the three sites, there is no obvious difference in seasonal wind direction patterns among them. The prevailing wind direction from October to February was from the north, which changed to the east from February to May and then changed to the south during the monsoon in summer.
The air inlet heights are 25 m above ground level (a.g.l.) for the Hangzhou site, 53 m a.g.l. at Linan and 10 m a.g.l. at Damingshan. Atmospheric CH4 concentrations at all three sites were continuously measured by cavity ring-down spectroscopy analyzers (model G2301 for the Hangzhou site and G2401 for the Linan site and Damingshan site; Picarro, Inc., Sunnyvale, CA). To obtain high-precision observations, two different standard gases were measured every 6 h, and a linear two-point fit was used to calibrate observations, with a precision and accuracy of 2 and 1 ppb. More details of the observation and calibration systems were described in Fang et al. (2014, 2022). Note that because of instrument issues at the Damingshan site, there is a data gap in September–October 2021. In general, 99.4 %, 99.0 % and 79.3 % of hourly CH4 observations were available in the whole year-long observation period for the Hangzhou site, Linan site and Damingshan site, respectively. Meteorological observations at the Hangzhou meteorological station were used to evaluate simulated meteorological fields, including air temperature at 2 m (T2 m), relative humidity (RH), downward solar radiation (S↓), wind speed (WS) at 10 m height and planetary boundary layer height (PBLH).
Note some previous studies of city-scale greenhouse gas concentration observation networks chose sites at the edge of urban borders as the background in their emission inversion systems (i.e., Indianapolis, USA, Miles et al., 2017; Los Angeles, USA, Verhulst et al., 2017; Washington, DC–Baltimore, USA, Lopez-Coto et al., 2020; Paris, France, Lian et al., 2021), but we chose to use five NOAA CH4 background sites as the potential background, including the UUM, TAP, RYO, YON and WLG sites (Fig. 1a), which were much further away than the observations at the Damingshan site. This strategy is based on the three following reasons: (1) our footprint domain is much larger than Hangzhou, and these five sites are also located close to the edge of the model domain; (2) CH4 concentrations within Hangzhou will be influenced by the seasonally varying monsoon, and the monthly varying wind directions will lead to obvious changes in the CH4 background compared to only at the Damingshan site; and (3) our model setups can partition CH4 enhancements from within Hangzhou and other regions.
The projected climate data from four RCP (Representative Concentration Pathway) scenarios (RCP8.5, RCP6.0, RCP4.5 and RCP2.6) by the MRI-CGCM3 model were downloaded from the World Data Center for Climate (WDCC, https://www.wdc-climate.de/ui/, last access: 17 February 2022), where annual air temperature at 2 m was used from the years 2021 to 2100. The most recent population density data for Hangzhou are for the year 2019 and were downloaded from the Chinese National Resource and Environment Science and Data Center.
2.2 WRF-STILT model setup
The WRF-STILT (WRF – Weather Research and Forecasting, version 4.2.2 – and STILT – Stochastic Time-Inverted Lagrangian Transport) model was used to simulate the hourly footprint and CH4 enhancement; see more details in Hu et al. (2019, 2021). Domain setups are displayed in Fig. 1a, with the outer nested domain (Domain 1, 27 km × 27 km grid resolution) covering eastern and central China and the inner domain (Domain 2, 9 km × 9 km grid resolution) covering the Yangtze River Delta (YRD) area. The physical schemes used in the WRF model are the same as in our previous studies for the YRD domain (Hu et al., 2019, 2021). The simulated CH4 concentration is the sum of the background and enhancement, where the enhancement is calculated by multiplying all CH4 fluxes with an hourly footprint that represents the sensitivity of the concentration changes to CH4 regional sources/sinks with a spatial resolution of . To better quantify CH4 components at each site, CH4 enhancements from different regions and sources are also tracked and separately simulated. Besides, we should note the CH4 background is important in simulating CH4 concentrations and atmospheric inversion. We will choose the CH4 background from the five background sites based on the monthly footprint as discussed in Sect. 3.1.
The most recent inventory of the Emissions Database for Global Atmospheric Research (EDGAR v6.0), which has 20 categories, and the WetCHARTs ensemble mean were used as the a priori anthropogenic and natural CH4 emissions. We should note there are many CH4 inventories for some developed regions and countries (i.e., France, USA, Germany) with high spatial resolutions. The reasons to choose EDGAR for a priori anthropogenic emissions are that (1) for all available CH4 inventories that covered China, the spatial resolution of EDGAR () is the highest, and it provides the most up-to-date results; (2) most previous studies that constrain emissions by atmospheric inversion studies also chose EDGAR, and our results can be directly compared with previous studies; and (3) the preliminary simulation of CH4 concentrations showed generally good performance compared to observations, indicating CH4 spatial distributions in Hangzhou have a relatively small bias even with a potentially large bias for magnitude, which will be constrained by our atmospheric inversion method.
The main sources of CH4 emissions in Hangzhou include SWD_LDF (solid waste landfills), WWT (wastewater handling), SWD_INC (solid waste incineration), PRO (all processes related to fuel exploitation from coal, oil and natural gas, including extraction, transportation, refining and distribution as listed in IPCC database; https://www.ipcc-nggip.iges.or.jp/EFDB/find_ef.php, last access: 30 December 2021), RCO (energy for buildings, mainly containing natural gas escaping from household use) and AGS (agricultural soils). We found emissions from SWD_LDF, WWT and SWD_INC were simply assigned in the same locations in the EDGAR inventory, and hence we combined them as waste treatment. For the CH4 emissions from wetland, we used the WetCHARTs ensemble mean with a spatial resolution of 0.5∘ for the monthly average (Bloom et al., 2017). Considering WetCHARTs treats rice paddies (main source is AGS) as one wetland type, AGS in EDGAR was excluded, and we assume WetCHARTs represents all wetland CH4 emissions as natural wetland and rice paddies.
2.3 Bayesian inversion framework
The scale factor Bayesian inversion (SFBI) approach was applied to interpret the atmospheric CH4 concentration (or enhancement) variations in terms of the quantitative constraint on all CH4 sources. The relationship between observed and simulated CH4 concentrations (or enhancement) can be expressed as follows in Eq. (1):
where y is the observed CH4 concentration (or enhancement), Kcorresponds to simulated enhancements from all categories, Γ is the state vector to be optimized and consists of a posteriori scale factors (SFs) for corresponding categories in K, and ε is the observing system error.
The optimal solution to derive a posteriori SFs is to minimize a cost function J(Γ), which represents the mismatch between CH4 observations and simulations and the mismatch between a posteriori and a priori SFs (Miller et al., 2008; Griffis et al., 2017). The cost function J(Γ) can be expressed as
where Se and Sa are the constructed error covariance matrices for observations and the a priori values and Se consists of measurement and model errors. Here each element in a priori SFs, Γa, is treated as 1. Therefore, the solution for obtaining the a posteriori SFs is to solve ∇Γ J(Γ) and is given by
In the Bayesian inversion framework, we first need to give an estimate of the error covariance matrices and the state vector for the a priori and observational data, following our previous studies conducted in eastern China (Hu et al., 2019, 2022). Uncertainties of 10 %, 13 % and 20 % were assigned to the measurement errors (Sobs), finite number of particles (500) released in the STILT model (Sparticles) and uncertainty in meteorological fields (Smet), respectively.
A previous study derived uncertainties in CH4 from waste treatment and other categories, which varied between 30 % and 50 %; these uncertainties were calculated mainly from activity data and EFs at the country scale based on annual averages (Solazzo et al., 2021). We should also note CH4 emission uncertainty will largely increase as the study region size decreases, and, as stated above, the relative difference among different inventories can reach 150 %. Considering the disaggregation of spatial distributions and temporal variations, CH4 emission uncertainties can be much larger at urban and monthly scales. To provide robust constraints on CH4 emissions in our study, we used three cases of a priori uncertainty combinations for different emissions in Bayesian inversion:
-
The first case uses three elements as wetland, waste treatment and all other anthropogenic sources; considering the larger seasonality of waste treatment, an uncertainty of 300 % was used for waste treatment and of 200 % for other categories.
-
The second case has more detailed categories – wetland, waste treatment, fuel exploitation, energy for buildings and the other anthropogenic sources – where the a priori uncertainty of 200 % was used for each category.
-
The third case has the same categories as Case 1 but uses a different a priori uncertainty for waste treatment of 200 %. The averages of all three cases are used as final a posteriori SFs, and the largest difference between each of the three cases is used as the final uncertainty.
3.1 Atmospheric CH4 observations
We first display the hourly CH4 concentrations from our three tower-based sites and smoothed background at five sites by the CCGCRV fitting method (Thoning et al., 1989) in Fig. 2a. The hourly observations at three towers show similar temporal variations but with different amplitudes. Observations at the Hangzhou site vary between 2000 and 2800 ppb and are much larger than at both the Linan site and the Damingshan site. Their monthly averages are also compared in Fig. 2b, and results show the monthly CH4 varies between the lowest value of 2106.3 ppb in July and highest value of 2225.0 ppb in September (annual mean of 2159.9 ppb) at the Hangzhou site, lowest values of 2023.3 ppb in July and highest values of 2132.0 ppb in September (annual mean of 2086.7 ppb) at the Linan site, the lowest value of 1955.5 ppb in July and without observations in September at the Damingshan site (annual mean of 2013.4 (± 3) ppb, where the uncertainty was calculated based on the assumption that the values of monthly mean CH4 concentrations in September and October are in between those of August and November). The similar trends among the three sites can be explained by all three sites being dominated by similar atmospheric transport processes, such as synoptic process (i.e., monsoon) and seasonally changing wind directions as summarized above. But their surrounding emission sources are highly different, implying the emissions of the Hangzhou site should be much larger than the Linan and Damingshan sites.
Because the CH4 background is important in concentration simulation and emission inversion, we also compare the CH4 background between five sites, where the annual averages at TAP, YON, RYO, WLG and UUM were 1989.8, 1850.1, 1982.7, 1973.4 and 1984.2 ppb, respectively. We found the differences were generally within 20 ppb among the TAP, RYO, WLG and UUM sites (Fig. 2), but there was a large difference between the YON site and four other sites from May to August, which could reach around 100 ppb. Note that because the YON site is located in the south of the East China Sea (Fig. 1a), it can be influenced by the monsoon with clean airflows from the South China Sea, which has many fewer CH4 sources compared to airflows from East Asia. The CH4 background at the TAP site appeared slightly higher than at the four other sites because the TAP site is located on the coast of South Korea and can be more easily polluted by anthropogenic emissions. Considering the large spatial difference between the CH4 background sites, monthly airflows and source footprints will be used to identify backgrounds for our observation network, with details discussed in the Supplement (Sect. S1, Fig. S3 and Table S1).
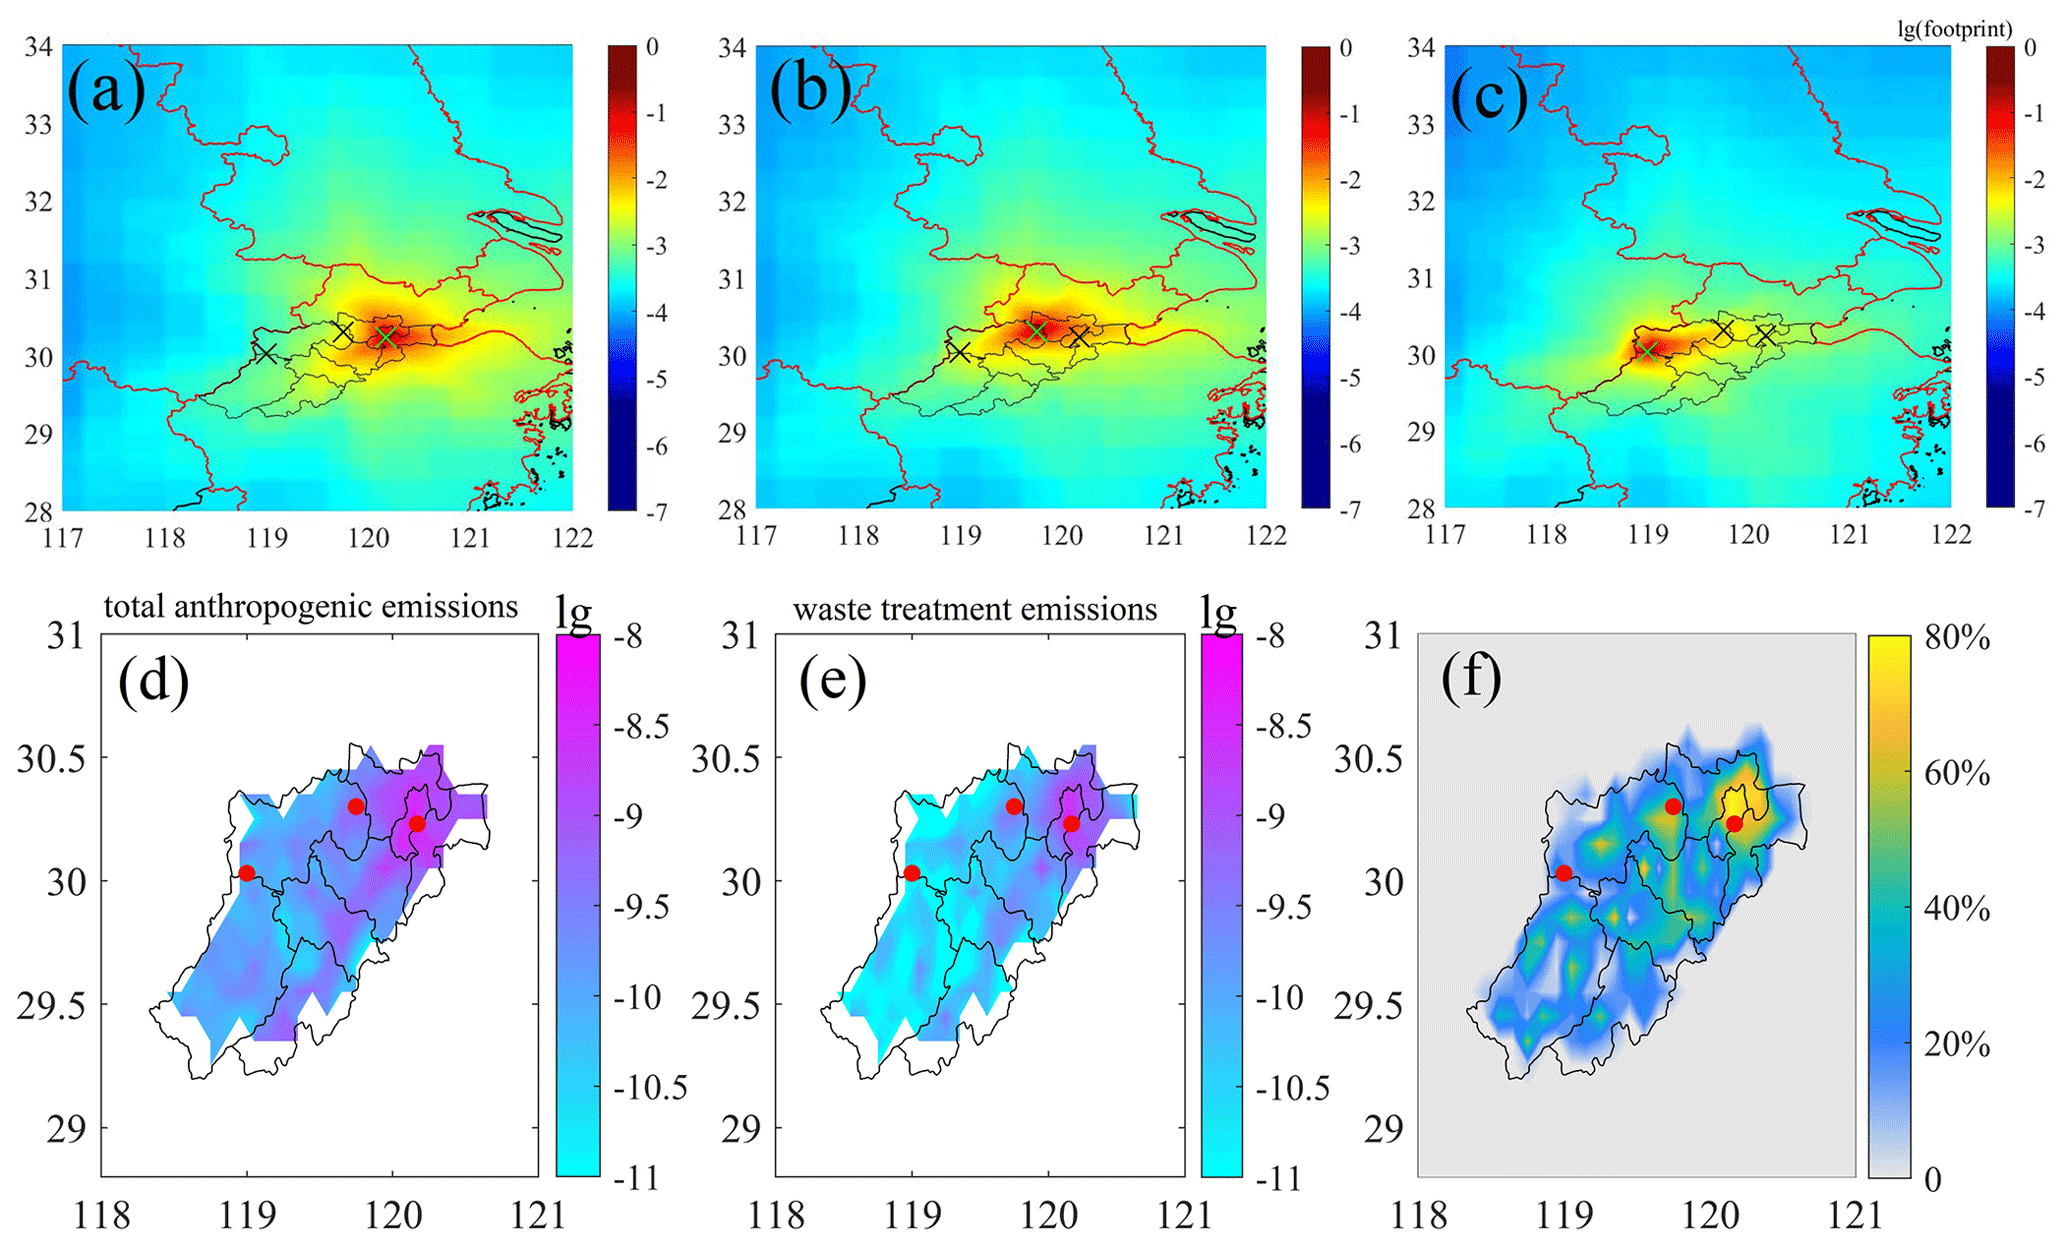
Figure 3Annual averages of the simulated footprint for the (a) Hangzhou site, (b) Linan site and (c) Damingshan site, where the green symbol “×” indicates the receptor location in each panel; (d) total anthropogenic CH4 emissions in the EDGAR v6.0 inventory; (e) waste treatment CH4 emissions in the EDGAR v6.0 inventory; (f) waste treatment as a proportion of total anthropogenic CH4 emissions, where red dots represent the three sites. Units for the footprint: ppm m2 s mol−1; units for emissions: kg m−2 s−1. The divisions in Hangzhou are different districts.
3.2 Concentration footprint and the a priori emissions
To illustrate the potential source regions of the three sites, annual averages of simulated footprints for each site are displayed in Fig. 3a–c. The results show their footprint distributions were quite similar because of close distance, but we also notice there were obvious differences in the footprint strengths (i.e., the area covered by red color) with Hangzhou site > Linan site > Damingshan site. The reason why the footprint at the Damingshan site is the lowest can be explained by the fact that the observations were collected at 1500 m height, and it was not easy to receive emissions signals within the boundary layer at that height. Besides, the Hangzhou site is located in the core urban area of Hangzhou, and it will show significant diurnal variation in the PBLH, especially since it has a higher nighttime PBLH caused by anthropogenic heat and high buildings than grassland/farmland, which dominate the Linan site and Damingshan site. Hence more air particles can remain within the PBLH and generate stronger footprint.
The a priori EDGAR CH4 emissions for total anthropogenic categories and waste treatment and their proportions are given in Fig. 3d–f. Significant gradients are observed from higher emissions in the east to lower emissions in the west, which is consistent with our three tower-based sets of observations. And the CH4 emissions for waste treatment indicated similar spatial distributions with urban land use and population density (Fig. 1c–d). Moreover, waste treatment seems to emit CH4 as area sources instead of point sources from waste treatment super-plants. Although a few previous studies found limitations of the EDGAR inventory in capturing CH4 emission patterns in some urban areas (Pak et al., 2021), here considering the fact that locations of landfills (Fig. 1b–d), which comprise the largest anthropogenic CH4 emitter in Hangzhou, are very close to the core urban area and highly consistent with EDGAR, we believe the spatial patterns of EDGAR in the study region to be reliable. We should note the Chinese government has constructed waste separation stations in each city with a density of one station per 150–200 households (around 450–800 people); usually these waste separation stations are full with waste because domestic garbage can be generated every day. They do not have gas collection systems and can emit large quantities of CH4 emissions caused by daily biomass waste as area sources (Tian et al., 2022). Besides, there is only one landfill that has a gas collection system; the reported gas collection efficiency was less than 80 %, which also indicates a large quantity of CH4 emissions will be directly emitted into the atmosphere and the emissions will be influenced by climate change. These above analyses also imply the Hangzhou site can observe higher emissions from both waste treatment and total anthropogenic emissions, which will be discussed and quantified later.
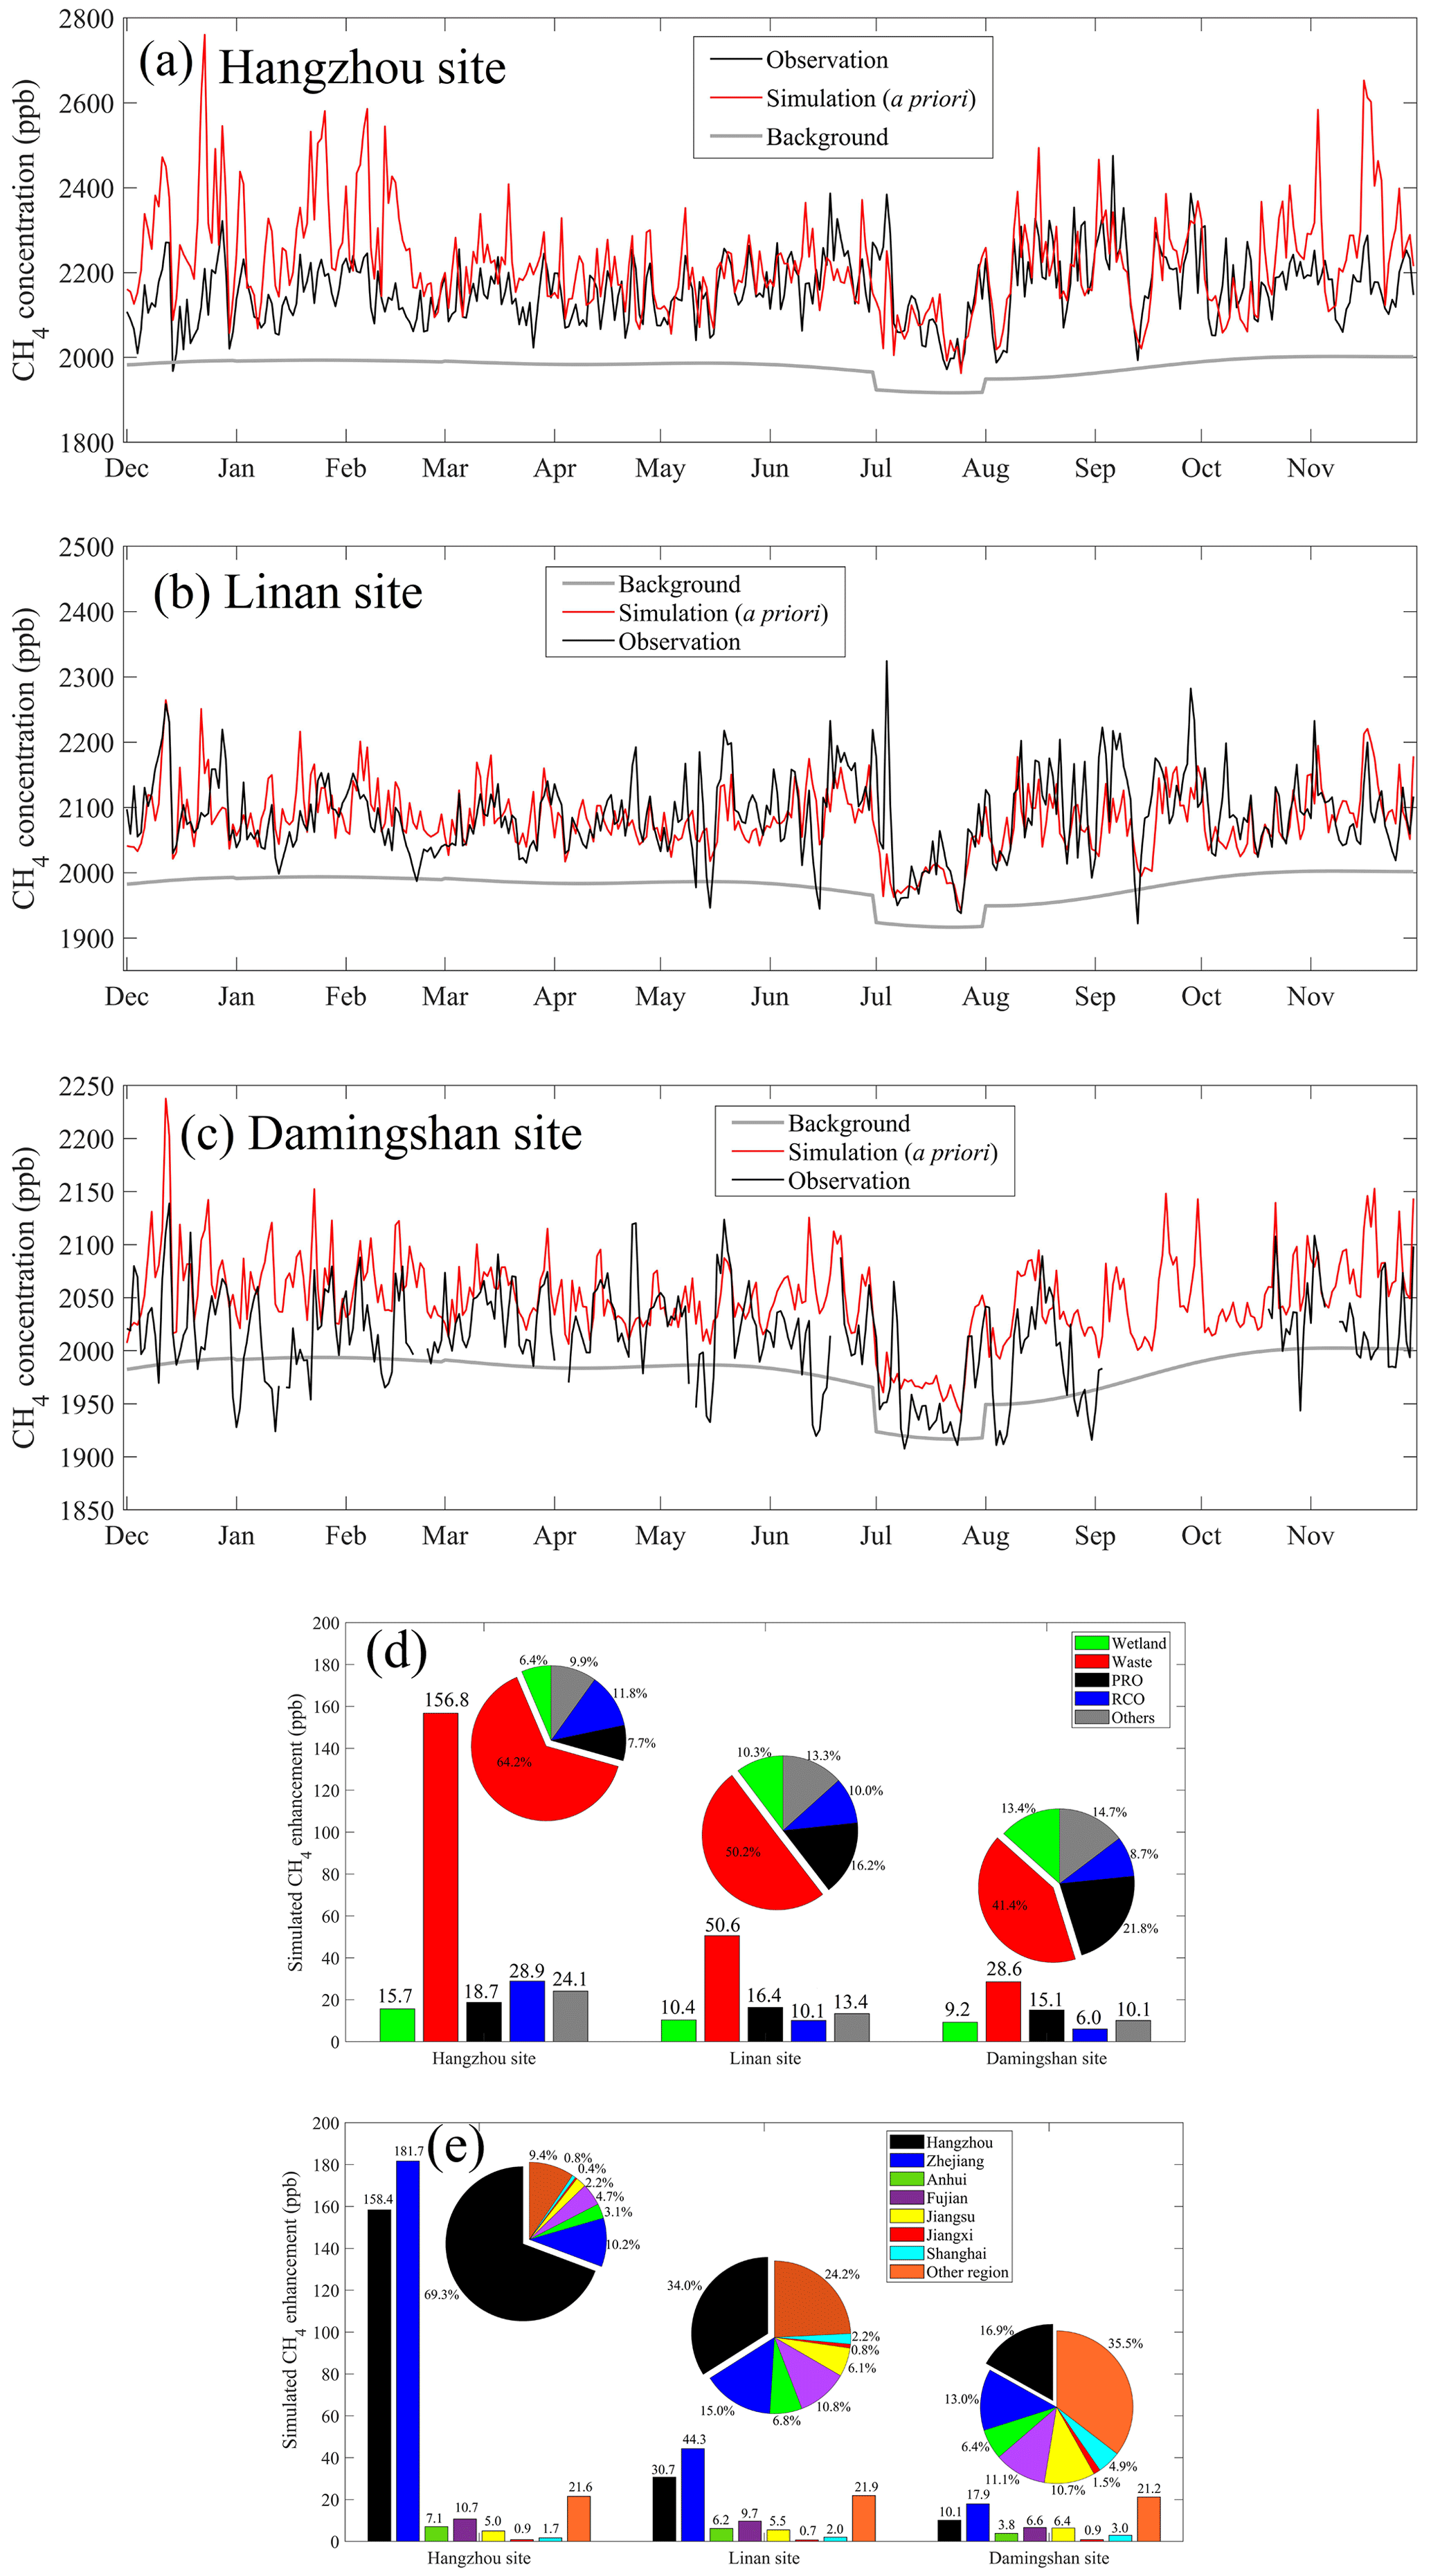
Figure 4Comparisons between daily CH4 observations and simulations for the (a) Hangzhou site, (b) Linan site and (c) Damingshan site; (d) simulated CH4 enhancements from the main emission categories; (e) simulated anthropogenic CH4 enhancement from different regions and its proportions. Note the blue color for the bar charts includes all contributions from Zhejiang, including Hangzhou, and the blue regions in the pie charts represent the remaining regions of Zhejiang minus Hangzhou.
3.3 Simulation of CH4 concentrations and their components for three sites
Comparisons between observed and simulated daily CH4 concentration averages are displayed in Fig. 4a–c and hourly concentrations in Fig. S4 for three sites. First, the hourly simulations in Fig. S4 show high consistency when only comparing the temporal patterns with observations, indicating good performance of model transport simulations as confirmed in Fig. S5 for evaluating meteorological fields. But the relative variations display obvious differences among the three sites for daily averages in Fig. 4a–c. The mean bias (MB), root mean square error (RMSE), and correlation coefficient (R) between daily observations and a priori simulations were 64.1, 129.2 and 0.44, respectively, for the Hangzhou site; −6.0, 57.1 ppb, and 0.50 for the Linan site; and 36.2, 55.6 ppb and 0.54 for the Damingshan site. As for the Hangzhou site, simulated CH4 concentrations show obvious overestimation from October to April, and the overestimation is also found at the Damingshan site. We found that the simulations at the Linan site showed overall good agreement with observation, although still with slight overestimation from January to April and underestimation from May to September. Considering the source area contributions for the three sites are different, these differences among the three sites indicated the bias in CH4 emission largely varied from Hangzhou to a larger regional scale.
To further quantify detailed contributions from different regions and categories to each tower site, CH4 enhancements from different categories and source areas were also simulated separately for the three sites. As displayed in Fig. 4d–e, the simulated a priori total enhancements at the Hangzhou site, Linan site and Damingshan site were 244.3, 100.8 and 69.0 ppb, respectively. We also found contributions by waste treatments dominated the total enhancements but with obvious differences among the three sites, which varied from the highest of 64.2 % at the Hangzhou site to the lowest of 41.4 % at the Damingshan site. We further calculated anthropogenic contributions from Hangzhou (excluding wetlands because of coarser spatial resolution for Hangzhou) and other provinces, which were 158.4 ppb at the Hangzhou site, 30.7 ppb at the Linan site and 10.1 ppb at the Damingshan site. And they accounted for 69.3 %, 34.0 % and 16.9 % of total anthropogenic enhancements at the corresponding sites. These results indicate the CH4 observations at the Hangzhou site, which is located in the core urban region, are more influenced by local emissions (mainly for waste treatment which will be discussed later) and contain much higher enhancements than the other two sites. The relative contributions from Hangzhou to observations at the Hangzhou site, Linan site and Damingshan site were 158.4 ppb (69.3 % of total CH4 enhancement), 30.7 ppb (34.0 % of total CH4 enhancement) and 10.1 ppb (16.9 % of total CH4 enhancement), respectively. The relative contributions from Zhejiang Province to observations at the Hangzhou site, Linan site and Damingshan site were 181.7 ppb (79.5 % of total CH4 enhancement), 44.3 ppb (49.0 % of total CH4 enhancement) and 17.9 ppb (29.9 % of total CH4 enhancement), respectively. These different values also imply that the observations at Linan and Damingshan sites can represent CH4 emissions of much larger region such as Zhejiang Province or the YRD area compared to Hangzhou (Fig. 4e).
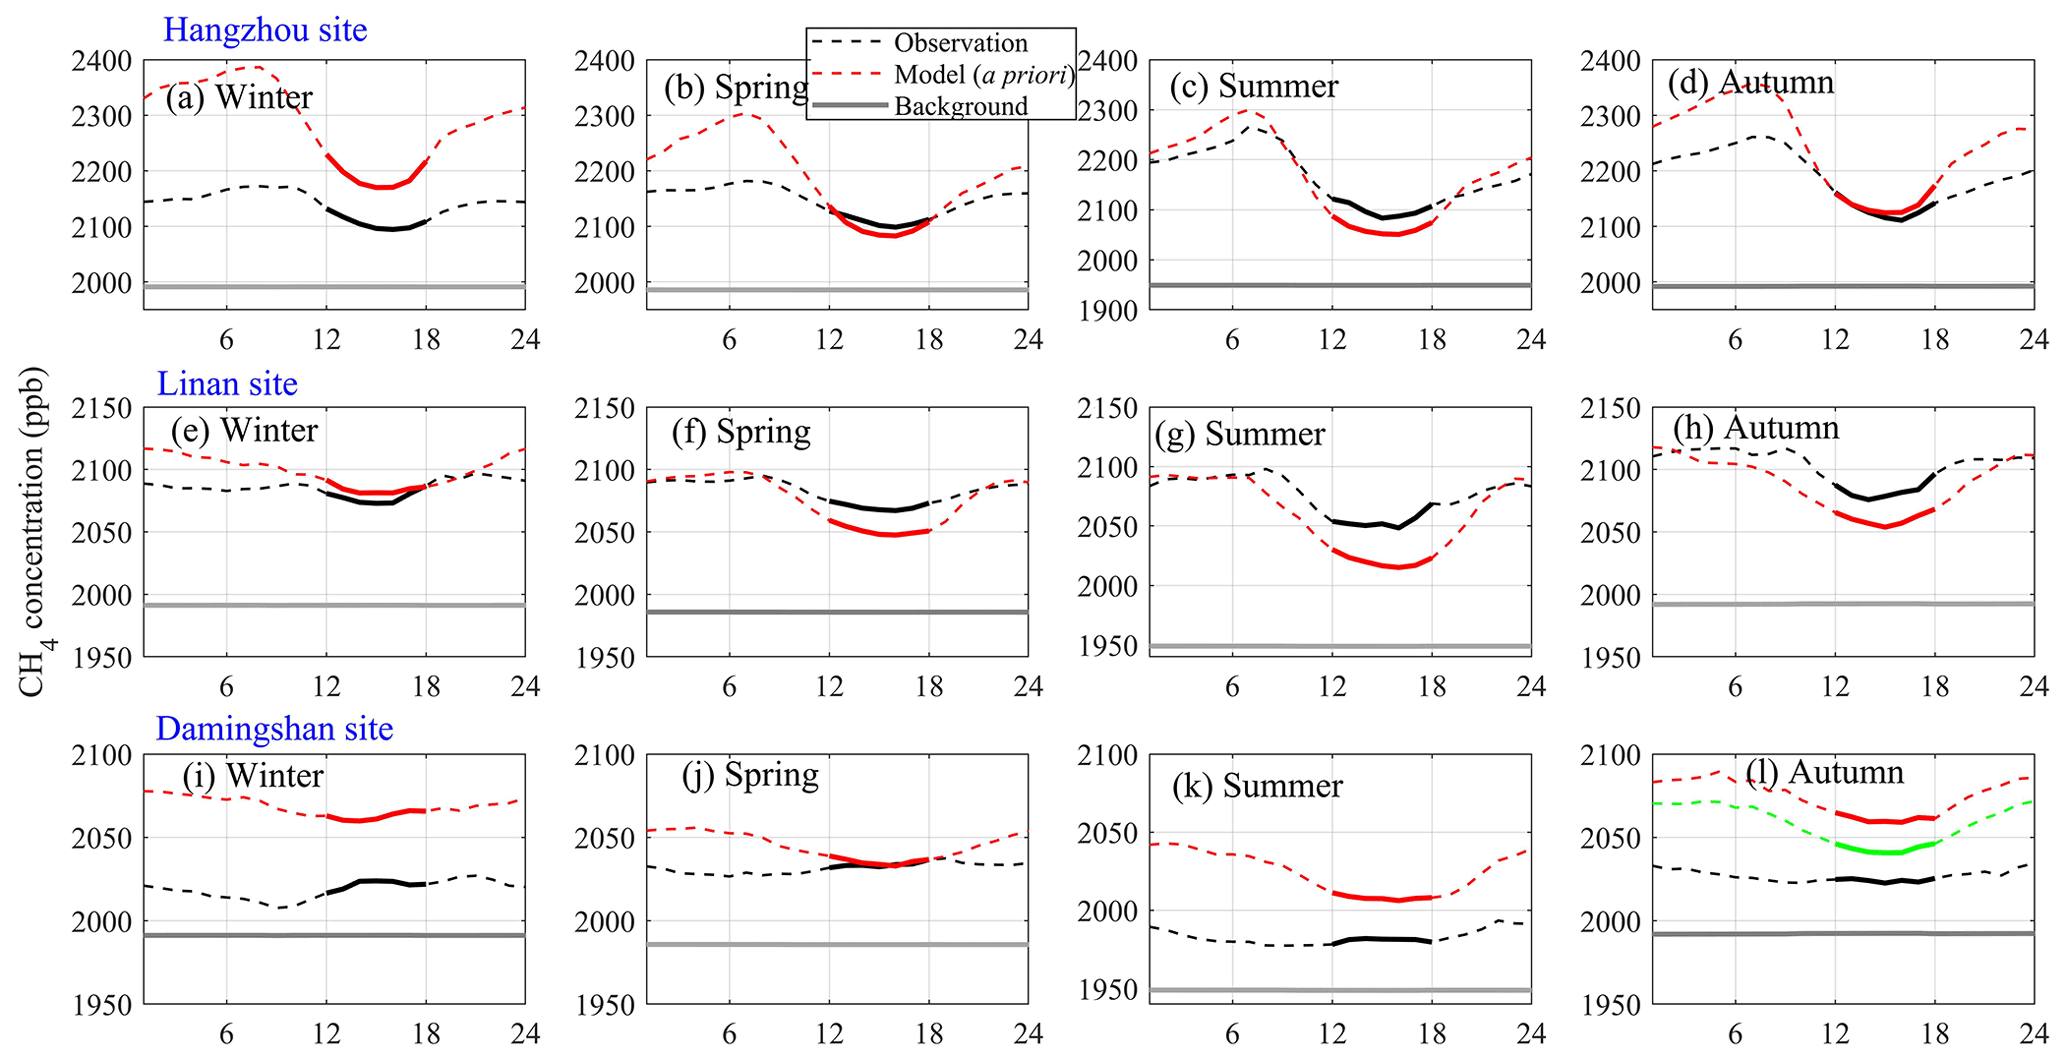
Figure 5Seasonally averaged diurnal variations for the Hangzhou site in (a) winter, (b) spring, (c) summer and (d) autumn; for the Linan site in (e) winter, (f) spring, (g) summer and (h) autumn; and for the Damingshan site in (i) winter, (j) spring, (k) summer and (l) autumn. Note that because of 2 months of a data gap in autumn for the Damingshan site, the green line is for all September–November simulations, the red line only represents the simulation of the corresponding period for available observation data, and bold lines represent data between 12:00 and 18:00 LT.
The seasonally averaged diurnal variations for both observations and simulations are also displayed in Fig. 5 for the three sites. Although many previous studies only used daytime observations and simulations to evaluate a priori emissions bias and constrain emissions (Sargent et al., 2018; Hu et al., 2022), these studies were based on the assumption that the diurnal scaling factors used for the a priori emissions are right (i.e., for anthropogenic CO2) or that the emissions do not have obvious diurnal variations (i.e., emissions from industries or manufacturing). As concluded above, the main CH4 component in Hangzhou was waste treatment (Fig. 3f), which should be highly sensitive to temperature and indicates obvious diurnal and seasonal patterns (Mønster et al., 2019; Kumar et al., 2022). And total CH4 emissions will be overestimated when using daytime emissions to represent all-day averages. Further, we found strong similarities of the diurnal variations between observations and simulations for the three sites, but there are still some discrepancies, especially the observations at the Linan site being generally higher than simulations from spring to autumn for both all-day and midday averages.
Hence, our preliminary conclusions were that the a priori CH4 emissions were generally overestimated for Hangzhou but underestimated in the larger region of Zhejiang or the YRD area. We also found simulations were higher than observations for all seasons at the Damingshan site, and this can be explained by the complex topography around the Damingshan site, where elevations changed from 0 to 1600 m within the site's grid cell of 9 km ( as displayed in Fig. 1b, and the mountain–valley wind patterns and PBLH changes can only be resolved with much higher spatial resolutions of <1 km. Hence the use of coarse resolutions (i.e., 9 km in this study) in the mountainous regions introduces large bias in simulating concentration and emission inversion, as also recently found in China for CO2 as “aggregation error” (Agustí-Panareda et al., 2019; Wang et al., 2022), so observations at the Damingshan site will not be used in emission inversions in this study.
3.4 Constraints on anthropogenic CH4 emissions
As displayed in Figs. 4a and 5a and concluded in Sect. 3.3, simulations using a priori CH4 emissions show obvious overestimation, especially from October to April at the Hangzhou site, and emissions were also overestimated in winter and underestimated from spring to autumn at the Linan site. Note this bias can be attributed to a priori emissions or meteorological simulations. Our previous studies in the YRD have evaluated the meteorological simulations by using the same physical parameterization schemes, which showed high consistency with observations (Hu et al., 2019, 2021, 2022; Huang et al., 2021). We also evaluated the meteorological simulations with observations and confirmed the good model performance (Fig. S5). Note that PBLH simulations are important in evaluating model performance. However, we only have 4 months of hourly PBLH observations, 1 month in each season. These hourly PBLH observations were used to evaluate the general performance of the WRF model. As displayed in Fig. S6, it shows overall good performance for both daytime and nighttime PBLH variations. Furthermore, we found no monthly variations in EDGAR v6.0 CH4 emissions for waste treatment, which contributed 64.2 % to the annual CH4 enhancement average and was much higher in winter (Figs. S7–S8). The CH4 emissions from waste treatment are produced by microbial processes, which should be affected by meteorological conditions, especially by seasonal temperature changes. Hence our assumption is that the biases in both their seasonality and their annual average lead to large overestimation/underestimation in the simulated CH4 concentration. Besides, bias in other anthropogenic emissions and wetlands can also partly contribute to the bias of the simulated CH4 concentration.
To quantify the bias sources and constrain corresponding a priori emissions for Hangzhou, we applied the scaling factor Bayesian inversion approach with three different cases as introduced in the “Materials and method” section. Instead of only using daytime CH4 observations to constrain a priori emissions, we choose to use all-day hourly data at the Hangzhou site to constrain emissions for Hangzhou, for the following three reasons: (1) the enhancements contributed by Hangzhou at the Hangzhou site were 69.3 %, much larger than the 34.0 % and 16.9 % for the Linan site and Damingshan site, respectively. (2) The waste treatment dominated anthropogenic CH4 emissions in Hangzhou, which is caused by biological processes and should be temperature dependent. Since the observed temperature varied diurnally by 20 ∘C, the use of only daytime observations without considering diurnal CH4 emissions will bring significant bias when using derived daytime emissions to represent all-day averages. The annual averages of daytime and all-day average concentrations were 2112.4 and 2156.0 ppb at the Hangzhou site, respectively; the reason why higher emissions in the daytime correspond to lower concentration than in all-day and nighttime conditions is that a lower PBLH in the nighttime will lead to higher concentration, and more comparisons between daytime and all-day average concentrations are displayed in Fig. 5 for the three sites. (3) Previous studies using daytime observations were mainly conducted for regions dominated by industry or energy production, which have much smaller diurnal variations than waste treatment, as stated above (Mønster et al., 2019; Kumar et al., 2022).
Table 1The a posteriori SFs for different categories in three cases for Hangzhou. Wetland: natural and agricultural wetland; waste: waste treatment; PRO: fuel exploitation; RCO: energy for buildings; others: the remaining anthropogenic emissions. For Case 1, there are three categories and 300 % uncertainty for waste treatment. For Case 2, there are five categories, and the a priori uncertainty of 200 % was used for each category. For Case 3, there are three categories and 200 % uncertainty for waste treatment.
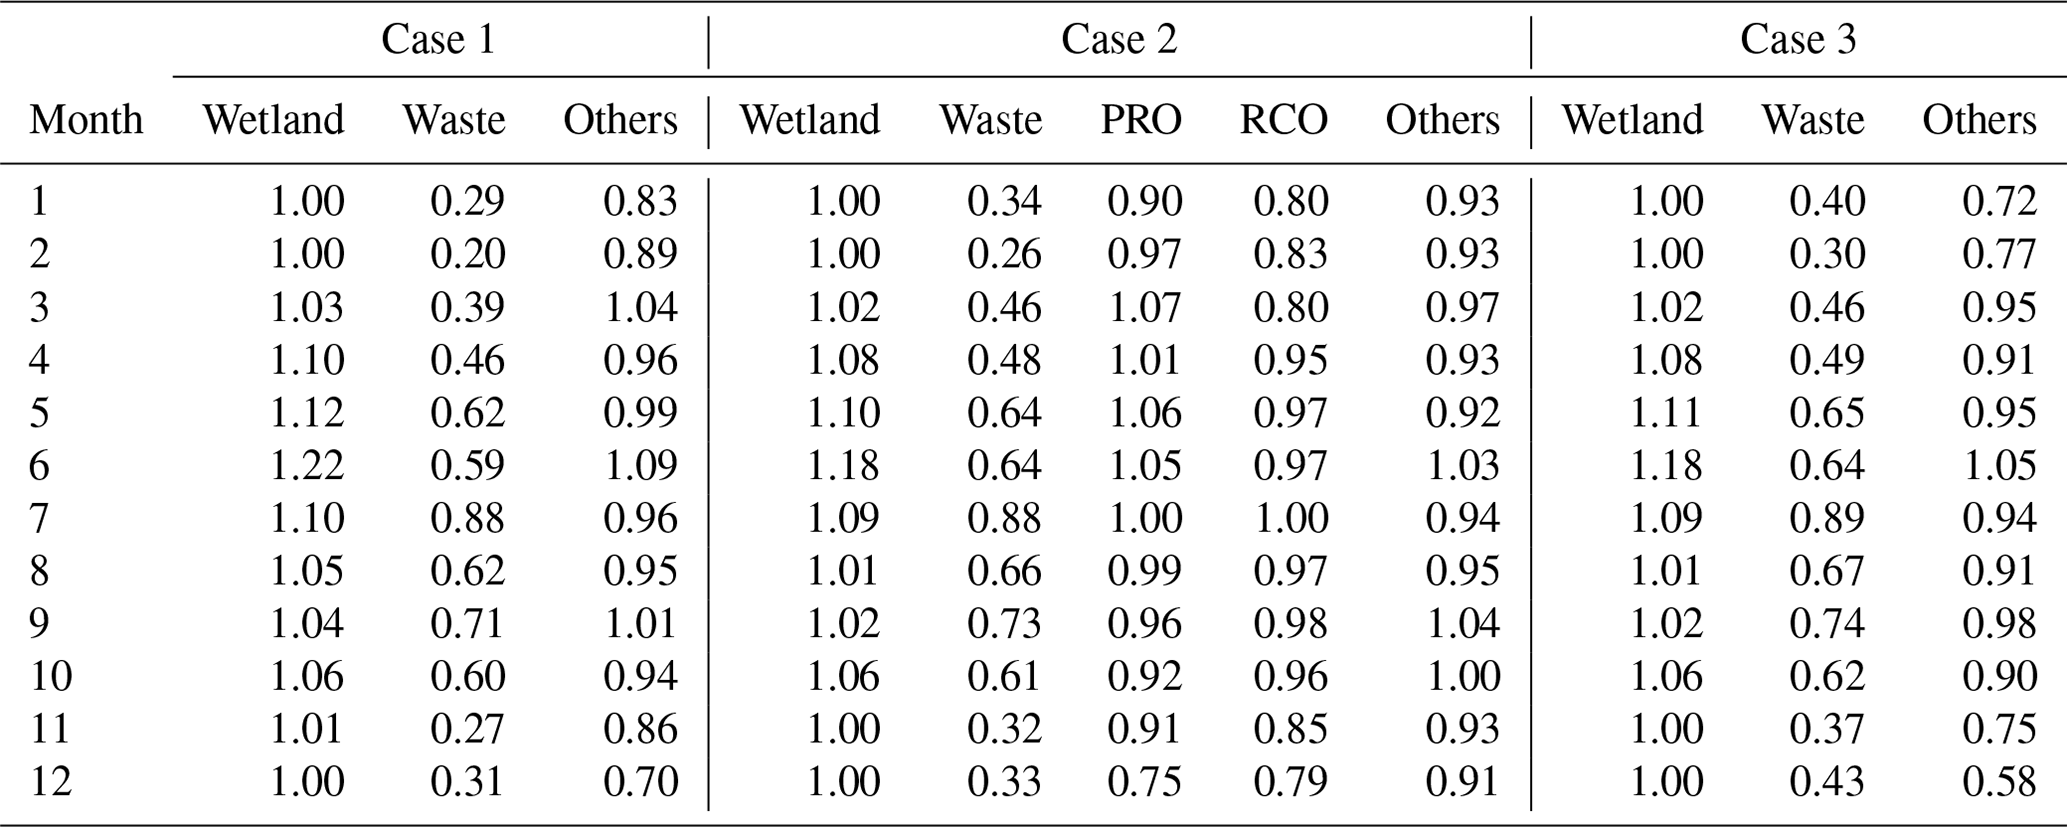
The derived monthly a posteriori SFs for each emission source are displayed in Table 1 for Hangzhou. The results show that the a posteriori SFs for waste treatment are much smaller in winter and higher in summer, indicating obvious seasonality, and the overestimation in winter was mainly contributed by waste treatment. The annual mean a posteriori SFs for waste treatment vary between 0.50 and 0.56 in all three cases, illustrating overestimation in the annual average for the a priori waste treatment emissions. Besides, the annual mean a posteriori SFs vary between 0.87 and 0.94 for the rest of the total anthropogenic categories (excluding agricultural soil) and are 0.97 for PRO (fuel exploitation) and 0.91 for RCO (energy for buildings); the annual mean a posteriori SF is 1.05 for wetland (including agricultural soil and natural wetland). These a posteriori SFs for the remaining anthropogenic categories and wetland indicate much smaller bias than waste treatment. The monthly a posteriori SFs for PRO and RCO also illustrate obvious seasonal variations but are still smaller than the a priori seasonality in the inventory (Fig. S9). Although the evaluations of hourly PBLH simulations have illustrated good performance in both daytime and nighttime (Fig. S6), we also conducted inversions by only using daytime observations to constrain CH4 emissions. Considering results from Case 2 are in between Case 1 and Case 3, here we only display the results from Case 1 and Case 3 (Table S2); they indicate similar seasonal variations to using all-day observations. We notice the values are larger than the latter, which is reasonable because CH4 emissions in the daytime should be larger than all-day and nighttime emissions. In general, a posteriori SFs, by using all-day concentration observations, will be used to represent total CH4 emissions from monthly to annual scales.
To evaluate whether the a posteriori SFs have significantly improved CH4 emissions, we used these SFs to derive the a posteriori emissions and re-simulated hourly concentrations in Fig. 6 (and daily averages in Fig. S9). Results show the hourly overestimation by using a priori emissions is largely reduced by using a posteriori emissions when compared with observations in Fig. 6a–b, and the regression slopes between daily averaged observations and simulations decrease from 1.51 (± 0.15) for a priori simulations to 0.85 (± 0.07) for a posteriori simulations in Fig. 6c. The mean bias (MB), root mean square error (RMSE) and correlation coefficient (R) between daily observations and a priori simulations are 64.1, 129.2 ppb and 0.44, respectively, and these statistics change to −22.2, 72.3 ppb and 0.58 for a posteriori simulations. These results indicate the a posteriori SFs obviously decrease the bias in a priori emissions and are closer to observations, when considering there are no system biases in the simulated monthly PBLH.
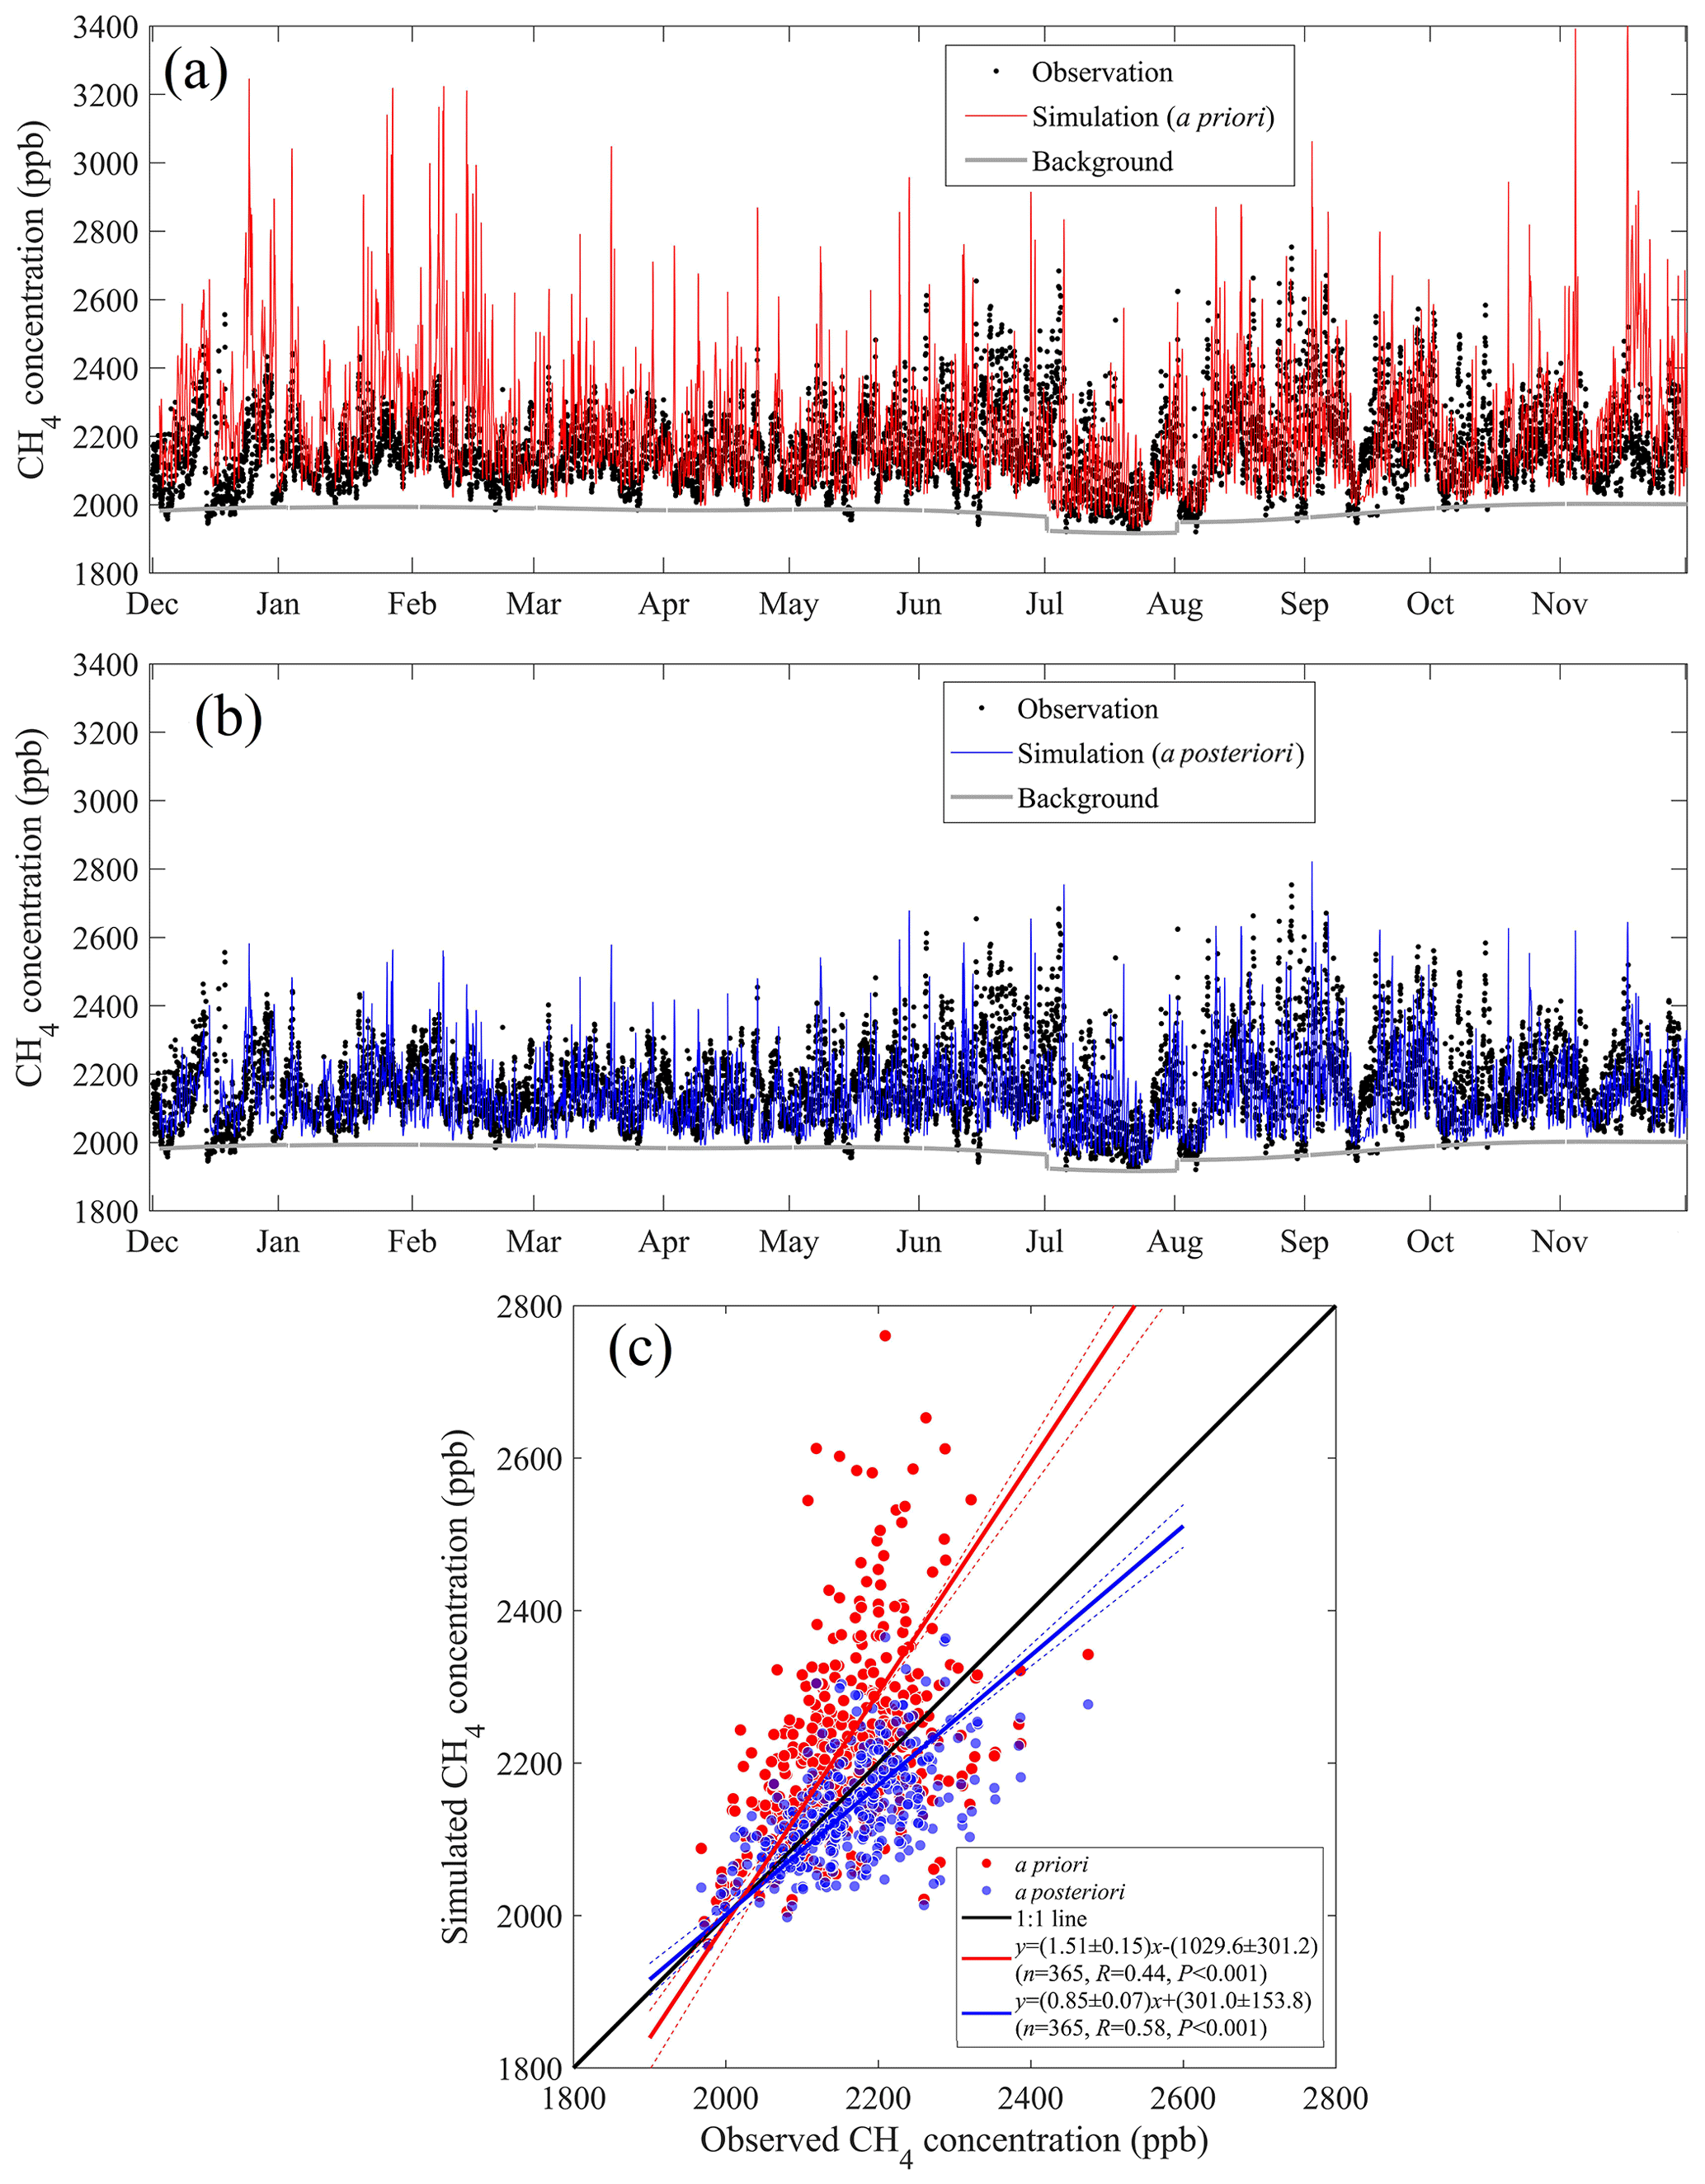
Figure 6Comparisons of hourly CH4 concentrations at the Hangzhou site between observations and simulations by using (a) a priori and (b) a posteriori emissions; (c) scatterplots of daily CH4 averages by using a priori and a posteriori emissions.
Comparisons of monthly CH4 emissions between a priori and a posteriori waste treatment and other anthropogenic sources (excluding agricultural soil) in Hangzhou are displayed in Figs. 7a and S7. For the a priori inventory, there are no seasonal variations for waste treatment with constant monthly emissions of 8.67×10³ t, and other anthropogenic sources show seasonality with much higher levels in winter (i.e., 5.22×10³ t in January) than in summer (i.e., 3.06×10³ t in August). The seasonality in the a priori EDGAR inventory is mainly dominated by RCO (energy for buildings), with proportions of total anthropogenic emissions changing from the highest value of 22 % in winter to the lowest values of 8 % in summer. Such information indicates the a priori inventory assigned more leaks from natural gas distribution infrastructure in winter than in summer. As discussed above, constant emissions from waste treatment should be wrong because of their large temperature sensitivity, and the observed monthly temperature difference between summer and winter was larger than 25 ∘C in Hangzhou in the study period. After including the constraints from the observed concentrations, the a posteriori emissions for waste treatment show obvious seasonality with the highest emission in July ( t) and lowest emission in February ( t). And emissions from other anthropogenic categories show much smaller seasonality (highest emission in January of t and lowest emission in August of t) than a priori emissions. In general, the annual emissions from waste treatment were 10.4×10⁴ t in the a priori EDGAR inventory and decreased to t for the a posteriori emissions, a decrease of 47.1 %. The a priori emissions from other anthropogenic sources were 4.5×10⁴ t and only slightly decrease to t for the a posteriori emissions, an 8.9 % decrease. Waste treatment as a proportion of total anthropogenic emissions decreases from 69.3 % a priori to 57.3 % a posteriori. To summarize, the annual total anthropogenic CH4 emissions (excluding agricultural soil) decrease from 15.0×10⁴ t to t, indicating overestimation of 36.0 % in Hangzhou for the a priori emissions.
However, as concluded above the observations and simulations at the Linan site, which represents the much larger region of Zhejiang Province or the YRD area, data from that site indicated slightly different results, i.e., that CH4 simulations were underestimated from spring to autumn and overestimated in winter (Figs. 4b and 5e–h). Here we used the multiplicative scaling factor (MSF) method and observations at the Linan site to derive SFs at the seasonal scale (Sargent et al., 2018; He et al., 2020), where we used 10 ppb as the potential CH4 background uncertainty in winter, spring and autumn and 20 ppb in summer; see details in the Supplement (Sect. S2). The derived a posteriori SFs were 0.87 (±0.08), 1.07 (±0.11), 1.19 (±0.24) and 1.16 (±0.11) for winter, spring, summer and autumn, respectively. The results for the Linan site showed similar seasonal variations to those found for Hangzhou with 1.07 (±0.14) of a priori anthropogenic emissions for the annual average. Our observations at the Hangzhou site and Linan site together indicate the a priori emissions were largely biased on both seasonal and annual scales, and the annual anthropogenic CH4 emissions were largely overestimated by 36.0 % in Hangzhou but were underestimated by 7.0 % in the larger region of Zhejiang Province or the YRD area.
3.5 Temperature sensitivity of waste treatment CH4 EFs and projected changes
Although the derived a posteriori monthly SFs on waste treatment reflected changes to emissions, considering the monthly activity data do not have obvious monthly changes, these SFs can mainly reflect relative variations in monthly EFs and contain meteorologically dominated changes especially for temperature. To evaluate the temperature sensitivity of waste treatment CH4 EFs, we first calculated the normalized monthly SFs by dividing monthly SFs by annual averages (Tables 1 and S3) and quantified the relationship between observed T2 m and normalized SFs. Note that the decomposition of organic waste by methanogens mostly takes places at some depth within the landfills and temperature can be higher than at the surface; hence the temperature within landfills should be much more related to methanogen activities and CH4 emissions than T2 m. However, considering (1) we do not have direct temperature observations under landfills, (2) T2 m can be used as an indicator of methanogen activities and (3) T2 m is a commonly used meteorological measure that can be provided for future RCP scenarios, the relationship between waste CH4 emissions and T2 m is constructed and used to predict how CH4 EFs will change in different climate scenarios. The normalized SFs illustrate a significant linear relationship with monthly T2 m (Fig. 7b), where the slopes imply that normalized SFs (and EFs) will increase by 38 %–50 % with temperature increase by 10 ∘C at the city scale. We also analyzed the temperature sensitivity by only using daytime CH4 observations and simulations in Fig. S10; this still shows a strong linear relationship between normalized SFs and T2 m, with slopes of 0.046 and 0.060. These results are highly consistent with results using all-day observations of 0.038 and 0.050, indicating similar results between using all-day observations and using only daytime observations and less influence of simulated nighttime PBLH bias on the corresponding temperature sensitivity.
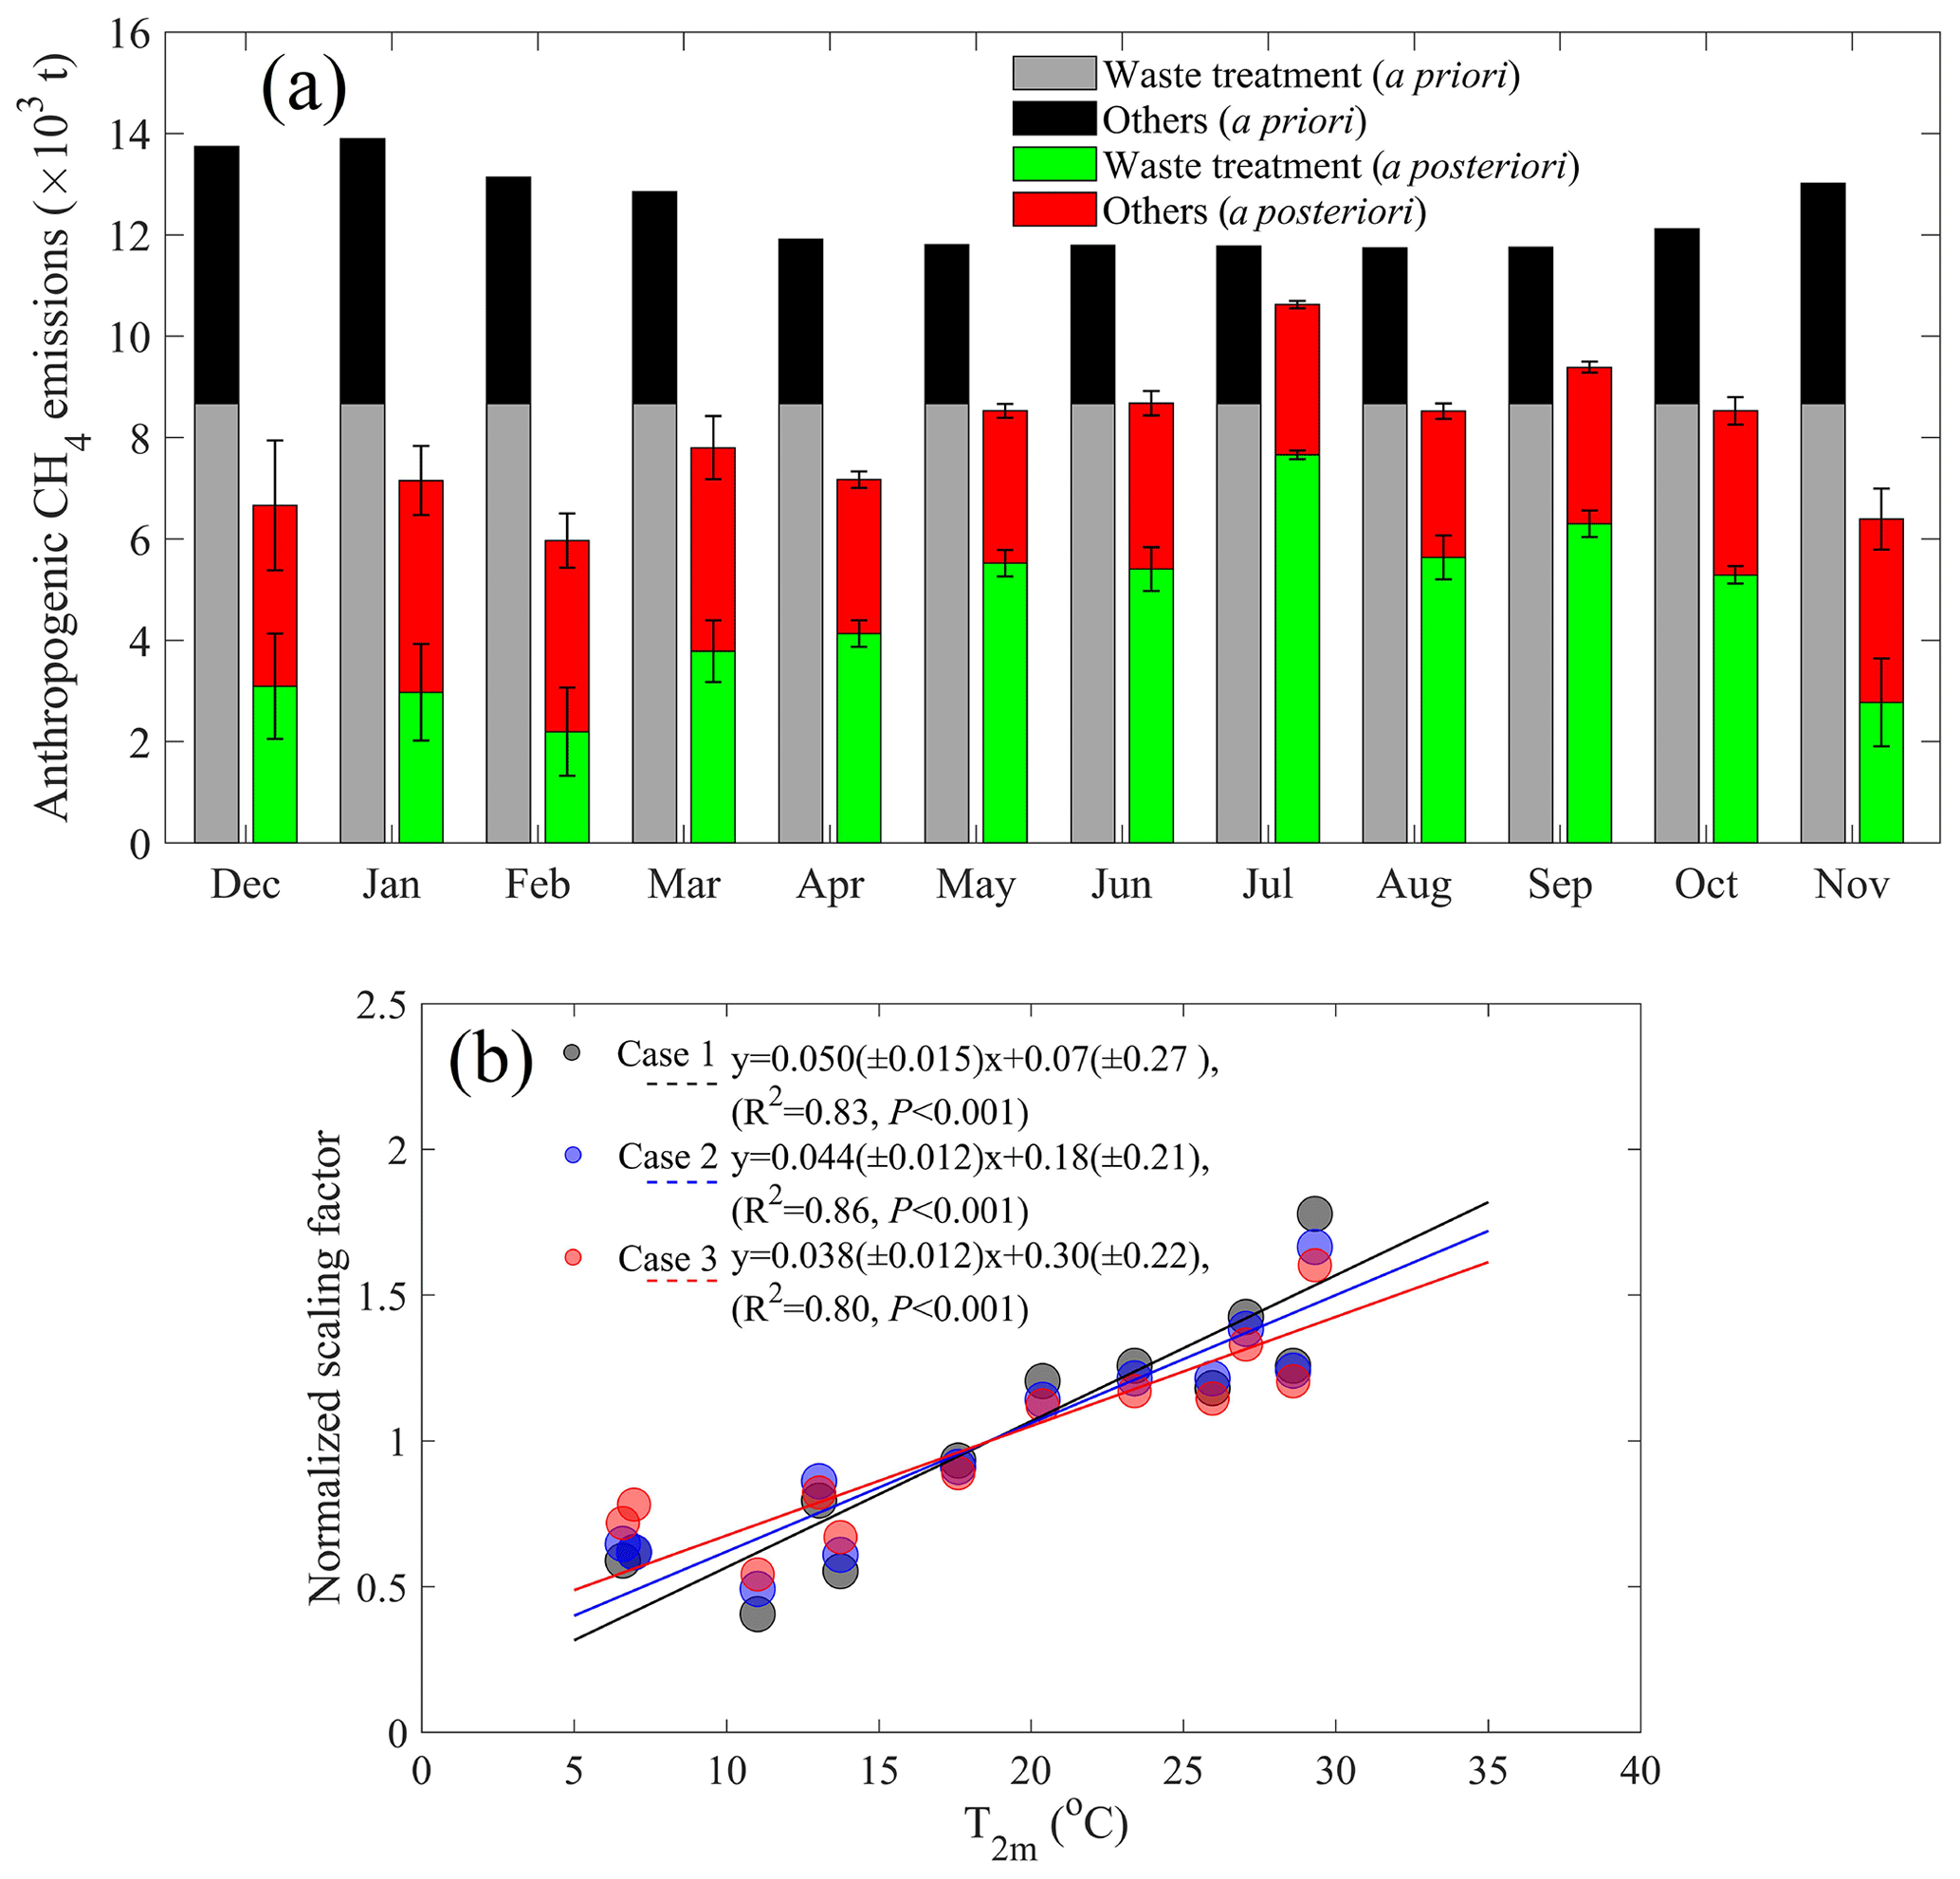
Figure 7(a) Monthly anthropogenic (excluding agricultural soil) CH4 emissions for a priori and a posteriori emissions for Hangzhou; (b) relationship between the monthly a posteriori CH4 emissions and temperature for the three cases discussed in Sect. 2.3 of this text.
We should note the precipitation, soil water content and atmospheric pressure can also have an obvious influence on CH4 emissions, and considering the fact that we have not conducted field measurement in landfills and landfills are usually covered by metal or plastic in China to avoid the spread of odors, reanalysis data cannot represent real soil water contents in these site-scale landfills. Precipitation and atmospheric pressure show an obvious linear relationship with temperature as displayed in Fig. S11. They display a positive linear relationship between precipitation (affecting water content) and T2 m and a negative linear relationship between monthly averaged atmospheric pressure and T2 m. We also found a negative relationship between atmospheric pressure and normalized SFs and a positive relationship between T2 m and normalized SFs (Figs. 7b and S11). Considering air temperature always displays a negative relationship with atmospheric pressure as warmer air temperature coincides with lighter air mass and lower atmospheric pressure in summer as displayed in Fig. S11b and colder air temperature coincides with heavier air mass and higher atmospheric pressure in winter, the temperature can be used to represent the co-influence of both temperature and atmospheric pressure, and we only focus on the influence of temperature on CH4 emissions and will add more supporting data in following studies.
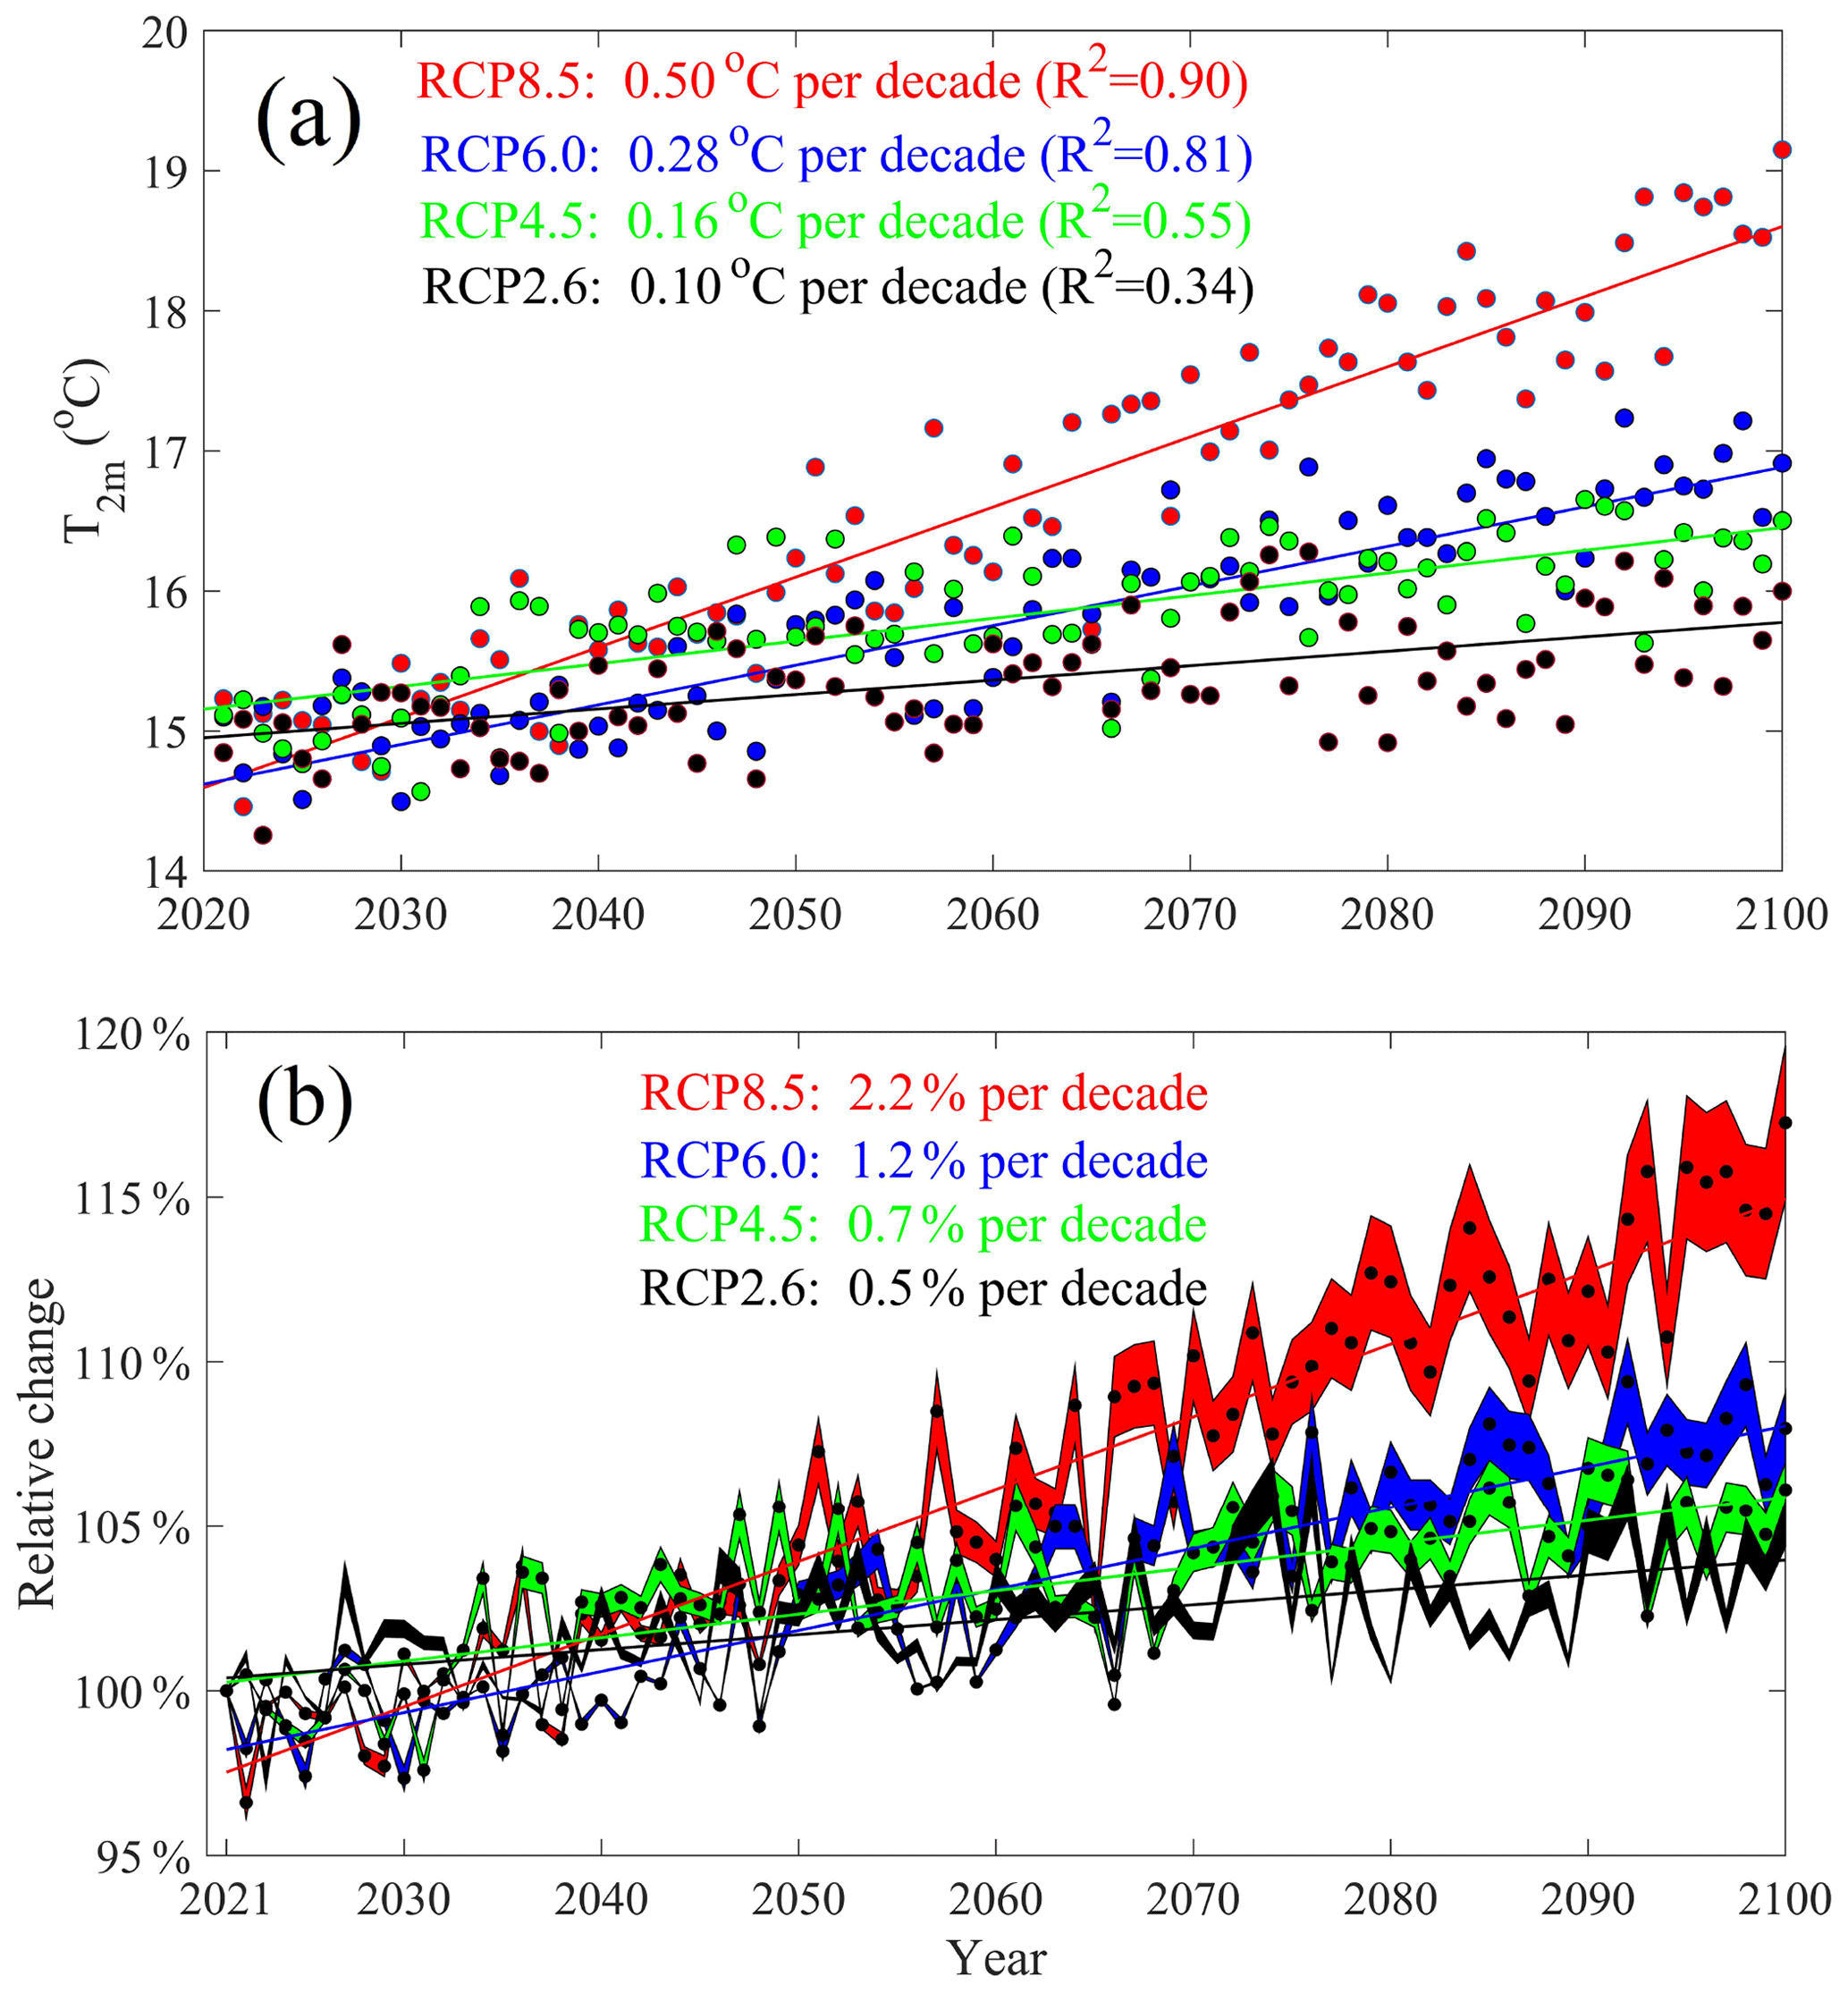
Figure 8(a) Annual air temperature from the year 2021 to 2100 for four different global warming scenarios for Hangzhou. (b) The projected relative change in waste treatment CH4 emissions (or EFs) for Hangzhou; note the shading indicates the extent of the three cases.
Our findings for the high sensitivity of waste treatment CH4 emissions to temperature also suggest a dramatic increase with the projection of future global warming trends. We further derived the T2 m trends for four different RCP scenarios of RCP8.5, RCP6.0, RCP4.5 and RCP2.6 (Fig. 8a). The results show T2 m will increase by 0.50, 0.28, 0.16 and 0.10 ∘C per decade, respectively, for Hangzhou. These different warming trends also indicate a distinct temperature-dominated influence on future CH4 EFs and emissions from waste treatment. We then used the slopes from Fig. 7b and annual temperature from 2021 to 2100 to derive relative changes in EFs in the next 80 years, where observations for the year 2021 were treated as the baseline year. As displayed in Fig. 8b, the EFs in the RCP8.5, RCP6.0, RCP4.5 and RCP2.6 scenarios will increase with the rates of 2.2 %, 1.2 %, 0.7 % and 0.5 % per decade, respectively. And CH4 EFs for waste treatment will be higher by 17.6 %, 9.6 %, 5.6 % and 4.0 % at the end of this century.
The spatial distribution of T2 m trends for all of China is also displayed in Fig. S12, which shows heterogeneous distribution across China for four global warming scenarios. Because eastern China has high population density, with the majority of the national population (Fig. S1), and is responsible for the largest domestic-garbage-induced CH4 emissions (Fig. S2), these combined factors indicate considerable CH4 emission changes from waste treatment in such a temperature-sensitive area. Considering that the temperature sensitivity of waste treatment CH4 EFs is caused by microbial processes at regional scales, the sensitivity can represent general conditions of different cities or landfills. And if we assume the derived temperature sensitivity (increase by 44 % with temperature increases of 10 ∘C on average) is applicable to China as a whole, especially for eastern China, the relative changes in waste treatment CH4 EFs can be calculated by multiplying this value by air temperature trends. The spatial distribution of global-warming-induced EF changes at the end of this century is displayed in Fig. 9. For the RCP2.6 scenario, EFs for waste treatment will slightly increase by 4.0 %–6.5 % in northeastern China and increase by 3.0 %–4.0 % in southeastern China. RCP6.0 also displayed heterogeneous changes in eastern China, with EFs in northeastern China increasing by 10.5 %–13.0 % and in southeastern China by 9.0 %–10.5 %. Relative changes in RCP4.5 and RCP8.5 are more homogeneous for eastern China, which indicates EFs will significantly increase by 5.0 %–7.5 % and 17.5 %–19.5 %, respectively. The largest changes will occur in western China for RCP8.5, with EFs increasing by >20.0 %, but this area has low population density and CH4 emissions, and therefore these effects of global warming can be ignored (Fig. S12). Finally, we should note these derived relative changes are only caused by global warming, and the influence of activity data, management technology and other factors is not considered and out of the scope of this study.
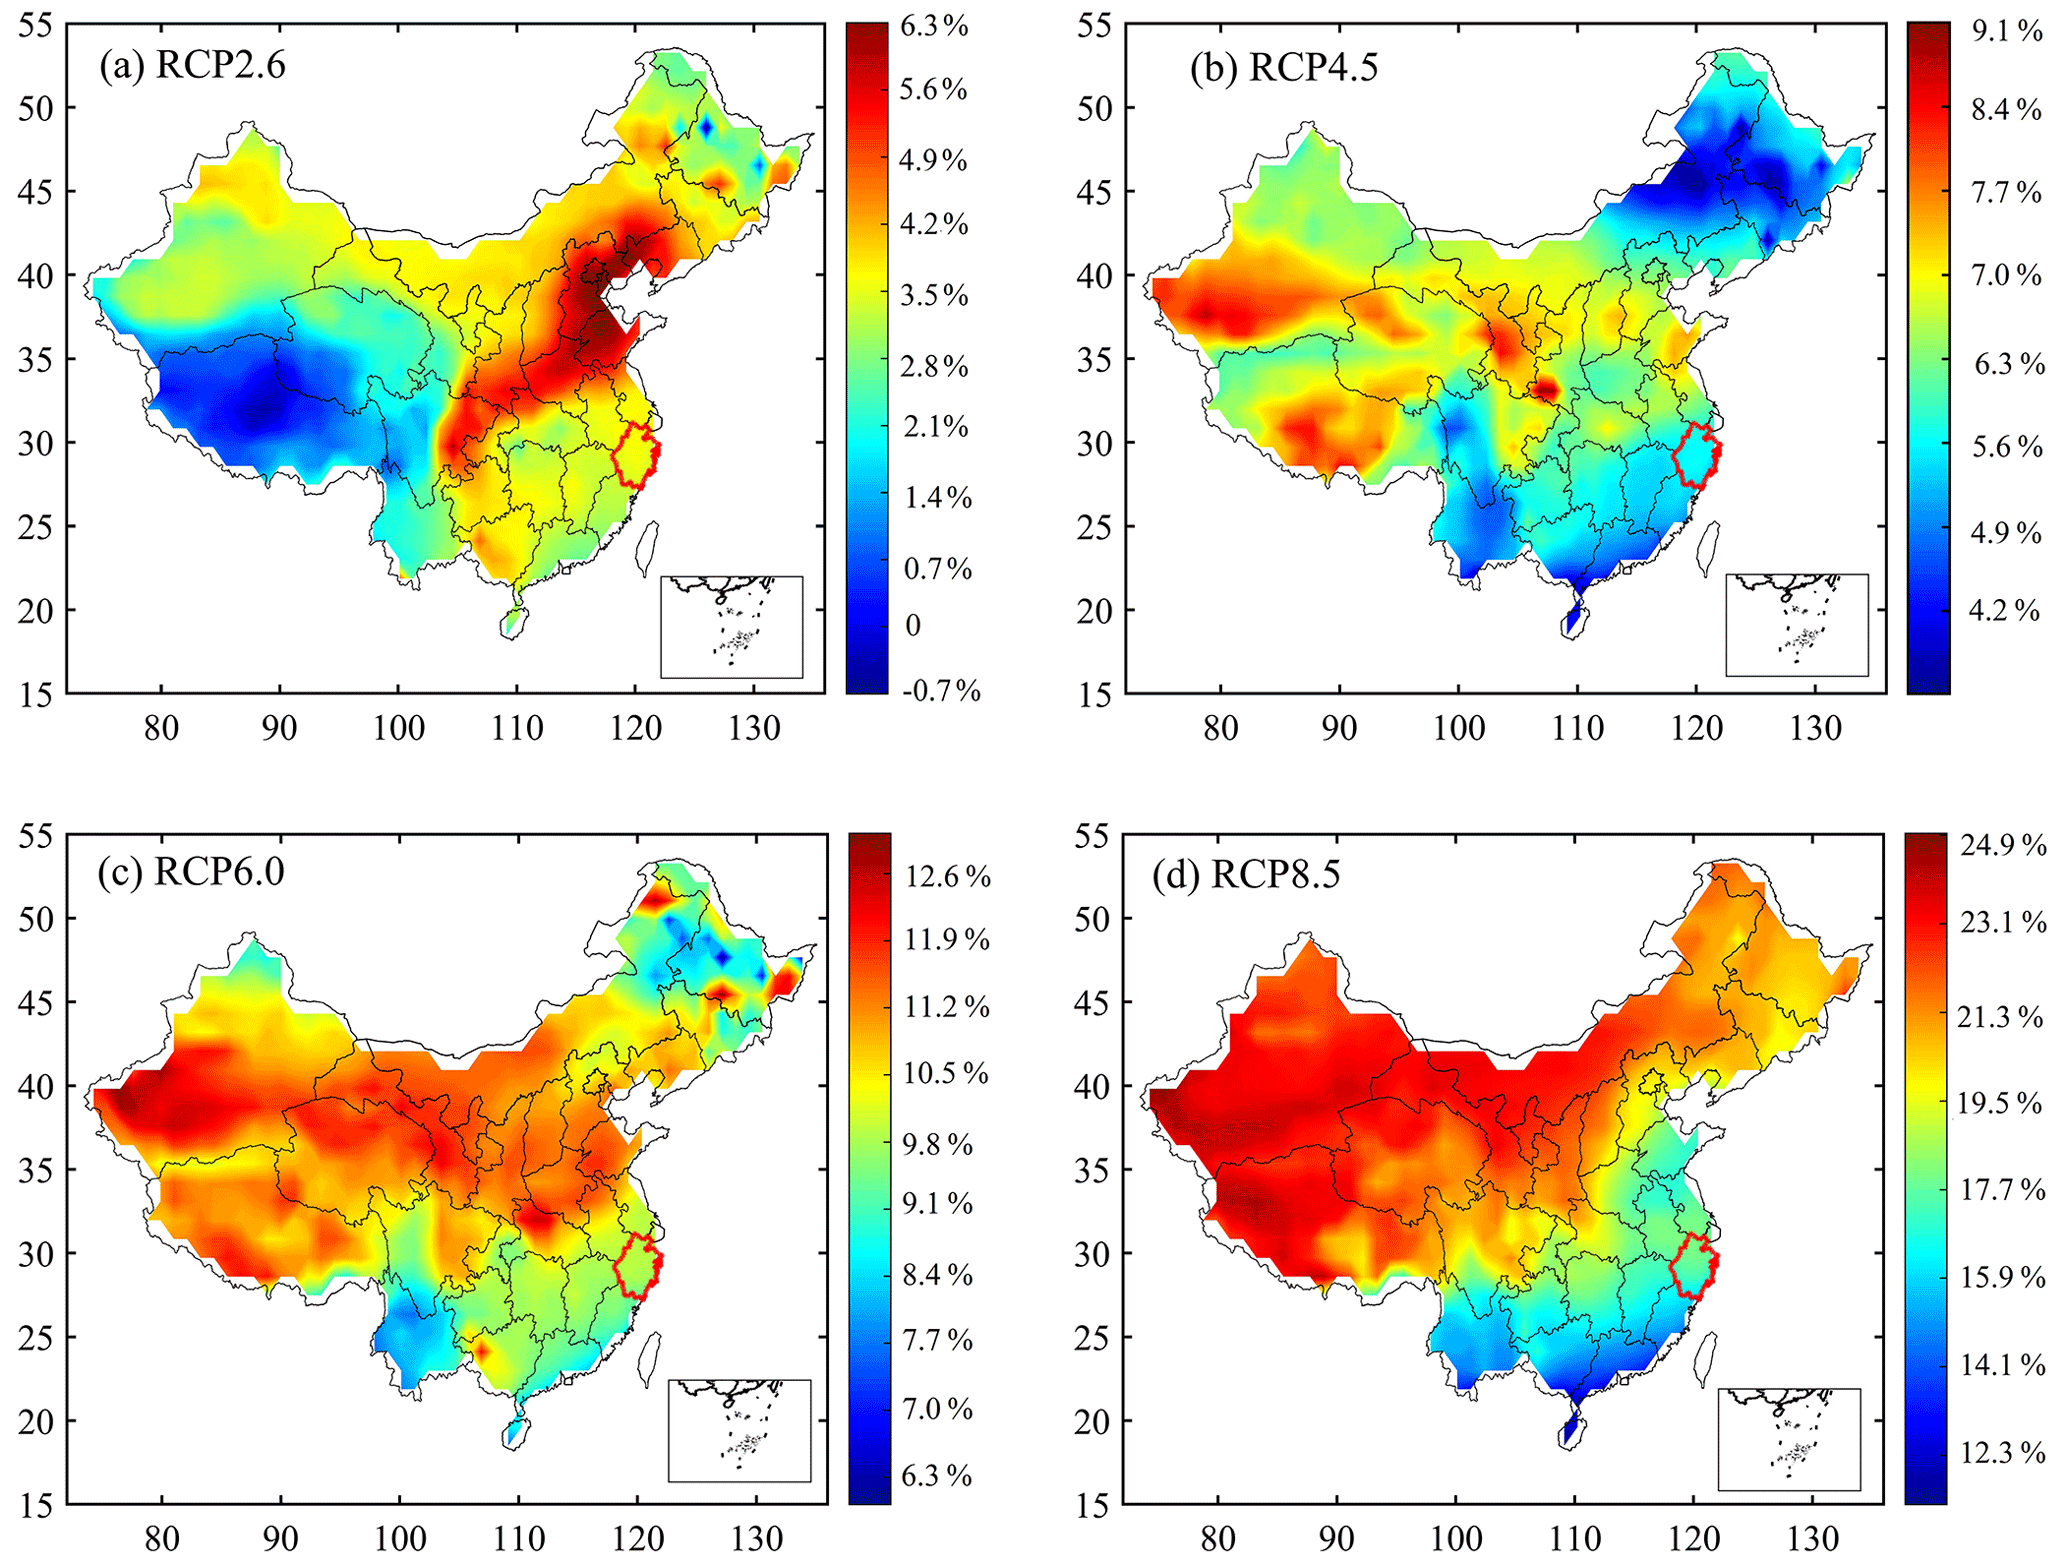
Figure 9Global-warming-induced relative changes in waste treatment CH4 EFs by the year 2100 for the (a) RCP2.6, (b) RCP4.5, (c) RCP6.0 and (d) RCP8.5 scenarios. Note the red boundary is Zhejiang Province.
Many previous studies have compared total CH4 emissions and their components for different inventories and bottom-up methods and have illustrated large uncertainty and bias at the city scale, and these biases were much larger for waste treatment (Peng et al., 2016; Saunois et al., 2020; Lin et al., 2021; Bian et al., 2022). A recent bottom-up piece of research compared wastewater CH4 EFs in China, which largely varied 4-fold in different provinces, and the uncertainties in the same province were even 2-fold larger than their average, implying considerable uncertainty in recent understanding of waste treatment EFs at the regional scale (Hua et al., 2022). And for the national total emissions, waste treatment CH4 emissions varied between 5 and 15 Tg a−1 (Peng et al., 2016; EDGAR v6). There are also other atmospheric inversion studies that estimate China's CH4 emissions (Hopkins et al., 2016; Hu et al., 2019; Huang et al., 2021; Miller et al., 2019; Lu et al., 2021; Chen et al., 2022). These studies found large variations in national emissions for almost all inventories, which were mainly caused by fossil fuel exploitation, the agricultural sector (livestock and rice paddies) and waste treatment. For the comparisons of waste treatment emissions, these satellite-based inversions also largely varied 1.5-fold between 6 and 9 Tg a−1 (Miller et al., 2019; Lu et al., 2021; Chen et al., 2022; Y. Zhang et al., 2022).
The reported discrepancies between bottom-up and top-down approaches indicate large uncertainty in understanding China's national CH4 emissions from waste treatment. And it is well known that the uncertainties will increase from the national scale to regional and city scales, also implying considerable uncertainties in city-scale emissions for inventories. But the atmospheric inversion approach for city-scale waste treatment, which can act as an independent evaluation, is still rare not only for China but also globally. To our best knowledge, there has been only one recent atmospheric inversion study focused on CH4 emissions from city-scale waste treatment, which used satellite-based observation to constrain emissions from four cities in India and Pakistan and concluded there was underestimation of landfill CH4 emissions by 1.4 to 2.6 times for the EDGAR inventory (Maasakkers et al., 2022). In our study, we found annual waste CH4 emissions were overestimated by 47.1 % for Hangzhou; our findings are different from results in India and Pakistan. These differences indicate bias of waste treatment CH4 emissions considerably varies in different countries and climate divisions. Our results highlight there is a large knowledge gap in understanding waste treatment emissions mechanisms and estimating urban waste treatment CH4 emissions, especially in China.
Differently from fossil-type sources that have much smaller monthly variations, CH4 emission from waste treatment is a biological-process-based source, and its EFs are highly sensitive to meteorological conditions, especially temperature. These factors lead to obvious bias in waste treatment CH4 emissions not only for the annual average but also for their seasonality. Besides, although there have been a few studies that aimed to predict future CH4 emissions from waste treatment, these studies were mainly based on activity data changes without considering the EF variations caused by future global warming trends or were only based on site-specific observations (USEPA, 2013; Cai et al., 2018; Spokas et al., 2021). Of these three cited studies, USEPA (2013) and Cai et al. (2018) only predicted emission changes due to changes in activity data and management technology. And the CH4 emissions for the year 2030 by Cai et al. (2018) were 23.5 % lower than the USEPA (2013) estimation, which was caused by the consideration of new policies and low-carbon policy scenarios. Spokas et al. (2021) modeled the CH4 emission changes with increasing air temperature, where CH4 emissions did not show obvious changes even with temperature increasing by ∼5 ∘C by the end of the year 2100. To our best knowledge, there are no inventories that have considered the temperature-induced changes for both seasonal variations and annual trends of CH4 emissions. Hence, it is still unclear in all inventories how EFs will change with different global warming scenarios at the city scale.
A few observation-based measurements have been conducted for waste treatment but only at some specific sites with large discrepancies of EFs (Du et al., 2017, 2018; Cai et al., 2018; Z. Zhao et al., 2019; NBSC, 2015; Wang et al., 2015; De La Cruz and Barlaz, 2010; Tolaymat et al., 2010; Cai et al., 2014, 2018). And only one of our previous studies used year-round atmospheric CH4 observations to constrain regional-scale CH4 emissions at Nanjing in the YRD area (Huang et al., 2021), where it found much higher emissions of the landfilling waste in summer than in winter: CH4 emissions in July were around 4 times those in February. But there is no study that has quantified the temperature sensitivity of waste CH4 emissions at the city scale or much larger regional scales. These two studies in different cities confirmed temperature as the dominant factor that drives seasonal variations in waste treatment CH4 emissions. Hence our study appears as the first one to estimate city-scale waste treatment CH4 emissions, their temperature sensitivity and projected changes in different global warming scenarios. Our findings for the large sensitivity to temperature indicate the monthly scaling factors should be considered to better represent CH4 emissions and simulate atmospheric CH4 concentrations.
We also note that the predictions of future climate changes are mainly based on different emitting intensities of greenhouse gases, and CH4 contributes around 20 % of direct anthropogenic radiative forcing (Seto et al., 2014). The CH4 emissions in different global warming scenarios were mainly calculated by predicting energy use data without considering the changes in EFs. In this study, we found there should be a large positive feedback between global warming and CH4 emissions, especially in the RCP8.5 scenario where global-warming-induced CH4 emissions from waste treatment will increase by 17.6 %. Hence the projected emissions from waste treatments and other biological-process-based sources, together with positive feedback between temperature and their emissions, are strongly implied in future climate change models. Besides, it is well known that CH4 concentration simulations are essential for modeling air pollution (e.g., O3, NOx and CO), especially in the stratosphere (Isaksen et al., 2011; Kaiho et al., 2013). Considering that waste treatment CH4 emissions accounted for ∼25 % of total anthropogenic emissions (EDGAR v6.0) in eastern China where severe air pollution frequently occurred, we also believe the coupling of temperature-dependent CH4 emissions and the monthly scaling factors on CH4 emissions can improve air pollution modeling in eastern China.
We should note that new technology and other meteorological variables can also influence waste treatment CH4 emissions. The main reason to only use temperature in this study is that we only constrained the emissions at the monthly scale in 1 year and derived 12 datasets of a posteriori CH4 emissions. Besides, temperature is considered to be the main factor in controlling monthly and annual variations in waste treatment CH4 emissions and can be used to represent the co-influence of other meteorological parameters such as atmospheric pressure. We will use multiple years' CH4 concentration to quantify the influence of new technology and other meteorological variables on waste treatment CH4 emissions in our following study, and we suggest that other tracers (e.g., ethane, 14CH4) are also important to separate CH4 emissions from biological and fossil CH4 emissions.
To better evaluate bias for city-scale anthropogenic CH4 emissions and understand the effect of the sensitivity of temperature on waste treatment CH4 emissions, we used a three-tower-based atmospheric CH4 observation network in Hangzhou, which is located in the developed YRD region and is one of the top 10 megacities in China. One-year hourly atmospheric CH4 observations were presented from December 2020 to November 2021. We then applied a scaling factor Bayesian inversion method to constrain monthly anthropogenic CH4 emissions and their components (especially for waste treatments) in Hangzhou, and we also used the multiplicative scaling factor method for the broader Zhejiang Province and YRD area at the seasonal scale.
To the best of our knowledge, our study presents the first tower-based CH4 observation network in China. We found obvious seasonal bias of simulated CH4 concentrations in the core urban area of Hangzhou, which was mainly caused by bias of waste treatment at both annual and monthly scales. The derived a posteriori CH4 emissions display obvious seasonal variations, with a peak in summer and trough in winter, which was mainly contributed by waste treatment; the a priori annual waste treatment CH4 emissions in Hangzhou were 10.4×10⁴ t and decreased to t for the a posteriori emissions, a decrease of 47.1 %. Besides, the total anthropogenic CH4 emissions (excluding agricultural soil) decreased from 15.0×10⁴ t to t, indicating overestimation of 36.0 % for the whole year of 2021. Observations at the Linan site imply that the annual CH4 emissions were slightly underestimated by 7.0 % for the larger region of Zhejiang Province or the YRD area, which was different from the case of Hangzhou. Additionally, the a posteriori monthly CH4 emissions from waste treatment illustrate a significant linear relationship with air temperature, with regression slopes indicating an increase of 38 %–50 % when temperature increases by 10 ∘C. Finally, we found the waste treatment CH4 EFs for Hangzhou will increase by 17.6 %, 9.6 %, 5.6 % and 4.0 % by the end of this century for the RCP8.5, RCP6.0, RCP4.5 and RCP2.6 scenarios, respectively. The derived relative changes for the whole of China also showed high heterogeneity and indicate large uncertainty in projecting future national total CH4 emissions. This study is also the first one that mainly focuses on the city-scale temperature sensitivity of waste treatment CH4 emissions from the perspective of the atmospheric inversion approach. And based on the above results, we strongly suggest the temperature-dependent EFs should be coupled in both recent CH4 inventories and future CH4 emission projections.
The atmospheric CH4 observation data can be requested from Cheng Hu (chenghu@njfu.edu.cn or nihaohucheng@163.com) and Bing Qi. The STILT model can be downloaded from http://www.stilt-model.org/ (Lin, 2003), the EDGAR inventory is from https://edgar.jrc.ec.europa.eu/ (Crippa et al., 2021) and the projected climate data were downloaded from the World Data Center for Climate (WDCC).
The supplement related to this article is available online at: https://doi.org/10.5194/acp-23-4501-2023-supplement.
CH and BQ designed the study. CH performed the model simulation and data analysis and wrote and revised the paper; BQ and RD conducted CH4 concentration observation and meteorological data collection, and all co-authors contributed to the data and figure preparation and analysis.
The contact author has declared that none of the authors has any competing interests.
Publisher’s note: Copernicus Publications remains neutral with regard to jurisdictional claims in published maps and institutional affiliations.
We sincerely thank the detailed comments from the two anonymous reviewers. We also want to express our thanks to Timothy J. Griffis from the University of Minnesota, who provided many important suggestions and support for this study.
Cheng Hu is supported by the National Natural Science Foundation of China (grant no. 42105117) and Natural Science Foundation of Jiangsu Province (grant no. BK20200802). Wei Xiao is supported by the National Key R&D Program of China (grant nos. 2020YFA0607501 and 2019YFA0607202). This work is also supported by the Zhejiang Provincial Basic Public Welfare Research Project (grant no. LGF22D050004).
This paper was edited by Ilse Aben and reviewed by two anonymous referees.
Agustí-Panareda, A., Diamantakis, M., Massart, S., Chevallier, F., Muñoz-Sabater, J., Barré, J., Curcoll, R., Engelen, R., Langerock, B., Law, R. M., Loh, Z., Morguí, J. A., Parrington, M., Peuch, V.-H., Ramonet, M., Roehl, C., Vermeulen, A. T., Warneke, T., and Wunch, D.: Modelling CO2 weather – why horizontal resolution matters, Atmos. Chem. Phys., 19, 7347–7376, https://doi.org/10.5194/acp-19-7347-2019, 2019.
Bian, R., Zhang, T., Zhao, F., Chen, J., Liang, C., Li, W., Sun, Y., Chai, X., Fang, X., and Yuan, L.: Greenhouse gas emissions from waste sectors in China during 2006–2019: Implications for carbon mitigation, Proc. Saf. Environ., 161, 488–497, 2022.
Bloom, A. A., Bowman, K. W., Lee, M., Turner, A. J., Schroeder, R., Worden, J. R., Weidner, R., McDonald, K. C., and Jacob, D. J.: A global wetland methane emissions and uncertainty dataset for atmospheric chemical transport models (WetCHARTs version 1.0), Geosci. Model Dev., 10, 2141–2156, https://doi.org/10.5194/gmd-10-2141-2017, 2017.
Börjesson, G. and Svensson, B. H.: Seasonal and Diurnal Methane Emissions From a Landfill and Their Regulation By Methane Oxidation, Waste Manage. Res., 15, 33–54, https://doi.org/10.1177/0734242X9701500104, 1997.
Cai, B., Liu, J., Zeng, X., Cao, D., Liu, L., Zhou, Y., and Zhang, Z.: Estimation of CH4 emission from landfill in China based on point emission sources, Adv. Clim. Change Res., 5, 81–91, 2014.
Cai, B., Lou, Z., Wang, J., Geng, Y., Sarkis, J., Liu, J., and Gao, Q.: CH4 mitigation potentials from China landfills and related environmental co-benefits, Sci. Adv., 4, eaar8400, https://doi.org/10.1126/sciadv.aar8400, 2018.
Chen, Z., Jacob, D. J., Nesser, H., Sulprizio, M. P., Lorente, A., Varon, D. J., Lu, X., Shen, L., Qu, Z., Penn, E., and Yu, X.: Methane emissions from China: a high-resolution inversion of TROPOMI satellite observations, Atmos. Chem. Phys., 22, 10809–10826, https://doi.org/10.5194/acp-22-10809-2022, 2022.
Crippa, M., Guizzardi, D., Solazzo, E., Muntean, M., Schaaf, E., Monforti-Ferrario, F., Banja, M., Olivier, J. G. J., Grassi, G., Rossi, S., and Vignati, E.: GHG emissions of all world countries – 2021 Report [data set], EUR 30831 EN, Publications Office of the European Union, Luxembourg, JRC126363, ISBN 978-92-76-41547-3, https://doi.org/10.2760/173513, 2021.
De La Cruz, F. B. and Barlaz, M. A.: Estimation of waste component-specific landfill decay rates using laboratory-scale decomposition data, Environ. Sci. Technol., 44, 4722–4728, 2010.
Du, M., Peng, C., Wang, X., Chen, H., Wang, M., and Zhu, Q.: Quantification of methane emissions from municipal solid waste landfills in China during the past decade, Renew. Sust. Energ. Rev., 78, 272–279, 2017.
Du, M., Zhu, Q., Wang, X., Li, P., Yang, B., Chen, H., Wang, M., Zhou, X., and Peng, C.: Estimates and predictions of methane emissions from wastewater in China from 2000 to 2020, Earths Future, 6, 252–263, 2018.
Fang, S., Du, R., Qi, B., Ma, Q., Zhang, G., Chen, B., and Li, J.: Variation of carbon dioxide mole fraction at a typical urban area in the Yangtze River Delta, China. Atmos. Res., 265, 105884, https://doi.org/10.1016/j.atmosres.2021.105884, 2022.
Griffis, T. J., Chen, Z., Baker, J. M.,Wood, J. D., Millet, D. B., Lee, X., Venterea, R., and Turner P.: Nitrous oxide emissions are enhanced in a warmer and wetter world, P. Natl. Acad. Sci. USA, 114, 12081–12085, https://doi.org/10.1073/pnas.1704552114, 2017.
He, J., Naik, V., Horowitz, L. W., Dlugokencky, E., and Thoning, K.: Investigation of the global methane budget over 1980–2017 using GFDL-AM4.1, Atmos. Chem. Phys., 20, 805–827, https://doi.org/10.5194/acp-20-805-2020, 2020.
Henne, S., Brunner, D., Oney, B., Leuenberger, M., Eugster, W., Bamberger, I., Meinhardt, F., Steinbacher, M., and Emmenegger, L.: Validation of the Swiss methane emission inventory by atmospheric observations and inverse modelling, Atmos. Chem. Phys., 16, 3683–3710, https://doi.org/10.5194/acp-16-3683-2016, 2016.
Hopkins, F. M., Kort, E. A., Bush, S. E., Ehleringer, J. R., Lai, C.-T., Blake, D. R., and Randerson, J. T.: Spatial patterns and source attribution of urban methane in the Los Angeles Basin, J. Geophys. Res.-Atmos., 121, 2490–2507, 2016.
Höglund-Isaksson, L.: Global anthropogenic methane emissions 2005–2030: technical mitigation potentials and costs, Atmos. Chem. Phys., 12, 9079–9096, https://doi.org/10.5194/acp-12-9079-2012, 2012.
Hua, H., Jiang, S., Yuan, Z., Liu, X., Zhang, Y., and Cai, Z. Advancing greenhouse gas emission factors for municipal wastewater treatment plants in China. Environ. Pollut., 295, 118648, https://doi.org/10.1016/j.envpol.2021.118648, 2022.
Hu C., Griffis, T. J., Liu, S., Xiao, W., Hu, N., Huang, W., Yang, D., and Lee, X.: Anthropogenic methane emission and its partitioning for the Yangtze River Delta region of China, J. Geophys. Res.-Biogeo., 124, 1148–1170, 2019.
Hu, C., Xu, J., Liu, C., Chen, Y., Yang, D., Huang, W., Deng, L., Liu, S., Griffis, T. J., and Lee, X.: Anthropogenic and natural controls on atmospheric δ13C-CO2 variations in the Yangtze River delta: insights from a carbon isotope modeling framework, Atmos. Chem. Phys., 21, 10015–10037, https://doi.org/10.5194/acp-21-10015-2021, 2021.
Hu, C., Griffis, T. J., Xia, L., Xiao, W., Liu, C., Xiao, Q., Huang, X., Yang, Y., Zhang, L., and Hou, B.: Anthropogenic CO2 emission reduction during the COVID-19 pandemic in Nanchang City, China, Environ. Pollut., 309, 119767, https://doi.org/10.1016/j.envpol.2022.119767, 2022.
Huang, W. J., Griffis, T. J., Hu, C., Xiao, W., and Lee, X. H.: Seasonal variations of CH4 emissions in the Yangtze River Delta region of China are driven by agricultural activities, Adv. Atmos. Sci., 38, 1537–1551, https://doi.org/10.1007/s00376-021-0383-9, 2021.
Isaksen, I. S., Gauss, M., Myhre, G., Anthony, W., Katey, M., and Ruppel, C.: Strong atmospheric chemistry feedback to climate warming from Arctic methane emissions, Global Biogeochem. Cy., 25, GB2002, https://doi.org/10.1029/2010GB003845, 2011.
Kumar, P., Broquet, G., Caldow, C., Laurent, O., Gichuki, S., Cropley, F., Yver-Kwok, C., Fontanier, B., Lauvaux, T., Ramonet, M., Shah, A., Berthe, G., Martin, F., Duclaux, O., Juery, C., Bouchet, C., Pitt, J., and Ciais, P.: Near-field atmospheric inversions for the localization and quantification Of controlled methane releases using stationary and mobile measurements, Q. J. Roy. Meteor. Soc., 148, 1886–1912, 2022.
Kissas, K., Ibrom, A., Kjeldsen, P., and Scheutz, C.: Methane emission dynamics from a Danish landfill: The effect of changes in barometric pressure, Waste. Manage., 138, 234–242, 2022.
Lian, J., Bréon, F.-M., Broquet, G., Lauvaux, T., Zheng, B., Ramonet, M., Xueref-Remy, I., Kotthaus, S., Haeffelin, M., and Ciais, P.: Sensitivity to the sources of uncertainties in the modeling of atmospheric CO2 concentration within and in the vicinity of Paris, Atmos. Chem. Phys., 21, 10707–10726, https://doi.org/10.5194/acp-21-10707-2021, 2021.
Lin, J. C.: A near-field tool for simulating the upstream influence of atmospheric observations: The Stochastic Time-Inverted Lagrangian Transport (STILT) model [software and model code], J. Geophys. Res., 108, 4493, https://doi.org/10.1029/2002JD003161, 2003.
Lin, X., Zhang, W., Crippa, M., Peng, S., Han, P., Zeng, N., Yu, L., and Wang, G.: A comparative study of anthropogenic CH4 emissions over China based on the ensembles of bottom-up inventories, Earth Syst. Sci. Data, 13, 1073–1088, https://doi.org/10.5194/essd-13-1073-2021, 2021.
Lopez-Coto, I., Ren, X., Salmon, O. E., Karion, A., Shepson, P. B., Dickerson, R. R., Stein, A., Prasad, K., and Whetstone, J. R.: Wintertime CO2, CH4, and CO Emissions Estimation for the Washington, DC-Baltimore Metropolitan Area Using an Inverse Modeling Technique, Environ. Sci. Technol., 54, 2606–2614, https://doi.org/10.1021/acs.est.9b06619, 2020.
Lou, Z., Cai, B. F., Zhu, N., Zhao, Y., Geng, Y., Yu, B., and Chen, W., Greenhouse gas emission inventories from waste sector in China during 1949–2013 and its mitigation potential, J. Clean. Prod., 157, 118–124, https://doi.org/10.1016/j.jclepro. 2017.04.135, 2017.
Lu, X., Jacob, D. J., Zhang, Y., Maasakkers, J. D., Sulprizio, M. P., Shen, L., Qu, Z., Scarpelli, T. R., Nesser, H., Yantosca, R. M., Sheng, J., Andrews, A., Parker, R. J., Boesch, H., Bloom, A. A., and Ma, S.: Global methane budget and trend, 2010–2017: complementarity of inverse analyses using in situ (GLOBALVIEWplus CH4 ObsPack) and satellite (GOSAT) observations, Atmos. Chem. Phys., 21, 4637–4657, https://doi.org/10.5194/acp-21-4637-2021, 2021.
Kaiho, K. and Koga, S.: Impacts of a massive release of methane and hydrogen sulfide on oxygen and ozone during the late Permian mass extinction, Global Planet. Change, 107, 91–101, https://doi.org/10.1016/j.gloplacha.2013.04.004, 2013.
Maasakkers, J. D., Varon, D. J., Elfarsdóttir, A., McKeever, J., Jervis, D., Mahapatra, G., Pandey, S., Lorente, A., Borsdorff, T., Foorthuis, L. R., Schuit, B. J., Tol, P., van Kempen, T. A., van Hees, R., and Aben, I.: Using satellites to uncover large methane emissions from landfills, Sci. Adv., 8, eabn9683, https://doi.org/10.1126/sciadv.abn9683, 2022.
Masuda, S., Sano, I., Hojo, T., Li, Y., and Nishimura, O.: The comparison of greenhouse gas emissions in sewage treatment plants with different treatment processes, Chemosphere, 193, 581–590, 2018.
Miles, N. L., Richardson, S. J., Lauvaux, T., Davis, K. J., Balashov, N. V., Deng, A., Turnbull, J. C., Sweeney, C., Gurney, K. R., Patarasuk, R., Razlivanov, I., Cambaliza, M. O. L., and Shepson, P. B.: Quantification of urban atmospheric boundary layer greenhouse gas dry mole fraction enhancements in the dormant season: Results from the Indianapolis Flux Experiment (INFLUX), Elem. Sci. Anth., 5, 27, https://doi.org/10.1525/elementa.127, 2017.
Miller, S. M., Matross, D. M., Andrews, A. E., Millet, D. B., Longo, M., Gottlieb, E. W., Hirsch, A. I., Gerbig, C., Lin, J. C., Daube, B. C., Hudman, R. C., Dias, P. L. S., Chow, V. Y., and Wofsy, S. C.: Sources of carbon monoxide and formaldehyde in North America determined from high-resolution atmospheric data, Atmos. Chem. Phys., 8, 7673–7696, https://doi.org/10.5194/acp-8-7673-2008, 2008.
Miller, S. M., Michalak, A. M., Detmers, R. G., Hasekamp, O. P., Bruhwiler, L. M. P., and Schwietzke, S.: China's coal mine methane regulations have not curbed growing emissions, Nat. Commun., 10, 303–308, https://doi.org/10.1038/s41467-018-07891-7, 2019.
Mønster, J., Kjeldsen, P., and Scheutz, C.: Methodologies for measuring fugitive methane emissions from landfills – a review, Waste Manage., 87, 835–859, https://doi.org/10.1016/j.wasman.2018.12.047, 2019.
National Bureau of Statistics of China (NBSC): China Statistical Yearbook (China Statistics Press, 2015), 2015 (in Chinese).
Pak, N. M., Heerah, S., Zhang, J., Chan, E., Worthy, D., Vogel, F., and Wunch, D.: The Facility Level and Area Methane Emissions inventory for the Greater Toronto Area (FLAME-GTA)[J], Atmos. Environ., 252, 118319, https://doi.org/10.1016/j.atmosenv.2021.118319, 2021.
Peng, S., Piao, S., Bousquet, P., Ciais, P., Li, B., Lin, X., Tao, S., Wang, Z., Zhang, Y., and Zhou, F.: Inventory of anthropogenic methane emissions in mainland China from 1980 to 2010, Atmos. Chem. Phys., 16, 14545–14562, https://doi.org/10.5194/acp-16-14545-2016, 2016.
Sargent, M., Barrera, Y., Nehrkorn, T., Hutyra, L. R., Gately, C. K., Mckain, K., Sweeney, C., Hegarty, J., Hardiman, B., Steven, C., and Wofsy, S. C.: Anthropogenic and biogenic CO2 fluxes in the Boston urban region, P. Natl. Acad. Sci. USA, 115, 7491–7496, https://doi.org/10.1073/pnas.1803715115, 2018.
Saunois, M., Stavert, A. R., Poulter, B., Bousquet, P., Canadell, J. G., Jackson, R. B., Raymond, P. A., Dlugokencky, E. J., Houweling, S., Patra, P. K., Ciais, P., Arora, V. K., Bastviken, D., Bergamaschi, P., Blake, D. R., Brailsford, G., Bruhwiler, L., Carlson, K. M., Carrol, M., Castaldi, S., Chandra, N., Crevoisier, C., Crill, P. M., Covey, K., Curry, C. L., Etiope, G., Frankenberg, C., Gedney, N., Hegglin, M. I., Höglund-Isaksson, L., Hugelius, G., Ishizawa, M., Ito, A., Janssens-Maenhout, G., Jensen, K. M., Joos, F., Kleinen, T., Krummel, P. B., Langenfelds, R. L., Laruelle, G. G., Liu, L., Machida, T., Maksyutov, S., McDonald, K. C., McNorton, J., Miller, P. A., Melton, J. R., Morino, I., Müller, J., Murguia-Flores, F., Naik, V., Niwa, Y., Noce, S., O'Doherty, S., Parker, R. J., Peng, C., Peng, S., Peters, G. P., Prigent, C., Prinn, R., Ramonet, M., Regnier, P., Riley, W. J., Rosentreter, J. A., Segers, A., Simpson, I. J., Shi, H., Smith, S. J., Steele, L. P., Thornton, B. F., Tian, H., Tohjima, Y., Tubiello, F. N., Tsuruta, A., Viovy, N., Voulgarakis, A., Weber, T. S., van Weele, M., van der Werf, G. R., Weiss, R. F., Worthy, D., Wunch, D., Yin, Y., Yoshida, Y., Zhang, W., Zhang, Z., Zhao, Y., Zheng, B., Zhu, Q., Zhu, Q., and Zhuang, Q.: The Global Methane Budget 2000–2017, Earth Syst. Sci. Data, 12, 1561–1623, https://doi.org/10.5194/essd-12-1561-2020, 2020.
Seto, K. C., Dhakal, S., Bigio, A., Blanco, H., Delgado, G. C., Dewar, D., Huang, L., Inaba, A., Kansal, A., Lwasa, S., McMahon, J. E., Müller, D. B., Murakami, J., Nagendra, H., and Ramaswami, A.: Human Settlements, Infrastructure and Spatial Planning, in: Climate Change 2014: Mitigation of Climate Change. Contribution of Working Group III to the Fifth Assessment Report of the Intergovernmental Panel on Climate Change, edited by: Edenhofer, O., Pichs-Madruga, R., Sokona, Y., Farahani, E., Kadner, S., Seyboth, K., Adler, A., Baum, I., Brunner, S., Eickemeier, P., Kriemann, B., Savolainen, J., Schlömer, S., von Stechow, C., Zwickel, T., and Minx, J. C., Cambridge University Press, Cambridge, United Kingdom and New York, NY, USA, https://doi.org/10.1017/CBO9781107415416.018, 2014.
Solazzo, E., Crippa, M., Guizzardi, D., Muntean, M., Choulga, M., and Janssens-Maenhout, G.: Uncertainties in the Emissions Database for Global Atmospheric Research (EDGAR) emission inventory of greenhouse gases, Atmos. Chem. Phys., 21, 5655–5683, https://doi.org/10.5194/acp-21-5655-2021, 2021.
Spokas, K., Bogner, J., and Corcoran, M.: Modeling landfill CH4 emissions: CALMIM international fieldvalidation, using CALMIM to simulate management strategies, current and futureclimate scenarios, Elem. Sci. Anth., 9, 00050, https://doi.org/10.1525/elementa.2020.00050, 2021.
Tolaymat, T., Green, R. B., Hater, G. R., Barlaz, M. A., Black, P., Bronson, D., and Powell, J.: Evaluation of landfill gas decay constant for municipal solid waste landfills operated as bioreactors, J. Air Waste Manage. Assoc., 60, 91–97, 2010.
Thoning, K. W., Tans, P. P., and Komhyr, W. D.: Atmospheric carbon dioxide at Mauna Loa observatory 2. Analysis of the NOAA/GMCC data, 1974–1985, J. Geophys. Res.-Atmos., 94, 8549–8565, https://doi.org/10.1029/JD094iD06p08549, 1989.
Tian, J., Gong, Y., Li, Y., Chen, X., Zhang, L., and Sun, Y.: Can policy implementation increase public waste sorting behavior?, The comparison between regions with and without waste sorting policy implementation in China, J. Clean. Prod., 636, 132401, https://doi.org/10.1016/j.jclepro.2022.132401, 2022.
United States Environmental Protection Agency (USEPA): Global Mitigation of Non-CO2 Greenhouse Gases 2010-2030 (United States Environmental Protection Agency Office of Atmospheric Programs (6207J), EPA-430-R-13-011, 2013); http://www.epa.gov/sites/production/files/2016-07/documents/mac_report_2014-exec_summ.compressed.pdf (last access: 19 July 2021), 2013.
Verhulst, K. R., Karion, A., Kim, J., Salameh, P. K., Keeling, R. F., Newman, S., Miller, J., Sloop, C., Pongetti, T., Rao, P., Wong, C., Hopkins, F. M., Yadav, V., Weiss, R. F., Duren, R. M., and Miller, C. E.: Carbon dioxide and methane measurements from the Los Angeles Megacity Carbon Project – Part 1: calibration, urban enhancements, and uncertainty estimates, Atmos. Chem. Phys., 17, 8313–8341, https://doi.org/10.5194/acp-17-8313-2017, 2017.
Wang, X., Nagpure, A. S., DeCarolis, J. F., and Barlaz, M. A.: Characterization of uncertainty in estimation of methane collection from select U.S. landfills, Environ. Sci. Technol. 49, 1545–1551, 2015.
Wang, Y., Wang, X., Wang, K., Chevallier, F., Zhu, D., Lian, J., He, Y., Tian, H., Li, J., Zhu, J., Jeong, S., and Canadell, J.: The size of the land carbon sink in China, Nature, 7–9, https://doi.org/10.1038/s41586-021-04255-y, 2022.
Williams, J. P., Ars, S., Vogel, F., Regehr, A., and Kang, M.: Differentiating and Mitigating Methane Emissions from Fugitive Leaks from Natural Gas Distribution, Historic Landfills, and Manholes in Montréal, Canada, Environ. Sci. Technol., 56, 16686–16694, https://doi.org/10.1021/acs.est.2c06254, 2022.
Yadav, V., Duren, R., Mueller, K., Verhulst, K. R., Nehrkorn, T., and Kim, J.: Spatio-temporally resolved methane fluxes fromthe Los Angeles megacity J. Geophys. Res.-Atmos. 124, 5131–5148, 2019.
Zhao, X., Jin, X., Guo, W., Zhang, C., Shan, Y., Du, M., Tillotson, M., Yang, H., Liao, X., and Li, Y.: China's urban methane emissions from municipal wastewater treatment plant, Earths Future, 7, 480–490, 2019.
Zhao, Z., Bian, R., Zhao, F., and Chai, X.: Implications of municipal solid waste disposal methods in China on greenhouse gas emissions, Renew. Sust. Energ. Rev., 39, e13372, https://doi.org/10.1002/ep.13372, 2019.
Zhang, B. and Chen, G.: China's CH4 and CO2 emissions: Bottomup estimation and comparative analysis, Ecol. Indic., 47, 112–122, https://doi.org/10.1016/j.ecolind.2014.01.022, 2014.
Zhang, K., Lee, X., Schultz, N. M., Huang, Q., Liu, Z., Chu, H., Zhao, L., and He, C.: A global dataset on subgrid land surface climate (2015–2100) from the Community Earth System Model, Geosci. Data J., 1–12, https://doi.org/10.1002/gdj3.153, 2022.
Zhang, Y., Fang, S., Chen, J., Lin, Y., Chen, Y., Liang, R., Jiang, K., Parker, R., Boesch, H., Steinbacher, M., Sheng, J., and Lu, X.: Shaojie Song, Shushi Peng: Observed Changes in China's Methane Emissions Linked to Policy Drivers, P. Natl. Acad. Sci. USA, 119, e2202742119, 2022.
Zhejiang Provincial Bureau of Statistics: Survey Office of the National Bureau of Statistics in Zhejiang, Zhejiang Statistical Yearbook 2018–2019 (China Statistics Press, Beijing, China, 2019), https://doi.org/10.1073/pnas.2202742119, 2019.