the Creative Commons Attribution 4.0 License.
the Creative Commons Attribution 4.0 License.
 | 13 Apr 2023
The impact of using assimilated Aeolus wind data on regional WRF-Chem dust simulations
Pantelis Kiriakidis
Antonis Gkikas
Georgios Papangelis
Theodoros Christoudias
Jonilda Kushta
Emmanouil Proestakis
Anna Kampouri
Eleni Marinou
Eleni Drakaki
Angela Benedetti
Michael Rennie
Christian Retscher
Anne Grete Straume
Alexandru Dandocsi
Jean Sciare
Vasilis Amiridis
Land–atmosphere interactions govern the process of dust emission and transport. An accurate depiction of these physical processes within numerical weather prediction models allows for better estimating the spatial and temporal distribution of the dust burden and the characterisation of source and recipient areas. In the presented study, the ECMWF-IFS (European Centre for Medium-Range Weather Forecast – Integrated Forecasting System) outputs, produced with and without the assimilation of Aeolus quality-assured Rayleigh–clear and Mie–cloudy horizontal line-of-sight wind profiles, are used as initial or boundary conditions in the Weather Research and Forecasting model coupled with Chemistry (WRF-Chem) to simulate 2-month periods in the spring and autumn of 2020, focusing on a case study in October. The experiments have been performed over the broader eastern Mediterranean and Middle East (EMME) region, which is frequently subjected to dust transport, as it encompasses some of the most active erodible dust sources. Aerosol- and dust-related model outputs (extinction coefficient, optical depth and concentrations) are qualitatively and quantitatively evaluated against ground- and satellite-based observations. Ground-based columnar and vertically resolved aerosol optical properties are acquired through AERONET sun photometers and PollyXT lidar, while near-surface concentrations are taken from EMEP. Satellite-derived vertical dust and columnar aerosol optical properties are acquired through LIVAS (LIdar climatology of Vertical Aerosol Structure) and MIDAS (ModIs Dust AeroSol), respectively.
Overall, in cases of either high or low aerosol loadings, the model predictive skill is improved when WRF-Chem simulations are initialised with the meteorological fields of Aeolus wind profiles assimilated by the IFS. The improvement varies in space and time, with the most significant impact observed during the autumn months in the study region. Comparison with observation datasets saw a remarkable improvement in columnar aerosol optical depths, vertically resolved dust mass concentrations and near-surface particulate concentrations in the assimilated run against the control run. Reductions in model biases, either positive or negative, and an increase in the correlation between simulated and observed values was achieved for October 2020.
Please read the corrigendum first before continuing.
-
Notice on corrigendum
The requested paper has a corresponding corrigendum published. Please read the corrigendum first before downloading the article.
-
Article
(13551 KB)
-
The requested paper has a corresponding corrigendum published. Please read the corrigendum first before downloading the article.
- Article
(13551 KB) - Full-text XML
- Corrigendum
- BibTeX
- EndNote


The Levantine Basin and eastern Mediterranean are frequent recipients of dust transported from North Africa and the Middle East (Gkikas et al., 2013, 2016), receiving an estimated annual influx of 40–150 g m−2 (Ben-Asher et al., 2019). Even though dust deposition can enhance the growth of terrestrial and oceanic ecosystems, high dust loads can have severe implications for human health, increasing the probability of a population developing respiratory and cardiovascular diseases (Kanatani et al., 2010; Xu et al., 2019). Additionally, dust storms affect the built environment by degrading the life of electrical equipment, impacting several modes of transport, decreasing the efficiency of solar-harnessing technologies and severely damaging crop output (Hachicha et al., 2019; Middleton, 2017; Weinzierl et al., 2012; Stefanski and Sivakumar, 2009).
Dust sources are characterised as areas with high availability of alluvium silts and high wind speeds. Some of the most critical Sahelian dust sources include the Bodélé and the Mauritania–Mali locality, with the former being responsible for the production of 6 %–18 % of global dust emissions (Todd et al., 2007; Engelstaedter and Washington, 2007). The combination of various factors, such as moisture content and surface roughness, determine the threshold velocity (Gillette and Hanson, 1989; Ravi et al., 2011), which, if exceeded, causes dust to become uplifted. Once suspended, dust from North Africa can reach as far as the Caribbean (Prospero, 1999; Prospero et al., 2014) depositing 261 ± 48 Tg along its path (Ridley et al., 2012). Approximately 30 %–50 % of the dust emitted from the Sahel is transported through the North Atlantic trajectory (Prospero, 1996) during the summer months. Meanwhile, eastward branches transporting dust towards the eastern Mediterranean and Middle East (EMME) region peak during late spring and summer (Middleton and Goudie, 2001). In recent years, an increasing contribution of dust loads in the EMME region from Middle Eastern sources has been highlighted (De Châtel, 2014; Pozzer et al., 2015; Notaro et al., 2015; Kelley et al., 2015; Logothetis et al., 2021) and attributed to changing climatic conditions. Specifically, the El Niño–Southern Oscillation and the Pacific decadal oscillation teleconnections (Kelley et al., 2015; Pozzer et al., 2015) have been linked to a regime shift in dust activity of the Fertile Crescent area in Mesopotamia (Notaro et al., 2015). Prolonged periods of drought subsequently decreased soil moisture, where in the work of Klingmüller et al. (2016) an R2 of 0.82–0.89 was established between decreased soil moisture and the observed positive trend in dust activity for Saudi Arabia and Iraq. Gkikas et al. (2022) identified seasonal variability in the dust optical depth over Mesopotamia, with spring and summer peaks. Dust storms, convective cold pools and nocturnal low-level jets are responsible for 80 % of dust transport during late spring and early summer (Heinold et al., 2013; Chedin et al., 2018). Anticyclonic activity of synoptic and sub-synoptic scale in the Mediterranean promotes dust transport in the region (Hatzaki et al., 2014; Ioannidou and Yau, 2008). Throughout all seasons, the western North African region is typically the source of the anticyclones, while areas within the eastern Mediterranean, such as Greece, have been identified as sinks (Lolis et al., 2004; Trigo et al., 2004).
The continuous improvements in the computational capability of numerical weather prediction (NWP) models and the growth of available high-resolution observations have significantly improved the accuracy of dust episode forecasting. Numerous sources of uncertainty still prevail, specifically the description of the dust source function and wind fields within an NWP model. Previous work improving the former source of uncertainty has been demonstrated in global models through the works of Ginoux et al. (2001), Zender et al. (2003), Schepanski et al. (2009) and Nabavi et al. (2017), meanwhile Kok et al. (2014) and Wu et al. (2016) have achieved similar improvements by including a threshold velocity parameterisation. However, significant variability in total dust emissions within global models persists, with emissions ranging from 500 to 6000 Tg yr−1 (Ginoux et al., 2001; Huneeus et al., 2011; Prospero et al., 2010), attributed to differing model parameterisations and configurations used (Uno et al., 2006; Huneeus et al., 2011). Alonso-Pérez et al. (2012) and Cavazos-Guerra and Todd (2012) assessed the capabilities of dust emission simulations using a Lagrangian–Eulerian model and a regional WRF-Chem (Weather Research and Forecasting model with Chemistry, Grell et al., 2005) model, respectively, constrained to western Sahara sources. Both study periods pre-date the recent negative dust trend observed for dust sources of Saharan origin (Mehta et al., 2016; Chedin et al., 2018; Shaheen et al., 2021). Tegen et al. (2013), using the COSMOS (Consortium for Small-scale Modelling) meteorological model for the years 2007 and 2008 for the Sahara region, identified challenges in the model ability to accurately depict inter-annual variability due to gaps in understanding controls of the atmospheric dust load. Nabavi et al. (2016) identified existing challenges of dust source functions within the WRF-Chem model unable to accurately depict dust sources in Mesopotamia, an area of increasing importance in dust studies. Following this, Nabavi et al. (2017) tested a new function termed WASF (West Africa source function) within the WRF-Chem model, aiming to improve multi-year analysis for the summers of 2008–2012. The incorporation of the WASF significantly improved the Spearman correlation, but the accuracy of forecasts dropped with increasing distance from the source, signifying deficiencies in model transport and deposition mechanisms (Nabavi et al., 2017). More recently, a high-resolution source function was developed by Parajuli et al. (2019) and was able to identify new dust sources; however, its use is limited to small-scale studies.
The WRF-Chem model allows for the implementation of various parameterisation schemes for dust modelling, with numerous studies enhancing the model to be particularly suitable for the EMME region (Ukhov et al., 2020). Tsarpalis et al. (2018) assessed the impact of a deposition scheme using a dust outbreak in June 2014 affecting the eastern Mediterranean. It was concluded that reductions in overestimations of dust residing at heights greater than 1 km could be achieved. However, underestimations increased at the surface level. Rizza et al. (2018) simulated a dust outbreak in March 2016 in the central Mediterranean and inter-compared three soil property models. The NoahMP model was performing the best, but in all three runs the dust peak was time-shifted relative to the observed peak. Flaounas et al. (2017) studied months of peak activity for the year 2011, with three dust emission parameterisation schemes, highlighting the importance of long-term simulations for sensitivity testing. Compared to the targeted sensitivity testing of the WRF-Chem model performed for the central and eastern Asia regions, a gap exists in inter-comparison studies over the EMME region, particularly in assessing individual dust simulation components (Darmenova et al., 2009; Kang et al., 2011; Su and Fung, 2015; Yuan et al., 2019; Zeng et al., 2020; Zhao et al., 2020).
The model predictive ability also benefits from an observational coverage network able to provide the model with observations. Even though there is broad coverage of ground-based stations along the European-Mediterranean border, this does not stand true for the North-African border and the Middle East region. The shortcoming of ground-based observational data can be overcome through the use of ever-increasing satellite products, one being the recently launched Aeolus Doppler wind lidar. The European Space Agency (ESA), in August 2018, launched the Aeolus satellite carrying ALADIN, the first-ever space-based lidar. ALADIN, via the HSRL (high-spectral-resolution lidar) technique (Shipley et al., 1983), acquires horizontal line-of-sight (HLOS) wind profiles up to 30 km all over the globe. Thus, advancing the current poor observational capabilities, particularly in the open seas of the Southern Hemisphere and the vast desert areas. The first assessment studies (Baars et al., 2020; Lux et al., 2020; Witschas et al., 2020) of Aeolus wind products during the satellite commission phase (autumn 2018) revealed the capability of Aeolus to derive high-quality wind profiles. The main scientific goals of the Aeolus satellite mission are to advance NWP and upgrade the current level of knowledge on atmospheric dynamics and their associated impacts on climate (Stoffelen et al., 2005; Isaksen and Rennie, 2019; Rennie and Isaksen, 2019). The positive impact of Aeolus wind data implementation on NWP has been demonstrated by the ECMWF starting the operational assimilation of Aeolus L2B wind data on January 2020 (Baars et al., 2020). Such activities have also been adopted by other European weather forecast centres (DWD, Météo-France and UK MetOffice). Rennie et al. (2021) demonstrated the beneficial impact of the incorporation of Aeolus wind data on the short- and medium-term forecasts in the Southern Hemisphere, in polar regions and in latitudinal bands where the well-developed “dust belt” stretches (Prospero et al., 2002). Since winds trigger dust mobilisation and drive the advection patterns of dust plumes, a subsequent positive impact of Aeolus on numerical dust simulations is anticipated. This improvement constitutes the overarching objective of the NEWTON (ImproviNg dust monitoring and forEcasting through Aeolus Wind daTa assimilation; https://newton.space.noa.gr/, last access: 17 June 2022) project funded by the ESA in the framework of the Aeolus+ Innovation call. In this study, the Aeolus wind fields provided by ESA and assimilated by ECMWF-IFS are implemented in the WRF-Chem to study the effect on the simulated dust. The model is initialised with two sets of IFS outputs that differ only in whether they include Aeolus wind profiles in the respective assimilation scheme. Four WRF-Chem runs were produced for April–May and September–November 2020, capturing the dust seasons of the EMME region.
This article is structured as follows: in Sects. 2.1 to 2.3 the regional WRF-Chem model setup is described, and in Sect. 2.5 the observation datasets and the collocation methodologies undertaken are explained. Section 3.1 describes the meteorological conditions simulated using the ECMWF-IFS products with and without Aeolus. Finally, in Sect. 3.2 and 3.3 model outputs are compared against surface measurements provided by AERONET, EMEP, PollyXT, and satellite-based MIDAS and LIVAS, leading to conclusions in Sect. 4.
In the following section, the WRF-Chem regional model configuration and the assimilation of the Aeolus wind fields within the ECMWF-IFS model are discussed in Sect. 2.1 and 2.2, respectively. Ground- and satellite-based observation datasets used to evaluate the model are discussed in Sect. 2.5, alongside the methods employed for their spatio-temporal collocation to simulated outputs.
2.1 WRF-Chem model setup
The WRF-Chem version 3.9.1.1 was used along with the WRF Pre-Processing System version 4.2 to perform meteorological and air quality simulations adjusted for the study region as described below.
The Regional Atmospheric Chemistry Mechanism (RACM) was applied to simulate gas-phase chemistry. RACM is based on the Regional Acid Deposition Model version 2 mechanism and has been shown by Georgiou et al. (2018) to produce the lowest mean bias for hourly concentrations of fine particles over the region of interest compared to other gas-phase chemistry mechanisms. The Modal Aerosol Dynamics Model for Europe (MADE) and the secondary organic aerosol (SOA) parameterisation based on the volatility basis set by Ahmadov et al. (2012) were employed to simulate aerosol inorganic species and SOA, respectively. Anthropogenic emissions were based on the Emission Database for Global Atmospheric Research for Hemispheric Transport of Air Pollution (EDGAR-HTAP) version 5 emission inventory compiled by the European Commission, Joint Research Centre/Netherlands Environmental Assessment Agency (Janssens-Maenhout et al., 2012). The Model of Emissions of Gases and Aerosols from Nature version 2.1 (MEGAN2.1) by Guenther et al. (2012) was employed to generate biogenic emissions based on weather and land use data.
Mineral dust and sea salt emissions were calculated online by the WRF-Chem model, driven by assimilated IFS Aeolus data. The Georgia Tech/Goddard Global Ozone Chemistry Aerosol Radiation and Transport (GOCART) model (Ginoux et al., 2001), coupled with the MADE/SORGAM aerosol mechanism within the framework of WRF-Chem, was used to simulate dust emission. The dust emission flux in the GOCART model is scaled by an empirical proportionality constant C. The value of C, estimated by Ginoux et al. (2001), was initially based on US regional data. Zhao et al. (2010) evaluated the performance of the WRF-Chem model for different values of C. They found that for C=0.4 µg s2 m−5, the WRF-Chem simulated mean aerosol optical depth (AOD) was consistent with the AERONET measurements at two sites over the Sahel region and aerosol size over North Africa (Zhao et al., 2010). Several sensitivity tests performed over Cyprus and the eastern Mediterranean led to the best-performing value of 0.36 µg s2 m−5 (Georgiou et al., 2018), based on the study of modelling sensitivities to dust emissions. Therefore, as this is the most prevalent source of dust emissions in the EMME region, in the following simulations a value of C equal to 0.36 µg s2 m−5 was used. The radiation scheme Rapid Radiative Transfer Model (RRTMG) has been used due to the incorporation of a two-stream radiative transfer solver (Oreopoulos and Barker, 1999) that enables a more accurate calculation of extinction from aerosols in the presence of multiple scattering (Iacono et al., 2008) compared to other schemes. A summary of the model configuration options is presented in Table A1 in the Appendix.
2.2 Aeolus assimilation
The WRF numerical experiments are performed using the simulated meteorological fields from the IFS as initial and boundary conditions. The IFS refers to a global numerical weather prediction system of the ECMWF. Two sets of outputs were produced by IFS, a control and an experimental run. Both IFS outputs have a 6 h temporal resolution and are projected on an equal latitude and longitude grid at 12 × 12 km spatial resolution. The configuration of the IFS runs is thoroughly described in Rennie et al. (2021) (see the second row in Table 1). The experimental run includes the Aeolus L2B (2B10 baseline, from 28 June to 31 December 2019 and from 20 April to 8 October 2020) Rayleigh–clear and Mie–cloudy HLOS wind profiles (Baars et al., 2020; Rennie and Isaksen, 2019). Aeolus HLOS retrievals are subjected to a quality screening identical to the one applied in the Observing System Experiments, detailed in the work of Rennie et al. (2021). Both simulations assimilate observations to reproduce the optimum state of the atmosphere (i.e. analysis). For the analyses at 00:00 and 12:00 UTC, observations falling within the time windows spanning from 21:00 UTC (the day before) to 09:00 UTC and from 09:00 to 21:00 UTC, respectively, are assimilated. The assimilation is done with the 4D-Var technique via a process called LWDA (long window data analysis; formerly known as “delayed cut-off”), which allows the maximum use of all observations falling within the assimilation time window. Short-term forecasts are initialised at the start of the time window (either 21:00 UTC or 09:00 UTC), which correspond to the analysis fields at 00:00 and 12:00 UTC and to intermediate nominal model times (i.e. 06:00 and 18:00 UTC).
The analyses IFS numerical outputs serve as initial and boundary conditions in the WRF-Chem model and are exactly the same as those described in Rennie et al. (2021) (Sect. 2.3: “Observing system experiments”). The WRF-Chem simulations using the IFS outputs were contrasted to investigate the modifications in the meteorological patterns and the subsequent variations in the simulated dust fields.
2.3 Experiment set-up
The WRF-Chem model was used to simulate the periods 4 April–31 May and 1 September–4 November 2020 using boundary conditions with (assimilated) and without (control) assimilated IFS Aeolus data. The periods under investigation coincide with the dust storm high-activity phase of the eastern Mediterranean (Engelstaedter et al., 2006; Miller et al., 2008; Tyrlis et al., 2014). The domain area has been configured to a horizontal grid resolution of 20 × 20 km, extending from 5 to 45∘ in latitude and −20 to 62.5∘ in longitude, spanning over the three primary dust sources affecting the region (domain area visualised in Fig. A1). Including the Saharan, Syrian and Arabian desert regions in the model domain allows us to not require the dust component from the boundary conditions and helps avoid biases in dust concentrations from global models. The WRF-Chem model uses a terrain-following hydrostatic-pressure vertical coordinate system. The model configuration uses 30 layers, from the surface up to 50 hPa, with an average height of 70 m for the first layer.
The WRF-Chem model has four-dimensional data assimilation (FDDA) capabilities, described in Deng et al. (2012). FDDA has been applied towards IFS re-analysis fields with and without assimilated Aeolus observations. It was shown that by nudging above and within the planetary boundary layer, the accuracy of the meteorological variables simulated within the WRF-Chem model is improved (Deng et al., 2007) and has since been used in other dust-related studies (e.g. Kumar et al., 2014). Following this, the horizontal wind components, temperature and moisture were nudged in all the model vertical layers, except the surface level, with a nudging coefficient of 3 × 10⁻⁴ s−1. Nudging was carried out at each time step throughout the whole simulation, with a time interval between analysis times of 6 h. Ramping started at the last analysis time and ended as a step function.
To evaluate the performance of WRF-Chem with the introduction of the ECMWF-IFS dataset, we employ the atmospheric extinction coefficient variable at the wavelength of 550 nm (EC55). EC55 profiles get computed through the radiation scheme RRTMG and can be integrated to produce the total aerosol optical depth. For the AOD calculation, dust particles are assumed to be spherical and internally mixed in five differently sized bins of an effective particle radius of 0.5, 1.4, 2.4, 4.5 and 8.0 µm. The Mie theory has been used to calculate the optical properties as a function of wavelength at each model grid point for the wavelengths of 300, 400, 600 and 999 nm as described in Barnard et al. (2010). More specifically, the aerosol optical thickness, the single-scattering albedo and the asymmetry parameter were determined by interpolation at the wavelength of the centre of the band located between the four wavelengths (Chaibou et al., 2020).
2.4 FLEXPART
For the characterisation of the origins of air masses, the Lagrangian particle dispersion model FLEXPART (Stohl et al., 2005; Brioude et al., 2013; Pisso et al., 2019) was run in a backward mode for the period 14 to 25 October 2020. The backward FLEXPART-WRF runs were performed by releasing 10 000 tracer particles at heights 0.5, 1, 2, 3, 4, 5, 7 and 10 km over the Agia Marina, Cyprus, station. The FLEXPART simulations were driven by hourly meteorological fields from the WRF-Chem model initiated with control and assimilated datasets.
2.5 Observation datasets
To evaluate the performance of the WRF-Chem model, ground-based AERONET AOD, EMEP coarse particulate matter (PM10) and PollyXT vertical dust concentrations were used. These were accompanied by space-borne horizontal and vertical dust products from MIDAS and LIVAS, respectively. Spatial and temporal collocations were applied to enable a direct comparison between simulated and observed variables, which are discussed in the following sub-sections.
2.5.1 AERONET
AERONET (AEronet RObotic NETwork) is a global network of about 1000 ground-based monitoring instruments distributed globally and maintained by NASA (Holben et al., 1998). The sun photometer instruments measure the spectral AOD (a unitless measure of aerosol load throughout the total atmospheric column), aerosol size parameters (e.g. Ångström exponent) and several other optical and microphysical properties (Dubovik and King, 2000; Dubovik et al., 2006). Due to the limited availability of level 2, cloud-screened and quality-assured data, level 1.5 (only cloud-screened) AOD measurements (Version 3, Giles et al., 2019; Sinyuk et al., 2020) are taken from 56 stations located within the WRF-Chem constructed domain (location of stations seen on Fig. A4).
The WRF-Chem model does not directly output the AOD and thus has to be calculated using Eqs. (1) and (2). Where refers to height (km) of the model level, to the thickness between model levels, EC55 to the atmospheric extinction coefficient at 550 nm (km−1), PH to perturbation geopotential (m2 s−2), PHB to base-state geopotential (m2 s−2), V to the vertical layer, t to the time interval, lat to latitude coordinates and long to longitude coordinates. The resulting AOD refers to the wavelength at 550 nm. AERONET AOD retrievals at this wavelength are not readily available. To make results comparable, AERONET AOD870 has been converted to AOD550 using the Ångström exponent equation and the Ångström exponent of wavelength 440–870 nm (Ångström, 1929). A statistical comparison of AOD550 produced from various wavelengths was carried out, revealing negligible statistical differences regardless of the wavelength used in the conversion, also highlighted in the work of Eck et al. (1999).
WRF-Chem outputs variables in regular (hourly) time intervals, while AERONET keeps records in non-constant interval steps. To temporally collocate the values, observations falling within a ±30 min range, centred at the model forecast hour, are averaged out. A spatial collocation is then implemented to modelled outputs of horizontal resolution 20 × 20 km. Modelled outputs are interpolated from a three-dimensional field to a horizontal plane at the station's height using the approach described in Ladwig et al. (2017). In summary, the data are interpolated from a curvilinear grid to an unstructured grid using the nearest grid point to the station's coordinates. This approach has been repeated using the four and nine neighbouring grid points with no statistically significant differences. Finally, an inverse distance squared algorithm is applied to output the variables at the coordinates and elevation of each station.
2.5.2 EMEP
The EMEP (European Monitoring and Evaluation Programme) is a pan-European database of ground-based aerosol concentration observations. EMEP was established following the convention of Long-range Transboundary Air Pollution in 1979. European member states are legally bound to monitor and report emissions to EMEP with a standard temporal resolution of daily intervals. These are then stored in the EMEP open-access database and are mapped using a 0.1∘ × 0.1∘ longitude–latitude grid (Mareckova et al., 2012).
To compensate for the poor temporal and spatial resolution of the EMEP database for the period under investigation, hourly products of PM10 at the EMEP background station of Agia Marina, Cyprus, were provided by the Department of Labour Inspection Cyprus (DLI) (Cyprus, 2021). For the comparison of observed PM10 with simulated values, a spatial collocation was carried out in a similar manner to the one described in Sect. 2.5.1. Since both simulated and observed values are reported at hourly intervals, no temporal collocation was required.
2.5.3 PollyXT
The PollyXT lidar monitors the vertical profiles of dust concentrations at the PANGEA observatory at Antikythera, Greece (Marinou et al., 2017). The products are obtained through the application of the Earlinet SCC algorithm described in D'Amico et al. (2015) and in the methodology presented by Mamouri and Ansmann (2017) and Ansmann et al. (2019). The products are only available during cloud-free conditions. It is noted that the calculated dust mass concentrations have an uncertainty of 20 %–30 % for a predominantly dust-dominated layer (Ansmann et al., 2019), while the uncertainty increases for a moderately dust-dominated layer and can reach up to 100 % in layers with a small contribution of dust particles (Marinou et al., 2019).
The PollyXT products were subjected to a spatio-temporal collocation to enable a direct comparison with the simulated data. Observations are derived from 642 m up to 14 km above sea level, with a 60 m vertical resolution. For the vertical collocation of the two datasets, the PollyXT products were averaged for each model vertical bin to match the vertical resolution of the WRF-Chem model. Meanwhile, the same methodology described in Sect. 2.5.1 has been used for the horizontal collocation. PollyXT products are derived in temporal averages between 30 min and 2 h depending on weather limitations. Hence, for the temporal collocation, model hourly products were averaged to the PollyXT time windows.
2.5.4 MIDAS
For evaluating the WRF AOD spatial patterns, the recently developed MIDAS dataset (Gkikas et al., 2021, 2022) has been utilised as a reference. MIDAS provides columnar mid-visible (at 550 nm) dust optical depth (DOD) derived through the combination of quality-assured MODIS-Aqua AOD retrievals and the portion of AOD attributed to DOD (MDF; MERRA-2 dust fraction) extracted from MERRA-2 (Modern-Era Retrospective analysis for Research and Applications version 2; (Gelaro et al., 2017; Randles et al., 2017)). Within MIDAS, the quality-assured MODIS-Aqua AOD, as well as DOD (along with its associated uncertainties), are provided at a fine spatial resolution (0.1∘ × 0.1∘) and at a global scale (both over land and maritime surfaces). Since the current WRF model version does not output DOD, the evaluation is focused only on the AOD simulated fields, mainly driven by the spatiotemporal variations of the intense dust loads, spreading within the region of interest and dominating other aerosol species.
In order to achieve the optimum MIDAS-WRF collocation, we are processing the swath level MIDAS data, where for the constructed domain, MIDAS has approximately five to seven daily overpasses corresponding to 5 min segments (Levy et al., 2013). The segments have been reprojected from their native grid (Hubanks et al., 2015) to an equal latitude–longitude grid at 0.1∘ × 0.1∘ spatial resolution. After conducting several sensitivity tests, the MIDAS dataset was regridded to 0.4∘ to minimise the noise effect noted when weak loads of AOD are recorded. In contrast to MIDAS, WRF AOD is mapped on an equidistant, 20 × 20 km, Lambert conformal conic projection. To project MIDAS and WRF-Chem AOD on a common grid, both have been regridded on an equal latitude–longitude grid at 0.4∘ spatial resolution. Regridding was carried out using the nearest neighbour method with a search radius around each grid pixel set at 20 km. The radius was tested with values ranging from 10 to 50 km, resulting in percentage difference ranges of 0.008 %–0.04 % and 0.0007 %–0.003 % for MIDAS and WRF outputs, respectively. The availability of MIDAS observations depends on the clouds' presence and deterring reasons for retrieving MODIS AOD. This leads to sparse AOD grid values compared to the WRF continuous domain coverage. Thus, a mask function is applied on WRF in the areas where MIDAS failed to resolve a value for AOD and simultaneously temporally collocates the two datasets. For the temporal collocation, three methods have been tested: a 3 h rolling average, a weighted average and use of the nearest hour. The relative difference between the latter and the former two approaches indicated poor performance and was hence discarded. Meanwhile, a comparison between the two remaining methods revealed negligible statistical differences. The weighted average method has been used to compute the collocation following Eq. (3), where AODi refers to the AOD at the nearest hour, AODi+1 to the AOD for the hour ahead and min to the minute of the MIDAS overpass. The hourly outputs have then been summed to produce daily AOD maps. The edges of the overpasses have a slight overlap; to overcome this, values at the overlaps were averaged. Finally, the daily sum maps were averaged to produce a single map for the whole period under investigation.
2.5.5 LIVAS
For the vertical assessment of the simulated dust patterns in the broader study region, the LIVAS (LIdar climatology of Vertical Aerosol Structure for space-based lidar simulation studies) pure-dust product, initially presented in Amiridis et al. (2013) and updated in Marinou et al. (2017), was utilised. LIVAS comprises a global dataset covering the period between June 2006 and December 2020 and is provided at a per-granule, level 2 resolution similar to the original CALIPSO (Cloud-Aerosol Lidar and Infrared Pathfinder Satellite Observations) level 2 profile products.
The pure-dust extinction coefficient product has been developed through the application of the depolarisation-based separation method introduced by Sugimoto et al. (2003) and Shimizu et al. (2004) and optimised for the Saharan region by Tesche et al. (2009). Marinou et al. (2017) calculated the uncertainty of the product in the region under investigation to be less than 20 % for altitudes up to 6 km. The products have a fine vertical resolution of 60 m and are projected on a uniform grid of 1∘ × 1∘ horizontal resolution. To make observations directly comparable to simulated values, the WRF horizontal grid has been regridded to a 1∘ × 1∘ latitude–longitude grid and vertically co-located following the methodology described in Sect. 2.5.3.
In Sect. 3.1, the WRF-Chem model runs for spring and autumn are compared, and the meteorological conditions and the subsequent effects on dust transport for the selected study period are discussed. In Sect. 3.2 and 3.3, comparisons of assimilated and control outputs to ground- and satellite-based observations are summarised.
3.1 Seasonal patterns and dust outbreak in October 2020
The WRF-Chem model, using both control and assimilated Aeolus ECMWF-IFS datasets, was run for 2 months in spring and 2 months in autumn. Figure 1, depicting the differences (assimilated–control) of the averaged dust concentrations and wind vectors at the atmospheric level of 850 mbar, reveals that the use of the assimilated dataset has negligible differences from the control one during the spring months (Fig. 1a), while a difference is observed for autumn (Fig. 1b). During the spring months, the differences in dust concentration between the two model runs are less than 20 µg m−3 for most of the study region. Meanwhile, for autumn the differences are more pronounced. A dipole seems to prevail, with the control run having higher concentrations over the central Mediterranean and the assimilated run over the eastern Mediterranean, which is especially true for October. Additionally, a comparison of the two model runs using PM10 from the EMEP station of Agia Marina, Cyprus (Fig. A2 in the Appendix), for spring supports the finding of a small deviation between the two model runs observed for spring. This finding suggests that the impact of the assimilated dataset has temporal (seasonal) variation for the region under investigation, which should be confirmed from long-term runs.
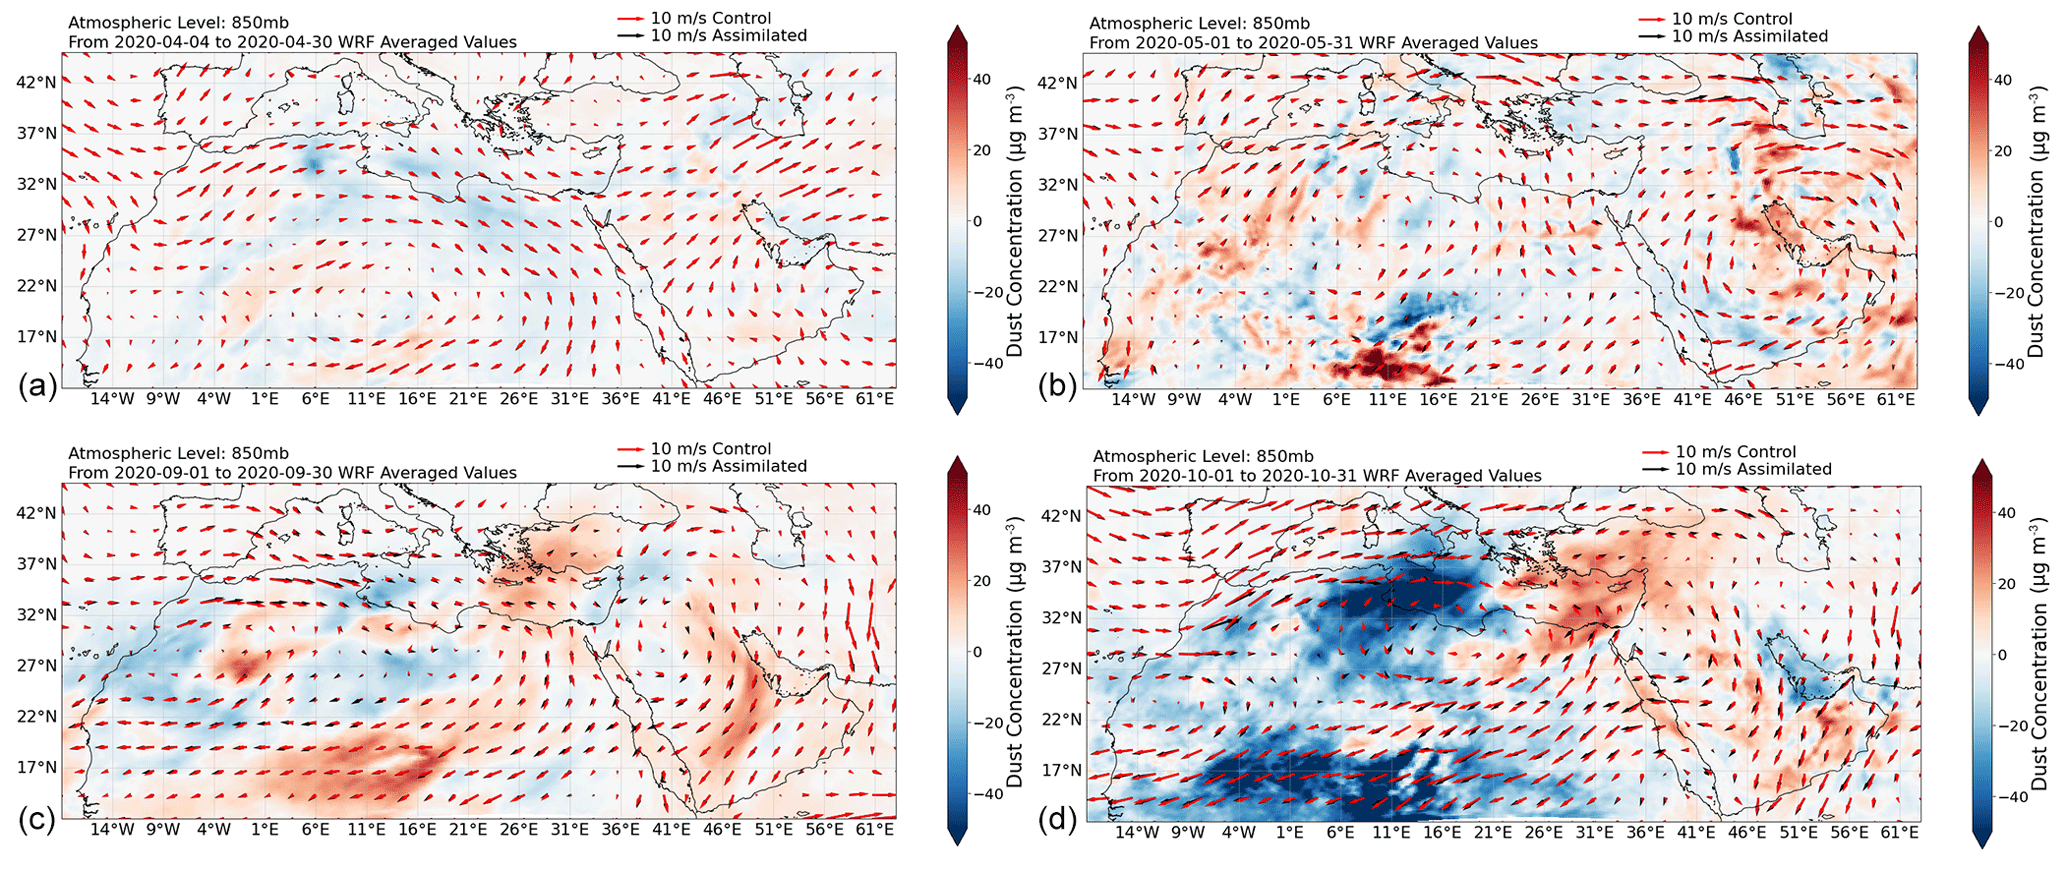
Figure 1Depiction of the difference in monthly average dust concentration and of wind vectors between the assimilated and control datasets, averaged for spring months (a, April, b, May) and autumn months (c, September, d, October) for the atmospheric pressure level of 850 mbar, where the red arrows represent the control wind vectors and the black arrows the assimilated ones.
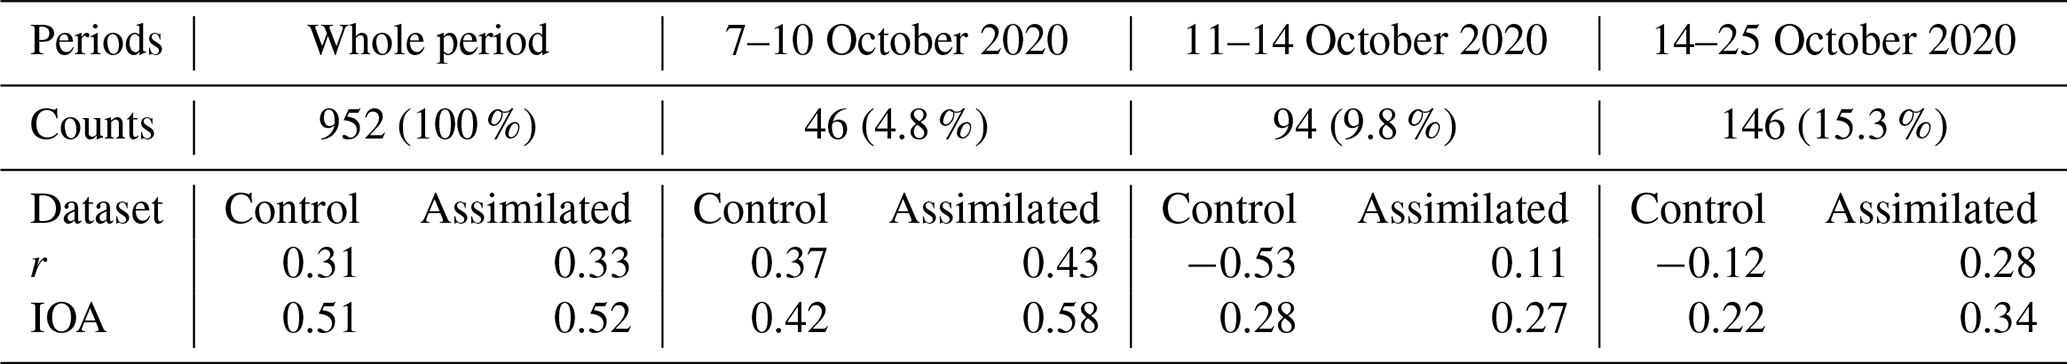
The availability of surface PM10 observations at the Agia Marina, Cyprus, station, allowed for an initial assessment of the two runs for autumn. Depicted in Fig. 2, two instances, highlighted in blue, mark periods where the assimilated run outperforms the control run, while one instance, highlighted in red, depicts the opposite. Summarised in Table 1 is the statistical analysis for the autumn period, as well as for the three highlighted instances, where counts refer to the number of data points within each time frame, r stands for the correlation coefficient and IOA stands for the index of agreement. The IOA measures the closeness in magnitude between two variables and is a unitless metric ranging from 0 to 1, where 1 indicates perfect agreement (following Eq. 5 in Willmott et al., 2012). During most of the period, minor differences are recorded between the two runs. However, the assimilated run performs slightly better than the control, with the highest improvement observed for the interval of 20–25 October. It is noted that the total sample size is small to draw statistically significant conclusions. The period 14–25 October 2020 was selected due to the formation of a dust storm of anticyclonic nature affecting the modelled domain, with notable deviations between the two model runs. The selected period allows for an investigation of the impact of ECMWF-IFS Aeolus on meteorology and hence dust mobilisation.
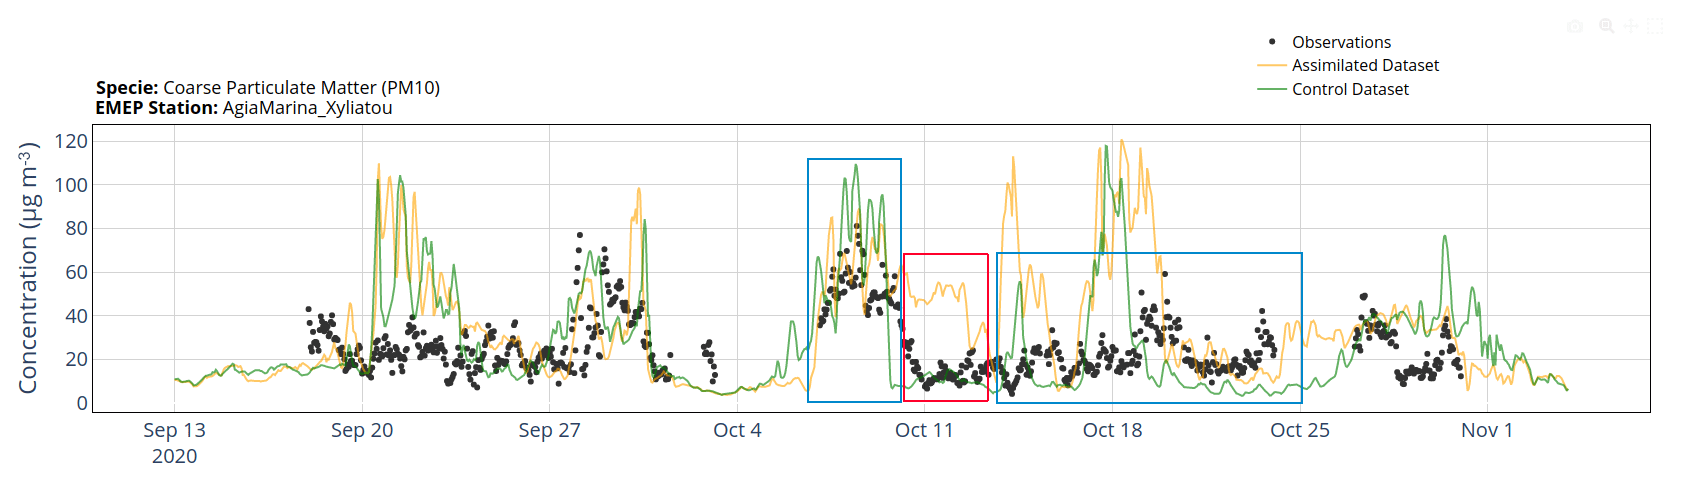
Figure 2Time series of PM10 concentrations recorded at Agia Marina, Cyprus, ground station for the months of autumn, where the green represents the control run, the yellow represents the assimilated run, and the black dots represent the observed values. Additionally, the blue highlighted boxes represent periods where the assimilated run outperforms the control run, while the red box represents the opposite.
Table 1Statistical comparison of modelled runs with PM10 concentrations recorded at Agia Marina station, Cyprus, for the whole period and the highlighted time windows.
In the study of Hatzaki et al. (2014), two major anticyclonic routes were identified, one parallel to the Iberian Peninsula and another parallel to the North African Coast, with the latter being the dominant route during summer and autumn. Consistent with past literature, during 14–19 October, a high-pressure cell developed in both simulations covering the Levantine Basin and extending to North Africa, as seen in Fig. 3. The high-pressure conditions ushered clockwise wind motion, forming an anticyclone just north of the great sand sea desert in the Sahara region, (30∘ N, 25∘ E). The warm-core anticyclone developed from the convergence of the upper troposphere, leading to air subsidence and warmer temperatures. The anticyclone developed near the 30∘ N line, consistent with past literature findings of warm-core anticyclonic development in the subtropics and midlatitude regions (Flocas et al., 2001; Hatzaki et al., 2014).
The anticyclogenesis on the 14–19 October mobilised and transported dust through the Gulf of Sidra into the Mediterranean Basin. The two models have near-identical pressure zones for this period (Fig. 3a and b). However, the minor deviations led to dust transported to the northeast in the assimilated run, with increased dust concentrations in the western sector of the anticyclone, and to the southwest in the control run, with higher dust concentrations over Egypt, as depicted in Fig. 4a. This can be attributed to the extension of the high-pressure cell northwest of Cyprus in the assimilated run, driving winds towards the Dodecanese and Anatolia. In contrast, the weaker high-pressure cell in the control run led to dust transport southwards from the Levantine Basin to Egypt. During 20–25 October, the high-pressure system moved westwards. In the control run, it remained more defined (Fig. 3c), while in the assimilated run, it weakened and dissipated (Fig. 3d). A second anticyclone formed in the control run with its focal point just off the coast of Tunisia, as indicated in Fig. 4b and also observed in terms of absolute vorticity (see Fig. A3 in the Appendix). The anticyclonic motion is not pronounced in the assimilated run, leading to markedly lower dust concentrations over the central Mediterranean and higher values over Egypt and the Middle East. The higher concentrations can be attributed to the more stagnant conditions in the eastern Mediterranean, where clockwise wind motion around 30∘ N 40∘ E mobilised dust from the Arabian Desert towards the Red Sea and the Levantine Basin. The anticyclonic motion modelled in the control run led to higher wind speeds over the central Mediterranean and Libya, while northeasterly winds passed through the Levantine Basin (Fig. A3a in the Appendix). Meanwhile, in the assimilated run, lower wind speeds were simulated over the Levantine and central Mediterranean basins and on the coastline of North Africa (Fig. A3b in the Appendix).
Additionally, four FLEXPART-WRF air mass back-trajectories were simulated for a total of two 5 d periods (14–19 and 20–25 October), with particles arriving at the Antikythera, Greece, station and the Agia Marina, Cyprus, station. Similar air mass routes were noted for both stations, with results being more notable for particles arriving at the Agia Marina station on 19 October. Figure 5 reveals apparent differences in the vertical height and source regions of aerosols arriving at the Agia Marina, Cyprus station, on 19 October at 02:00:00 UTC. The assimilated run simulated the arrival of aerosols from North African dust sources, while in the control run aerosols originated from continental Europe.
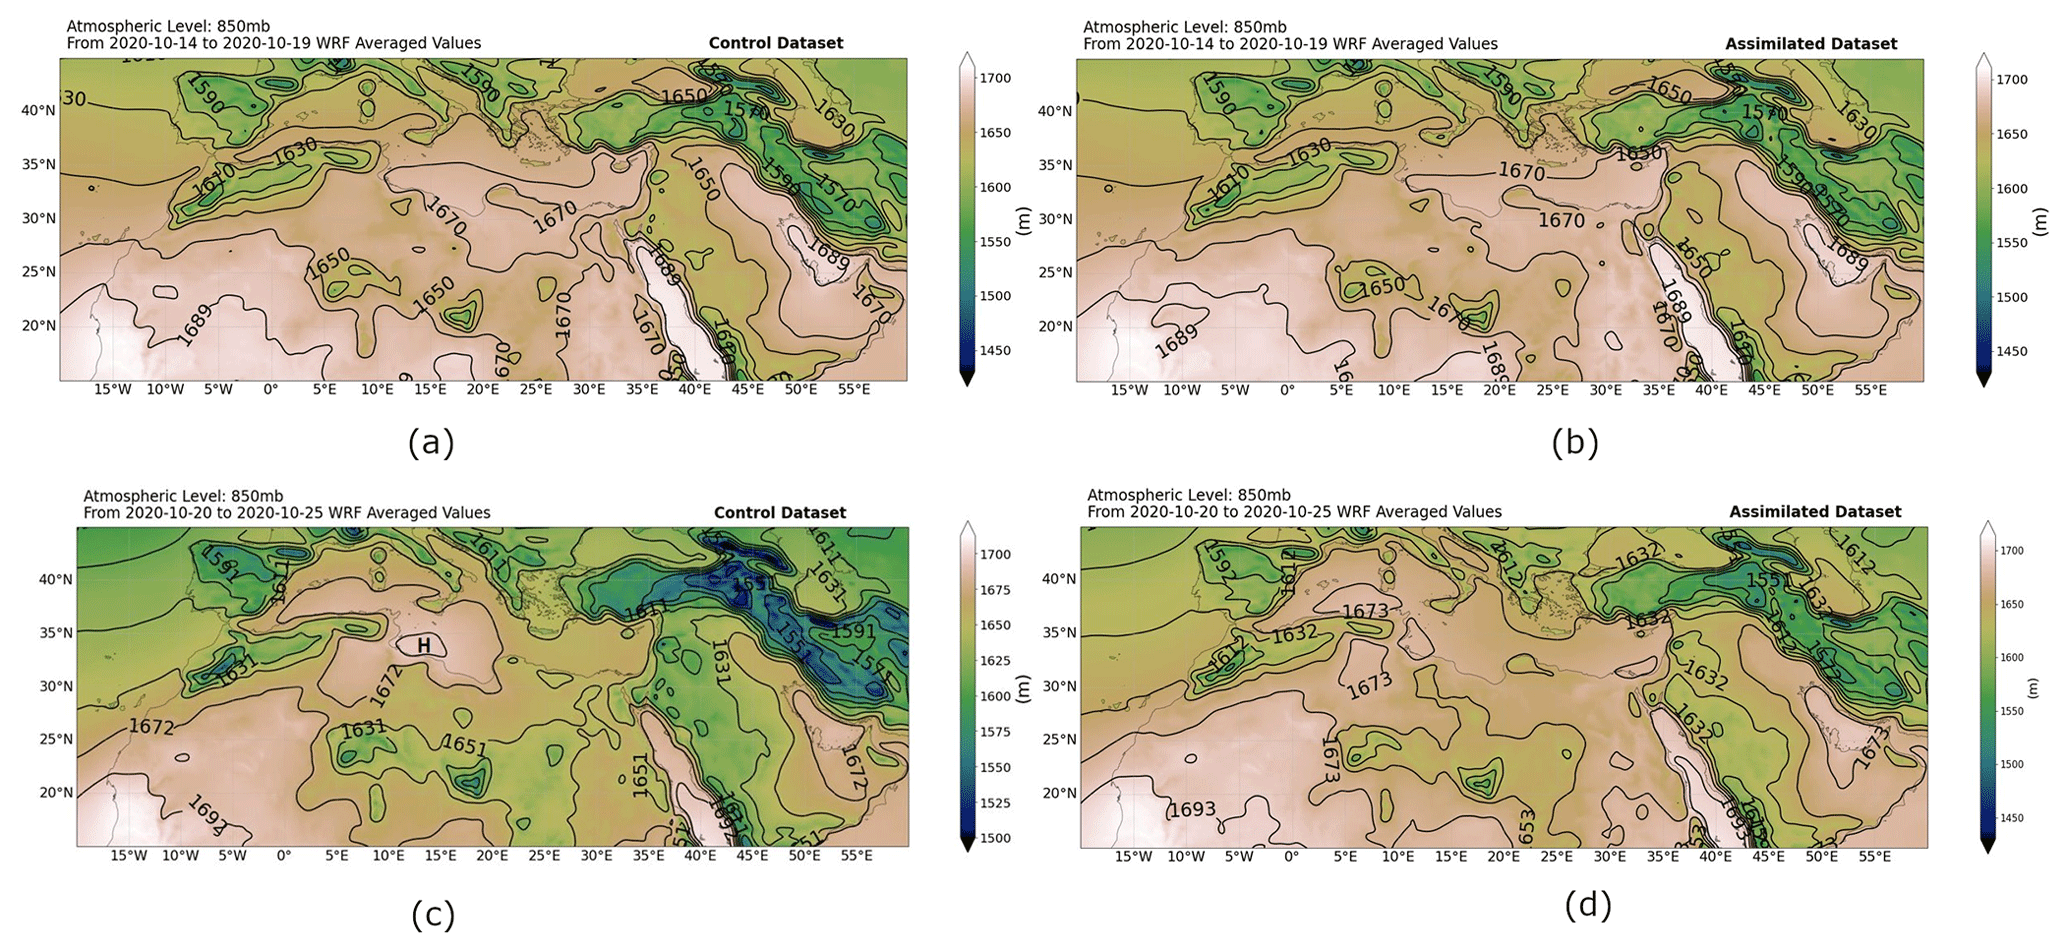
Figure 3Pressure gradient of model runs for 14–25 October 2020. Representation of the averaged geopotential height for 14–19 October in the control run (a) and assimilated run (b) and for 20–25 October in the control run (c) and assimilated run (d) for the atmospheric layer at 850 mbar.
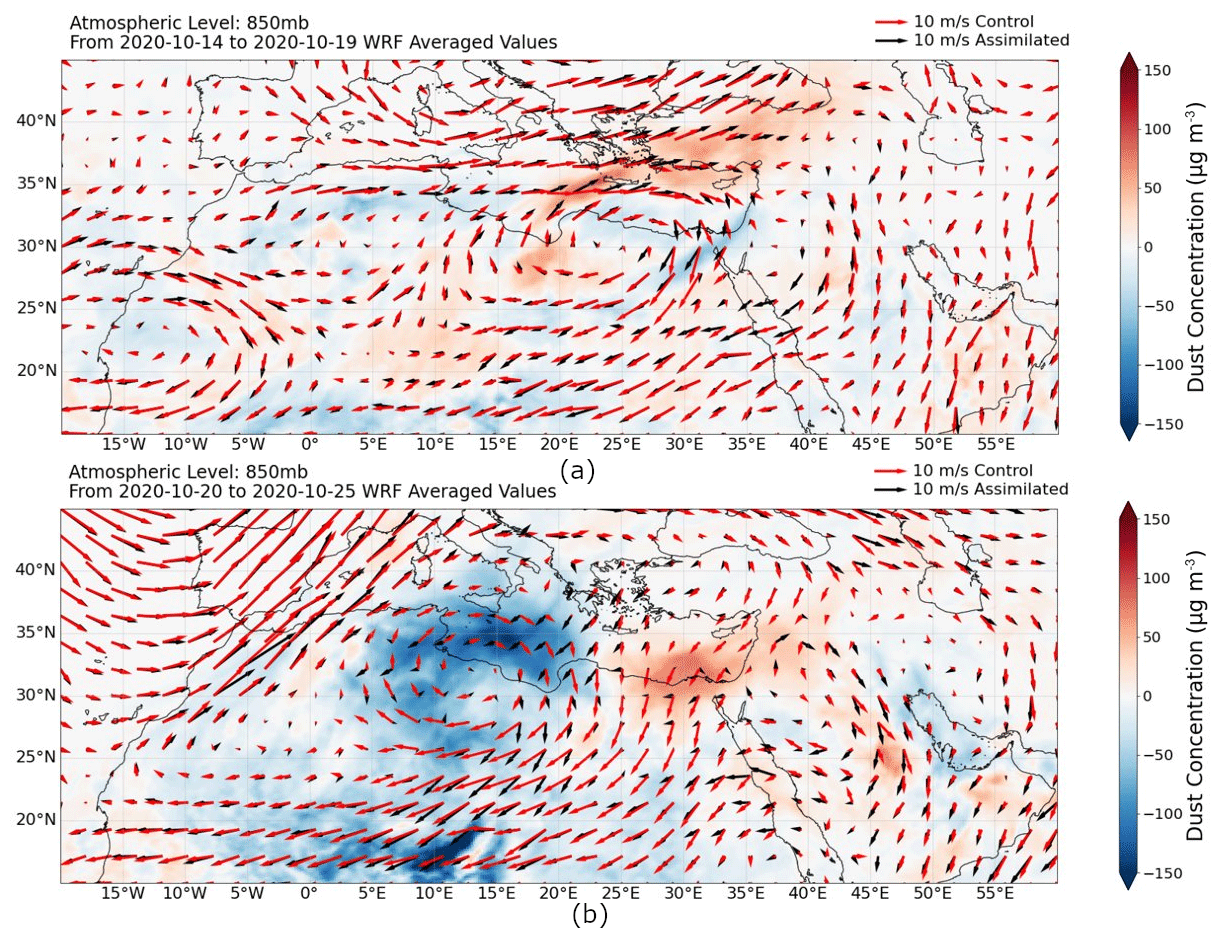
Figure 4Averaged dust concentration differences (assimilated–control) and wind fields at the atmospheric level of 850 mbar for the time-averaged periods, 14–19 October (a) and 20–25 October (b), where the red arrows represent the control wind vectors and the black arrows the assimilated ones.
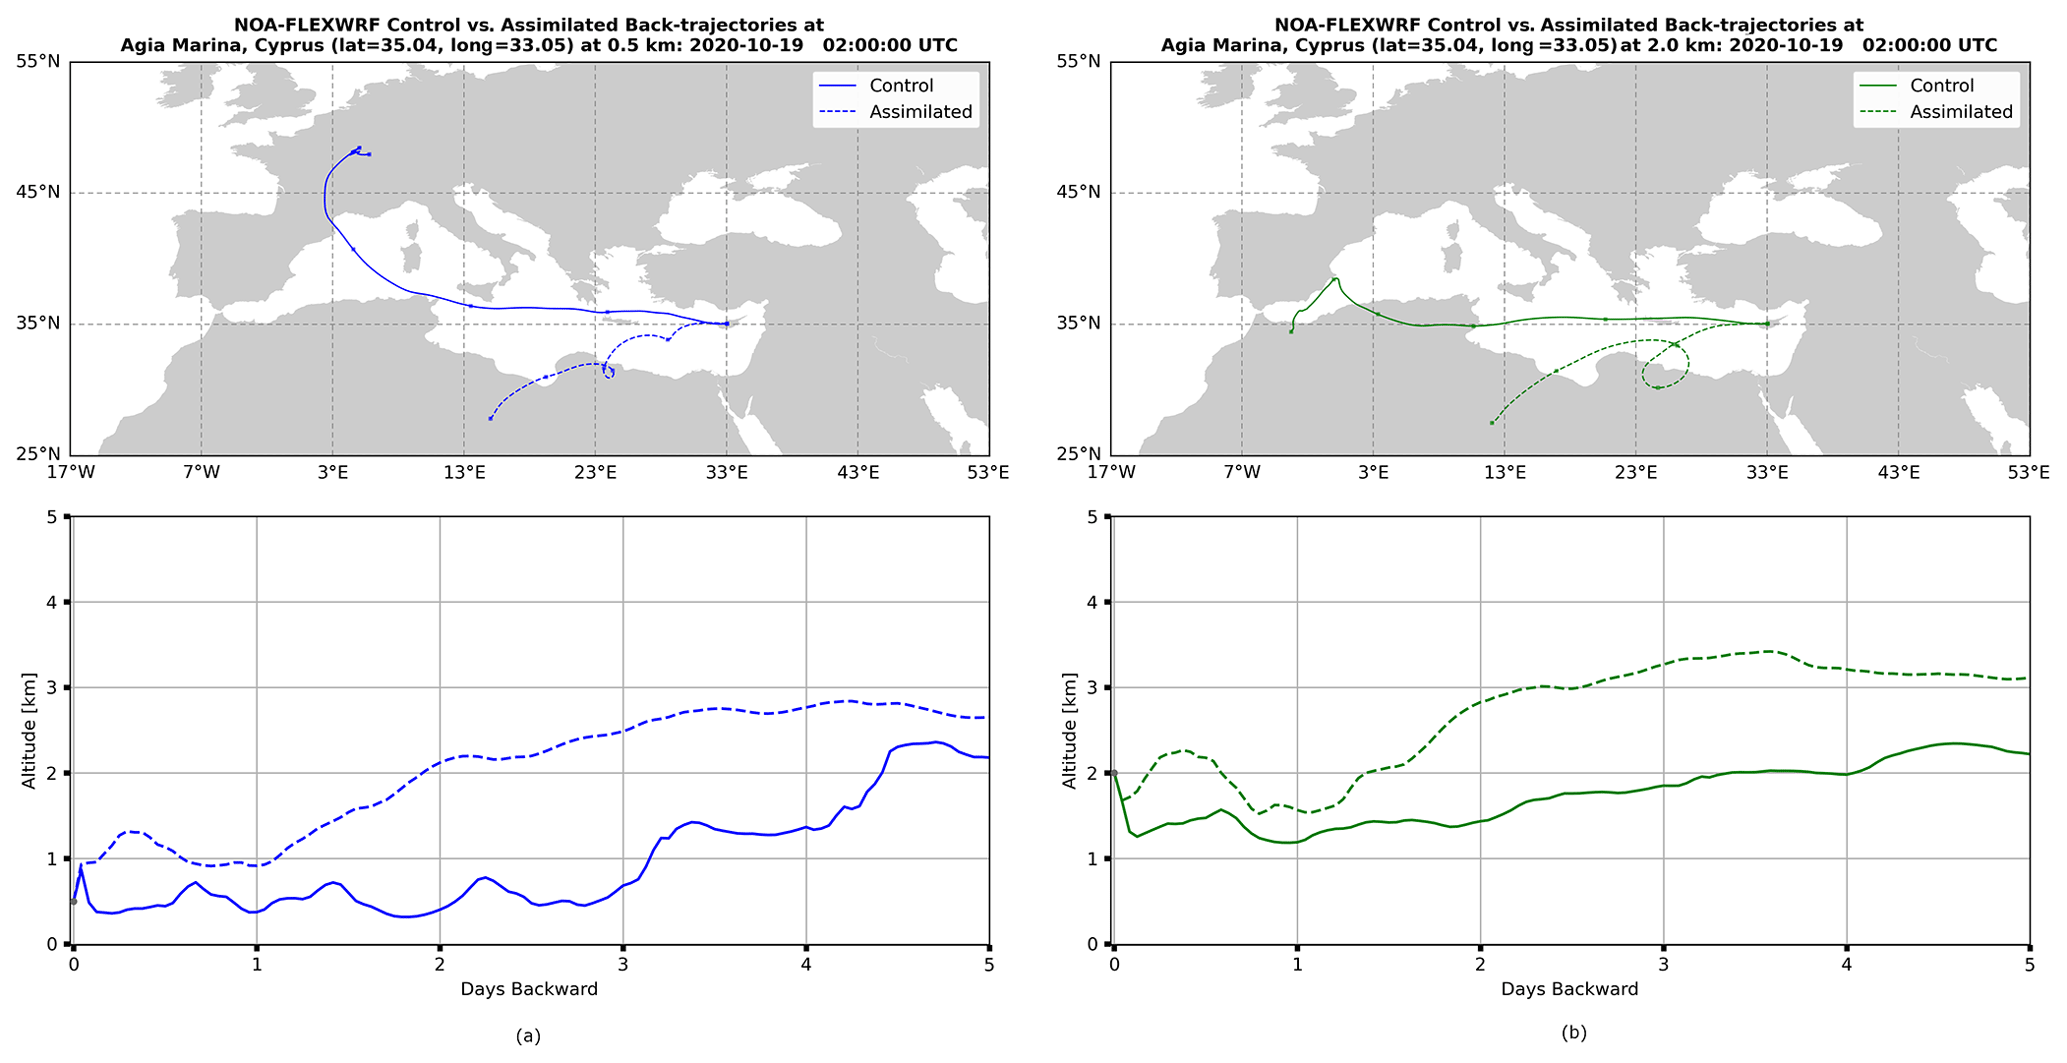
Figure 5The top row depicts the FLEXPART backward trajectories for tracer particles arriving at the Agia Marina, Cyprus, station at 0.5 km (a) and at 2 km (b) on 19 October at 02:00:00 UTC. The solid line represents the trajectory of the control run, and the dashed line represents the trajectory of the assimilated run. Additionally, the altitude inclinations of the particles are depicted in the bottom row.
3.2 Ground-based evaluation
For the horizontal spatio-temporal evaluation of the model runs, AOD has been sourced from 56 AERONET sun photometers within the whole extended domain. The map of stations used can be found in Fig. A4 in the Appendix. For the vertical evaluation of dust concentration, the PollyXT lidar at the Antikythera station in Greece has been used.
The simulated high dust concentration over the central and eastern Mediterranean from 14 to 25 October (Fig. 4) led to the assumption of a dust-dominated AOD, which is also supported by FLEXPART trajectories (Fig. 5). In the study of Formenti et al. (2001), the Mediterranean Basin was characterised as a hotspot of long-range transport of tropospheric trace gases and aerosols with base values 2 to 10 times higher than the hemispheric background troposphere (Lelieveld et al., 2002). The pressure gradient between the Azores High and Asian monsoon causes an eastward influx of small-sized particles into the EMME region (Lelieveld et al., 2002). To identify dust-dominated loads of AERONET total atmospheric column retrievals, a filter on AOD and Ångström exponent was applied. In previous AOD studies in the EMME region, the cut-off thresholds for AOD and Ångström indicating a dust-dominated AOD have been placed within the ranges of > 0.15–0.35 and < 0.40–0.75, respectively (Fotiadi et al., 2006; Basart et al., 2009; Toledano et al., 2007). The threshold of Ångström exponent < 0.75 has been selected following the study of Gkikas et al. (2021), which found this threshold to perform well at capturing coarse particles. Additionally, a cut-off level of AOD > 0.15 has been used to minimise the contribution from coarse sea salt aerosols (Gkikas et al., 2021). Thereby, values that satisfy these conditions were classed as dust-dominated and were used in the statistical analysis summarised in Table 2. It is noted that the unfiltered AOD readings, accompanied by the Ångström exponent values, are used in the time series plots (Fig. 6), showcasing all available observations.
A statistical improvement is obtained for all 56 AERONET stations when implementing the Aeolus wind dataset, which is stronger for stations located in the Central Mediterranean and EMME regions (stations highlighted in Fig. A4). Metrics were produced for selected stations impacted by the anticyclogenesis mentioned above (14–25th), as well as for the two smaller time windows (14–19 and 20–25). This was done to test whether the improvement arises due to the materialisation of an anticyclone only in the control run from the 20th onwards (see Sect. 3.1). For both periods and the whole period, an improvement of 0.20–0.22 in the correlation coefficient is obtained using the assimilated dataset. This indicates that the improvement is not solely attained from an isolated instance. The anticyclonic conditions that prevail in the control run for the period of 20–25 October 2020 over the central Mediterranean are the underlying reason for the higher AOD profiles modelled at the impacted stations of Lampedusa and Lecce University in Italy, Gozo in Malta, and Finokalia and Antikythera in Greece. Meanwhile, the more stagnant wind conditions simulated in the assimilated run produced lower AOD values atop these stations and are more coherent to observations, as depicted in Fig. 6. During this period, the assimilated run computes higher dust concentrations in the Levantine Basin translating to a high AOD, consistent with a high AERONET AOD and low Ångström exponent recorded at Agia Marina and CUT-TEPAK stations in Cyprus, as well as Tel-Aviv University and Sede Boker stations in Israel. The locations of the stations mentioned can be found in Fig. A4 in the Appendix.
Table 2Statistical comparison of filtered AERONET AOD observations to model outputs for all 56 AERONET stations and for selected stations for 14–25 October 2020.
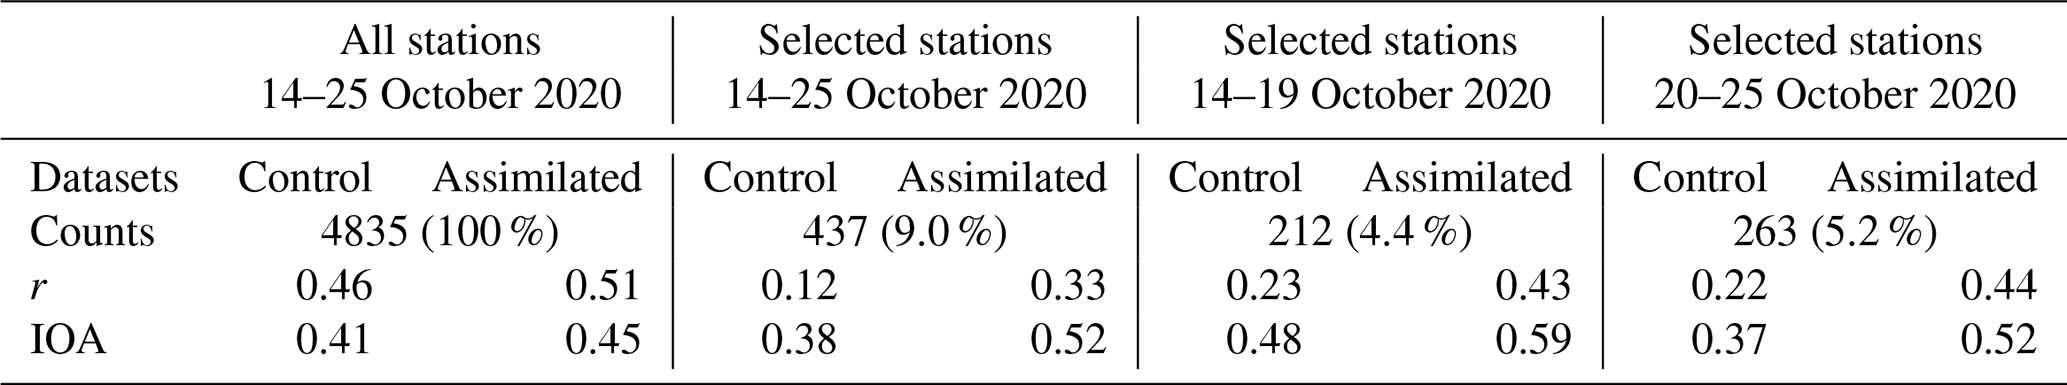
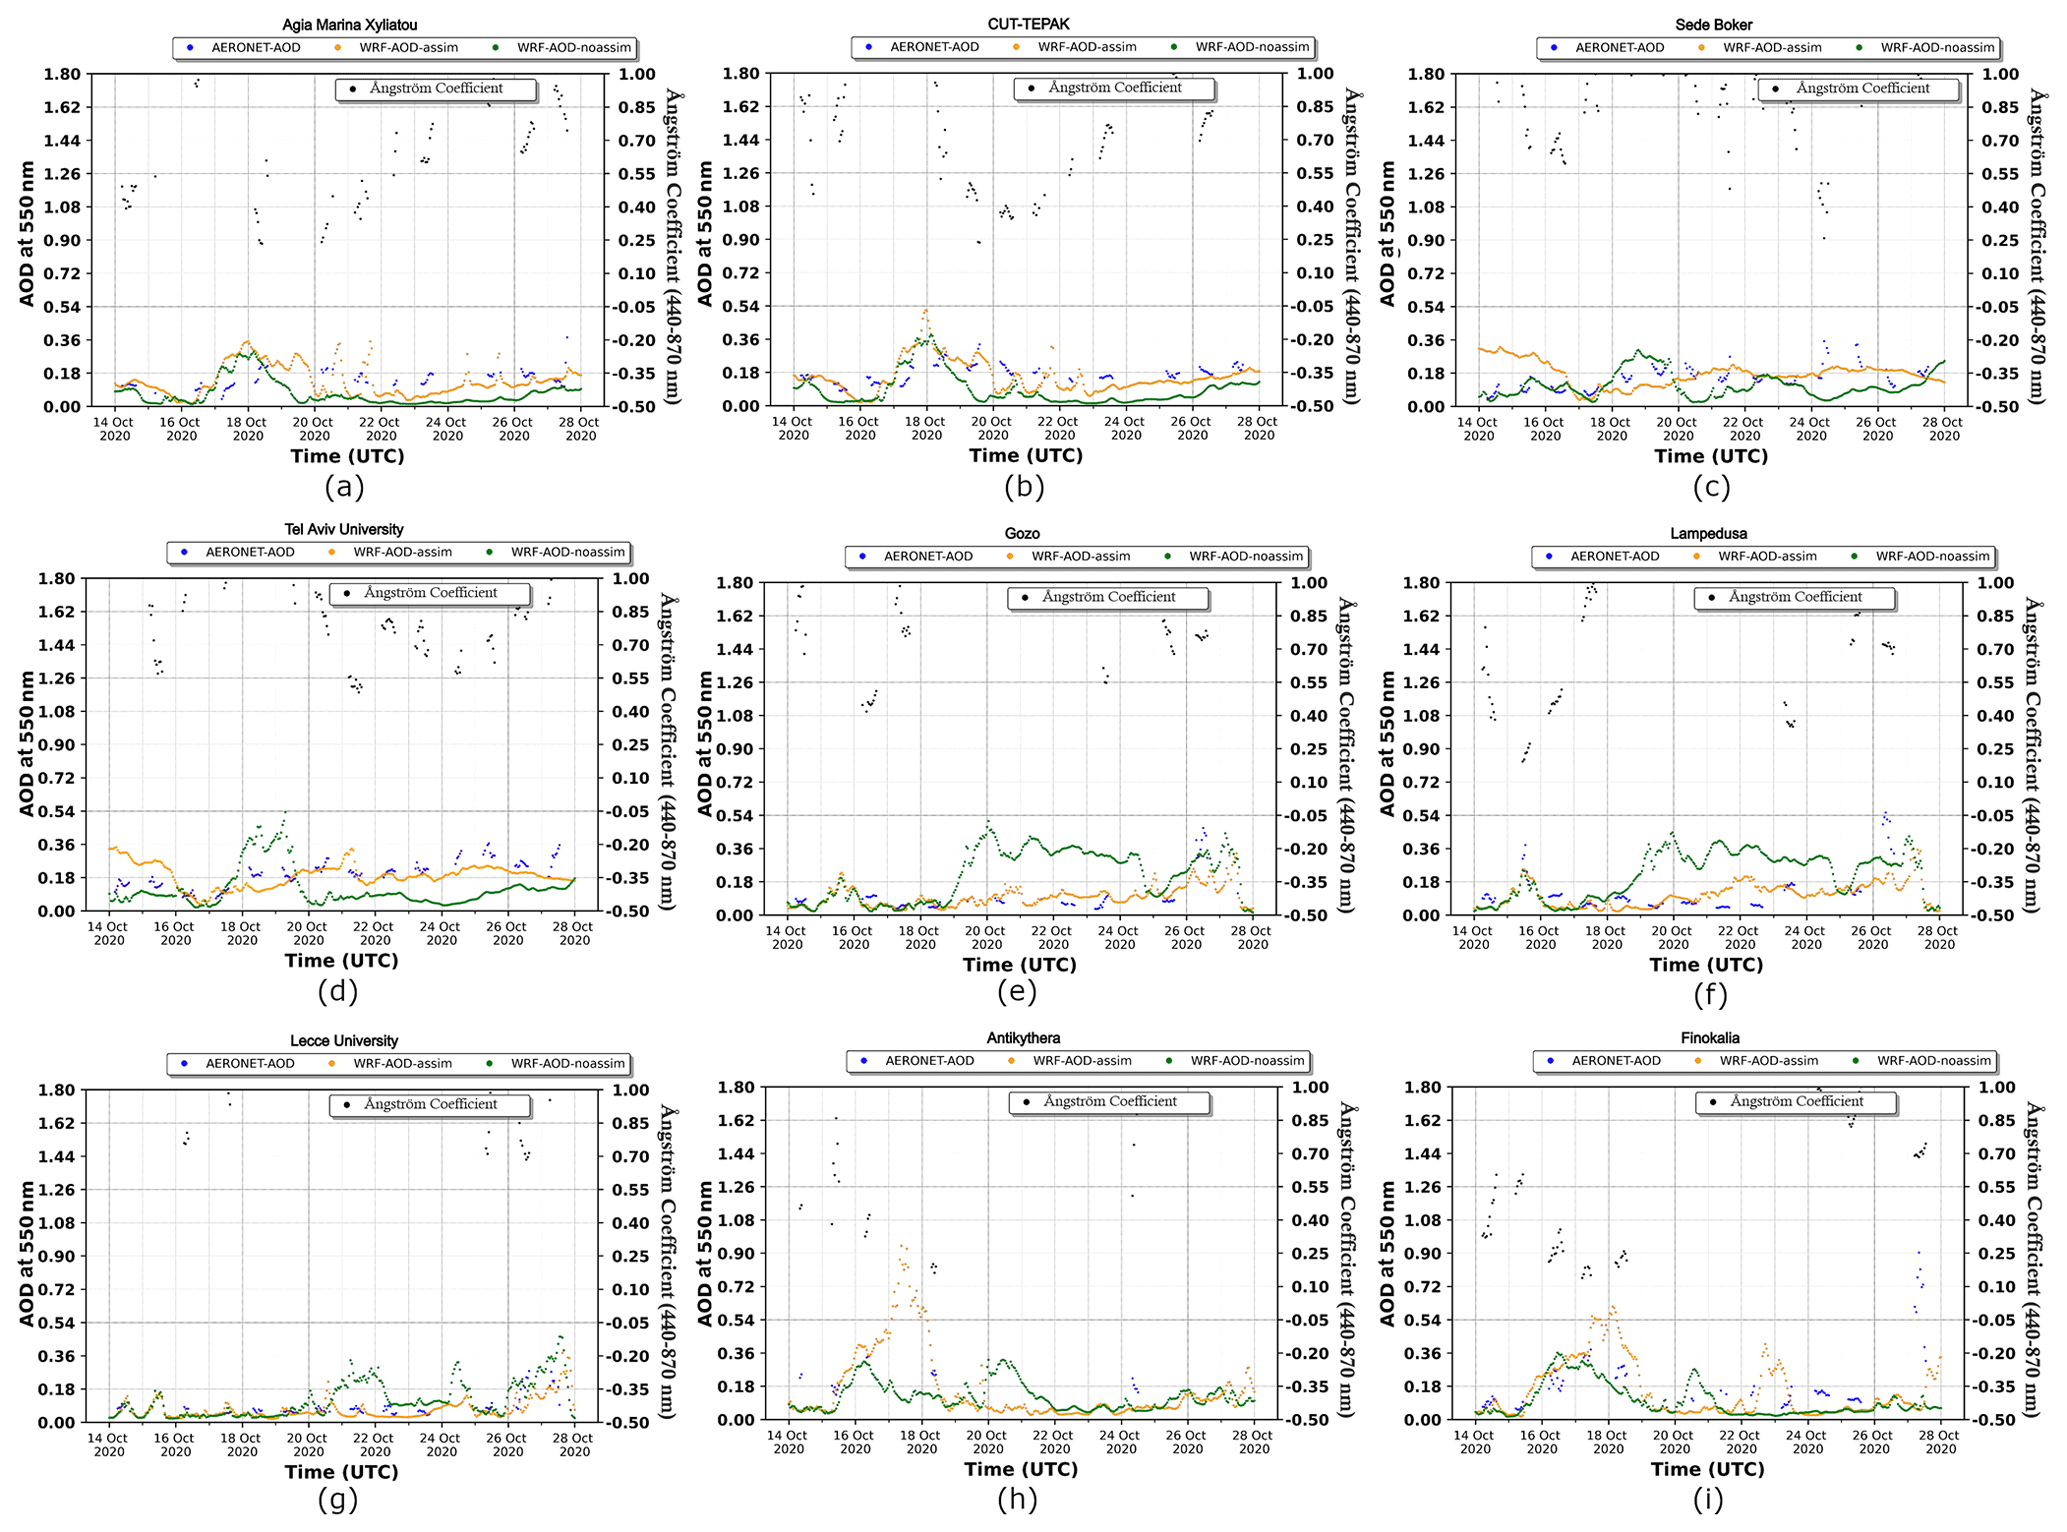
Figure 6Time series plots of observed AOD (blue points) from AERONET stations within the model domain, contrasted against assimilated AOD (yellow) and control AOD (green). Additionally, the black points represent the Ångström coefficient obtained from the AERONET stations.
To supplement AERONET observations, the vertical dust profile at Antikythera station was obtained through the PollyXT lidar, depicted in Fig. 7. In the works of Papayannis et al. (2005), Mona et al. (2006) and Kalivitis et al. (2007), the highest dust concentrations in the Mediterranean during autumn were observed at 2–5 km, consistent with PollyXT observations, while both model runs display the highest dust concentrations from 1–4 km. During 15–19 October, the assimilated run overestimates dust concentrations, whereas the control run underestimates dust concentrations for the same period, with the former having a better fit to the observed vertical structure. The overestimation and underestimation could be explained by the 20 %–30 % uncertainty of the lidar products (Ansmann et al., 2019). The formation of an anticyclone in the control run is materialised as a dust plume over Antikythera, arriving on 20 October and dispersing by 22 October (Fig. 7a). In contrast, the assimilated run did not simulate the dust plume and is in better agreement with the limited observations available from PollyXT and the complementary observations from MIDAS and SEVIRI as shown in Figs. A5 and A6. For MIDAS, AOD values of less than 0.3 are recorded in the area, and from the SEVIRI natural enhanced imagery and dust RGB composites no dust plume is resolved in the area (see Figs. A5 and A6 in the Appendix). During 23–25 October, the assimilated run simulates the arrival of a dust plume earlier than observed but has a more consistent vertical structure relative to the control run.
Overall, these results support the idea that the predictive ability of the WRF-Chem model for the specified regions is improved when implementing the assimilated dataset. This is perhaps related to the volatile conditions present in the Mediterranean during the transitional autumn season.
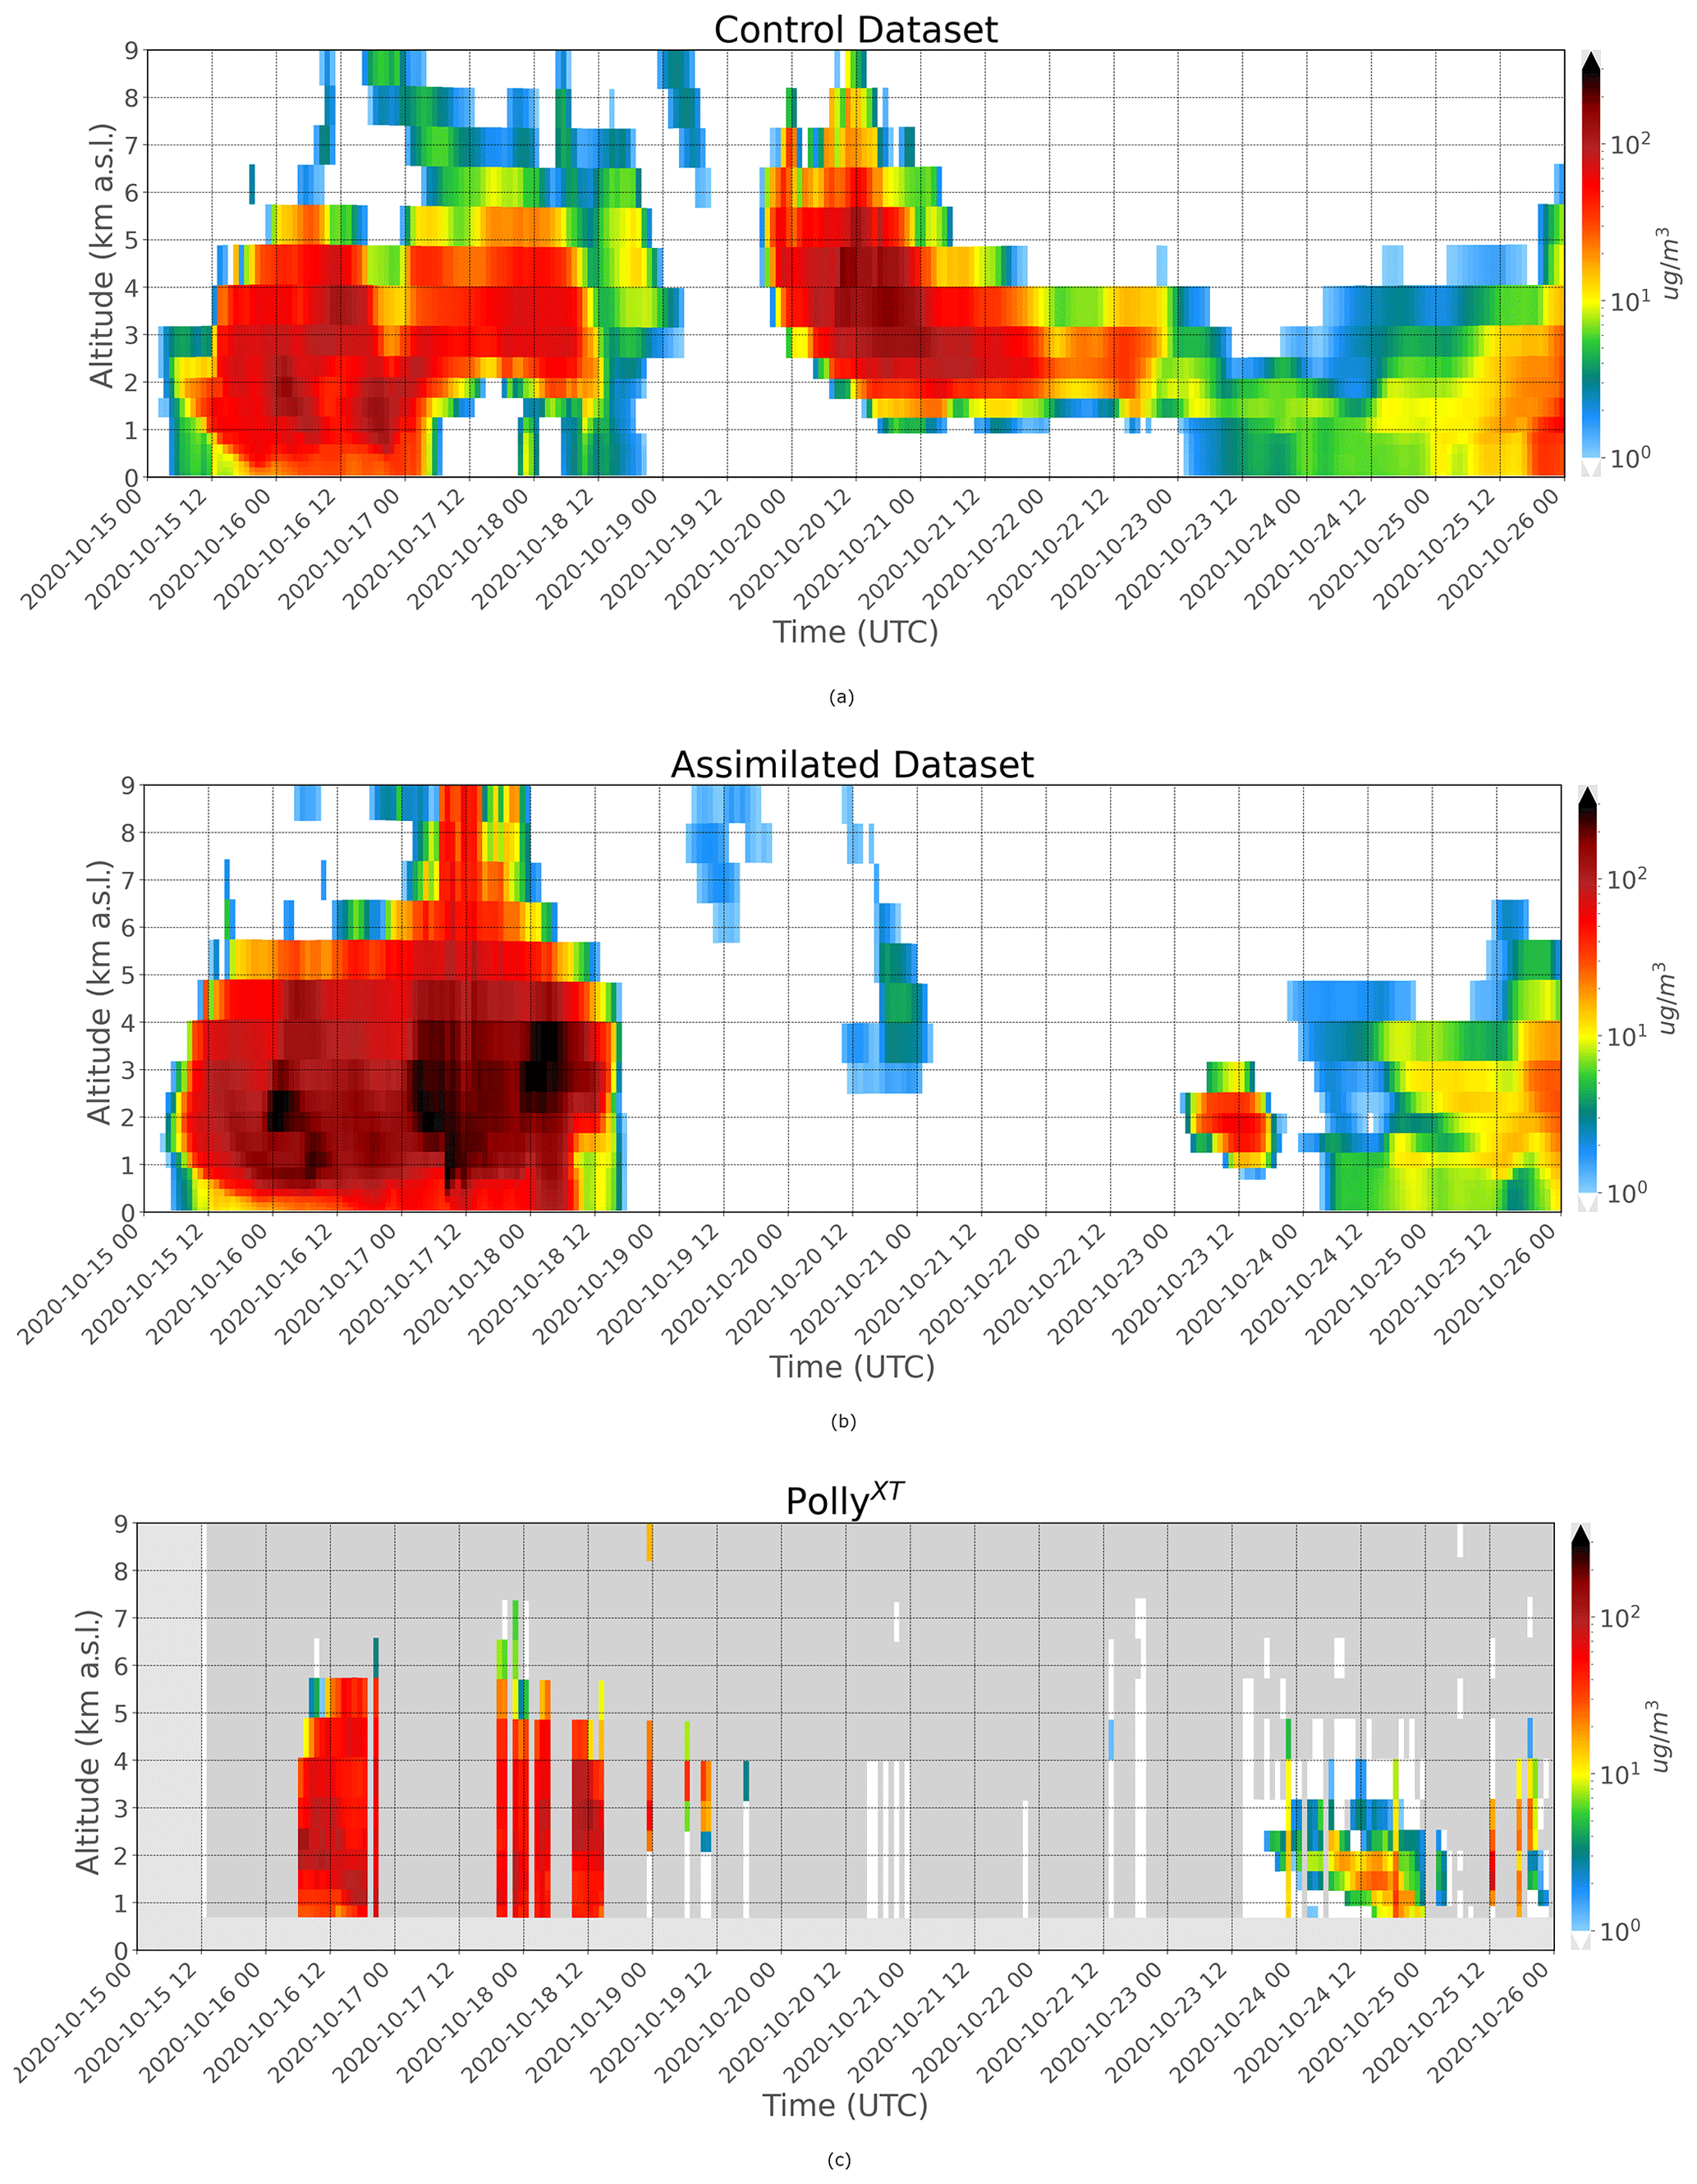
Figure 7Collocated vertical dust concentrations for the control run (a), assimilated run (b) and PollyXT observations (c) at the Antikythera, Greece, station for 15–25 October 2020.
3.3 Satellite-based evaluation
MIDAS and LIVAS satellite observations were sourced to complement ground-based observations from AERONET and PollyXT. MIDAS provides aerosol observations at wide spatial coverage with a fine spatial resolution, whereas LIVAS provides vertically resolved retrievals at fine vertical resolution.
A comparison of the model runs with observations from MIDAS is depicted in Fig. 8a and b, where the highlighted areas indicate locations of significant discrepancies between control and assimilated model runs. As expected, in both simulations, areas of high AOD are concentrated at the Sahel, a dust source region active throughout the year with dust activity peaking in spring (Ravi et al., 2011; Middleton and Goudie, 2001). Introducing the Aeolus assimilated wind dataset improves cohesion between simulated and observed values. This is especially true over the central Mediterranean, where positive bias is reduced by 45 %, attributed to the control run simulating an anticyclone not seen in the assimilated run. Furthermore, a reduction in negative bias by 8 % is achieved over the Fertile Crescent (Mesopotamia), a dust source region that became active from 2006 onwards due to prolonged periods of drought (Kelley et al., 2015).
Dust events close to the domain boundaries are less resolved. In particular, discrepancies east of the Caspian Sea are noted. The relative error of simulating events increases with the magnitude of the event. Hence, strong events close to the boundaries inherit a larger error relative to events in the inner domain, which is the case for this study period. Figure 8c shows the observed AOD values averaged for the period 14–25 October 2020 with three circled localities, where the model in both runs underestimated AOD values. AOD present at location 1 is most likely derived from the Bodélé depression, an enclosed basin of alluvium silts deflated by a low-level jet transporting dust south to the Gulf of Guinea (Todd et al., 2007; Engelstaedter and Washington, 2007; Knippertz and Fink, 2006). The Bodélé depression has been the subject of various past studies due to the inability of global dust models with a coarse horizontal resolution to accurately depict AOD in the area (Bou Karam et al., 2009; Huneeus et al., 2011; Haustein et al., 2012). Location 2 spans over the Mauritania–Mali source area, the Taoudeni Basin, where the modelled, northerly winds displace aerosols further south for both runs overestimating AOD values relative to MIDAS. While locations 1 and 2 are dust-source regions strongly affecting areas in North Africa, the North Atlantic Ocean and the Mediterranean, location 3 is a critical dust source influx for the EMME region. The underestimation of model AOD values in Mesopotamia has been related to the regime shift in dust activity from 2006 onwards (Notaro et al., 2015). It is apparent that the recent changes in land characterisation are not reflected within the current model land configuration scheme. In future versions of the regional WRF-Chem model, the model–observation discrepancies could be further analysed, and appropriate re-configurations can be implemented to accurately depict land use (change).
Using the LIVAS dataset allowed for the evaluation of vertical dust concentration as depicted by Fig. 9. In all instances, the dust resides up to 5–6 km with concentrations lower than 15 µg m−3 at higher altitudes. This is consistent with past literature, which determined the upper altitudes of dust in the Mediterranean to fall within the range of 5–9 km (Alpert et al., 2004; Papayannis et al., 2005). However, simulated dust concentrations atop the Antikythera lidar reached a maxima of 10 km (Fig. 7c). Revealed by Fig. 9a, just off the Libyan coast, the control run simulated a dust plume related to the pronounced anticyclonic activity, which is not present in either the assimilated run or the observed dust vertical profile. Both model runs overestimated dust concentrations relative to LIVAS southwest from the Bodélé depression. The control run overestimated this value by approximately 500 µg m−3 and the assimilated run overestimated it by 200 µg m−3, which could be attributed to the discussion regarding location 1 (Fig. 8c). For 21 October (Fig. 9b), a dust plume is observed on the coast of Egypt that is also modelled by the assimilated run (but shifted by 1∘ to the south) but is absent in the control run.
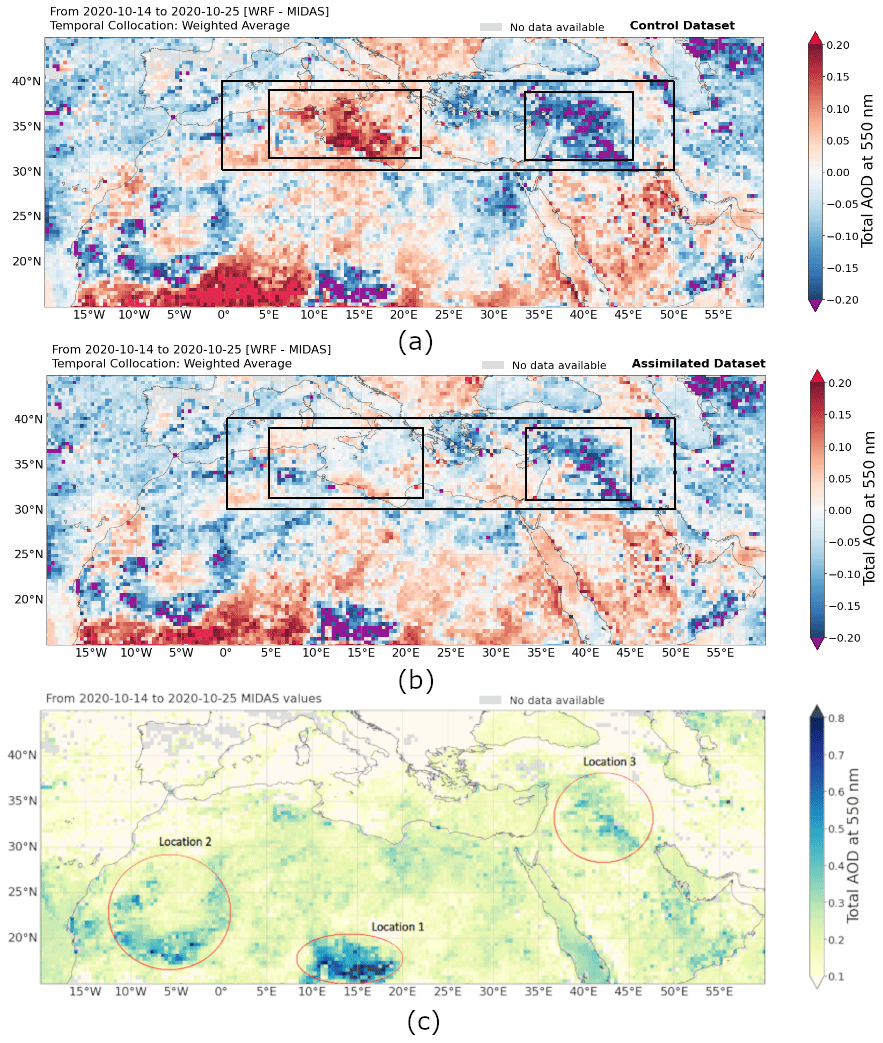
Figure 8Time-averaged differences in AOD (WRF-MIDAS) for the control run (a) and the assimilated run (b), where the black rectangles indicate regions of significant improvement when simulating conditions using the assimilated run. Additionally, (c) represents the observed MIDAS AOD values for the time-averaged period of 14–25 October, where the highlighted red circles indicate locations where both runs underestimate AOD.
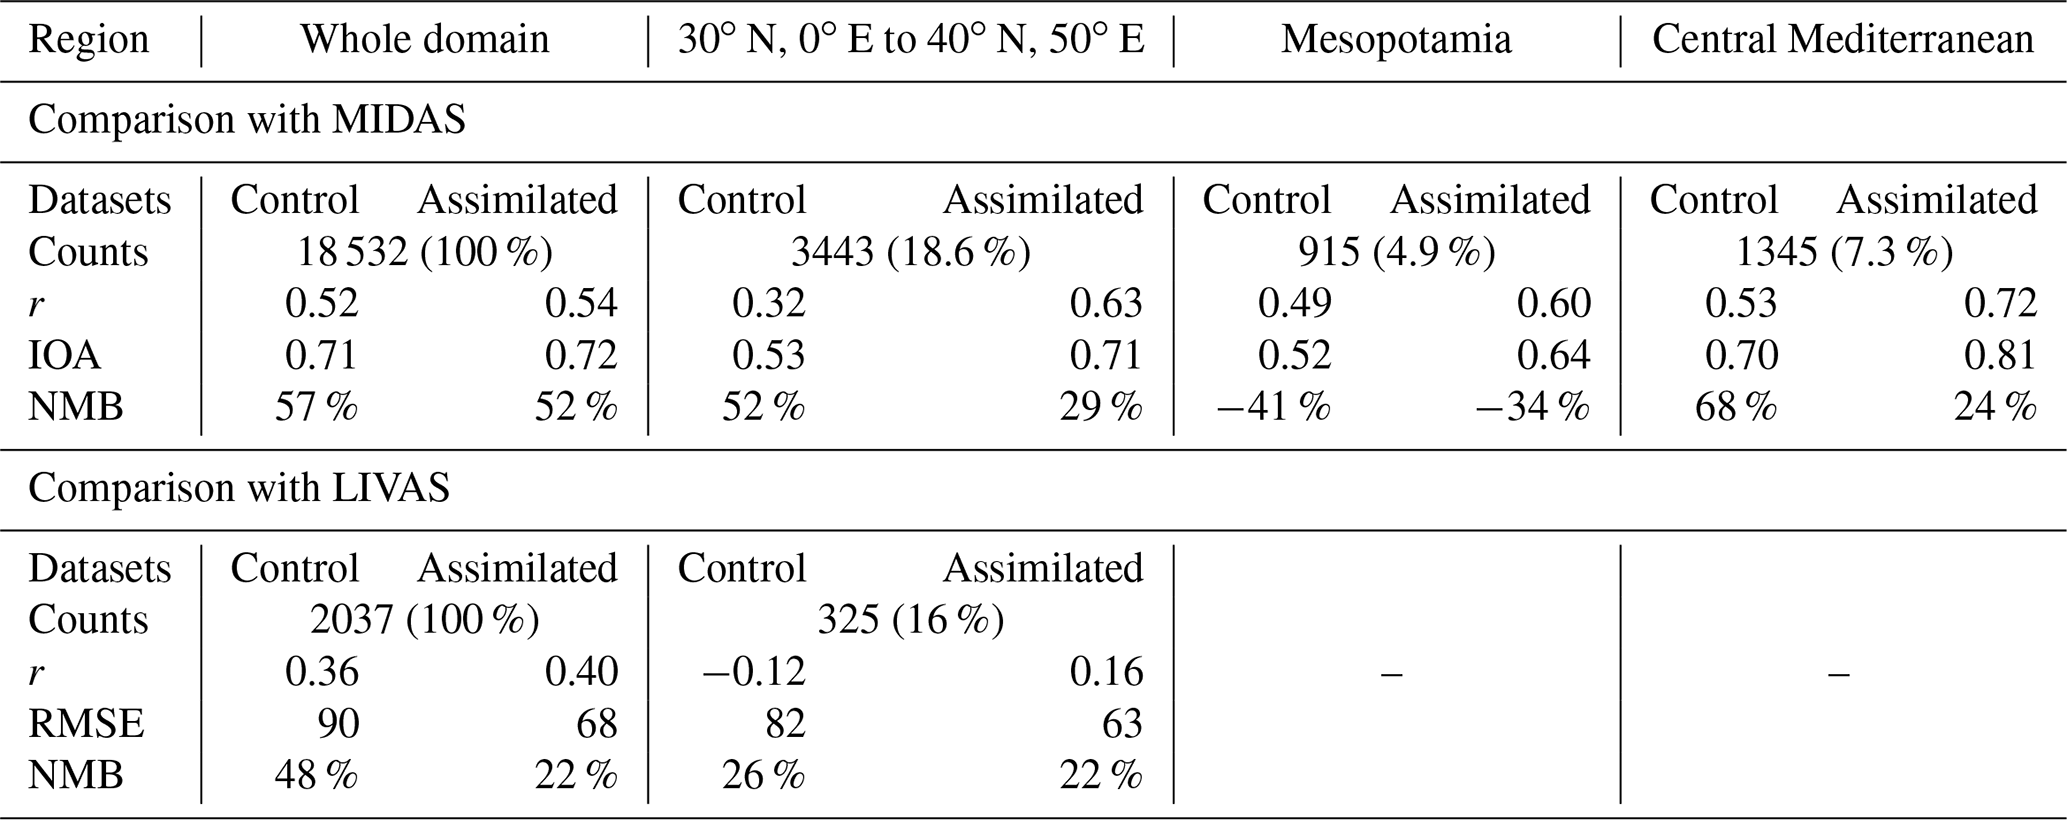
Only night-time profiles with a backscatter coefficient of more than 0.0008 km−1 sr−1 and a height greater than 180 m above surface elevation were used to ensure a reliable statistical comparison of model outputs with LIVAS products (Proestakis et al., 2018). Additionally, observations were filtered within the limits of a dust optical depth ≥ 0.01 and > 4 cloud-free profiles falling within the 1∘ grid cell. Introducing these filters saw both model runs recording an increase in correlation coefficient and index of agreement and a reduction in normalised mean bias (NMB) and root-mean-square error (RMSE). However, this resulted in a drop in the number of sample counts from 3874 to 2037, limiting the availability of comparable observations. Thus, a comparison was made for the whole domain and the area spanning from 30∘ N, 0∘ E to 40∘ N, 50∘ E rather than sub-regions, as conducted for MIDAS, and is summarised in Table 3.
It is apparent from both observation datasets that the introduction of the assimilated Aeolus wind fields improves the model predictive ability by reducing positive biases and improving the correlation of modelled products to observations. Comparison with MIDAS observations saw a substantial reduction in positive bias by 44 % in the central Mediterranean region, accompanied by an increase in r of 0.19. This has been attributed to the control run simulating an anticyclone not present in the assimilated run. Over Mesopotamia, a reduction in negative bias of 17 % is attained. To compensate for the small sample number in the regions mentioned above, a statistical analysis has been performed for a box spanning from 30∘ N, 0∘ E to 40∘ N, 50∘ E, covering both the central Mediterranean and Mesopotamia, which led to an increase in the sample pool. Within this area, significant improvements were recorded with an increase in r of 0.31 and IOA of 0.18 and a reduction in positive bias of 23 %. As observed in the statistical comparison with AERONET (Sect. 3.2), comparing MIDAS observations to the whole domain reduces the improvements achieved using the assimilated dataset. This does not stand true for LIVAS, where data points are solely available atop CALIPSO satellite tracks, and a synoptic comparison of all available overpasses improved r by 0.06 and reduced positive bias by 26 % when using the assimilated products. Limiting the comparison to within the 30∘ N, 0∘ E to 40∘ N, 50∘ E box reduced positive bias by 4 % and RMSE by 0.19.
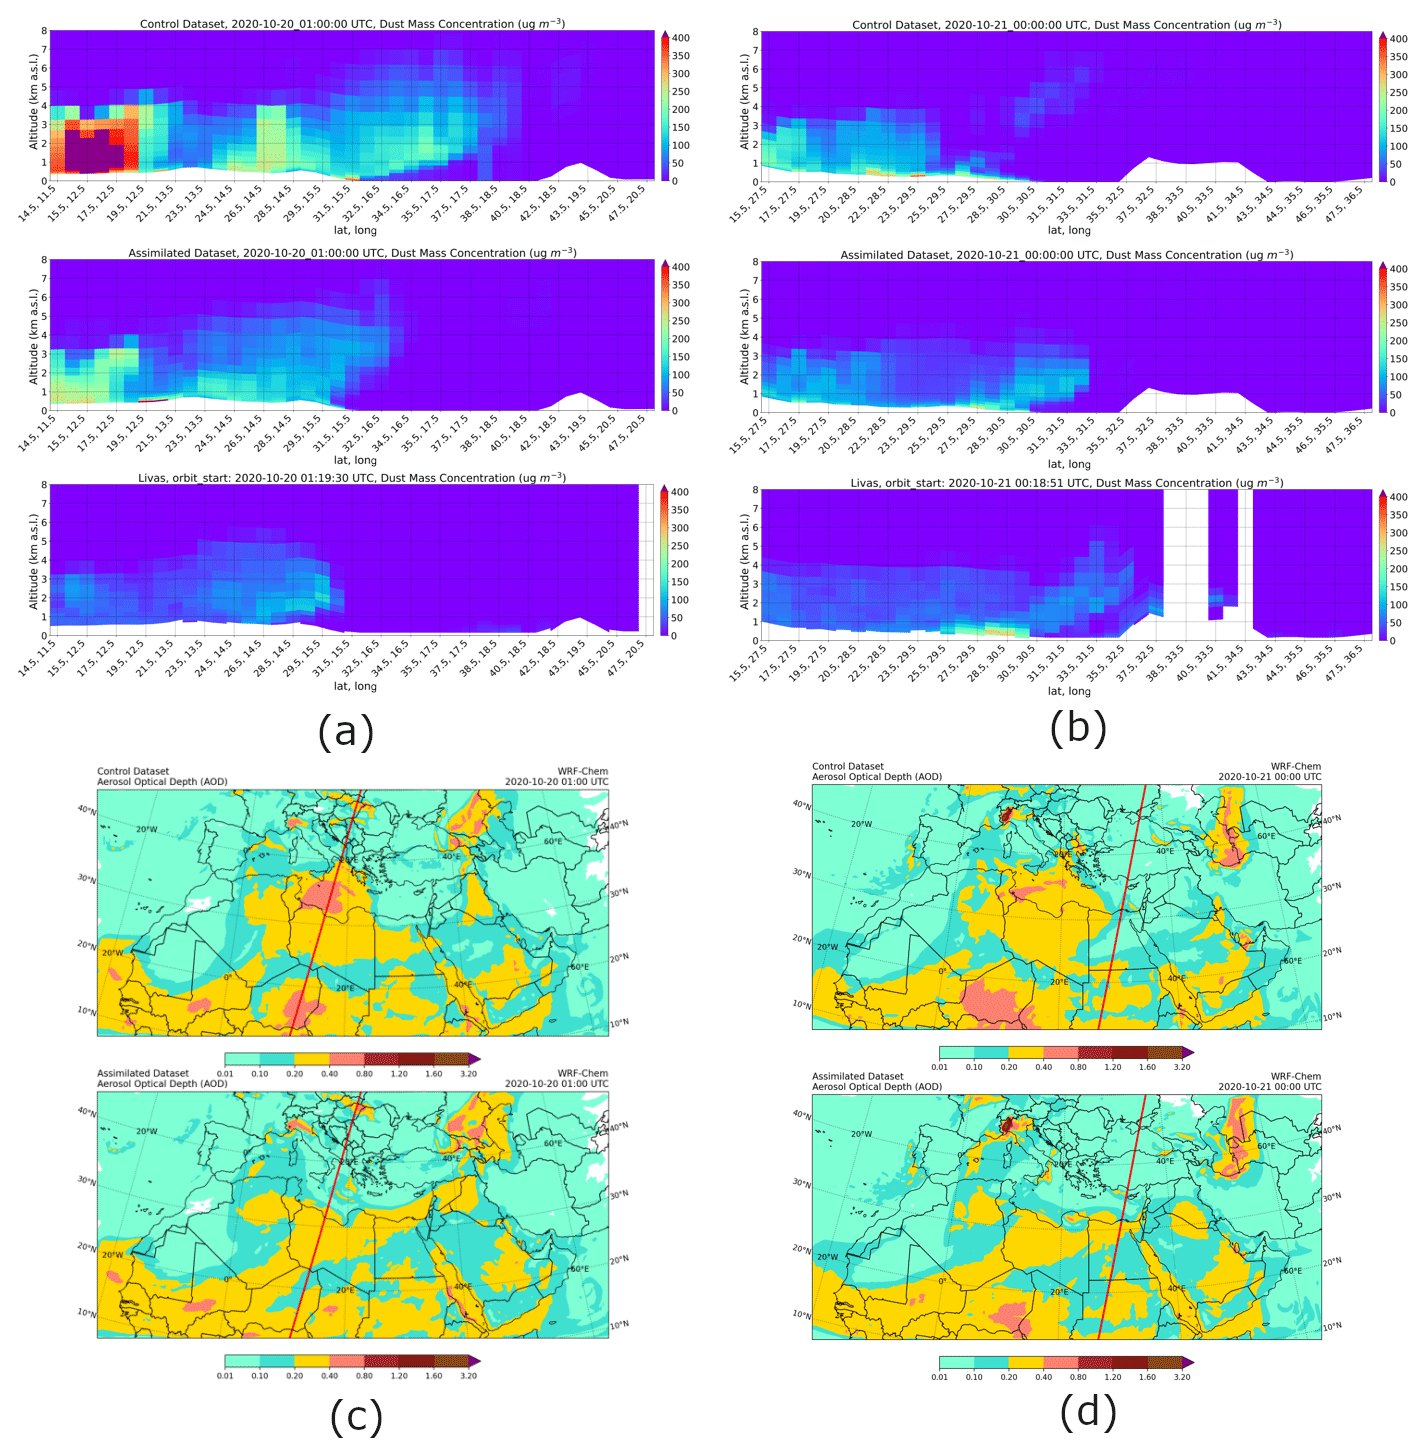
Figure 9Collocated control and assimilated model runs of LIVAS depicting vertical dust concentrations for 20 October 2020 at 01:00 (a) and 21 October 2020 at 00:00 (b). The CALIPSO tracks are represented by the red lines in the horizontal simulated AOD values (c, d), where for (a) and (b) the top panel represents the control run, the middle panel the assimilated run and the bottom panel the LIVAS observations.
Table 3Statistical comparison of modelled to observed products for MIDAS and LIVAS for the period 14–25 October 2020.
The launch of the ESA's Aeolus satellite, acquiring wind profiles up to the lower stratosphere for the first time, was a significant step forward for Earth observations. Aeolus filled a critical gap in the Global Observing System by providing vertically resolved winds over remote oceanic and vast continental areas that are not well covered by conventional wind observations. Aligned with the main scientific objective of the satellite mission, the European Centre for Medium-Range Weather Forecasts was the first meteorological centre that started the operational assimilation of Aeolus winds (January 2020), followed by other European institutes. Thanks to these activities, the beneficial impact of Aeolus winds on numerical weather prediction has been demonstrated via their implementation into global atmospheric models. This advancement in the forecast models' predictive skills is anticipated to also materialise in aerosol and air quality simulations, acknowledging the determinant role of meteorology on the processes governing the life cycle components of airborne particles.
In the presented paper, the effect on aeolian dust prediction from the inclusion of the assimilated ECMWF-IFS Aeolus Rayleigh–clear and Mie–cloudy wind products within the WRF-Chem model in spring and autumn 2020 was studied. Focus was given to the broader eastern Mediterranean and Middle East region, which is frequently affected by massive loads of mineral particles. The impact of the Aeolus dataset was more evident during the transitional October period compared to the spring months, where the maximum difference in dust concentration over the study region was 20 µg m−3 at the atmospheric layer of 850 mbar. In October, distinct differences in dust concentrations were visualised, with values peaking over the central Mediterranean in the control run and over the Levantine Basin in the assimilated run. This suggested that the impact of the use of the assimilated dataset has temporal variation over the EMME region. Through further research, the observation regarding the improved model predictability visualised only for the autumn months could be investigated to explain the driving forces responsible for the improvement. The period of 14 to 25 October 2020 has been investigated for the Eastern Mediterranean and Middle East region, where anticyclonic conditions prevail in the Central and East Mediterranean region leading to the transport of aeolian dust particles. The dust numerical model outputs were evaluated against ground-based and satellite observations to ensure a complete and comprehensive assessment. Analysis of the October period revealed that an anticyclone materialised over the domain in the control run that was much less pronounced in the assimilated run. Comparison of the model results to both ground- and satellite-based observations, including EMEP, AERONET, PollyXT, MIDAS and LIVAS, allowed for a thorough investigation of numerical dust outputs both horizontally and vertically. In all cases, using the assimilated Aeolus wind products improved the model predictive ability with increases in correlation coefficient and index of agreement and decreases in positive and negative biases. The most significant improvements were observed when the statistical analyses were performed over the EMME region, while comparisons with the whole simulated domain decreased the improvements. Specifically, for the period where a second anticyclone forms in the control run, the use of Aeolus resulted in a reduction of positive bias atop the anticyclone by 44 % and an improvement in the correlation coefficient by 0.19. Through FLEXPART backwards-trajectory analysis, the source regions of aerosols were analysed. It was revealed that the control run had an influx of aerosols from continental Europe, while the assimilated run had an influx of aerosols from the Saharan region. The benefits attained from the incorporation of the assimilated IFS Aeolus data solely relate to the period of 14 to 25 October 2020, where anticyclonic conditions prevail in the EMME and central Mediterranean regions. Even though the period of improvement is statistically negligible compared to longer timescales, the strong reductions in positive bias and underestimates highlight the importance of Aeolus in further dust research.
This case study can serve as a benchmark for future relevant studies with emphasis on long-term periods and other natural aerosol species, such as volcanic ash (Amiridis et al., 2022) and sea salt. Relying on the same concept, a similar study (Gkikas and the NEWTON team, 2022) for the western Sahara, hosting some of the most active dust sources on the planet (Ginoux et al., 2012), and the tropical Atlantic Ocean, receiving large amounts of mineral particles exported from the Sahara throughout the year, is in preparation. According to preliminary results in the framework of the JATAC campaign (Cabo Verde, September 2021), there are evident modifications of the meteorological patterns. These are observed throughout the atmosphere, subsequently affecting the evolution of the Saharan dust plumes, which are more realistically represented in the numerical experiments initialised after incorporating assimilated IFS Aeolus wind fields. An interesting aspect for future work would be the use of a holistic approach for the assimilation experiments relying solely on Aeolus retrievals. More specifically, an investigation into the feasibility of the implementation of Aeolus wind profiles in regional atmospheric dust models for producing meteorological and dust analyses could be carried out. These can be utilised to initialise short- to medium-term forecasts. Finally, a better representation of the simulated aerosol fields from Aeolus wind implementation will result in an improved assessment of the aerosol-induced perturbations of the Earth–atmosphere radiation budget with accompanying positive impacts on numerical weather prediction (Pérez et al., 2006; Gkikas et al., 2018; Benedetti and Vitart, 2018), thus fulfilling the main scientific objective of the Aeolus satellite mission.
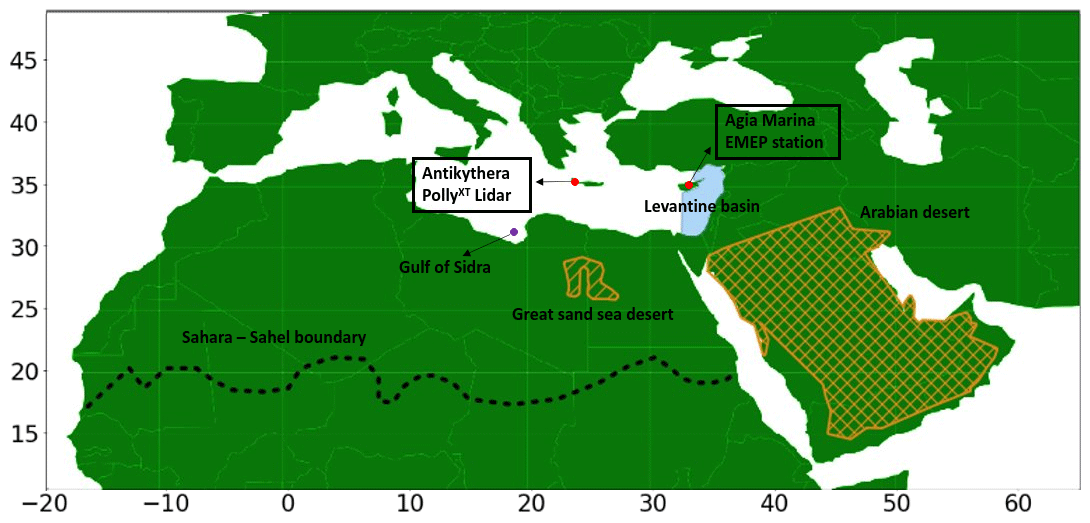
Figure A1Model domain used in the WRF-Chem simulations alongside some locations and observation stations mentioned in the text.
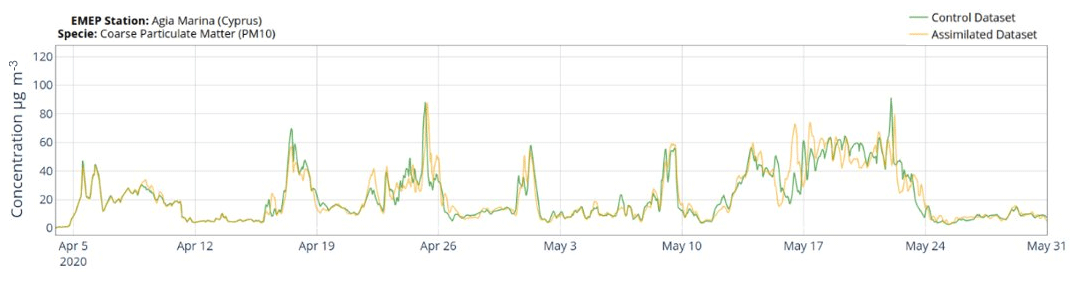
Figure A2Comparison of PM10 at the EMEP Station at Agia Marina, Cyprus, between the WRF-Chem simulations in spring, where the green line represents the control run and the yellow shows the assimilated run.
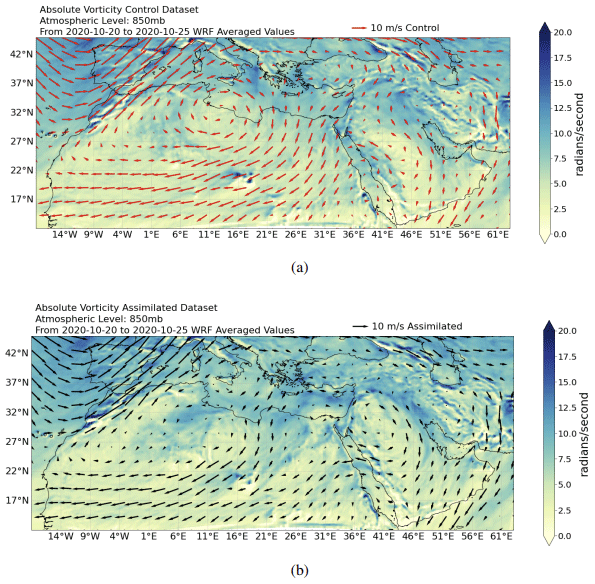
Figure A3Comparison of model vorticity for control (a) and assimilated (b) runs (20–25 October 2020), where the wind vectors are represented in red for the control run and in black for the assimilated run.
Table A1WRF-Chem model configuration options used in the simulations.
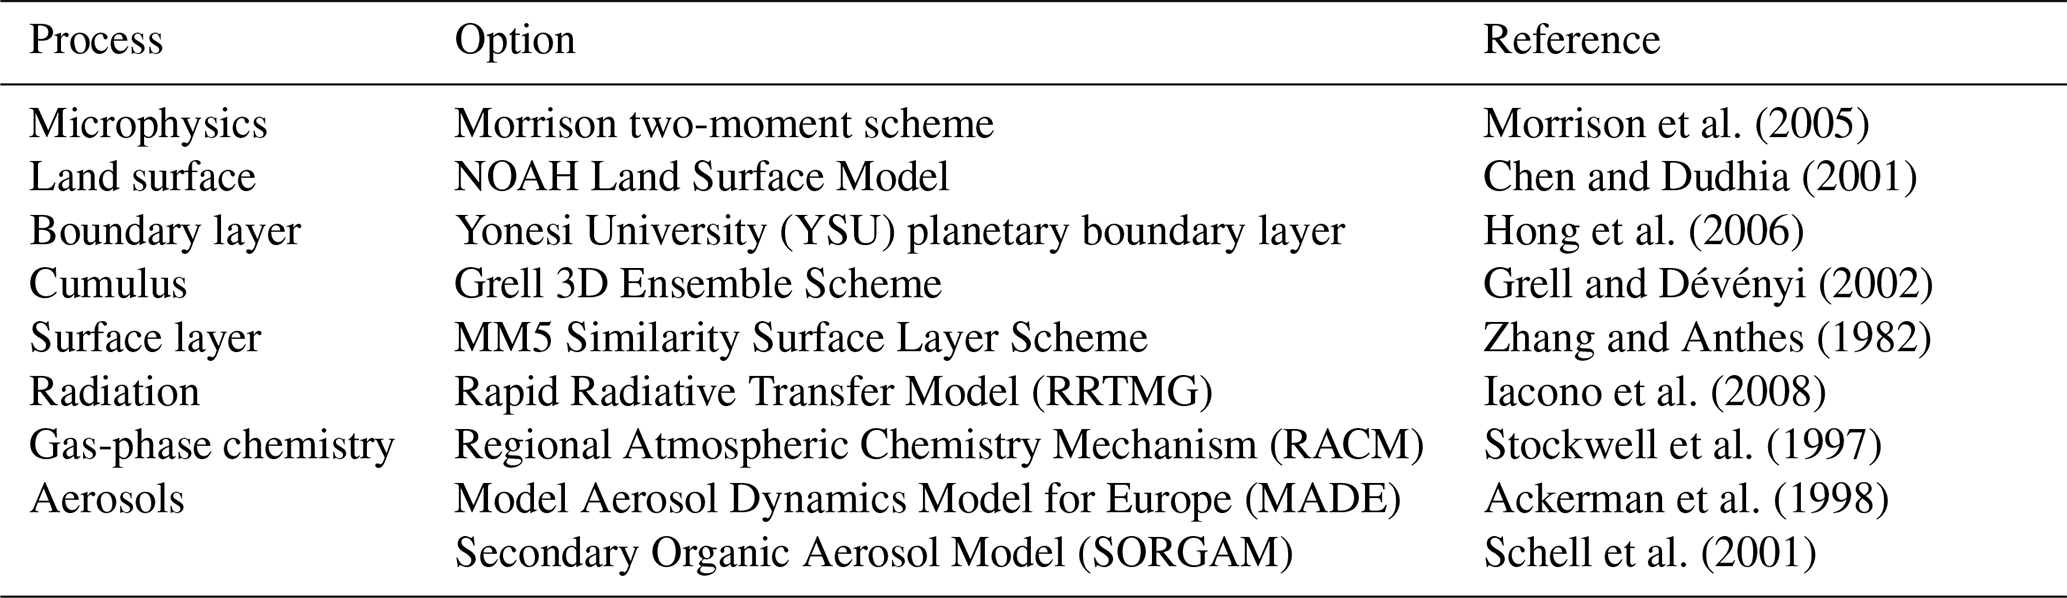
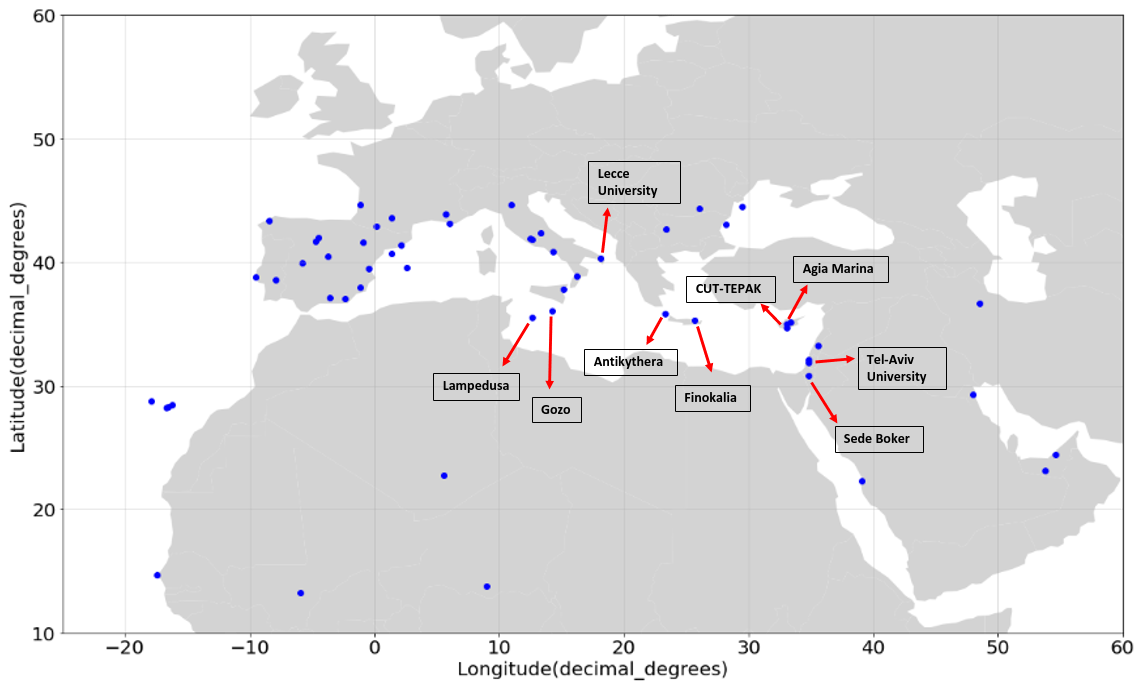
Figure A4Map of all the AERONET stations within the constructed domain with available observations for the period of 18 September to 1 November 2020 used for the model evaluation. The stations used in the main text are those named and indicated with red arrows.
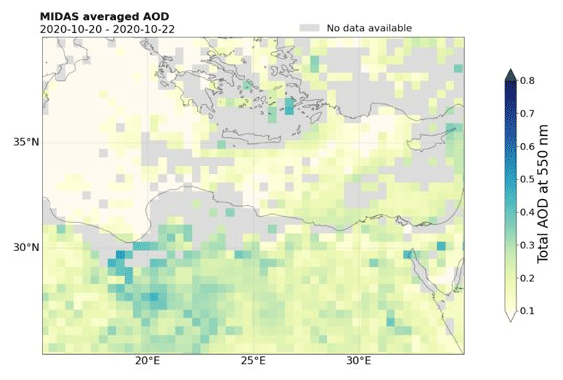
Figure A5MIDAS AOD values for the time-averaged period of 20–22 October 2020 for the model domain area surrounding the PollyXT lidar instrument.
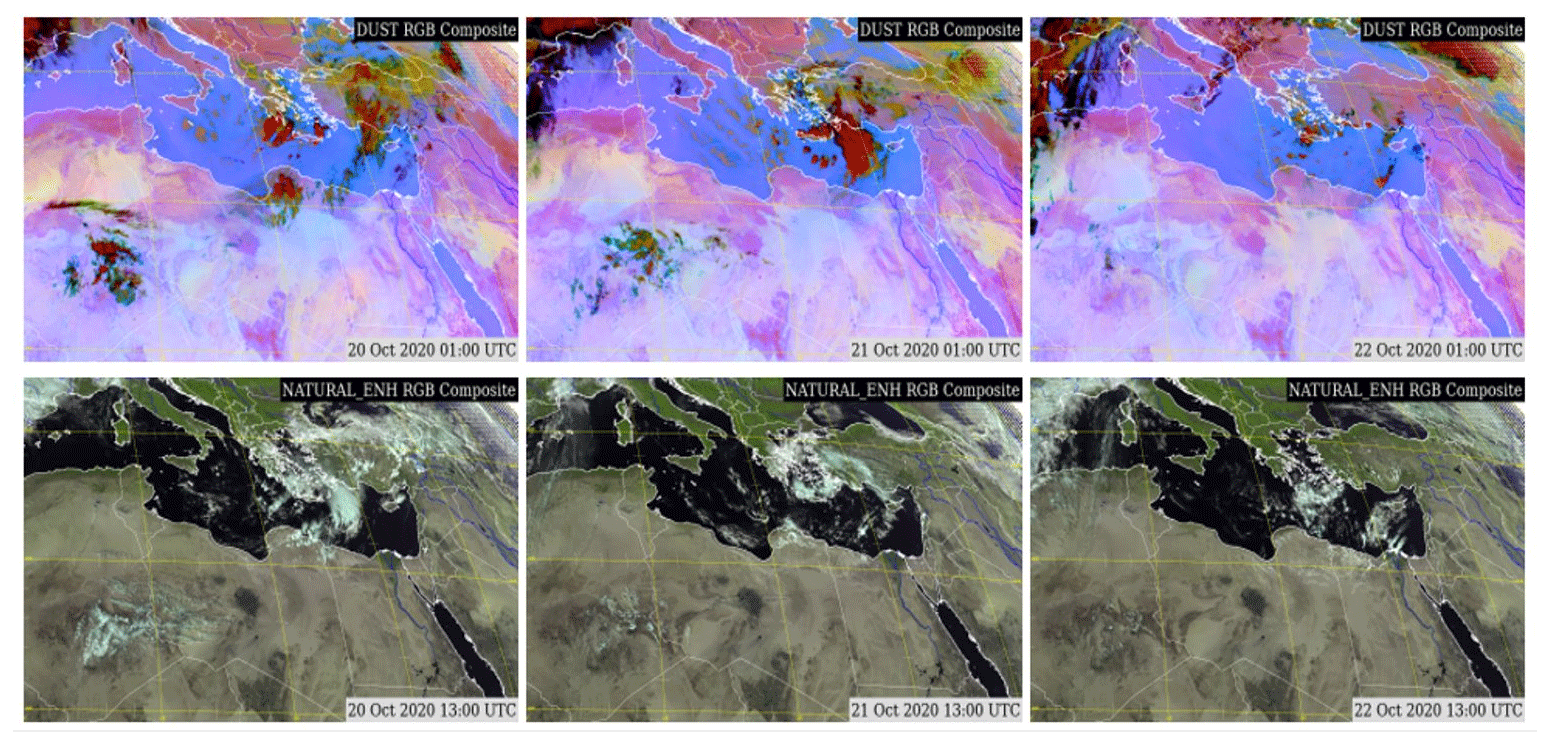
Figure A6Representation of satellite imagery over Antikythera from 20–22 October, where in the top row the Dust RGB composite colour is shown for night-time imagery at 01:00:00 UTC and in the bottom row the natural enhanced imagery is shown for 13:00:00 UTC. The images of Fig. A6 are property of © EUMETSAT (2020).
WRF-Chem is open-source software that can be accessed through https://geomodeling.njnu.edu.cn/modelItem/7faf79e0-fc0b-460f-93e1-e63bc86b0662 (NOAA/ESRL, 2019).
The MIDAS data are available upon request from Antonis Gkikas (agkikas@academyofathens.gr), LIVAS pure-dust products are available upon request from Eleni Marinou (elmarinou@noa.gr), Vassilis Amiridis (vamoir@noa.gr), and Emmanuel Proestakis (proestakis@noa.gr). PollyNET Finokalia data are available upon request from Eleni Marinou (elmarinou@noa.gr) and Vassilis Amiridis (vamoir@noa.gr).
The EARLINET data used in this study are available from the authors and upon registration from the EARLINET web page at https://data.earlinet.org/earlinet/login.zul (Pappalardo et al., 2014). The AERONET data used in this study are available from the AERONET web page at https://aeronet.gsfc.nasa.gov/cgi-bin/webtool_inv_v3 (Dubovik et al., 2006).
PK produced the model experiments, performed data collection, performed data analysis and wrote the manuscript. AG produced the model experiments, performed data collection, contributed to the scientific discussion and reviewed the manuscript. PG produced the model experiments, performed data collection and contributed to the scientific discussion. TC contributed to the scientific discussion and reviewed the manuscript. JK contributed to the scientific discussion. EP performed data collection and contributed to the scientific discussion. AK performed data collection and contributed to the scientific discussion. EM performed data collection and contributed to the scientific discussion. EDi contributed to the scientific discussion. AB contributed to the scientific discussion. MR contributed to the scientific discussion. CR contributed to the scientific discussion. AGS contributed to the scientific discussion. AD contributed to the scientific discussion. VA contributed to the scientific discussion. JS contributed to the scientific discussion.
The contact author has declared that none of the authors has any competing interests.
Publisher's note: Copernicus Publications remains neutral with regard to jurisdictional claims in published maps and institutional affiliations.
This article is part of the special issue “Aeolus data and their application (AMT/ACP/WCD inter-journal SI)”. It is not associated with a conference.
Antonis Gkikas acknowledges support by the Hellenic Foundation for Research and Innovation (H.F.R.I.) under the “2nd Call for H. F. R. I. Research Projects to support Post-Doctoral Researchers” (project acronym: ATLANTAS, project no. 544). We thank NASA/LaRC/ASDC for making the CALIPSO products available, which are used to build LIVAS products.
This research has been supported by the European Space Agency (grant no. NEWTON, 4000133130/20/IBG//Aeolus+ Innovation (Aeolus+I)), the Horizon 2020 Framework Programme, H2020 European Institute of Innovation and Technology (grant no. 856612), and ACCEPT, which is co-financed by the Norwegian Financial Mechanism (85 %) and the Republic of Cyprus (15 %) in the framework of the programming period 2014–2021.
This paper was edited by Stelios Kazadzis and reviewed by four anonymous referees.
Ackerman, S. A., Strabala, K. I., Menzel, W. P., Frey, R. A., Moeller, C. C., and Gumley, L. E.: Discriminating clear sky from clouds with MODIS, J. Geophys. Res.-Atmos., 103, 32141–32157, 1998. a
Ahmadov, R., McKeen, S. A., Robinson, A. L., Bahreini, R., Middlebrook, A. M., De Gouw, J. A., Meagher, J., Hsie, E. Y., Edgerton, E., Shaw, S., and Trainer, M.: A volatility basis set model for summertime secondary organic aerosols over the eastern United States in 2006, J. Geophys. Res.-Atmos., 117, D06301, https://doi.org/10.1029/2011JD016831, 2012. a
Alonso-Pérez, S., Cuevas, E., Querol, X., Guerra, J. C., and Pérez, C.: African dust source regions for observed dust outbreaks over the Subtropical Eastern North Atlantic region, above 25 N, J. Arid Environ., 78, 100–109, 2012. a
Alpert, P., Kishcha, P., Shtivelman, A., Krichak, S., and Joseph, J.: Vertical distribution of Saharan dust based on 2.5-year model predictions, Atmos. Res., 70, 109–130, 2004. a
Amiridis, V., Wandinger, U., Marinou, E., Giannakaki, E., Tsekeri, A., Basart, S., Kazadzis, S., Gkikas, A., Taylor, M., Baldasano, J., and Ansmann, A.: Optimizing CALIPSO Saharan dust retrievals, Atmos. Chem. Phys., 13, 12089–12106, https://doi.org/10.5194/acp-13-12089-2013, 2013. a
Amiridis, V., Kampouri, A., Gkikas, A., Misios, S., Gialitaki, A., Marinou, E., Rennie, M., Benedetti, A., Solomos, S., Zanis, P., Vasardani, O., Eleftheratos, K., Paschou, P., Georgiou, T., Scollo, S., Mona, L., Papagiannopoulos, N., Retscher, C., Parrinello, T., and Straume, A. G.: Aeolus impact on Volcanic Ash early warning systems for Aviation, Research Square [preprint], https://doi.org/10.21203/rs.3.rs-2539393/v1, 2022. Vassilis Amiridis, Anna Kampouri, Antonis Gkikas et al. Aeolus impact on Volcanic Ash early warning systems for Aviation, 01 March 2023, PREPRINT (Version 1) available at Research Square [https://doi.org/10.21203/rs.3.rs-2539393/v1] a
Ångström, A.: On the atmospheric transmission of sun radiation and on dust in the air, Geogr. Ann., 11, 156–166, 1929. a
Ansmann, A., Mamouri, R.-E., Hofer, J., Baars, H., Althausen, D., and Abdullaev, S. F.: Dust mass, cloud condensation nuclei, and ice-nucleating particle profiling with polarization lidar: updated POLIPHON conversion factors from global AERONET analysis, Atmos. Meas. Tech., 12, 4849–4865, https://doi.org/10.5194/amt-12-4849-2019, 2019. a, b, c
Baars, H., Herzog, A., Heese, B., Ohneiser, K., Hanbuch, K., Hofer, J., Yin, Z., Engelmann, R., and Wandinger, U.: Validation of Aeolus wind products above the Atlantic Ocean, Atmos. Meas. Tech., 13, 6007–6024, https://doi.org/10.5194/amt-13-6007-2020, 2020. a, b, c
Barnard, J. C., Fast, J. D., Paredes-Miranda, G., Arnott, W. P., and Laskin, A.: Technical Note: Evaluation of the WRF-Chem “Aerosol Chemical to Aerosol Optical Properties” Module using data from the MILAGRO campaign, Atmos. Chem. Phys., 10, 7325–7340, https://doi.org/10.5194/acp-10-7325-2010, 2010. a
Basart, S., Pérez, C., Cuevas, E., Baldasano, J. M., and Gobbi, G. P.: Aerosol characterization in Northern Africa, Northeastern Atlantic, Mediterranean Basin and Middle East from direct-sun AERONET observations, Atmos. Chem. Phys., 9, 8265–8282, https://doi.org/10.5194/acp-9-8265-2009, 2009. a
Ben-Asher, M., Haviv, I., Roering, J. J., and Crouvi, O.: The potential influence of dust flux and chemical weathering on hillslope morphology: Convex soil-mantled carbonate hillslopes in the Eastern Mediterranean, Geomorphology, 341, 203–215, 2019. a
Benedetti, A. and Vitart, F.: Can the direct effect of aerosols improve subseasonal predictability?, Mon. Weather Rev., 146, 3481–3498, 2018. a
Bou Karam, D., Flamant, C., Tulet, P., Chaboureau, J.-P., Dabas, A., and Todd, M. C.: Estimate of Sahelian dust emissions in the intertropical discontinuity region of the West African Monsoon, J. Geophys. Res.-Atmos., 114, D13106, https://doi.org/10.1029/2008JD011444, 2009. a
Brioude, J., Arnold, D., Stohl, A., Cassiani, M., Morton, D., Seibert, P., Angevine, W., Evan, S., Dingwell, A., Fast, J. D., Easter, R. C., Pisso, I., Burkhart, J., and Wotawa, G.: The Lagrangian particle dispersion model FLEXPART-WRF version 3.1, Geosci. Model Dev., 6, 1889–1904, https://doi.org/10.5194/gmd-6-1889-2013, 2013. a
Cavazos-Guerra, C. and Todd, M. C.: Model simulations of complex dust emissions over the Sahara during the West African monsoon onset, Adv. Meteorol., 2012, 351731, https://doi.org/10.1155/2012/351731, 2012. a
Chaibou, A. A. S., Ma, X., Kumar, K. R., Jia, H., Tang, Y., and Sha, T.: Evaluation of dust extinction and vertical profiles simulated by WRF-Chem with CALIPSO and AERONET over North Africa, J. Atmos. Sol.-Terr. Phys., 199, 105213, https://doi.org/10.1016/j.jastp.2020.105213, 2020. a
Chedin, A., Capelle, V., and Scott, N.: Detection of IASI dust AOD trends over Sahara: how many years of data required?, Atmos. Res., 212, 120–129, 2018. a, b
Chen, F. and Dudhia, J.: Coupling an advanced land surface–hydrology model with the Penn State–NCAR MM5 modeling system. Part I: Model implementation and sensitivity, Mon. Weather Rev., 129, 569–585, 2001. a
Cyprus, L. I.: Air Quality in cyprus, https://www.airquality.dli.mlsi.gov.cy/graphs (last access: 20 June 2022), 2021. a
D'Amico, G., Amodeo, A., Baars, H., Binietoglou, I., Freudenthaler, V., Mattis, I., Wandinger, U., and Pappalardo, G.: EARLINET Single Calculus Chain – overview on methodology and strategy, Atmos. Meas. Tech., 8, 4891–4916, https://doi.org/10.5194/amt-8-4891-2015, 2015. a
Darmenova, K., Sokolik, I. N., Shao, Y., Marticorena, B., and Bergametti, G.: Development of a physically based dust emission module within the Weather Research and Forecasting (WRF) model: Assessment of dust emission parameterizations and input parameters for source regions in Central and East Asia, J. Geophys. Res.-Atmos., 114, D14201, https://doi.org/10.1029/2008JD011236, 2009. a
De Châtel, F.: The role of drought and climate change in the Syrian uprising: Untangling the triggers of the revolution, Middle Eastern Stud., 50, 521–535, 2014. a
Deng, A., Stauffer, D. R., Dudhia, J., Otte, T., and Hunter, G. K.: Update on analysis nudging FDDA in WRF-ARW, in: Proceedings of the 8th WRF Users’ Workshop, p. 35, http://www.mmm.ucar.edu/wrf/users/workshops/WS2007/abstracts/4-8_Deng.pdf (last access: 10 November 2022), 2007. a
Deng, A., Stauffer, D., Gaudet, B., and Hunter, G.: A rapidly relocatable high-resolution WRF system for military-defense, aviation and wind energy, in: 13th Annual WRF Users’ Workshop, 25–29, https://www.regonline.com/AttendeeDocuments/1077122/43387256/43387256_1045173.pdf (last access: 10 November 2022), 2012. a
Dubovik, O. and King, M. D.: A flexible inversion algorithm for retrieval of aerosol optical properties from Sun and sky radiance measurements, J. Geophys. Res.-Atmos., 105, 20673–20696, 2000. a
Dubovik, O., Sinyuk, A., Lapyonok, T., Holben, B. N., Mishchenko, M., Yang, P., Eck, T. F., Volten, H., Munoz, O., Veihelmann, B., and Van der Zande, W. J.: Application of spheroid models to account for aerosol particle nonsphericity in remote sensing of desert dust, J. Geophys. Res.-Atmos., 111, D11208, https://doi.org/10.1029/2005JD006619, 2006. a, b
Eck, T. F., Holben, B., Reid, J., Dubovik, O., Smirnov, A., O'neill, N., Slutsker, I., and Kinne, S.: Wavelength dependence of the optical depth of biomass burning, urban, and desert dust aerosols, J. Geophys. Res.-Atmos., 104, 31333–31349, 1999. a
Engelstaedter, S. and Washington, R.: Atmospheric controls on the annual cycle of North African dust, J. Geophys. Res.-Atmos., 112, D03103, https://doi.org/10.1029/2006JD007195, 2007. a, b
Engelstaedter, S., Tegen, I., and Washington, R.: North African dust emissions and transport, Earth-Sci. Rev., 79, 73–100, 2006. a
Flaounas, E., Kotroni, V., Lagouvardos, K., Klose, M., Flamant, C., and Giannaros, T. M.: Sensitivity of the WRF-Chem (V3.6.1) model to different dust emission parametrisation: assessment in the broader Mediterranean region, Geosci. Model Dev., 10, 2925–2945, https://doi.org/10.5194/gmd-10-2925-2017, 2017. a
Flocas, H., Maheras, P., Karacostas, T., Patrikas, I., and Anagnostopoulou, C.: A 40-year climatological study of relative vorticity distribution over the Mediterranean, Int. J. Climatol., 21, 1759–1778, 2001. a
Formenti, P., Andreae, M., Andreae, T., Galani, E., Vasaras, A., Zerefos, C., Amiridis, V., Orlovsky, L., Karnieli, A., Wendisch, M., and Wex, H.: Aerosol optical properties and large-scale transport of air masses: Observations at a coastal and a semiarid site in the eastern Mediterranean during summer 1998, J. Geophys. Res.-Atmos., 106, 9807–9826, 2001. a
Fotiadi, A., Hatzianastassiou, N., Drakakis, E., Matsoukas, C., Pavlakis, K. G., Hatzidimitriou, D., Gerasopoulos, E., Mihalopoulos, N., and Vardavas, I.: Aerosol physical and optical properties in the Eastern Mediterranean Basin, Crete, from Aerosol Robotic Network data, Atmos. Chem. Phys., 6, 5399–5413, https://doi.org/10.5194/acp-6-5399-2006, 2006. a
Gelaro, R., McCarty, W., Suárez, M. J., Todling, R., Molod, A., Takacs, L., Randles, C. A., Darmenov, A., Bosilovich, M. G., Reichle, R., and Wargan, K.: The modern-era retrospective analysis for research and applications, version 2 (MERRA-2), J. Climate, 30, 5419–5454, 2017. a
Georgiou, G. K., Christoudias, T., Proestos, Y., Kushta, J., Hadjinicolaou, P., and Lelieveld, J.: Air quality modelling in the summer over the eastern Mediterranean using WRF-Chem: chemistry and aerosol mechanism intercomparison, Atmos. Chem. Phys., 18, 1555–1571, https://doi.org/10.5194/acp-18-1555-2018, 2018. a, b
Giles, D. M., Sinyuk, A., Sorokin, M. G., Schafer, J. S., Smirnov, A., Slutsker, I., Eck, T. F., Holben, B. N., Lewis, J. R., Campbell, J. R., Welton, E. J., Korkin, S. V., and Lyapustin, A. I.: Advancements in the Aerosol Robotic Network (AERONET) Version 3 database – automated near-real-time quality control algorithm with improved cloud screening for Sun photometer aerosol optical depth (AOD) measurements, Atmos. Meas. Tech., 12, 169–209, https://doi.org/10.5194/amt-12-169-2019, 2019. a
Gillette, D. A. and Hanson, K. J.: Spatial and temporal variability of dust production caused by wind erosion in the United States, Journal of Geophysical Research: Atmospheres, 94, 2197–2206, 1989. a
Ginoux, P., Chin, M., Tegen, I., Prospero, J. M., Holben, B., Dubovik, O., and Lin, S.-J.: Sources and distributions of dust aerosols simulated with the GOCART model, J. Geophys. Res.-Atmos., 106, 20255–20273, 2001. a, b, c, d
Ginoux, P., Prospero, J. M., Gill, T. E., Hsu, N. C., and Zhao, M.: Global-scale attribution of anthropogenic and natural dust sources and their emission rates based on MODIS Deep Blue aerosol products, Rev. Geophys., 50, RG3005, https://doi.org/10.1029/2012RG000388, 2012. a
Gkikas, A. and the NEWTON team: Assessing the impact of Aeolus wind data assimilation on the Saharan dust simulations in the framework of the JATAC campaign, EGU General Assembly 2022, Vienna, Austria, 23–27 May 2022, EGU22-3586, https://doi.org/10.5194/egusphere-egu22-3586, 2022. a
Gkikas, A., Hatzianastassiou, N., Mihalopoulos, N., Katsoulis, V., Kazadzis, S., Pey, J., Querol, X., and Torres, O.: The regime of intense desert dust episodes in the Mediterranean based on contemporary satellite observations and ground measurements, Atmos. Chem. Phys., 13, 12135–12154, https://doi.org/10.5194/acp-13-12135-2013, 2013. a
Gkikas, A., Basart, S., Hatzianastassiou, N., Marinou, E., Amiridis, V., Kazadzis, S., Pey, J., Querol, X., Jorba, O., Gassó, S., and Baldasano, J. M.: Mediterranean intense desert dust outbreaks and their vertical structure based on remote sensing data, Atmos. Chem. Phys., 16, 8609–8642, https://doi.org/10.5194/acp-16-8609-2016, 2016. a
Gkikas, A., Obiso, V., Pérez García-Pando, C., Jorba, O., Hatzianastassiou, N., Vendrell, L., Basart, S., Solomos, S., Gassó, S., and Baldasano, J. M.: Direct radiative effects during intense Mediterranean desert dust outbreaks, Atmos. Chem. Phys., 18, 8757–8787, https://doi.org/10.5194/acp-18-8757-2018, 2018. a
Gkikas, A., Proestakis, E., Amiridis, V., Kazadzis, S., Di Tomaso, E., Tsekeri, A., Marinou, E., Hatzianastassiou, N., and Pérez García-Pando, C.: ModIs Dust AeroSol (MIDAS): a global fine-resolution dust optical depth data set, Atmos. Meas. Tech., 14, 309–334, https://doi.org/10.5194/amt-14-309-2021, 2021. a, b, c
Gkikas, A., Proestakis, E., Amiridis, V., Kazadzis, S., Di Tomaso, E., Marinou, E., Hatzianastassiou, N., Kok, J. F., and García-Pando, C. P.: Quantification of the dust optical depth across spatiotemporal scales with the MIDAS global dataset (2003–2017), Atmos. Chem. Phys., 22, 3553–3578, https://doi.org/10.5194/acp-22-3553-2022, 2022. a, b
Grell, G. A. and Dévényi, D.: A generalized approach to parameterizing convection combining ensemble and data assimilation techniques, Geophys. Res. Lett., 29, 38–1, 2002. a
Grell, G. A., Peckham, S. E., Schmitz, R., McKeen, S. A., Frost, G., Skamarock, W. C., and Eder, B.: Fully coupled “online” chemistry within the WRF model, Atmos. Environ., 39, 6957–6975, 2005. a
Guenther, A. B., Jiang, X., Heald, C. L., Sakulyanontvittaya, T., Duhl, T., Emmons, L. K., and Wang, X.: The Model of Emissions of Gases and Aerosols from Nature version 2.1 (MEGAN2.1): an extended and updated framework for modeling biogenic emissions, Geosci. Model Dev., 5, 1471–1492, https://doi.org/10.5194/gmd-5-1471-2012, 2012. a
Hachicha, A. A., Al-Sawafta, I., and Said, Z.: Impact of dust on the performance of solar photovoltaic (PV) systems under United Arab Emirates weather conditions, Renew. Energ., 141, 287–297, 2019. a
Hatzaki, M., Flocas, H. A., Simmonds, I., Kouroutzoglou, J., Keay, K., and Rudeva, I.: Seasonal aspects of an objective climatology of anticyclones affecting the Mediterranean, J. Climate, 27, 9272–9289, 2014. a, b, c
Haustein, K., Pérez, C., Baldasano, J. M., Jorba, O., Basart, S., Miller, R. L., Janjic, Z., Black, T., Nickovic, S., Todd, M. C., Washington, R., Müller, D., Tesche, M., Weinzierl, B., Esselborn, M., and Schladitz, A.: Atmospheric dust modeling from meso to global scales with the online NMMB/BSC-Dust model – Part 2: Experimental campaigns in Northern Africa, Atmos. Chem. Phys., 12, 2933–2958, https://doi.org/10.5194/acp-12-2933-2012, 2012. a
Heinold, B., Knippertz, P., Marsham, J., Fiedler, S., Dixon, N., Schepanski, K., Laurent, B., and Tegen, I.: The role of deep convection and nocturnal low-level jets for dust emission in summertime West Africa: Estimates from convection-permitting simulations, J. Geophys. Res.-Atmos., 118, 4385–4400, 2013. a
Holben, B. N., Eck, T. F., Slutsker, I. A., Tanré, D., Buis, J., Setzer, A., Vermote, E., Reagan, J. A., Kaufman, Y., Nakajima, T., and Lavenu, F.: AERONET—A federated instrument network and data archive for aerosol characterization, Remote Sens. Environ., 66, 1–16, 1998. a
Hong, S.-Y., Noh, Y., and Dudhia, J.: A new vertical diffusion package with an explicit treatment of entrainment processes, Mon. Weather Rev., 134, 2318–2341, 2006. a
Hubanks, P., Platnick, S., King, M., and Ridgway, B.: MODIS Atmosphere L3 gridded product algorithm theoretical basis document (atbd) & users guide, ATBD reference number ATBD-MOD-30, NASA, 125, p. 585, 2015. a
Huneeus, N., Schulz, M., Balkanski, Y., Griesfeller, J., Prospero, J., Kinne, S., Bauer, S., Boucher, O., Chin, M., Dentener, F., Diehl, T., Easter, R., Fillmore, D., Ghan, S., Ginoux, P., Grini, A., Horowitz, L., Koch, D., Krol, M. C., Landing, W., Liu, X., Mahowald, N., Miller, R., Morcrette, J.-J., Myhre, G., Penner, J., Perlwitz, J., Stier, P., Takemura, T., and Zender, C. S.: Global dust model intercomparison in AeroCom phase I, Atmos. Chem. Phys., 11, 7781–7816, https://doi.org/10.5194/acp-11-7781-2011, 2011. a, b, c
Iacono, M. J., Delamere, J. S., Mlawer, E. J., Shephard, M. W., Clough, S. A., and Collins, W. D.: Radiative forcing by long-lived greenhouse gases: Calculations with the AER radiative transfer models, J. Geophys. Res.-Atmos., 113, D13103, https://doi.org/10.1029/2008JD009944, 2008. a, b
Ioannidou, L. and Yau, M.: A climatology of the Northern Hemisphere winter anticyclones, J. Geophys. Res.-Atmos., 113, D08119, https://doi.org/10.1029/2007JD008409, 2008. a
Isaksen, L. and Rennie, M.: A preliminary evaluation of using Aeolus L2B Winds in ECMWF’s NWP system, with focus on the tropical region, in: Living Planet Symposium, Milan, Italy, https://lps19.esa.int/NikalWebsitePortal/living-planet-symposium-2019/lps19/Agenda/AgendaItemDetail?id=64570099-bea7-4b8f-a54b-5b6ad81fa342 (last access: 8 November 2022), 13–17 May 2019. a
Janssens-Maenhout, G., Dentener, F., Van Aardenne, J., Monni, S., Pagliari, V., Orlandini, L., Klimont, Z., Kurokawa, J.-I., Akimoto, H., Ohara, T., and Wankmüller, R.: EDGAR-HTAP: a harmonized gridded air pollution emission dataset based on national inventories, European Commission Publications Office, Ispra, Italy, EUR report No EUR, 25229, p. 40, https://doi.org/10.2788/14102, 2012. a
Kalivitis, N., Gerasopoulos, E., Vrekoussis, M., Kouvarakis, G., Kubilay, N., Hatzianastassiou, N., Vardavas, I., and Mihalopoulos, N.: Dust transport over the eastern Mediterranean derived from Total Ozone Mapping Spectrometer, Aerosol Robotic Network, and surface measurements, J. Geophys. Res.-Atmos., 112, D03202, https://doi.org/10.1029/2006JD007510, 2007. a
Kanatani, K. T., Ito, I., Al-Delaimy, W. K., Adachi, Y., Mathews, W. C., and Ramsdell, J. W.: Desert dust exposure is associated with increased risk of asthma hospitalization in children, Am. J. Resp. Crit. Care, 182, 1475–1481, 2010. a
Kang, J.-Y., Yoon, S.-C., Shao, Y., and Kim, S.-W.: Comparison of vertical dust flux by implementing three dust emission schemes in WRF/Chem, J. Geophys. Res.-Atmos., 116, D09202, https://doi.org/10.1029/2010JD014649, 2011. a
Kelley, C. P., Mohtadi, S., Cane, M. A., Seager, R., and Kushnir, Y.: Climate change in the Fertile Crescent and implications of the recent Syrian drought, P. Natl. Acad. Sci. USA, 112, 3241–3246, 2015. a, b, c
Klingmüller, K., Pozzer, A., Metzger, S., Stenchikov, G. L., and Lelieveld, J.: Aerosol optical depth trend over the Middle East, Atmos. Chem. Phys., 16, 5063–5073, https://doi.org/10.5194/acp-16-5063-2016, 2016. a
Knippertz, P. and Fink, A. H.: Synoptic and dynamic aspects of an extreme springtime Saharan dust outbreak, Q. J. Roy. Meteor. Soc., 132, 1153–1177, 2006. a
Kok, J. F., Albani, S., Mahowald, N. M., and Ward, D. S.: An improved dust emission model – Part 2: Evaluation in the Community Earth System Model, with implications for the use of dust source functions, Atmos. Chem. Phys., 14, 13043–13061, https://doi.org/10.5194/acp-14-13043-2014, 2014. a
Kumar, R., Barth, M. C., Pfister, G. G., Naja, M., and Brasseur, G. P.: WRF-Chem simulations of a typical pre-monsoon dust storm in northern India: influences on aerosol optical properties and radiation budget, Atmos. Chem. Phys., 14, 2431–2446, https://doi.org/10.5194/acp-14-2431-2014, 2014. a
Ladwig, P., Herder, J., and Geiger, C.: Towards Precise, Fast and Comfortable Immersive Polygon Mesh Modelling: Capitalising the Results of Past Research and Analysing the Needs of Professionals, in: ICAT-EGVE, 205–212, https://dl.acm.org/doi/abs/10.5555/3298830.3298868 (last access: 21 May 2022), 2017. a
Lelieveld, J., Berresheim, H., Borrmann, S., Crutzen, P. J., Dentener, F., Fischer, H., Feichter, J., Flatau, P., Heland, J., Holzinger, R., and and Korrmann, R.: Global air pollution crossroads over the Mediterranean, Science, 298, 794–799, 2002. a, b
Levy, R. C., Mattoo, S., Munchak, L. A., Remer, L. A., Sayer, A. M., Patadia, F., and Hsu, N. C.: The Collection 6 MODIS aerosol products over land and ocean, Atmos. Meas. Tech., 6, 2989–3034, https://doi.org/10.5194/amt-6-2989-2013, 2013. a
Logothetis, S.-A., Salamalikis, V., Gkikas, A., Kazadzis, S., Amiridis, V., and Kazantzidis, A.: 15-year variability of desert dust optical depth on global and regional scales, Atmos. Chem. Phys., 21, 16499–16529, https://doi.org/10.5194/acp-21-16499-2021, 2021. a
Lolis, C., Bartzokas, A., and Katsoulis, B.: Relation between sensible and latent heat fluxes in the Mediterranean and precipitation in the Greek area during winter, Int. J. Climatol., 24, 1803–1816, 2004. a
Lux, O., Lemmerz, C., Weiler, F., Marksteiner, U., Witschas, B., Rahm, S., Geiß, A., and Reitebuch, O.: Intercomparison of wind observations from the European Space Agency's Aeolus satellite mission and the ALADIN Airborne Demonstrator, Atmos. Meas. Tech., 13, 2075–2097, https://doi.org/10.5194/amt-13-2075-2020, 2020. a
Mamouri, R.-E. and Ansmann, A.: Potential of polarization/Raman lidar to separate fine dust, coarse dust, maritime, and anthropogenic aerosol profiles, Atmos. Meas. Tech., 10, 3403–3427, https://doi.org/10.5194/amt-10-3403-2017, 2017. a
Mareckova, K., Wankmueller, R., Whiting, R., and Pinterits, M.: Review of Emission Data Reported under the LRTAP Convention and NEC Directive, Tech. rep., Technical Report CEIP 1, http://www.ceip.at/fileadmin/inhalte/emep/pdf/2012/InventoryReport2012_forWeb.pdf (last access: 13 April 2022), 2012. a
Marinou, E., Amiridis, V., Binietoglou, I., Tsikerdekis, A., Solomos, S., Proestakis, E., Konsta, D., Papagiannopoulos, N., Tsekeri, A., Vlastou, G., Zanis, P., Balis, D., Wandinger, U., and Ansmann, A.: Three-dimensional evolution of Saharan dust transport towards Europe based on a 9-year EARLINET-optimized CALIPSO dataset, Atmos. Chem. Phys., 17, 5893–5919, https://doi.org/10.5194/acp-17-5893-2017, 2017. a, b, c
Marinou, E., Tesche, M., Nenes, A., Ansmann, A., Schrod, J., Mamali, D., Tsekeri, A., Pikridas, M., Baars, H., Engelmann, R., Voudouri, K.-A., Solomos, S., Sciare, J., Groß, S., Ewald, F., and Amiridis, V.: Retrieval of ice-nucleating particle concentrations from lidar observations and comparison with UAV in situ measurements, Atmos. Chem. Phys., 19, 11315–11342, https://doi.org/10.5194/acp-19-11315-2019, 2019. a
Mehta, M., Singh, R., Singh, A., and Singh, N.: Recent global aerosol optical depth variations and trends – A comparative study using MODIS and MISR level 3 datasets, Remote Sens. Environ., 181, 137–150, 2016. a
Middleton, N. and Goudie, A.: Saharan dust: sources and trajectories, T. I. Brit. Geogr., 26, 165–181, 2001. a, b
Middleton, N. J.: Desert dust hazards: A global review, Aeolian Res., 24, 53–63, 2017. a
Miller, S. D., Kuciauskas, A. P., Liu, M., Ji, Q., Reid, J. S., Breed, D. W., Walker, A. L., and Mandoos, A. A.: Haboob dust storms of the southern Arabian Peninsula, J. Geophys. Res.-Atmos., 113, D01202, https://doi.org/10.1029/2007JD008550, 2008. a
Mona, L., Amodeo, A., Pandolfi, M., and Pappalardo, G.: Saharan dust intrusions in the Mediterranean area: Three years of Raman lidar measurements, J. Geophys. Res.-Atmos., 111, D16203, https://doi.org/10.1029/2005JD006569, 2006. a
Morrison, H., Curry, J., and Khvorostyanov, V.: A new double-moment microphysics parameterization for application in cloud and climate models. Part I: Description, J. Atmos. Sci., 62, 1665–1677, 2005. a
Nabavi, S. O., Haimberger, L., and Samimi, C.: Climatology of dust distribution over West Asia from homogenized remote sensing data, Aeolian Res., 21, 93–107, 2016. a
Nabavi, S. O., Haimberger, L., and Samimi, C.: Sensitivity of WRF-chem predictions to dust source function specification in West Asia, Aeolian Res., 24, 115–131, 2017. a, b, c
NOAA/ESRL: WRF-CHEM, Model Item, OpenGMS, NOAA/ESRL [data set], https://geomodeling.njnu.edu.cn/modelItem/7faf79e0-fc0b-460f-93e1-e63bc86b0662 (last access: 22 October 2022), 2019. a
Notaro, M., Yu, Y., and Kalashnikova, O. V.: Regime shift in Arabian dust activity, triggered by persistent Fertile Crescent drought, J. Geophys. Res.-Atmos., 120, 10–229, 2015. a, b, c
Oreopoulos, L. and Barker, H. W.: Accounting for subgrid-scale cloud variability in a multi-layer 1D solar radiative transfer algorithm, Q. J. Roy. Meteor. Soc., 125, 301–330, 1999. a
Papayannis, A., Balis, D., Amiridis, V., Chourdakis, G., Tsaknakis, G., Zerefos, C., Castanho, A. D. A., Nickovic, S., Kazadzis, S., and Grabowski, J.: Measurements of Saharan dust aerosols over the Eastern Mediterranean using elastic backscatter-Raman lidar, spectrophotometric and satellite observations in the frame of the EARLINET project, Atmos. Chem. Phys., 5, 2065–2079, https://doi.org/10.5194/acp-5-2065-2005, 2005. a, b
Pappalardo, G., Amodeo, A., Apituley, A., Comeron, A., Freudenthaler, V., Linné, H., Ansmann, A., Bösenberg, J., D'Amico, G., Mattis, I., Mona, L., Wandinger, U., Amiridis, V., Alados-Arboledas, L., Nicolae, D., and Wiegner, M.: EARLINET: towards an advanced sustainable European aerosol lidar network, Atmos. Meas. Tech., 7, 2389–2409, https://doi.org/10.5194/amt-7-2389-2014, 2014. a
Parajuli, S. P., Stenchikov, G. L., Ukhov, A., and Kim, H.: Dust emission modeling using a new high-resolution dust source function in WRF-Chem with implications for air quality, J. Geophys. Res.-Atmos., 124, 10109–10133, 2019. a
Pérez, C., Nickovic, S., Pejanovic, G., Baldasano, J. M., and Özsoy, E.: Interactive dust-radiation modeling: A step to improve weather forecasts, J. Geophys. Res.-Atmos., 111, D16206, https://doi.org/10.1029/2005JD006717, 2006. a
Pisso, I., Sollum, E., Grythe, H., Kristiansen, N. I., Cassiani, M., Eckhardt, S., Arnold, D., Morton, D., Thompson, R. L., Groot Zwaaftink, C. D., Evangeliou, N., Sodemann, H., Haimberger, L., Henne, S., Brunner, D., Burkhart, J. F., Fouilloux, A., Brioude, J., Philipp, A., Seibert, P., and Stohl, A.: The Lagrangian particle dispersion model FLEXPART version 10.4, Geosci. Model Dev., 12, 4955–4997, https://doi.org/10.5194/gmd-12-4955-2019, 2019. a
Pozzer, A., de Meij, A., Yoon, J., Tost, H., Georgoulias, A. K., and Astitha, M.: AOD trends during 2001–2010 from observations and model simulations, Atmos. Chem. Phys., 15, 5521–5535, https://doi.org/10.5194/acp-15-5521-2015, 2015. a, b
Proestakis, E., Amiridis, V., Marinou, E., Georgoulias, A. K., Solomos, S., Kazadzis, S., Chimot, J., Che, H., Alexandri, G., Binietoglou, I., Daskalopoulou, V., Kourtidis, K. A., de Leeuw, G., and van der A, R. J.: Nine-year spatial and temporal evolution of desert dust aerosols over South and East Asia as revealed by CALIOP, Atmos. Chem. Phys., 18, 1337–1362, https://doi.org/10.5194/acp-18-1337-2018, 2018. a
Prospero, J.: Saharan dust transport over the North Atlantic Ocean and Mediterranean: An overview, The impact of desert dust across the Mediterranean, edited by: Guerzoni, S. and Chester, R., Kluwer Acad., Norwell, Mass., 133–151, 1996. a
Prospero, J. M.: Long-range transport of mineral dust in the global atmosphere: Impact of African dust on the environment of the southeastern United States, P. Natl. Acad. Sci. USA, 96, 3396–3403, 1999. a
Prospero, J. M., Ginoux, P., Torres, O., Nicholson, S. E., and Gill, T. E.: Environmental characterization of global sources of atmospheric soil dust identified with the Nimbus 7 Total Ozone Mapping Spectrometer (TOMS) absorbing aerosol product, Rev. Geophys., 40, 1002, https://doi.org/10.1029/2000RG000095, 2002. a
Prospero, J. M., Landing, W. M., and Schulz, M.: African dust deposition to Florida: Temporal and spatial variability and comparisons to models, J. Geophys. Res.-Atmos., 115, D13304, https://doi.org/10.1029/2009JD012773, 2010. a
Prospero, J. M., Collard, F.-X., Molinié, J., and Jeannot, A.: Characterizing the annual cycle of African dust transport to the Caribbean Basin and South America and its impact on the environment and air quality, Global Biogeochem. Cy., 28, 757–773, 2014. a
Randles, C., Da Silva, A., Buchard, V., Colarco, P., Darmenov, A., Govindaraju, R., Smirnov, A., Holben, B., Ferrare, R., Hair, J., and Shinozuka, Y.: The MERRA-2 aerosol reanalysis, 1980 onward. Part I: System description and data assimilation evaluation, J. Climate, 30, 6823–6850, 2017. a
Ravi, S., D'Odorico, P., Breshears, D. D., Field, J. P., Goudie, A. S., Huxman, T. E., Li, J., Okin, G. S., Swap, R. J., Thomas, A. D., and Van Pelt, S.: Aeolian processes and the biosphere, Rev. Geophys., 49, RG3001, https://doi.org/10.1029/2010RG000328, 2011. a, b
Rennie, M. and Isaksen, L.: Investigations into the Quality of Aeolus L2B Winds Using the ECMWF Model and Initial NWP Impact Assessment, in: Living Planet Symposium, Milan, Italy, 13–17, https://lps19.esa.int/NikalWebsitePortal/living-planet-symposium-2019/lps19/Agenda/AgendaItemDetail?id=1a3d272c-f7d1-4847-b1c4-08c452f9405f (last access: 8 November 2022), 2019. a, b
Rennie, M. P., Isaksen, L., Weiler, F., de Kloe, J., Kanitz, T., and Reitebuch, O.: The impact of Aeolus wind retrievals on ECMWF global weather forecasts, Q. J. Roy. Meteor. Soc., 147, 3555–3586, 2021. a, b, c, d
Ridley, D., Heald, C., and Ford, B.: North African dust export and deposition: A satellite and model perspective, J. Geophys. Res.-Atmos., 117, D02202, https://doi.org/10.1029/2011JD016794, 2012. a
Rizza, U., Miglietta, M. M., Mangia, C., Ielpo, P., Morichetti, M., Iachini, C., Virgili, S., and Passerini, G.: Sensitivity of WRF-Chem model to land surface schemes: Assessment in a severe dust outbreak episode in the Central Mediterranean (Apulia Region), Atmos. Res., 201, 168–180, 2018. a
Schell, B., Ackermann, I. J., Hass, H., Binkowski, F. S., and Ebel, A.: Modeling the formation of secondary organic aerosol within a comprehensive air quality model system, J. Geophys. Res.-Atmos., 106, 28275–28293, 2001. a
Schepanski, K., Tegen, I., Todd, M., Heinold, B., Bönisch, G., Laurent, B., and Macke, A.: Meteorological processes forcing Saharan dust emission inferred from MSG-SEVIRI observations of subdaily dust source activation and numerical models, J. Geophys. Res.-Atmos., 114, D10201, https://doi.org/10.1029/2008JD010325, 2009. a
Shaheen, A., Wu, R., Lelieveld, J., Yousefi, R., and Aldabash, M.: Winter AOD trend changes over the Eastern Mediterranean and Middle East region, Int. J. Climatol., 41, 5516–5535, 2021. a
Shimizu, A., Sugimoto, N., Matsui, I., Arao, K., Uno, I., Murayama, T., Kagawa, N., Aoki, K., Uchiyama, A., and Yamazaki, A.: Continuous observations of Asian dust and other aerosols by polarization lidars in China and Japan during ACE-Asia, J. Geophys. Res.-Atmos., 109, D19S17, https://doi.org/10.1029/2002JD003253, 2004. a
Shipley, S. T., Tracy, D., Eloranta, E. W., Trauger, J. T., Sroga, J., Roesler, F., and Weinman, J. A.: High spectral resolution lidar to measure optical scattering properties of atmospheric aerosols. 1: Theory and instrumentation, Appl. Optics, 22, 3716–3724, 1983. a
Sinyuk, A., Holben, B. N., Eck, T. F., Giles, D. M., Slutsker, I., Korkin, S., Schafer, J. S., Smirnov, A., Sorokin, M., and Lyapustin, A.: The AERONET Version 3 aerosol retrieval algorithm, associated uncertainties and comparisons to Version 2, Atmos. Meas. Tech., 13, 3375–3411, https://doi.org/10.5194/amt-13-3375-2020, 2020. a
Stefanski, R. and Sivakumar, M.: Impacts of sand and dust storms on agriculture and potential agricultural applications of a SDSWS, in: IOP Conference Series: Earth and Environmental Science, vol. 7, p. 012016, IOP Publishing, https://doi.org/10.1088/1755-1307/7/1/012016, 2009. a
Stockwell, W. R., Kirchner, F., Kuhn, M., and Seefeld, S.: A new mechanism for regional atmospheric chemistry modeling, J. Geophys. Res.-Atmos., 102, 25847–25879, 1997. a
Stoffelen, A., Pailleux, J., Källén, E., Vaughan, J. M., Isaksen, L., Flamant, P., Wergen, W., Andersson, E., Schyberg, H., Culoma, A., and Meynart, R.: The atmospheric dynamics mission for global wind field measurement, B. Am. Meteorol. Soc., 86, 73–88, 2005. a
Stohl, A., Forster, C., Frank, A., Seibert, P., and Wotawa, G.: Technical note: The Lagrangian particle dispersion model FLEXPART version 6.2, Atmos. Chem. Phys., 5, 2461–2474, https://doi.org/10.5194/acp-5-2461-2005, 2005. . a
Su, L. and Fung, J. C.: Sensitivities of WRF-Chem to dust emission schemes and land surface properties in simulating dust cycles during springtime over East Asia, J. Geophys. Res.-Atmos., 120, 11–215, 2015. a
Sugimoto, N., Uno, I., Nishikawa, M., Shimizu, A., Matsui, I., Dong, X., Chen, Y., and Quan, H.: Record heavy Asian dust in Beijing in 2002: Observations and model analysis of recent events, Geophys. Res. Lett., 30, 1194, https://doi.org/10.1029/2002GL016092, 2003. a
Tegen, I., Schepanski, K., and Heinold, B.: Comparing two years of Saharan dust source activation obtained by regional modelling and satellite observations, Atmos. Chem. Phys., 13, 2381–2390, https://doi.org/10.5194/acp-13-2381-2013, 2013. a
Tesche, M., Ansmann, A., Müller, D., Althausen, D., Engelmann, R., Freudenthaler, V., and Groß, S.: Vertically resolved separation of dust and smoke over Cape Verde using multiwavelength Raman and polarization lidars during Saharan Mineral Dust Experiment 2008, J. Geophys. Res.-Atmos., 114, D13202, https://doi.org/10.1029/2009JD011862, 2009. a
Todd, M. C., Washington, R., Martins, J. V., Dubovik, O., Lizcano, G., M'bainayel, S., and Engelstaedter, S.: Mineral dust emission from the Bodélé Depression, northern Chad, during BoDEx 2005, J. Geophys. Res.-Atmos., 112, D06207, https://doi.org/10.1029/2006JD007170, 2007. a, b
Toledano, C., Cachorro, V., Berjon, A., De Frutos, A., Sorribas, M., De la Morena, B., and Goloub, P.: Aerosol optical depth and Ångström exponent climatology at El Arenosillo AERONET site (Huelva, Spain), Q. J. Roy. Meteor. Soc., 133, 795–807, 2007. a
Trigo, R., Trigo, I., DaCamara, C., and Osborn, T.: Climate impact of the European winter blocking episodes from the NCEP/NCAR Reanalyses, Clim. Dynam., 23, 17–28, 2004. a
Tsarpalis, K., Papadopoulos, A., Mihalopoulos, N., Spyrou, C., Michaelides, S., and Katsafados, P.: The implementation of a mineral dust wet deposition scheme in the GOCART-AFWA module of the WRF model, Remote Sensing, 10, 1595, https://doi.org/10.3390/rs10101595, 2018. a
Tyrlis, E., Škerlak, B., Sprenger, M., Wernli, H., Zittis, G., and Lelieveld, J.: On the linkage between the Asian summer monsoon and tropopause fold activity over the eastern Mediterranean and the Middle East, J. Geophys. Res.-Atmos., 119, 3202–3221, 2014. a
Ukhov, A., Mostamandi, S., da Silva, A., Flemming, J., Alshehri, Y., Shevchenko, I., and Stenchikov, G.: Assessment of natural and anthropogenic aerosol air pollution in the Middle East using MERRA-2, CAMS data assimilation products, and high-resolution WRF-Chem model simulations, Atmos. Chem. Phys., 20, 9281–9310, https://doi.org/10.5194/acp-20-9281-2020, 2020. a
Uno, I., Wang, Z., Chiba, M., Chun, Y., Gong, S. L., Hara, Y., Jung, E., Lee, S.-S., Liu, M., Mikami, M., and Music, S.: Dust model intercomparison (DMIP) study over Asia: Overview, J. Geophys. Res.-Atmos., 111, D12213, https://doi.org/10.1029/2005JD006575, 2006. a
Weinzierl, B., Sauer, D., Minikin, A., Reitebuch, O., Dahlkötter, F., Mayer, B., Emde, C., Tegen, I., Gasteiger, J., Petzold, A., and Veira, A.: On the visibility of airborne volcanic ash and mineral dust from the pilot’s perspective in flight, Phys. Chem. Earth, 45, 87–102, 2012. a
Willmott, C. J., Robeson, S. M., and Matsuura, K.: A refined index of model performance, Int. J. Climatol., 32, 2088–2094, 2012. a
Witschas, B., Lemmerz, C., Geiß, A., Lux, O., Marksteiner, U., Rahm, S., Reitebuch, O., and Weiler, F.: First validation of Aeolus wind observations by airborne Doppler wind lidar measurements, Atmos. Meas. Tech., 13, 2381–2396, https://doi.org/10.5194/amt-13-2381-2020, 2020. a
Wu, J., Kurosaki, Y., Shinoda, M., and Kai, K.: Regional characteristics of recent dust occurrence and its controlling factors in East Asia, SOLA, 12, 187–191, 2016. a
Xu, W., Sun, Y., Wang, Q., Zhao, J., Wang, J., Ge, X., Xie, C., Zhou, W., Du, W., Li, J., and Fu, P.: Changes in aerosol chemistry from 2014 to 2016 in winter in Beijing: Insights from high-resolution aerosol mass spectrometry, J. Geophys. Res.-Atmos., 124, 1132–1147, 2019. a
Yuan, T., Chen, S., Huang, J., Zhang, X., Luo, Y., Ma, X., and Zhang, G.: Sensitivity of simulating a dust storm over Central Asia to different dust schemes using the WRF-Chem model, Atmos. Environ., 207, 16–29, 2019. a
Zender, C. S., Newman, D., and Torres, O.: Spatial heterogeneity in aeolian erodibility: Uniform, topographic, geomorphic, and hydrologic hypotheses, J. Geophys. Res.-Atmos., 108, 4543, https://doi.org/10.1029/2002JD003039, 2003. a
Zeng, Z.-C., Chen, S., Natraj, V., Le, T., Xu, F., Merrelli, A., Crisp, D., Sander, S. P., and Yung, Y. L.: Constraining the vertical distribution of coastal dust aerosol using OCO-2 O2 A-band measurements, Remote Sens. Enviro., 236, 111494,https://doi.org/10.1016/j.rse.2019.111494, 2020. a
Zhang, D. and Anthes, R. A.: A high-resolution model of the planetary boundary layer – Sensitivity tests and comparisons with SESAME-79 data, J. Appl. Meteorol., 21, 1594–1609, 1982. a
Zhao, C., Liu, X., Leung, L. R., Johnson, B., McFarlane, S. A., Gustafson Jr., W. I., Fast, J. D., and Easter, R.: The spatial distribution of mineral dust and its shortwave radiative forcing over North Africa: modeling sensitivities to dust emissions and aerosol size treatments, Atmos. Chem. Phys., 10, 8821–8838, https://doi.org/10.5194/acp-10-8821-2010, 2010. a, b
Zhao, J., Ma, X., Wu, S., and Sha, T.: Dust emission and transport in Northwest China: WRF-Chem simulation and comparisons with multi-sensor observations, Atmos. Res., 241, 104978, https://doi.org/10.1016/j.atmosres.2020.104978, 2020. a
The requested paper has a corresponding corrigendum published. Please read the corrigendum first before downloading the article.
- Article
(13551 KB) - Full-text XML