the Creative Commons Attribution 4.0 License.
the Creative Commons Attribution 4.0 License.
 | 05 Apr 2023
Foreign emissions exacerbate PM2.5 pollution in China through nitrate chemistry
Jun-Wei Xu
Jamiu Adeniran
Hao Kong
Fine particulate matter (PM2.5) pollution is a severe problem in China. Research on the sources of Chinese PM2.5 pollution has focused on the contributions of China's domestic emissions. However, the impact of foreign anthropogenic emissions has typically been simplified or neglected, partly due to the perception that the short lifetime of PM2.5 (a few days) does not allow long-distance transport. Here we explore the role of foreign anthropogenic emissions in Chinese PM2.5 pollution in 2015 using the GEOS-Chem chemical transport model. We validate the model simulations with a comprehensive set of observations of PM2.5 and its composition, including sulfate, nitrate, ammonium, black carbon, and primary organic aerosols, over China and its surrounding regions. We find that 8 % of PM2.5 (5 µg m−3) and 19 % of nitrate (2.6 µg m−3) over eastern China in 2015 was contributed by foreign anthropogenic emissions. The contributions were the highest in January (6.9 µg m−3 PM2.5, with 68 % nitrate) and the lowest in July (2.7 µg m−3 PM2.5, with 11 % nitrate). Yet, only 30 % of such foreign contributions in January were through direct atmospheric transport. The majority (70 %) were instead through chemical interactions between foreign-transported aerosol precursors and China's domestic emissions of pollutants. Specifically, the transport of non-methane volatile organic compounds (NMVOCs) from foreign countries enhanced the atmospheric oxidizing capacity and facilitated the oxidation of Chinese nitrogen oxides (NOx) to form nitric acid (HNO3) over eastern China. The abundance of Chinese ammonia (NH3) further partitioned nearly all HNO3 gas to particulate nitrate, leading to considerable foreign contributions of nitrate and PM2.5 to eastern China. Over southwestern China, foreign anthropogenic emissions contributed 4.9 µg m−3 PM2.5 concentrations (18 % of total PM2.5 mass) to Yunnan Province, with 37 % as organics and 27 % as sulfate. Our findings suggest that foreign anthropogenic emissions play an important role in Chinese PM2.5 pollution because of direct aerosol transport and, more importantly, chemical interactions between transported pollutants and China's local emissions. Thus, foreign emission reductions will be very beneficial for improving Chinese air quality.
- Article
(2678 KB) - Full-text XML
-
Supplement
(1665 KB) - BibTeX
- EndNote


China has been severely affected by fine particulate matter (PM2.5, particulate matter smaller than 2.5 µm in aerodynamic diameter) pollution over the past decades from processes of industrialization and urbanization (Geng et al., 2021; West et al., 2016). Over 1 million premature deaths associated with PM2.5 pollution occur in China every year (Cohen et al., 2017; Yue et al., 2020; Zhang et al., 2017). In response, the Chinese government imposed stringent emission controls on primary particles and precursor gases in the 5-year Clean Air Action in 2013 (China State Council, 2013), leading to a nationwide emission reduction of 59 % for sulfur dioxide (SO2) and 21 % for nitrogen oxides (NOx≡ NO + NO2) from 2013 to 2017 (Zhang et al., 2019; Zheng et al., 2018). Correspondingly, annual-mean PM2.5 concentrations in China decreased by 30 %–50 % from 2013 to 2017 (Ding et al., 2019; Geng et al., 2021; Li et al., 2019), avoiding 64 000 (6.8 %) premature deaths. Despite these remarkable achievements, population-weighted mean PM2.5 concentration in China was still as high as 42.1 µg m−3 in 2017 (with 2.1 million associated premature deaths; Geng et al., 2021a), far exceeding the newly revised threshold of 5 µg m−3 in the World Health Organization (WHO) Air Quality Guidelines (WHO, 2021). In 2020, the Chinese government further launched the “Beautiful China” strategy, which requires an annual-mean PM2.5 concentration of ≤ 35 µg m−3 in all cities by 2035. Yet, nearly 30 % of cities in China exceeded that standard based on the 2021 national observation data (Ministry of Ecology and Environment, MEE, 2021). Thus, further improvement of air quality is pressing. However, air quality management has been progressively challenging with the abundance of end-of-pipe control technologies in dominant sources (industrial and power sectors; Xing et al., 2020) and the exhausting benefits of such technologies (Geng et al., 2021). Hence, more comprehensive and in-depth understanding of Chinese PM2.5 pollution sources is urgently needed to help prioritize increasingly limited resources for accurate and effective mitigation action.
Recent research on the sources of PM2.5 pollution in China has focused mostly on China's domestic anthropogenic emissions (An et al., 2019; Cheng et al., 2021b; Meng et al., 2019; Tang et al., 2022; Tong et al., 2018; Xing et al., 2020). A number of studies have explored how China could further reduce its own emissions of air pollutants through a wide range of energy transformation scenarios to achieve co-benefits of air quality improvement and climate mitigation (Cheng et al., 2021b; Peng et al., 2018; Tong et al., 2018, 2020; Xing et al., 2020). Studies have also investigated factors hindering the effectiveness of emission reductions on air quality improvement in China, such as excess ammonia emissions (Bai et al., 2019; Gu et al., 2021; Yan et al., 2021a) and enhanced atmospheric oxidizing capacity associated with NOx emission reductions in recent years (Huang et al., 2021; Le et al., 2020; Ren et al., 2021; Zang et al., 2022). A few works have studied the inter-provincial transport of pollution across China and found that the contribution of inter-provincial transport to PM2.5 concentrations in the most severely polluted regions (such as Beijing) might have exceeded that of local emissions (Li et al., 2015). In addition, the range of inter-provincial transport of pollution was not confined within city clusters, such as Beijing–Tianjin–Hebei, the Yangtze River Delta, and the Pearl River Delta, but also extended over a long distance across city clusters (Wang et al., 2022). Yan et al. (2021b) further found that transboundary transport from Asian regions (18.5 %–19.2 %, including Chinese regions outside the Wuhan city cluster) contributed much more to ozone concentrations in the Wuhan city cluster in Central China than the transport within the city cluster (2.5 %–3.1 %), highlighting the importance of transboundary transport of pollutants to China.
However, the influence of transboundary transport to China air quality has been hardly investigated for PM2.5. This is likely due to the perception that the relatively short lifetime of PM2.5 (a few days) does not permit long-distance transport (Wang et al., 2019). Only a few have investigated the influence of pollutant emissions from neighboring countries (Jiang et al., 2013; Koplitz et al., 2017) on China; however they have typically focused on one particular sector, such as biomass burning emissions from South Asia (Jiang et al., 2013) or coal emissions from Southeast Asia (Koplitz et al., 2017). A comprehensive assessment of transboundary PM2.5 pollution in China from foreign sources is lacking. In contrast, studies on the transboundary PM2.5 pollution from China to neighboring countries have received considerable attention (Choi et al., 2019; Jiang et al., 2013; Kurokawa and Ohara, 2020; Park et al., 2014). This contrast is likely due to another perception that transboundary pollution from foreign countries to China is minor since China's domestic emissions far exceeded those from neighboring countries, such as Korea, Japan, India, and Southeast Asia (Kurokawa and Ohara, 2020; McDuffie et al., 2020). However, the pollutant emission pattern in China and neighboring countries may shift in the future. Emissions in China have decreased considerably (Zheng et al., 2018), and the trend is expected to continue with the launch of ambitious policies on air pollution (the 2035 Beautiful China strategy) and climate change (the 2060 carbon neutrality). In contrast, emissions from India and Southeast Asian countries have been estimated to increase in the future by various projections, given their fast economic growth and a lack of clear commitments on either air quality or climate mitigation (IEA, 2021). For example, Koplitz et al. (2017) revealed that the projected increase in coal emissions in Southeast Asian countries will lead to 49 780 excess deaths per year associated with PM2.5 pollution in 2030, with 9000 (18 %) of these excess deaths occurring in China. The transboundary pollution from neighboring countries to China may become increasingly prominent in the future. Thus, an effective air quality management action for the achievement of the Beautiful China target requires a clear understanding of the current contribution of foreign anthropogenic emissions to Chinese PM2.5 pollution.
A comprehensive assessment of foreign contributions to PM2.5 pollution in China relies on a complex representation of aerosol emissions and chemical reactions across a large spatial domain. The GEOS-Chem global chemical transport model has been widely applied to PM2.5 studies over Asia (i.e., China, India, Southeast Asia, Korea, and Japan; Choi et al., 2019; Koplitz et al., 2017; Miao et al., 2020; Venkataraman et al., 2018; Wang et al., 2004; Zhang et al., 2015) and is thereby applicable to such research. Although the model has been extensively validated for total PM2.5 mass concentrations over China using observational data, compositional PM2.5 across China and total PM2.5 for other Asian countries are far less evaluated due to scarce observations (Cheng et al., 2021a; Koplitz et al., 2017; Miao et al., 2020). This limits the credibility of the model's representation of aerosol emission and chemical reactions across a large domain. Thus, a more comprehensive evaluation of the GEOS-Chem simulation is needed to support model estimates of the influence of transboundary pollution on air quality in China.
In this study, we use the GEOS-Chem model to quantify the contributions of foreign anthropogenic emissions to total and compositional PM2.5 mass concentrations over China in 2015. We first evaluate our model simulations with comprehensive observations of total and compositional PM2.5 concentrations across China and other Asian countries. Then, we quantify the contributions of foreign anthropogenic emissions to Chinese PM2.5 and compositional concentrations in 2015. Finally, we reveal the physical and chemical pathways leading to such contributions.
We conducted a series of simulations using the GEOS-Chem chemical transport model (v13.2.1; http://www.geos-chem.org, last access: 4 April 2023) to (1) represent 2015 PM2.5 and composition concentrations over Asia, (2) quantify the contributions of foreign anthropogenic emissions to total and compositional PM2.5 concentrations over China, and (3) understand the role and the mechanisms of direct transport and chemical interactions in transboundary pollution in China. Simulation configurations are summarized in Table 1 and are elaborated as follows.
Table 1Configuration summary of GEOS-Chem simulations in this study. Emission abbreviations are elaborated in Sect. 2.2.
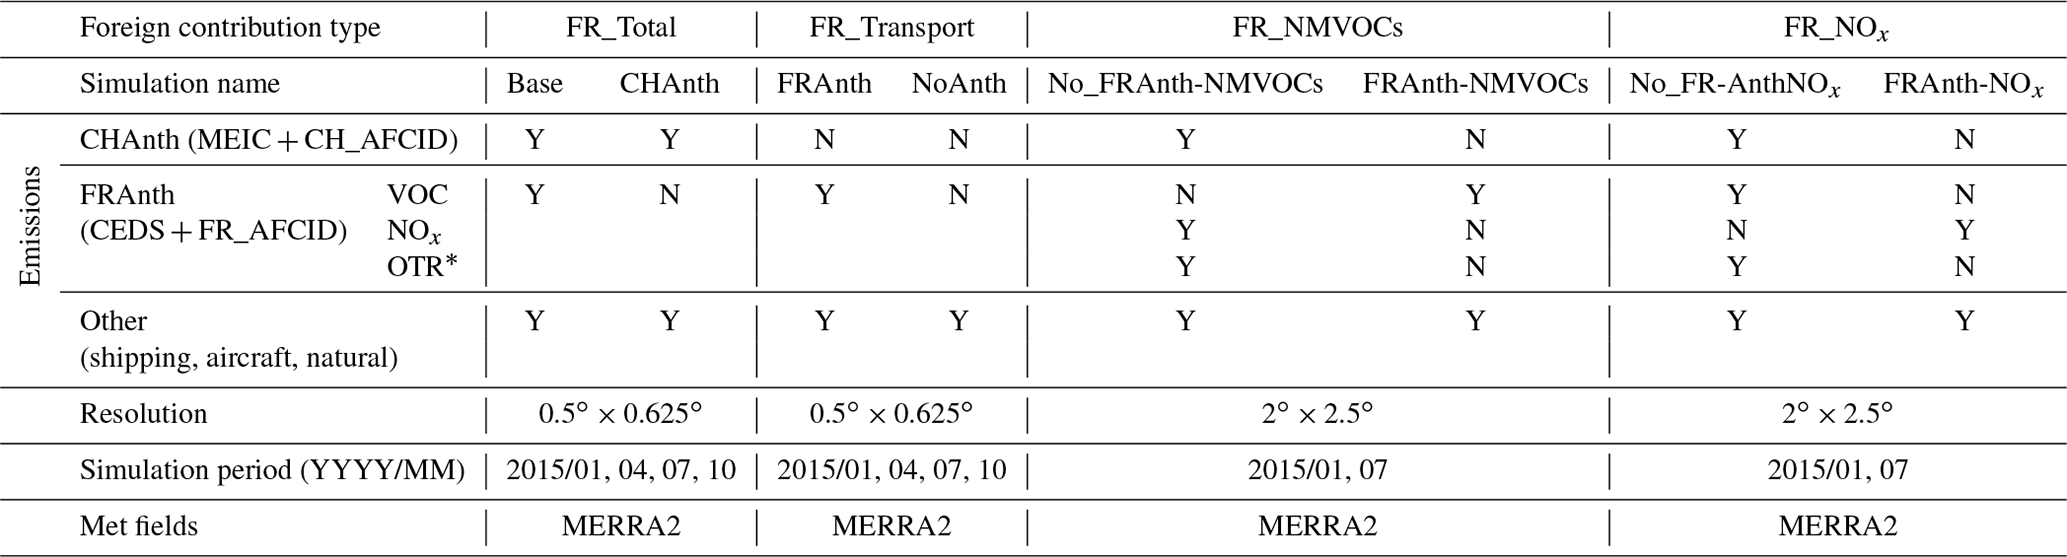
* OTR refers to other species including SO2, NH3, BC, OC, and CO.
2.1 The GEOS-Chem simulation of ground-level PM2.5
We used the flex-grid capability of the GEOS-Chem classic model v13.2.1 to simulate aerosol concentrations over Asia and the adjacent area (11∘ S–60∘ N, 30–150∘ E; Fig. 2a) at a horizontal resolution of 0.5∘ × 0.625∘ and at 47 vertical levels between the surface and ∼ 0.01 hPa. The lowest vertical layer has a thickness of about 130 m. We regard the pollutant concentrations in this layer as “ground-level”. Detailed descriptions of the flex-grid setup can be found at http://wiki.seas.harvard.edu/geos-chem/index.php/FlexGrid (last access: 4 April 2023). Our flex-grid domain extended the traditionally defined nested Asia domain (11∘ S–55∘ N, 60–150∘ E) in the model (Fig. 2a) to better represent the transport of anthropogenic pollutants from Central Asia to China that has not been studied yet. Our simulations were driven by assimilated meteorological data from MERRA-2 provided by the Global Modeling and Assimilation Office (GMAO) at NASA Goddard Space Flight Center. Convective transport in the model was computed from the convective mass fluxes in the meteorological archive as described by Wu et al. (2007). A non-local scheme was used to represent vertical mixing within the planetary boundary layer (PBL), as it accounts for different states of mixing based on the static instability (Lin and McElroy, 2010). Boundary conditions were archived from global simulations at a resolution of 2∘ × 2.5∘. We spun up every simulation for 1 month to remove the effects of initial conditions.
GEOS-Chem simulates PM2.5 concentrations as the sum of sulfate (SO), nitrate (NO), ammonium (NH), organic aerosol (OA ≡ primary OA + secondary OA), black carbon (BC), fine dust, and fine sea salt component concentrations. The sulfate–nitrate–ammonium (SNA) aerosol system was simulated following Fountoukis and Nenes (2007) and Park et al. (2004), including heterogeneous chemistry with dinitrogen pentoxide (N2O5) uptake by aerosol and hydroperoxyl radical (HO2) uptake by aerosol. Gas−aerosol partitioning of SNA was simulated by the ISORROPIA II thermodynamic equilibrium scheme (Pye et al., 2009). We used a simple scheme to represent secondary organic aerosol formation (Heald et al., 2012) and used a spatially resolved ratio to calculate organic mass from organic aerosol concentrations (Philip et al., 2014). Natural dust simulation followed the Mineral Dust Entrainment and Deposition (DEAD) scheme (Duncan Fairlie et al., 2007). Sea salt aerosol simulation was described in Jaeglé et al. (2011). Dry deposition of gases and particles followed a standard resistance-in-series scheme, with updates from Jaeglé et al. (2018). Wet deposition was described in Liu et al. (2001) and Wang et al. (2011, 2014), with updates from Luo et al. (2020) that included a faster below-cloud scavenging of HNO3. We calculated the simulated PM2.5 and composition concentrations at 35 % relative humidity (RH) for consistency with ground-based measurements.
2.2 Emissions for baseline simulation
We conducted a baseline simulation (“Base” run in Table 1) for January, April, July, and October 2015 and treated the mean of the 4 months as the annual mean. Our simulations were all at a resolution of 0.5∘ × 0.625∘, unless otherwise specified. The baseline simulation used emissions as described below.
Anthropogenic emissions for China were taken from the Multi-resolution Emission Inventory (MEIC) for 2015 (Zheng et al., 2018), and for the rest of the world they were taken from the Community Emissions Data System (CEDS) version 2 for 2015 (https://data.pnnl.gov/dataset/CEDS-4-21-21, last access: 4 April 2023). Other emissions were default in GEOS-Chem. Fine anthropogenic fugitive dust emissions from combustion and industrial sources for countries except China (FR_AFCID) were taken from Philip et al. (2017) and from the MEIC inventory for China (CH_AFCID). Aircraft emissions were from the Aviation Emissions Inventory Code (AEIC) inventory (Stettler et al., 2011). Natural emissions include lightning NOx from Murray et al. (2012); soil NOx, biogenic non-methane volatile organic carbons (NMVOCs), and sea salt from offline emissions developed by Weng et al. (2020); biomass burning emissions from the Global Fire Emissions Database version 4 (GFED4; Randerson et al., 2015); volcano emissions from Fisher et al. (2011); marine dimethyl sulfide (DMS) emissions from Breider et al. (2017); and dust emissions using the Mineral Dust Entrainment and Deposition (DEAD) scheme (Zender et al., 2003).
2.3 Sensitivity simulations for the contributions of foreign anthropogenic emissions to Chinese PM2.5 and composition concentrations
We quantified contributions of foreign anthropogenic emissions to China's total and compositional PM2.5 concentrations by taking the difference in the baseline simulation (“Base” run in Table 1) and a sensitivity simulation that excluded foreign anthropogenic emissions from the baseline simulation (“CHAnth” run in Table 1). Such a foreign contribution is referred to as “FR_total”. We also conducted simulations to quantify the sectoral contributions of foreign anthropogenic emissions to China's PM2.5 concentrations. Sectoral contributions were calculated by taking the difference in a simulation that included one sector of foreign anthropogenic emissions (agriculture, industry, energy, traffic, residential combustion, solvent use, waste burning) at a time and a simulation without foreign anthropogenic emissions (“CHAnth” in Table 1).
We further conducted sensitivity simulations to attribute the transboundary pollution to (1) direct transport of foreign PM2.5 to China and (2) chemical interactions between transported foreign pollutants and Chinese emissions. We quantified the contribution of direct transport in transboundary pollution (referred to as “FR_transport”) by taking the difference in a sensitivity simulation that excluded Chinese anthropogenic emissions (“FRAnth” run in Table 1) and another sensitivity simulation that excluded both Chinese and foreign anthropogenic emissions (“NoAnth” run in Table 1). Transboundary pollution through chemical interactions with China's local emissions (referred to as “FR_chemistry”) was calculated as the differences between total foreign anthropogenic contributions (FR_total) and direct transport contributions (FR_transport).
We conducted sensitivity simulations to understand main pollutants driving the chemical interactions of transboundary pollution with Chinese emissions. Specifically, we quantified the contributions of foreign anthropogenic emissions of NMVOCs and NOx to O3, NO3, N2O5, HNO3, and NO concentrations in China. Such contributions include both the direct transport of foreign pollutants and chemical interactions between foreign-transported and Chinese domestic emissions of pollutants. We quantified the total contributions of foreign anthropogenic emissions of NMVOCs as the difference between a simulation with full emissions and a simulation that excluded foreign anthropogenic emissions of NMVOCs (“Base” – “No_FRAnthNMVOCs” runs in Table 1). To quantify the direct transport share of the total contributions, we excluded China's domestic emissions to avoid interactions with foreign-transported pollutants and calculated them as the difference between simulations that included and excluded foreign anthropogenic emissions (“FRAnthNMVOCs” – “NoAnth” runs in Table 1). The contributions of chemical interactions between foreign NMVOCs and China's domestic emissions were quantified as the difference between the total contributions and the direct transport share of the total contributions. Similarly, the total contributions by foreign anthropogenic emissions of NOx were calculated as “Base” – “No_FRAnthNOx” runs in Table 1, with the corresponding direct transport share of the total contributions calculated as “FRAnthNOx” – “NoAnth” runs in Table 1 and the chemistry share calculated as the difference between the total and the direct transport share.
To reduce computational costs, we conducted NMVOC-related sensitivity simulations at a resolution of 2∘ × 2.5∘ (Table 1). The difference in PM2.5 over eastern China between resolutions of 2∘ × 2.5∘ and 0.5∘ × 0.625∘ is about 5 % (3 µg m−3). Compositional differences are within 20 %, with the largest difference in nitrate (2.6 µg m−3, 18 %) and the lowest in black carbon (0.1 µg m−3, 4 %). These differences are within the reasonable range associated with spatial resolutions.
We evaluated the modeled PM2.5 and composition concentrations in the base year (2015) using ground-level PM2.5 observations from the network of the China National Environmental Monitoring Center (CNEMC), a literature search, and the World Health Organization (WHO) database.
Ground-level PM2.5 observations were obtained from the CNEMC network (http://106.37.208.228:8082/, last access: 4 April 2023). We used hourly measurements for January, April, July, and October 2015. PM2.5 mass concentrations were measured using the micro-oscillating balance method or the β absorption method (Zhang and Cao, 2015). We further applied quality controls to hourly CNEMC data. Specifically, we removed a day if there were <14 valid data points within the day and removed a month if there were <25 d of valid data within the month. These in whole removed 12 % of the PM2.5 hourly data and finally retained observations for 1179 sites in 314 cities for model evaluation (Fig. S1). To compare with the GEOS-Chem-simulated PM2.5 concentrations, we calculated the grid-averaged and monthly averaged PM2.5 concentrations from the CNEMC to match spatially and temporally with the model.
We collected compositional PM2.5 observations from publicly available studies, as shown in Table S1. We selected observations that spun at least 1 year or seasonal/monthly measurements centered at January, April, July, or October to match our model simulations. A total of 56 observation data points from 17 cities in 16 provinces for 2014–2016 were collected for major PM2.5 chemical composition, including sulfate, nitrate, ammonium, organic aerosol (OA), and black carbon. We sampled the GEOS-Chem-simulated concentrations from locations and periods (monthly or annual) of observations for evaluation.
To evaluate the modeled PM2.5 concentrations outside China, we collected PM2.5 measurement data for 2013–2016 from the WHO's database on ambient air pollution in cities (https://www.who.int/data/gho/data/themes/air-pollution, last access: 4 April 2023). This database provides annual-average PM2.5 concentrations for more than 500 cities globally. We retained PM2.5 measurements that were directly measured and excluded data inferred from PM10 concentrations. We also retained the sites within our simulation domain and the grid cells where anthropogenic emissions exceeded natural emissions (by comparing PM2.5 concentrations in “FRAnth” and “NoAnth” runs in Table 1). A total of 83 sites covering 10 Asian countries (Bangladesh, Indonesia, India, Japan, Korea, Malaysia, Myanmar, the Philippines, Thailand, and Vietnam) were finally selected in our study as shown in Fig. 2a. Because of the differences in measurement approaches between jurisdictions and the absence of details regarding measurement data (Brauer et al., 2016), we compared annual-average PM2.5 concentrations in the WHO dataset with those estimated from a hybrid of satellite observations, a chemical transport model, and ground-based measurements (van Donkelaar et al., 2021). We removed the sites if the differences were more than 40 %. The final sites retained in our study are shown in Fig. 2b.
Figure 1 shows modeled and observed annual-mean concentrations of PM2.5 and composition across China. The modeled total and compositional PM2.5 are for 2015. Observations of total PM2.5 are for 2015, and those of composition are for 2014–2016. The spatial distribution of modeled PM2.5 exhibits a broad high across eastern China, driven primarily by sulfate (SO), nitrate (NO), ammonium (NH), and organics (OA). PM2.5 over the Sichuan Basin is also high, contributed mostly by sulfate, ammonium, and organics. The enhanced PM2.5 concentrations over the west are dominated by mineral dust. Compared to observations, the modeled PM2.5 reproduces the spatial variation in PM2.5 well across China, with a correlation coefficient (r) of 0.73 and a normalized mean bias (NMB) of 15.7 %. The slight overestimation is primarily contributed by sites in the Sichuan Basin (Fig. S1a), where local emissions (anthropogenic and vegetation emissions; Wang et al., 2018) and meteorological conditions (humid and stagnant; Chen et al., 2014; Liao et al., 2017), combined with the special terrain (plain surrounded by hills; Chen et al., 2014; Wang et al., 2017), make it hard for the model to represent aerosol processes, especially the secondary aerosol formation process (Liao et al., 2017; Tao et al., 2017; Wang et al., 2018). The seasonal evaluation of simulated PM2.5 is shown in Fig. S2 and exhibits a good consistency with observations across seasons (r = 0.61–0.77), demonstrating the model's capability in capturing the seasonal pattern of aerosol processes.
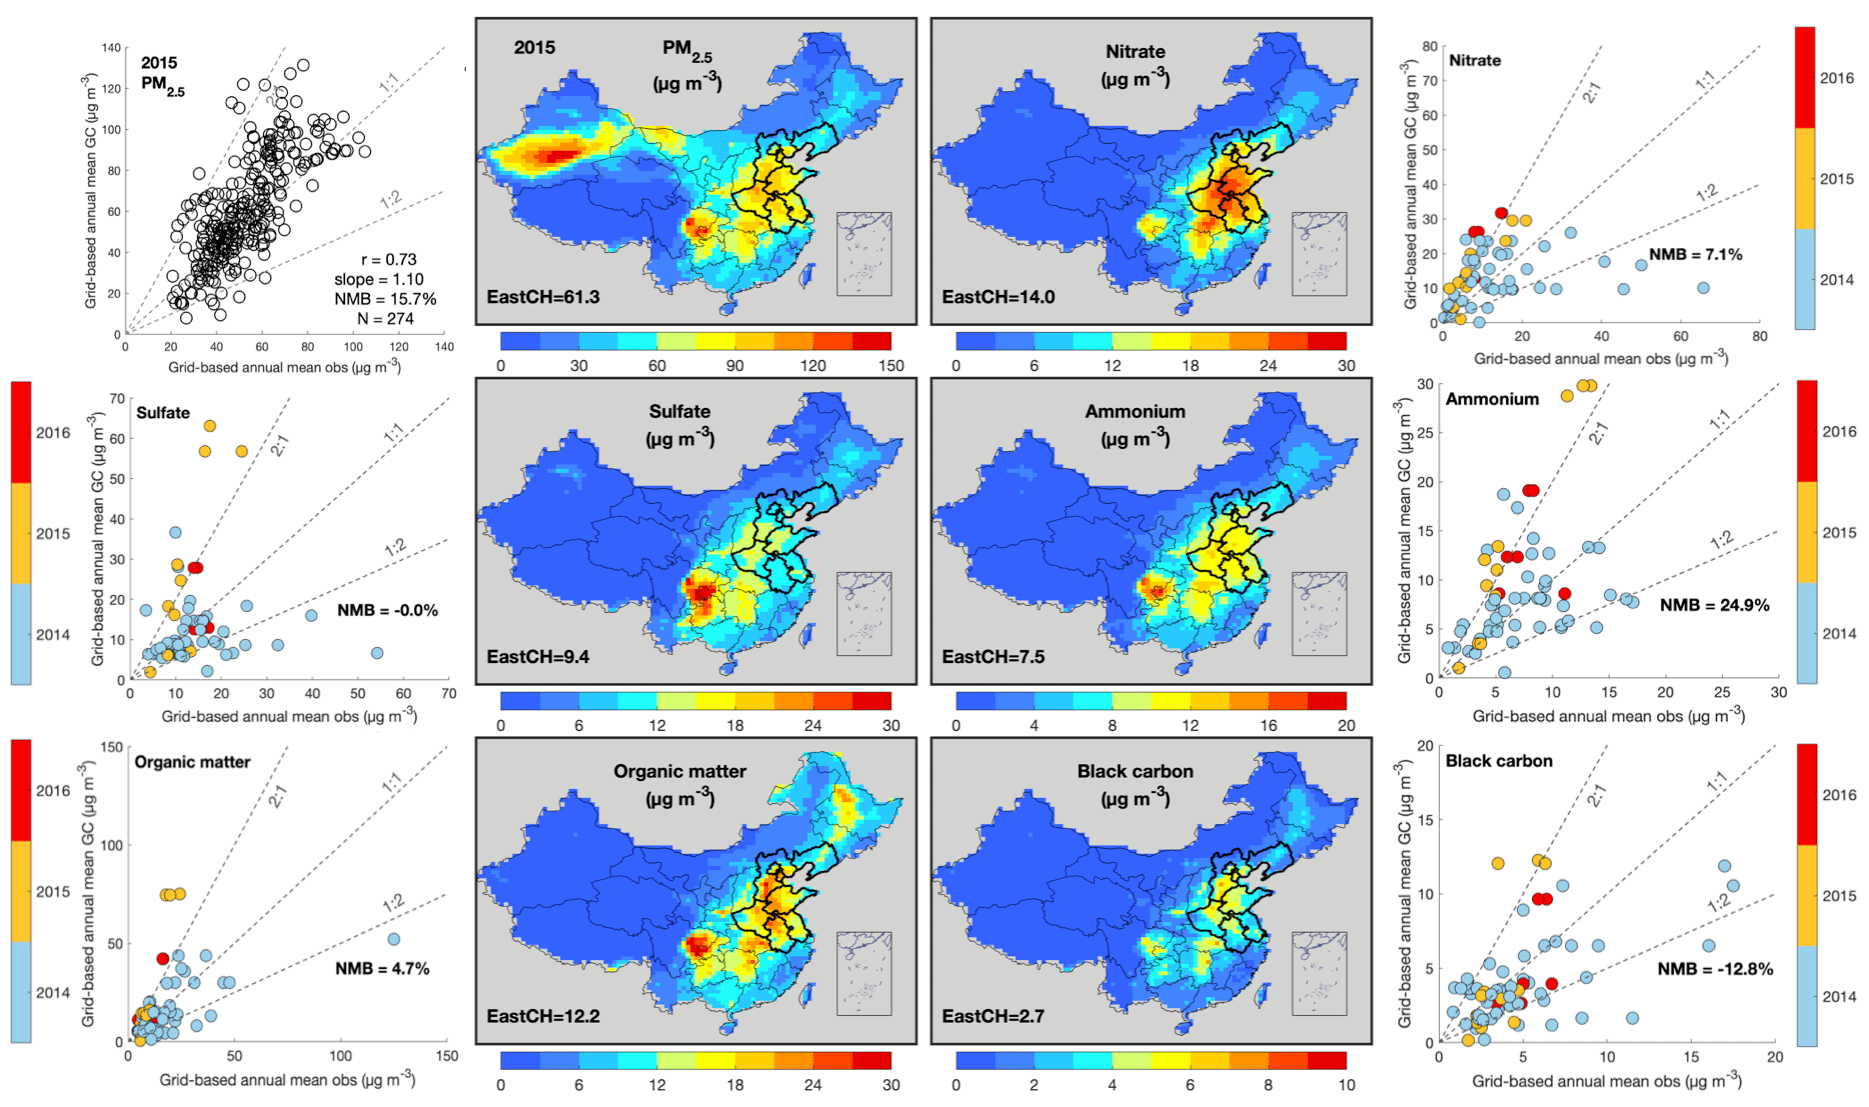
Figure 1Total and compositional PM2.5 concentrations in China. Spatial distributions of PM2.5 and composition concentrations are annual-mean concentrations simulated by the GEOS-Chem model for January, April, July, and October 2015 with a resolution of 0.5∘ × 0.625∘. We regard the mean of the 4 months as the annual mean. Thick black lines outline eastern China, as discussed in this work. Text in the bottom left corner of each map refers to mean concentrations (µg m−3) over eastern China. The scatterplot of PM2.5 compares the simulated annual-mean concentrations with collocated and coincident observations for 2015 from the CNEMC network. Scatterplots of composition compare both annual and monthly concentrations of the observed and the coincident simulated concentrations according to the availability of observations from the literature for 2014–2016.
We further evaluate our modeled compositional PM2.5 with observations from 56 sites across 16 provinces and municipalities in China to better understand the performance of the simulation. The scatterplots of composition comparison in Fig. 1 show a mixture of annual and monthly data depending on the availability of observation data from the literature. We find that the modeled compositional PM2.5 reasonably reproduces the vast spatial variation in PM2.5 composition from observations. Sulfate and nitrate simulations are particularly improved over previous model studies where sulfate was significantly underestimated (NMB of −40 %) and nitrate was substantially overestimated (NMB – 80 %; Gao et al., 2018; Miao et al., 2020). The better representation of nitrate is due to the faster nitrate removal in the Luo et al. (2020) deposition scheme. Organics are also well reproduced by the model (NMB = 4.7 %), suggesting the effectiveness of the simple secondary organic aerosol (SOA) scheme in representing total SOA mass. Ammonium and black carbon show relatively large discrepancies (NMB = 24.9 % and −12.8 %, respectively), potentially reflecting model biases in chemical reactions or gas–particle partitioning for ammonium formation (Miao et al., 2020) and emission inventories for BC (Zhang et al., 2019). In addition, outstanding differences in observation approaches (i.e., thermal, optical, or incandescence measurements for black carbon and different relative humidity in measurements; Bond et al., 2013; Snider et al., 2016) across the literature are another major reasons for the discrepancies.
The evaluation of modeled PM2.5 concentrations for other Asian regions has been rarely conducted due to limited observations (Koplitz et al., 2017). Here, we compare our modeled PM2.5 concentrations with observations from 10 Asian countries around China to understand the model performance in regions whose pollution could influence China through transboundary transport. Figure 2 shows good agreement between modeled and observed total PM2.5 mass across countries, with a correlation coefficient of 0.76 and a NMB of 3.5 %, despite large uncertainties in the measurements collected by different countries. There is an underestimate at coastal sites (e.g., in the Philippines; Fig. 2a), where sea salt aerosols potentially make larger contributions than our simulations. Specifically, our simulated PM2.5 is very consistent with observations in Southeast Asia (NMB = 2.7 %; including Indonesia, Myanmar, the Philippines, Thailand, and Vietnam), India (3.8 %), and other countries in South Asia (NMB = 7.9 %; including Bangladesh, Bhutan, the Maldives, Nepal, Pakistan, and Sri Lanka). Simulations over Japan and South Korea show relatively larger bias (NMB = 17.4 % for Japan and 40 % for South Korea). Zhai et al. (2021) attributed the 43 % bias in the GEOS-Chem simulation of surface PM2.5 over South Korea in their study to nighttime nitrate formation, although their updates of faster below-cloud scavenging of HNO3 (Luo et al., 2020) corrected the overall nitrate bias in East Asia.

Figure 2Annual-mean PM2.5 concentrations at anthropogenic-emission-dominated sites in the simulation domain outside China. (a) The spatial distribution of simulated and observed PM2.5 concentration ratios. The simulated concentration at each measurement site represents the 0.5∘ × 0.625∘ grid cell covering that site. Dashed lines represent the default nested Asia domain (11∘ S–55∘ N, 60–150∘ E) in the model. The flex-grid domain in our study is shown as the entire domain of the map. (b) Scatterplot comparing simulated concentrations for 2015 with collocated observations from the WHO for 2013–2016.
Figure 3 shows the contributions of foreign anthropogenic emissions to total and compositional PM2.5 concentrations over China in 2015. On the national level, foreign anthropogenic emissions contribute about 2.4 µg m−3 PM2.5 to China in 2015, accounting for 6.2 % of the national-average PM2.5 concentration. The foreign influence exhibits prominent spatial heterogeneity, with the largest contribution of 5.0 µg m−3 PM2.5 (8 %) to eastern China (outlined in Fig. 3; including Anhui, Hebei, Henan, Jiangsu, Liaoning, Shandong, Beijing, and Tianjin). Considering the WHO's newly revised guideline for PM2.5 annual exposure level (≤ 5 µg m−3), foreign anthropogenic emissions alone would make PM2.5 concentrations over eastern China reach the WHO standard, threatening the health of nearly 500 million residents there. Transboundary pollution is also outstanding along the southwestern border, contributing 4.9 µg m−3 PM2.5 (18 %) to Yunnan Province, mostly driven by anthropogenic emissions from South Asia (i.e., India).

Figure 3Simulated annual-mean contributions of foreign anthropogenic emissions to China's total and compositional PM2.5 concentrations in 2015. Thick black lines outline eastern China, as discussed in this work. Text in the bottom left corner of each panel refers to mean concentrations (µg m−3) over eastern China contributed by foreign anthropogenic emissions. The foreign impact on China's anthropogenic dust concentrations is shown in Fig. S3. YN in the PM2.5 subplot refers to the location of Yunnan Province.
The transboundary pollution over eastern and southwestern China is contributed by different chemical components of PM2.5, as shown in Fig. 3. Eastern China is mainly driven by nitrate and ammonium, explaining 70 % of transboundary PM2.5. Particularly, 18 % of nitrate and 12 % of ammonium concentrations over eastern China in 2015 are driven by transboundary pollution. However, such an enhancement over eastern China is not observed for organic matter, partly due to the simplified SOA formation scheme that is not able to fully represent the chemical formation of SOA, which is a common issue in chemical transport models (Pennington et al., 2021; Shrivastava et al., 2017). Leibensperger et al. (2011) and Koplitz et al. (2017) found similar nitrate enhancement, yet to a much lesser extent (<0.2 µg m−3). They attributed the nitrate enhancement to the increase in ozone that speeded up the rate at which Chinese local NOx emissions were converted to nitrate. We discuss the mechanism in more detail in the next section. The sulfate contribution is very small (<0.5 µg m−3). Leibensperger et al. (2011) proposed a reason for why H2O2 (the key oxidant for sulfate formation) is abundant most of the year over eastern China and is thereby insensitive to additional transboundary sources. When H2O2-limited conditions prevail in winter, cloud cover is infrequent, limiting the in-cloud oxidation of SO2. Thus, the influence of transboundary pollution to sulfate over eastern China is weak. The transboundary PM2.5 over southwestern China is primarily contributed by organics (1.8 µg m−3, 37 % of transboundary PM2.5), which is consistent with previous studies that found that massive biomass burning emissions in South Asia contributed considerable organics to southern China (Jiang et al., 2013). Sulfate contributes 27 % of transboundary PM2.5 over southwestern China, where the inflow of hot and humid atmosphere from South Asia facilitates the in-cloud formation of sulfate (Jiang et al., 2013). In addition, anthropogenic fugitive dust emissions from foreign countries have an influence on Chinese PM2.5, accounting for 14 % of the PM2.5 increase in both eastern and southwestern regions, as shown in Fig. S3.
We further investigate the seasonal variation in transboundary pollution in China to understand potential sources of foreign contributions. Figure 4 presents the seasonal enhancement of PM2.5, nitrate, and ammonium over China in 2015 driven by foreign anthropogenic emissions. Transboundary pollution of PM2.5 over eastern China is the largest in January (6.9 µg m−3) and gradually decreases to a minimum in July (2.7 µg m−3). Affected regions also change prominently with seasons. In January, the boundary of transboundary PM2.5 larger than 9 µg m−3 extends to the south of the eastern China domain outlined in Fig. 4, whereas in July, that boundary shrinks to a much smaller region along the east coast. Source attribution (Fig. S4) reveals that all of the seven major anthropogenic emission source sectors in foreign countries contributed similarly (10 %–17 % for each sector) to Chinese PM2.5 in January, yet their relative importance exhibits spatial heterogeneity. Over eastern China, industry and solvent use in foreign countries are the largest sources (likely because of their considerable amount of NMVOCs emissions that increase the atmospheric oxidizing capacity over eastern China, as is discussed in Sect. 6), whereas over Yunnan Province, residential combustion in foreign countries makes the largest contribution.
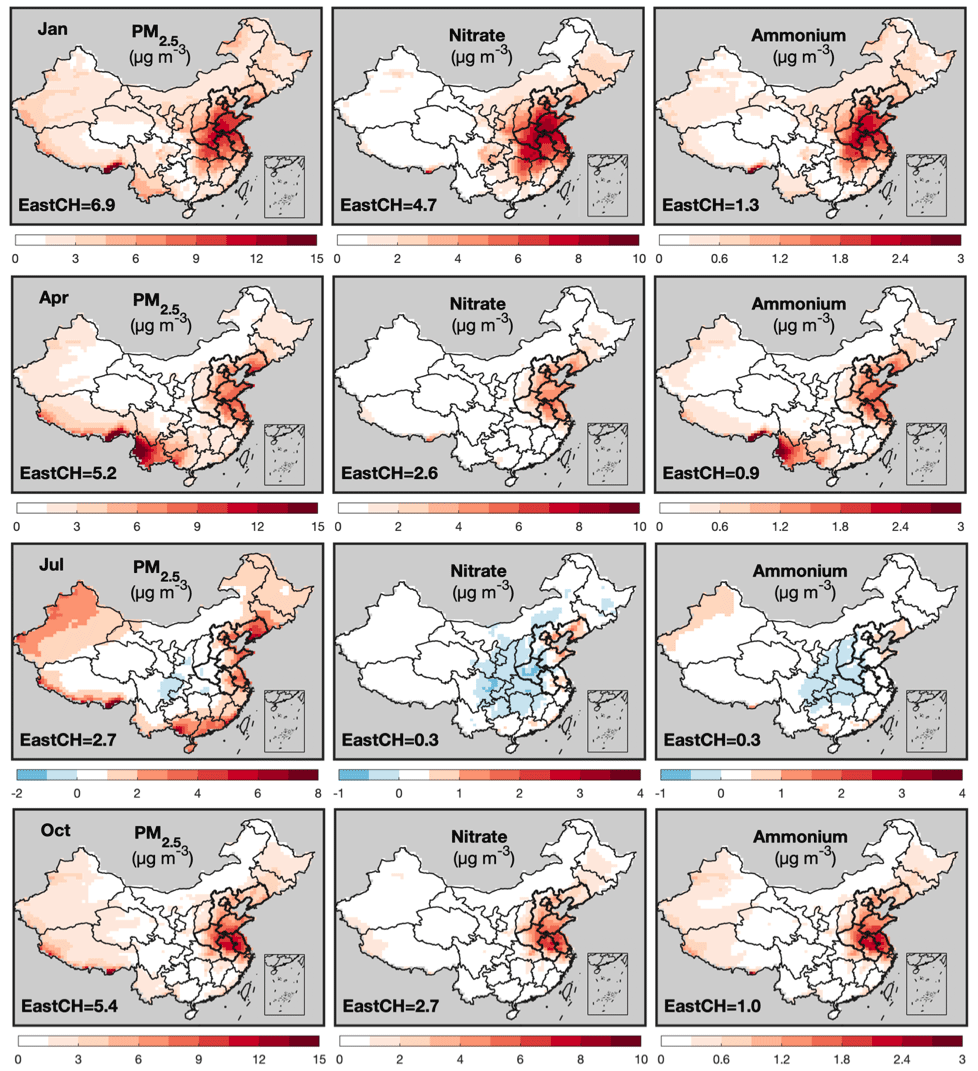
Figure 4Same as Fig. 3, but for January, April, July, and October as denoted by text in the top left corner of each row.
These seasonal characteristics of transboundary PM2.5 are similar to those of nitrate and ammonium. In January, 68 % of transboundary PM2.5 over eastern China is contributed by nitrate (4.7 µg m−3) and 19 % by ammonium (1.3 µg m−3), yet these fractions decrease to 11 % for both nitrate and ammonium in July. The transboundary nitrate for the majority of eastern China exceeds 5 µg m−3 in January yet decreases to less than 1 µg m−3 and is even negative in July. These prominent seasonal variations in transboundary PM2.5, nitrate, and ammonium reflect different processes controlling the transboundary pollution in winter and summer in China.
We investigate the relative importance of direct transport and chemical interactions in driving the considerable transboundary pollution over eastern China in January and July, as shown in Fig. 5. In January, the transboundary PM2.5, nitrate, and ammonium are predominantly (71 %–97 %) driven by chemical interactions, suggesting that the transboundary pollution in winter over eastern China is not through direct transport of nitrate and ammonium but through chemical interactions between directly transported precursors from foreign countries and local emissions in China. In July, however, nearly all transboundary PM2.5 over eastern China is driven by direct transport, with 30 % of the direct transport contributed by anthropogenic fugitive dust from foreign countries (Fig. S3). The transboundary nitrate is still primarily driven by chemical interactions in July (89 %), yet the magnitude is too small to substantially affect total PM2.5.

Figure 5Foreign anthropogenic contributions to PM2.5, nitrate, and ammonium concentrations in January and July over eastern China. Total concentration contributions of foreign anthropogenic emissions are split into contributions from direct transport and chemical interactions according to the legend. The contributions to other PM2.5 components are shown in Fig. S5.

Figure 6Contributions of foreign anthropogenic emissions of NMVOCs (a, b) and NOx (c, d) to atmospheric oxidizing capacity and oxidation products over eastern China as simulated by the GEOS-Chem model for January (a, c) and July (b, d) 2015. Total foreign anthropogenic contributions are split into contributions from direct transport and chemical interactions according to the legend. O3 concentrations are 24 h average concentrations. Nitrogen-related species are presented in micrograms of nitrogen per cubic meter for the convenience of nitrogen budget calculation.
We further explore the changes in key chemical species for nitrate formation to understand the chemical mechanism driving the considerable nitrate enhancement over eastern China. Figure 6 shows the contributions of transboundary pollution to concentrations of precursor gases (NOx), oxidants (O3, N2O5, and NO3), and oxidized products (total inorganic nitrate including gas-phase HNO3 and particulate NO) in nitrate chemistry over eastern China in January and July. Figure 6a shows that, in January, chemical interactions between foreign-emitted NMVOCs and China's local aerosols promote the O3 production over eastern China by 2.6 ppb, leading to a drop in NOx (−1.8 µg N m−3) and an increase in N2O5+ NO3 and HNO3+ NO (0.88 µg N m−3) concentrations over eastern China. The presence of excess ammonia over eastern China due to the reduction in SO2 (Liu et al., 2018, 2019) further partitions nearly all HNO3 gas into particulate nitrate (nitrate ammonium, NH4NO3), leading to a nitrate increase of about 1 µg N m−3 (or 2.6 µg m−3) there. These results reveal that, in January, when the O3 production is in a NMVOCs-limited regime, the additional NMVOCs from transboundary sources promote the O3 production and the subsequent nitrate formation over eastern China, which otherwise would be limited by the lack of O3 (Jin and Holloway, 2015; Li et al., 2018; Wang et al., 2017).
In addition to NMVOCs, NOx is another important precursor of O3. We therefore conducted sensitivity simulations to understand the role that foreign anthropogenic emissions of NOx play in the nitrate enhancement in eastern China. As shown in Fig. 6c for January, the promotion of nitrate formation is very small, with the additional influence of NOx emitted from foreign sources. This is due to the high local emissions of NOx over eastern China in January that suppress the O3 formation under a NOx-saturated regime.
In July, although foreign NMVOCs contribute about 4 ppb O3 to eastern China through the chemistry process, they hardly lead to much difference in nitrate concentrations (Fig. 6b, d). This is because a lack of excess aerosols (compared to winter) limits the transformation of N2O5 and NO3 to HNO3 on the aerosol surface. In addition, the oxidation of NOx by OH is sufficiently fast in summer, and the abundance of OH over eastern China in summer makes the NOx oxidation process insensitive to the added O3 from foreign countries. Therefore, a lack of excess aerosols and the abundance of OH in summer make the transboundary transport of ozone precursors minor in contributions to nitrate concentrations over eastern China.
An effective air quality improvement action requires an accurate understanding of PM2.5 sources. This work complements our understanding of PM2.5 sources in China by investigating the influence of foreign transboundary transport through the GEOS-Chem simulation. Our extensive and comprehensive evaluation of the GEOS-Chem model for PM2.5 total and compositional mass concentrations in China and 10 additional Asian countries showed a reasonable consistency with observations. Based on model simulations, we found that foreign anthropogenic emissions played an important role in Chinese PM2.5 pollution because of direct aerosol transport and, more importantly, chemical interactions between transboundary pollutants and China's local emissions. Over eastern China, the transport of NMVOCs from foreign anthropogenic emissions increased O3 concentrations by 2.6 ppb through chemical interactions with China's local aerosols. The additional O3 combined with high local emissions of NOx and ammonia led to a nitrate enhancement of 2.6 µg m−3 in January. Over southwestern China, transboundary transport contributed 18 % of the PM2.5 to Yunnan Province in 2015, mostly driven by the direct transport of aerosols from anthropogenic emissions in South Asia. There are a few sources of uncertainty in this study, for example the wet deposition of nitrate and the simplified secondary organic aerosol formation scheme, but they do not manifest themselves as systematic biases.
In light of the physical and chemical mechanisms of transboundary pollution in China, further improvements of air quality for the Beautiful China target require different emission reduction strategies for different regions. Over eastern China, reductions in both foreign and domestic anthropogenic emissions can reduce transboundary PM2.5 pollution to China, since a considerable amount of transboundary-transported PM2.5 is formed through the chemical interactions between pollutants from both sources. To reduce the transboundary influence driven by chemical interactions, source sectors with considerable emissions of NMVOCs in foreign countries, such as industry and solvent use, are of particular importance. Over southwestern China, foreign emission reductions will be necessary for improving air quality there since the transboundary pollution was primarily through the direct transport of aerosols from foreign countries. Given the declining trend of Chinese anthropogenic emissions in the present and the future, the likely rising emissions from adjacent countries in the future could become an increasingly important problem for Chinese air quality protection if no action is taken to avoid emissions increases in adjacent countries. Our study points to the need to carefully consider the potential influence of transboundary pollution when making long-term air quality improvement strategies in China. Future studies could further investigate the impact of transboundary pollution transport to China under future emission scenarios or extend this study to other regions in the world where transboundary pollution could potentially increase domestic PM2.5 pollution through nitrate chemistry. Investigation into the bi-directional PM2.5 contributions between countries would also be helpful for developing practical policies for regional cooperation on emission reductions.
Data presented in this paper are available upon request to the corresponding author.
The supplement related to this article is available online at: https://doi.org/10.5194/acp-23-4149-2023-supplement.
JL led the study. JWX and JL designed the study. JWX performed the model simulations and conducted the data analysis. GL updated the wet deposition scheme in the model simulation. JA collected observation data of PM2.5 composition from the literature. HK processed PM2.5 observations from the CNEMC website. JWX wrote the manuscript with input from JL. All authors commented on the manuscript.
The contact author has declared that none of the authors has any competing interests.
Publisher’s note: Copernicus Publications remains neutral with regard to jurisdictional claims in published maps and institutional affiliations.
The authors would like to thank CNEMC staff for providing PM2.5 measurements across China and WHO staff for providing global PM2.5 measurements.
This research has been supported by the National Natural Science Foundation of China (grant no. 42075175), the second Tibetan Plateau Scientific Expedition and Research Program (grant no. 2019QZKK0604), and the China Postdoctoral Science Foundation (grant no. 55 2021M700191).
This paper was edited by Jason West and reviewed by two anonymous referees.
An, Z., Huang, R. J., Zhang, R., Tie, X., Li, G., Cao, J., Zhou, W., Shi, Z., Han, Y., Gu, Z., and Ji, Y.: Severe haze in northern China: A synergy of anthropogenic emissions and atmospheric processes, P. Natl. Acad. Sci. USA, 116, 8657–8666, https://doi.org/10.1073/pnas.1900125116, 2019.
Bai, Z., Winiwarter, W., Klimont, Z., Velthof, G., Misselbrook, T., Zhao, Z., Jin, X., Oenema, O., Hu, C., and Ma, L.: Further Improvement of Air Quality in China Needs Clear Ammonia Mitigation Target, Environ. Sci. Technol., 53, 10542–10544, https://doi.org/10.1021/acs.est.9b04725, 2019.
Bond, T. C., Doherty, S. J., Fahey, D. W., Forster, P. M., Berntsen, T., DeAngelo, B. J., Flanner, M. G., Ghan, S., Kärcher, B., Koch, D., Kinne, S., Kondo, Y., Quinn, P. K., Sarofim, M. C., Schultz, M. G., Schulz, M., Venkataraman, C., Zhang, H., Zhang, S., Bellouin, N., Guttikunda, S. K., Hopke, P. K., Jacobson, M. Z., Kaiser, J. W., Klimont, Z., Lohmann, U., Schwarz, J. P., Shindell, D., Storelvmo, T., Warren, S. G., and Zender, C. S.: Bounding the role of black carbon in the climate system: A scientific assessment, J. Geophys. Res.-Atmos., 118, 5380–5552, https://doi.org/10.1002/jgrd.50171, 2013.
Brauer, M., Freedman, G., Frostad, J., van Donkelaar, A., Martin, R. V, Dentener, F., Dingenen, R. van, Estep, K., Amini, H., Apte, J. S., Balakrishnan, K., Barregard, L., Broday, D., Feigin, V., Ghosh, S., Hopke, P. K., Knibbs, L. D., Kokubo, Y., Liu, Y., Ma, S., Morawska, L., Sangrador, J. L. T., Shaddick, G., Anderson, H. R., Vos, T., Forouzanfar, M. H., Burnett, R. T., and Cohen, A.: Ambient Air Pollution Exposure Estimation for the Global Burden of Disease 2013, Environ. Sci. Technol., 50, 79–88, https://doi.org/10.1021/acs.est.5b03709, 2016.
Breider, T. J., Mickley, L. J., Jacob, D. J., Ge, C., Wang, J., Payer Sulprizio, M., Croft, B., Ridley, D. A., McConnell, J. R., Sharma, S., Husain, L., Dutkiewicz, V. A., Eleftheriadis, K., Skov, H., and Hopke, P. K.: Multidecadal trends in aerosol radiative forcing over the Arctic: Contribution of changes in anthropogenic aerosol to Arctic warming since 1980, J. Geophys. Res.-Atmos., 122, 3573–3594, https://doi.org/10.1002/2016JD025321, 2017.
Chen, Y., Xie, S., Luo, B., and Zhai, C.: Characteristics and origins of carbonaceous aerosol in the Sichuan Basin, China, Atmos. Environ., 94, 215–223, https://doi.org/10.1016/j.atmosenv.2014.05.037, 2014.
Cheng, J., Tong, D., Liu, Y., Yu, S., Yan, L., Zheng, B., Geng, G., He, K., and Zhang, Q.: Comparison of Current and Future PM2.5 Air Quality in China Under CMIP6 and DPEC Emission Scenarios, Geophys. Res. Lett., 48, 1–11, https://doi.org/10.1029/2021GL093197, 2021a.
Cheng, J., Tong, D., Zhang, Q., Liu, Y., Lei, Y., Yan, G., Yan, L., Yu, S., Cui, R. Y., Clarke, L., Geng, G., Zheng, B., Zhang, X., Davis, S. J., and He, K.: Pathways of China's PM2.5 air quality 2015–2060 in the context of carbon neutrality, Natl. Sci. Rev., 0, nwab078, https://doi.org/10.1093/nsr/nwab078, 2021b.
Choi, J., Park, R. J., Lee, H.-M., Lee, S., Jo, D. S., Jeong, J. I., Henze, D. K., Woo, J.-H., Ban, S.-J., Lee, M.-D., Lim, C.-S., Park, M.-K., Shin, H. J., Cho, S., Peterson, D., and Song, C.-K.: Impacts of local vs. trans-boundary emissions from different sectors on PM2.5 exposure in South Korea during the KORUS-AQ campaign, Atmos. Environ., 203, 196–205, https://doi.org/10.1016/j.atmosenv.2019.02.008, 2019.
Cohen, A. J., Brauer, M., Burnett, R., Anderson, H. R., Frostad, J., Estep, K., Balakrishnan, K., Brunekreef, B., Dandona, L., Dandona, R., Feigin, V., Freedman, G., Hubbell, B., Jobling, A., Kan, H., Knibbs, L., Liu, Y., Martin, R., Morawska, L., Pope, C. A., Shin, H., Straif, K., Shaddick, G., Thomas, M., van Dingenen, R., van Donkelaar, A., Vos, T., Murray, C. J. L., and Forouzanfar, M. H.: Estimates and 25-year trends of the global burden of disease attributable to ambient air pollution: an analysis of data from the Global Burden of Diseases Study 2015, Lancet, 389, 1907–1918, https://doi.org/10.1016/S0140-6736(17)30505-6, 2017.
Ding, A., Huang, X., Nie, W., Chi, X., Xu, Z., Zheng, L., Xu, Z., Xie, Y., Qi, X., Shen, Y., Sun, P., Wang, J., Wang, L., Sun, J., Yang, X. Q., Qin, W., Zhang, X., Cheng, W., Liu, W., Pan, L., and Fu, C.: Significant reduction of PM2.5 in eastern China due to regional-scale emission control: Evidence from SORPES in 2011–2018, Atmos. Chem. Phys., 19, 11791–11801, https://doi.org/10.5194/acp-19-11791-2019, 2019.
Duncan Fairlie, T., Jacob, D. J., and Park, R. J.: The impact of transpacific transport of mineral dust in the United States, Atmos. Environ., 41, 1251–1266, https://doi.org/10.1016/j.atmosenv.2006.09.048, 2007.
Fisher, J. A., Jacob, D. J., Wang, Q., Bahreini, R., Carouge, C. C., Cubison, M. J., Dibb, J. E., Diehl, T., Jimenez, J. L., Leibensperger, E. M., Lu, Z., Meinders, M. B. J., Pye, H. O. T., Quinn, P. K., Sharma, S., Streets, D. G., van Donkelaar, A., and Yantosca, R. M.: Sources, distribution, and acidity of sulfate-ammonium aerosol in the Arctic in winter-spring, Atmos. Environ., 45, 7301–7318, https://doi.org/10.1016/j.atmosenv.2011.08.030, 2011.
Fountoukis, C. and Nenes, A.: ISORROPIA II: a computationally efficient thermodynamic equilibrium model for K+–Ca2+–Mg2+–NH–Na+–SO–NO–Cl−–H2O aerosols, Atmos. Chem. Phys., 7, 4639–4659, https://doi.org/10.5194/acp-7-4639-2007, 2007.
Gao, M., Han, Z., Liu, Z., Li, M., Xin, J., Tao, Z., Li, J., Kang, J.-E., Huang, K., Dong, X., Zhuang, B., Li, S., Ge, B., Wu, Q., Cheng, Y., Wang, Y., Lee, H.-J., Kim, C.-H., Fu, J. S., Wang, T., Chin, M., Woo, J.-H., Zhang, Q., Wang, Z., and Carmichael, G. R.: Air quality and climate change, Topic 3 of the Model Inter-Comparison Study for Asia Phase III (MICS-Asia III) – Part 1: Overview and model evaluation, Atmos. Chem. Phys., 18, 4859–4884, https://doi.org/10.5194/acp-18-4859-2018, 2018.
Geng, G., Zheng, Y., Zhang, Q., Xue, T., Zhao, H., Tong, D., Zheng, B., Li, M., Liu, F., Hong, C., He, K., and Davis, S. J.: Drivers of PM2.5 air pollution deaths in China 2002–2017, Nat. Geosci., 14, 645–650, https://doi.org/10.1038/s41561-021-00792-3, 2021.
Gu, B., Zhang, L., Van Dingenen, R., Vieno, M., Van Grinsven, H. J. M., Zhang, X., Zhang, S., Chen, Y., Wang, S., Ren, C., Rao, S., Holland, M., Winiwarter, W., Chen, D., Xu, J., and Sutton, M. A.: Abating ammonia is more cost-effective than nitrogen oxides for mitigating PM2.5 air pollution, Science, 374, 758–762, https://doi.org/10.1126/science.abf8623, 2021.
Heald, C. L., J. L. Collett Jr., Lee, T., Benedict, K. B., Schwandner, F. M., Li, Y., Clarisse, L., Hurtmans, D. R., Van Damme, M., Clerbaux, C., Coheur, P.-F., Philip, S., Martin, R. V., and Pye, H. O. T.: Atmospheric ammonia and particulate inorganic nitrogen over the United States, Atmos. Chem. Phys., 12, 10295–10312, https://doi.org/10.5194/acp-12-10295-2012, 2012.
Huang, X., Ding, A., Gao, J., Zheng, B., Zhou, D., Qi, X., Tang, R., Wang, J., Ren, C., Nie, W., Chi, X., Xu, Z., Chen, L., Li, Y., Che, F., Pang, N., Wang, H., Tong, D., Qin, W., Cheng, W., Liu, W., Fu, Q., Liu, B., Chai, F., Davis, S. J., Zhang, Q., and He, K.: Enhanced secondary pollution offset reduction of primary emissions during COVID-19 lockdown in China, Natl. Sci. Rev., 8, nwaa137, https://doi.org/10.1093/nsr/nwaa137, 2021.
IEA: World Energy Outlook, International Energy Agency, IEA/OECD, France, https://www.iea.org/reports/world-energy-outlook-2021 (last access: 4 Apr 2023), 2021.
Jaeglé, L., Quinn, P. K., Bates, T. S., Alexander, B., and Lin, J.-T.: Global distribution of sea salt aerosols: new constraints from in situ and remote sensing observations, Atmos. Chem. Phys., 11, 3137–3157, https://doi.org/10.5194/acp-11-3137-2011, 2011.
Jaeglé, L., Shah, V., Thornton, J. A., Lopez-Hilfiker, F. D., Lee, B. H., McDuffie, E. E., Fibiger, D., Brown, S. S., Veres, P., Sparks, T. L., Ebben, C. J., Wooldridge, P. J., Kenagy, H. S., Cohen, R. C., Weinheimer, A. J., Campos, T. L., Montzka, D. D., Digangi, J. P., Wolfe, G. M., Hanisco, T., Schroder, J. C., Campuzano-Jost, P., Day, D. A., Jimenez, J. L., Sullivan, A. P., Guo, H., and Weber, R. J.: Nitrogen Oxides Emissions, Chemistry, Deposition, and Export Over the Northeast United States During the WINTER Aircraft Campaign, J. Geophys. Res.-Atmos., 123, 12368–12393, https://doi.org/10.1029/2018JD029133, 2018.
Jiang, H., Liao, H., Pye, H. O. T., Wu, S., Mickley, L. J., Seinfeld, J. H., and Zhang, X. Y.: Projected effect of 2000–2050 changes in climate and emissions on aerosol levels in China and associated transboundary transport, Atmos. Chem. Phys., 13, 7937–7960, https://doi.org/10.5194/acp-13-7937-2013, 2013.
Jin, X. and Holloway, T.: Spatial and temporal variability of ozone sensitivity over China observed from the Ozone Monitoring Instrument, J. Geophys. Res.-Atmos., 120, 7229–7246, https://doi.org/10.1002/2015JD023250, 2015.
Koplitz, S. N., Jacob, D. J., Sulprizio, M. P., Myllyvirta, L., and Reid, C.: Burden of Disease from Rising Coal-Fired Power Plant Emissions in Southeast Asia, Environ. Sci. Technol., 51, 1467–1476, https://doi.org/10.1021/acs.est.6b03731, 2017.
Kurokawa, J. and Ohara, T.: Long-term historical trends in air pollutant emissions in Asia: Regional Emission inventory in ASia (REAS) version 3, Atmos. Chem. Phys., 20, 12761–12793, https://doi.org/10.5194/acp-20-12761-2020, 2020.
Le, T., Wang, Y., Liu, L., Yang, J., Yung, Y. L., Li, G., and Seinfeld, J. H.: Unexpected air pollution with marked emission reductions during the COVID-19 outbreak in China, Science, 369, 702–706, https://doi.org/10.1126/science.abb7431, 2020.
Leibensperger, E. M., Mickley, L. J., Jacob, D. J., and Barrett, S. R. H.: Intercontinental influence of NOx and CO emissions on particulate matter air quality, Atmos. Environ., 45, 3318–3324, https://doi.org/10.1016/j.atmosenv.2011.02.023, 2011.
Li, H., Cheng, J., Zhang, Q., Zheng, B., Zhang, Y., Zheng, G., and He, K.: Rapid transition in winter aerosol composition in Beijing from 2014 to 2017: response to clean air actions, Atmos. Chem. Phys., 19, 11485–11499, https://doi.org/10.5194/acp-19-11485-2019, 2019.
Li, P., Yan, R., Yu, S., Wang, S., Liu, W., and Bao, H.: Reinstate regional transport of PM2.5 as a major cause of severe haze in Beijing, P. Natl. Acad. Sci. USA, 112, E2739–E2740, https://doi.org/10.1073/pnas.1502596112, 2015.
Li, Q., Zhang, L., Wang, T., Wang, Z., Fu, X., and Zhang, Q.: “New” Reactive Nitrogen Chemistry Reshapes the Relationship of Ozone to Its Precursors, Environ. Sci. Technol., 52, 2810–2818, https://doi.org/10.1021/acs.est.7b05771, 2018.
Liao, T., Wang, S., Ai, J., Gui, K., Duan, B., Zhao, Q., Zhang, X., Jiang, W., and Sun, Y.: Heavy pollution episodes, transport pathways and potential sources of PM2.5 during the winter of 2013 in Chengdu (China), Sci. Total Environ., 584/585, 1056–1065, https://doi.org/10.1016/j.scitotenv.2017.01.160, 2017.
Lin, J.-T. and McElroy, M. B.: Impacts of boundary layer mixing on pollutant vertical profiles in the lower troposphere: Implications to satellite remote sensing, Atmos. Environ., 44, 1726–1739, https://doi.org/10.1016/j.atmosenv.2010.02.009, 2010.
Liu, H., Jacob, D. J., Bey, I., and Yantosca, R. M.: Constraints from 210 Pb and 7 Be on wet deposition and transport in a global three-dimensional chemical tracer model driven by assimilated meteorological fields, J. Geophys. Res.-Atmos., 106, 12109–12128, https://doi.org/10.1029/2000JD900839, 2001.
Liu, M., Huang, X., Song, Y., Xu, T., Wang, S., Wu, Z., Hu, M., Zhang, L., Zhang, Q., Pan, Y., Liu, X., and Zhu, T.: Rapid SO2 emission reductions significantly increase tropospheric ammonia concentrations over the North China Plain, Atmos. Chem. Phys., 18, 17933–17943, https://doi.org/10.5194/acp-18-17933-2018, 2018.
Liu, M., Huang, X., Song, Y., Tang, J., Cao, J., Zhang, X., Zhang, Q., Wang, S., Xu, T., Kang, L., Cai, X., Zhang, H., Yang, F., Wang, H., Yu, J. Z., Lau, A. K. H., He, L., Huang, X., Duan, L., Ding, A., Xue, L., Gao, J., Liu, B., and Zhu, T.: Ammonia emission control in China would mitigate haze pollution and nitrogen deposition, but worsen acid rain, P. Natl. Acad. Sci. USA, 116, 7760–7765, https://doi.org/10.1073/pnas.1814880116, 2019.
Luo, G., Yu, F., and Moch, J. M.: Further improvement of wet process treatments in GEOS-Chem v12.6.0: Impact on global distributions of aerosols and aerosol precursors, Geosci. Model Dev., 13, 2879–2903, https://doi.org/10.5194/gmd-13-2879-2020, 2020.
McDuffie, E. E., Smith, S. J., O'Rourke, P., Tibrewal, K., Venkataraman, C., Marais, E. A., Zheng, B., Crippa, M., Brauer, M., and Martin, R. V.: A global anthropogenic emission inventory of atmospheric pollutants from sector- And fuel-specific sources (1970–2017): An application of the Community Emissions Data System (CEDS), Earth Syst. Sci. Data, 12, 3413–3442, https://doi.org/10.5194/essd-12-3413-2020, 2020.
Meng, W., Zhong, Q., Chen, Y., Shen, H., Yun, X., Smith, K. R., Li, B., Liu, J., Wang, X., Ma, J., Cheng, H., Zeng, E. Y., Guan, D., Russell, A. G., and Tao, S.: Energy and air pollution benefits of household fuel policies in northern China, P. Natl. Acad. Sci. USA, 116, 16773–16780, https://doi.org/10.1073/pnas.1904182116, 2019.
Miao, R., Chen, Q., Zheng, Y., Cheng, X., Sun, Y., Palmer, P. I., Shrivastava, M., Guo, J., Zhang, Q., Liu, Y., Tan, Z., Ma, X., Chen, S., Zeng, L., Lu, K., and Zhang, Y.: Model bias in simulating major chemical components of PM2.5 in China, Atmos. Chem. Phys., 20, 12265–12284, https://doi.org/10.5194/acp-20-12265-2020, 2020.
Murray, L. T., Jacob, D. J., Logan, J. A., Hudman, R. C., and Koshak, W. J.: Optimized regional and interannual variability of lightning in a global chemical transport model constrained by LIS/OTD satellite data, J. Geophys. Res.-Atmos., 117, D20307, https://doi.org/10.1029/2012JD017934, 2012.
Park, M. E., Song, C. H., Park, R. S., Lee, J., Kim, J., Lee, S., Woo, J.-H., Carmichael, G. R., Eck, T. F., Holben, B. N., Lee, S.-S., Song, C. K., and Hong, Y. D.: New approach to monitor transboundary particulate pollution over Northeast Asia, Atmos. Chem. Phys., 14, 659–674, https://doi.org/10.5194/acp-14-659-2014, 2014.
Park, R. J., Jacob, D. J., Field, B. D., Yantosca, R. M., and Chin, M.: Natural and transboundary pollution influences on sulfate-nitrate-ammonium aerosols in the United States: Implications for policy, J. Geophys. Res., 109, D15204, https://doi.org/10.1029/2003JD004473, 2004.
Peng, W., Wagner, F., Ramana, M. V., Zhai, H., Small, M. J., Dalin, C., Zhang, X., and Mauzerall, D. L.: Managing China's coal power plants to address multiple environmental objectives, Nat. Sustain., 1, 693–701, https://doi.org/10.1038/s41893-018-0174-1, 2018.
Pennington, E. A., Seltzer, K. M., Murphy, B. N., Qin, M., Seinfeld, J. H., and Pye, H. O. T.: Modeling secondary organic aerosol formation from volatile chemical products, Atmos. Chem. Phys., 21, 18247–18261, https://doi.org/10.5194/acp-21-18247-2021, 2021.
Philip, S., Martin, R. V., Pierce, J. R., Jimenez, J. L., Zhang, Q., Canagaratna, M. R., Spracklen, D. V., Nowlan, C. R., Lamsal, L. N., Cooper, M. J., and Krotkov, N. A.: Spatially and seasonally resolved estimate of the ratio of organic mass to organic carbon, Atmos. Environ., 87, 34–40, https://doi.org/10.1016/j.atmosenv.2013.11.065, 2014.
Philip, S., Martin, R. V, Snider, G., Weagle, C. L., van Donkelaar, A., Brauer, M., Henze, D. K., Klimont, Z., Venkataraman, C., Guttikunda, S. K., and Zhang, Q.: Anthropogenic fugitive, combustion and industrial dust is a significant, underrepresented fine particulate matter source in global atmospheric models, Environ. Res. Lett., 12, 044018, https://doi.org/10.1088/1748-9326/aa65a4, 2017.
Pye, H. O. T., Liao, H., Wu, S., Mickley, L. J., Jacob, D. J., Henze, D. K., and Seinfeld, J. H.: Effect of changes in climate and emissions on future sulfate-nitrate-ammonium aerosol levels in the United States, J. Geophys. Res.-Atmos., 114, D01205, https://doi.org/10.1029/2008JD010701, 2009.
Randerson, J. T., Van Der Werf, G. R., Giglio, L., Collatz, G. J., and Kasibhatla, P. S.: Global Fire Emissions Database, Version 4, (GFEDv4), ORNL Distributed Active Archive Center [data set], https://doi.org/10.3334/ornldaac/1293, 2015.
Ren, C., Huang, X., Wang, Z., Sun, P., Chi, X., Ma, Y., Zhou, D., Huang, J., Xie, Y., Gao, J., and Ding, A.: Nonlinear response of nitrate to NOx reduction in China during the COVID-19 pandemic, Atmos. Environ., 264, 118715, https://doi.org/10.1016/j.atmosenv.2021.118715, 2021.
Shrivastava, M., Cappa, C. D., Fan, J., Goldstein, A. H., Guenther, A. B., Jimenez, J. L., Kuang, C., Laskin, A., Martin, S. T., Ng, N. L., Petaja, T., Pierce, J. R., Rasch, P. J., Roldin, P., Seinfeld, J. H., Shilling, J., Smith, J. N., Thornton, J. A., Volkamer, R., Wang, J., Worsnop, D. R., Zaveri, R. A., Zelenyuk, A., and Zhang, Q.: Recent advances in understanding secondary organic aerosol: Implications for global climate forcing, Rev. Geophys., 55, 509–559, https://doi.org/10.1002/2016RG000540, 2017.
Snider, G., Weagle, C. L., Murdymootoo, K. K., Ring, A., Ritchie, Y., Stone, E., Walsh, A., Akoshile, C., Anh, N. X., Balasubramanian, R., Brook, J., Qonitan, F. D., Dong, J., Griffith, D., He, K., Holben, B. N., Kahn, R., Lagrosas, N., Lestari, P., Ma, Z., Misra, A., Norford, L. K., Quel, E. J., Salam, A., Schichtel, B., Segev, L., Tripathi, S., Wang, C., Yu, C., Zhang, Q., Zhang, Y., Brauer, M., Cohen, A., Gibson, M. D., Liu, Y., Martins, J. V., Rudich, Y., and Martin, R. V.: Variation in global chemical composition of PM2.5: emerging results from SPARTAN, Atmos. Chem. Phys., 16, 9629–9653, https://doi.org/10.5194/acp-16-9629-2016, 2016.
Stettler, M. E. J., Eastham, S., and Barrett, S. R. H.: Air quality and public health impacts of UK airports, Part I: Emissions, Atmos. Environ., 45, 5415–5424, https://doi.org/10.1016/j.atmosenv.2011.07.012, 2011.
Tang, R., Zhao, J., Liu, Y., Huang, X., Zhang, Y., Zhou, D., Ding, A., Nielsen, C. P., and Wang, H.: Air quality and health co-benefits of China's carbon dioxide emissions peaking before 2030, Nat. Commun., 13, 1008, https://doi.org/10.1038/s41467-022-28672-3, 2022.
Tao, J., Zhang, L., Cao, J., and Zhang, R.: A review of current knowledge concerning PM2.5 chemical composition, aerosol optical properties and their relationships across China, Atmos. Chem. Phys., 17, 9485–9518, https://doi.org/10.5194/acp-17-9485-2017, 2017.
Tong, D., Zhang, Q., Liu, F., Geng, G., Zheng, Y., Xue, T., Hong, C., Wu, R., Qin, Y., Zhao, H., Yan, L., and He, K.: Current Emissions and Future Mitigation Pathways of Coal-Fired Power Plants in China from 2010 to 2030, Environ. Sci. Technol., 52, 12905–12914, https://doi.org/10.1021/acs.est.8b02919, 2018.
Tong, D., Cheng, J., Liu, Y., Yu, S., Yan, L., Hong, C., Qin, Y., Zhao, H., Zheng, Y., Geng, G., Li, M., Liu, F., Zhang, Y., Zheng, B., Clarke, L., and Zhang, Q.: Dynamic projection of anthropogenic emissions in China: Methodology and 2015–2050 emission pathways under a range of socio-economic, climate policy, and pollution control scenarios, Atmos. Chem. Phys., 20, 5729–5757, https://doi.org/10.5194/acp-20-5729-2020, 2020.
van Donkelaar, A., Hammer, M. S., Bindle, L., Brauer, M., Brook, J. R., Garay, M. J., Hsu, N. C., Kalashnikova, O. V, Kahn, R. A., Lee, C., Levy, R. C., Lyapustin, A., Sayer, A. M., and Martin, R. V.: Monthly Global Estimates of Fine Particulate Matter and Their Uncertainty, Environ. Sci. Technol., 55, 15287–15300, https://doi.org/10.1021/acs.est.1c05309, 2021.
Venkataraman, C., Brauer, M., Tibrewal, K., Sadavarte, P., Ma, Q., Cohen, A., Chaliyakunnel, S., Frostad, J., Klimont, Z., Martin, R. V., Millet, D. B., Philip, S., Walker, K., and Wang, S.: Source influence on emission pathways and ambient PM2.5 pollution over India (2015–2050), Atmos. Chem. Phys., 18, 8017–8039, https://doi.org/10.5194/acp-18-8017-2018, 2018.
Wang, H., Tian, M., Chen, Y., Shi, G., Liu, Y., Yang, F., Zhang, L., Deng, L., Yu, J., Peng, C., and Cao, X.: Seasonal characteristics, formation mechanisms and source origins of PM2.5 in two megacities in Sichuan Basin, China, Atmos. Chem. Phys., 18, 865–881, https://doi.org/10.5194/acp-18-865-2018, 2018.
Wang, J., Ni, R., Lin, J., Tan, X., Tong, D., Zhao, H., Zhang, Q., Lu, Z., Streets, D., Pan, D., Huang, Y., Guan, D., Feng, K., Yan, Y., Hu, Y., Liu, M., Chen, L., and Liu, P.: Socioeconomic and atmospheric factors affecting aerosol radiative forcing: Production-based versus consumption-based perspective, Atmos. Environ., 200, 197–207, https://doi.org/10.1016/j.atmosenv.2018.12.012, 2019.
Wang, Q., Jacob, D. J., Fisher, J. A., Mao, J., Leibensperger, E. M., Carouge, C. C., Le Sager, P., Kondo, Y., Jimenez, J. L., Cubison, M. J., and Doherty, S. J.: Sources of carbonaceous aerosols and deposited black carbon in the Arctic in winter-spring: implications for radiative forcing, Atmos. Chem. Phys., 11, 12453–12473, https://doi.org/10.5194/acp-11-12453-2011, 2011.
Wang, Q., Jacob, D. J., Spackman, J. R., Perring, A. E., Schwarz, J. P., Moteki, N., Marais, E. A., Ge, C., Wang, J., and Barrett, S. R. H.: Global budget and radiative forcing of black carbon aerosol: Constraints from pole-to-pole (HIPPO) observations across the Pacific, J. Geophys. Res.-Atmos., 119, 195–206, https://doi.org/10.1002/2013JD020824, 2014.
Wang, S., Li, S., Xing, J., Ding, Y., Hu, S., Liu, S., Qin, Y., Dong, Z., Dong, J., Song, G., and Dong, L.: Current and future prediction of inter-provincial transport of ambient PM2.5 in China, Atmos. Chem. Phys. Discuss. [preprint], https://doi.org/10.5194/acp-2022-368, 2022.
Wang, T., Xue, L., Brimblecombe, P., Lam, Y. F., Li, L., and Zhang, L.: Ozone pollution in China: A review of concentrations, meteorological influences, chemical precursors, and effects, Sci. Total Environ., 575, 1582–1596, https://doi.org/10.1016/j.scitotenv.2016.10.081, 2017.
Wang, Y. X., McElroy, M. B., Jacob, D. J., and Yantosca, R. M.: A nested grid formulation for chemical transport over Asia: Applications to CO, J. Geophys. Res.-Atmos., 109, D22307, https://doi.org/10.1029/2004JD005237, 2004.
Weng, H., Lin, J., Martin, R., Millet, D. B., Jaeglé, L., Ridley, D., Keller, C., Li, C., Du, M., and Meng, J.: Global high-resolution emissions of soil NOx, sea salt aerosols, and biogenic volatile organic compounds, Sci. Data, 7, 148–163, https://doi.org/10.1038/s41597-020-0488-5, 2020.
West, J. J., Cohen, A., Dentener, F., Brunekreef, B., Zhu, T., Armstrong, B., Bell, M. L., Brauer, M., Carmichael, G., Costa, D. L., Dockery, D. W., Kleeman, M., Krzyzanowski, M., Künzli, N., Liousse, C., Lung, S.-C. C., Martin, R. V, Pöschl, U., Pope, C. A., Roberts, J. M., Russell, A. G., and Wiedinmyer, C.: What We Breathe Impacts Our Health: Improving Understanding of the Link between Air Pollution and Health, Environ. Sci. Technol., 50, 4895–4904, https://doi.org/10.1021/acs.est.5b03827, 2016.
WHO: WHO Global Air Quality Guidelines: Particulate Matter (PM2.5 and PM10), Ozone, Nitrogen Dioxide, Sulfur Dioxide and Carbon Monoxide, World Health Organization (WHO), Geneva, Switzerland, 2021.
Wu, S., Mickley, L. J., Jacob, D. J., Logan, J. A., Yantosca, R. M., and Rind, D.: Why are there large differences between models in global budgets of tropospheric ozone?, J. Geophys. Res.-Atmos., 112, D05302, https://doi.org/10.1029/2006JD007801, 2007.
Xing, J., Lu, X., Wang, S., Wang, T., Ding, D., Yu, S., Shindell, D., Ou, Y., Morawska, L., Li, S., Ren, L., Zhang, Y., Loughlin, D., Zheng, H., Zhao, B., Liu, S., Smith, K. R., and Hao, J.: The quest for improved air quality may push China to continue its CO2 reduction beyond the Paris Commitment, P. Natl. Acad. Sci. USA, 117, 29535–29542, https://doi.org/10.1073/pnas.2013297117, 2020.
Yan, Y., Zhou, Y., Kong, S., Lin, J., Wu, J., Zheng, H., Zhang, Z., Song, A., Bai, Y., Ling, Z., Liu, D., and Zhao, T.: Effectiveness of emission control in reducing PM2.5 pollution in central China during winter haze episodes under various potential synoptic controls, Atmos. Chem. Phys., 21, 3143–3162, https://doi.org/10.5194/acp-21-3143-2021, 2021a.
Yan, Y., Zheng, H., Kong, S., Lin, J., Yao, L., Wu, F., Cheng, Y., Niu, Z., Zheng, S., Zeng, X., Yan, Q., Wu, J., Zheng, M., Liu, M., Ni, R., Chen, L., Chen, N., Xu, K., Liu, D., Zhao, D., Zhao, T., and Qi, S.: On the local anthropogenic source diversities and transboundary transport for urban agglomeration ozone mitigation, Atmos. Environ., 245, 118005, https://doi.org/10.1016/j.atmosenv.2020.118005, 2021b.
Yue, H., He, C., Huang, Q., Yin, D., and Bryan, B. A.: Stronger policy required to substantially reduce deaths from PM2.5 pollution in China, Nat. Commun., 11, 1462, https://doi.org/10.1038/s41467-020-15319-4, 2020.
Zang, H., Zhao, Y., Huo, J., Zhao, Q., Fu, Q., Duan, Y., Shao, J., Huang, C., An, J., Xue, L., Li, Z., Li, C., and Xiao, H.: High atmospheric oxidation capacity drives wintertime nitrate pollution in the eastern Yangtze River Delta of China, Atmos. Chem. Phys., 22, 4355–4374, https://doi.org/10.5194/acp-22-4355-2022, 2022.
Zender, C. S., Bian, H., and Newman, D.: Mineral Dust Entrainment and Deposition (DEAD) model: Description and 1990s dust climatology, J. Geophys. Res., 108, 4416, https://doi.org/10.1029/2002JD002775, 2003.
Zhai, S., Jacob, D. J., Brewer, J. F., Li, K., Moch, J. M., Kim, J., Lee, S., Lim, H., Lee, H. C., Kuk, S. K., Park, R. J., Jeong, J. I., Wang, X., Liu, P., Luo, G., Yu, F., Meng, J., Martin, R. V, Travis, K. R., Hair, J. W., Anderson, B. E., Dibb, J. E., Jimenez, J. L., Campuzano-Jost, P., Nault, B. A., Woo, J.-H., Kim, Y., Zhang, Q., and Liao, H.: Relating geostationary satellite measurements of aerosol optical depth (AOD) over East Asia to fine particulate matter (PM2.5): insights from the KORUS-AQ aircraft campaign and GEOS-Chem model simulations, Atmos. Chem. Phys., 21, 16775–16791, https://doi.org/10.5194/acp-21-16775-2021, 2021.
Zhang, L., Liu, L., Zhao, Y., Gong, S., Zhang, X., Henze, D. K., Capps, S. L., Fu, T.-M., Zhang, Q., and Wang, Y.: Source attribution of particulate matter pollution over North China with the adjoint method, Environ. Res. Lett., 10, 84011, https://doi.org/10.1088/1748-9326/10/8/084011, 2015.
Zhang, Q., Jiang, X., Tong, D., Davis, S. J., Zhao, H., Geng, G., Feng, T., Zheng, B., Lu, Z., Streets, D. G., Ni, R., Brauer, M., Van Donkelaar, A., Martin, R. V., Huo, H., Liu, Z., Pan, D., Kan, H., Yan, Y., Lin, J., He, K., and Guan, D.: Transboundary health impacts of transported global air pollution and international trade, Nature, 543, 705–709, https://doi.org/10.1038/nature21712, 2017.
Zhang, Q., Zheng, Y., Tong, D., Shao, M., Wang, S., Zhang, Y., Xu, X., Wang, J., He, H., Liu, W., Ding, Y., Lei, Y., Li, J., Wang, Z., Zhang, X., Wang, Y., Cheng, J., Liu, Y., Shi, Q., Yan, L., Geng, G., Hong, C., Li, M., Liu, F., Zheng, B., Cao, J., Ding, A., Gao, J., Fu, Q., Huo, J., Liu, B., Liu, Z., Yang, F., He, K., and Hao, J.: Drivers of improved PM2.5 air quality in China from 2013 to 2017, P. Natl. Acad. Sci. USA, 116, 24463–24469, https://doi.org/10.1073/pnas.1907956116, 2019.
Zhang, Y.-L. and Cao, F.: Fine particulate matter (PM2.5) in China at a city level, Sci. Rep., 5, 14884, https://doi.org/10.1038/srep14884, 2015.
Zheng, B., Tong, D., Li, M., Liu, F., Hong, C., Geng, G., Li, H., Li, X., Peng, L., Qi, J., Yan, L., Zhang, Y., Zhao, H., Zheng, Y., He, K., and Zhang, Q.: Trends in China's anthropogenic emissions since 2010 as the consequence of clean air actions, Atmos. Chem. Phys., 18, 14095–14111, https://doi.org/10.5194/acp-18-14095-2018, 2018.
- Abstract
- Introduction
- GEOS-Chem simulations
- Ground-level observations of PM2.5 and composition in China and other Asian countries
- PM2.5 and composition concentrations across China and other Asian countries
- Contributions of foreign anthropogenic emissions to total and compositional PM2.5 in China
- Physical and chemical mechanisms of foreign anthropogenic contributions to PM2.5 over eastern China
- Conclusions
- Data availability
- Author contributions
- Competing interests
- Disclaimer
- Acknowledgements
- Financial support
- Review statement
- References
- Supplement