the Creative Commons Attribution 4.0 License.
the Creative Commons Attribution 4.0 License.
 | 05 Apr 2023
Numerical modelling of relative contribution of planetary waves to the atmospheric circulation
Andrey V. Koval
Olga N. Toptunova
Maxim A. Motsakov
Ksenia A. Didenko
Tatiana S. Ermakova
Nikolai M. Gavrilov
Eugene V. Rozanov
Using the general circulation model of the middle and upper atmosphere (MUAM), a number of numerical scenarios were implemented to study the impact of individual planetary waves (PWs) on the global atmospheric circulation, including zonal wind, temperature, and residual meridional circulation (RMC). The calculations were performed for the winter conditions of the Northern Hemisphere (January–February). We show the contribution to the formation of the dynamic and temperature regimes of the MUAM made by equatorial Kelvin waves propagating to the east, as well as atmospheric normal modes (NMs) with periods from 4 to 16 d. In particular, it is demonstrated that the impact of a 5 d PW and an ultra-fast Kelvin wave (UFKW) can change the speed of circulation flows by up to 6 % in the areas of their amplitude maxima. At the same time, this effect can be significantly enhanced in certain periods of time. The presented research results are important for a deeper understanding of the mechanisms of large-scale atmospheric interactions. Despite the obviousness and simplicity of the problem, such work has not been carried out yet.
- Article
(6118 KB) - Full-text XML
-
Supplement
(2741 KB) - BibTeX
- EndNote


Planetary waves (PWs, known as Rossby waves) are large-scale variations in the hydrodynamic parameters of the atmosphere (wind, temperature, density), which are formed due to the potential vorticity conservation. The horizontal distribution of PWs is determined by the counteraction of the meridional gradient of the Coriolis force and the meridional displacements of the jet streams. According to the classic theory (e.g. Holton, 1975), a number of waves fit along the circle of latitude, determining the zonal wave number. The amplitudes of PWs increase due to a decrease in the density of the atmosphere when they propagate from their sources in the troposphere. In the middle and upper atmosphere, these disturbances become an important driver of the atmospheric circulation. One of the important features of planetary waves is their active interaction with the mean flow causing transfer of energy and momentum. This feature was reflected in the formulation of the generalised Eliassen Palm theorem (Eliassen and Palm, 1961). Planetary waves can provide a significant acceleration of the background flow in the middle atmosphere when dissipating. This acceleration is comparable to the acceleration associated with gravity waves (GWs) and atmospheric tides (e.g. Pogoreltsev, 1999).
Another important feature of PWs, which explains the need for their comprehensive study, is that they are a link between different atmospheric layers and regions. The PWs can contribute to the signal propagation from the quasi-biennial oscillation (QBO) of the equatorial zonal wind into the thermosphere (Koval et al., 2022a, b) and from the equatorial region to the extratropical region (Holton and Tan, 1980). The ability of PWs to be reflected downward at the heights of the lower thermosphere, due to changes in vertical temperature gradients associated with solar activity cycle, can also have a significant effect on the dynamic and temperature regimes of the middle atmosphere (Koval et al., 2018a).
According to the so-called “downward control principle” (Haynes et al., 1991), PWs are the main driving force of meridional extratropical circulation (see also Holton et al., 1995). Due to its global nature, meridional circulation is considered to be the most important mechanism of dynamic interaction between different layers and regions of the atmosphere, affecting the transport of aerosol, atmospheric gases and, consequently, the composition of the atmosphere. Changes in the meridional circulation can affect the behaviour of the ozone layer. The state of the ozone layer has attracted increased attention due to global ozone depletion (e.g. Newman et al, 2009). Planetary waves are the main factor in the development of sudden stratospheric warming (Schoeberl, 1978; Nath et al., 2016).
Many studies are currently dedicated to PWs, having different periods and zonal wave numbers. For example, numerical simulations of PW influence were discussed in Liu et al. (2004), Chang et al. (2014), Wang et al. (2017), Forbes et al. (2018, 2020), He et al. (2020) and many others. Ground-based radar measurements were presented by Clark et al. (2002), Jiang et al. (2008) and Pancheva et al. (2008), and satellite measurements were presented by Day et al. (2011), Forbes and Zhang (2017), Pancheva et al. (2018), and Merzlyakov et al. (2013). Processing of reanalysis data and weather forecasting systems was presented by Sassi et al. (2012) and Qin et al. (2021) among others.
In this paper, we considered the relative contribution of various PW modes to the formation of the global atmospheric circulation using the unique opportunity that numerical modelling gives us. In order to further understand the nature of large-scale atmospheric dynamics, we carried out a number of numerical experiments to quantify the sensitivity of the zonal wind and temperature fields, as well as meridional circulation components to the switching on/off sources of various PW modes in the model. Despite the obviousness and simplicity of the problem, such work has not been carried out yet. Unfortunately, there is no universal way to study the impact of all Rossby waves; each wave has its own characteristics, depending, in particular, on the season, the impact of large-scale processes such as the quasi-biennial oscillation of the equatorial zonal wind and the El Niño–Southern Oscillation. Therefore, we have chosen only a part of the PW spectrum, the amplitudes of which are maximised during the boreal winter.
2.1 The MUAM
Waves are studied using the middle and upper atmosphere model (MUAM, Pogoreltsev et al., 2007). The MUAM is a three-dimensional nonlinear mechanistic model of the general atmospheric circulation at heights from the surface to the F2 ionospheric layer (up to 300–400 km). This is one of the most promising and modern models of atmospheric wave dynamics, which makes it possible to study the processes in the middle and upper atmosphere, as well as their interaction with lower levels (see, for example, Gavrilov et al., 2018; Ermakova et al., 2019; Koval et al., 2018a, b; 2022a, b; Medvedeva et al., 2019). One of the advantages of the MUAM is that it allows us to not only analyse the amplitudes of planetary waves but also associate them with various generating sources. The log-isobaric height ) is used as the vertical coordinate in the MUAM, where p is the pressure in hPa, ps is the surface pressure, and H is the pressure scale height. The latitudinal and longitudinal spacing of the model's horizontal grid is 5.625∘ × 5∘. A version of the model with 56 vertical levels is used, covering a vertical range from the Earth's surface to about 300 km. The time integration step is 225 s.
The MUAM radiation module takes into account atmospheric net radiative heating due to solar and infrared irradiance. The thermosphere includes parameterisation of heating in the extreme ultraviolet band. Ion drag, molecular and turbulent viscosity and thermal conductivity are included as well. The model provides the possibility of PW excitation near the Earth's surface. The possibility of changing the albedo of the underlying surface is available. Weather changes and cloudiness in the troposphere are not simulated. The MUAM uses three parameterisations of gravity waves with different phase velocities, including orographic waves. For a further description of the processes involved in the current version of the model, please refer to Koval et al. (2022a).
The main parameters simulated by the MUAM include four-dimensional fields of the zonal, meridional and vertical velocity components, geopotential height, and temperature with a time step of 2 h. By the MUAM initialisation, zonal mean climatological distributions of the geopotential height and temperature are set with the lower boundary conditions at the 1000 hPa isobaric level. These distributions were obtained using the reanalysis MERRA-2 data (Gelaro et al., 2017) and averaged over 20 years (from 2000 to 2019) for January–February.
Since the MUAM does not reproduce tropospheric weather, the sources of the westward-propagating PWs (atmospheric normal modes, NMs) and the eastward PWs (Kelvin waves) in the MUAM are specified using additional terms in the heat balance equation, having the form of time-dependent sinusoidal harmonics with zonal wave numbers m=1 … 3 and periods matching the simulated PWs. To specify the latitudinal structure of the PW components, the corresponding Hough functions obtained using the method described by Swarztrauber and Kasahara (1985) are used. The PW periods are equal to the resonant response of the atmosphere to the wave action at the lower boundary (Pogoreltsev, 1999). Westward propagating NMs (1.1, 1.2, 1.3, and 2.1, 2.2) in the classification proposed by Longuet-Higgins (1968) are considered. They have periods of about 5, 10 and 16 d with a zonal number of 1, and about 4 and 7 d with a zonal number of 2. In addition, eastward propagating ultra-fast Kelvin waves (UFKWs, having a period of about 3.5 d, a zonal number of 1) are studied. In addition to the mentioned PWs, the MUAM also includes sources of slow and fast Kelvin waves (m=1) and quasi-two-day waves (m=3). However, their amplitudes and contribution to the global circulation during the boreal winter are weak, so they are beyond the scope of this study.
The spatial resolution of the model is relatively coarse. However, as the previous studies have shown, this resolution is more than enough to resolve global atmospheric oscillations, including tides (e.g. Suvorova and Pogoreltsev, 2011; Shevchuk et al., 2018; Didenko et al., 2022) and planetary waves (e.g. Gavrilov et al., 2018; Koval et al., 2018a, b; 2022a, b and references therein). Very important drivers of the atmospheric circulation are gravity waves (GWs). Naturally, the GWs (of orographic and non-orographic origin) cannot be resolved by the MUAM, so parameterisations are used to involve their dynamic and thermal effects. There are three of them in model. For GWs that have slow phase speeds (5–30 m s−1) a parameterisation by Lindzen (1981) is implemented. For faster waves with phase speeds of 30–125 m s−1, which are particularly important in the thermosphere, a version of the spectral parameterisation proposed by Yiğit and Medvedev (2009) is applied. The parameterisation uses 15 GW spectral components uniformly distributed within the period range from 40 min to 3 h. A third parameterisation implemented into the MUAM is responsible for accounting for the stationary GWs of orographic origin (Gavrilov and Koval, 2013).
2.2 Residual meridional circulation (RMC)
A significant problem when considering meridional flows in the framework of the classical Eulerian approach (i.e. with zonal averaging of meridional and vertical circulation flows) is that, in the equations of dynamics, the wave sources of momentum and heat are compensated by advective flows of momentum and heat (Charney and Drazin, 1961). This feature does not allow one to isolate and analyse the wave action on the mean flow. At the same time, in the continuity equation for long-lived gas components, there is a compensation of wave and mean flows. Thus, the use of the Eulerian mean meridional circulation is inefficient for calculating mass transfer and long-lived gas species and analysing wave–mean flow interaction. A thorough analysis of this topic was made by Butchart (2014). In this study, the Transformed Eulerian Mean (TEM) approach, introduced by Andrews and McIntyre (1976), was used to diagnose the impact of PWs on the mean flow. The TEM approach is based on consideration of the components of the mean residual meridional circulation (RMC), which is a superposition of eddy and advective mean transport. Formulas for calculating the RMC components are presented, for example, by Koval et al. (2022a). The time-averaged RMC represents the net average movement of air masses and, therefore, in contrast to the conventional mean Eulerian circulation, it approximates the average advective movement of atmospheric species.
2.3 Scenarios of model experiments
A series of numerical experiments (model runs) was carried out for January–February to identify the influence of various wave components on the variability of the global circulation and the RMC. The scenarios of the model runs are presented in Table 1: a reference run of the model (no. 1) was carried out to calculate the atmospheric circulation with the inclusion of all sources of the considered PWs, and other runs were performed with the sources of individual waves turned off. Designations of 4DW, 5DW … denote PWs having periods of 4, 5 d and others; UFKW means ultra-fast Kelvin wave. The PW amplitudes were obtained using the longitude–time Fourier expansion into the first four harmonics applied to the geopotential height fields. Next, an approximation was carried out using the least squares method to the given oscillation periods.
Table 1Scenarios of model calculations, including different PWs.

Figure 1 shows the amplitudes of geopotential height variations due to the observing planetary waves for January–February. The wave amplitude according to the results of the initial model simulation with the inclusion of sources of all considered PWs (run no. 1) is presented on the left side. For comparison, the right panels show the amplitudes of these waves for the model simulations with each wave source turned off (see scenarios in Table 1).
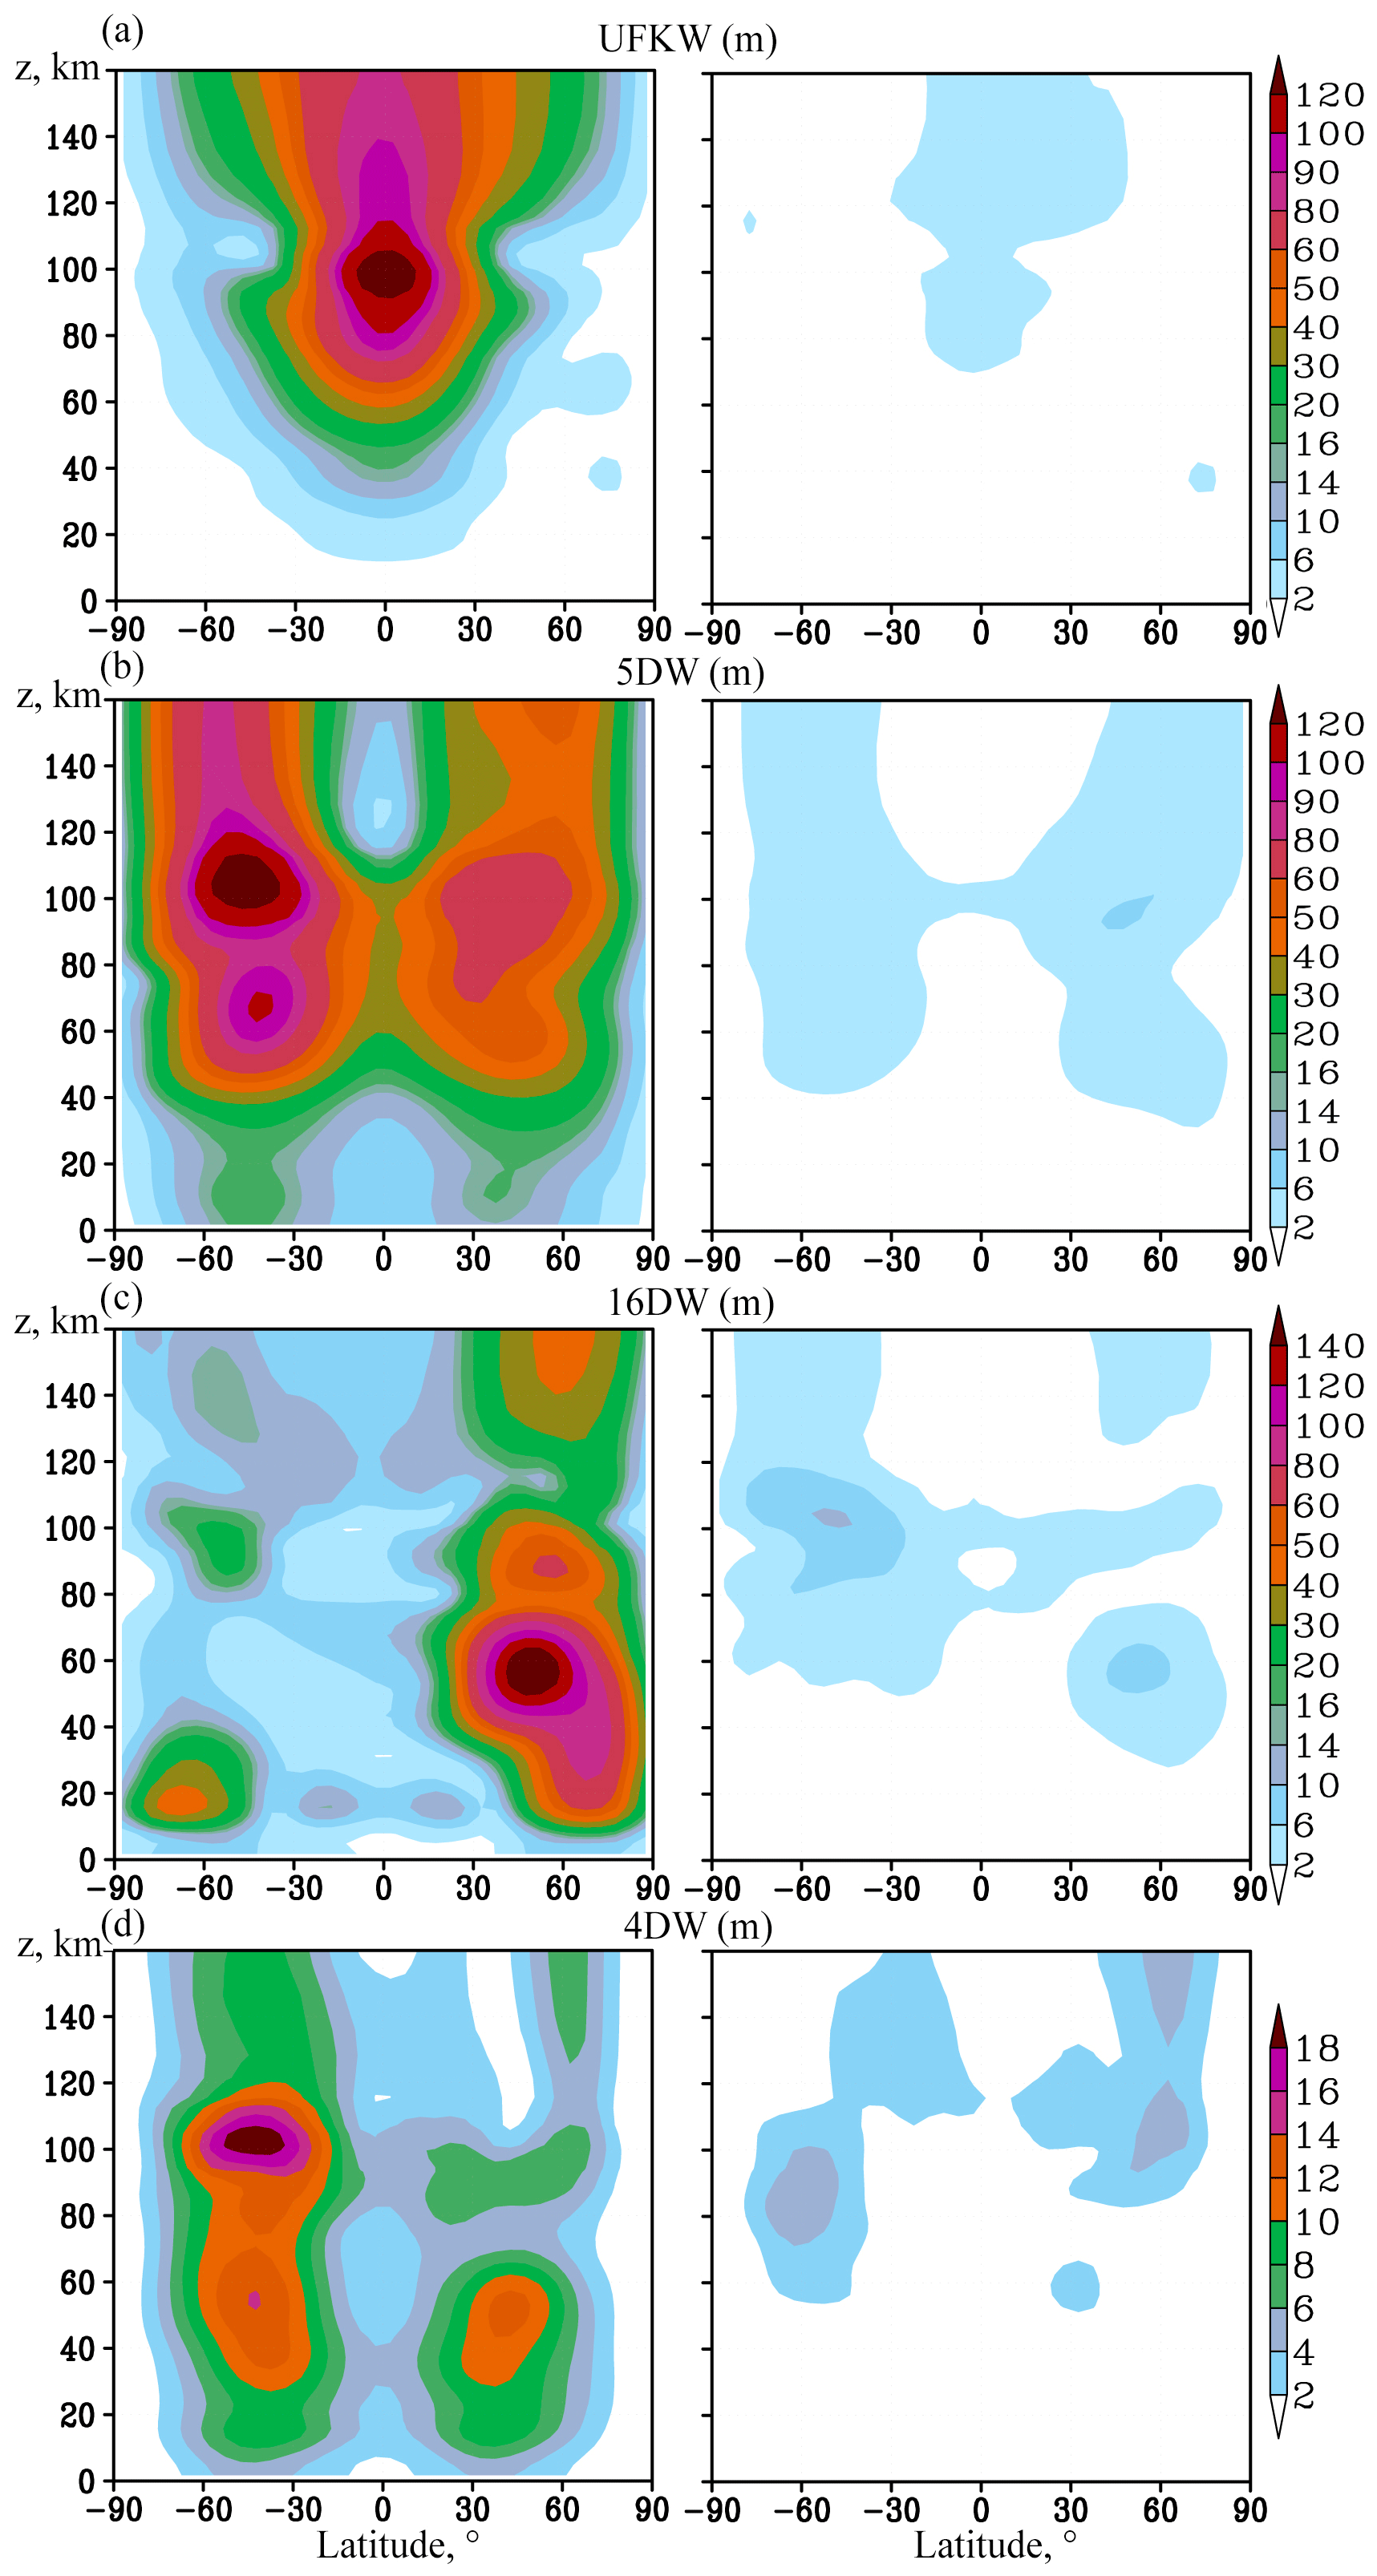
Figure 1Amplitudes of variations of geopotential height (m) with the source of the respective PW in the MUAM being turned on (left panels) and off (right panels) for the following PW modes: (a) ultra-fast Kelvin wave, (b) 5 d PW, (c) 16 d (all with a zonal wave number m=1) and (d) 4 d PW (with m=2). Note that the colour scale is different for different panels.
The amplitude of the eastward propagating UFKW (a period of about 3.5 d) is shown in Fig. 1a. Kelvin waves are localised in the low-latitude region unlike classic atmospheric NMs, the horizontal structure of which is caused primarily by the action of the Coriolis force weakening them near the Equator. The UFKW is mainly excited by the tropospheric source specified in the MUAM. Its generation by internal atmospheric interactions is relatively weak (compare the left and right panels of Fig. 1a). The westward propagating NMs, shown in Fig. 1b–d, have maxima in the middle latitudes of both hemispheres. Waves with larger phase velocities (4 and 5 d NMs) can propagate in both hemispheres (Fig. 1b and d), while slower waves predominantly propagate through the eastward wind structures of the winter hemisphere (in our case the Northern Hemisphere) (Fig. 11c). This is due to propagation barriers of these waves occurring when their phase velocity is less than the westward zonal jet stream in the summer stratosphere and mesosphere (see, for example, Charney and Drazin, 1961). The presence of these barriers is also confirmed by the calculation of the refractive index of the atmosphere for the PWs considered. According to Matsuno (1970), PWs propagate along waveguides: regions of positive refractive index. Our calculations showed that in the Southern Hemisphere, the waveguide for 10 and 16 d waves is interrupted, preventing their direct upward propagation. These waves propagate to the Southern Hemisphere from the Northern Hemisphere, crossing the Equator in the stratosphere, as was shown, for example, in the study by Koval et al. (2018a).
Figure 1 shows the deficiency of waves generated in the middle atmosphere inside the model, and the PW amplitudes with the sources turned off (right panels) do not exceed a numerical noise level. An exception is the maximum amplitude of the 16 d PW in the right panel of Fig. 1c, which is formed at latitude near 60∘ S and altitude of about 100 km. When the tropospheric source is turned off, this maximum of geopotential height reaches 15 m in the right panel of Fig. 1c, whereas it is about 24 m for the turned-on wave source (the left panel of Fig. 1c). This reveals that an interesting effect of the 16 d PW generation by internal atmospheric sources was discovered. The main source of the 16 d wave generation in the southern lower thermosphere of the MUAM may be elucidated by the nonlinear interaction of the 5 and 4 d waves, whose amplitudes have maxima in the same latitude–altitude region in the left panels of Fig. 1b and d. Therefore, further study of this phenomenon is required.
A detailed comparison of the MUAM-simulated PW amplitudes for January–February with satellite and radar observations, also with reanalysis data was carried out. For example, the amplitudes of PWs in the geopotential field calculated according to NCEP/NCAR reanalysis data at 10 and 30 hPa pressure levels were presented in the study by Pancheva et al. (2008). The values of these amplitudes agree with our results. The calculated PW amplitudes in geopotential height according to the MERRA-2 reanalysis data and averaged over the years used for the initialisation of the MUAM also have similar value and structure to the simulated one's. Additionally, Yamazaki et al. (2021) present the distributions of the 4 d PW amplitudes according to measurements of geopotential height using the microwave limb sounder on the Aura satellite, the structure of which corresponds to our calculations. Whereas, the presented values of the PW amplitudes may differ significantly, which is primarily due to the fact that the data for individual specific days are presented in the specified article. The data from the global numerical weather forecasting system (NOGAPS-ALPHA) are used by Sassi et al. (2012) to calculate structures of geopotential height variations by atmospheric NMs. These structures are similar to our distributions. In addition, the 5 d wave amplification in the southern mesosphere, similar to the one demonstrated in the left panel of Fig. 1a, is shown. For a more detailed analysis of the simulated PWs, in order to compare with the published data, the amplitudes of temperature variations by PWs were also calculated. The simulated 5 d PW and UFKW in temperature fields were compared, in particular, with the wave amplitudes calculated from TIMED/SABER temperature data (Pancheva et al., 2010). The amplitude value accordance (up to 6 K at the magnetic local time (MLT) height for January for the 5 d PW at the mid-latitudes of both hemispheres; for the UFKW – at the Equator) and the spatial distribution accordance of PWs across latitudes were found. Moreover, the simulated PW amplitudes correlate in magnitude and spatial distribution with the respective waves obtained in a number of studies (Pancheva et al., 2008, 2009; Forbes et al., 2017; Pedatella and Forbes, 2009; Huang et al., 2017).
The residual meridional circulation (RMC) was calculated to analyse the changes in atmospheric circulation caused by various PWs for each MUAM simulation scenario presented in Table 1, with all PW sources turned on for comparisons with model runs at turned-off sources of particular wave modes. The RMC structure should be sensitive to the PW impact as it is a combination of advective and wave-induced eddy components. The latter is primarily driven to PWs according to the “downward control” principle (Haynes et al., 1991). Figure 2 shows the RMC components and temperature averaged over January–February for model run no. 1 (see Table 1) (all PW sources included) and differences in these fields due to turning off each analysed PW mode. Respective mean zonal wind increments are shown in Fig. 3. Simulated mean zonal wind (Fig. 3a) and temperature (Fig. 2a) correlate with those obtained with the empirical models HWM-14 (Drob et al., 2015) and NRLMSIS 2.0 (Emmert et al., 2020), also with a semiempirical wind model by Jacobi et al. (2009) and with the MERRA-2 reanalysis data.
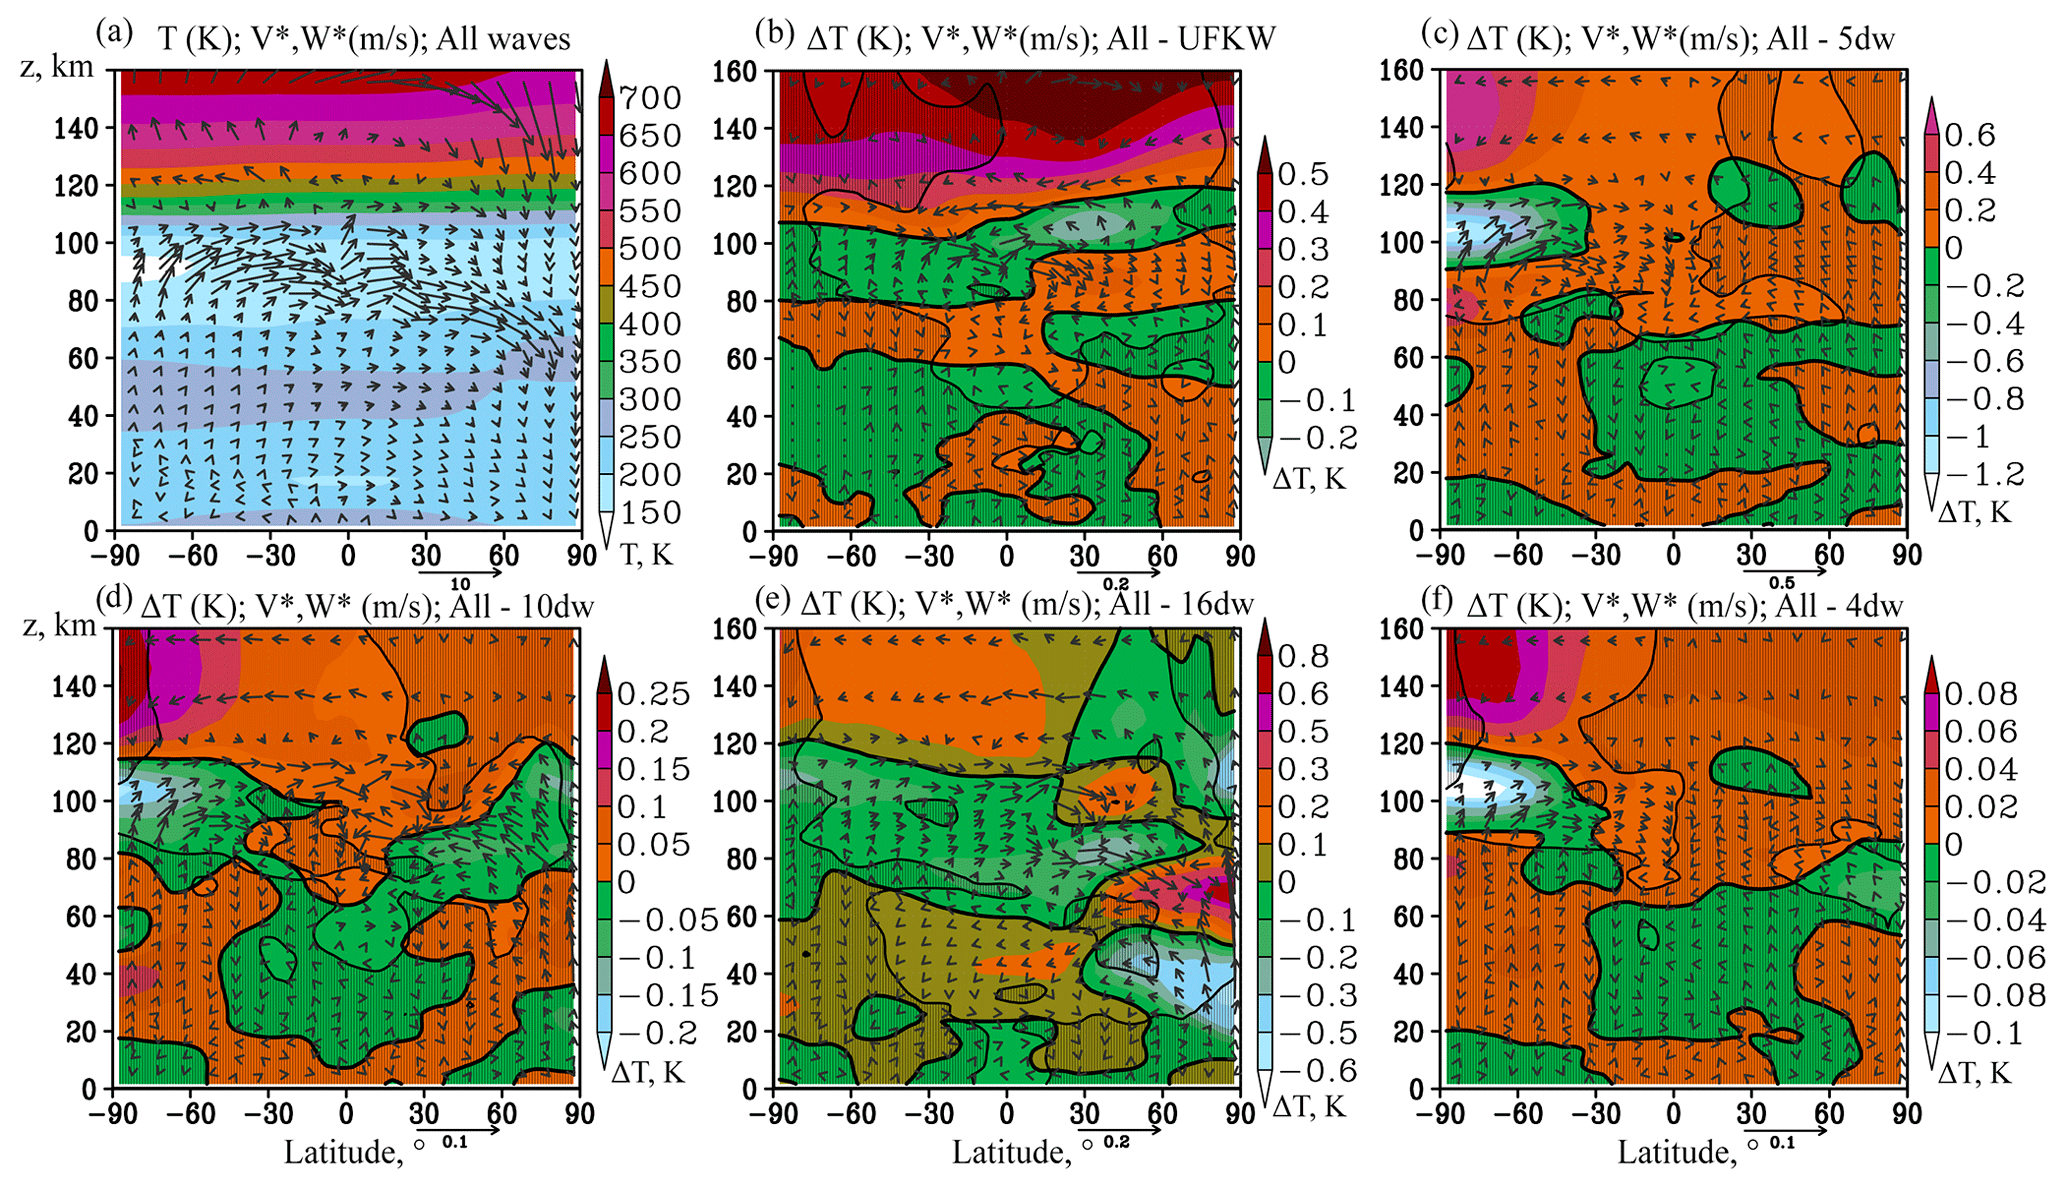
Figure 2(a) RMC components (arrows, m s−1, vertical component multiplied by 200) and mean zonal temperature components (colours, K) for January–February with all PW sources turned on; (b–f) increments in RMC and temperature due to switching off sources of PWs: UFKW, 5, 10, 16 and 4 d waves, respectively. Shaded areas show insignificant temperature and/or RMC increments at 95 %.

Figure 3(a) Zonal wind components (colours, (m s−1) for January–February with all PW sources turned on; (b–f) increments in zonal wind due to switching off sources of PWs: UFKW, 5, 10, 16 and 4 d waves. Shaded areas show insignificant wind increments at 95 %.
Figures 2 and 3 show influence of turning off each individual PW to the mean zonal temperature and zonal wind. The main impacts are usually localised in the regions of maximum PW amplitudes. The greatest contribution to the circulation change is made by the 5 d PW. The main differences in Fig. 2c occur in the southern lower thermosphere, which correspond to a RMC strengthening in a layer between 80 and 120 km after switching on the 5 d PW tropospheric source. The acceleration of zonal wind (eastward above 100 km, and westward below) is observed in the same region in Fig. 3c. This effect is primarily explained by the convergence of the Eliassen–Palm flux (EP) in this region. The acceleration of the RMC there leads to the lifting up of a warmer air and warming of the atmospheric layer between 60 and 90 km, as well as to the acceleration of air transport from the coldest region of the atmosphere (about 90 km, at latitudes from the South Pole to 60∘ N), which leads to the cooling of the atmosphere above this layer. In addition, in the circumpolar southern stratosphere, at a level of about 60 km, there is deceleration of the zonal wind, which, on the contrary, is associated with the EP flux divergence. The described changes in RMC and zonal wind between 60 and 120 km can reach values up to 6 %, forming a significant contribution to the atmospheric circulation from only one wave. Relative changes in RMC components and zonal wind are presented in Figs. S1b–S3b in the supplemental information.
The maximum UFKW amplitude is located at 100 km in the equatorial region (see Fig. 1b). Then the wave propagates higher, gradually attenuating. Its contribution to the circulation flow changes is also maximised in this region and exerted mainly in the strengthening of the zonal wind (Fig. 3b) and the RMC (Fig. 2b). Similar to the 5 d PW, the RMC increments can reach up to 5 %–6 % as it is shown in Figs. S1a and S2a. Figure S3a shows that zonal mean wind changes in the equatorial region between 80 and 120 km can exceed 10 % in areas where wind values are greater than 5 m s−1. The UFKW impact in the 100–120 km layer leads to cooling in the Northern Hemisphere caused by a slowdown in meridional transport and additional up-drafts causing adiabatic cooling.
The impact of the 16 d wave on the circulation, as shown above (Figs. 2e and 3e), is comparable in value with the 5 d PW and UFKW; however, it has a different structure. Maximum PW amplitude occurs in the stratosphere of the Northern Hemisphere, and its contribution to atmospheric circulation is observed in this region. Figure 2e shows that the introduction of the 16 d wave leads to cooling of the layer below 50 km and heating of the overlying layer. The temperature changes here are explained by the change in the RMC components: in particular, the acceleration and weakening of the RMC-descending branch contributes to adiabatic heating and cooling, respectively. This is accompanied by acceleration of the zonal wind (Fig. 3e), directed in this region to the east (Fig. 3a). Statistically significant changes in circulation components may reach 6 % in the high-latitude stratosphere as shown in Figs. S1d and S2d. Below, in Figs. 5 and 6, it is shown that action of the 16 d PW may be stronger than the 5 d PW and UFKW at certain points in time.
The 10 and 4 d PWs make a smaller contribution to the dynamic and thermal regime of the atmosphere. Specifically, the structure of the 10 d wave in the middle atmosphere is similar to the structure of the 16 d one: the amplitude maximum is observed in the northern stratosphere, but due to the higher phase velocity, its waveguide in the southern middle atmosphere is wider. Propagating in the Southern Hemisphere, it contributes to the zonal wind acceleration up to heights of 140 km (Fig. 3d) and to the respective temperature changes. A faster 7 d wave, like the 5 d wave, is able to propagate along waveguides in both hemispheres. Generally, the 10 and 7 d PW contributions cause the same effects as the 5 d one described above, although they are much weaker in this region.
The relatively weak increments, examined in Figs. 2 and 3, require an assessment of statistical significance. Such an assessment was carried out using the Student's paired t test applied to 45 312 pairs of samples in each of the latitude–altitude grid nodes (64 longitude points × 708 time points for January–February with a 2 h model output). Statistically insignificant increments at the 95 % significance level are marked with shading. In Fig. 4, shading indicates statistically insignificant data on either temperature or RMC.
For a more detailed analysis of the PW effects on atmospheric circulation, the time series of mean zonal temperature and zonal wind variations due to the considered PW effects were observed – Figs. 4 and 5, respectively. Latitudes and heights corresponding to the maxima of the PW amplitudes were selected: the Equator, 100 km is for the UFKW; the 5 d wave is considered at 50∘ S and 105 km; 7, 10 and 16 d waves: 50∘ N and 55 km; 4 d wave: 45∘ S and 105 km.
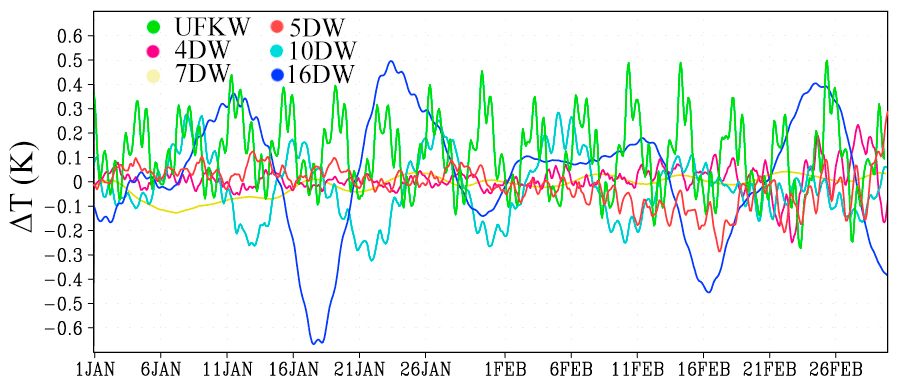
Figure 4Time series of mean zonal temperature variations due to the inclusion of tropospheric sources of various PWs in the regions of their maximum amplitudes in the MUAM.
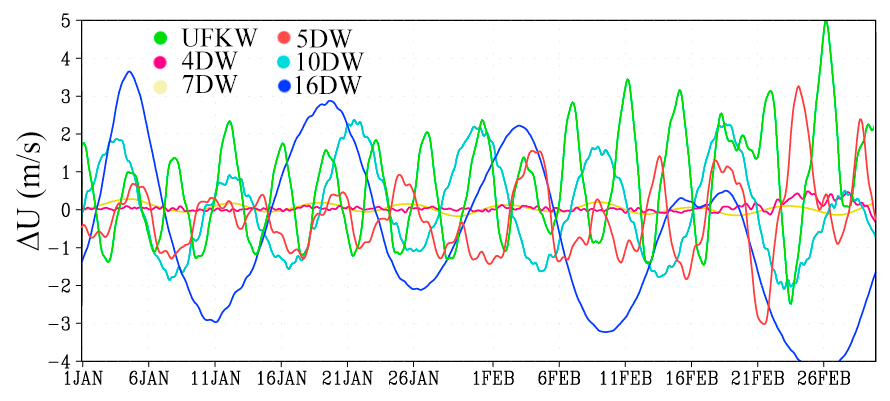
Figure 5Time series of mean zonal wind variations due to the inclusion of tropospheric sources of various PWs in the regions of their maximum amplitudes in the MUAM.
In all cases, especially for the zonal wind (Fig. 5), the wave structure of increments with a period corresponding to the period of the considered PW is observed. In particular, wind changes, which significantly exceed the averaged data for January and February (presented in Fig. 3) can be seen in this figure. Specifically, the inclusion of the 16 d wave and the UFKW can cause the wind speed changes up to 4, and 5 m s−1, respectively. The PWs with zonal number 2 (4 and 7 d) make much smaller changes to the zonal flow, while the weakening of the zonal flow is accompanied by the increase of these waves as well as the 5 d wave and the UFKW by the end of February. Temperature variations in Fig. 4 have a more complex structure since temperature variations are affected by not only pressure fluctuations but also meridional circulation fluctuations.
A number of model simulations have been carried out for January–February, using a three-dimensional nonlinear mechanistic numerical model of the general circulation of the middle and upper atmosphere (MUAM), to estimate the sensitivity of the atmosphere dynamic and thermal regime to the various planetary wave impacts. The MUAM allows the inclusion of selective sources of various PW modes, which gives the opportunity for deeper study into the contribution of each PW to the atmospheric circulation structure. Moreover, for a more detailed diagnostics of the PW effect on the mean flow, the transformed Eulerian mean approach was used, implying the calculation of the residual mean meridional circulation, which is a superposition of eddy and advective mean transport.
The amplitudes of the simulated PWs are consistent with the ground-based, satellite observations data, as well as with the reanalysis and assimilation of meteorological data. The obtained increments of hydrometeorological parameters are maximal, as a rule, in the regions of maximum amplitudes of the considered PWs. In particular, the inclusion of the 5 d PW and an UFKW can transform the components of the residual meridional circulation up to 6 % each, forming a significant contribution to the atmospheric circulation. The impact of the 16 d wave on the circulation is comparable in value with the 5 d PW and UFKW; however, it has a different structure. Changes in circulation components occur in the high-latitude stratosphere and may reach up to 6 %. In turn, all the above-mentioned changes in the meridional circulation, especially its vertical component, as well as a variation of wave activity fluxes, can cause variations in the background temperature of more than 1 K. At the same time, at certain moments, this effect is much stronger. In addition, the waves can be superimposed on one another, and their effect can be summarised, i.e. the cumulative effect of the considered waves can significantly increase at certain moments in time.
The effect of the 16 d PW generation by an internal atmospheric source in the southern lower thermosphere was found, independent of the tropospheric PW sources specified in the model. Most probably, the point is that the 4 d PW with a wave number 2 interacts nonlinearly with a 5 d PW with a wave number 1 causing a secondary wave excitation. Such a mechanism is described, e.g. by Pogoreltsev (2001): when two waves having frequencies ω and zonal numbers m interact, a new (secondary) wave arises in which the frequency and wave number are the sum or difference of the corresponding values of the primary waves. Hence, the direct effect of the PWs can be enhanced due to their nonlinear interactions. Finally, this causes deceleration of the mean flow, creating better conditions for the sudden stratospheric warming (SSW) onset (e.g. Pogoreltsev et al., 2014). However, additional calculations are required to confirm this theory.
In addition, it should also be noted that for proper modelling of large-scale atmospheric dynamics, all models of the general atmospheric circulation should be tested for the ability to reproduce the global resonant properties of the atmosphere (the so-called atmospheric normal modes). This possibility has been repeatedly described in the MUAM (e.g. Pogoreltsev, 2007; Koval et al., 2018a), which underlines the reliability of the results obtained.
According to statement 1296 of the Civil Code of the Russian Federation, all rights on the MUAM code belong to the Russian State Hydrometeorological University (RSHU). To get access to the codes and for their usage, a reader should obtain permission from the RSHU Rector at the following address: 79 Voronezhskaya Street, St. Petersburg, Russia, 192007, phone: 007 (812) 372-50-92. The authors will assist in obtaining such permission. All data sets presented in the paper can be obtained from author Andrey Koval (a.v.koval@spbu.ru) upon request.
The supplement related to this article is available online at: https://doi.org/10.5194/acp-23-4105-2023-supplement.
All authors have made valuable contributions to the writing and editing of the paper, data analysis and visualisation of the results. AVK: conceptualisation, RMC calculation, writing the final version of the paper; TON and MAM: numerical modelling; TSE and KAD: statistical processing; GNM: consulting, English editing on an earlier version of the paper; EVR: consulting, reanalysis data processing. All authors have read and agreed to the published version of the paper.
The contact author has declared that none of the authors has any competing interests.
Publisher's note: Copernicus Publications remains neutral with regard to jurisdictional claims in published maps and institutional affiliations.
Calculations and interpretation of the residual mean circulation and statistical analysis are supported by the Russian Science Foundation (grant no. 20-77-10006). The MUAM adjustment, performing numerical simulations of the atmospheric global circulation and calculation of PW structures are supported by the Ministry of Science and Higher Education of the Russian Federation (agreement 075-15-2021-583). All figures in this study are made using Grid Analysis and Display System (GrADS), which is free software developed thanks to the NASA Advanced Information Systems Research Program.
This research has been supported by the Russian Science Foundation (grant no. 20-77-10006) and the Ministry of Science and Higher Education of the Russian Federation (grant no. 075-15-2021-583).
Publisher’s note: the article processing charges for this publication were not paid by a Russian or Belarusian institution.
This paper was edited by John Plane and reviewed by two anonymous referees.
Andrews, D. G. and McIntyre, M. E.: Planetary waves in horizontal and vertical shear: The generalized Eliassen-Palm relation and the mean zonal acceleration, J. Atmos. Sci., 33, 2031–2048, https://doi.org/10.1175/1520-0469(1976)033<2031:PWIHAV>2.0.CO;2, 1976.
Butchart, N.: The Brewer-Dobson circulation, Rev. Geophys., 52, 157–184, https://doi.org/10.1002/2013RG000448, 2014.
Chang, L. C., Yue, L., Wang, W., Wu, Q., and Meier, R. R.: Quasi two day wave-related variability in the background dynamics and composition of the mesosphere/thermosphere and the ionosphere, J. Geophys. Res.-Space, 119, 4786–4804, 2014.
Charney, J. G. and Drazin, P. G.: Propagation of planetary-scale disturbances from the lower into the upper atmosphere, J. Geophys. Res., 66, 83–109, 1961.
Clark, R., Burrage, M., Franke, S., Manson, A., Meek, C., Mitchell, N., and Muller, H.: Observations of 7-d planetary waves with MLT radars and the UARS-HRDI instrument, J. Atmos. Sol.-Terr. Phy., 64, 1217–1228, 2002.
Day, K. A., Hibbins, R. E., and Mitchell, N. J.: Aura MLS observations of the westward-propagating s=1, 16-day planetary wave in the stratosphere, mesosphere and lower thermosphere, Atmos. Chem. Phys., 11, 4149–4161, https://doi.org/10.5194/acp-11-4149-2011, 2011.
Didenko, K. A., Koval, A. V., Ermakova, T. S., and Lifar, V. D.: Interactions of stationary planetary waves during winter 2008–2009 and 2018–2019 sudden stratospheric warmings, Proc. of SPIE, 28th International Symposium on Atmospheric and Ocean Optics, Atmospheric Physics, https://doi.org/10.1117/12.2644458, 2022.
Drob, D. P., Emmert, J. T., Meriwether, J. W., Makela, J. J., Doornbos, E., Conde, M., Hernandez, G., Noto, G., Zawdie, K. A., McDonald, S. E., Huba, J. D., and Klenzing, J. H.: An update to the Horizontal Wind Model (HWM): The quiet time thermosphere, Earth and Space Science, 2, 301–319, https://doi.org/10.1002/2014EA000089, 2015.
Eliassen A. and Palm E.: On the transfer of energy in stationary mountain waves, Geophys. Norv., 22, 1–23, 1961.
Emmert, J. T., Drob, D. P., Picone, J. M., Siskind, D. E., Jones, M. Jr., Mlynczak, M. G., Bernath, P. F., Chu, X., Doornbos, E., Funke, B., Goncharenko, L. P., Hervig, M. E., Schwartz, M. J., Sheese, P. E., Vargas, F., Williams, B. P., and Yuan, T.: NRLMSIS 2.0: A whole-atmosphere empirical model of temperature and neutral species densities, Earth and Space Science, 7, e2020EA001321, https://doi.org/10.1029/2020EA001321, 2020.
Ermakova T. S., Aniskina, O. G., Statnaya, I. A., Motsakov, M. A., and Pogoreltsev A. I.: Simulation of the ENSO influence on the extra-tropical middle atmosphere, Earth Planets Space, 71, 8, https://doi.org/10.1186/s40623-019-0987-9, 2019.
Forbes, J. M. and Zhang, X.: The quasi-6 day wave and its interactions with solar tides, J. Geophys. Res.-Space, 122, 4764–4776, https://doi.org/10.1002/2017JA023954, 2017.
Forbes, J. M., Zhang, X., and Maute, A.: Planetary wave (PW) generation in the thermosphere driven by the PW-modulated tidal spectrum, J. Geophys. Res.-Space, 125, e2019JA027704, https://doi.org/10.1029/2019JA027704, 2020.
Forbes, J. M., Zhang, X., Maute, A., and Hagan, M. E.: Zonally symmetric oscillations of the thermosphere at planetary wave periods, J. Geophys. Res.-Space, 123, 4110–4128, https://doi.org/10.1002/2018JA025258, 2018.
Gavrilov, N. M. and Koval, A. V.: Parameterization of mesoscale stationary orographic wave forcing for use in numerical models of atmospheric dynamics, Izv. Atmos. Ocean. Phys., 49, 244–251 https://doi.org/10.1134/S0001433813030067, 2013.
Gavrilov, N. M., Koval, A. V., Pogoreltsev, A. I., and Savenkova, E. N.: Simulating planetary wave propagation to the upper atmosphere during stratospheric warming events at different mountain wave scenarios, Adv. Space Res., 61, 1819–1836, https://doi.org/10.1016/j.asr.2017.08.022, 2018.
Gelaro, R., McCarty, W., Suárez, Max J., Todling, R., Molod, A., Takacs, L., Randles, C., Darmenov, A., Bosilovich, M. G., Reichle, R., Wargan, K., Coy, L., Cullather, R., Draper, C., Akella, S., Buchard, V., Conaty, A., da Silva, A., Wei Gu, Gi-Kong Kim, Koster, R., Lucchesi, R., Merkova, D., Nielsen, J. E., Partyka, G., Pawson, S., Putman, W., Rienecker, M., Schubert, S. D., Sienkiewicz, M. and Zhao, B. The Modern-Era Retrospective Analysis for Research and Applications, Version 2 (MERRA-2), J. Climate, 30, 5419–5454, https://doi.org/10.1175/JCLI-D-16-0758.1, 2017.
Haynes, P. H., McIntyre, M. E., Shepherd, T. G., Marks, C. J., and Shine, K. P. On the “downward control” of extratropical diabatic circulations by eddy-induced mean zonal forces, J. Atmos. Sci. 48, 651–678, 1991.
He, M., Chau, J. L., Forbes, J. M., Thorsen, D., Li, G., Siddiqui, T. A., Yamazaki, Y., and Hocking, W. K.: Quasi-10-day wave and semidiurnal tide nonlinear interactions during the Southern Hemispheric SSW 2019 observed in the Northern Hemispheric mesosphere, Geophys. Res. Lett., 47, e2020GL091453, https://doi.org/10.1029/2020GL091453, 2020.
Holton, J. R.: The dynamic meteorology of the stratosphere and mesosphere, Meteorol. Monogr., 15, 218, https://doi.org/10.1002/qj.49710243325, 1975.
Holton, J. R. and Tan, H.: The influence of the equatorial quasibiennial oscillation on the global circulation at 50 mb, J. Atmos. Sci., 37, 2200–2208, 1980.
Holton, J. R., Haynes, P. H., McIntyre, M. E., Douglas, A. R., Rood, R. B., and Pfister, L.: Stratosphere-troposphere exchange, Rev. Geophys., 33, 403–439, 1995.
Huang, Y., Zhang, S., Li, C., Li, H., Huang, K., and Huang, C.: Annual and interannual variations in global 6.5 DWS from 20 to 110 km during 2002–2016 observed by TIMED/SABER, J. Geophys. Res.-Space, 122, 8985–9002, https://doi.org/10.1002/2017JA023886, 2017.
Jacobi, Ch., Fröhlich, K., and Portnyagin, Y. Semi-empirical model of middle atmosphere wind from the ground to the lower thermosphere, Adv. Space Res., 43, 239–246, 2009.
Jiang, G., Xu, J., Xiong, J., Ma, R., Ning, B., Murayama, Y., Thorsen, D., Gurubaran, S., Vincent, R. A., Reid, I., and Franke, S. J.: A case study of the mesospheric 6.5-day wave observed by radar systems, J. Geophys. Res., 113, D16111, https://doi.org/10.1029/2008JD009907, 2008.
Koval, A. V., Gavrilov, N. M., Pogoreltsev, A. I., and Shevchuk, N. O.: Influence of solar activity on penetration of traveling planetary-scale waves from the troposphere into the thermosphere, J. Geophys. Res.-Space, 123, 6888–6903, https://doi.org/10.1029/2018JA025680, 2018a.
Koval, A. V., Gavrilov, N. M., Pogoreltsev, A. I., and Savenkova, E. N.: Comparisons of planetary wave propagation to the upper atmosphere during stratospheric warming events at different QBO phases, J. Atmos. Sol.-Terr. Phy., 171, 201–209, https://doi.org/10.1016/j.jastp.2017.04.013, 2018b.
Koval, A. V., Gavrilov, N. M., Pogoreltsev, A. I., and Kandieva, K. K.: Dynamical impacts of stratospheric QBO on the global circulation up to the lower thermosphere, J. Geophys. Res.-Atmos., 127, e2021JD036095, https://doi.org/10.1029/2021JD036095, 2022a.
Koval, A. V., Gavrilov, N. M., Kandieva, K. K. Ermakova, T. S., and Didenko, K. A.: Numerical simulation of stratospheric QBO impact on the planetary waves up to the thermosphere, Sci. Rep., 12, 21701, https://doi.org/10.1038/s41598-022-26311-x 2022b.
Lindzen, R. S.: Turbulence and stress owing to gravity wave and tidal breakdown, J. Geophys. Res., 86, 9707–9714, 1981.
Liu, H. L., Talaat, E. R., Roble, R. G., Lieberman, R. S., Riggin D. M., and Yee, J. H.: The 6.5-day wave and its seasonal variability in the middle and upper atmosphere, J. Geophy. Res.-Atmos., 109, D21112, https://doi.org/10.1029/2004jd004795, 2004.
Longuet-Higgins, M. S.: The eigenfunctions of Laplace's tidal equation over a sphere, Philos. T. R. Soc. Lond., 262, 511–607, 1968.
Matsuno, T.: Vertical propagation of stationary planetary waves in the winter Northern Hemisphere, J. Atmos. Sci., 27, 871–883, 1970.
Medvedeva, I. V., Semenov, A. I., Pogoreltsev, A. I., and Tatarnikov, A. V.: Influence of sudden stratospheric warming on the mesosphere/lower thermosphere from the hydroxyl emission observations and numerical simulations, J. Atmos. Sol.-Terr. Phy., 187, 22–32, https://doi.org/10.1016/j.jastp.2019.02.005, 2019.
Merzlyakov, E., Solovjova, T., and Yudakov, A.: The interannual variability of a 5–7 day wave in the middle atmosphere in autumn from era product data, aura MLS data, and meteor wind data, J. Atmos. Sol.-Terr. Phy., 102, 281–289, 2013.
Nath, D., Chen, W., Zelin, C., Pogoreltsev, A. I., and Wei, K. Dynamics of 2013 Sudden Stratospheric Warming event and its impact on cold weather over Eurasia: Role of planetary wave reflection, Sci. Rep., 6, 24174, https://doi.org/10.1038/srep24174, 2016.
Newman, P. A., Oman, L. D., Douglass, A. R., Fleming, E. L., Frith, S. M., Hurwitz, M. M., Kawa, S. R., Jackman, C. H., Krotkov, N. A., Nash, E. R., Nielsen, J. E., Pawson, S., Stolarski, R. S., and Velders, G. J. M.: What would have happened to the ozone layer if chlorofluorocarbons (CFCs) had not been regulated?, Atmos. Chem. Phys., 9, 2113–2128, https://doi.org/10.5194/acp-9-2113-2009, 2009.
Pancheva, D., Mukhtarov, P., Mitchell, N. J., Merzlyakov, E., Smith, A. K., Andonov, B., Singer, W., Hocking, W., Meek, C., Manson, A., and Murayama, Y. Planetary waves in coupling the stratosphere and mesosphere during the major stratospheric warming in 2003/2004, J. Geophys. Res., 113, D12105, https://doi.org/10.1029/2007JD009011, 2008.
Pancheva, D., Mukhtarov, P., Andonov, B., Mitchell, N. J., and Forbes, J. M. Planetary waves observed by TIMED/SABER in coupling the stratosphere- mesosphere-lower thermosphere during the winter of 2003/2004: part 2 – altitude and latitude planetary wave structure, J. Atmos. Sol.-Terr. Phy., 71, 75–87, https://doi.org/10.1016/j.jastp.2008.09.027, 2009.
Pancheva, D., Mukhtarov, P., Andonov, B., and Forbes, J. M.: Global distribution and climatological features of the 5–6-day planetary waves seen in the SABER/TIMED temperatures (2002–2007), J. Atmos. Sol.-Terr. Phy., 72, 26–37, 2010.
Pancheva, D., Mukhtarov, P., and Siskind, D. E.: The quasi-6-day waves in NOGAPS-ALPHA forecast model and their climatology in MLS/Aura measurements (2005–2014), J. Atmos. Sol.-Terr. Phy., 181, 19–37, 2018.
Pedatella, N. M. and Forbes, J. M.: Modulation of the equatorial F-region by the quasi-16-day planetary wave, Geophys. Res. Lett., 36, L09105, https://doi.org/10.1029/2009GL037809, 2009.
Pogoreltsev, A. I.: Simulation of planetary waves and their influence on the zonally averaged circulation in the middle atmosphere, Earth Planets Space, 51, 773–784, 1999.
Pogoreltsev, A. I.: Numerical simulation of secondary planetary waves arising from the nonlinear interaction of the normal atmospheric modes, Phys. Chem. Earth Pt. C, 26, 395–403, 2001.
Pogoreltsev, A. I.: Generation of normal atmospheric modes by stratospheric vacillations, Izv. Atmos. Ocean. Phy., 43, 423–435, 2007.
Pogoreltsev, A. I., Vlasov, A. A., Froehlich, K., and Jacobi, Ch.: Planetary waves in coupling the lower and upper atmosphere, J. Atmos. Sol.-Terr. Phy., 69, 2083–2101, https://doi.org/10.1016/j.jastp.2007.05.014, 2007.
Pogoreltsev, A. I., Savenkova, E. N., and Pertsev, N. N.: Sudden stratopheric warmings: the role of normal atmospheric modes, Geomagn. Aeronomy, 54, 1–15, doi 10.1134/S0016793214020169, 2014.
Qin, Y., Gu, S.-Y., and Dou, X.: A new mechanism for the generation of quasi-6-day and quasi-10-day waves during the 2019 Antarctic sudden stratospheric warming, J. Geophys. Res.-Atmos., 126, e2021JD035568, https://doi.org/10.1029/2021JD035568, 2021.
Sassi, F., Garcia, R., and Hoppel, K.: Large-scale Rossby normal modes during some recent Northern Hemisphere winters, J. Atmos. Sci., 69, 820–839, 2012.
Schoeberl, M.: Stratospheric warmings – observations and theory, Rev. Geophys., 16, 521–538, https://doi.org/10.1029/RG016i004p00521, 1978.
Shevchuk N. O., Ortikov, M. Yu., and Pogoreltsev, A. I.: Modeling of atmospheric tides with account of diurnal variations of ionospheric conductivity, Russ. J. Phys. Chem. B, 12, 576–589, https://doi.org/10.1134/S199079311803017X, 2018.
Suvorova, E. V. and Pogoreltsev, A. I.: Modeling of nonmigrating tides in the middle atmosphere, Geomagmetizm and Aeronomy, 51, 105–115, https://doi.org/10.1134/S0016793210061039, 2011.
Swarztrauber, P. N. and Kasahara, A.: The vector harmonic analysis of Laplace's tidal equations, SIAM J. Sci. Stat. Comp., 6, 464–491, 1985.
Wang, J. C., Chang, L. C., Yue, J., Wang, W., and Siskind, D. E.: The quasi 2 day wave response in TIME-GCM nudged with NOGAPS-ALPHA, J. Geophys. Res.-Space, 122, 5709–5732, 2017.
Yamazaki, Y., Matthias, V., and Miyoshi, Y.: Quasi-4-day wave: Atmospheric manifestation of the first symmetric Rossby normal mode of zonal wavenumber 2, J. Geophys. Res.-Atmos., 126, e2021JD034855, https://doi.org/10.1029/2021JD034855, 2021.
Yiğit, E., and Medvedev, A. S.: Heating and cooling of the thermo-sphere by internal gravity waves, Geophys. Res. Lett., 36, L14807, https://doi.org/10.1029/2009GL038507, 2009.