the Creative Commons Attribution 4.0 License.
the Creative Commons Attribution 4.0 License.
 | 28 Mar 2023
Improving ozone simulations in Asia via multisource data assimilation: results from an observing system simulation experiment with GEMS geostationary satellite observations
Juseon Bak
Peter Zoogman
Song Liu
Xicheng Li
Shuai Sun
Yuyang Chen
Dongchuan Pu
Xiaoxing Zuo
Weitao Fu
Tzung-May Fu
The applications of geostationary (GEO) satellite measurements at an unprecedented spatial and temporal resolution from the Geostationary Environment Monitoring Spectrometer (GEMS) for monitoring and forecasting the alarming ozone pollution in Asia through data assimilation remain at the early stage. Here we investigate the benefit of multiple ozone observations from GEMS geostationary satellite, low Earth orbit (LEO) satellite, and surface networks on summertime ozone simulations through individual or joint data assimilation, built on our previous observing system simulation experiment (OSSE) framework (Shu et al., 2022). We find that data assimilation improves the monitoring of exceedance, spatial patterns, and diurnal variations of surface ozone, with a regional mean negative bias reduction from 2.1 to 0.2–1.2 ppbv in ozone simulations as well as significant improvements of a root-mean-square error (RMSE) of by 5 %–69 % in most Asian countries. Furthermore, the joint assimilation of GEMS and surface observations performs the best. GEMS also brings direct added value for better reproducing ozone vertical distributions, especially in the middle to upper troposphere at low latitudes, but may mask the added value of LEO measurements, which are crucial to constrain surface and upper tropospheric ozone simulations when observations from other platforms are inadequate. Our study provides a valuable reference for ozone data assimilation as multisource observations become gradually available in the era of GEO satellites.
- Article
(9525 KB) - Full-text XML
-
Supplement
(6407 KB) - BibTeX
- EndNote


Ozone is a secondary air pollutant formed in a complex chemical interaction between nitrogen oxides (NOx) and volatile organic compounds (VOCs) in the presence of sunlight. Long-term exposure to ozone increases the risk of premature mortality from respiratory causes, for example, reportedly contributing to an estimated 365 000 deaths from the chronic obstructive pulmonary disease worldwide in 2019 (Health Effects Institute, 2020). In particular, the majority (∼80 %) of estimated ozone-attributable respiratory deaths are in Asia, predominantly in India and China (Malley et al., 2017), where operational monitoring sites are spatially scattered and sparse. As the first geostationary air quality monitoring satellite instrument, the Geostationary Environment Monitoring Spectrometer (GEMS) on board the Geostationary Korea Multi-Purpose satellite (Geo-KOMPSAT)-2B continuously measures tropospheric ozone in the daytime over East Asia (Kim et al., 2020), providing unprecedented opportunities to fill the observational gaps over this region. However, the extent to which the observing system during the operation of GEMS, principally consisting of measurements from GEMS, low Earth orbit (LEO) satellites, and ground-based stations, would improve ozone simulations and forecasting remains unclear. We quantify here the added value of individually or jointly assimilating multiple ozone observations for improving ozone simulations in Asia, built on our previous observing system simulation experiment (OSSE) framework (Shu et al., 2022).
Ozone pollution in Asia has been worsening in the last decade, resulting from rapid urbanization and industrialization (Gaudel et al., 2018; Chen et al., 2021). In East Asia, lower tropospheric ozone column measurements reveal a decadal increase of 0.21±0.05 Dobson unit (DU) during 2005–2018 in eastern China, South Korea, and Japan (Lee et al., 2021). Near the surface, the observed daily maximum 8 h average (MDA8) ozone concentrations steadily increased by ∼ 4 % yr−1–8 % yr−1 during 2013–2020 according to the Chinese surface network (Han et al., 2020; Lu et al., 2020), along with intensified persistent ozone pollution episodes lasting 5 d or longer (Gong et al., 2020; Shu et al., 2020). Ground-based observations in South Korea likewise indicate a nationwide increase of 0.3 to 1.7 ppbv yr−1 in surface MDA8 ozone during 2001–2018 (Yeo and Kim, 2021). In Southeast Asia, elevated MDA8 ozone levels exceeding the recommended exposure of 50 ppbv (Assareh et al., 2016; Marvin et al., 2021) are reported from biomass burning (Reddington et al., 2021; Sonkaew and Macatangay, 2015; Yadav et al., 2017), often recurringly during the dry season (Ziemke et al., 2009), causing deteriorated ozone pollution in downstream areas (Deng et al., 2008; Lin et al., 2013). In South Asia, countries have observed the steepest increase in ozone exposure globally. For example, India has witnessed an increase of about 17 % in population-weighted average MDA8 ozone concentrations, ramping from 56.5 ppbv in 2010 to 66.2 ppbv in 2019 (Health Effects Institute, 2020).
The alarming ozone pollution in Asia calls for better understanding and forecasting from air quality models. In particular, data assimilation, incorporated into chemical transport models (CTMs), maximizes the value of observations, thus reducing biases in ozone numerical simulations (Bocquet et al., 2015; Wu et al., 2008; Huang et al., 2015). Data assimilation utilizes a wide range of observations, generally involving measurements from ground-based stations (Tang et al., 2011; Peng et al., 2018; Ma et al., 2019), LEO satellites (Huang et al., 2015; Miyazaki et al., 2012, 2020b; Inness et al., 2015, 2019b), and geostationary satellites (Claeyman et al., 2011; Zoogman et al., 2011, 2014; Quesada-Ruiz et al., 2020; Shu et al., 2022) in the current and anticipated observing system. As such, data assimilation applications have propelled to the forefront of the development of tropospheric and surface ozone reanalysis, e.g. Monitoring Atmospheric Composition and Climate (MACC) reanalysis (Inness et al., 2013), Copernicus Atmosphere Monitoring Service (CAMS) interim reanalysis (Flemming et al., 2017), CAMS reanalysis (Inness et al., 2019a), Tropospheric ozone reanalysis (TCR-1/TCR-2) (Miyazaki et al., 2015, 2020a), and Chinese air quality reanalysis (CAQRA) (Kong et al., 2021).
Widely recognized, the value of the measurements from LEO satellites, e.g. Ozone Monitoring Instrument (OMI) (Levelt et al., 2018), Global Ozone Monitoring Experiment-2 (GOME-2) (Munro et al., 2016), and TROPOspheric Monitoring Instrument (TROPOMI) (Veefkind et al., 2012), for improving tropospheric chemistry modelling is immense due to the high spatial coverage (Inness et al., 2019a, b). For example, Miyazaki et al. (2020b) demonstrated that the assimilation of multiconstituent LEO satellite data reduces annual mean ozone bias by 39 %–97 % in the middle troposphere. Sekiya et al. (2022) manifested that the assimilation of TROPOMI tropospheric nitrogen dioxide (NO2) column retrievals leads to improved agreements (by 7 %–40 %) with independent validation observations compared to control simulation, which is more obvious than those by assimilating OMI data (by 1 %–22 %) for many cases, owing to the higher spatial resolution and smaller observation errors of TROPOMI measurements.
Observing air quality from space is entering a new era of geostationary satellites, marked by the launch of GEMS on February 2020. Compared with LEO satellites, geostationary satellites can monitor the diurnal variations in tropospheric ozone and its precursors in the daytime. A virtual geostationary constellation, consisting of GEMS over East Asia (Kim et al., 2020), Tropospheric emissions: Monitoring of pollution (TEMPO, 2023) over North America (Zoogman et al., 2017), and Sentinel-4 (2024) over Europe (Ingmann et al., 2012), focuses on the most polluted and industrialized regions in the Northern Hemisphere. Their value for atmospheric chemistry modelling has been investigated preliminarily through the OSSE approach (Zoogman et al., 2014; Quesada-Ruiz et al., 2020; Shu et al., 2022).
GEMS is an ultraviolet (UV) and visible (Vis) imaging spectrometer that facilitates tropospheric ozone monitoring at an unprecedented spatial (7×8 km2 at Seoul) and temporal (eight times per day at least) resolution in a spectral range of 300–340 nm over East Asia, yielding massive observations for data assimilation applications (Kim et al., 2020; Bak et al., 2013, 2019). An OSSE presented in our previous work (Shu et al., 2022) has revealed that GEMS could provide useful information to constrain surface and middle-to-upper tropospheric ozone simulations. However, there remains a need for more investigations involving multisource data assimilation. Here we examine to what extent the assimilation of multiple ozone observations (GEMS, LEO satellite, and surface observations), individually or in combination, would improve ozone simulations in Asia through a robust OSSE as described below.
OSSE is a critical tool for objectively assessing the added value of proposed satellite observations to an existing observing system and investigating the impact of instrument designs (Timmermans et al., 2015; Brasseur and Jacob, 2017). In general, the air quality OSSE framework involves the following: (1) application of a CTM to generate time-varying 3-D fields of atmospheric compositions (taken as the “true” atmosphere), called nature run; (2) virtual sampling of such “true” atmosphere following the observing schedules and error characteristics of proposed instruments, that is, to generate synthetic observations; (3) application of a second, preferably independent CTM to obtain a priori and a posteriori estimates of atmospheric compositions (without and with the assimilation of synthetic observations), called control run and assimilation run, respectively; and (4) quantification of the benefit of proposed instruments by examining the correction of mismatch between the “true” state and the a priori after data assimilation (Zoogman et al., 2014). In Fig. S1, we sketch the abovementioned steps.
We perform our OSSE for June 2020 to represent summertime ozone in Asia. The observing system includes the GEMS geostationary satellite, an LEO satellite instrument (i.e. OMI), and the surface monitoring network. This study only simulates synthetic OMI ozone profile retrievals to represent the LEO satellite measurements. In the nature run, we use a regional CTM, the Weather Research and Forecasting model coupled with Chemistry (WRF-Chem) (Grell et al., 2005), to construct the “true” atmosphere. We then sample such a virtual atmosphere to retrieve synthetic GEMS and OMI ozone profiles based on optimal estimation (Rodgers, 2000) and to extract synthetic surface observations. Next, we use a global CTM GEOS-Chem (Bey et al., 2001; Park et al., 2004; Mao et al., 2013) as the forward model for data assimilation to perform the control run and assimilation run. Last, we quantify the information contributed by the observing system by comparing paired differences between these two simulations and the “true” atmosphere.
2.1 Simulation models
We apply a regional CTM, WRF-Chem (version 4.1) (Grell et al., 2005), for the nature run of the OSSE to simulate the “true” state of atmospheric compositions. The selection of nature run is crucial to characterize the realistic model errors dedicated to the robustness of the OSSE. Here we configure WRF-Chem with a grid resolution of 50 km × 50 km covering most of Asia and 34 vertical layers extending from the surface to 50 hPa. The setup of the WRF-Chem simulation, as well as the GEOS-Chem simulations described below, follows our preceding work (Shu et al., 2022) and is summarized in Table S1. We have previously shown its robust capability in reproducing the temporal variations and vertical distributions of ozone through validation against actual surface ozone and ozonesonde measurements, respectively.
For the control run and assimilation run, we use a nested version of the GEOS-Chem (version 12.9.3), which is a global CTM with a detailed HOx–NOx–VOC–ozone–aerosol–halogen tropospheric chemistry mechanism (Bey et al., 2001; Park et al., 2004; Mao et al., 2013) and has been widely applied in ozone simulations (Zoogman et al., 2014; Gong et al., 2020; Shu et al., 2022). The nested Asian (11∘ S–55∘ N, 60–150∘ E) simulation has a resolution of , with 47 vertical layers up to 0.1 hPa and boundary conditions updated every 3 h from a global simulation. As indicated in Table S1, we configure GEOS-Chem as differently as possible in meteorological fields, chemical mechanisms, and emission inventories relative to WRF-Chem simulation to maximize their independence for the proper interpretation of OSSE results, as previously emphasized.
2.2 Observing system and synthetic observations
Our OSSE simulates the observing system over Asia during the operation of GEMS, consisting of GEMS geostationary satellite measurements, LEO OMI (henceforth LEO) satellite measurements, and surface measurements. We produce synthetic observations since GEMS scientific ozone profile products have not yet been released. We assume the normal operation of OMI, acknowledging data loss due to row anomalies and instrument degradation (Schenkeveld et al., 2017), which will be addressed in our future study assimilating real observations.
To simulate GEMS and OMI ozone retrievals, we apply a fast ozone profile retrieval simulation (FOR) tool (Shu et al., 2022), in which the optimal estimation-based retrievals (Rodgers, 2000) and lookup table (LUT)-based radiative transfer simulations (Bak et al., 2021) are merged. The spectral range is set to be 305–340 nm for GEMS, while both Hartley band (269–309 nm) and Huggins band (312–330 nm) are used for OMI (Bak et al., 2013, 2019). Hourly GEMS ozone profiles are synthetically retrieved for the daytime period (01:00–08:00 UTC) over East Asia (5∘ S–45∘ N, 75–145∘ E). We likewise generate daily OMI measurements within the study domain according to the real-time orbit information of OMI (https://disc.gsfc.nasa.gov/datasets/OMTO3_003/summary, last access: 1 March 2023).
Briefly, the a posteriori estimate of x () is determined as a linear combination of the true state (xt) and a priori (xap) state, with A, weighting factor:
where Sy and Sa are covariance matrices of measurement random-noise errors and a priori errors, respectively, with K, weighting function matrix (). A is the averaging kernel matrix () representing the sensitivity of the retrieved profile to the true state (measurement information). Each diagonal element of A represents the degree of freedom for signal (DFS), quantifying the number of independent pieces of information available at that layer from radiance measurements. I is the identity matrix. To account for the impact of measurement noises on a posteriori estimate, is added to the a posteriori estimate, where G describes the relative contribution of measurement errors () on the retrieval (). is the covariance matrix of solution errors, which is also seen as the sum of Sn and Ss:
where Sn and Ss quantify the retrieval errors caused by the measurement errors and a priori errors, respectively.
In this experiment, a priori information (xap, Sa) is taken from the climatological dataset (McPeters and Labow, 2012), commonly for GEMS and OMI data simulation. The state vector consists of the ozone profiles at 24 layers, surface albedo, and cloud fraction. The pressure level grid is set at for i=0 to 23 (1 atm=1013.25 hPa, ∼2.5 km thickness between levels), with the top of the atmosphere set for P24 (∼ 55–65 km). To complete the “true” profiles, the WRF-Chem “true” atmosphere is used and extended with GEOS-Chem control run outputs above ∼50 hPa due to the top pressure limit of WRF-Chem and then the merged profiles are spatially nested onto the standard retrieval grids. Both GEMS and OMI synthetic datasets are simulated at native spatial grids, and then the spatial binning is applied by 4×4 for GEMS and 4 (along-track) × 2 (across-track) for OMI to match with the planned GEMS data format and the current OMI data format (https://avdc.gsfc.nasa.gov/pub/data/satellite/Aura/OMI/V03/L2/OMPROFOZ/, last access: 1 March 2023), respectively.
Figures 1 and 2 compare the performance of simulated GEMS (Fig. 1e and f) and OMI (Fig. 2b and c) retrievals, including ozone profiles (), associated retrieval errors (), and averaging kernels (A) at noon for a specified location near Beijing with a high ozone level (Figs. 1b and 2a). In general, the magnitude of GEMS retrieval errors is very close to that of a priori errors at the upper atmospheric layers above ∼2 hPa due to the weak retrieval sensitivity (DFS close to zero) and hence the strong influence of a priori on the retrievals (Bak et al., 2013). In comparison to GEMS, the retrieval quality of OMI is significantly better above 200 hPa for representing the stratosphere and upper troposphere, with the DFS value up to 0.53. Nevertheless, GEMS has stronger vertical sensitivity and smaller retrieval errors relative to OMI at each layer below 200 hPa, providing sufficient measurement information to characterize tropospheric and near-surface ozone. Specifically, GEMS has more potential to capture the hot spots and diurnal evolution of ozone pollution in East Asia (Fig. 1a–d), as revealed in Shu et al. (2022). In addition, the validation of retrieval errors and averaging kernels of the OMI ozone profile at Shanghai (Fig. S2) retrieved by the FOR tool against the Smithsonian Astrophysical Observatory (SAO) OMI Ozone Profile (PROFOZ) product (https://avdc.gsfc.nasa.gov/pub/data/satellite/Aura/OMI/V03/L2/OMPROFOZ/, last access: 1 March 2023) demonstrates the robust capability of the FOR tool to simulate satellite observations.
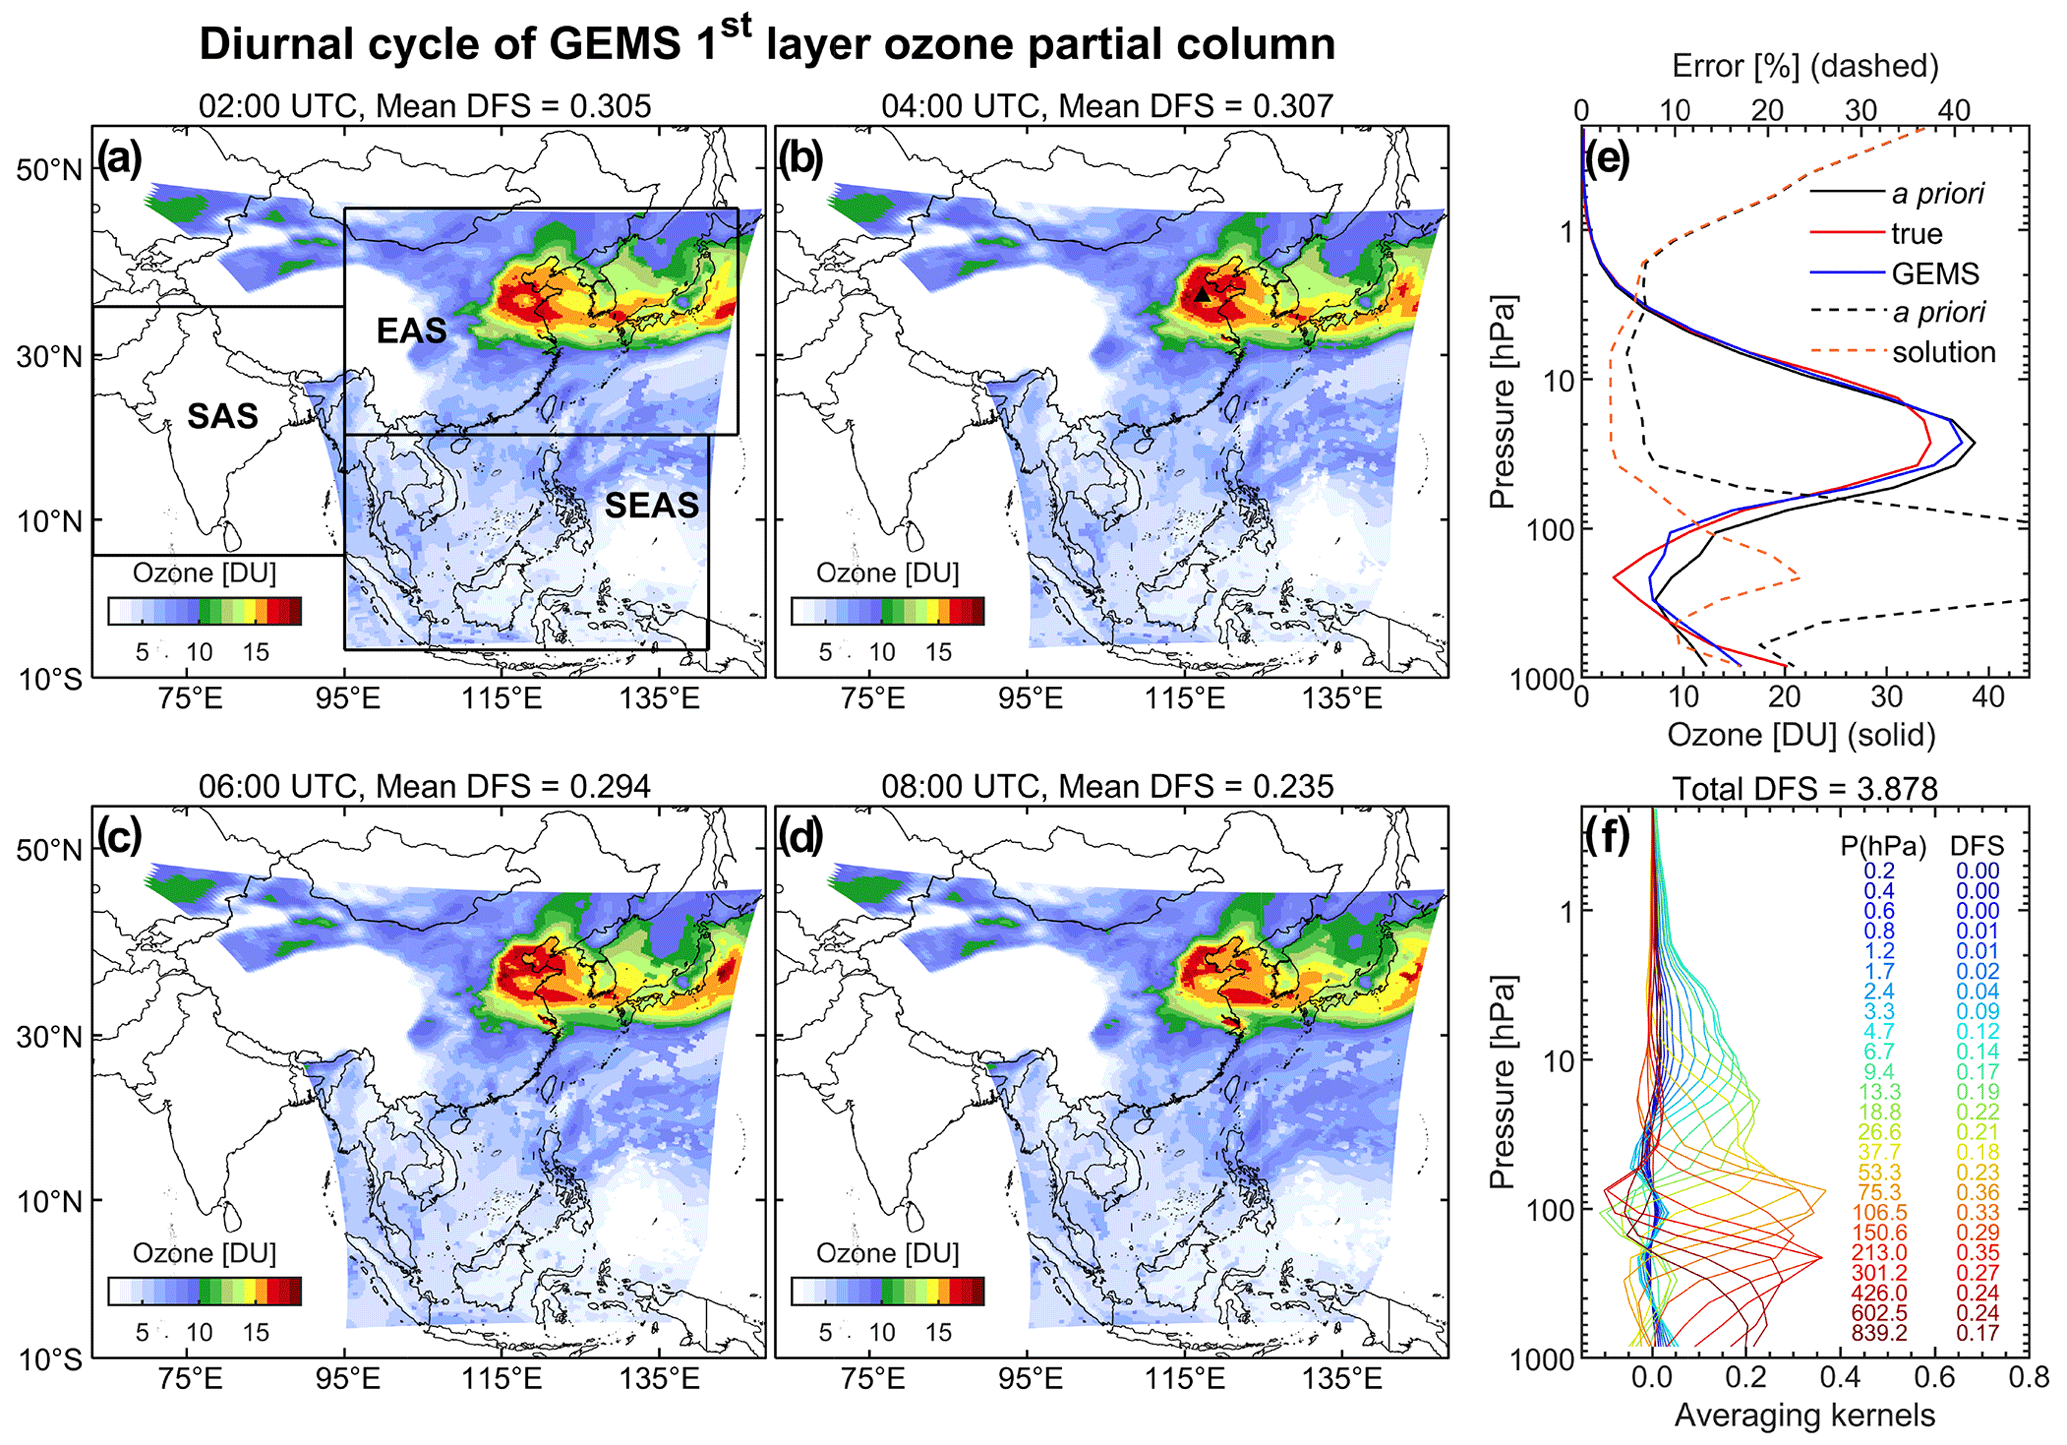
Figure 1Example of diurnal cycles of surface-layer ozone partial column (02:00, 04:00, 06:00, and 08:00 UTC, a–d), vertical ozone profiles and relative retrieval errors (e), and averaging kernels (f) at 04:00 UTC for a specified grid with high ozone level (36.6∘ N, 117.1∘ E, denoted using the black triangle in b) from simulated GEMS retrievals on 16 June 2020. In (a–d), captions give the regional average of the degree of freedom for signal (DFS; defined as the trace of the averaging kernel matrix in Sect. 2.2) of the corresponding GEMS retrievals. The black box areas in (a) define the regions of East Asia (EAS), Southeast Asia (SEAS), and South Asia (SAS). In (e), the solid lines denote the a priori (black), true (red), and retrieved (blue) profiles. The dashed lines represent the a priori (black) and solution (orange) errors that both normalized to a priori profiles. In (f), the caption gives the total DFS. Averaging kernels (coloured by layers) are normalized to the thickness of each layer and a priori errors. Also inserted are elements of the DFS vector along with the central pressure of each layer.
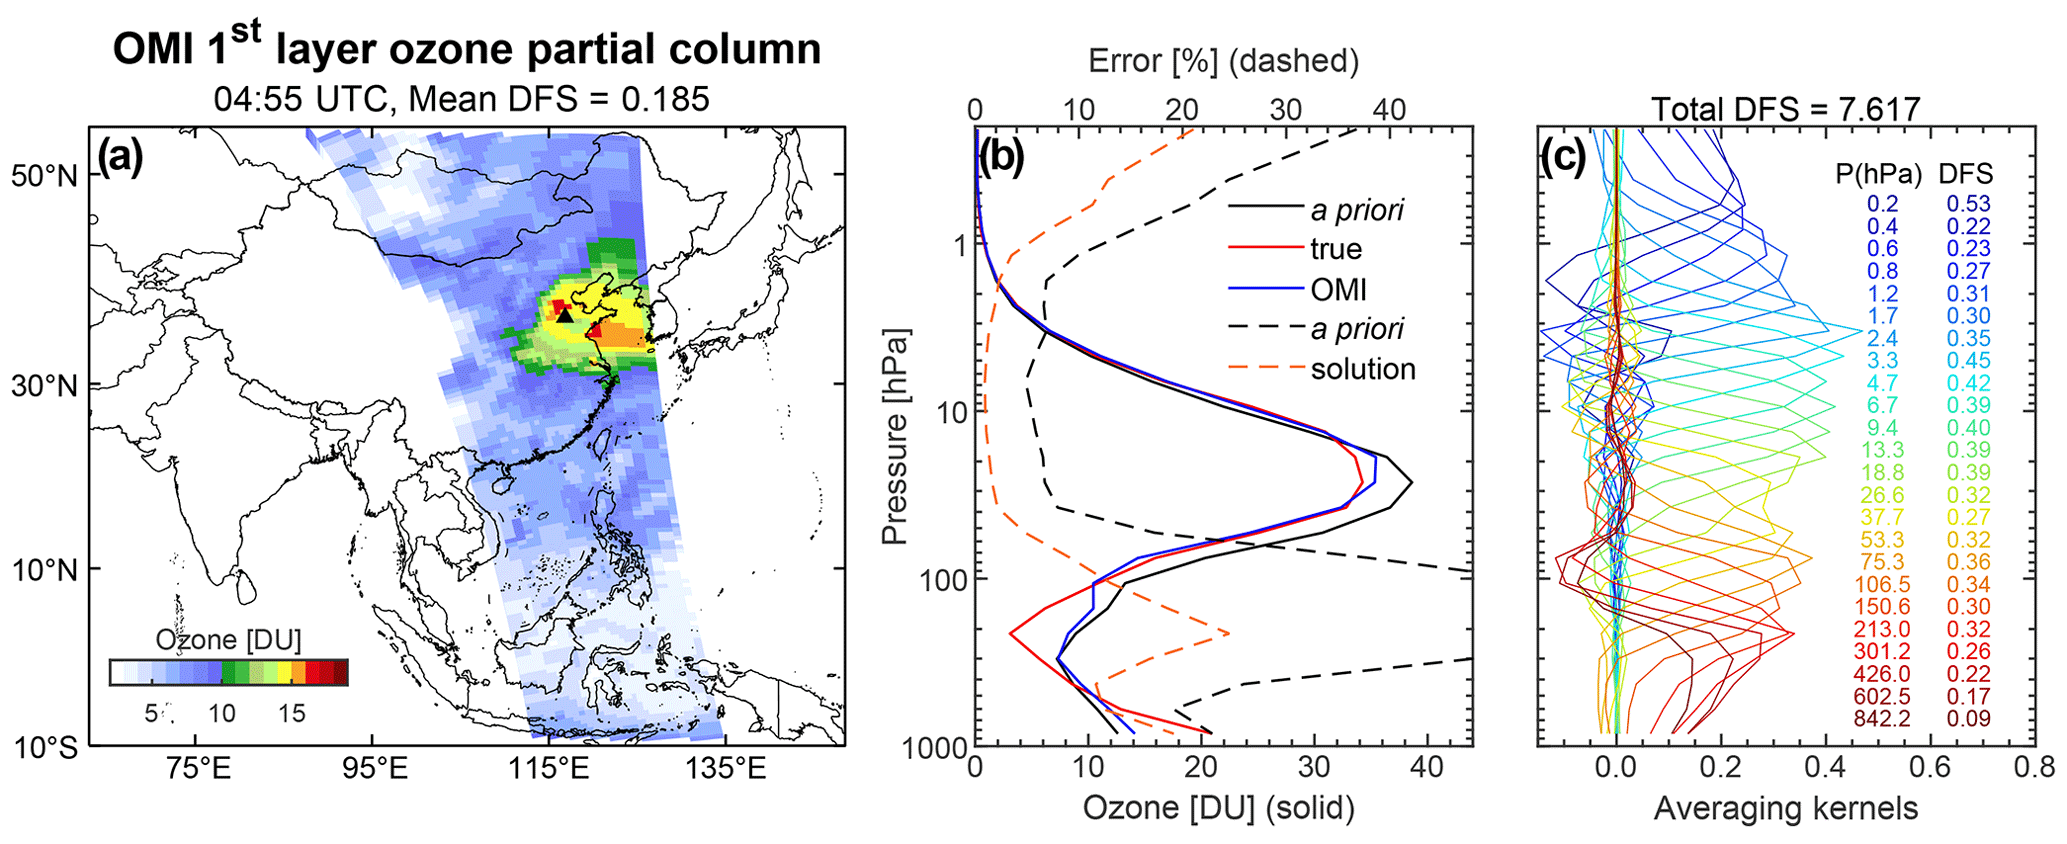
Figure 2Same as Fig. 1 but from simulated OMI retrievals at 04:55 UTC on 16 June 2020.
We sample hourly surface ozone measurements based on site information from three networks, i.e. the Tropospheric Ozone Assessment Report (TOAR) (Schultz et al., 2017), the China National Environmental Monitoring Center (CNEMC) (http://www.cnemc.cn/, last access: 1 March 2023), and the Continuous Ambient Air Quality Monitoring Stations (CAAQMS) of the Central Pollution Control Board (CPCB) in India (Singh et al., 2020). There are a total of 3214 sites in the Asian domain (Fig. 3).

Figure 3Distributions of surface monitoring site over the Asian domain. The red, blue, and green dots represent monitoring sites from the Tropospheric Ozone Assessment Report (TOAR), the China National Environmental Monitoring Center (CNEMC), and the Continuous Ambient Air Quality Monitoring Stations (CAAQMS) of the Central Pollution Control Board (CPCB) in India, respectively. The coloured areas indicate monthly mean daily maximum 8 h average (MDA8) ozone concentrations in June 2020, as simulated by the control run.
2.3 Assimilation of satellite and surface observations
We adopt a sequential sub-optimal Kalman filter technique (Parrington et al., 2009; Zoogman et al., 2011, 2014; Shu et al., 2022) in the data assimilation system. At each assimilation time step, we calculate the optimal estimate of the true ozone concentrations (x, state vector) as a weighted average of the model forecast xb and the observation y:
where H represents the observation operator that maps the model forecast into the observation space. For satellite measurements , it utilizes the spatial interpolation operator S, the a priori profile xap, and averaging kernels A from satellite retrievals (Sect. 2.2) to remove the dependence of the analysis on the model-retrieval comparison (Miyazaki et al., 2012, 2020b). We limit our assimilation exercise to satellite pixels with cloud fraction less than 0.3 and vertical profiles at the bottom 11 retrieval layers (see Figs. 1 and 2) to avoid introducing redundant stratospheric information. For surface measurements, Hxb=xb.
The Kalman gain matrix M measures the relative weight apportioned to the model forecast and the observation:
where Pb is the model error covariance matrix that expresses the errors in the forward model. Following Zoogman et al. (2014) and Shu et al. (2022), we initialize the model error variances (diagonal terms) with a priori errors of 25 %. We parameterize the model error covariances (off-diagonal terms) using the horizontal and vertical error correlation lengths of 450 and 1.7 km, respectively (Fig. S3). We update this matrix at each assimilation time step by , where I is the identity matrix.
R is the observation error covariance matrix, including the contributions from the measurement error and the representativeness error. Since the horizontal resolution of all synthetic observations (GEMS, LEO satellite, and surface observations) is much finer than that of the model, we apply a super-observation approach to produce more representative data and reduce the horizontal observation error correlations (Miyazaki et al., 2012; Ma et al., 2019). A super-observation is generated by averaging all the observations (including errors and averaging kernels) within the same 0.5∘ latitude × 0.625∘ longitude GEOS-Chem model grid. Thus, R is assumed to be diagonal; that is, the observation errors are not correlated. For satellite measurements, the observation error (i.e. solution error from Sect. 2.2) is determined during the retrieval procedure and reduced by the square root of the number of observations averaged over each GEOS-Chem grid square (Zoogman et al., 2014; Shu et al., 2022). We assume zero representation error since the synthetic satellite observations are spatially dense. For surface measurements, we reduce more than 3000 surface monitoring sites to 725 super-observation grids and then randomly select 80 % of these super-observations for assimilation and 20 % for validation (Fig. S4). The measurement error ε0 is assumed to be 4 % for ozone, according to officially released documents from the CNEMC (HJ 193–2013 and HJ 654–2013, available at http://www.cnemc.cn/jcgf/dqhj/, last access: 1 March 2023) following Kong et al. (2021). The representativeness error is parameterized as proposed by Elbern et al. (2007):
where Δx is the model resolution (∼56 km), and L represents the characteristic representativeness length of the surface stations and is set as 2 km due to the lack of observation site information. ϵabs represents the error characteristic parameters (1.2 for ozone) according to Elbern et al. (2007). Finally, the total observation error εt is defined as
To distinguish the impact of assimilated observations and assimilation time step on the performance, we conduct nine data assimilation experiments (Table 1). We assimilate daytime synthetic GEMS, surface, and LEO satellite observations at 1 or 3 h time steps individually or simultaneously. We use the mean bias error (MBE), mean absolute error (MAE), root-mean-square error (RMSE), and correlation coefficient (r) to assess the assimilation performance in reproducing surface and tropospheric ozone relative to the “true” atmosphere.
Table 1Configuration of data assimilation experiments.
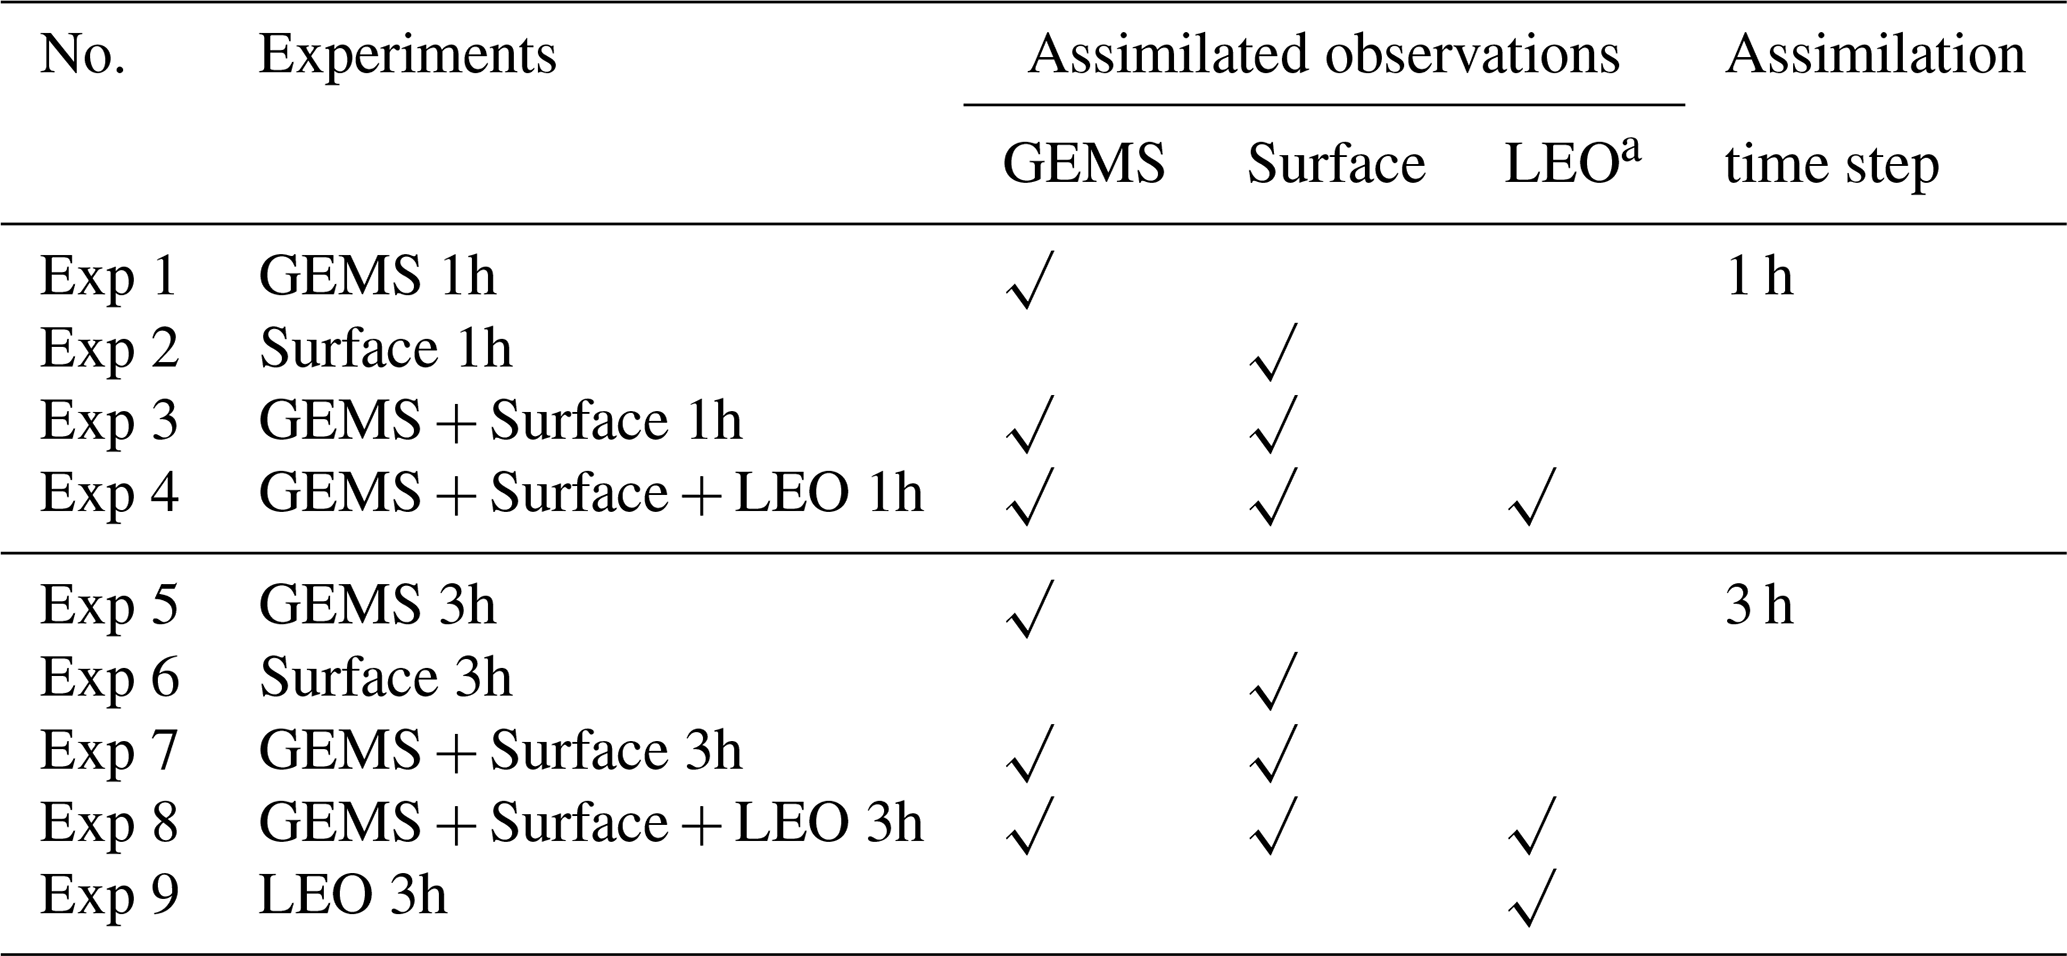
a LEO observations are assimilated when available.
3.1 Improved simulations of surface ozone
Our analysis starts with evaluating the benefit of multiple ozone observations on surface ozone simulations. Figure 4 compares the surface MDA8 ozone concentrations and the frequency of high-ozone days (hereafter defined as surface MDA8 ozone >80 ppbv) in June 2020 between the “true” atmosphere and GEOS-Chem simulations without assimilation (a priori) and with assimilation (a posteriori) of synthetic GEMS, surface, and LEO satellite observations at 1 h time steps (Exp 1–4). Compared to the “true” atmosphere, the GEOS-Chem a priori is biased low (−2.1 ppbv for regional mean bias) and performs poorly in capturing excessive ozone. In the “true” atmosphere, the frequency of high-ozone days is found to be ∼1.79 d on average over the Asian domain, with recurrent ozone exceedance in eastern China, the Tibetan Plateau, and northern India. However, the a priori only captures 0.2 high-ozone days per grid square per month with weak spatial correlation (r=0.51). The individual or simultaneous assimilation of GEMS and surface observations effectively corrects the negative MDA8 ozone bias (dropping from 2.1 to 0.2–1.2 ppbv) and better captures ozone exceedance (increasing to 0.46–0.75 d). We also observe an improved spatial pattern of simulated ozone against the “true” atmosphere, with r increasing by 0.01–0.05 for MDA8 ozone concentrations and by 0.07–0.23 for high-ozone days.
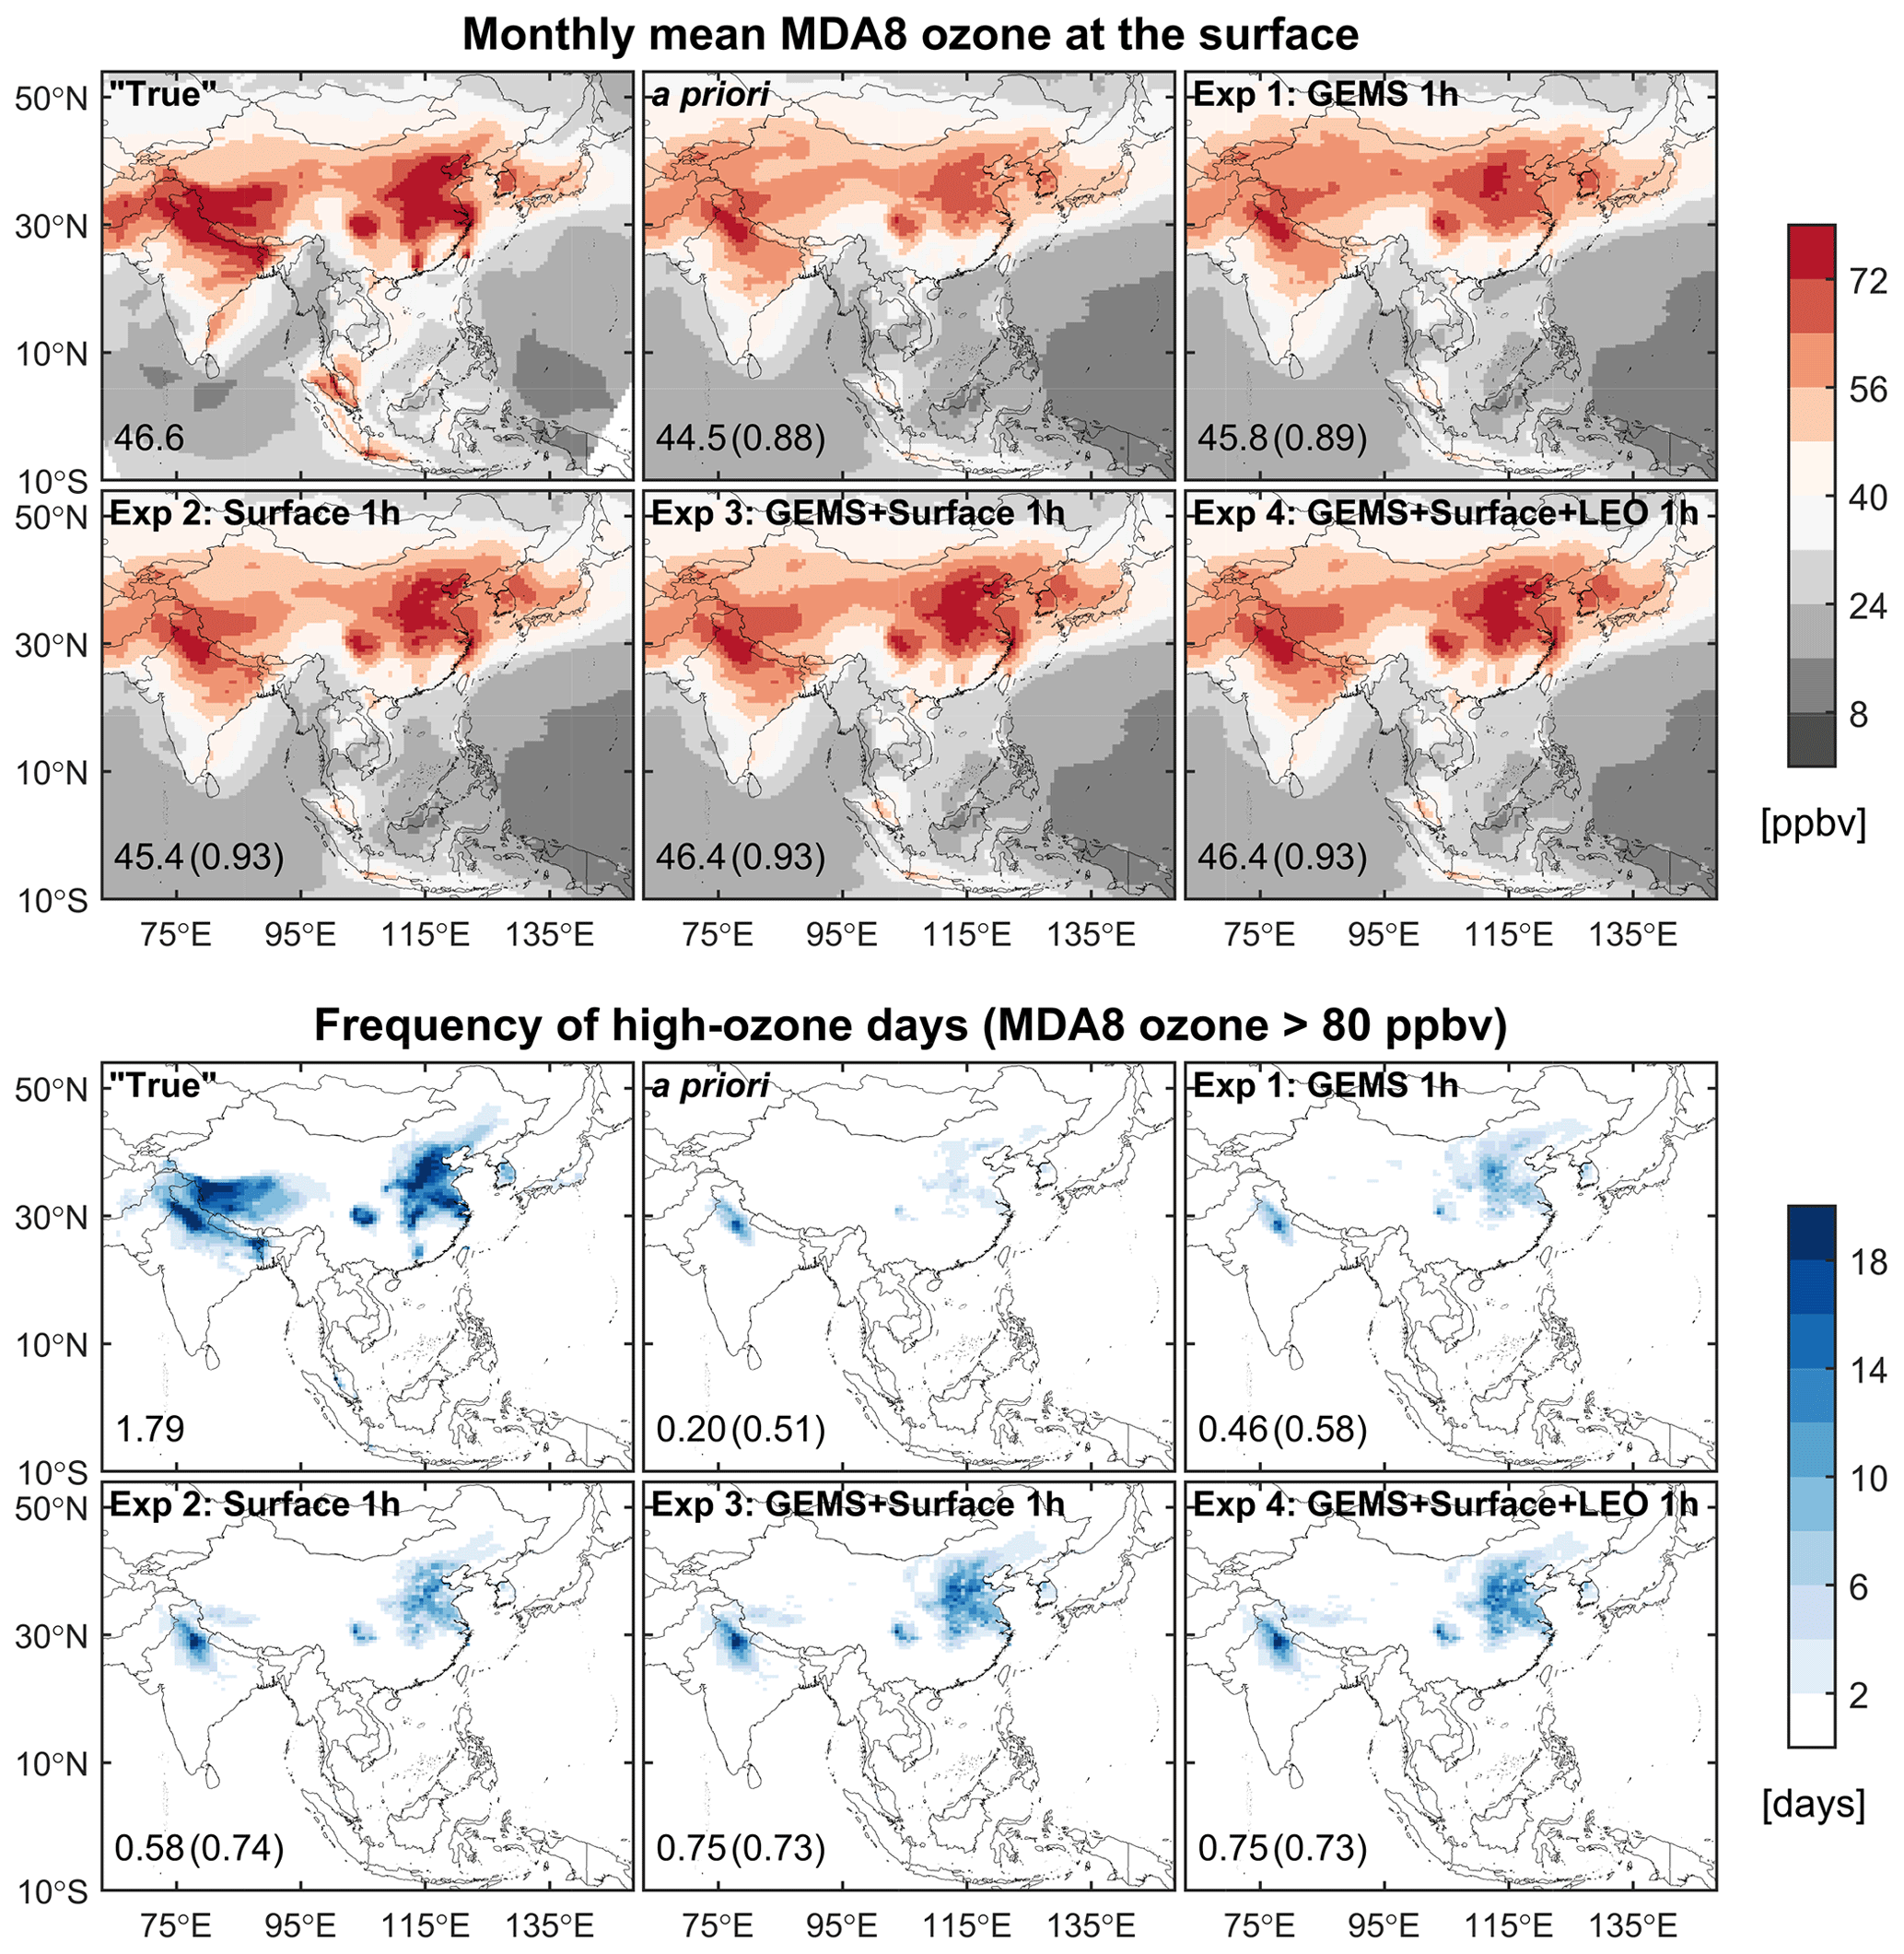
Figure 4Monthly mean daily maximum 8 h average (MDA8) ozone at the surface and the frequency of high-ozone days (defined as surface MDA8 ozone exceeding 80 ppbv) for June 2020 over the Asian domain, as simulated by the nature run (“True”), the control run (a priori), and four assimilation runs (Exp 1–4 in Table 1). The domain-averaged value over the land is inset. For the control run and assimilation runs, the spatial correlation coefficients relative to the nature run are also inset in parentheses.
On the whole, the added value of GEMS measurements (Exp 1) to surface ozone simulations is smaller but non-negligible compared to that of surface observations (Exp 2), while the simultaneous assimilation of GEMS and surface data (Exp 3) provides the best performance among these assimilation runs. On that basis, we further discover that the addition of the LEO instrument (Exp 4) may not provide new valuable information to constrain surface ozone beyond GEMS and surface observations (Exp 3), as similarly indicated in Zoogman et al. (2014) because OMI and GEMS have similar spectral information on surface ozone.
To investigate the influence of assimilation frequency, we perform four sensitivity experiments with a longer assimilation time step of 3 h (Exp 5–8, Fig. S5). We find that additional assimilation of LEO measurements (Exp 8) decreases the mean bias from −0.8 to −0.4 ppbv and improves the prediction of high-ozone days from 0.49 to 0.57 d with a stronger spatial correlation (r increases by 0.05) beyond GEMS and surface data (Exp 7). This highlights the importance of the LEO instrument in constraining surface ozone when observations from other platforms are inadequate for assimilation. Furthermore, we conduct an additional experiment that only assimilates LEO measurements (Exp 9, Fig. S6). Compared to LEO satellite observations, the individual assimilation of GEMS observations (Exp 5, Fig. S5) provides more added value for monitoring surface ozone in East Asia and Southeast Asia due to the stronger sensitivity to surface ozone and smaller retrieval errors (Figs. 1 and 2), especially more effectively diagnosing the ozone exceedance in eastern China, while making little corrections to simulated surface ozone in South Asia owing to the limited coverage over this region (Fig. 1). However, this inability of GEMS observations to correct ozone bias in South Asia could be addressed by additionally assimilating surface observations (Exp 7, Fig. S5). As such, the use of joint assimilation is essential to efficiently enhance the information of GEMS and surface observations to constrain surface ozone simulations.
Considering the heterogeneous spatial corrections made to surface ozone in Asia after data assimilation, which is likely a cause of the space layout of the observing system, we thereby review the statistics for 18 designated Asian countries (Fig. 5). We show the reduction in MAE and RMSE and the difference in the spatial correlation coefficient between GEOS-Chem simulations with and without data assimilation relative to the “true” atmosphere. We rule out the assimilation experiments involving the LEO instrument considering its insignificant impacts on surface ozone simulations, as discussed above.

Figure 5The MAE reduction (a), RMSE reduction (b), and the difference in the spatial correlation coefficient (c) of simulated surface ozone between the assimilation run and the control run relative to the nature run for June 2020 in 18 Asian countries.
Taking the assimilation runs with a 1 h assimilation time step (Exp 1–3) as an example, our analysis confirms that the joint assimilation of GEMS and surface data has the best performance in more than half of the Asian countries, with MAE reduced by 7 %–74 % (except for North Korea and Myanmar) and RMSE reduced by 5 %–69 % (except for Japan, North Korea, and Myanmar) in simulated ozone. In Southeast Asia, the improvements are almost spatially consistent with RMSE reduced by 17 %–42 % in most countries when concurrently assimilating GEMS and surface data, especially notably in Cambodia, Vietnam, and the Philippines (by 31 %–42 %). Meanwhile, the data assimilation results including only GEMS observations (Exp 1) and with the addition of surface observations (Exp 3) have comparable performance in some regions (e.g. the Philippines, Indonesia, and Vietnam), revealing the dominant role of GEMS rather than surface observations in improving surface ozone simulations as a result of the sparse surface network (Fig. 3). In comparison, we may relate the elevated benefit of surface observations beyond GEMS on ozone simulations in some countries, like Thailand and Laos, to the propagation of information from more dense surface observations in East Asia through transboundary transport.
In East Asia, we observe a steady improvement in the spatial correlation of simulated ozone (e.g. by up to 0.08 in China) relative to the “true” atmosphere after assimilating surface observations individually (Exp 2) or in combination with GEMS data (Exp 3). Specifically, in China, the improvements in ozone simulations between these two simulations are quantitatively close, with a reduction of ∼ 32 %–35 % in MAE and RMSE. In comparison, here we extend the investigation to eastern China with a higher density of surface observations (Fig. S7) and observe that the joint assimilation has the best performance for improving surface ozone simulations, contributing to a more significant reduction of 52 % and 46 % in MAE and RMSE, respectively. However, the influence of assimilation efforts is complicated in East Asia, such as in Japan and Mongolia where the a priori ozone and its bias are relatively low. In this case, adding the synthetic GEMS observations results in a slight deterioration of simulated ozone and even counteracts the positive impact of surface observations when performing the joint assimilation. We attribute this partly to the improper specification of model errors and the spatial spread of observational information via transboundary transport.
In South Asia, we observe limited improvements in surface ozone simulations in India, Nepal, Bangladesh, and Sri Lanka introduced by GEMS due to the lack of observations (Fig. 1). Thus, surface observations provide almost all the information to correct ozone bias when assimilating surface data individually (Exp 2) or with additional GEMS data (Exp 3), where we detect an MAE and RMSE reduction of 7 %–52 % and 5 %–49 %, respectively. Differently, GEMS could provide meaningful information to track ozone in Bhutan (RMSE reduced by over 70 %), located within its observational field. We neglect here the slightly worsened spatial pattern of simulated ozone in Bhutan, mainly resulting from the spatially scattered and sparse model grids, as observed in Vietnam, Cambodia, and Malaysia.
We reach similar conclusions when expanding our analysis to the other assimilation runs with a longer assimilation time step of 3 h (Exp 5–7). In general, we find that the spatial coverage of multiple observations and the spatial spread of observational information via transboundary transport would significantly influence the assimilation performance, resulting in unequally distributed improvements in surface ozone simulations over Asia. The intercomparison of these two groups of experiments further shows that the assimilation of GEMS observations individually or in combination with surface data at 3 h time steps could achieve comparable performance in some regions (e.g. Laos and Vietnam) relative to experiments assimilating all observations at 1 h time steps. This implies the feasibility of reducing the number of assimilated observations in actual applications to improve computational efficiency.
GEMS will provide continuous daytime measurements of tropospheric ozone profiles, thus the capability of geostationary observations through data assimilation to monitor the hourly variations of surface ozone is of particular interest. Figures 6 and S8 present the diurnal and daily variations of surface ozone at validation grids (Fig. S4), respectively. Overall, the joint assimilation of GEMS and surface observations (Exp 3) shows the best performance in reproducing the temporal variability of simulated surface ozone (Figs. 6a and S8a), with the smallest bias and RMSE, especially in the late afternoon (Fig. 6b and c) and on high-ozone days (Fig. S8b and c). Notably, it adds more valuable information to constrain ozone for the time period of 03:00–11:00 (03:00–08:00) UTC than the individual assimilation of GEMS (surface) measurements, principally depending on the temporal coverage of these observations. Besides, the a priori shows an average temporal correlation coefficient (r) of 0.55 in simulated hourly ozone relative to the “true” atmosphere. Individually assimilating GEMS data (Exp 1) makes limited corrections to this correlation, which is in sharp contrast to the enhanced temporal correlation from the data assimilation results including only surface data (Exp 2) and with additional GEMS data (Exp 3), improving the average of r to 0.72 and 0.70, respectively (Fig. 6d).
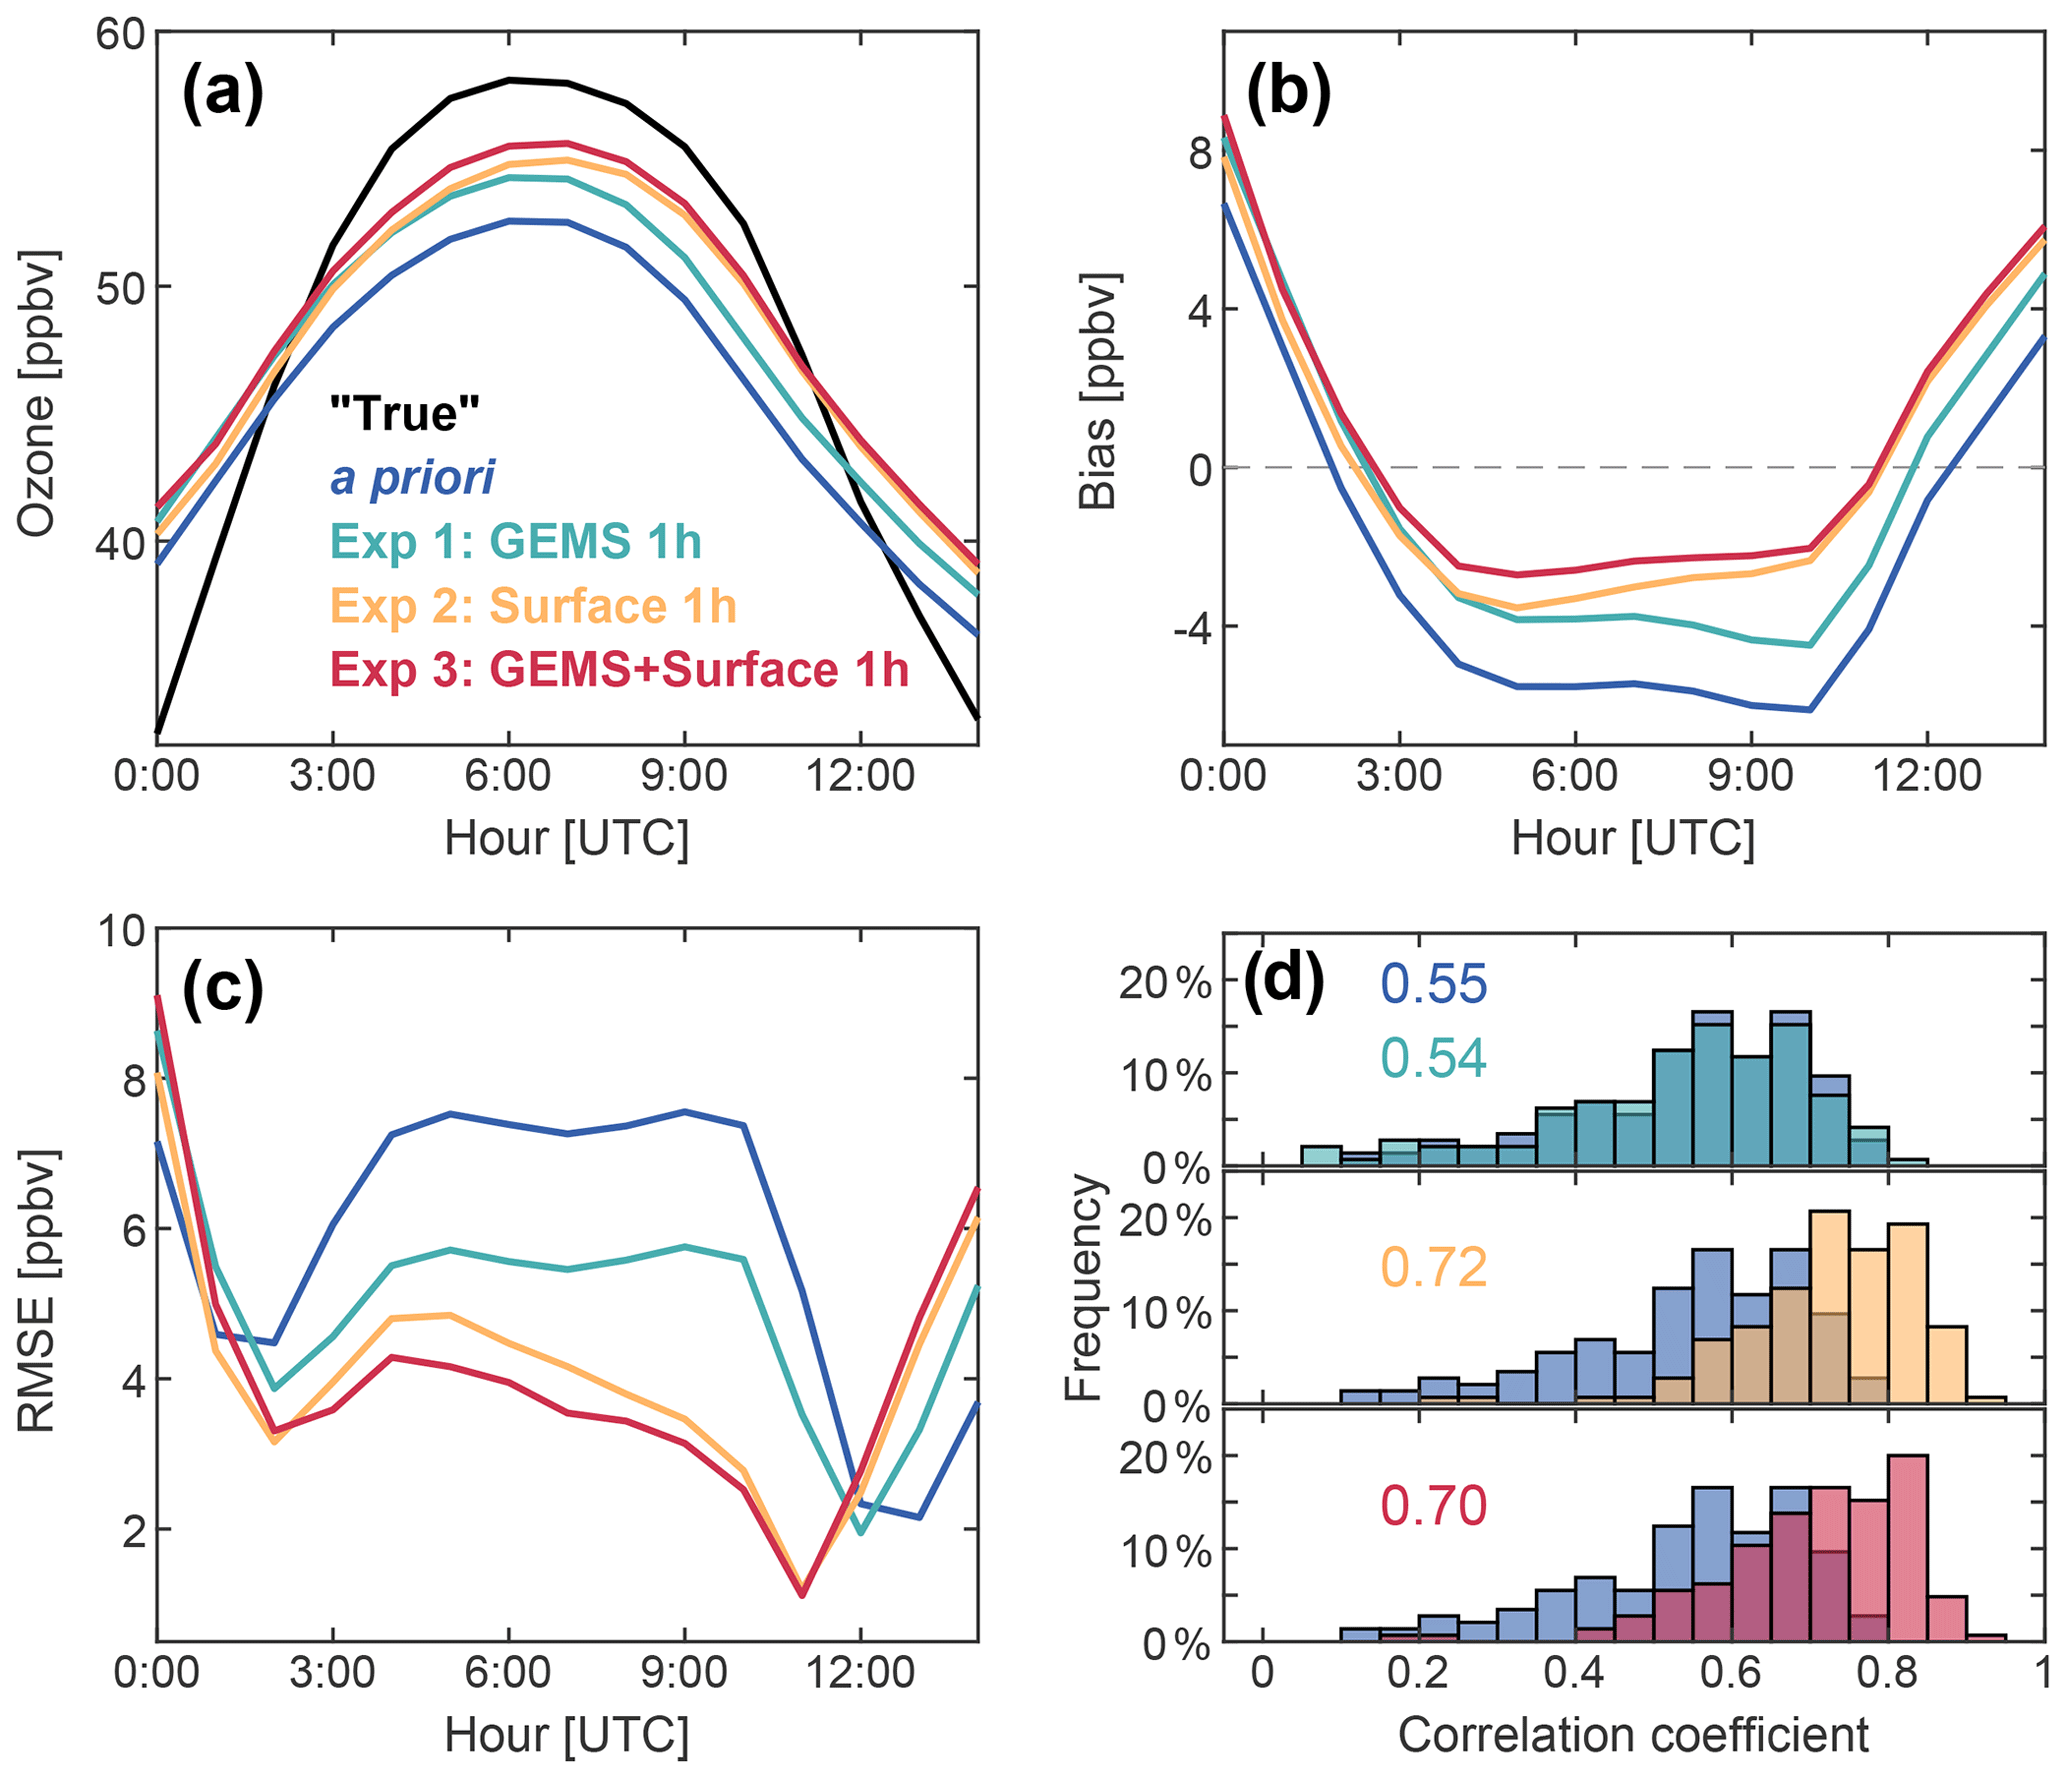
Figure 6Comparison of the averaged diurnal cycle of (a) surface ozone, (b) mean bias, and (c) RMSE, as well as (d) the histogram (in percentage) of the temporal correlation coefficient of hourly ozone at validation grids (Fig. S4), as simulated by the control run (a priori, in blue) and three assimilation runs (Exp 1–3 in Table 1, in green, yellow, and red, respectively) relative to the nature run (“True”, black line in a) for June 2020. In (d), the green, yellow, and red bars respectively represent the frequency (%) of the temporal correlation coefficient of simulated ozone between the three assimilation runs (Exp 1–3) and the nature run, which is in comparison to that of the control run (in blue). The blue bars are the same in the three sub-panels to better illustrate the improvements in the temporal correlation of simulated ozone relative to the control run. The mean values of the temporal correlation coefficient (coloured the same as lines in a) at all validation grids are inset.
To test the value of multiple ozone observations for short-term ozone forecasts, we conduct a series of 72 h forecasts, each initialized at 06:00 UTC from 1 to 27 June 2020 (not shown). The 27 forecasting experiments are conducted using the concentration analysis from Exp 3 as the chemical initial conditions. Our results suggest no substantial improvement in the short-term ozone forecasts, as evidenced in Fig. 6c. Note that the adjustments in simulated ozone vanish rapidly after 11:00 UTC without new observations assimilated, leading to a spiked increase in ozone RMSE. We attribute this to the unimplemented optimization of ozone precursors (Timmermans et al., 2019). Further efforts concerning the simultaneous optimization of the chemical initial conditions and ozone precursor emissions (NOx and VOCs) are essential to improve the short-term ozone forecasts (Ma et al., 2019; Peng et al., 2018).
3.2 Improved simulations of tropospheric ozone profiles
Next, we evaluate to what extent tropospheric ozone profile simulations may benefit from the individual or simultaneous assimilation of multiple ozone observations. Figure 7 displays the simulated ozone profiles averaged over the Asian domain and three specified subregions, i.e. East Asia, Southeast Asia, and South Asia (defined in Fig. 1). Figure 8 further compares the MDA8 ozone concentrations at three vertical levels, i.e. 200, 500, and 700 hPa, representing the upper, middle, and lower troposphere, respectively. Here we focus on two assimilation runs using a 3 h assimilation time step (Exp 7 and 8) to pinpoint the added value of the LEO instrument for tropospheric ozone simulations. See Figs. S9 and S10 for the assimilation runs using a 1 h time step (Exp 3 and 4).
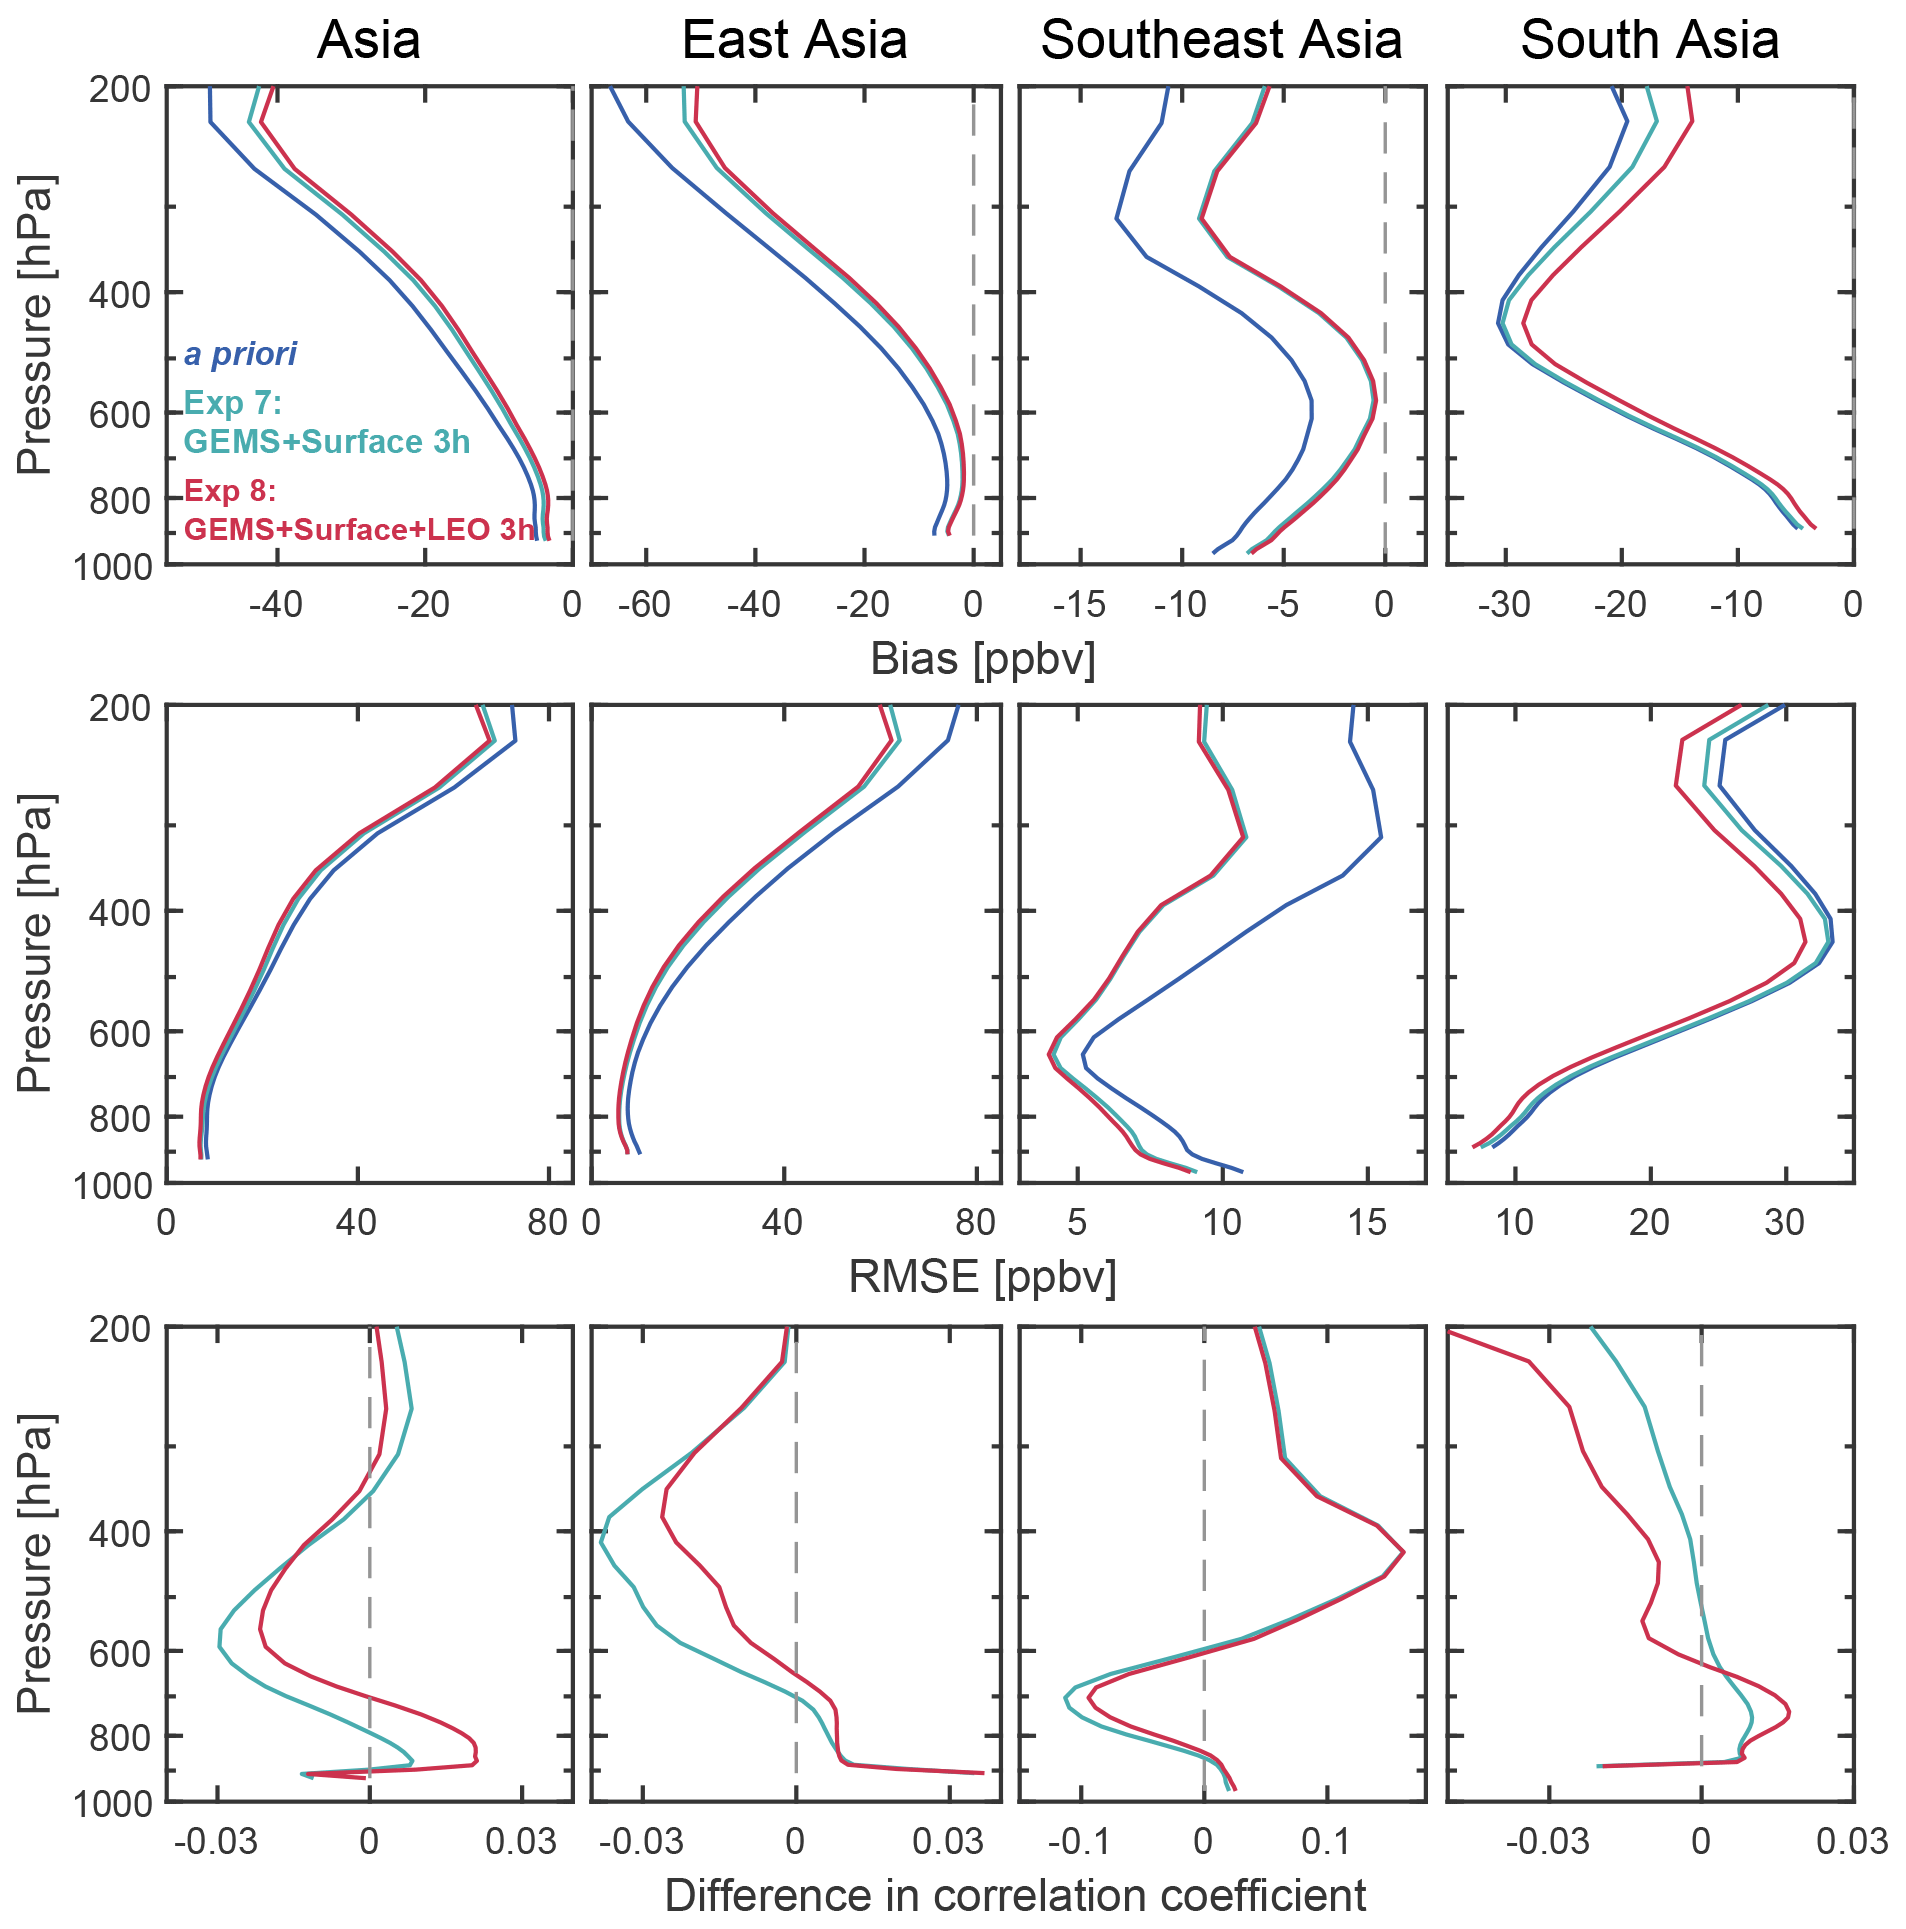
Figure 7Ozone MBE (top panels), RMSE (middle panels), and the difference in the spatial correlation coefficient (assimilation run minus control run, bottom panels) relative to the nature run for June 2020 over the Asian domain, East Asia, Southeast Asia, and South Asia (defined in Fig. 1), as simulated by the control run (a priori) and two assimilation runs (Exp 7 and 8 in Table 1).
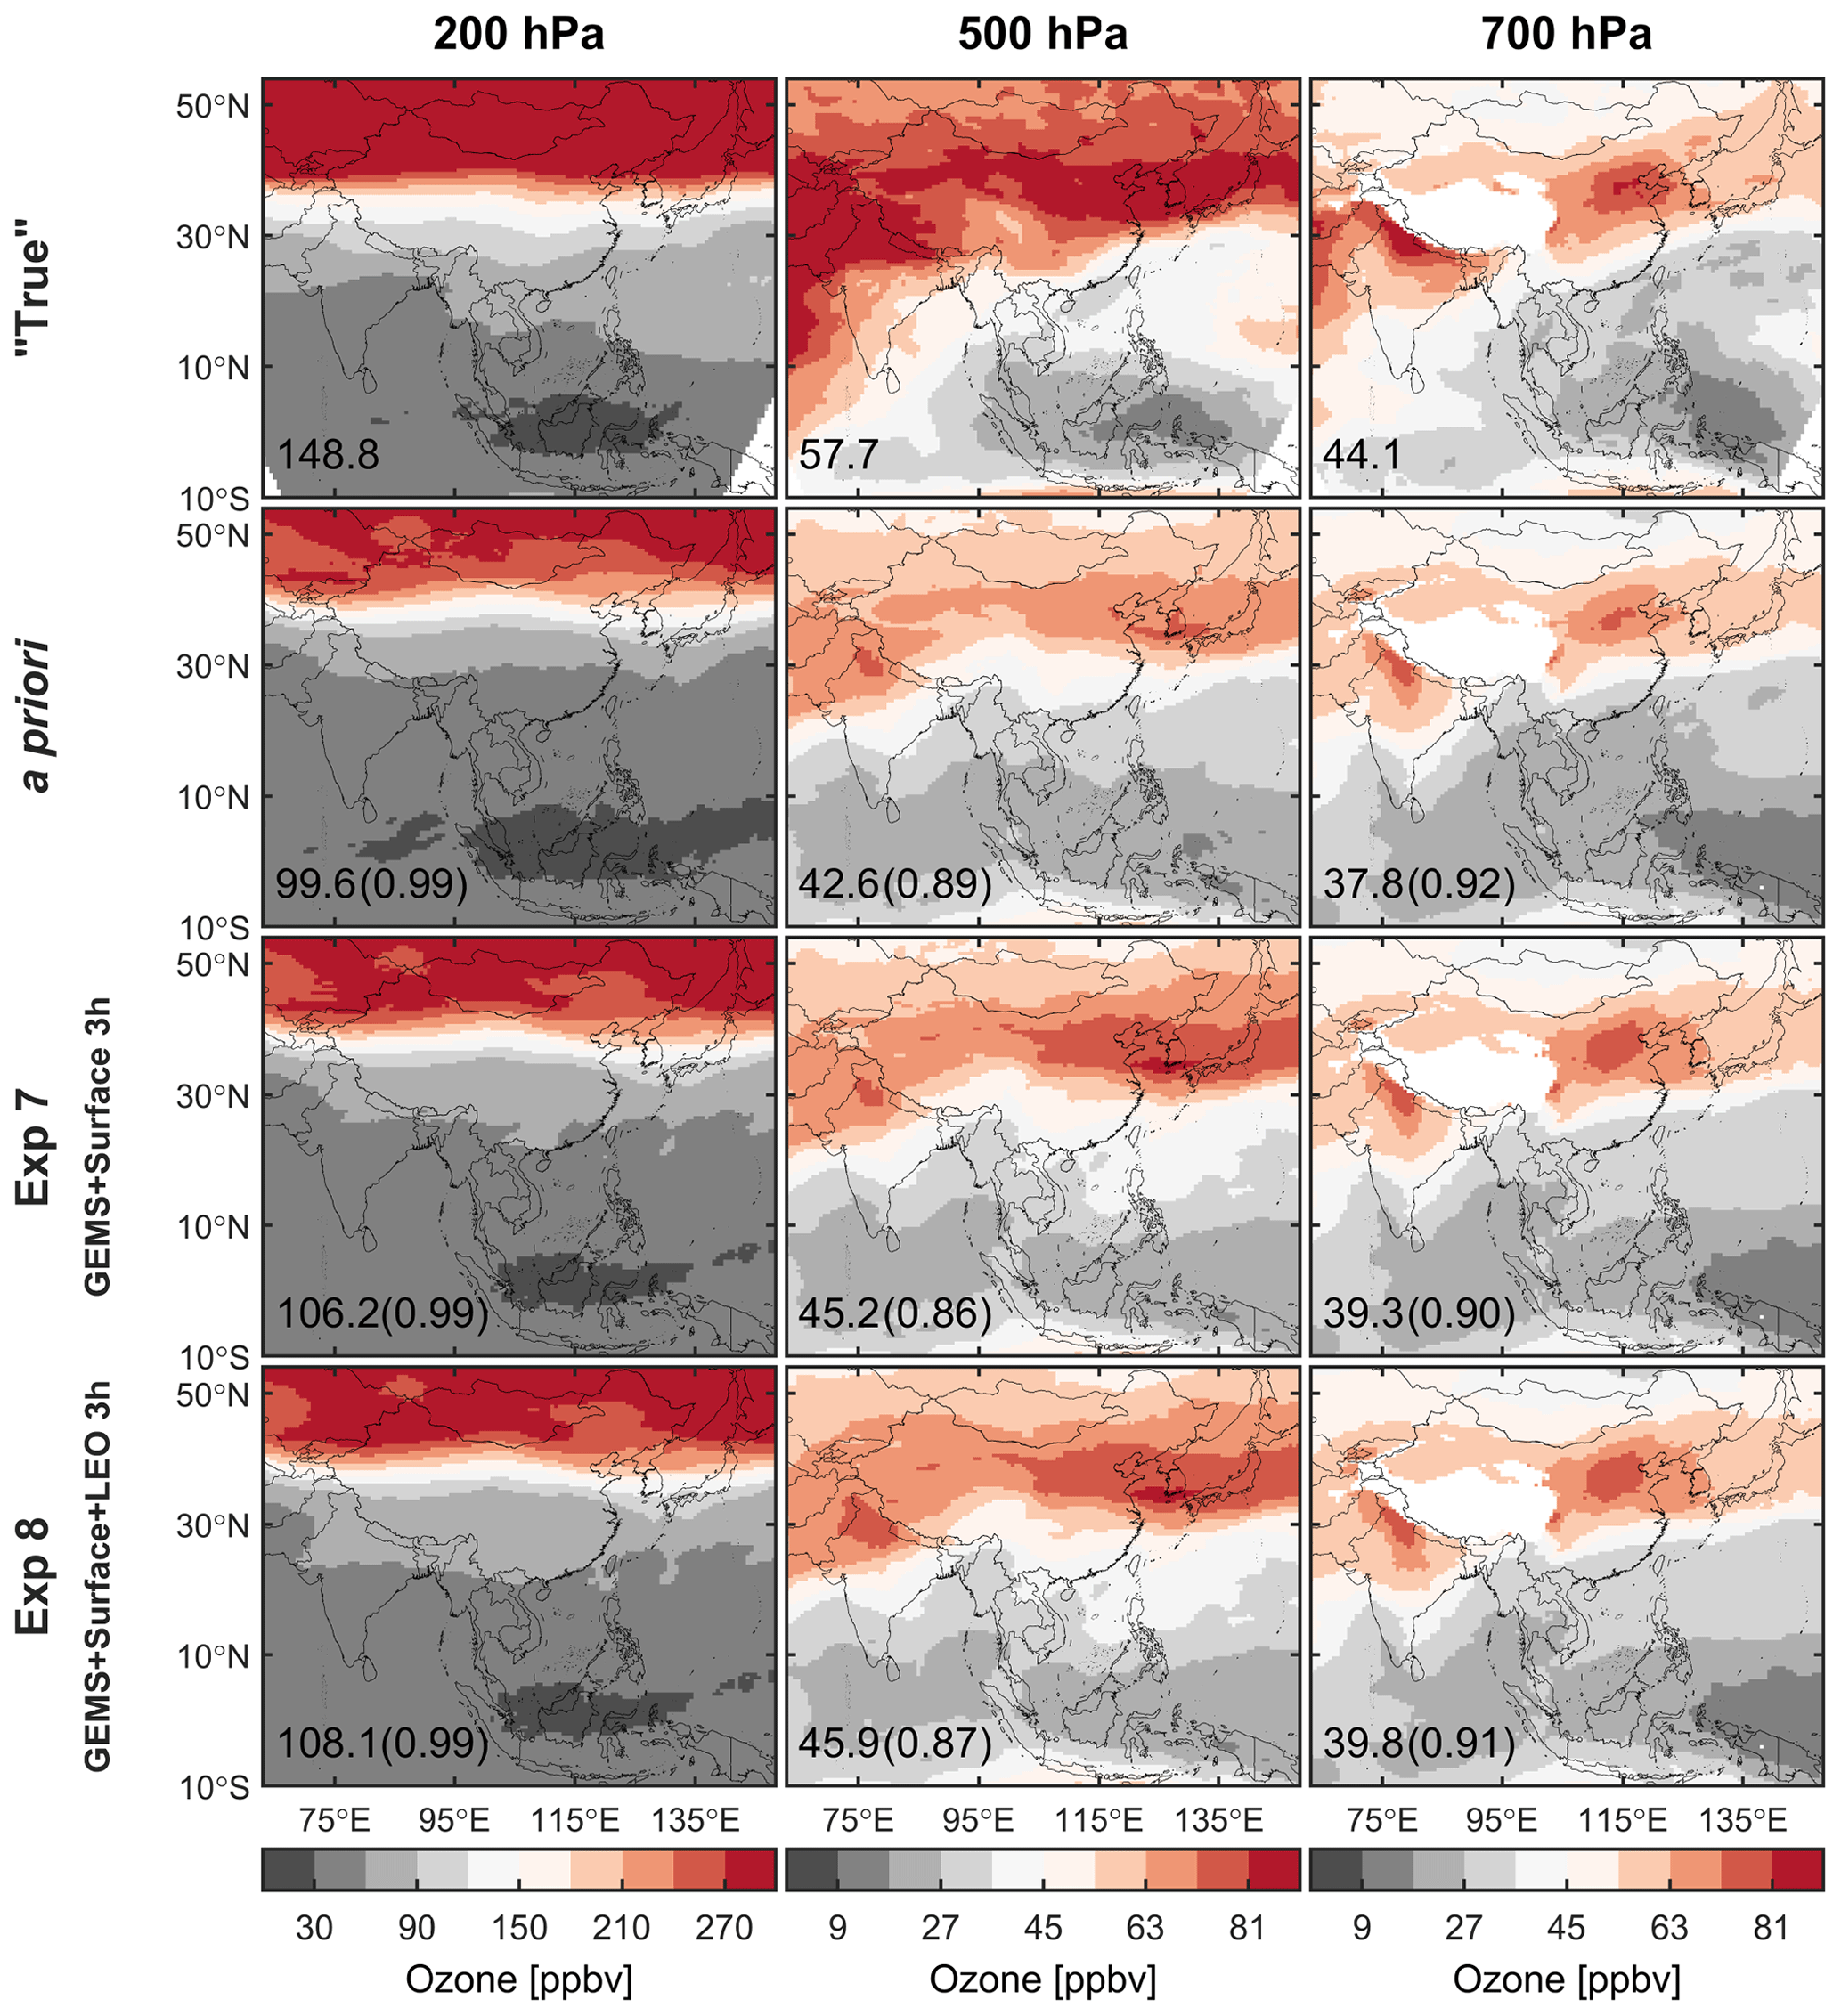
Figure 8Monthly mean MDA8 ozone at 200 (left panels), 500 (middle panels), and 700 hPa (right panels) for June 2020 over the Asian domain, as simulated by the nature run (“True”), the control run (a priori), and two assimilation runs (Exp 7 and 8 in Table 1). The domain-averaged value is inset. For the control run and assimilation runs, the spatial correlation coefficients relative to the nature run are also inset in parentheses.
Compared with the “true” atmosphere, the a priori tends to underestimate ozone from the surface to the upper troposphere over all the specified regions (Fig. 7). The data assimilation greatly removes the negative bias and large RMSE, with more obvious improvement in the middle to upper troposphere, especially in Southeast Asia. Data assimilation results without (Exp 7) and with (Exp 8) the addition of the LEO instrument suggest that GEMS observations may have masked the added value of LEO measurements for the whole Asian domain as well as East Asia and Southeast Asia, with a tiny discrepancy in improving ozone vertical distributions. This is also demonstrated by the comparison of tropospheric ozone profiles between two assimilation runs that only assimilate GEMS or LEO observations (Exp 5 and 9, Fig. S11), where we see that the individual assimilation of GEMS data contributes to a more apparent bias and RMSE reduction in East Asia and Southeast Asia. On the contrary, the LEO measurements add valuable corrections to the upper tropospheric ozone simulations over South Asia (Fig. 7) where GEMS observations are unavailable (Fig. 1). In addition, the changes in the spatial correlation (varying from −0.05 to 0.04) of simulated ozone relative to the “true” atmosphere in East Asia and South Asia are relatively small, showing a weakened spatial correlation in the middle to upper troposphere (above 600 hPa). On a regional scale, in contrast, the data assimilation slightly increases the spatial correlation at the upper layers above ∼350 hPa over Asia. This improvement is predominantly due to the greatly improved ozone simulations in Southeast Asia in the middle to upper troposphere, where an enhancement by up to ∼0.16 in the spatial correlation is broadly distributed.
Vertically, our results show that the a priori is consistently biased low relative to the “true” atmosphere, with a regional mean difference of −49.2, −15.1, and −6.3 ppbv at 200, 500, and 700 hPa, respectively. Jointly assimilating GEMS and surface observations (Exp 7) contributes to an apparent bias reduction of 6.6, 2.6, and 1.5 ppbv at the three levels, respectively (Fig. 8). On that basis, the application of the LEO instrument (Exp 8) adds extra information to constrain ozone, with a superimposed bias reduction of 1.9, 0.7, and 0.5 ppbv, respectively. Particularly, the LEO measurements bring more practical corrections to ozone simulations in South Asia (e.g. northern India at 500 hPa), as discussed above. In comparison, we obtain a comparable performance (bias decreased by 7.2, 2.7, and 1.7 ppbv, respectively) from the joint assimilation of all GEMS and surface data (Exp 3) at 1 h times steps (Fig. S10), however, with no substantial corrections when further assimilating LEO satellite data (Exp 4). This result is consistent with that for surface ozone simulations, that is, the application of all available GEMS observations may mask the direct added value of LEO instrument for tropospheric ozone simulations. Here we neglect the small changes in the spatial pattern of simulated ozone, given that satellite measurements do not fully cover the Asian domain.
Figure 9 compares the RMSE reduction in simulated ozone at 200, 500, and 700 hPa for the six assimilation runs in 18 Asian countries. Here we rule out the experiments that individually assimilate surface or LEO satellite data (Exp 2, 6, and 9). At 200 hPa, our analysis reveals a robust improvement in ozone simulations for almost all the countries relative to the “true” atmosphere from all assimilation experiments. We see an RMSE reduction of 33 %–57 % in most of Southeast Asia (except for Malaysia and Indonesia), 7 %–31 % in East Asia, and 4 %–81 % in South Asia. These results are generally in line with our previous work (Shu et al., 2022), which reports an RMSE reduction of 18 %–49 % between 200–300 hPa after assimilating GEMS data individually, particularly with a better performance at low latitudes.
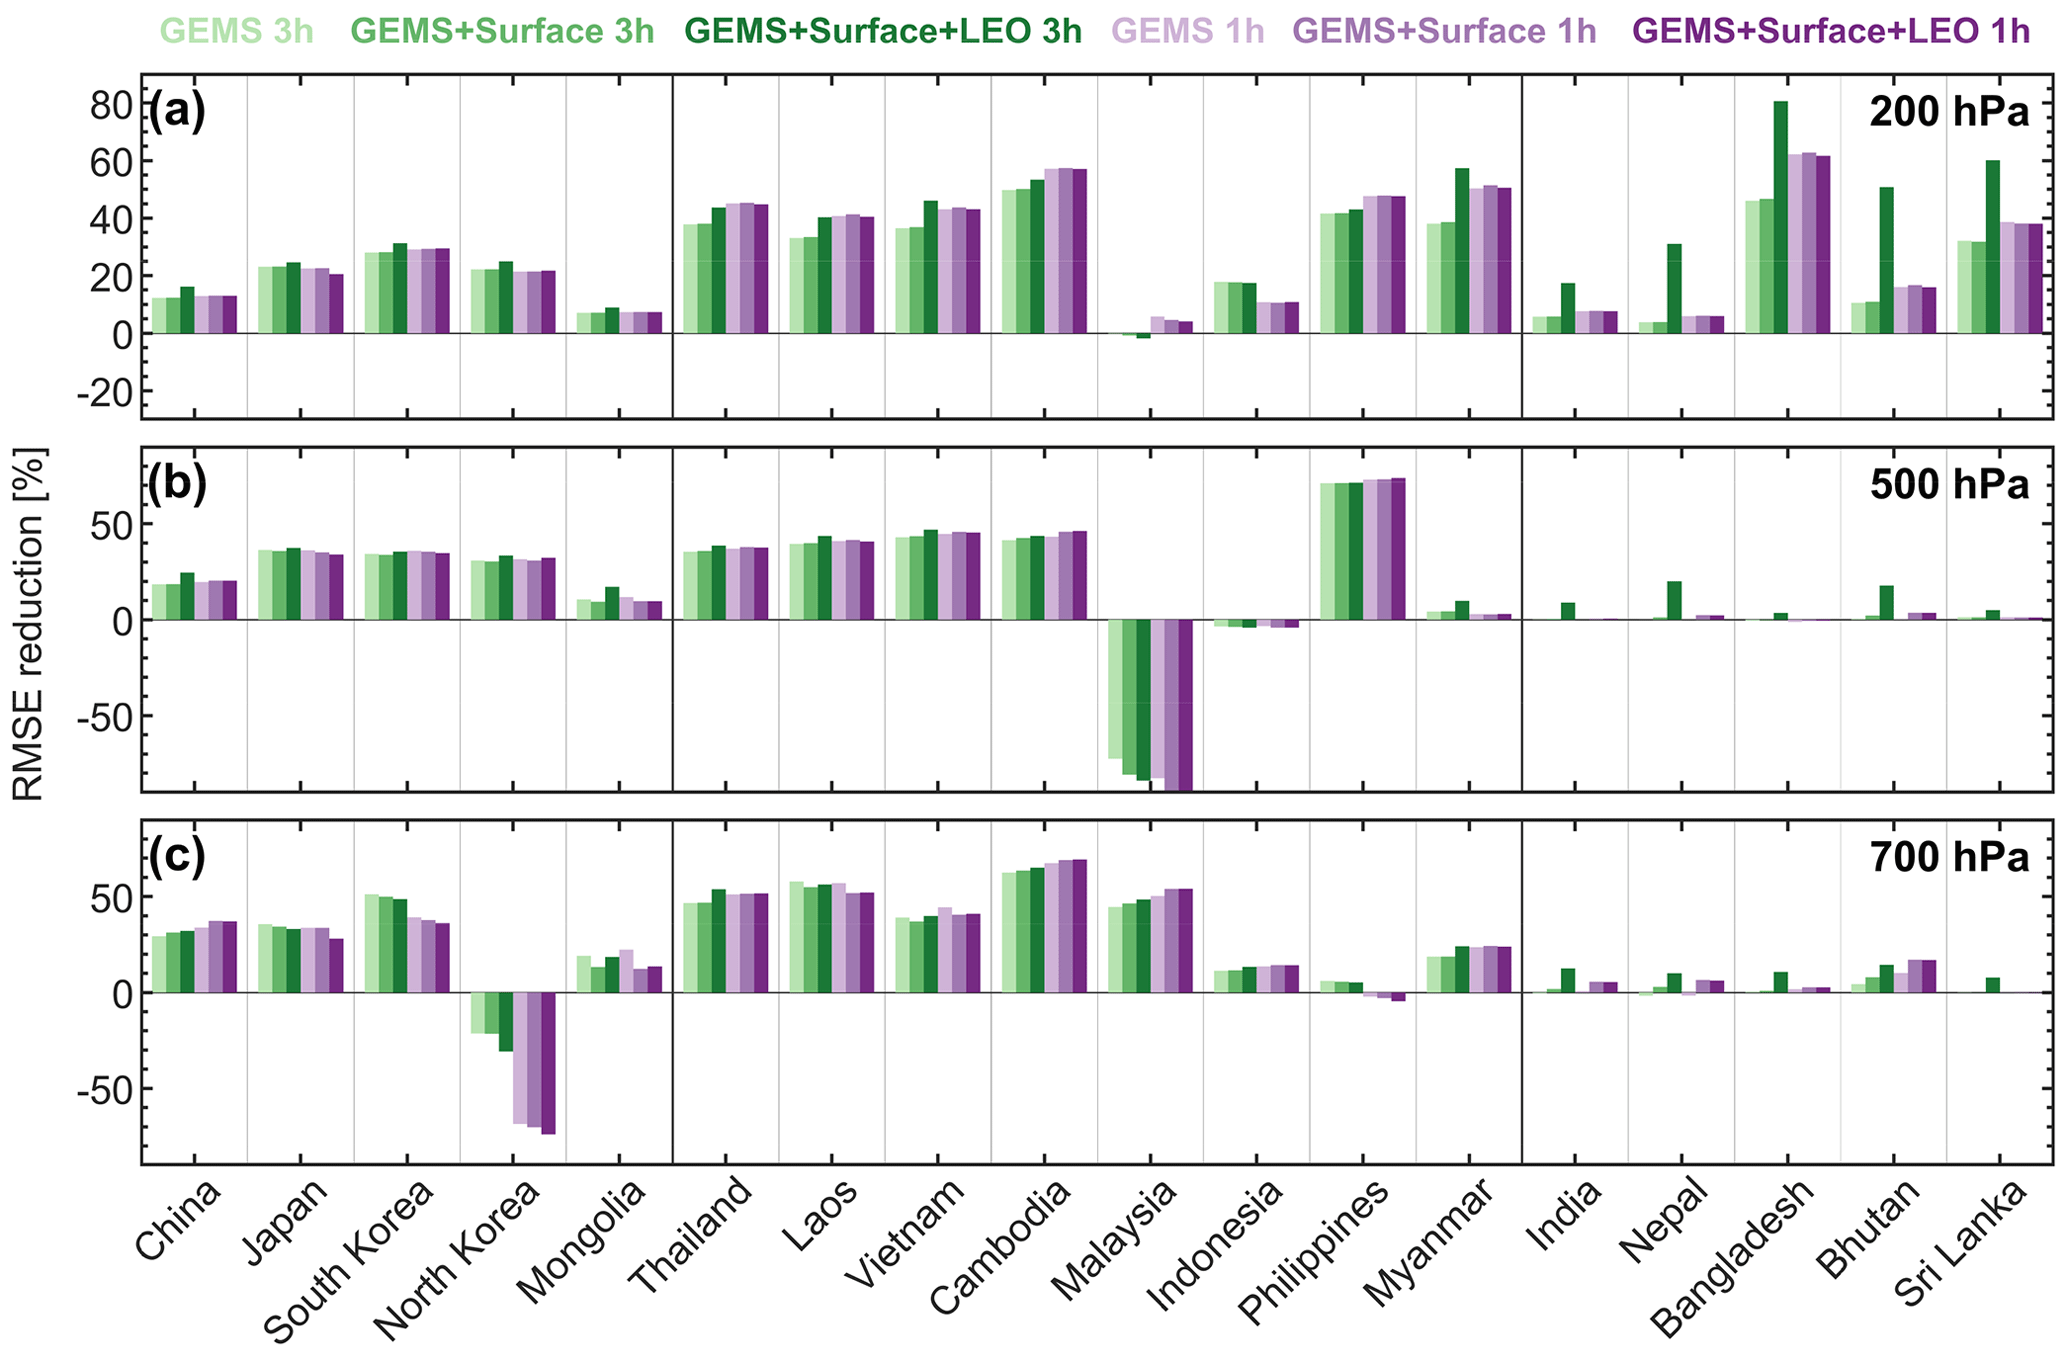
Figure 9The RMSE reduction in simulated ozone at 200 (a), 500 (b), and 700 hPa (c) between the assimilation run and the control run relative to the nature run for June 2020 in 18 Asian countries.
The performance of these six assimilation experiments is roughly comparable for East Asia and Southeast Asia, whereas the joint assimilation of synthetic observations at 3 h time steps (Exp 8) contributes to the most significant improvement (e.g. RMSE decreased by >80 % in Bangladesh) in ozone simulations in South Asia. This is also observed at 500 and 700 hPa, excluding the limited improvement in simulated ozone in South Asia after data assimilation except for Exp 8. We suggest the closer agreement in simulated ozone against the “true” atmosphere in South Asia that is only observed at 200 hPa is primarily attributable to the stronger retrieval sensitivities and smaller observation errors of satellite measurements (Figs. 1 and 2), as well as the spatial propagation of information as a result of the much more significantly improved tropospheric ozone simulations in Southeast Asia and East Asia.
At 500 hPa, the data assimilation contributes to an RMSE reduction of 30 %–37 % in Japan, South Korea, and North Korea, which is more evident than that in China and Mongolia (9 %–25 %). In comparison, the improvements are much more unequally distributed in Southeast Asia. We see a higher RMSE reduction of up to 74 % in simulated ozone in the Philippines, followed by Thailand, Laos, Vietnam, and Cambodia (35 %–47 %). However, the assimilation also results in worse ozone simulations in regions like Malaysia and Indonesia.
At 700 hPa, there is a significant RMSE reduction of 37 %–69 % in most of Southeast Asia (except for Indonesia, the Philippines, and Myanmar), which is more prominent than that of East Asia (by 12 %–51 % except for North Korea). Moreover, it is important to note here that the additional assimilation of surface data (Exp 3) beyond GEMS (Exp 1) adds slightly visible corrections to ozone in some areas (e.g. China, Cambodia, and Malaysia), while it offsets the positive effect of GEMS measurements and therefore leads to a weakened improvement in ozone simulations in regions like Mongolia, Laos, and Vietnam. This illustrates the vertical propagation of information from surface observations to upper atmospheric layers.
We have applied two independent chemical transport models (GEOS-Chem and WRF-Chem) through a robust OSSE to investigate how the assimilation of multiple ozone observations (GEMS, surface, and LEO satellite observations), individually or in combination, would benefit the surface and tropospheric ozone simulations in summer over Asia.
For surface ozone simulations, the individual or joint assimilation of GEMS and surface observations reduces the simulation biases and improves the monitoring of ozone exceedance, spatial patterns, and diurnal variations. In most cases, the added value of GEMS observations for improving surface ozone simulations is smaller but non-negligible compared to surface observations. The joint assimilation of these two kinds of observations provides the best performance, with the mean bias reduced from −2.1 to −0.2 ppbv, the modelled high-ozone days increasing from 0.20 to 0.75 d, and the temporal correlation coefficient increasing from 0.55 to 0.70. However, these improvements in surface ozone simulations are unequally distributed over Asia, generally with a reduction of 5 %–69 % in the RMSE in most countries. Specifically, we find that GEMS (surface) observations play a more critical role in constraining surface ozone in Southeast (South) Asia due to the sparse distribution (absence) of surface (GEMS) measurements.
For tropospheric ozone profile simulations, the use of GEMS observations in data assimilation results in a more accurate prediction of ozone vertical distributions, especially in the middle to upper troposphere at low latitudes. On a regional scale, jointly assimilating all GEMS and surface observations contributes to an apparent reduction of 7.2, 2.7, and 1.7 ppbv in the mean ozone bias at 200, 500, and 700 hPa, respectively. Similar to those at the surface, we observe an inequality in the improvements in tropospheric ozone simulations. The data assimilation adds the most noticeable corrections in ozone vertical distributions in Southeast Asia, exhibiting an enhanced spatial correlation of up to ∼0.16 in the middle to upper troposphere and an RMSE reduction of 33 %–74 % at the three vertical levels in most countries. In contrast, the assimilation performance has the largest spatial variability in South Asia, with RMSE reduced by 4 %–81 % at 200 hPa but no improvement achieved at the other two levels from most assimilation experiments.
The spatial coverage of assimilated observations, along with the spatial propagation of information from multiple observations, significantly influences the assimilation performance, resulting in unequally distributed improvements in surface and tropospheric ozone simulations over Asia. In most cases, the join assimilation of all available synthetic observations at 1 h time steps provides the best performance, whereas the assimilation experiments using a 3 h assimilation time step may have provided sufficient information in some cases, e.g. to constrain the surface ozone simulations in regions of Southeast Asia and the upper tropospheric ozone simulations in South Asia. Besides, sensitivity experiments also reveal the enhanced role of LEO measurements in improving surface and upper tropospheric ozone simulations, only when inadequate GEMS and surface observations are applied in data assimilation, especially in South Asia due to the absence of GEMS observations.
The improvements introduced by the multisource data assimilation using GEMS geostationary observations are promising, although the data assimilation experiments still have difficulty in fully reproducing the observed ozone features. As an extension of our preceding work (Shu et al., 2022), this study offers a comprehensive simulation reference for future ozone studies in Asia, acknowledging that the improvement in ozone simulations should be interpreted within the current OSSE framework. Further applications need to pay more attention to multiconstituent data assimilation to simultaneously optimize ozone and its precursor fields, including chemical initial conditions and emissions (Miyazaki et al., 2012, 2020b; Ma et al., 2019).
The GEOS-Chem model is available at https://doi.org/10.5281/zenodo.3974569 (The International GEOS-Chem User Community, 2020). The WRF-Chem model is available at https://www2.mmm.ucar.edu/wrf/users/download/get_source.html (NCAR, 2023). The OMI PROFOZ product is available at https://avdc.gsfc.nasa.gov/pub/data/satellite/Aura/OMI/V03/L2/OMPROFOZ/ (Aura Validation Data Center, 2023).
The supplement related to this article is available online at: https://doi.org/10.5194/acp-23-3731-2023-supplement.
LZ devised the conceptual ideas and supervised the findings of this work. LS provided and processed the data, conducted the investigation, performed formal analysis, and created the figures. LS, JB, and PZ developed the methodology. LS and JB contributed to the software. LZ, LS, and JB acquired the funding. LS drafted the original manuscript. LZ, JB, PZ, HH, SL, XL, SS, JL, YC, DP, XZ, WF, XY, and TMF reviewed and commented on the manuscript.
The contact author has declared that none of the authors has any competing interests.
Publisher's note: Copernicus Publications remains neutral with regard to jurisdictional claims in published maps and institutional affiliations.
This article is part of the special issue “GEMS: first year in operation (AMT/ACP inter-journal SI)”. It is not associated with a conference.
This work is supported by the Center for Computational Science and Engineering at the Southern University of Science and Technology.
This research has been supported by the Key-Area Research and Development Program of Guangdong Province (grant no. 2020B1111360001), Guangdong Basic and Applied Basic Research Foundation (grant no. 2021A1515110713), Guangdong Basic and Applied Basic Research Fund (grant no. 2020B1515130003), Guangdong University Research Project Science Team (grant no. 2021KCXTD004), Shenzhen Science and Technology Program (grant nos. KQTD20210811090048025, JCYJ20210324104604012, JCYJ20220530115404009), and China Postdoctoral Science Foundation (grant no. 2021M701554). Research at Pusan National University is supported by the Basic Science Research Program through the National Research Foundation of Korea (NRF) funded by the Ministry of Education (grant no. 2020R1A6A1A03044834).
This paper was edited by Jianzhong Ma and reviewed by two anonymous referees.
Assareh, N., Prabamroong, T., Manomaiphiboon, K., Theramongkol, P., Leungsakul, S., Mitrjit, N., and Rachiwong, J.: Analysis of observed surface ozone in the dry season over Eastern Thailand during 1997–2012, Atmos. Res., 178–179, 17–30, https://doi.org/10.1016/j.atmosres.2016.03.009, 2016.
Aura Validation Data Center: OMI PROFOZ product [data set], https://avdc.gsfc.nasa.gov/pub/data/satellite/Aura/OMI/V03/L2/OMPROFOZ/, last access: 1 March 2023.
Bak, J., Kim, J. H., Liu, X., Chance, K., and Kim, J.: Evaluation of ozone profile and tropospheric ozone retrievals from GEMS and OMI spectra, Atmos. Meas. Tech., 6, 239–249, https://doi.org/10.5194/amt-6-239-2013, 2013.
Bak, J., Baek, K.-H., Kim, J.-H., Liu, X., Kim, J., and Chance, K.: Cross-evaluation of GEMS tropospheric ozone retrieval performance using OMI data and the use of an ozonesonde dataset over East Asia for validation, Atmos. Meas. Tech., 12, 5201–5215, https://doi.org/10.5194/amt-12-5201-2019, 2019.
Bak, J., Liu, X., Spurr, R., Yang, K., Nowlan, C. R., Miller, C. C., Abad, G. G., and Chance, K.: Radiative transfer acceleration based on the principal component analysis and lookup table of corrections: optimization and application to UV ozone profile retrievals, Atmos. Meas. Tech., 14, 2659–2672, https://doi.org/10.5194/amt-14-2659-2021, 2021.
Bey, I., Jacob, D. J., Yantosca, R. M., Logan, J. A., Field, B. D., Fiore, A. M., Li, Q., Liu, H. Y., Mickley, L. J., and Schultz, M. G.: Global modeling of tropospheric chemistry with assimilated meteorology: Model description and evaluation, J. Geophys. Res.-Atmos., 106, 23073–23095, https://doi.org/10.1029/2001JD000807, 2001.
Bocquet, M., Elbern, H., Eskes, H., Hirtl, M., Žabkar, R., Carmichael, G. R., Flemming, J., Inness, A., Pagowski, M., Pérez Camaño, J. L., Saide, P. E., San Jose, R., Sofiev, M., Vira, J., Baklanov, A., Carnevale, C., Grell, G., and Seigneur, C.: Data assimilation in atmospheric chemistry models: current status and future prospects for coupled chemistry meteorology models, Atmos. Chem. Phys., 15, 5325–5358, https://doi.org/10.5194/acp-15-5325-2015, 2015.
Brasseur, G. P. and Jacob, D. J.: Modeling of Atmospheric Chemistry, Cambridge University Press, Cambridge, https://doi.org/10.1017/9781316544754, 2017.
Chen, X., Jiang, Z., Shen, Y., Li, R., Fu, Y., Liu, J., Han, H., Liao, H., Cheng, X., Jones, D. B. A., Worden, H., and Abad, G. G.: Chinese Regulations Are Working – Why Is Surface Ozone Over Industrialized Areas Still High? Applying Lessons From Northeast US Air Quality Evolution, Geophys. Res. Lett., 48, e2021GL092816, https://doi.org/10.1029/2021GL092816, 2021.
Claeyman, M., Attié, J.-L., Peuch, V.-H., El Amraoui, L., Lahoz, W. A., Josse, B., Joly, M., Barré, J., Ricaud, P., Massart, S., Piacentini, A., von Clarmann, T., Höpfner, M., Orphal, J., Flaud, J.-M., and Edwards, D. P.: A thermal infrared instrument onboard a geostationary platform for CO and O3 measurements in the lowermost troposphere: Observing System Simulation Experiments (OSSE), Atmos. Meas. Tech., 4, 1637–1661, https://doi.org/10.5194/amt-4-1637-2011, 2011.
Deng, X., Tie, X., Zhou, X., Wu, D., Zhong, L., Tan, H., Li, F., Huang, X., Bi, X., and Deng, T.: Effects of Southeast Asia biomass burning on aerosols and ozone concentrations over the Pearl River Delta (PRD) region, Atmos. Environ., 42, 8493–8501, https://doi.org/10.1016/j.atmosenv.2008.08.013, 2008.
Elbern, H., Strunk, A., Schmidt, H., and Talagrand, O.: Emission rate and chemical state estimation by 4-dimensional variational inversion, Atmos. Chem. Phys., 7, 3749–3769, https://doi.org/10.5194/acp-7-3749-2007, 2007.
Flemming, J., Benedetti, A., Inness, A., Engelen, R. J., Jones, L., Huijnen, V., Remy, S., Parrington, M., Suttie, M., Bozzo, A., Peuch, V.-H., Akritidis, D., and Katragkou, E.: The CAMS interim Reanalysis of Carbon Monoxide, Ozone and Aerosol for 2003–2015, Atmos. Chem. Phys., 17, 1945–1983, https://doi.org/10.5194/acp-17-1945-2017, 2017.
Gaudel, A., Cooper, O. R., Ancellet, G., Barret, B., Boynard, A., Burrows, J. P., Clerbaux, C., Coheur, P.-F., Cuesta, J., Cuevas, E., Doniki, S., Dufour, G., Ebojie, F., Foret, G., Garcia, O., Granados-Muñoz, M. J., Hannigan, J. W., Hase, F., Hassler, B., Huang, G., Hurtmans, D., Jaffe, D., Jones, N., Kalabokas, P., Kerridge, B., Kulawik, S., Latter, B., Leblanc, T., Le Flochmoën, E., Lin, W., Liu, J., Liu, X., Mahieu, E., McClure-Begley, A., Neu, J. L., Osman, M., Palm, M., Petetin, H., Petropavlovskikh, I., Querel, R., Rahpoe, N., Rozanov, A., Schultz, M. G., Schwab, J., Siddans, R., Smale, D., Steinbacher, M., Tanimoto, H., Tarasick, D. W., Thouret, V., Thompson, A. M., Trickl, T., Weatherhead, E., Wespes, C., Worden, H. M., Vigouroux, C., Xu, X., Zeng, G., and Ziemke, J.: Tropospheric Ozone Assessment Report: Present-day distribution and trends of tropospheric ozone relevant to climate and global atmospheric chemistry model evaluation, Elementa: Sci. Anthropocene, 6, 39, https://doi.org/10.1525/elementa.291, 2018.
Gong, C., Liao, H., Zhang, L., Yue, X., Dang, R., and Yang, Y.: Persistent ozone pollution episodes in North China exacerbated by regional transport, Environ. Pollut., 265, 115056, https://doi.org/10.1016/j.envpol.2020.115056, 2020.
Grell, G. A., Peckham, S. E., Schmitz, R., McKeen, S. A., Frost, G., Skamarock, W. C., and Eder, B.: Fully coupled “online” chemistry within the WRF model, Atmos. Environ., 39, 6957–6975, https://doi.org/10.1016/j.atmosenv.2005.04.027, 2005.
Han, H., Liu, J., Shu, L., Wang, T., and Yuan, H.: Local and synoptic meteorological influences on daily variability in summertime surface ozone in eastern China, Atmos. Chem. Phys., 20, 203–222, https://doi.org/10.5194/acp-20-203-2020, 2020.
Health Effects Institute: State of Global Air 2020, Special Report, Health Effects Institute, Boston, MA, https://www.stateofglobalair.org/ (last access: 1 March 2023), ISSN 2578-6873, 2020.
Huang, M., Bowman, K. W., Carmichael, G. R., Lee, M., Chai, T., Spak, S. N., Henze, D. K., Darmenov, A. S., and da Silva, A. M.: Improved western U.S. background ozone estimates via constraining nonlocal and local source contributions using Aura TES and OMI observations, J. Geophys. Res.-Atmos., 120, 3572–3592, https://doi.org/10.1002/2014JD022993, 2015.
Ingmann, P., Veihelmann, B., Langen, J., Lamarre, D., Stark, H., and Courrèges-Lacoste, G. B.: Requirements for the GMES Atmosphere Service and ESA's implementation concept: Sentinels-4/-5 and -5p, Remote Sens. Environ., 120, 58–69, https://doi.org/10.1016/j.rse.2012.01.023, 2012.
Inness, A., Baier, F., Benedetti, A., Bouarar, I., Chabrillat, S., Clark, H., Clerbaux, C., Coheur, P., Engelen, R. J., Errera, Q., Flemming, J., George, M., Granier, C., Hadji-Lazaro, J., Huijnen, V., Hurtmans, D., Jones, L., Kaiser, J. W., Kapsomenakis, J., Lefever, K., Leitão, J., Razinger, M., Richter, A., Schultz, M. G., Simmons, A. J., Suttie, M., Stein, O., Thépaut, J.-N., Thouret, V., Vrekoussis, M., Zerefos, C., and the MACC team: The MACC reanalysis: an 8 yr data set of atmospheric composition, Atmos. Chem. Phys., 13, 4073–4109, https://doi.org/10.5194/acp-13-4073-2013, 2013.
Inness, A., Blechschmidt, A. M., Bouarar, I., Chabrillat, S., Crepulja, M., Engelen, R. J., Eskes, H., Flemming, J., Gaudel, A., Hendrick, F., Huijnen, V., Jones, L., Kapsomenakis, J., Katragkou, E., Keppens, A., Langerock, B., de Mazière, M., Melas, D., Parrington, M., Peuch, V. H., Razinger, M., Richter, A., Schultz, M. G., Suttie, M., Thouret, V., Vrekoussis, M., Wagner, A., and Zerefos, C.: Data assimilation of satellite-retrieved ozone, carbon monoxide and nitrogen dioxide with ECMWF's Composition-IFS, Atmos. Chem. Phys., 15, 5275–5303, https://doi.org/10.5194/acp-15-5275-2015, 2015.
Inness, A., Ades, M., Agustí-Panareda, A., Barré, J., Benedictow, A., Blechschmidt, A.-M., Dominguez, J. J., Engelen, R., Eskes, H., Flemming, J., Huijnen, V., Jones, L., Kipling, Z., Massart, S., Parrington, M., Peuch, V.-H., Razinger, M., Remy, S., Schulz, M., and Suttie, M.: The CAMS reanalysis of atmospheric composition, Atmos. Chem. Phys., 19, 3515–3556, https://doi.org/10.5194/acp-19-3515-2019, 2019a.
Inness, A., Flemming, J., Heue, K.-P., Lerot, C., Loyola, D., Ribas, R., Valks, P., van Roozendael, M., Xu, J., and Zimmer, W.: Monitoring and assimilation tests with TROPOMI data in the CAMS system: near-real-time total column ozone, Atmos. Chem. Phys., 19, 3939–3962, https://doi.org/10.5194/acp-19-3939-2019, 2019b.
Kim, J., Jeong, U., Ahn, M.-H., Kim, J. H., Park, R. J., Lee, H., Song, C. H., Choi, Y.-S., Lee, K.-H., Yoo, J.-M., Jeong, M.-J., Park, S. K., Lee, K.-M., Song, C.-K., Kim, S.-W., Kim, Y. J., Kim, S.-W., Kim, M., Go, S., Liu, X., Chance, K., Chan Miller, C., Al-Saadi, J., Veihelmann, B., Bhartia, P. K., Torres, O., Abad, G. G., Haffner, D. P., Ko, D. H., Lee, S. H., Woo, J.-H., Chong, H., Park, S. S., Nicks, D., Choi, W. J., Moon, K.-J., Cho, A., Yoon, J., Kim, S.-k., Hong, H., Lee, K., Lee, H., Lee, S., Choi, M., Veefkind, P., Levelt, P. F., Edwards, D. P., Kang, M., Eo, M., Bak, J., Baek, K., Kwon, H.-A., Yang, J., Park, J., Han, K. M., Kim, B.-R., Shin, H.-W., Choi, H., Lee, E., Chong, J., Cha, Y., Koo, J.-H., Irie, H., Hayashida, S., Kasai, Y., Kanaya, Y., Liu, C., Lin, J., Crawford, J. H., Carmichael, G. R., Newchurch, M. J., Lefer, B. L., Herman, J. R., Swap, R. J., Lau, A. K. H., Kurosu, T. P., Jaross, G., Ahlers, B., Dobber, M., McElroy, C. T., and Choi, Y.: New Era of Air Quality Monitoring from Space: Geostationary Environment Monitoring Spectrometer (GEMS), B. Am. Meteorol. Soc., 101, E1–E22, https://doi.org/10.1175/bams-d-18-0013.1, 2020.
Kong, L., Tang, X., Zhu, J., Wang, Z., Li, J., Wu, H., Wu, Q., Chen, H., Zhu, L., Wang, W., Liu, B., Wang, Q., Chen, D., Pan, Y., Song, T., Li, F., Zheng, H., Jia, G., Lu, M., Wu, L., and Carmichael, G. R.: A 6-year-long (2013–2018) high-resolution air quality reanalysis dataset in China based on the assimilation of surface observations from CNEMC, Earth Syst. Sci. Data, 13, 529–570, https://doi.org/10.5194/essd-13-529-2021, 2021.
Lee, H.-J., Chang, L.-S., Jaffe, D. A., Bak, J., Liu, X., Abad, G. G., Jo, H.-Y., Jo, Y.-J., Lee, J.-B., and Kim, C.-H.: Ozone Continues to Increase in East Asia Despite Decreasing NO2: Causes and Abatements, Remote Sens., 13, 2177, https://doi.org/10.3390/rs13112177, 2021.
Levelt, P. F., Joiner, J., Tamminen, J., Veefkind, J. P., Bhartia, P. K., Stein Zweers, D. C., Duncan, B. N., Streets, D. G., Eskes, H., van der A, R., McLinden, C., Fioletov, V., Carn, S., de Laat, J., DeLand, M., Marchenko, S., McPeters, R., Ziemke, J., Fu, D., Liu, X., Pickering, K., Apituley, A., González Abad, G., Arola, A., Boersma, F., Chan Miller, C., Chance, K., de Graaf, M., Hakkarainen, J., Hassinen, S., Ialongo, I., Kleipool, Q., Krotkov, N., Li, C., Lamsal, L., Newman, P., Nowlan, C., Suleiman, R., Tilstra, L. G., Torres, O., Wang, H., and Wargan, K.: The Ozone Monitoring Instrument: overview of 14 years in space, Atmos. Chem. Phys., 18, 5699–5745, https://doi.org/10.5194/acp-18-5699-2018, 2018.
Lin, Y. C., Lin, C. Y., Lin, P. H., Engling, G., Lin, Y. C., Lan, Y. Y., June Chang, C. W., Kuo, T. H., Hsu, W. T., and Ting, C. C.: Influence of Southeast Asian biomass burning on ozone and carbon monoxide over subtropical Taiwan, Atmos. Environ., 64, 358–365, https://doi.org/10.1016/j.atmosenv.2012.09.050, 2013.
Lu, X., Zhang, L., Wang, X., Gao, M., Li, K., Zhang, Y., Yue, X., and Zhang, Y.: Rapid Increases in Warm-Season Surface Ozone and Resulting Health Impact in China Since 2013, Environ. Sci. Tech. Lett., 7, 240–247, https://doi.org/10.1021/acs.estlett.0c00171, 2020.
Ma, C., Wang, T., Mizzi, A. P., Anderson, J. L., Zhuang, B., Xie, M., and Wu, R.: Multiconstituent Data Assimilation With WRF-Chem/DART: Potential for Adjusting Anthropogenic Emissions and Improving Air Quality Forecasts Over Eastern China, J. Geophys. Res.-Atmos., 124, 7393–7412, https://doi.org/10.1029/2019JD030421, 2019.
Malley, C. S., Henze, D. K., Kuylenstierna, J. C. I., Vallack, H. W., Davila, Y., Anenberg, S. C., Turner, M. C., and Ashmore, M. R.: Updated Global Estimates of Respiratory Mortality in Adults ≥ 30 Years of Age Attributable to Long-Term Ozone Exposure, Environ. Health Perspect., 125, 087021, https://doi.org/10.1289/EHP1390, 2017.
Mao, J., Paulot, F., Jacob, D. J., Cohen, R. C., Crounse, J. D., Wennberg, P. O., Keller, C. A., Hudman, R. C., Barkley, M. P., and Horowitz, L. W.: Ozone and organic nitrates over the eastern United States: Sensitivity to isoprene chemistry, J. Geophys. Res.-Atmos., 118, 11256–211268, https://doi.org/10.1002/jgrd.50817, 2013.
Marvin, M. R., Palmer, P. I., Latter, B. G., Siddans, R., Kerridge, B. J., Latif, M. T., and Khan, M. F.: Photochemical environment over Southeast Asia primed for hazardous ozone levels with influx of nitrogen oxides from seasonal biomass burning, Atmos. Chem. Phys., 21, 1917–1935, https://doi.org/10.5194/acp-21-1917-2021, 2021.
McPeters, R. D. and Labow, G. J.: Climatology 2011: An MLS and sonde derived ozone climatology for satellite retrieval algorithms, J. Geophys. Res.-Atmos., 117, D10303, https://doi.org/10.1029/2011JD017006, 2012.
Miyazaki, K., Eskes, H. J., Sudo, K., Takigawa, M., van Weele, M., and Boersma, K. F.: Simultaneous assimilation of satellite NO2, O3, CO, and HNO3 data for the analysis of tropospheric chemical composition and emissions, Atmos. Chem. Phys., 12, 9545–9579, https://doi.org/10.5194/acp-12-9545-2012, 2012.
Miyazaki, K., Eskes, H. J., and Sudo, K.: A tropospheric chemistry reanalysis for the years 2005–2012 based on an assimilation of OMI, MLS, TES, and MOPITT satellite data, Atmos. Chem. Phys., 15, 8315–8348, https://doi.org/10.5194/acp-15-8315-2015, 2015.
Miyazaki, K., Bowman, K., Sekiya, T., Eskes, H., Boersma, F., Worden, H., Livesey, N., Payne, V. H., Sudo, K., Kanaya, Y., Takigawa, M., and Ogochi, K.: Updated tropospheric chemistry reanalysis and emission estimates, TCR-2, for 2005–2018, Earth Syst. Sci. Data, 12, 2223–2259, https://doi.org/10.5194/essd-12-2223-2020, 2020a.
Miyazaki, K., Bowman, K. W., Yumimoto, K., Walker, T., and Sudo, K.: Evaluation of a multi-model, multi-constituent assimilation framework for tropospheric chemical reanalysis, Atmos. Chem. Phys., 20, 931–967, https://doi.org/10.5194/acp-20-931-2020, 2020b.
Munro, R., Lang, R., Klaes, D., Poli, G., Retscher, C., Lindstrot, R., Huckle, R., Lacan, A., Grzegorski, M., Holdak, A., Kokhanovsky, A., Livschitz, J., and Eisinger, M.: The GOME-2 instrument on the Metop series of satellites: instrument design, calibration, and level 1 data processing – an overview, Atmos. Meas. Tech., 9, 1279–1301, https://doi.org/10.5194/amt-9-1279-2016, 2016.
NCAR: WRF-Chem model [code], https://www2.mmm.ucar.edu/wrf/users/download/get_source.html, last access: 1 March 2023.
Park, R. J., Jacob, D. J., Field, B. D., Yantosca, R. M., and Chin, M.: Natural and transboundary pollution influences on sulfate-nitrate-ammonium aerosols in the United States: Implications for policy, J. Geophys. Res.-Atmos., 109, D15204, https://doi.org/10.1029/2003JD004473, 2004.
Parrington, M., Jones, D. B. A., Bowman, K. W., Thompson, A. M., Tarasick, D. W., Merrill, J., Oltmans, S. J., Leblanc, T., Witte, J. C., and Millet, D. B.: Impact of the assimilation of ozone from the Tropospheric Emission Spectrometer on surface ozone across North America, Geophys. Res. Lett., 36, L04802, https://doi.org/10.1029/2008GL036935, 2009.
Peng, Z., Lei, L., Liu, Z., Sun, J., Ding, A., Ban, J., Chen, D., Kou, X., and Chu, K.: The impact of multi-species surface chemical observation assimilation on air quality forecasts in China, Atmos. Chem. Phys., 18, 17387–17404, https://doi.org/10.5194/acp-18-17387-2018, 2018.
Quesada-Ruiz, S., Attié, J.-L., Lahoz, W. A., Abida, R., Ricaud, P., El Amraoui, L., Zbinden, R., Piacentini, A., Joly, M., Eskes, H., Segers, A., Curier, L., de Haan, J., Kujanpää, J., Oude Nijhuis, A. C. P., Tamminen, J., Timmermans, R., and Veefkind, P.: Benefit of ozone observations from Sentinel-5P and future Sentinel-4 missions on tropospheric composition, Atmos. Meas. Tech., 13, 131–152, https://doi.org/10.5194/amt-13-131-2020, 2020.
Reddington, C. L., Conibear, L., Robinson, S., Knote, C., Arnold, S. R., and Spracklen, D. V.: Air Pollution From Forest and Vegetation Fires in Southeast Asia Disproportionately Impacts the Poor, GeoHealth, 5, e2021GH000418, https://doi.org/10.1029/2021GH000418, 2021.
Rodgers, C.: Inverse Methods for Atmospheric Sounding: Theory and Practice, World Scientific, ISBN 978-981-02-2740-1, https://doi.org/10.1142/3171, 2000.
Schenkeveld, V. M. E., Jaross, G., Marchenko, S., Haffner, D., Kleipool, Q. L., Rozemeijer, N. C., Veefkind, J. P., and Levelt, P. F.: In-flight performance of the Ozone Monitoring Instrument, Atmos. Meas. Tech., 10, 1957–1986, https://doi.org/10.5194/amt-10-1957-2017, 2017.
Schultz, M. G., Schröder, S., Lyapina, O., Cooper, O. R., Galbally, I., Petropavlovskikh, I., von Schneidemesser, E., Tanimoto, H., Elshorbany, Y., Naja, M., Seguel, R. J., Dauert, U., Eckhardt, P., Feigenspan, S., Fiebig, M., Hjellbrekke, A.-G., Hong, Y.-D., Kjeld, P. C., Koide, H., Lear, G., Tarasick, D., Ueno, M., Wallasch, M., Baumgardner, D., Chuang, M.-T., Gillett, R., Lee, M., Molloy, S., Moolla, R., Wang, T., Sharps, K., Adame, J. A., Ancellet, G., Apadula, F., Artaxo, P., Barlasina, M. E., Bogucka, M., Bonasoni, P., Chang, L., Colomb, A., Cuevas-Agulló, E., Cupeiro, M., Degorska, A., Ding, A., Fröhlich, M., Frolova, M., Gadhavi, H., Gheusi, F., Gilge, S., Gonzalez, M. Y., Gros, V., Hamad, S. H., Helmig, D., Henriques, D., Hermansen, O., Holla, R., Hueber, J., Im, U., Jaffe, D. A., Komala, N., Kubistin, D., Lam, K.-S., Laurila, T., Lee, H., Levy, I., Mazzoleni, C., Mazzoleni, L. R., McClure-Begley, A., Mohamad, M., Murovec, M., Navarro-Comas, M., Nicodim, F., Parrish, D., Read, K. A., Reid, N., Ries, L., Saxena, P., Schwab, J. J., Scorgie, Y., Senik, I., Simmonds, P., Sinha, V., Skorokhod, A. I., Spain, G., Spangl, W., Spoor, R., Springston, S. R., Steer, K., Steinbacher, M., Suharguniyawan, E., Torre, P., Trickl, T., Weili, L., Weller, R., Xiaobin, X., Xue, L., and Zhiqiang, M.: Tropospheric Ozone Assessment Report: Database and metrics data of global surface ozone observations, Elementa: Sci. Anthropocene, 5, 58, https://doi.org/10.1525/elementa.244, 2017.
Sekiya, T., Miyazaki, K., Eskes, H., Sudo, K., Takigawa, M., and Kanaya, Y.: A comparison of the impact of TROPOMI and OMI tropospheric NO2 on global chemical data assimilation, Atmos. Meas. Tech., 15, 1703–1728, https://doi.org/10.5194/amt-15-1703-2022, 2022.
Shu, L., Wang, T., Han, H., Xie, M., Chen, P., Li, M., and Wu, H.: Summertime ozone pollution in the Yangtze River Delta of eastern China during 2013–2017: Synoptic impacts and source apportionment, Environ. Pollut., 257, 113631, https://doi.org/10.1016/j.envpol.2019.113631, 2020.
Shu, L., Zhu, L., Bak, J., Zoogman, P., Han, H., Long, X., Bai, B., Liu, S., Wang, D., Sun, W., Pu, D., Chen, Y., Li, X., Sun, S., Li, J., Zuo, X., Yang, X., and Fu, T.-M.: Improved ozone simulation in East Asia via assimilating observations from the first geostationary air-quality monitoring satellite: Insights from an Observing System Simulation Experiment, Atmos. Environ., 274, 119003, https://doi.org/10.1016/j.atmosenv.2022.119003, 2022.
Singh, V., Singh, S., Biswal, A., Kesarkar, A. P., Mor, S., and Ravindra, K.: Diurnal and temporal changes in air pollution during COVID-19 strict lockdown over different regions of India, Environ. Pollut., 266, 115368, https://doi.org/10.1016/j.envpol.2020.115368, 2020.
Sonkaew, T. and Macatangay, R.: Determining relationships and mechanisms between tropospheric ozone column concentrations and tropical biomass burning in Thailand and its surrounding regions, Environ. Res. Lett., 10, 065009, https://doi.org/10.1088/1748-9326/10/6/065009, 2015.
Tang, X., Zhu, J., Wang, Z. F., and Gbaguidi, A.: Improvement of ozone forecast over Beijing based on ensemble Kalman filter with simultaneous adjustment of initial conditions and emissions, Atmos. Chem. Phys., 11, 12901–12916, https://doi.org/10.5194/acp-11-12901-2011, 2011.
The International GEOS-Chem User Community: geoschem/geos-chem: GEOS-Chem 12.9.3 (12.9.3), Zenodo [code], https://doi.org/10.5281/zenodo.3974569, 2020.
Timmermans, R. M. A., Lahoz, W. A., Attié, J. L., Peuch, V. H., Curier, R. L., Edwards, D. P., Eskes, H. J., and Builtjes, P. J. H.: Observing System Simulation Experiments for air quality, Atmos. Environ., 115, 199–213, https://doi.org/10.1016/j.atmosenv.2015.05.032, 2015.
Timmermans, R., Segers, A., Curier, L., Abida, R., Attié, J.-L., El Amraoui, L., Eskes, H., de Haan, J., Kujanpää, J., Lahoz, W., Oude Nijhuis, A., Quesada-Ruiz, S., Ricaud, P., Veefkind, P., and Schaap, M.: Impact of synthetic space-borne NO2 observations from the Sentinel-4 and Sentinel-5P missions on tropospheric NO2 analyses, Atmos. Chem. Phys., 19, 12811–12833, https://doi.org/10.5194/acp-19-12811-2019, 2019.
Veefkind, J. P., Aben, I., McMullan, K., Förster, H., de Vries, J., Otter, G., Claas, J., Eskes, H. J., de Haan, J. F., Kleipool, Q., van Weele, M., Hasekamp, O., Hoogeveen, R., Landgraf, J., Snel, R., Tol, P., Ingmann, P., Voors, R., Kruizinga, B., Vink, R., Visser, H., and Levelt, P. F.: TROPOMI on the ESA Sentinel-5 Precursor: A GMES mission for global observations of the atmospheric composition for climate, air quality and ozone layer applications, Remote Sens. Environ., 120, 70–83, https://doi.org/10.1016/j.rse.2011.09.027, 2012.
Wu, L., Mallet, V., Bocquet, M., and Sportisse, B.: A comparison study of data assimilation algorithms for ozone forecasts, J. Geophys. Res.-Atmos., 113, https://doi.org/10.1029/2008JD009991, 2008.
Yadav, I. C., Linthoingambi Devi, N., Li, J., Syed, J. H., Zhang, G., and Watanabe, H.: Biomass burning in Indo-China peninsula and its impacts on regional air quality and global climate change-a review, Environ. Pollut., 227, 414–427, https://doi.org/10.1016/j.envpol.2017.04.085, 2017.
Yeo, M. J. and Kim, Y. P.: Long-term trends of surface ozone in Korea, J. Clean. Prod., 294, 125352, https://doi.org/10.1016/j.jclepro.2020.125352, 2021.
Ziemke, J. R., Chandra, S., Duncan, B. N., Schoeberl, M. R., Torres, O., Damon, M. R., and Bhartia, P. K.: Recent biomass burning in the tropics and related changes in tropospheric ozone, Geophys. Res. Lett., 36, L15819, https://doi.org/10.1029/2009GL039303, 2009.
Zoogman, P., Jacob, D. J., Chance, K., Zhang, L., Le Sager, P., Fiore, A. M., Eldering, A., Liu, X., Natraj, V., and Kulawik, S. S.: Ozone air quality measurement requirements for a geostationary satellite mission, Atmos. Environ., 45, 7143–7150, https://doi.org/10.1016/j.atmosenv.2011.05.058, 2011.
Zoogman, P., Jacob, D. J., Chance, K., Liu, X., Lin, M., Fiore, A., and Travis, K.: Monitoring high-ozone events in the US Intermountain West using TEMPO geostationary satellite observations, Atmos. Chem. Phys., 14, 6261–6271, https://doi.org/10.5194/acp-14-6261-2014, 2014.
Zoogman, P., Liu, X., Suleiman, R. M., Pennington, W. F., Flittner, D. E., Al-Saadi, J. A., Hilton, B. B., Nicks, D. K., Newchurch, M. J., Carr, J. L., Janz, S. J., Andraschko, M. R., Arola, A., Baker, B. D., Canova, B. P., Chan Miller, C., Cohen, R. C., Davis, J. E., Dussault, M. E., Edwards, D. P., Fishman, J., Ghulam, A., González Abad, G., Grutter, M., Herman, J. R., Houck, J., Jacob, D. J., Joiner, J., Kerridge, B. J., Kim, J., Krotkov, N. A., Lamsal, L., Li, C., Lindfors, A., Martin, R. V., McElroy, C. T., McLinden, C., Natraj, V., Neil, D. O., Nowlan, C. R., O×Sullivan, E. J., Palmer, P. I., Pierce, R. B., Pippin, M. R., Saiz-Lopez, A., Spurr, R. J. D., Szykman, J. J., Torres, O., Veefkind, J. P., Veihelmann, B., Wang, H., Wang, J., and Chance, K.: Tropospheric emissions: Monitoring of pollution (TEMPO), J. Quant. Spectrosc. Ra., 186, 17–39, https://doi.org/10.1016/j.jqsrt.2016.05.008, 2017.