the Creative Commons Attribution 4.0 License.
the Creative Commons Attribution 4.0 License.
 | 10 Jan 2023
Sources of organic aerosols in eastern China: a modeling study with high-resolution intermediate-volatility and semivolatile organic compound emissions
Jingyu An
Dandan Huang
Momei Qin
Rusha Yan
Liping Qiao
Min Zhou
Yingjie Li
Shuhui Zhu
Qian Wang
Hongli Wang
Current chemical transport models fail to reproduce both the concentrations and temporal variations of organic aerosol (OA), especially the secondary organic aerosol (SOA), hindering the identification of major contribution sources. The fact that precursors of intermediate-volatility and semivolatile organic compounds (I/SVOCs) are not included in models has a significant impact on the performance of SOA simulation. Herein, we establish a high-resolution emission inventory of I/SVOCs and by incorporating it into the CMAQ model, concentrations, temporal variations, and spatial distributions of POA and SOA originating from different sources in the Yangtze River Delta (YRD) region of China were simulated. By incorporating I/SVOC emissions into the model, the modeled average SOA concentrations in the region increased by 148 %. Significant model improvements in the simulations of different OA components were demonstrated by comparison with comprehensive observation data. Furthermore, spatial and seasonal variations of different source contributions to OA production have been identified. We found that cooking emissions are predominant sources of POA in the densely populated urban area of the region. I/SVOC emissions from industrial sources are dominant contributors to the SOA formation, followed by those from mobile sources. Our results indicate that future control measures should be specifically tailored on an intraregional scale based on the different source characteristics to achieve the national goal of continuous improvement in air quality. In addition, local source profiles and emission factors of I/SVOCs, as well as SOA formation mechanisms in the model framework must urgently be updated to further improve the model performance and thus the accuracy of source identifications.
- Article
(12249 KB) - Full-text XML
-
Supplement
(2562 KB) - BibTeX
- EndNote


Organic aerosol (OA) contributes a large fraction (20 % to 90 %) of atmospheric submicron aerosol (Zhang et al., 2007; Jimenez et al., 2009) and has negative impacts on air quality, climate (Shrivastava et al., 2017), and human health (Nault et al., 2021). OA is composed of primary organic aerosol (POA) directly emitted from fossil fuel combustion, biomass burning, and other sources, as well as secondary organic aerosol (SOA) formed through the atmospheric oxidation of gas-phase species emitted from a wide range of biogenic and anthropogenic sources (Hallquist et al., 2009). Understanding and identifying the origins of OA is, therefore, important to elucidate their health and climate effects and establish effective mitigation policies. However, OA is a dynamic system driven by the gas–particle partitioning of organic vapors and particulate organic material and continuously evolves upon atmospheric oxidation (Robinson et al., 2007; Donahue et al., 2009; Zhao et al., 2013; Jathar et al., 2014). It is challenging to constrain the abundance of OA precursors and to identify key sources.
Great efforts have been made in the identification of OA sources through source apportionment of the measured OA components, such as positive matrix factorization (PMF) (Zhang et al., 2011), the chemical mass balance (CMB) model (Zheng et al., 2002), or the multilinear engine (ME-2) (Canonaco et al., 2013). The Aerodyne high-resolution time-of-flight aerosol mass spectrometer (AMS), has been proven to be a powerful tool in quantification and chemical characterization of different OA components in real time (Canagaratna et al., 2007). Coupled with PMF analysis, AMS measurements allow for the deconvolution of physically meaningful OA factors. Commonly retrieved factors include three POA sources, i.e., hydrocarbon-like OA (HOA) related to fossil fuel combustion, biomass burning OA (BBOA), and cooking-related OA (COA), as well as two SOA components, i.e., less oxidized oxygenated OA (LO-OOA) and more oxidized oxygenated OA (MO-OOA) (Hayes et al., 2013; Crippa et al., 2014; Sun et al., 2014; Li et al., 2017). Combining offline AMS and radiocarbon (14C) measurements, Huang et al. (2014) also identified the contributions of fossil and nonfossil sources to SOA. Attempts were made in subsequent studies by coupling the AMS measurement with a suite of comprehensive and collocated SOA tracer measurements to distinguish biogenic and major anthropogenic SOA sources, such as traffic and cooking emissions (Xu et al., 2015; Zhang et al., 2018; Zhu et al., 2021; D. Huang et al., 2021). However, given the hard ionization in the AMS, there are limits to how much source information can be extracted from AMS data. Further deconvolution on the contributions of different sources to OA production is challenging.
Besides field measurements, air quality modeling is another widespread technique, which has advantages for regional-scale OA source apportionment with higher temporal and spatial resolution. However, the models generally underpredicted the measured SOA concentration in the atmosphere. The volatility basis set (VBS) scheme has, therefore, been developed, which lumps organic precursors as well as their oxidation products into different volatility bins. Upon atmospheric aging, the volatility of these compounds evolves due to processes such as functionalization and fragmentation, which can be accounted for in the models by shifting the proportion of these compounds in different volatility bins (Donahue et al., 2006). Previous studies successively configured the VBS scheme from one-dimensional (1-D) to 1.5-/2-dimensions (1.5-/2-D), which can better describe the evolution of OA in the 2-D space of volatility and oxidation state in the model (Tsimpidi et al., 2010; Koo et al., 2014; Woody et al., 2016; B. Zhao et al., 2016; Yang et al., 2019). However, there are still some shortcomings in the modeling of OA, for example the lack of representation of the hydrophilic properties of OA, which assumes SOA condenses onto an organic phase, whereas SOA may also condense on an aqueous phase (Kim et al., 2011). Another important limitation is the underestimation of intermediate-volatility organic compounds (IVOCs) and semivolatile organic compounds' (SVOCs) emissions in the models, which potentially have substantial contributions to SOA budget owing to their high SOA yields (Presto et al., 2009; Tkacik et al., 2012; Zhao et al., 2014; Liggio et al., 2016). IVOCs refer to organic compounds with effective saturation concentrations (C∗) between 103 to 106 µg m−3 at 298 K and 1 atm, while SVOCs refer to organic compounds with C∗ between 10−1 to 103 µg m−3 at 298 K and 1 atm (Robinson et al., 2007).
I/SVOC emission inventories have been developed and applied into air quality models over the past decade. Most of them were estimated by applying different scaling factors based on their relationship with POA, volatile organic compounds (VOCs), or some proxies like naphthalene (Pye and Seinfeld, 2010; Shrivastava et al., 2011; Jathar et al., 2017; Wu et al., 2019, 2021; Li et al., 2020, 2022; Ling et al., 2022). Yet in practice, the same scaling factor was applied to most of the sources in previous studies due to the lack of measurements on I/SVOC emission factors. For example, except biomass burning (0.75–1.5), Wu et al. (2019) utilized scaling factors of 8–30 for all of the other emission source categories, which was estimated based on the measurements of on-road mobile sources. Li et al. (2020) assumed scaling factors of 1.5 for on-road mobile sources, and 0.34–1.5 for the other sources, such as industrial and residential sources, which were much lower than the estimations given in Wu et al. (2021). L. Huang et al. (2021) tried an emission factor method to quantify the I/SVOC emissions, yet the results were 60 % lower than those obtained with the scaling factor method, and were far from reproducing the measured amount of SOA. Obviously, roughly estimating I/SVOC emissions using one or two emission profiles as surrogates for all emission sources will create large uncertainties.
Recent studies successively determined the volatility distribution, chemical composition, and emission factors of I/SVOCs from mobile sources, including gasoline and diesel vehicles, nonroad diesel machinery, marine vessel, and aircraft (Presto et al., 2011; Cross et al., 2013; Y. Zhao et al., 2015, 2016; Huang et al., 2018; Qi et al., 2019; Drozd et al., 2019). I/SVOC emission profiles have been reported for nonmobile sources as well, including coal combustion, wood-burning, cooking, fuel evaporation, and industrial and residential volatile chemical products (Huffman et al., 2009; Gentner et al., 2012; May et al., 2013; Koss et al., 2018; McDonald et al., 2018; Cai et al., 2019; Drozd et al., 2021), making the quantification of I/SVOC emissions and their involvement in air quality models possible.
In China, SOA has been emerging as an important contributor to air pollution. Field observations reveal that OA contributes significantly (30 %) to the PM2.5 concentrations in most parts of China (Tao et al., 2017; Z. Liu et al., 2018), among which SOA contributes up to 80 % of OA during haze pollution (Huang et al., 2014; Ming et al., 2017; Li et al., 2021). SOA formation in China has already been examined in several modeling studies. It was found that by considering the POA aging and I/SVOCs oxidation in the models, which is realized by the coupling of the VBS scheme, the formation and evolution of SOA can be much better simulated compared to the results of the two-product SOA modeling framework (B. Zhao et al., 2016; Wu et al., 2019; Li et al., 2020; Yao et al., 2020; L. Huang et al., 2021). Chang et al. (2022) developed an emission framework that achieves a full volatility coverage in both the gas and particle phases of organic compounds in China, which have greatly improved the model performance on SOA concentrations. However, detailed source contributions of SOA in city scale still needs to be refined. Studies on high-resolution an I/SVOC emission inventory for more specific sources are highly needed.
In this study, taking the Yangtze River Delta (YRD) region, including Jiangsu, Zhejiang, Anhui provinces and Shanghai city, as a pilot, we established a high-resolution source specific I/SVOC emission inventory. We then applied the established inventory into CMAQ v5.3 to evaluate the contributions of I/SVOC emissions to SOA formation by comparing the results with the observation data collected in the region. Furthermore, we also ran the model in different scenarios to quantify the seasonal contributions of different sources to POA and SOA formation in the YRD region.
2.1 I/SVOC emission inventory
Previous studies usually used POA scaling factors to estimate the I/SVOC emissions, which may lead to large uncertainties in the estimation of gas-phase organic compound-dominated sources, like oil refineries, chemical production, and industrial solvent use. Herein, we compiled both gas-phase and particle-phase I/SVOCs emission inventories and incorporated them into the model. The detailed process of the inventories is as follows.
-
Source classification: to refine the I/SVOC emissions from different sources, we divided the sources into five major categories and then further grouped them into 21 sub-categories. The major categories include industrial process sources, industrial solvent use sources, mobile sources, residential sources, and agricultural sources. As shown in Table S1 in the Supplement, the industrial process sources include sectors such as oil refinery, chemical production, and pulp and paper production; industrial solvent use sources include textile, leather tanning, timber processing, and the use of various industrial volatile chemical products; mobile sources include gasoline and diesel vehicle emissions, fuel evaporation, diesel machinery, marine vessel, and aircraft; residential sources include coal combustion, residential solvent use, and cooking emissions; the agricultural source is specifically referred to biomass burning in household stoves, and open burning was not included in this study.
-
Emission estimation: gas-phase emissions for each specific source were estimated by the ratios of total I/SVOC components to anthropogenic VOC (AVOC) components (G-ratio). Similarly, particle-phase emissions were estimated by the ratios of total particle-phase I/SVOC components to POA (P-ratio). The G- and P-ratios for each source were determined according to their fractions of total I/SVOC species in VOC and POA emissions. Then we grouped different I/SVOC species into lumped I/SVOC bins based on their C∗ to determine the volatility distributions of each source. The gas-phase emissions were distributed into four lumped aliphatic IVOC bins across the volatility basis set from C∗ = 103 to 106 µg m−3, two aromatic IVOC bins with the C∗ = 105 and 106 µg m−3, and four lumped SVOC bins with C∗ from 10−1 and 102 µg m−3. The particle-phase emissions were distributed into five bins spanning C∗ from 10−1 and 103 µg m−3. Source profiles of I/SVOC species for different sources were referenced from the results in previous studies. Tables S1 and S2 show the G-ratios and P-ratios for each specific source and their references. For industrial processes, industrial solvent use, and residential solvent-use sources, only gas-phase emissions were considered. Their G-ratios and emission profiles were derived from the latest version of the SPECIATE 5.1 database (US EPA, 2021c). For gasoline and diesel vehicles, the G-ratios and P-ratios and emission profiles were referenced from a new mobile source parameterization recommended by Lu et al. (2020). Those of diesel machinery, marine vessel, and residential coal combustion were determined by recent measurement results in China (Qi et al., 2019; Huang et al., 2018; Cai et al., 2019). The G-ratios and profiles of cooking and biomass burning emissions were derived from the SPECIATE 5.1 database, while their P-ratios and profiles were referenced from two previous studies (May et al., 2013; Louvaris et al., 2017). The base emissions of AVOCs and POA (see Table S3) were taken from a high-resolution emission inventory for the year 2017 developed in our previous study (An et al., 2021).
-
Model input: before being input into the model, the estimated gas-phase and particle-phase emissions were summed and then redistributed according to their phase equilibrium under the actual atmospheric state. The formula of phase equilibrium is shown in Eq. (1).
where Fp is the fraction of particle-phase emissions for each volatility bin; COA represents the OA concentration in the atmosphere. We assumed it to be 10 µg m−3 in this study; C∗ is the effective saturation concentration of each volatility bin. After redistribution, the I/SVOC emissions for each source category were allocated into 4 km × 4 km grids and hourly temporal profiles using the same method as for the criteria pollutants.
2.2 Model configuration
We used the Community Modeling and Analysis System (CMAQ version 5.3.2) to simulate the concentrations of air pollutants. The domain of the simulation is presented in Fig. 1. The simulations were conducted for three nested grids with horizontal resolution of 36 km (D1), 12 km (D2), and 4 km (D3), respectively. D1 covers most of China and the surrounding countries, including Japan and South Korea; D2 covers eastern China and D3 covers the entire YRD region and its surrounding land and waters.
Meteorological fields were provided by the Weather Research and Forecasting (WRF version 3.7) model with 27 vertical layers extending to the tropopause (100 hpa). The initial and boundary conditions (ICs, BCs) in the WRF were based on the 1∘ × 1∘ reanalysis data from the National Centers for Environmental Prediction Final Analysis (NCEP-FNL). Physical options used in the WRF simulation are listed in Table S4.
The Sparse Matrix Operator Kernel Emissions (US EPA, 2021b) model was applied to process emissions for input to CMAQ. CMAQ version 5.3.2 (US EPA, 2021a) was used to simulate atmospheric pollutants concentrations. ICs and BCs of the D1 domain are based on a Model for Ozone And Related Chemical Tracers (MOZART) global simulation (Emmons et al., 2010). For the inner D2 and D3 domain, ICs and BCs are extracted from the simulation results of the outer domains. Options selected for the CMAQ simulations include the SAPRC07 gas phase chemistry, the AERO7 aerosol scheme, the Regional Acid Deposition Model (RADM) model aqueous phase chemistry, and ISORROPIA inorganic particulate thermodynamics.
The emission inventory developed in this study was used to produce the emission system in the YRD region, while emissions beyond YRD were supplied by the Multiresolution Emission Inventory for China (Tsinghua University, 2021), the Shipping Emission Inventory Model (SEIM) (Liu et al., 2019), and the Model Inter-Comparison Study (MIX) emission inventory for 2010 (Li et al., 2017). The I/SVOC emission inventory outside the YRD region was developed by multiplying the VOCs and POA emissions with the average G-ratios and P-ratios of major source categories like industry, vehicles, marine vessels, and residential. Biogenic volatile organic compounds (BVOCs) emissions were estimated based on MEGAN (Model of Emissions of Gases and Aerosols from Nature) version 2.10, driving by inputs of the leaf area index (LAI) from the MODIS product, plant functional types (PFT) based on remote sensing data, inline coupled emission factors, and meteorology simulated by the WRF model. Detailed configurations of MEGAN can be obtained from our previous study (Y. Liu et al., 2018).
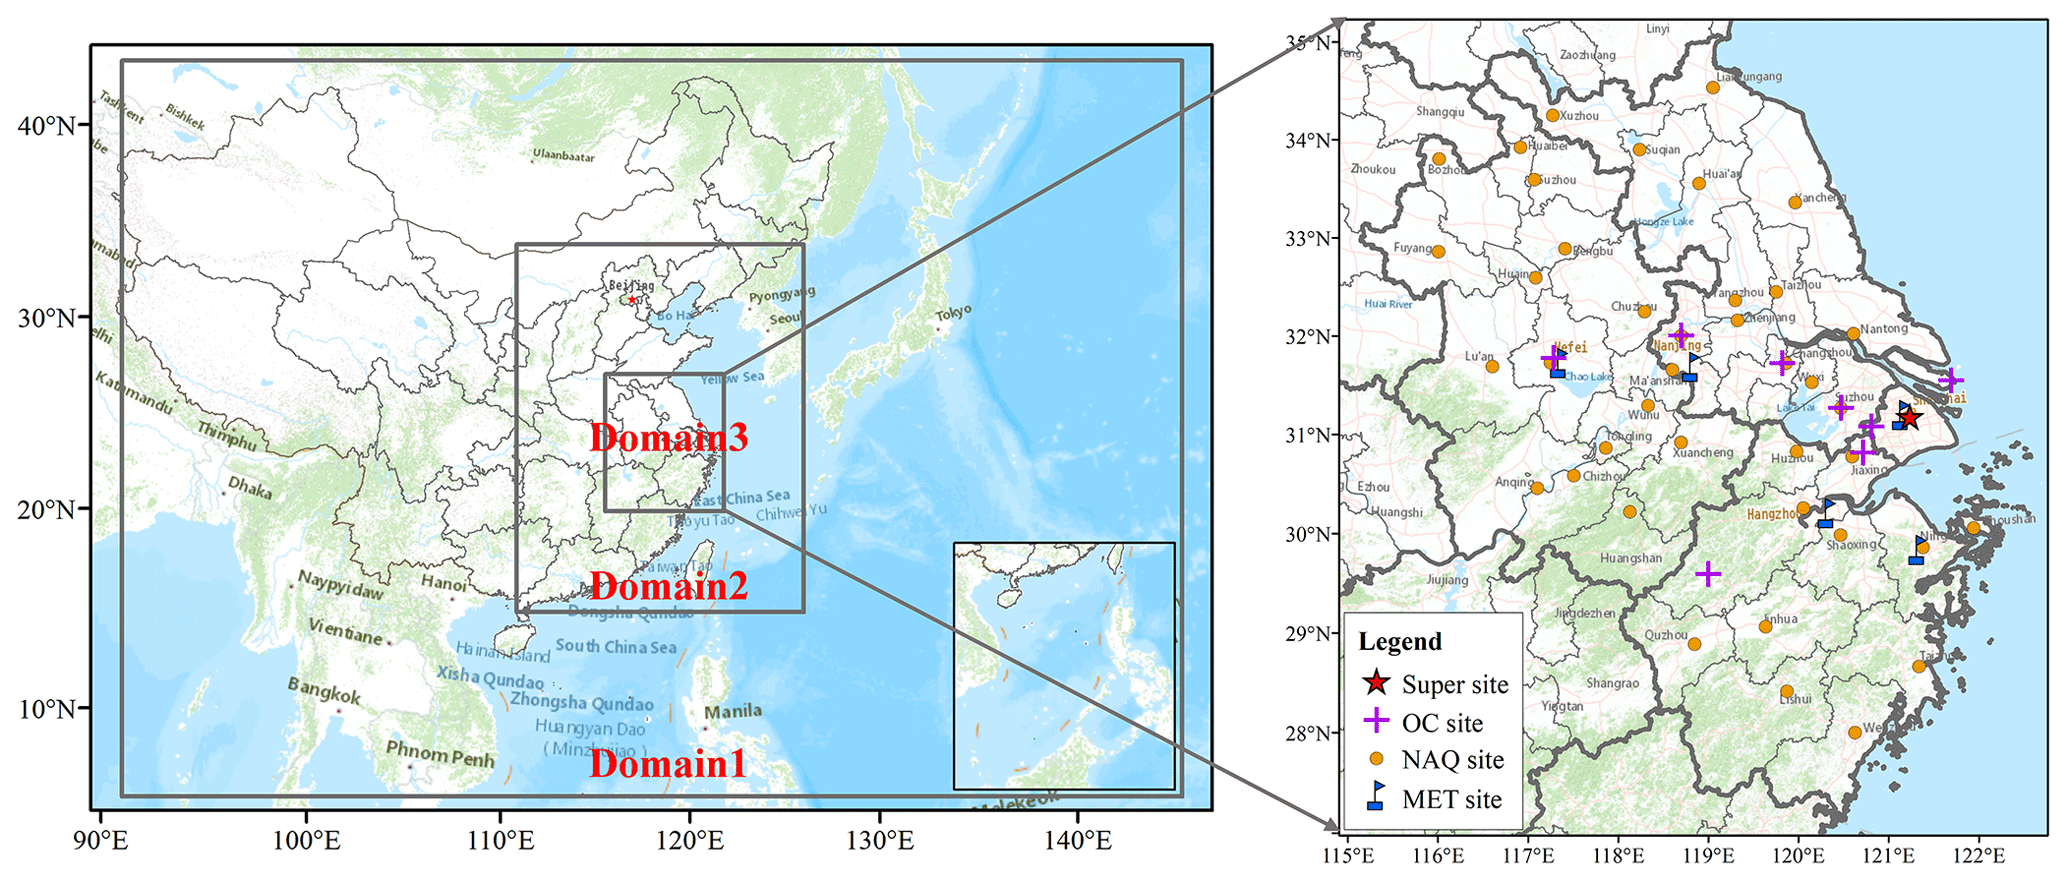
Figure 1Modeling domain and locations of observation sites. The blue marks are meteorological monitoring sites. The yellow dots represent the national air quality monitoring sites. The purple crosses are the observation sites with PM2.5 chemical composition measurements. The red star represents the observation site of AMS measurement.
SOA formed from I/SVOCs was estimated using the parameterization within the VBS framework in Lu et al. (2020). Specifically, the I/SVOC surrogates react with OH, generating four oxygenated organic species with volatility spanning from to 102 µg m−3, which may exist in both gas and condensed phases. The rate coefficient (i.e., kOH) and product yields (i.e., αi, i=1, 2, 3, 4) for each primary I/SVOC species were derived based on previous laboratory results (Y. Zhao et al., 2015, 2016). Multigeneration oxidation was considered by implementing further oxidation of the vapors from the initial oxidation, which redistributes the mass across the volatility bins of to 102 µg m−3, and thus fragmentation and functionalization were included. The further oxidation of the vapor products used the default aging scheme for the oxidation products of POA in the CMAQ (Murphy et al., 2017). Additionally, SOA formation from SVOCs was treated similarly, and more details can be found in Murphy et al. (2017). POA was treated as semivolatile to account for its gas–particle partitioning and aging process and segregated to several particle species, which varied in their volatility with to 103 µg m−3 (Donahue et al., 2006). Particle-phase emissions from different sources were then speciated and input considered as semivolatile species accordingly. The remaining POA emissions excluding particle-phase I/SVOCs were treated as nonvolatile POC (primary organic carbon) and PNCOM (primary noncarbon organic matter).
2.3 Model simulations
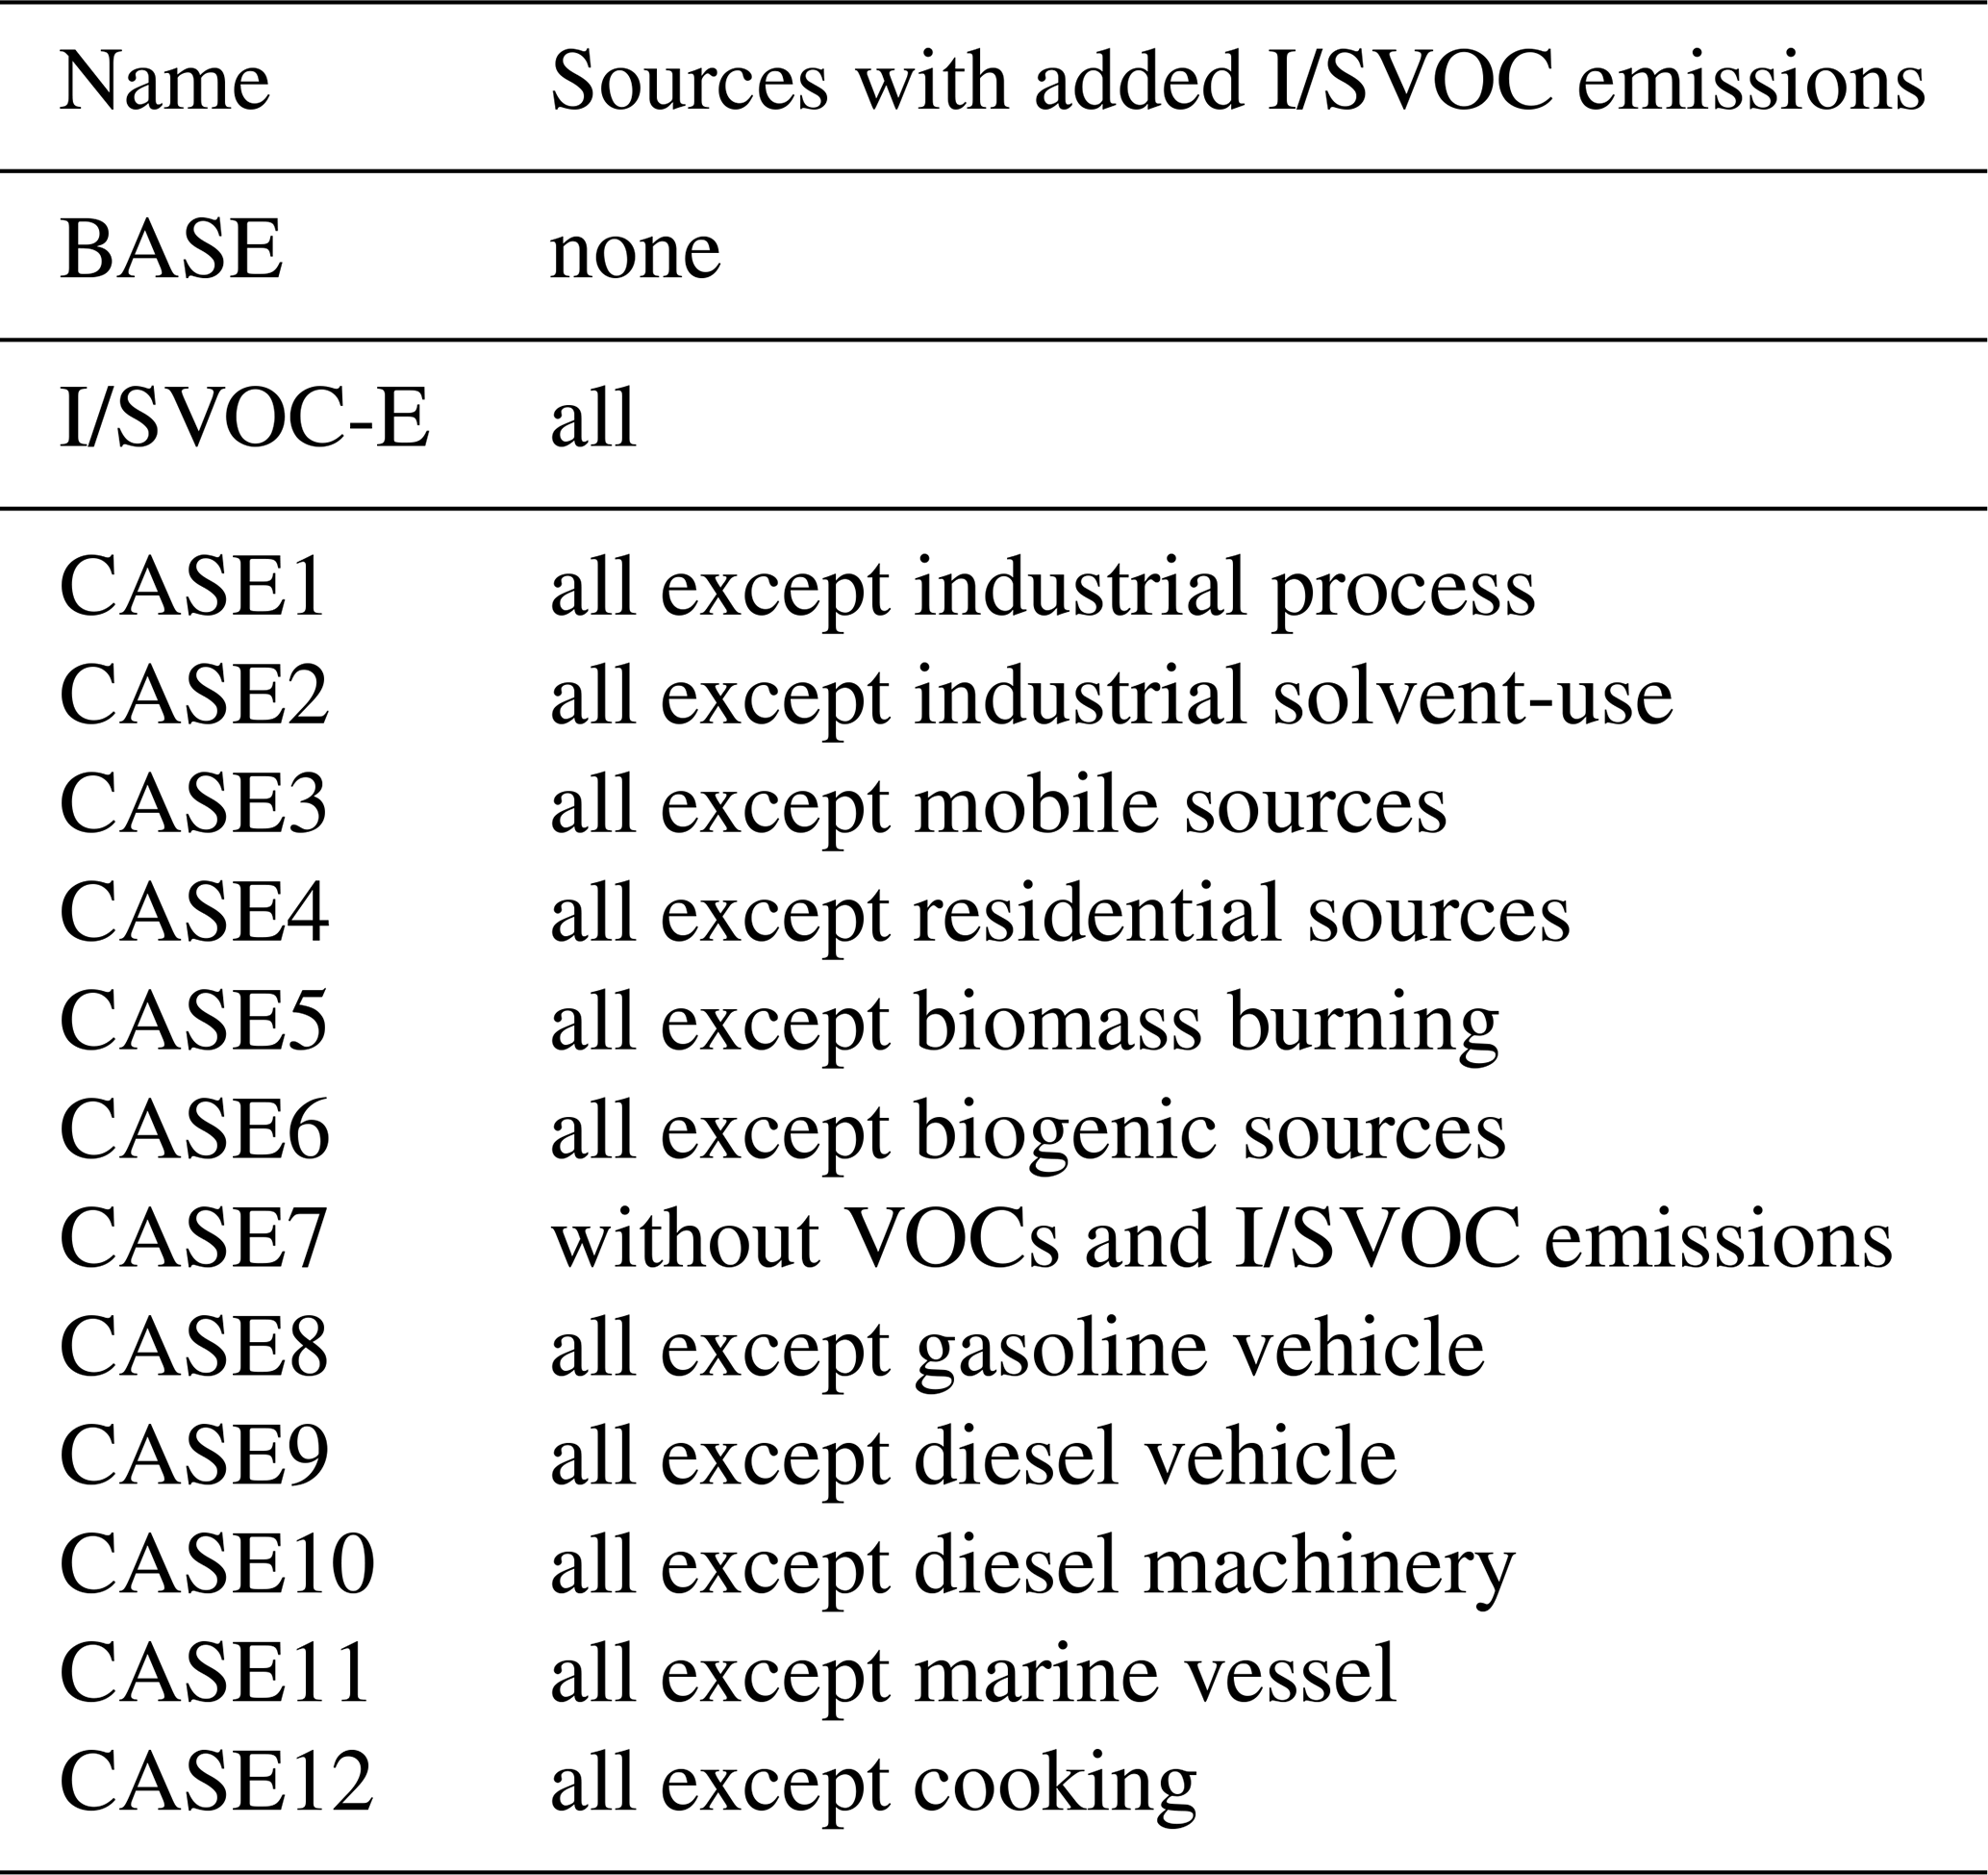
To investigate the model performance on OA simulations and the contributions of different sources, we set 14 simulation cases using the brute-force method (Zhang et al., 2005). Table 1 shows the settings for these 14 cases. First was the BASE simulation case, in which the I/SVOC emissions were not included, and the POA emissions were treated as nonvolatile. The second was the I/SVOC-E case, which augmented the high-resolution I/SVOC emission inventory established in this study. In addition, the POA emissions in the I/SVOC-E simulation were split into both nonvolatile and semivolatile parts. The nonvolatile emissions were obtained by subtracting the P-ratios from the total POA. Emissions of semivolatile POA were treated with variable gas–particle partitioning and multigenerational aging in this simulation case. We then used the difference between I/SVOC-E and BASE cases to evaluate the OA contributions from I/SVOC emissions. CASE1 to CASE12, respectively, excluded the VOC and I/SVOC emissions from different sources. We used the differences between I/SVOC-E and CASE1–12 to quantify the contribution of each source to OA concentration.
2.4 Model evaluation
To capture the characteristics of OA with different meteorological features in the YRD region, we selected four periods to represent spring (15 March to 15 April 2019), summer (1 to 31 July 2019), fall (15 October to 15 November 2018), and winter (1 to 31 December 2018) to conduct the simulations. Evaluations on model performance were made by comparing the simulation results with the observations obtained in the region, including five meteorological observation sites, 10PM2.5 chemical composition sites, and 41 national air quality monitoring sites, one in each city. The locations of the meteorological and air pollutant observation sites are shown in Fig. 1.
We also used the observation data of an AMS and a GC-MS/FID system at the supersite in Shanghai to further verify the model performance on the simulation of POA, SOA, and key VOC precursors. Details of the AMS measurements and PMF analysis are provided in our previous study (D. Huang et al., 2021). A total of 55 PAMS (Photochemical Assessment Monitoring Stations) species were identified by the GC-MS/FID system, including 27 alkanes, 11 alkenes, acetylene, and 16 aromatics. The supersite was located on the top floor of an eight-story building at Shanghai Academy of Environmental Sciences (SAES, 31∘10′ N, 121∘25′ E), 30 m above the ground. The site was in a typical residential and commercial area with significant influence from traffic emissions. Several petrochemical and chemical industrial factories are located around 50 km away from the site to the south and southwest.
Model performance in simulation of meteorological parameters and major criteria air pollutants are summarized in Tables S5 and S6. The mean bias (MB), mean gross error (MGE), root-mean-square error (RMSE), and index of agreement (IOA) of temperature, humidity, wind speed, and wind direction in each season are within the criteria recommended by Emery et al. (2001). Although the temperature in summer and winter, and the wind speed in fall and winter were slightly overestimated, their MGE and IOA values are within the uncertainties as recommended in Emery et al. (2001).
For the simulation of major criteria air pollutants, both mean fractional bias (MFB) and mean fractional error (MFE) of all pollutants met the criteria recommended by Boylan and Russell (2006). Since the addition of I/SVOC emissions would change the PM2.5 simulation results, we thus presented the statistical results for both BASE and I/SVOC-E cases in Table S6. The simulated SO2 was slightly overestimated, which might have been caused by the overestimation of SO2 emissions due to the fact that China's SO2 emission reduction was far beyond the expectations. In contrast, the modeled NO2 were underestimated in spring, fall, and winter, likely due to the overestimation of wind speed in these seasons. The modeled O3 and PM2.5 were slightly overestimated in the I/SVOC-E simulation case. Overall, the simulated meteorological parameters and major criteria air pollutants were consistent with the observations.
3.1 I/SVOC emission inventory
3.1.1 Source-specific I/SVOC emissions
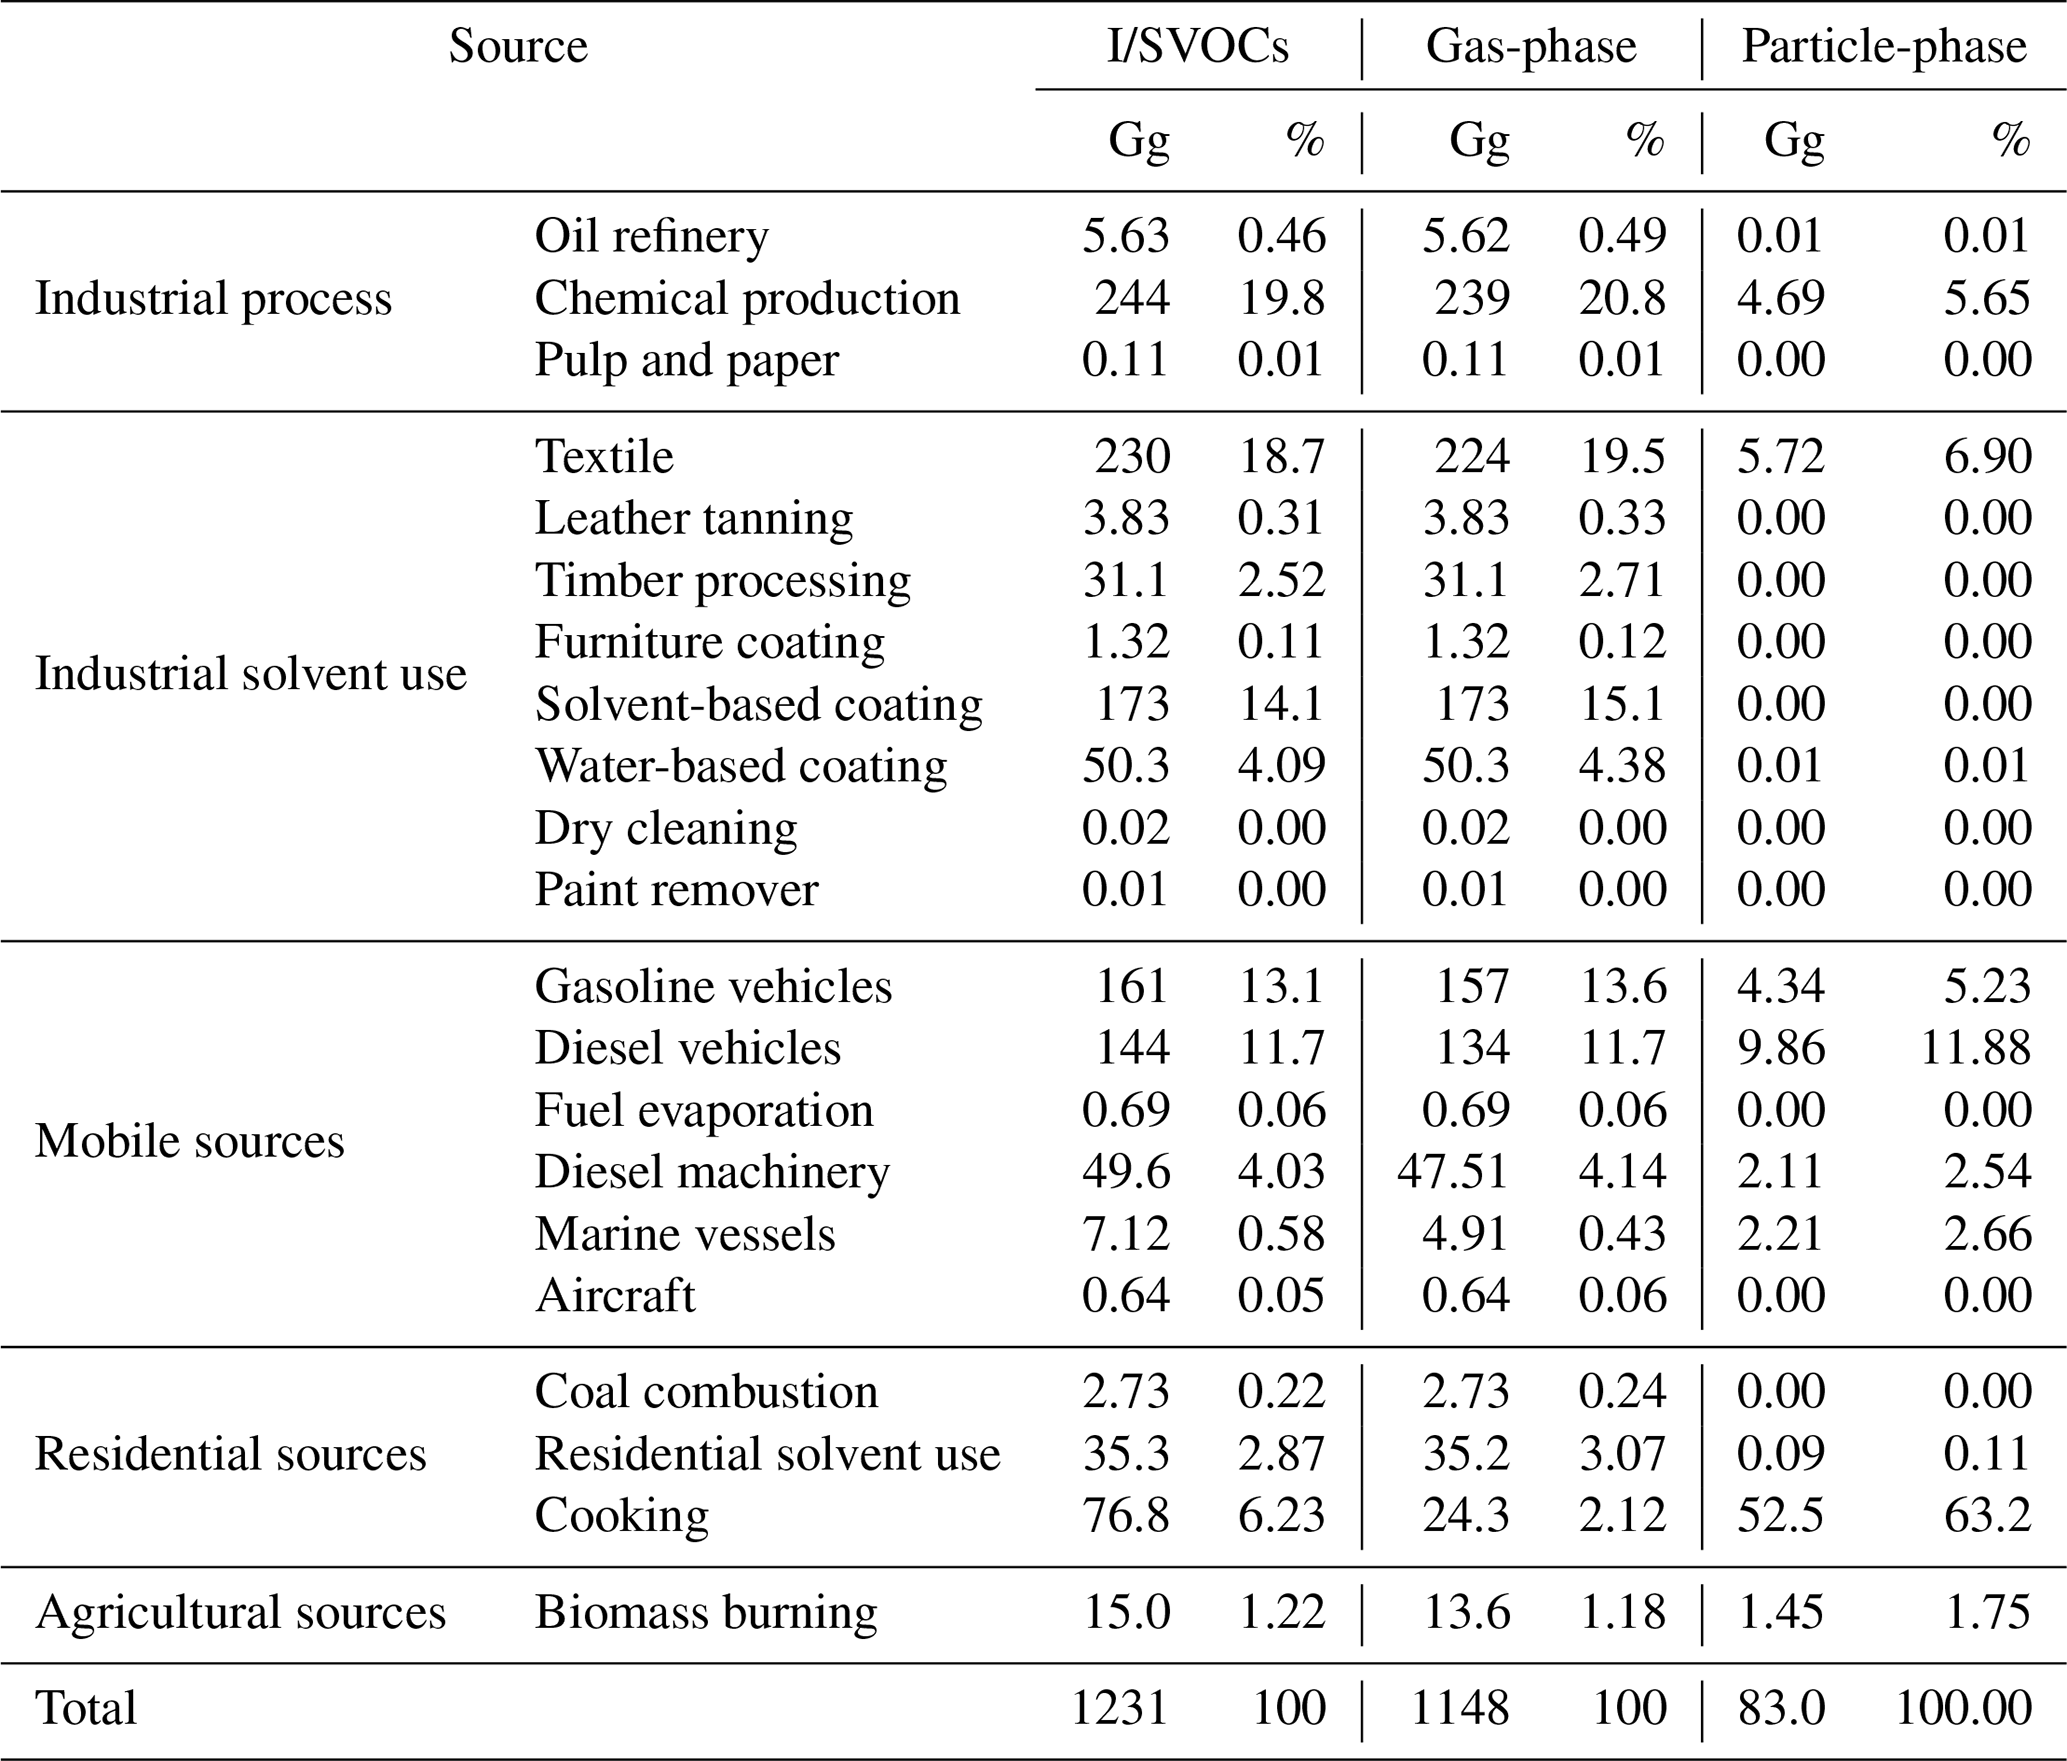
Table 2 shows the gas-phase and particle-phase emission inventories for detailed source category for year 2017 in the YRD region. The total gas-phase emission in the YRD region was 1148 Gg in 2017, lower than that in Wu et al. (2021) of 1360 Gg, but higher than the estimate in L. Huang et al. (2021) of 730 Gg. We found industrial solvent use was the largest contributor (484 Gg, 42.1 %) of total gas-phase emissions, followed by industrial process sources (245 Gg, 21.3 %), mobile sources (344 Gg, 30.0 %), residential sources (62 Gg, 5.4 %), and agricultural sources (14 Gg, 1.2 %). Specifically, chemical production, textile, and solvent-based coating were major sectors of gas-phase emissions in the YRD region, accounting for 20.8 %, 19.5 %, and 15.1 % of the total gas-phase emission, and their contributions to AVOC emissions were 20.7 %, 2.2 %, and 23.4 %, respectively (see Table S3). The chemical materials and production process of these industries were quite different, which would make their G-ratios quite different in the profiles. For example, the textile industry only accounted for 2.2 % of the total AVOC emissions in the YRD region but contributed to 19.5 % of the gas-phase emissions due to its higher G-ratio (2.473). Another example is water-based coatings, whose VOC emissions were approximately 10.2 % of solvent-based coatings, while their I/SVOC emissions were 29.1 % of those from solvent-based coatings. These findings indicate that reductions in VOC emissions do not necessarily correspond to simultaneous reductions in I/SVOCs emissions and subsequent SOA formation, which should be considered in future control strategies (Yuan et al., 2010).
For gas-phase emission of mobile origin, the major contributors were gasoline vehicle, diesel vehicle, and nonroad diesel machinery, accounting for 13.6 %, 11.7 %, and 2.1 %, respectively. The total gas-phase emissions from gasoline and diesel vehicles were 291 Gg, much higher than the results reported by Liu et al. (2017) (30 Gg) and L. Huang et al. (2021) (16 Gg) using the emission factor method, which likely underestimates the emission factors of I/SVOCs due to the lack of localized emission factors. Our tunnel experiment results show that the average IVOCs emission factors of gasoline and diesel vehicles were 15.3 and 219.8 mg km−1 (Tang et al., 2021), which were significantly higher than those used in the above studies (Liu et al., 2017; L. Huang et al., 2021). More comprehensive localized emission measurements are advocated to better constrain the I/SVOC emissions from mobile sources.
Particle-phase emissions were 83 Gg. The largest contributor of particle-phase emissions came from cooking emission and diesel vehicle, accounting for 53.2 % and 119 % of the total, followed by gasoline vehicle (5.2 %), marine vessel (2.7 %), diesel machinery (2.5 %), and biomass burning (1.8 %). Note that the particle-phase emissions from coal combustion (e.g., power plants, boilers, etc.), other industrial processes, and aircraft were not included in this study. On the one hand, the POA emissions (see Table S3) from these sources were limited, accounting for less than 5 %, which could be expected given that their particle-phase emissions were also relatively low. On the other hand, the profiles of particle-phase components of these sources were still difficult to obtain. More measurements of the I/SVOC emissions from these sources is necessary in the future.
Table 2Source-specific emissions of I/SVOCs for the year 2017 in the YRD region.
3.1.2 Volatility distributions of I/SVOCs
Figure 2 shows the volatility distribution of I/SVOC emissions from different sources as well as their gas–particle distributions. The I/SVOC emissions generally showed an increasing trend with the increase of volatility. As shown in Fig. 2a, IVOC emissions (logC∗ bins at 3–6) accounted for 86 % of the total I/SVOC emissions, overwhelmingly dominated by industrial process and mobile sources. SVOCs (logC∗ bins at 0–2) and low-volatile organic compounds (LVOCs, logC∗ bins at −1) contributed to 11 % and 3 % of the total I/SVOCs emissions. In terms of the contributing sectors, mobile sources, industrial process, and solvent use dominated the total I/SVOC emissions. While the IVOCs were equally contributed to by above-listed three sources, residential and mobile sources dominated the SVOCs and LVOCs emissions.
We further investigated the contributions of different volatility bins to each source category. The mobile source was dominated by IVOC emission (88 %). Note that IVOC emissions from vehicles included a certain fraction of aromatics, which have faster OH reaction rates and higher SOA yields compared to aliphatics in the same volatility bin (Y. Zhao et al., 2016; Drozd et al., 2019). Lu et al. (2020) therefore defined two additional lumped IVOC species with logC∗ bins at 5 and 6 to account for the aromatic IVOCs in vehicle exhaust according to the measurements in previous studies (Y. Zhao et al., 2015, 2016). Here in this study, we also split the aromatic IVOC emissions from mobile sources and found that aromatic IVOCs accounted for 23 % of the total I/SVOC emissions from the mobile source. The industrial process and solvent-use sources were also dominated by IVOC emissions, accounting for 81 % and 97 %, respectively. The volatility distribution of residential sources was relatively uniform, with IVOCs, SVOCs and LVOCs accounting for 40 %, 30 %, and 30 %. Agricultural (i.e., biomass burning) sources were more concentrated in IVOCs, accounting for 76 %, while SVOCs accounted for 24 %. It should be noted that other than mobile sources, the emission profiles of the other sources were mainly derived from the SPECIATE 5.1 database (US EPA, 2021c) in this study, which may be inconsistent with real-world emissions in China. To further reduce the uncertainty in the I/SVOC emission inventory, measurements of I/SVOC emissions from different local sources are, therefore, important and urgently needed in the future.
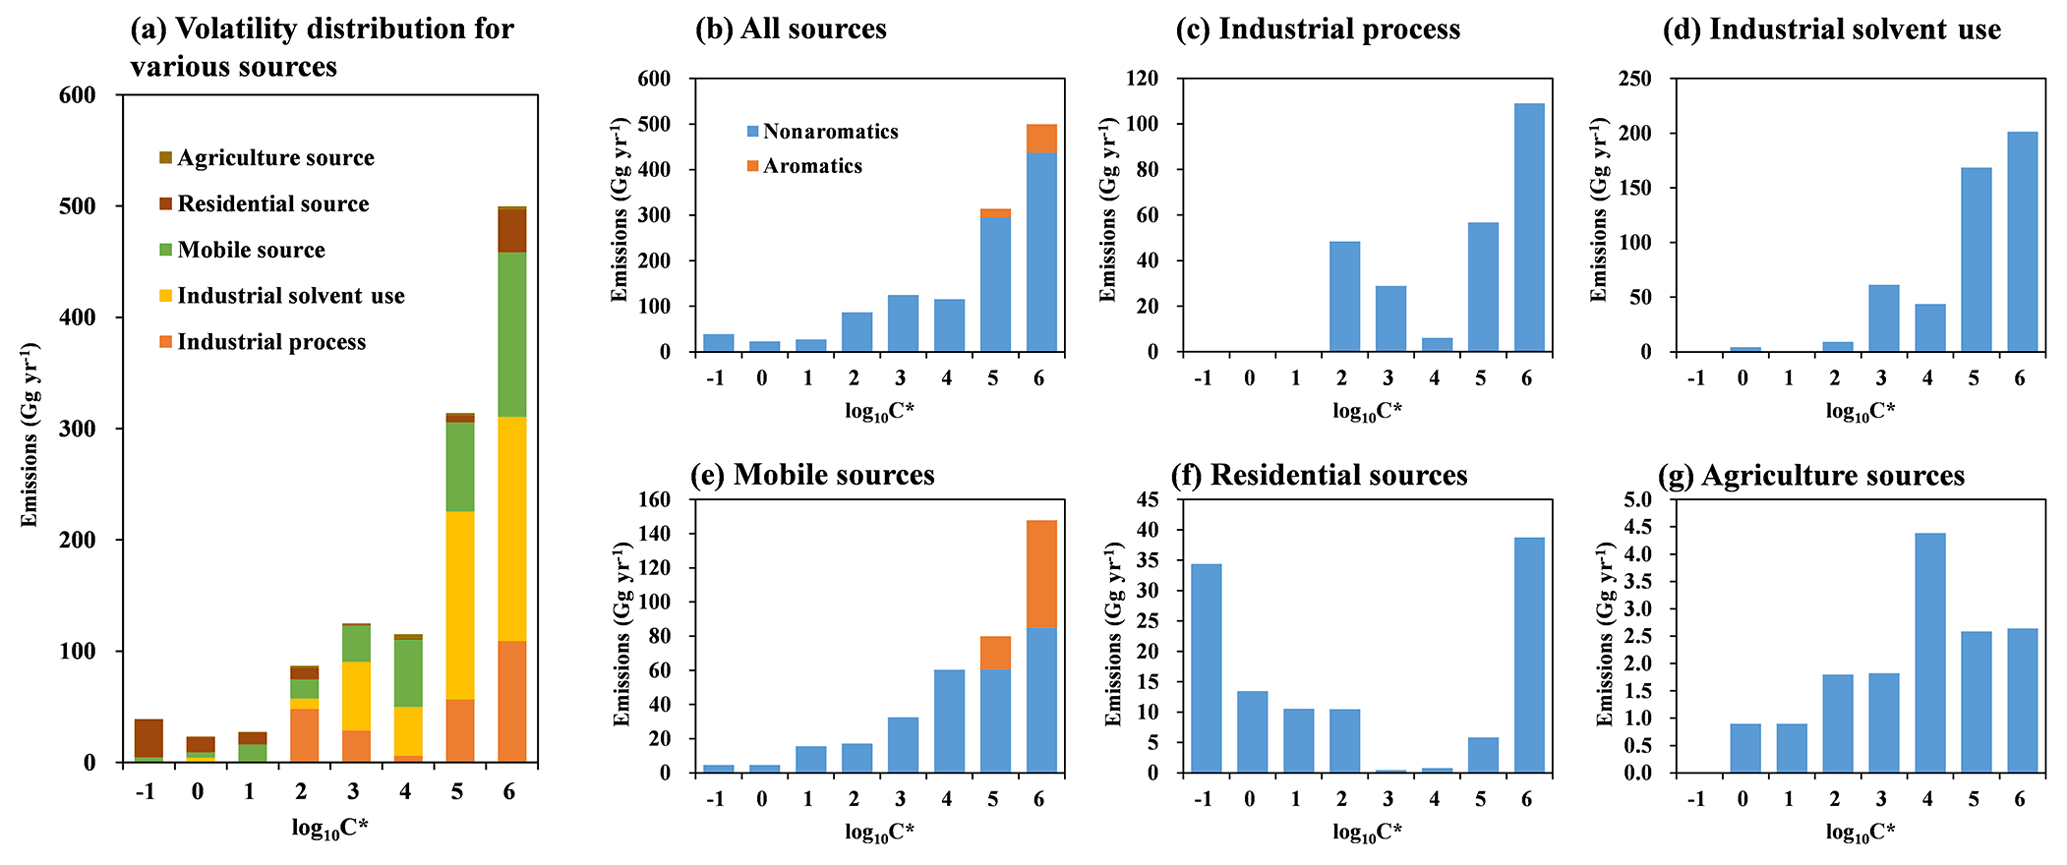
Figure 2Volatility distributions of I/SVOCs emitted from different sources in the YRD region.
3.1.3 Spatial distributions of I/SVOC emissions in the YRD region
Figure 3 compares the spatial distributions of AVOC, IVOC, SVOC, and LVOC emissions in the YRD region. The IVOC, SVOC, and LVOC emissions were largely concentrated in city clusters in eastern YRD, and hotspots can also be observed in the northern agglomerations. The distributions of I/S/LVOC emissions were generally consistent with those of the AVOC emissions in the region. Compared to the spatial distributions of I/S/LVOC emissions in Chang et al. (2022), our emissions had similar spatial distributions but at a higher resolution. Emission hotspots in urban areas can be captured more clearly in this study, which will help improve the simulation in urban areas.
Figure 4 shows the spatial distributions of source-specific I/SVOC emissions in the YRD region. There were considerable differences in the spatial distributions of I/SVOC emissions from different sources. The I/SVOC emissions from industrial sources (including industrial process and industrial solvent use) were mainly concentrated in the eastern urban agglomeration, which was related to the developed industrial activities in the region. The I/SVOC emissions from mobile and residential sources clustered into multiple hotspots in urban areas, while emissions from agricultural sources were mainly distributed in northern YRD, where frequent agricultural activities exist.
We also compare the spatial distributions of I/SVOC emissions with those of POA and BVOCs. We found that POA emissions were more concentrated in urban centers associated with mobile and residential sources (see Fig. S1 in the Supplement). BVOC emissions in the YRD region were mainly distributed in the southern area, where AVOC and IVOC emissions were relatively low. The difference in the spatial distributions of I/SVOC, AVOC, BVOC, and POA emissions implies that the sources of organic components in different areas of the region are quite different, which will be discussed in the following sections.
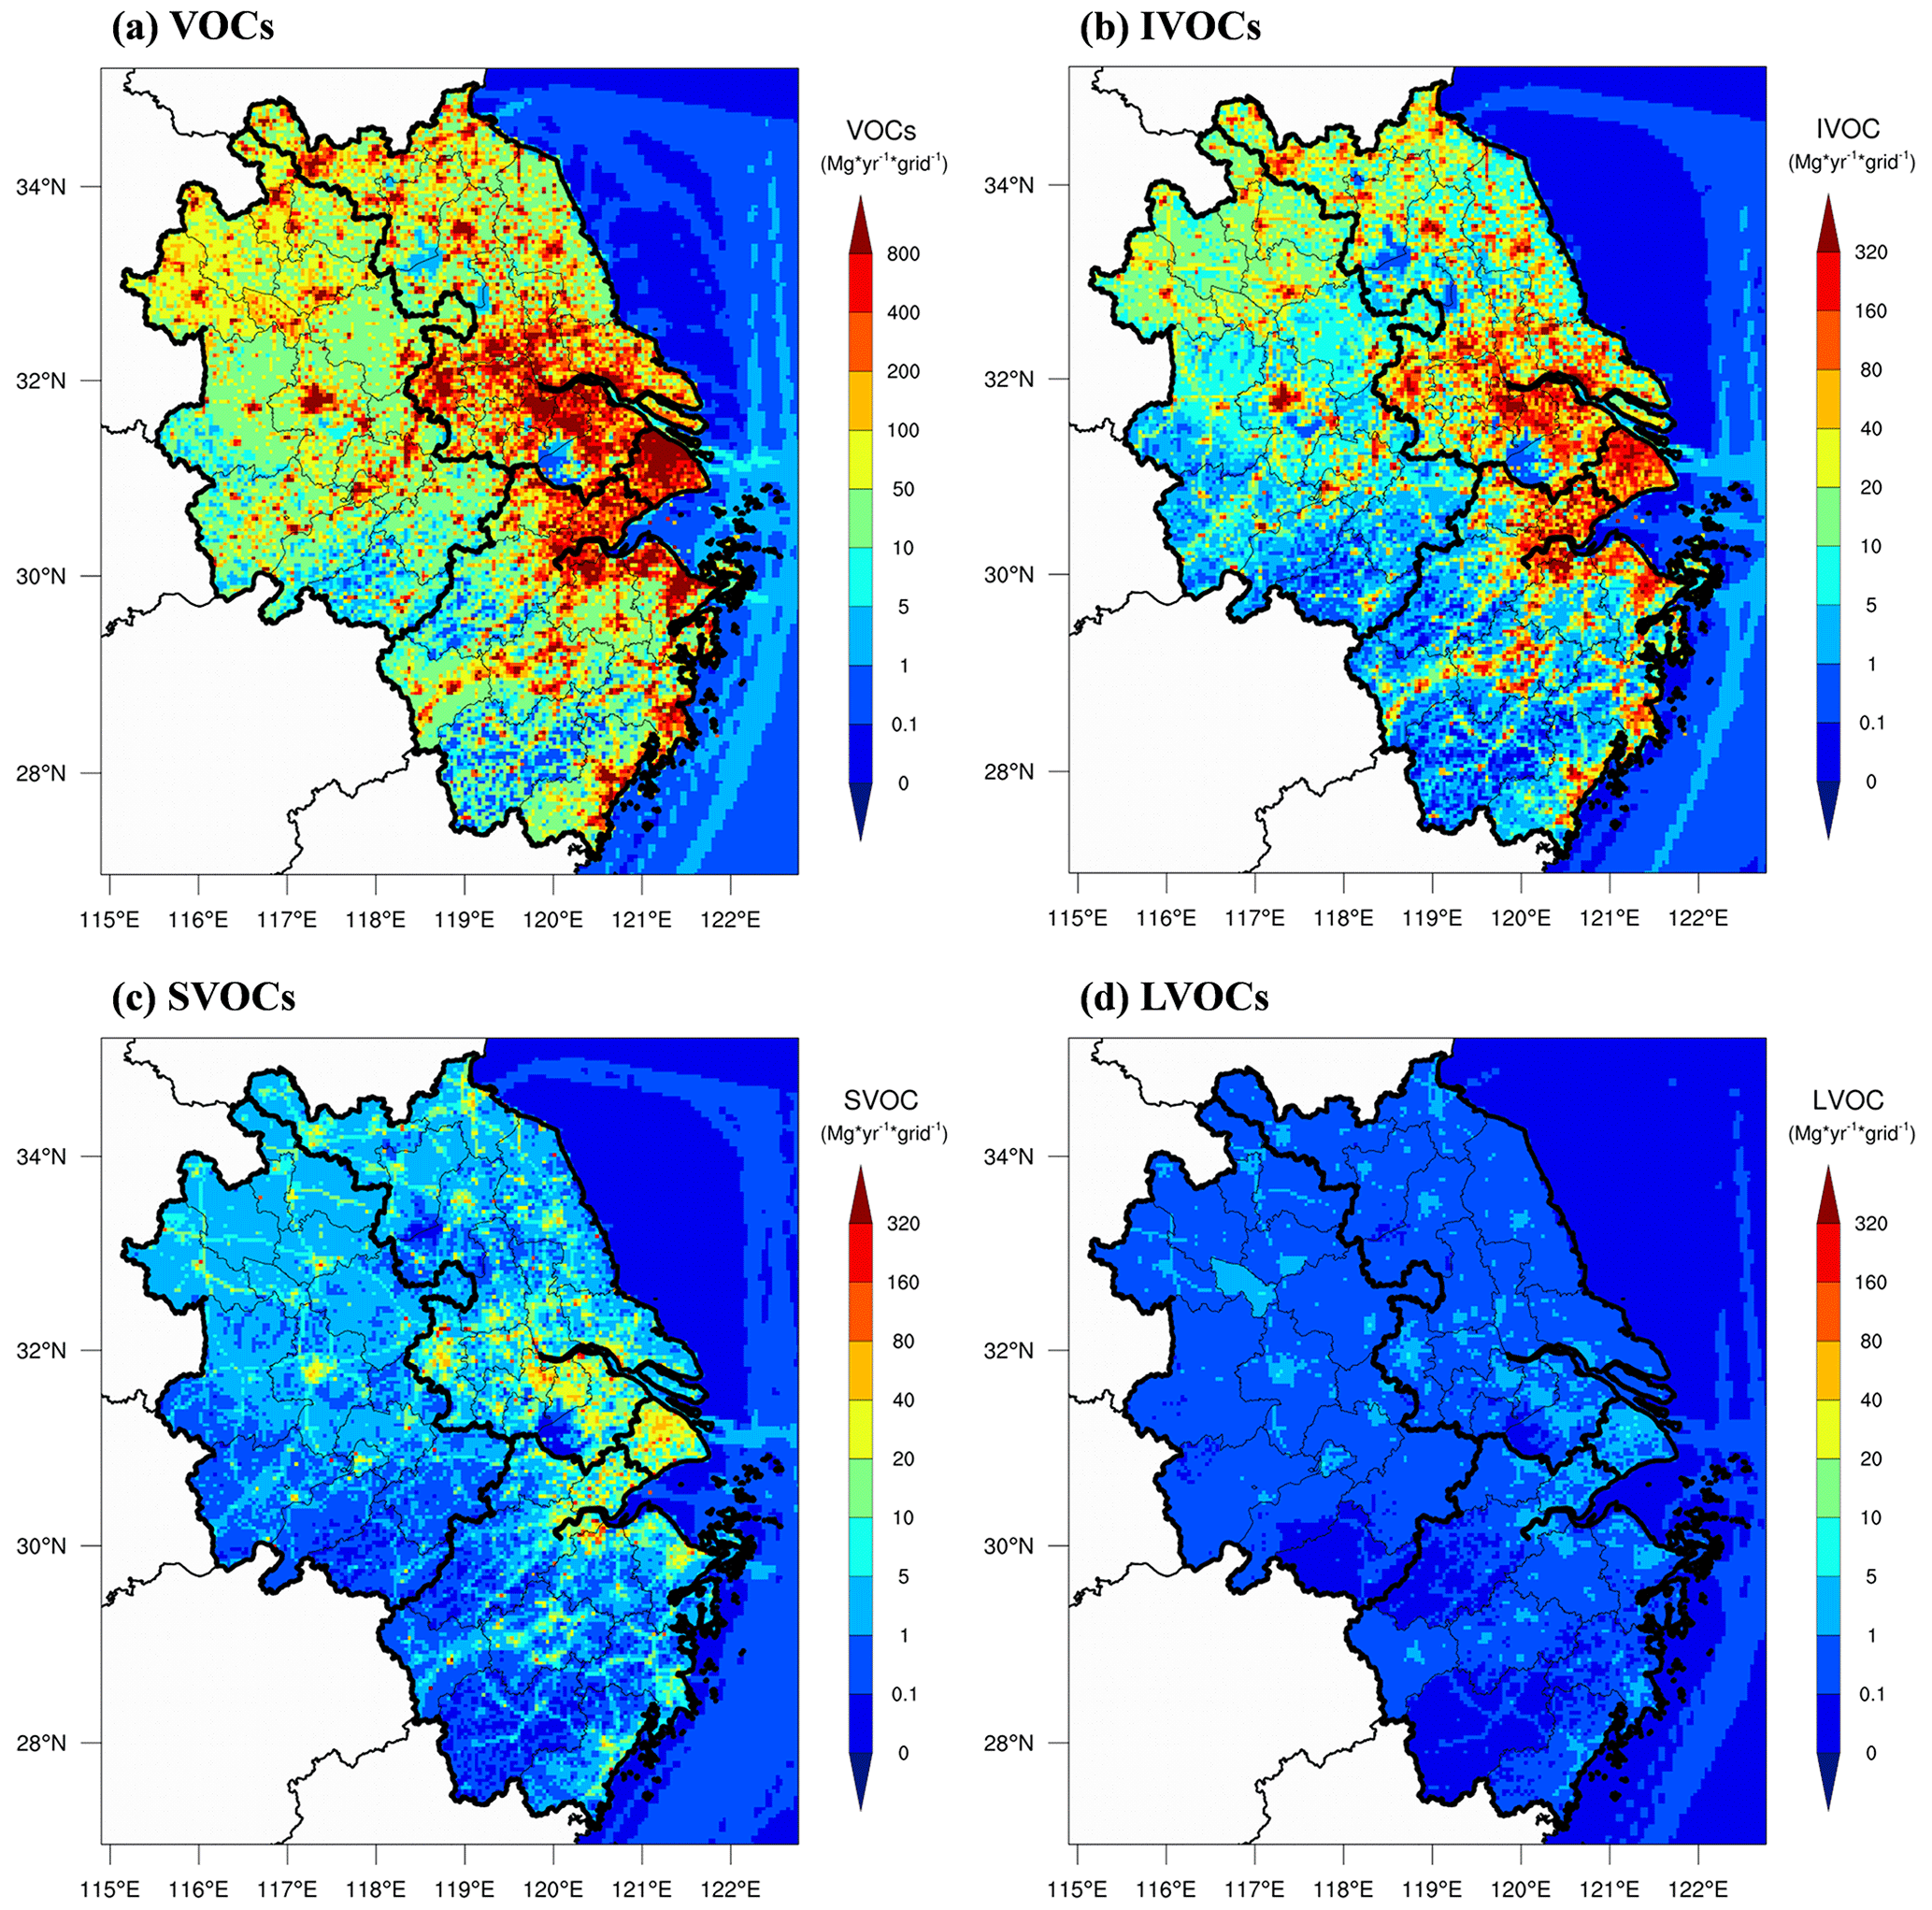
Figure 3Spatial distributions of anthropogenic VOC, IVOC, SVOC, and LVOC emissions in the YRD region for the year 2017.
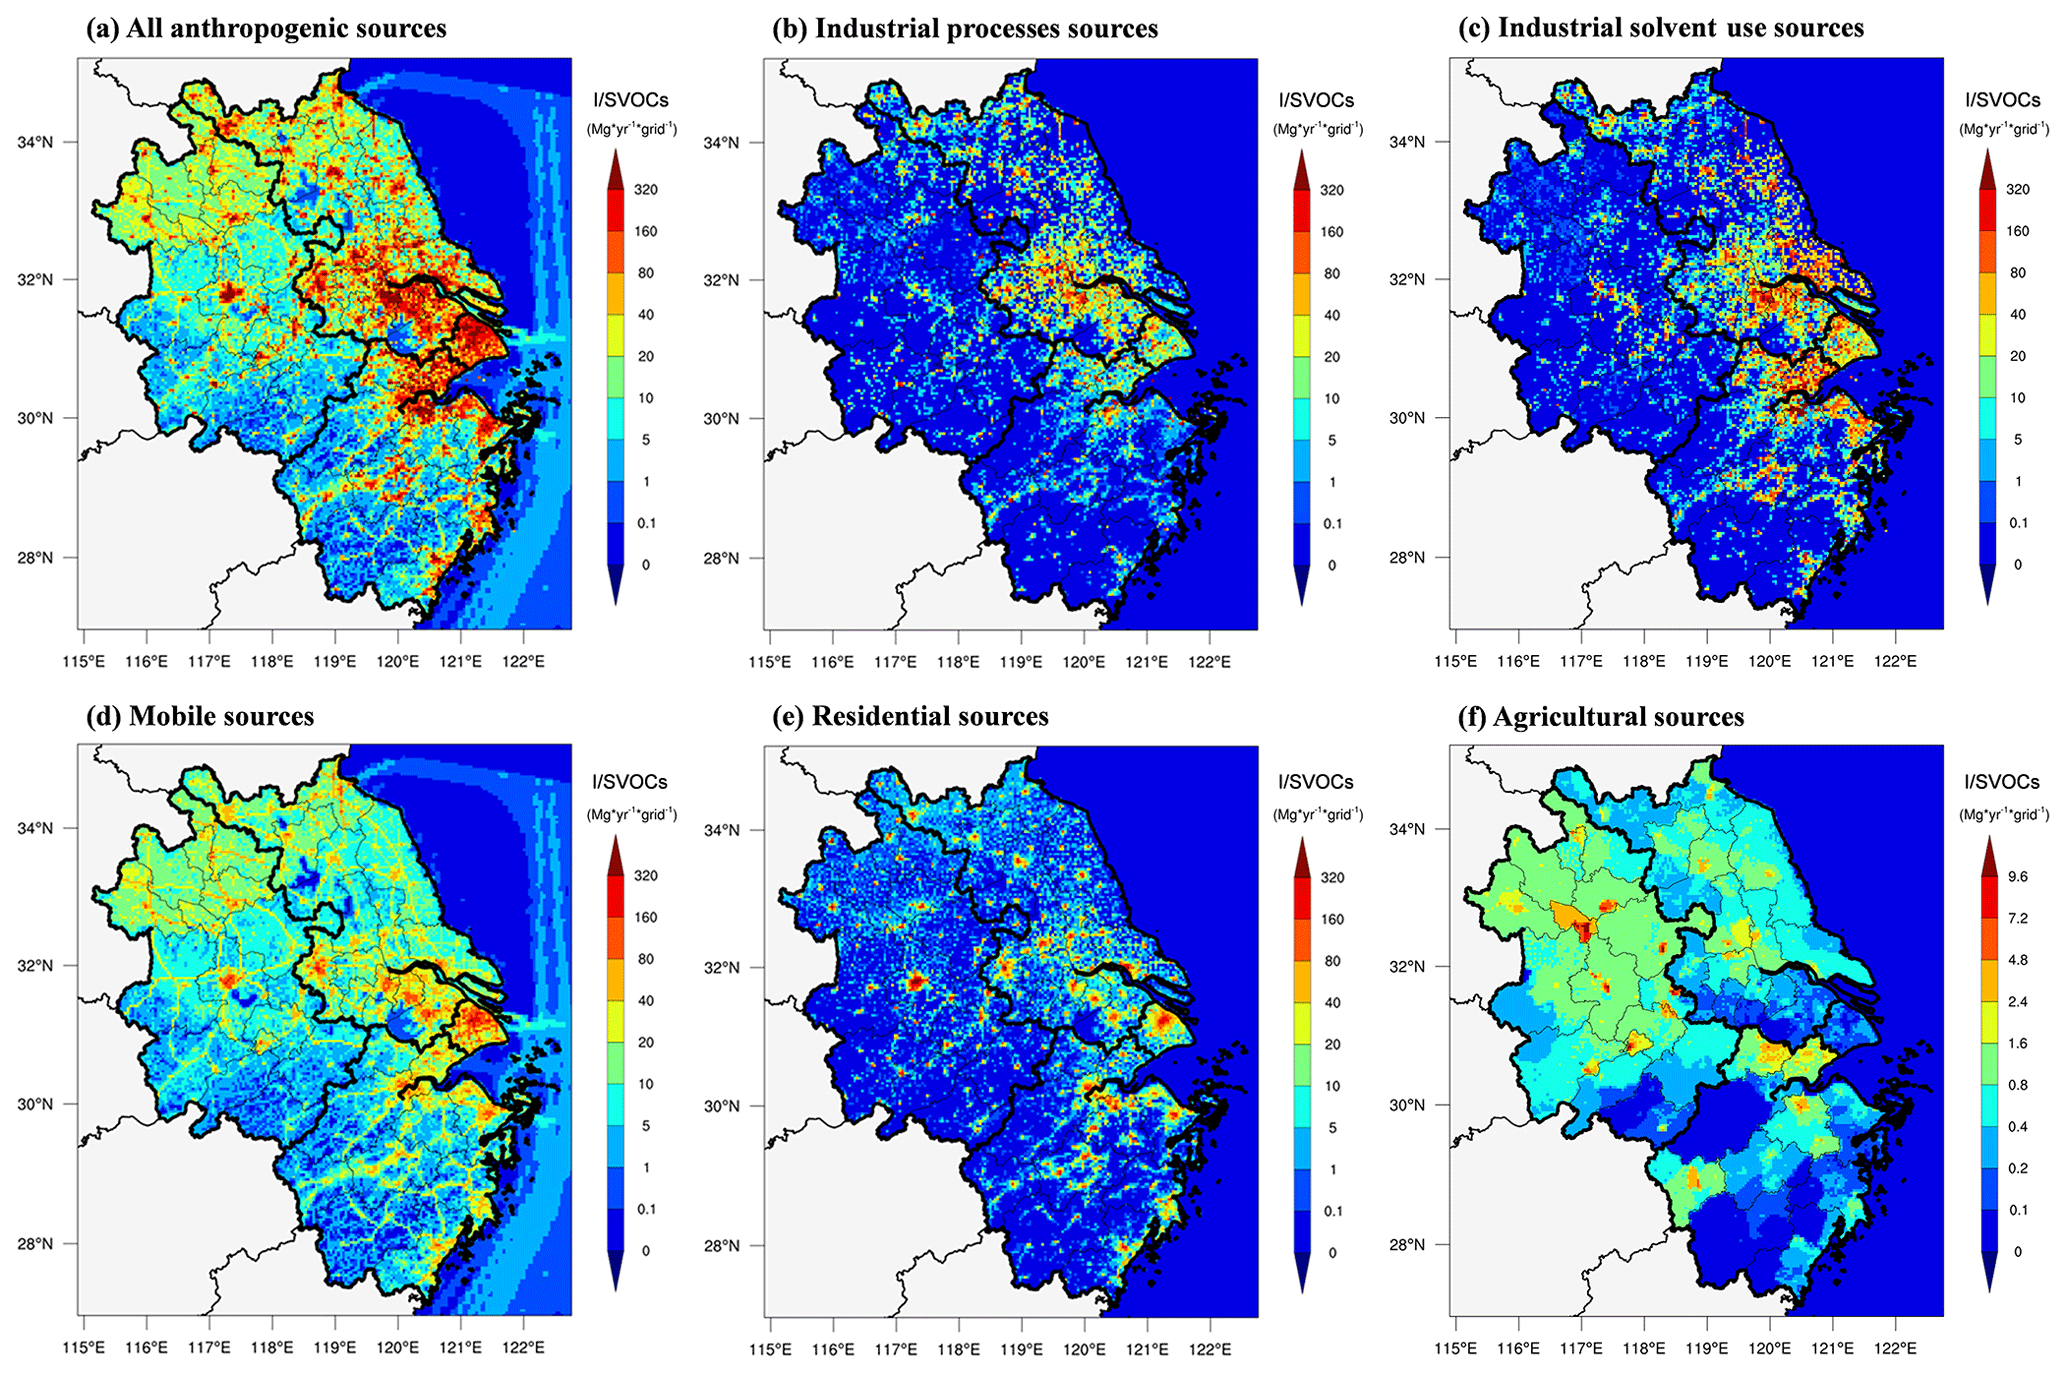
Figure 4Spatial distributions of I/SVOC emissions from different source categories in the YRD region for the year 2017.
3.2 Comparison between model simulation and observations
3.2.1 Simulation results of VOCs and IVOCs
Since model performance on the simulation of VOCs is critical for SOA estimation, we first compare the modeled concentrations of VOCs with those of the measured at the SAES supersite for several aromatic VOCs, including benzene, toluene, and m-/p-/o-xylenes. As shown in Fig. S2, the model simulation was able to capture the hourly variations of these species, measured with Pearson correlation coefficients (r) of 0.54–0.65, 0.45–0.60, 0.54–0.69 for toluene, xylene, and benzene, respectively. Although the simulation results of toluene were 28 % lower and xylene and benzene were 41 % and 22 % higher than those of the measured, the model results are within the uncertainties. Overall, the simulation results of the VOC species showed good agreement with the observations, which could be further used for the model simulation of SOA formation.
Long-term continuous observations of I/SVOC concentrations were sparse, so the simulation results of IVOCs were compared with those obtained from offline measurements reported in our previous studies (Li et al., 2019; Ren et al., 2020). The reported IVOC concentrations (sum of gas- and particle-phase concentrations) in summer and winter Shanghai in 2018, respectively, varied between 1.5–17.2 and 2.2–43.1 µg m−3 with average concentrations of 6.8±3.7 and 18.2±11.0 µg m−3. In this study, our modeled average concentrations of IVOCs in spring, summer, fall, and winter at the SAES supersite in Shanghai were 12.8±5.6, 9.0±3.2, 12.2±5.2, and 12.4±7.6 µg m−3, respectively. The modeled IVOCs was higher in summer and lower in winter. This may be attributed to the unreasonable estimate of monthly profiles of I/SVOC emissions. In this study, I/SVOC emissions in winter were only 5 % higher than those in summer, consistent with the trends simulated by the model, but far from reaching the large difference (∼2.7 times) between the observed concentrations in winter and summer. Continuous long-term measurements of I/SVOC at multiple locations and improvements of monthly variations in I/SVOC emissions are strongly recommended in the future to help improve the SOA model performance.
3.2.2 Simulation results of OA concentrations
Figure 5 presents the OA concentrations originating from different sources, including POA and SOA formed from AVOCs, BVOCs, and I/SVOCs, in four seasons in YRD from both BASE and I/SVOC-E simulations. Here, we used the average of the modeled concentrations at 41 national air quality monitoring sites (see the yellow dots in Fig. 1) to represent the regional average. The regional average concentration of OA (8.8 µg m−3) in the I/SVOC-E simulation was 22 % higher than that from BASE simulation (7.2 µg m−3) due to the involvement of I/SVOCs in the I/SVOC-E simulation.
The seasonal average concentration of POA was 5.5 µg m−3 in the BASE case, with the lowest in summer (3.8 µg m−3) and the highest in winter (6.9 µg m−3). High POA concentrations in winter were mainly induced by the stagnant meteorological conditions, such as low wind speed and boundary layer height and weaker photochemical effect, and vice versa in summer. For the spatial distributions as presented in Fig. 6, POA concentrations in northern YRD were high and mainly concentrated in urban areas, which was consistent with the distributions of POA emissions (Fig. S1). The POA concentrations in the I/SVOC-E simulation decreased by 12 %–20 % compared with the BASE case. In the I/SVOC-E simulation, the POA was treated as semivolatile, where gas–particle partitioning and multigeneration oxidation were considered (Murphy et al., 2017). Entering into the atmosphere, more semivolatile compounds evaporated into gas-phase and then generated SOA through multigeneration oxidation, which reduced the POA concentrations relatively.
The seasonal average concentration of AVSOA in the BASE case was only 0.2 µg m−3. The average AVSOA concentration in the I/SVOC-E case increased by 17 % compared with the BASE case due to higher OA loading. Nonetheless, AVSOA still exhibited very limited contribution to the regional OA concentration, whereas the average concentration of BVOC derived SOA (BVSOA, 1.7 µg m−3 in the I/SVOC-E simulation case) was much higher. Also, evident seasonal variations were observed for BVSOA, with the highest in summer (2.3 µg m−3), followed by spring (1.7 µg m−3), fall (1.6 µg m−3), and winter (1.1 µg m−3). Hotspots of BVSOA concentrations were concentrated in western and southern YRD. The observed seasonal variations and spatial distributions of BVOC derived SOA were consistent with those of the BVOC emissions in YRD (Y. Liu et al., 2018).
The average concentration of I/SVOC derived SOA (I/SVSOA) in I/SVOC-E simulation was 2.2 µg m−3, with the highest in spring (2.7 µg m−3) and the lowest in summer (1.8 µg m−3), which was a combined effect of emission, oxidation and meteorological conditions. For example, Qin et al. (2022) suggested that in spring the enhanced solar radiation and OH oxidation potentially promote the secondary conversion from I/SVOCs to SOA. The low concentration in summer was likely due to more favorable diffusion conditions than in the other seasons. By incorporating I/SVOC emissions into the I/SVOC-E simulation, the modeled average SOA concentration in the region increased from 1.7 (BASE) to 4.1 µg m−3; high concentrations of I/SVSOA were observed in central and northern YRD. Overall, the addition of high-resolution I/SVOC emissions significantly increased the SOA concentration by 148 %, which will be further constrained by the observation in next section.
To validate the model performance on regional OA simulation, we compared it with the measured concentrations of organic carbon (OC) in PM2.5 at multiple sites in the YRD region (Fig. S3). Although both BASE and I/SVOC-E simulations showed good correlations with the observation as shown in Fig. S3c, f, i, and l, OC concentrations in I/SVOC-E simulations in different seasons were all higher than those in the BASE simulations. In the BASE simulation, the modeled OC concentrations of each season only explained 51 % to 71 % of the observations. With the addition of I/SVOC emissions into I/SVOC-E simulation, the modeled OC concentrations agreed much better with the observations, with modeled OC increasing to 70 % to 91 % of the observations. Details for the statistical evaluation of model performance on OC in BASE and I/SVOC-E simulations are shown in Table S7.
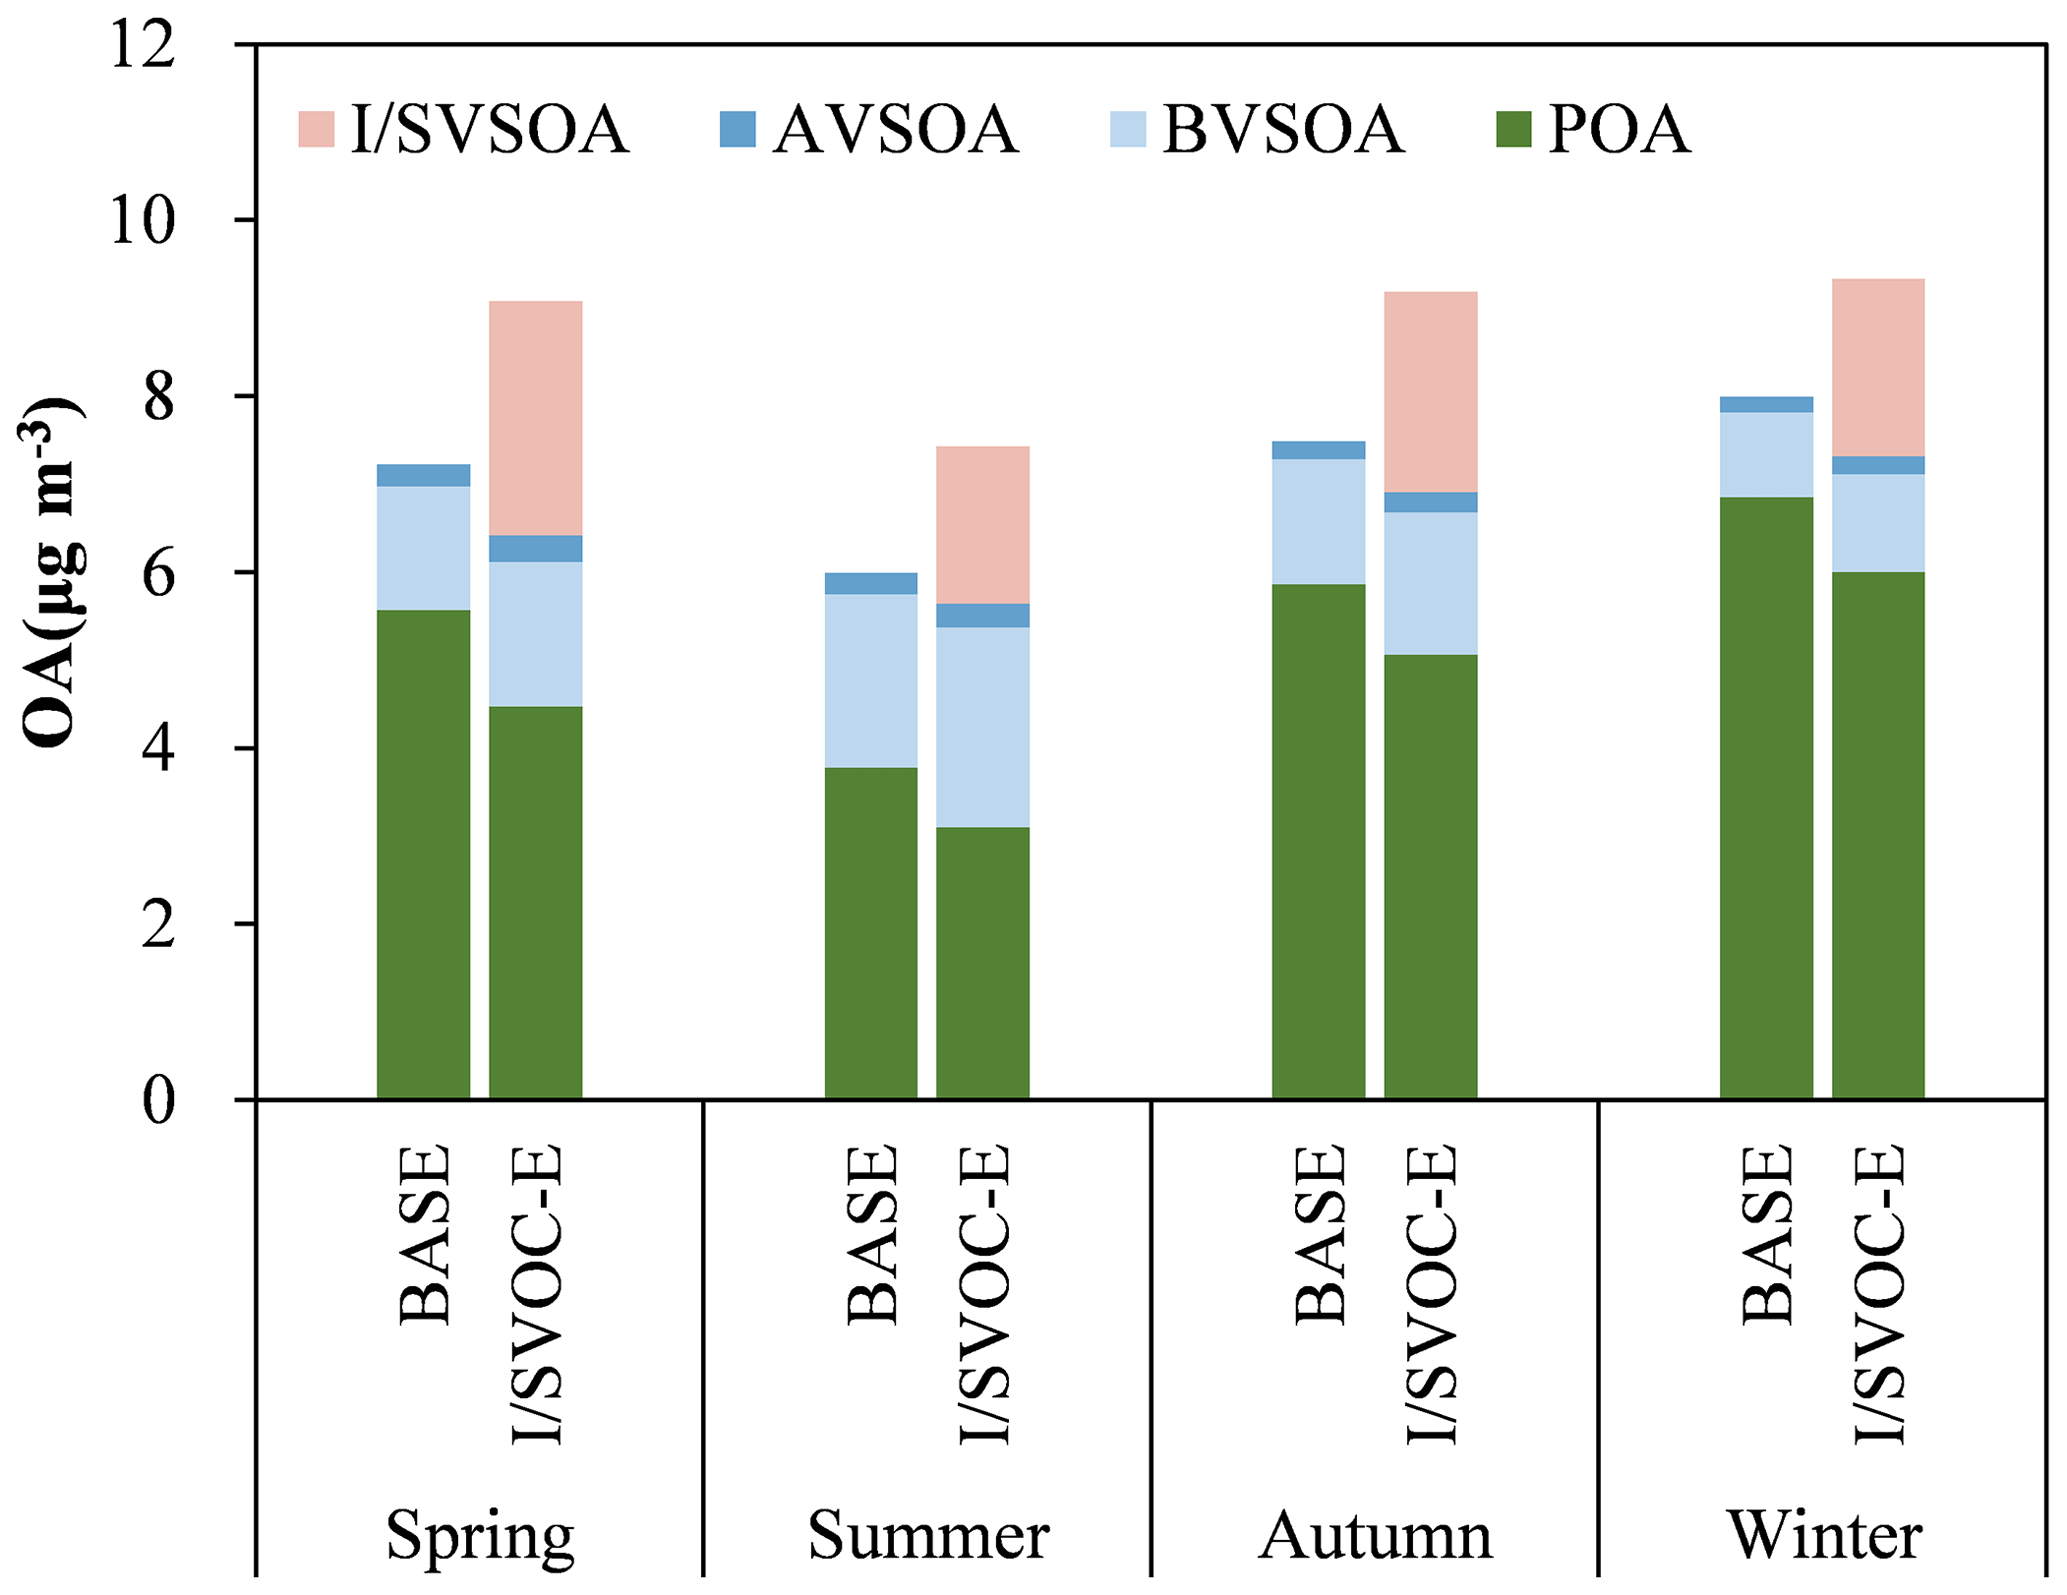
Figure 5Comparisons of the regional average concentrations of POA and SOA formed from AVOCs, BVOCs, and I/SVOCs in different seasons from the BASE and I/SVOC-E simulations.
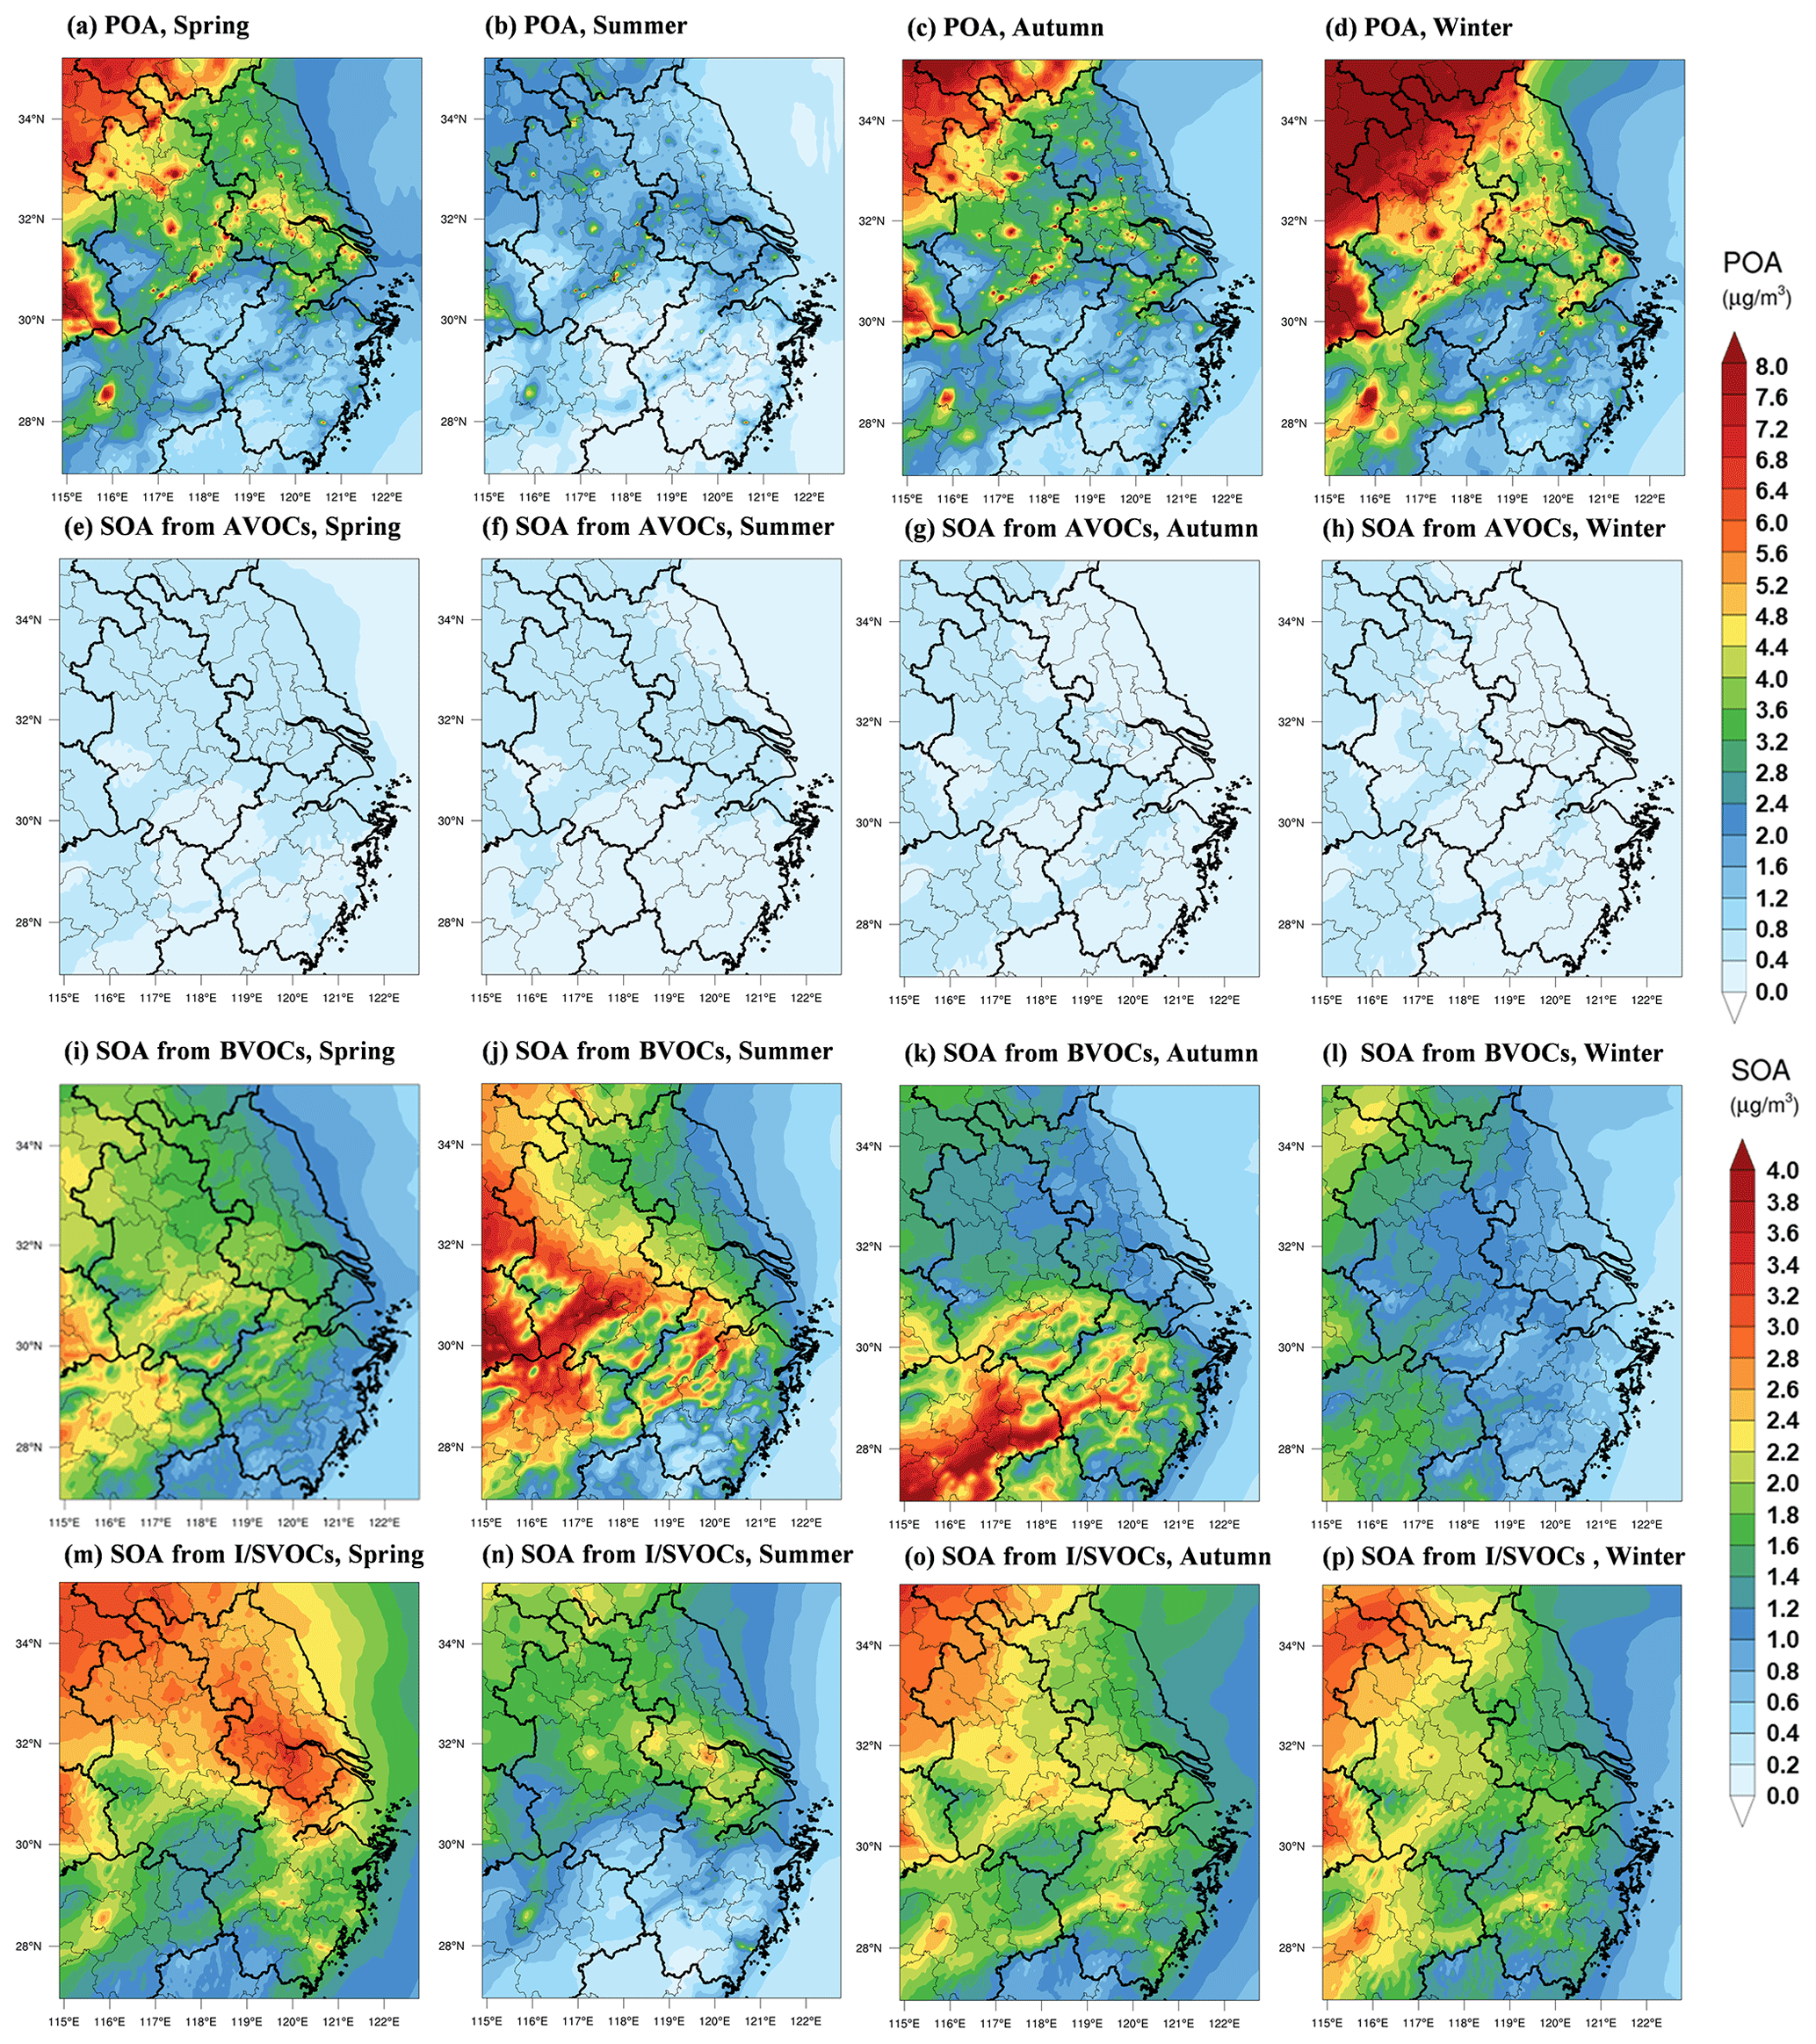
Figure 6Spatial distributions of modeled POA and SOA formed from AVOCs, BVOCs, and I/SVOCs in different seasons in the I/SVOC-E simulation.
3.2.3 Temporal variations of OA components: simulation vs. AMS observation
To further validate the model performance on the simulations of POA and SOA, we compared the simulation results with those measured by an AMS at the SAES supersite. Both simulation and observation results were obtained for PM1 aerosol particles (aerodynamic diameter <1 µm). Note that uncertainties exist when we directly compare the POA and SOA derived from the model with those resolved by AMS-PMF analysis since a clear split of POA and SOA from a measurement point of view can hardly be achieved. To minimize the uncertainty associated with the PMF analysis, comprehensive molecular identification of OA components was conducted, and multiple source apportionment model results were compared following the method given in D. Huang et al. (2021) to improve the accuracy of the factor separation. Figure 7 shows that the simulation results of POA, SOA and OA were similar to the observation results not only in average concentration levels but also in temporal variations. For POA, the diurnal patterns in the BASE and I/SVOC-E simulations agree with each other, and both can reproduce the observed concentrations. The POA concentrations in the I/SVOC-E simulation cases decreased by 4 %–18 % (Fig. S4) compared with the BASE case and was closer to the observations. Similarly to the observation results, the simulated POA concentrations peaked at noon and in the early evening, which was mainly contributed to by cooking emissions, as reported in our previous study (D. Huang et al., 2021).
For SOA, the average concentrations in spring, summer, fall, and winter in BASE simulation were 1.2, 1.6, 0.8, and 0.7 µg m−3, respectively, which were only 14 %–30 % of those observed by the AMS (see Fig. S4). The SOA simulation was improved in I/SVOC-E simulation with the modeled SOA concentrations of 3.8 3.7, 2.7, and 2.3 µg m−3 in spring, summer, fall, and winter respectively. The SOA concentrations in I/SVOC-E simulation were 2.4–3.6 times higher than those in BASE simulation, which was 40 % to 72 % of the observation, indicating the large contributions of I/SVOCs emissions to SOA production.
The I/SVOC-E simulation also demonstrated improvements in reproducing the temporal variations of SOA, especially during the daytime (Fig. 7e–h). Compared with the BASE simulation, evident increases in SOA concentrations during daytime can be observed in I/SVOC-E simulation (Fig. 7e–h), which agrees better with the observation. However, the model cannot fully capture the diurnal patterns of SOA observed in most seasons, except for the summer, when both the concentrations and diurnal variations of SOA are well reproduced. This may be attributed to several reasons. For example, heterogeneous and multiphase reactions have not been included in the model of this study but played important roles in SOA formation, especially during pollution episodes in cool seasons (Guo et al., 2020; Kim et al., 2022). Recent studies also found that nocturnal NO3 oxidation was also an important route for SOA formation, which would drive the enhancement of SOA during nighttime (Yu et al., 2019; Decker et al., 2021). Yet mechanism and parameterizations of these processes remain unclear, making the involvement of these processes in the model difficult. A recent study further found that there were considerable emissions of condensable particulate matter (CPM) from stationary sources in the industrial and energy sectors, which would effectively improve the contributions of the industrial sector to OA simulation especially in winter, and should also be considered in the future (Morino et al., 2018, 2022). In addition, I/SVOC emissions from outside of the YRD region might be underestimated due to the lack of a detailed base emission inventory, resulting in the corresponding underestimation of the transported SOA, which were prominent especially in fall, winter and spring in Shanghai. The development of a high-resolution I/SVOCs emissions inventory is urgently needed at a larger regional scale.
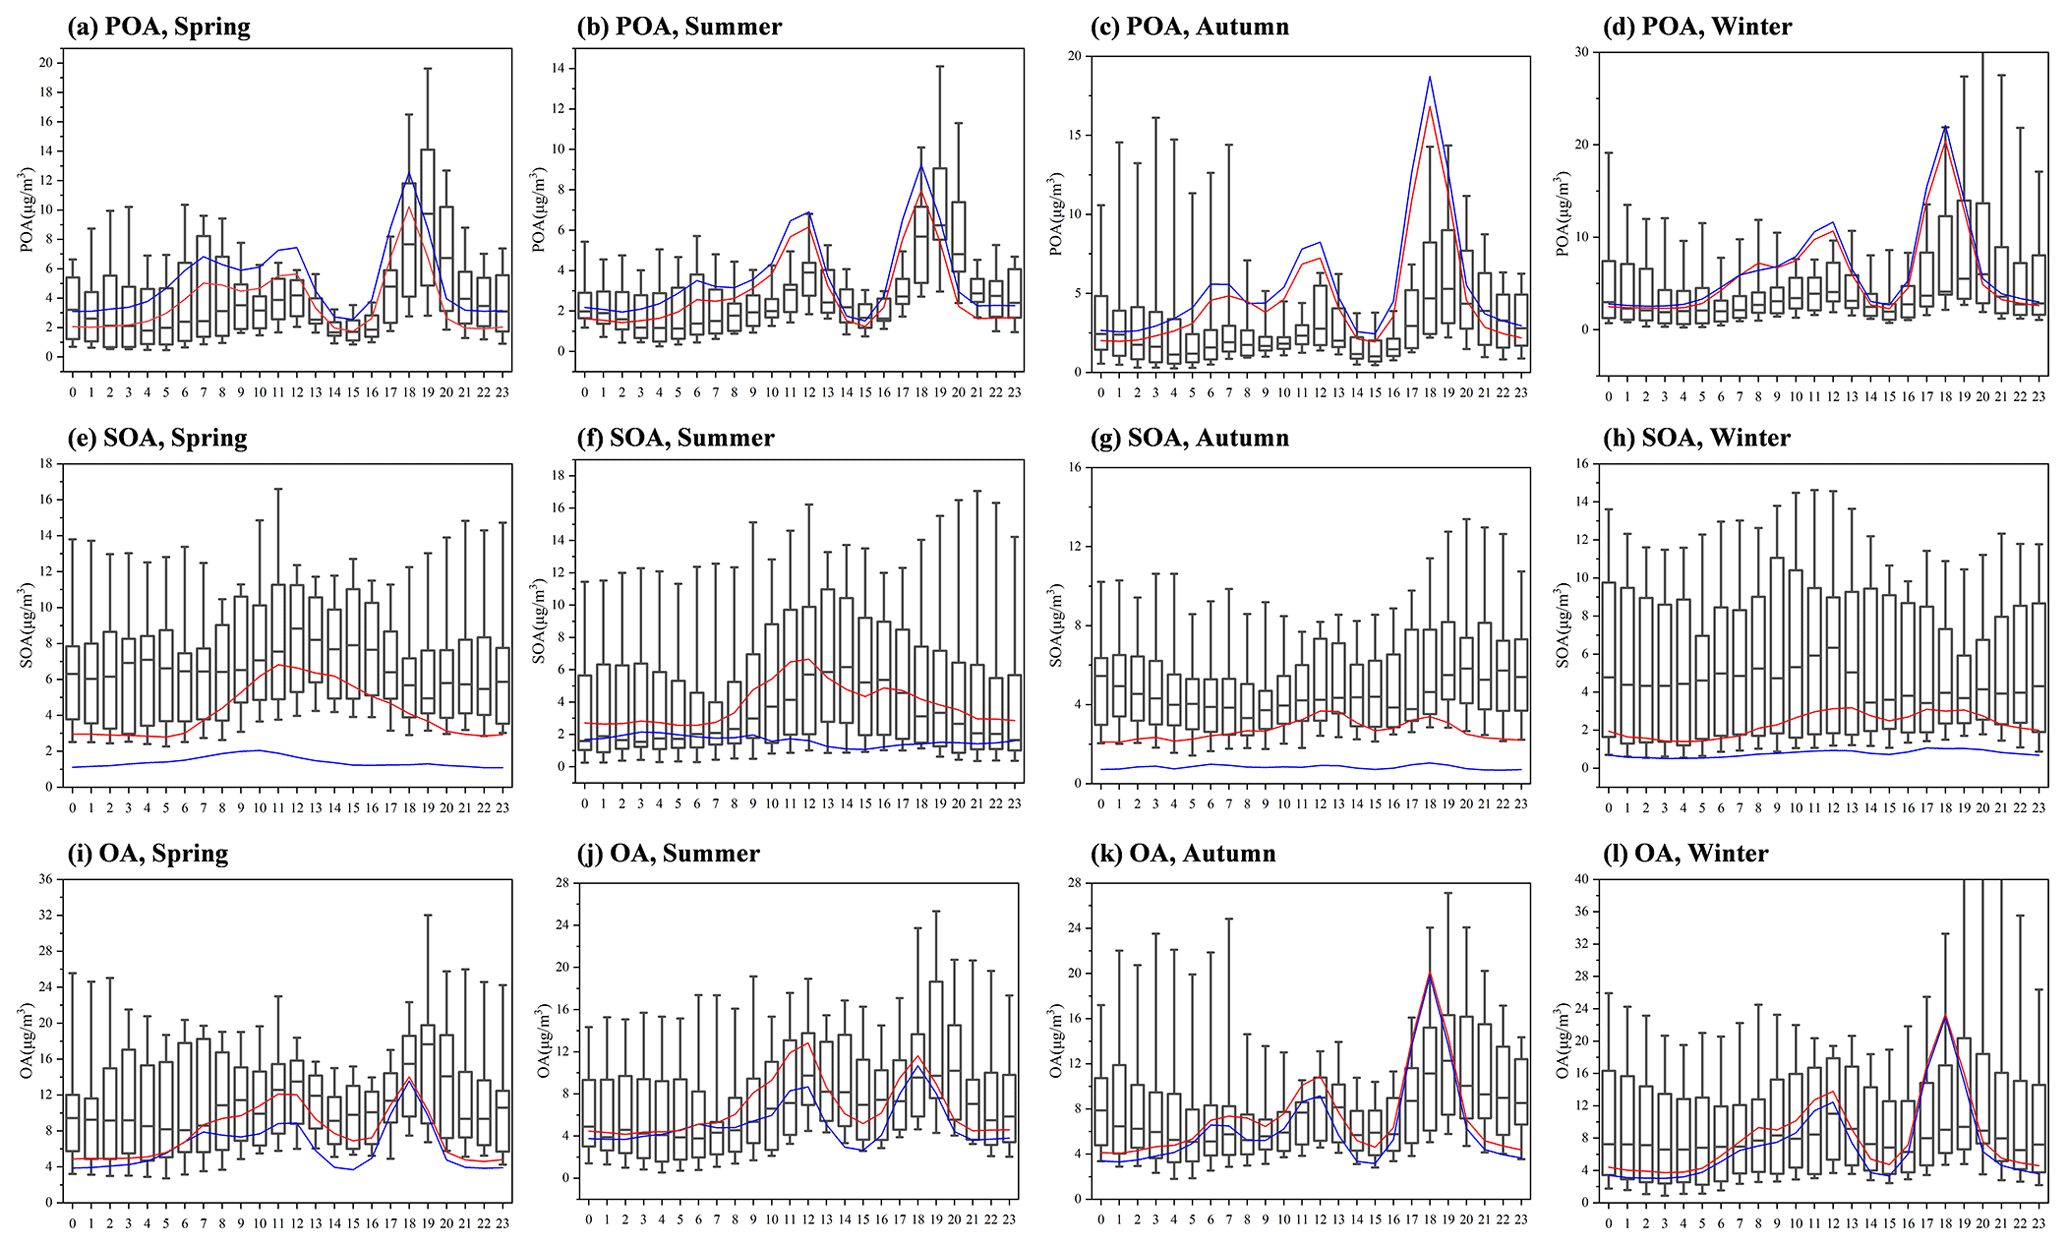
Figure 7Diurnal patterns of modeled POA, SOA, and OA concentrations in different seasons and their comparisons with the observations at the SAES supersite. The boxplots represent the diurnal patterns of the AMS observations. The blue and red lines, respectively, represent the diurnal patterns of the simulation results in BASE and I/SVOC-E cases.
3.3 OA source contributions
3.3.1 POA and SOA sources in the region
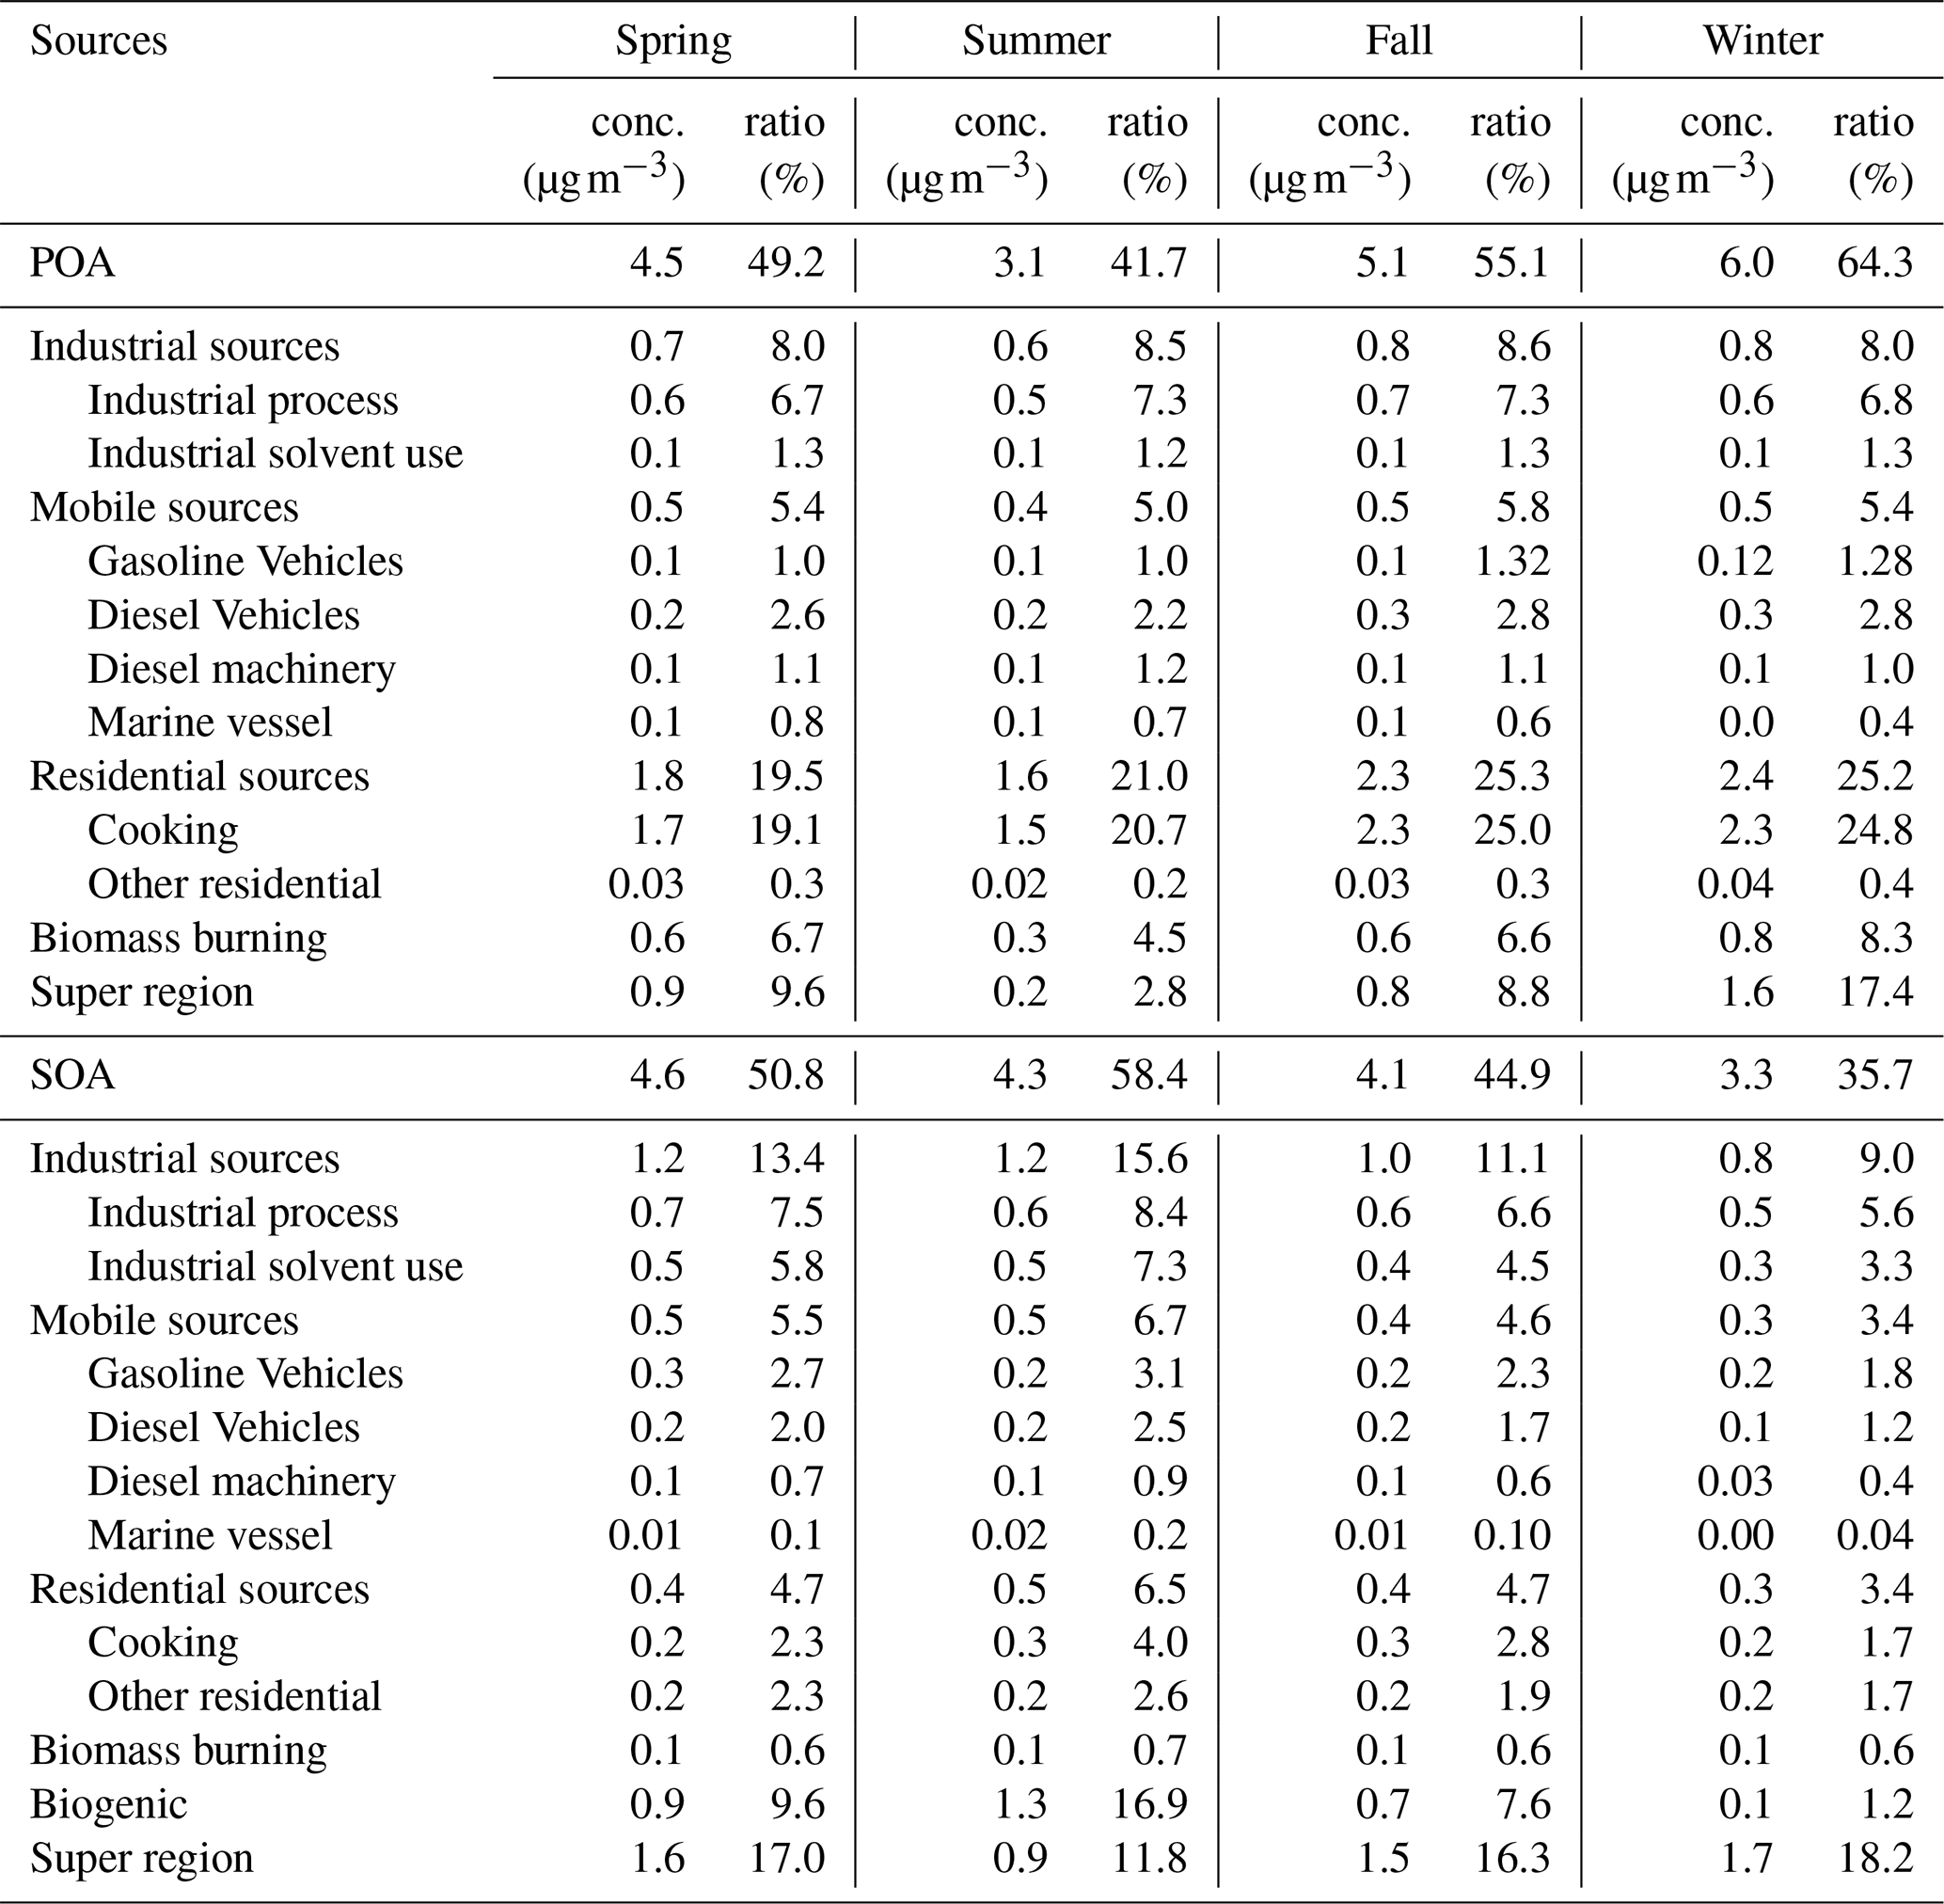
Based on the high-resolution I/SVOC emission inventory established in this study, we successfully simulated the POA and SOA concentrations from each source. Table 3 summarizes the regional average concentrations of POA and SOA originating from different sources and their relative contributions. Residential POA dominated the regional OA, with average concentrations ranged from 1.6 to 2.4 µg m−3 in different seasons, accounting for 19.5 %–25.3 % of the total OA, among which cooking emission is the dominant source (ca. 98 %) of residential POA. Other POA sources include industrial, biomass burning, and mobile sources, accounting for 8.0 %–8.6 %, 4. 5 %–8.3 %, and 5.0 %–5.8 % of the total OA, respectively. The cumulative fraction of POA in total OA from industrial and mobile sources was 13.4 %–14.4 %, close to that of HOA (15 %) observed by the AMS measurement in Shanghai (Fig. S5).
Industrial sources were the main source of SOA in the YRD region, with average SOA concentrations of 0.8–1.2 µg m−3 in four seasons, accounting for 9.0 %–15.6 % of the total OA, among which, industrial process and solvent-use sources had almost equal contributions. Mobile sources were the second largest source of SOA in this region, with an average concentration of 0.3–0.5 µg m−3, accounting for 3.4 %–6.7 % of the total OA. Among them, the source contribution of gasoline vehicles to SOA was 1.8 %–3.1 %, and that of diesel vehicles was 1.2 %–2.6 %. BVSOA showed significant seasonal differences with concentrations of 0.9, 1.3, 0.7, and 0.1 µg m−3, respectively in spring, summer, fall, and winter, accounting for 9.6 %, 16.9 %, 7.6 %, and 1.2 % of the total OA.
Overall, cooking emission was the major source of POA in YRD, accounting for 19.1 %–25.0 % of the total OA, which is consistent with our observations in Shanghai (D. Huang et al., 2021; Zhu et al., 2021). Both simulations and observations demonstrated higher contributions of cooking emission in urban China than those reported overseas (17 %–18 %) (Chen et al., 2021), which is attributed to the difference between Asian style and Western style cooking. The results emphasize that cooking emission has become a nonnegligible source of nonfossil carbon in urban areas in eastern China. Contributions from industrial sources ran second among all sources, accounting for 17.0 %–24.1 % of OA and 24.7 %–26.8 % of SOA, which is attributed to the high I/SVOC emissions from industrial sources and is consistent with previous studies (Miao et al., 2021). Other sources mainly include mobile sources (8.8 % to 11.7 % of OA) and biomass burning (5.2 %–8.9 % of OA). Specifically, diesel and gasoline vehicles were the major contributors among mobile sources, with higher contribution from the former (4.0 %–4.7 %) than the latter (3.1 %–4.0 %), followed by diesel machinery (1.3 %–2.1 %) and marine vessels (0.4 %–0.9 %). The contribution of biomass burning was highest in winter (8.9 %) compared to contributions of 5.2 %–7.3 % in other seasons, and it was even higher than contribution of mobile sources (8.76 %) in winter. The remaining 14.5 %–35.6 % of OA was from super region scale, which represented OA originated from emissions outside the YRD region. Our results were generally similar with those of Chang et al. (2022) for the YRD region. We both found the domestic combustion mainly engaged in cooking emissions had a major contribution to OA. Next was volatile chemical products (VCPs), especially the use of solvents, paints, and adhesives in industrial sector also made a high contribution. Note that industrial process also took up a high fraction in our OA simulation, while it was lower in the study by Chang et al. (2022). The difference in I/SVOC emission estimates was the main reason for this divergence. Mobile sources in both studies had similar contributions, which accounted for about 10 % of the total OA. Comparatively, our source classification was more specific, which will help identify more specific OA sources to design more refined regional control countermeasures.
Table 3POA and SOA source contributions of different emission sources in each season in the YRD region.
3.3.2 Spatial distributions of SOA originating from different sources
Figure 8 shows the spatial distributions of modeled SOA originating from different sources in each season in YRD region. Note that we only considered the SOA formed from the intraregional VOC and I/SVOC emissions, excluding those transported from the super region. A large spatial variability was observed for the sources of SOA driven by emissions. For example, industrial and mobile SOA concentrated in the eastern and central YRD, where I/SVOC emissions were high (Fig. 4). Residential and agricultural SOA presented a more uniform spatial distribution than industrial and mobile SOA, with enhanced formation in central and western YRD (Fig. 8i–l).
Although absolute source-dependent SOA concentrations differ in different seasons, low spatial variabilities were observed for different seasons. Industrial, mobile, and residential sources were the predominant contributors to SOA formation in eastern and central YRD, especially for the area along the Hangzhou Bay and Yangtze River, driven by the enhanced I/SVOC emissions. The spatial distributions of BVSOA were discussed above and will not be detailed here.
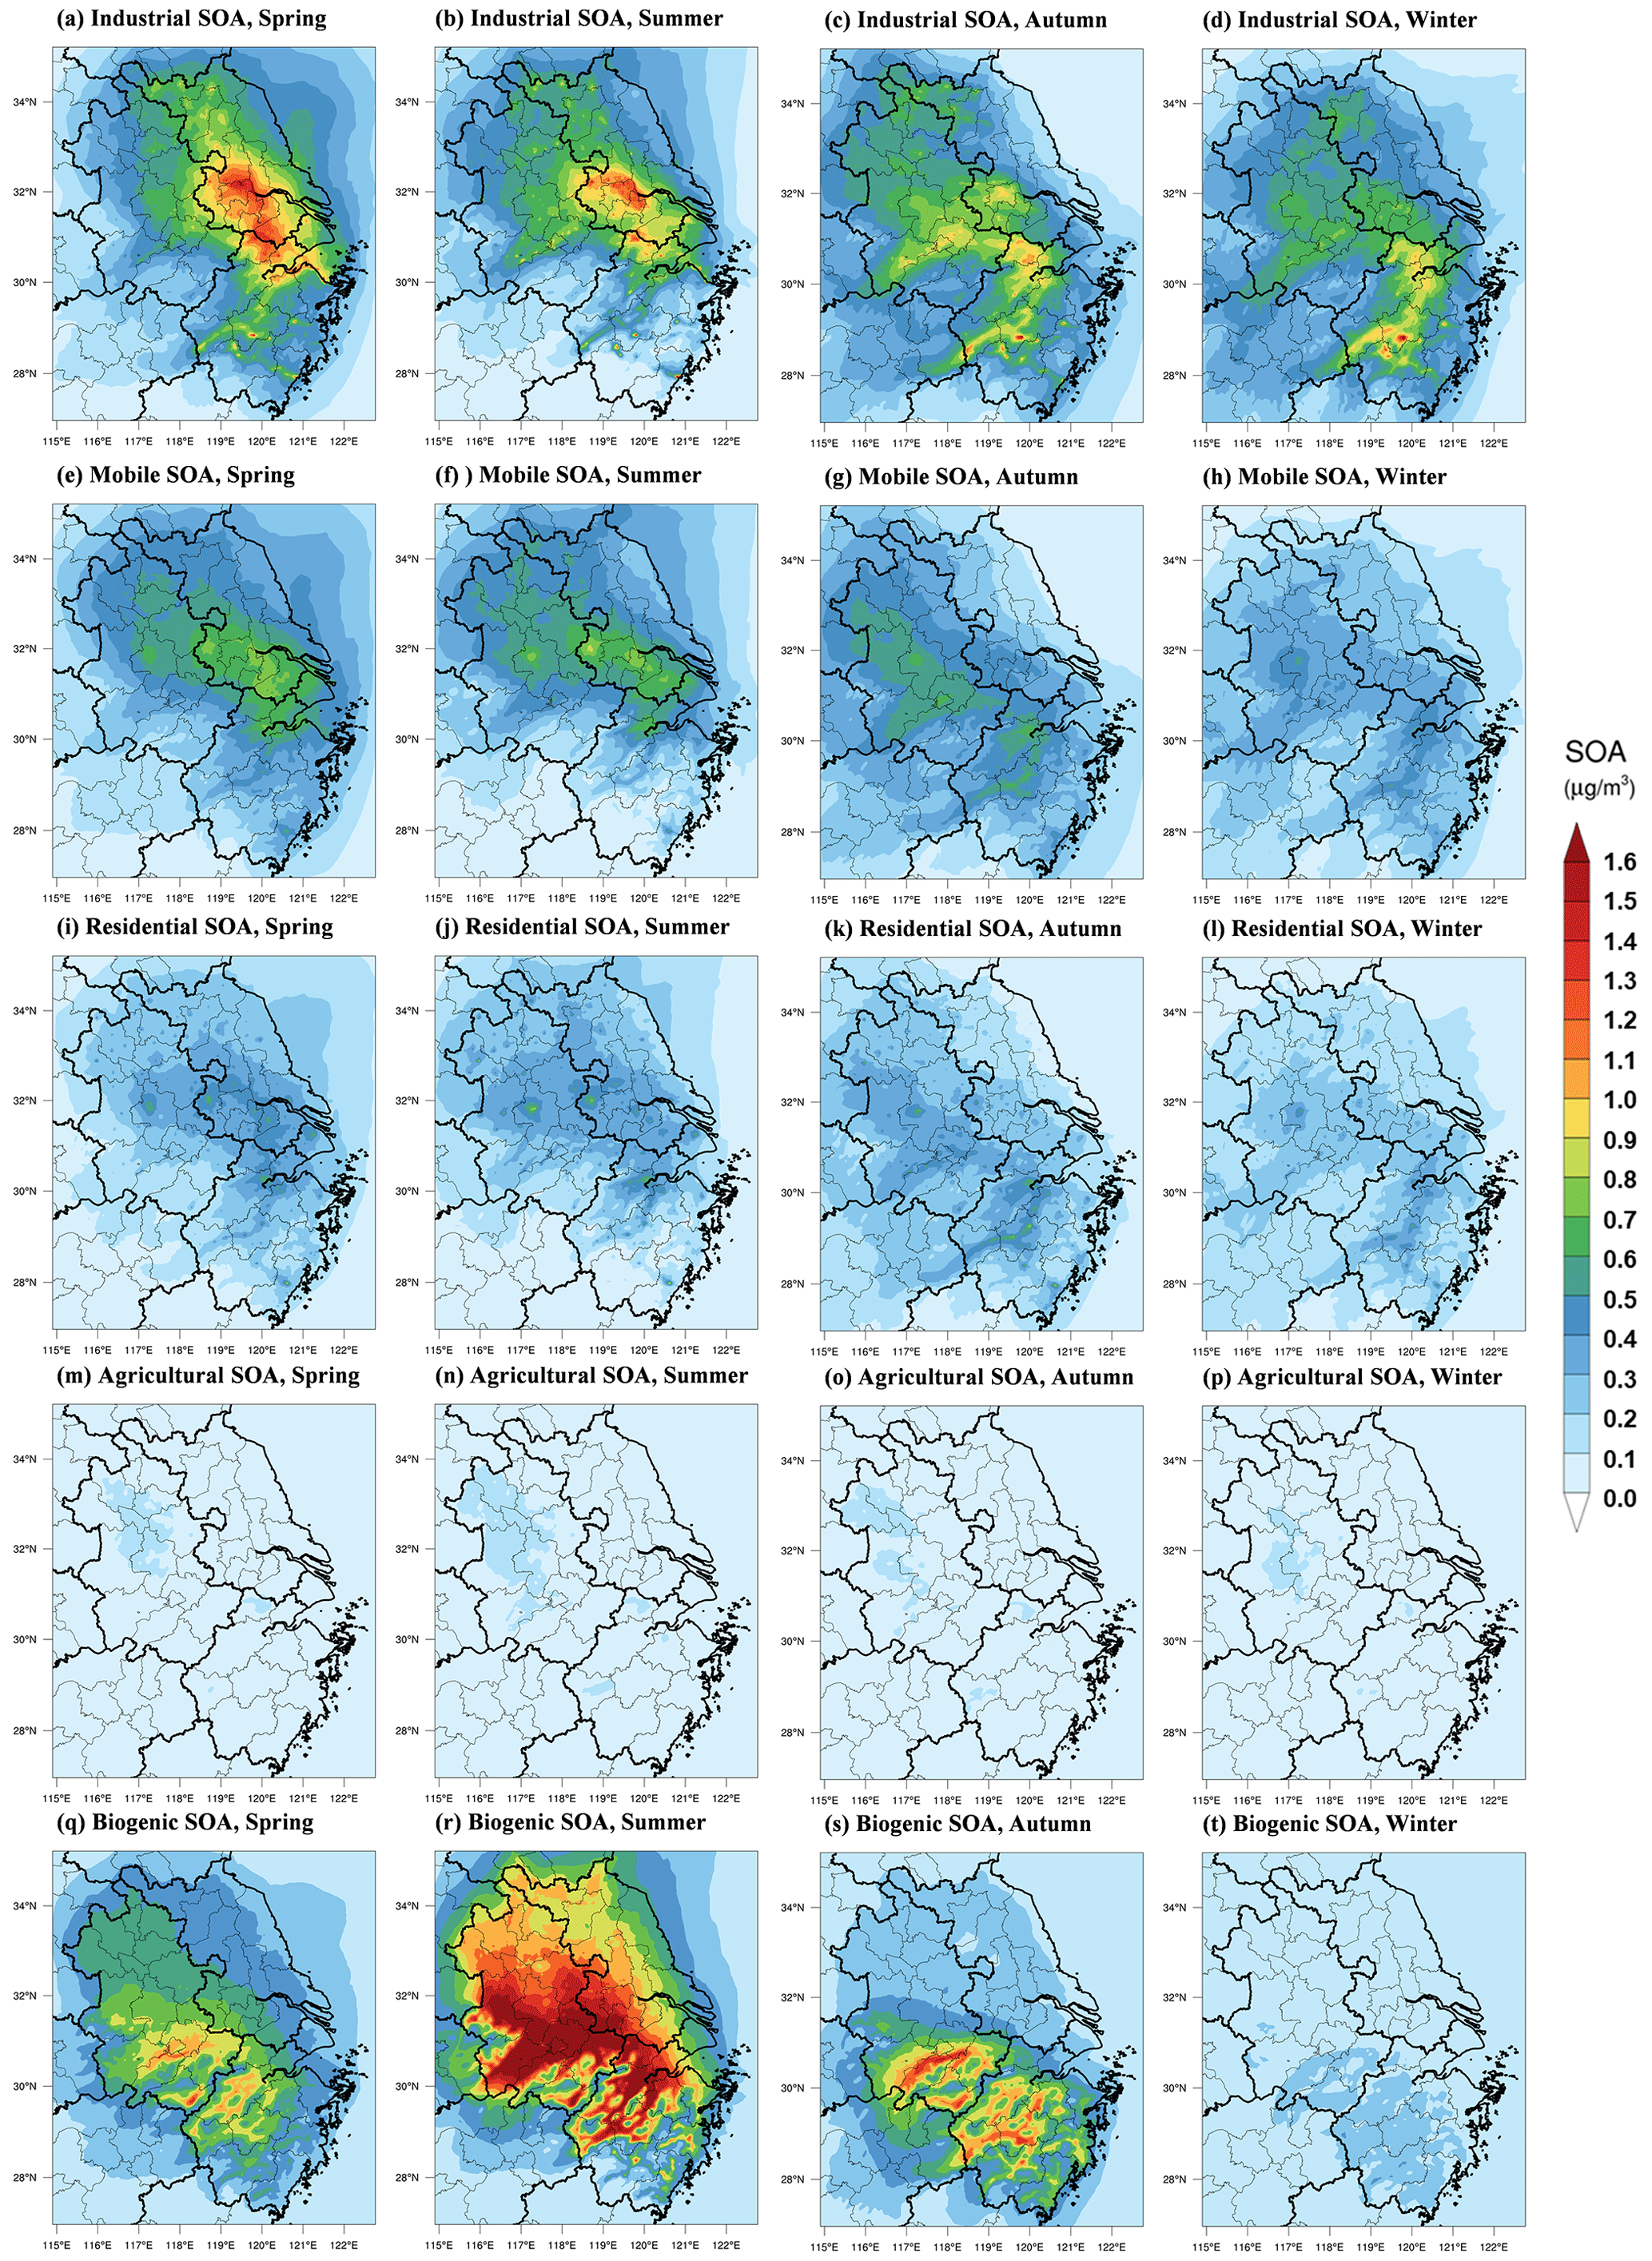
Figure 8Spatial distributions of modeled SOA concentrations from different sources in each season in the YRD region.
3.3.3 Predominant OA sources in sub-regions of YRD
To characterize the source contributions in different parts of the region, we categorized the simulation region into six sub-regions: northern YRD, western YRD, central YRD, eastern YRD, and southern YRD. Six representative cities in theses six regions were further selected for detailed a comparison of source contributions, including Xuzhou (XZ), Hefei (HF), Nanjing (NJ), Hangzhou (HZ), Shanghai (SH), and Jinhua (JH). Figure 9 shows their locations and OA source contributions during summer and winter.
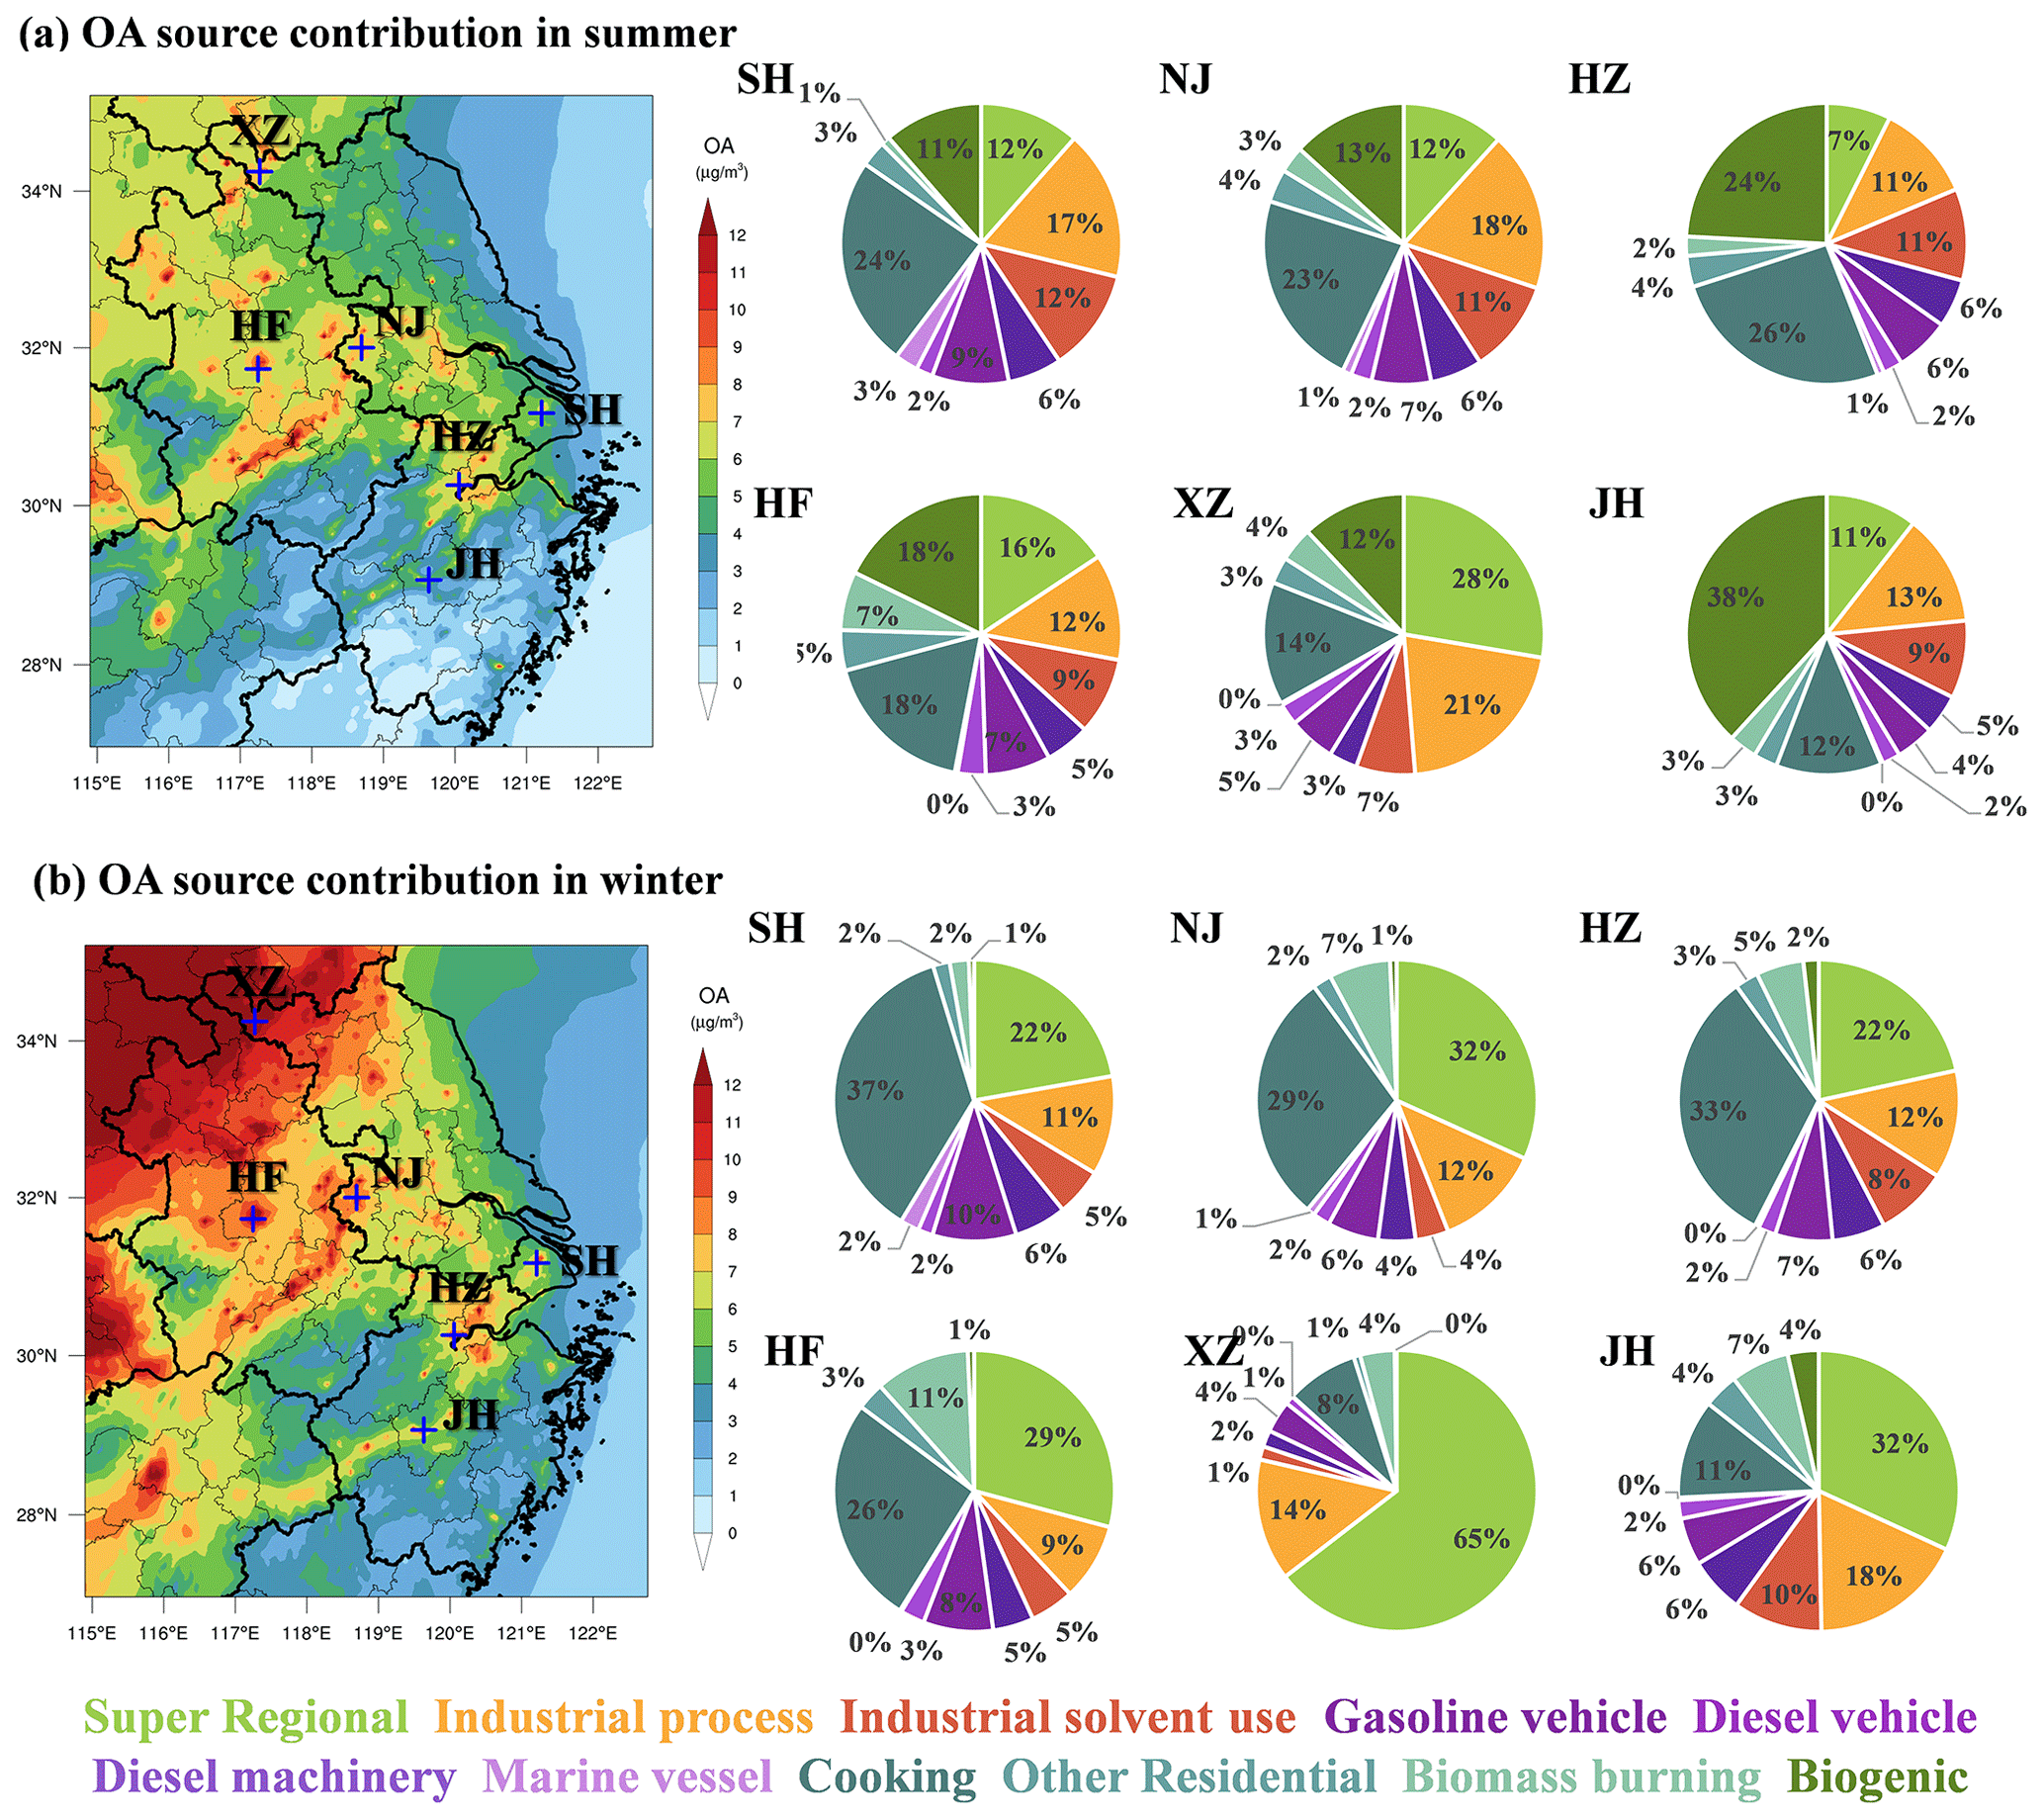
Figure 9Source contributions of modeled OA concentrations from different sources during summer and winter in different cities of the region.
In Northern YRD, represented by XZ, enhanced contribution from the super-regional scale to the local OA was observed for both winter (64.6 %) and summer (27.7 %), and the contributions from industrial processes (14.0 % in winter and 21.0 % in summer) were also higher than other sub-regions. Other major sources include biogenic (12.0 %) and cooking emissions (14.1 %) in summer and cooking (8.3 %) in winter. Taken together, super-regional transportation and industrial processes are predominant contributors of OA in northern YRD, accounting for 78.6 % and 48.7 % in summer and winter, respectively, followed by cooking emissions.
In western YRD, represented by HF, cooking emissions were the largest contributor to OA with contributions of 17.8 % and 26.3 % in both summer and winter, respectively, followed by super-regional contributions of 15.7 % (summer) and 29.2 % (winter). Other major sources also include mobile source of 15.5 %, biogenic source in summer (17.8 %), and industrial processes in both summer (12.3 %) and winter (8.9 %). In central YRD, represented by NJ and HZ, the relative source contributions were very similar to those in western YRD, with predominant contributions from cooking (22.8 %–32.6 %), followed by super-regional transportation (7.4 %–31.8 %), industrial processes (11.3 %–18.4 %), and mobile source (13.1 %–16.3 %).
In eastern YRD, represented by SH, the largest OA source was cooking emission, account for 24.3 % and 36.6 % of OA in summer and winter respectively, followed by mobile sources of 19 %, super-regional transportation of 11.5 % (summer) and 22.2 % (winter), and industrial processes of 17.3 % (summer) and 11.4 % (winter). In southern YRD, represented by JH, while biogenic contribution prevailed in summer (38.2 %), super-regional transportation was significant in winter (31.8 %). Similarly to other sub-regions, other major sources also included the contributions of cooking emission of 12.2 % (summer) and 11.4 % (winter), industrial processes of 12.9 % (summer) and 17.9 % (winter), and mobile sources of 13 %. Yet southern YRD presented more evident increase in the contribution from industrial solvent use compared with other sub-regions.
To summarize, cooking, super-regional transportation, industrial processes, and mobile sources were the predominant sources of OA in all sub-regions regardless of the season, albeit enhanced contributions from biogenic sources to the OA formation in summer were observed, especially in southern YRD. High contributions of cooking sources were in accordance with the distributions of populations, and high contributions of mobile sources were somewhat expected, especially in the city centers. Source contributions of OA varying in the intraregional scale implies that more targeted control measures need to be designed according to the emission features of each city. Specifically, for densely populated areas, it is necessary to strengthen the future control strategy of cooking emissions; special attention needs to be paid to the I/SVOC emissions from industrial sources in the eastern, central, and northern YRD regions; mobile sources show their significance in urban area of the region, dominated by the equal contributions from gasoline and diesel vehicles, indicating that further reductions on the I/SVOCs from vehicle emissions are, therefore, critical for pollution control on a city scale.
In this study, we established a high-resolution I/SVOC emission inventory with detailed source profiles and applied it into CMAQ v5.3.2 to simulate POA and SOA formation in YRD region of China. With the addition of I/SVOC emissions, simulation results show significant improvements on both temporal variations and spatial distributions of OA. Compared with the BASE simulation, where I/SVOC emissions were not included, the simulated SOA increased by 1.5 times in I/SVOC-E simulation, highlighting the significant contributions of I/SVOC emissions to SOA production. The remaining 10 %–30 % underestimation of OA indicates that future work is still needed to bridge the gap between simulation and observations, such as measuring local emission factors and source profiles of I/SVOC from various local sources and updating SOA formation mechanisms in the model framework.
With the addition of source-specific I/SVOC emissions, we successfully quantified the contribution of each source to POA and SOA concentrations in YRD. For POA, cooking emissions are the predominant source, which is concentrated in urban areas of YRD in accordance with the population distribution. For SOA, for the first time, we demonstrate that I/SVOCs from industrial sources are the dominant contributor, followed by those from mobile sources. In summer, the contributions of biogenic emissions to total SOA are also nonnegligible, especially for cities in southern YRD. Spatial and seasonal variations in the source contributions suggest that control strategies for OA pollution should vary by cities and seasons. For urban areas, cooking emissions have been emerging as an important POA source, not to mention the fact that their impact on SOA formation are not yet certain. Our results suggest that the control measures on the cooking emissions should be strengthened in the future for the further reduction of POA. Another important source of SOA in urban areas is mobile sources, especially gasoline and diesel vehicles. Reduction in I/SVOC emissions from vehicles are effective measures in the mitigation of urban air pollution, which is also technically feasible, as has been demonstrated by Qi et al. (2021). Continuous improvement in emission standards is one way to promote the reduction of motor vehicle-related SOA. Our study further reveals that nontailpipe sources of I/SVOCs (e.g., solvent use, petrochemical, etc.) are major contributors to SOA formation in the YRD region, which is consistent with Chang et al. (2022)'s model results on the national scale. However, the current understanding of SOA formation potentials from these sources is still far from enough. For example, the localized I/SVOC emission factors and source profiles of these sources are still missing. Their chemical behavior and SOA yields may be different from the emissions from mobile sources, which have been widely studied, which urges in-depth studies on these sources as well as the corresponding control measures.
The gridded emissions of I/SVOCs from various sources for the YRD region developed by this study at a horizontal resolution of 4 km × 4 km can be downloaded from the following website: https://doi.org/10.6084/m9.figshare.19536082.v1 (An et al., 2022). Additional related data are available upon request by contacting the corresponding author (Cheng Huang; huangc@saes.sh.cn).
The supplement related to this article is available online at: https://doi.org/10.5194/acp-23-323-2023-supplement.
CH, JA, DH, and MQ designed the research. CH and JA developed the I/SVOC emission inventory. JA, MQ, and RY performed the model. DH, LQ, MZ, YL, SZ, and QW collected the observation data. CH, JA, DH, and HW analyzed the results. CH, JA, and DH wrote the paper.
The contact author has declared that none of the authors has any competing interests.
Publisher's note: Copernicus Publications remains neutral with regard to jurisdictional claims in published maps and institutional affiliations.
We are grateful for the support from the National Natural Science Foundation of China, the Science and Technology Commission of the Shanghai Municipality, and the Shanghai Municipal Bureau of Ecology and Environment.
This work was supported by the National Natural Science Foundation of China (grant no. 21777101), the Science and Technology Commission of the Shanghai Municipality (grant no. 21230711000), the Shanghai Municipal Bureau of Ecology and Environment Fund Project (grant nos. 202001 and 202114), and the State Environmental Protection Key Laboratory of Formation and Prevention of Urban Air Pollution Complex (grant no. CX2020080576).
This paper was edited by Barbara Ervens and reviewed by three anonymous referees.
An, J., Huang, Y., Huang, C., Wang, X., Yan, R., Wang, Q., Wang, H., Jing, S., Zhang, Y., Liu, Y., Chen, Y., Xu, C., Qiao, L., Zhou, M., Zhu, S., Hu, Q., Lu, J., and Chen, C.: Emission inventory of air pollutants and chemical speciation for specific anthropogenic sources based on local measurements in the Yangtze River Delta region, China, Atmos. Chem. Phys., 21, 2003–2025, https://doi.org/10.5194/acp-21-2003-2021, 2021.
An, J., Huang, C., Huang, D., Qin, M., Yan, R., Qiao, L., Zhou, M., Li, Y., Zhu, S., Wang, Q., and Wang, H.: Sources of organic aerosols in east China: A modeling study with high-resolution intermediate-volatility and semi-volatile organic compound emissions, figshare [data set], https://doi.org/10.6084/m9.figshare.19536082.v1, 2022.
Boylan, J. W. and Russell, A. G.: PM and light extinction model performance metrics, goals, and criteria for three-dimensional air quality models, Atmos. Environ., 40, 4946–4959, 2006.
Cai, S., Zhu, L., Wang, S., Wisthaler, A., Li, Q., Jiang, J., and Hao, J.: Time-resolved intermediate-volatility and semivolatile organic compound emissions from household coal combustion in northern China, Environ. Sci. Technol., 53, 9269–9278, 2019.
Canagaratna, M. R., Jayne, J. T., Jimenez, J. L., Allan, J. D., Alfarra, M. R., Zhang, Q., Onasch, T. B., Drewnick, F., Coe, H., Middlebrook, A., Delia, A., Williams, L. R., Trimborn, A. M., Northway, M. J., DeCarlo, P. F., Kolb, C. E., Davidovits, P., and Worsnop, D. R.: Chemical and microphysical characterization of ambient aerosols with the aerodyne aerosol mass spectrometer, Mass Spectrom. Rev., 26, 185–222, 2007.
Canonaco, F., Crippa, M., Slowik, J. G., Baltensperger, U., and Prévôt, A. S. H.: SoFi, an IGOR-based interface for the efficient use of the generalized multilinear engine (ME-2) for the source apportionment: ME-2 application to aerosol mass spectrometer data, Atmos. Meas. Tech., 6, 3649–3661, https://doi.org/10.5194/amt-6-3649-2013, 2013.
Chang, X., Zhao, B., Zheng, H., Wang, S., Cai, S., Guo, F., Gui, P., Huang, G., Wu, D., Han, L., Xing, J., Man, H., Hu, R., Liang, C., Xu, Q., Qiu, X., Ding, D., Liu, K., Han, R., Robinson, A. L., and Donahue, N. M.: Full-volatility emission framework corrects missing and underestimated secondary organic aerosol sources, One Earth, 5, 403–412, 2022.
Chen, W., Ye, Y., Hu, W., Zhou, H., Pan, T., Wang, Y., Song, W., Song, Q., Ye, C., Wang, C., Wang, B., Huang, S., Yuan, B., Zhu, M., Lian, X., Zhang, G., Bi, X., Jiang, F., Liu, J., Canonaco, F., Prevot, A. S. H., Shao, M., and Wang, X.: Real-time characterization of aerosol compositions, sources, and aging processes in Guangzhou during PRIDE-GBA 2018 campaign, J. Geophys. Res.-Atmos., 126, e2021JD035114, https://doi.org/10.1029/2021JD035114, 2021.
Crippa, M., Canonaco, F., Lanz, V. A., Äijälä, M., Allan, J. D., Carbone, S., Capes, G., Ceburnis, D., Dall'Osto, M., Day, D. A., DeCarlo, P. F., Ehn, M., Eriksson, A., Freney, E., Hildebrandt Ruiz, L., Hillamo, R., Jimenez, J. L., Junninen, H., Kiendler-Scharr, A., Kortelainen, A.-M., Kulmala, M., Laaksonen, A., Mensah, A. A., Mohr, C., Nemitz, E., O'Dowd, C., Ovadnevaite, J., Pandis, S. N., Petäjä, T., Poulain, L., Saarikoski, S., Sellegri, K., Swietlicki, E., Tiitta, P., Worsnop, D. R., Baltensperger, U., and Prévôt, A. S. H.: Organic aerosol components derived from 25 AMS data sets across Europe using a consistent ME-2 based source apportionment approach, Atmos. Chem. Phys., 14, 6159–6176, https://doi.org/10.5194/acp-14-6159-2014, 2014.
Cross, E. S., Hunter, J. F., Carrasquillo, A. J., Franklin, J. P., Herndon, S. C., Jayne, J. T., Worsnop, D. R., Miake-Lye, R. C., and Kroll, J. H.: Online measurements of the emissions of intermediate-volatility and semi-volatile organic compounds from aircraft, Atmos. Chem. Phys., 13, 7845–7858, https://doi.org/10.5194/acp-13-7845-2013, 2013.
Decker, Z. C. J., Robinson, M. A., Barsanti, K. C., Bourgeois, I., Coggon, M. M., DiGangi, J. P., Diskin, G. S., Flocke, F. M., Franchin, A., Fredrickson, C. D., Gkatzelis, G. I., Hall, S. R., Halliday, H., Holmes, C. D., Huey, L. G., Lee, Y. R., Lindaas, J., Middlebrook, A. M., Montzka, D. D., Moore, R., Neuman, J. A., Nowak, J. B., Palm, B. B., Peischl, J., Piel, F., Rickly, P. S., Rollins, A. W., Ryerson, T. B., Schwantes, R. H., Sekimoto, K., Thornhill, L., Thornton, J. A., Tyndall, G. S., Ullmann, K., Van Rooy, P., Veres, P. R., Warneke, C., Washenfelder, R. A., Weinheimer, A. J., Wiggins, E., Winstead, E., Wisthaler, A., Womack, C., and Brown, S. S.: Nighttime and daytime dark oxidation chemistry in wildfire plumes: an observation and model analysis of FIREX-AQ aircraft data, Atmos. Chem. Phys., 21, 16293–16317, https://doi.org/10.5194/acp-21-16293-2021, 2021.
Donahue, N. M., Robinson, A. L., Stanier, C. O., and Pandis, S. N.: Coupled Partitioning, Dilution, and Chemical Aging of Semivolatile Organics, Environ. Sci. Technol., 40, 2635–2643, 2006.
Donahue, N. M., Robinson, A. L., and Pandis, S. N.: Atmospheric organic particulate matter: From smoke to secondary organic aerosol, Atmos. Environ., 43, 94–106, 2009.
Drozd, G. T., Zhao, Y., Saliba, G., Frodin, B., Maddox, C., Oliver Chang, M.-C., Maldonado, H., Sardar, S., Weber, R. J., Robinson, A. L., and Goldstein, A. H.: Detailed speciation of intermediate volatility and semivolatile organic compound emissions from gasoline vehicles: Effects of cold-starts and implications for secondary organic aerosol formation, Environ. Sci. Technol., 53, 1706–1714, 2019.
Drozd, G. T., Weber, R. J., and Goldstein, A. H.: Highly resolved composition during diesel evaporation with modeled ozone and secondary aerosol formation: Insights into pollutant formation from evaporative intermediate volatility organic compound sources, Environ. Sci. Technol., 55, 5742–5751, 2021.
Emery, C., Tai, E., and Yarwood, G.: Enhanced meteorological modeling and performance evaluation for two Texas ozone episodes, prepared for the Texas natural resource conservation commission, by ENVIRON International Corporation, 2001.
Emmons, L. K., Walters, S., Hess, P. G., Lamarque, J.-F., Pfister, G. G., Fillmore, D., Granier, C., Guenther, A., Kinnison, D., Laepple, T., Orlando, J., Tie, X., Tyndall, G., Wiedinmyer, C., Baughcum, S. L., and Kloster, S.: Description and evaluation of the Model for Ozone and Related chemical Tracers, version 4 (MOZART-4), Geosci. Model Dev., 3, 43–67, https://doi.org/10.5194/gmd-3-43-2010, 2010.
Gentner, D. R., Isaacman, G., Worton, D. R., Chan, A. W. H., Dallmann, T. R., Davis, L., Liu, S., Day, D. A., Russell, L. M., Wilson, K. R., Weber, R., Guha, A., Harley, R. A., and Goldstein, A. H.: Elucidating secondary organic aerosol from diesel and gasoline vehicles through detailed characterization of organic carbon emissions, P. Natl. Acad. Sci. USA, 109, 18318–18323, 2012.
Guo, J., Zhou, S., Cai, M., Zhao, J., Song, W., Zhao, W., Hu, W., Sun, Y., He, Y., Yang, C., Xu, X., Zhang, Z., Cheng, P., Fan, Q., Hang, J., Fan, S., Wang, X., and Wang, X.: Characterization of submicron particles by time-of-flight aerosol chemical speciation monitor (ToF-ACSM) during wintertime: aerosol composition, sources, and chemical processes in Guangzhou, China, Atmos. Chem. Phys., 20, 7595–7615, https://doi.org/10.5194/acp-20-7595-2020, 2020.
Hallquist, M., Wenger, J. C., Baltensperger, U., Rudich, Y., Simpson, D., Claeys, M., Dommen, J., Donahue, N. M., George, C., Goldstein, A. H., Hamilton, J. F., Herrmann, H., Hoffmann, T., Iinuma, Y., Jang, M., Jenkin, M. E., Jimenez, J. L., Kiendler-Scharr, A., Maenhaut, W., McFiggans, G., Mentel, Th. F., Monod, A., Prévôt, A. S. H., Seinfeld, J. H., Surratt, J. D., Szmigielski, R., and Wildt, J.: The formation, properties and impact of secondary organic aerosol: current and emerging issues, Atmos. Chem. Phys., 9, 5155–5236, https://doi.org/10.5194/acp-9-5155-2009, 2009.
Hayes, P. L., Ortega, A. M., Cubison, M. J., Froyd, K. D., Zhao, Y., Cliff, S. S., Hu, W. W., Toohey, D. W., Flynn, J. H., Lefer, B. L., Grossberg, N., Alvarez, S., Rappenglück, B., Taylor, J. W., Allan, J. D., Holloway, J. S., Gilman, J. B., Kuster, W. C., de Gouw, J. A., Massoli, P., Zhang, X., Liu, J., Weber, R. J., Corrigan, A. L., Russell, L. M., Isaacman, G., Worton, D. R., Kreisberg, N. M., Goldstein, A. H., Thalman, R., Waxman, E. M., Volkamer, R., Lin, Y. H., Surratt, J. D., Kleindienst, T. E., Offenberg, J. H., Dusanter, S., Griffith, S., Stevens, P. S., Brioude, J., Angevine, W. M., and Jimenez, J. L.: Organic aerosol composition and sources in Pasadena, California, during the 2010 CalNex campaign, J. Geophys. Res.-Atmos., 118, 9233–9257, 2013.
Huang, C., Hu, Q., Li, Y., Tian, J., Ma, Y., Zhao, Y., Feng, J., An, J., Qiao, L., Wang, H., Jing, S., Huang, D., Lou, S., Zhou, M., Zhu, S., Tao, S., and Li, L.: Intermediate volatility organic compound emissions from a large cargo vessel operated under real-world conditions, Environ. Sci. Technol., 52, 12934–12942, 2018.
Huang, D., Zhu, S., An, J., Wang, Q., Qiao, L., Zhou, M., He, X., Ma, Y., Sun, Y., Huang, C., Yu, J., and Zhang, Q.: Comparative assessment of cooking emission contributions to urban organic aerosol using online molecular tracers and aerosol mass spectrometry measurements, Environ. Sci. Technol., 55, 14526–14535, 2021.
Huang, L., Wang, Q., Wang, Y., Emery, C., Zhu, A., Zhu, Y., Yin, S., Yarwood, G., Zhang, K., and Li, L.: Simulation of secondary organic aerosol over the Yangtze River Delta region: The impacts from the emissions of intermediate volatility organic compounds and the SOA modeling framework, Atmos. Environ., 246, 118079, https://doi.org/10.1016/j.atmosenv.2020.118079, 2021.
Huang, R. J., Zhang, Y., Bozzetti, C., Ho, K., Cao, J., Han, Y., Daellenbach, K. R., Slowik, J. G., Platt, S. M., Canonaco, F., Zotter, P., Wolf, R., Pieber, S. M., Bruns, E. A., Crippa, M., Ciarelli, G., Piazzalunga, A., Schwikowski, M., Abbaszade, G., Schnelle-Kreis, J., Zimmermann, R., An, Z., Szidat, S., Baltensperger, U., El Haddad, I., and Prévôt, A. S. H.: High secondary aerosol contribution to particulate pollution during haze events in China, Nature, 514, 218–222, 2014.
Huffman, J., Docherty, K., Mohr, C., Cubison, M., Ulbrich, I., Ziemann, P., Onasch, T., and Jimenez, J.: Chemically-resolved volatility measurements of organic aerosol from different sources, Environ. Sci. Technol., 43, 5351–5357, 2009.
Jathar, S. H., Gordon, T. D., Hennigan, C. J., Pye, H. O. T., Pouliot, G., Adams, P. J., Donahue, N. M., and Robinson, A. L.: Unspeciated organic emissions from combustion sources and their influence on the secondary organic aerosol budget in the United States, P. Natl. Acad. Sci. USA, 111, 10473–10478, 2014.
Jathar, S. H., Woody, M., Pye, H. O. T., Baker, K. R., and Robinson, A. L.: Chemical transport model simulations of organic aerosol in southern California: model evaluation and gasoline and diesel source contributions, Atmos. Chem. Phys., 17, 4305–4318, https://doi.org/10.5194/acp-17-4305-2017, 2017.
Jimenez, J. L., Canagaratna, M. R., Donahue, N. M., Prevot, A. S. H., Zhang, Q., Kroll, J. H., DeCarlo, P. F., Allan, J. D., Coe, H., Ng, N. L., Aiken, A. C., Docherty, K. S., Ulbrich, I. M., Grieshop, A. P., Robinson, A. L., Duplissy, J., Smith, J. D., Wilson, K. R., Lanz, V. A., Hueglin, C., Sun, Y. L., Tian, J., Laaksonen, A., Raatikainen, T., Rautiainen, J., Vaattovaara, P., Ehn, M., Kulmala, M., Tomlinson, J. M., Collins, D. R., Cubison, M. J., Dunlea, J., Huffman, J. A., Onasch, T. B., Alfarra, M. R., Williams, P. I., Bower, K., Kondo, Y., Schneider, J., Drewnick, F., Borrmann, S., Weimer, S., Demerjian, K., Salcedo, D., Cottrell, L., Griffin, R., Takami, A., Miyoshi, T., Hatakeyama, S., Shimono, A., Sun, J. Y., Zhang, Y. M., Dzepina, K., Kimmel, J. R., Sueper, D., Jayne, J. T., Herndon, S. C., Trimborn, A. M., Williams, L. R., Wood, E. C., Middlebrook, A. M., Kolb, C. E., Baltensperger, U., and Worsnop, D. R.: Evolution of Organic Aerosols in the Atmosphere, Science, 326, 1525–1529, 2009.
Kim, D., Cho, C., Jeong, S., Lee, S., Nault, B. A., Campuzano-Jost, P., Day, D. A., Schroder, J. C., Jimenez, J. L., Volkamer, R., Blake, D. R., Wisthaler, A., Fried, A., DiGangi, J. P., Diskin, G. S., Pusede, S. E., Hall, S. R., Ullmann, K., Huey, L. G., Tanner, D. J., Dibb, J., Knote, C. J., and Min, K.-E.: Field observational constraints on the controllers in glyoxal (CHOCHO) reactive uptake to aerosol, Atmos. Chem. Phys., 22, 805–821, https://doi.org/10.5194/acp-22-805-2022, 2022.
Kim, Y., Couvidat, F., Sartelet, K., and Seigneur, C.: Comparison of different gas-phase mechanisms and aerosol modules for simulating particulate matter formation, J. Air Waste Manage., 61, 1218–1226, 2011.
Koo, B., Knipping, E., and Yarwood, G.: 1.5-Dimensional volatility basis set approach for modeling organic aerosol in CAMx and CMAQ, Atmos. Environ., 95, 158–164, 2014.
Koss, A. R., Sekimoto, K., Gilman, J. B., Selimovic, V., Coggon, M. M., Zarzana, K. J., Yuan, B., Lerner, B. M., Brown, S. S., Jimenez, J. L., Krechmer, J., Roberts, J. M., Warneke, C., Yokelson, R. J., and de Gouw, J.: Non-methane organic gas emissions from biomass burning: identification, quantification, and emission factors from PTR-ToF during the FIREX 2016 laboratory experiment, Atmos. Chem. Phys., 18, 3299–3319, https://doi.org/10.5194/acp-18-3299-2018, 2018.
Li, J., Han, Z., Li, J., Liu, R., Wu, Y., Liang, L., and Zhang, R.: The formation and evolution of secondary organic aerosol during haze events in Beijing in wintertime, Sci. Total Environ., 703, 134937, https://doi.org/10.1016/j.scitotenv.2019.134937, 2020.
Li, J., Cao, L., Gao, W., He, L., Yan, Y., He, Y., Pan, Y., Ji, D., Liu, Z., and Wang, Y.: Seasonal variations in the highly time-resolved aerosol composition, sources and chemical processes of background submicron particles in the North China Plain, Atmos. Chem. Phys., 21, 4521–4539, https://doi.org/10.5194/acp-21-4521-2021, 2021.
Li, J., Han, Z., Wu, J., Tao, J., Li, J., Sun, Y., Liang, L., Liang, M., and Wang, Q.: Secondary organic aerosol formation and source contributions over east China in summertime, Environ. Pollut., 306, 119383, https://doi.org/10.1016/j.envpol.2022.119383, 2022.
Li, M., Zhang, Q., Kurokawa, J.-I., Woo, J.-H., He, K., Lu, Z., Ohara, T., Song, Y., Streets, D. G., Carmichael, G. R., Cheng, Y., Hong, C., Huo, H., Jiang, X., Kang, S., Liu, F., Su, H., and Zheng, B.: MIX: a mosaic Asian anthropogenic emission inventory under the international collaboration framework of the MICS-Asia and HTAP, Atmos. Chem. Phys., 17, 935–963, https://doi.org/10.5194/acp-17-935-2017, 2017.
Li, Y., Ren, B., Qiao, Z., Zhu, J., Wang, H., Zhou, M., Qiao, L., Lou, S., Jing, S., Huang, C., Tao, S., Rao, P., and Li, J.: Characteristics of atmospheric intermediate volatility organic compounds (IVOCs) in winter and summer under different air pollution levels, Atmos. Environ., 210, 58–65, 2019.
Li, Y. J., Sun, Y. L., Zhang, Q., Li, X., Li, M., Zhou, Z., and Chan, C. K.: Real-time chemical characterization of atmospheric particulate matter in China: A review, Atmos. Environ., 158, 270–304, 2017.
Liggio, J., Li, S., Hayden, K., Taha, Y. M., Stroud, C., Darlington, A., Drollette, B. D., Gordon, M., Lee, P., Liu, P., Leithead, A., Moussa, S. G., Wang, D., Brien, J. O., Mittermeier, R. L., Osthoff, H. D., Makar, P. A., Zhang, J., Brook, J. R., Lu, G., Staebler, R. M., Han, Y., Travis, W., Plata, D. L., and Gentner, D. R.: Oil sands operations as a large source of secondary organic aerosols, Nature, 534, 1–16, 2016.
Ling, Z., Wu, L., Wang, Y., Shao, M., Wang, X., and Huang, W.: Roles of semivolatile and intermediate-volatility organic compounds in secondary organic aerosol formation and its implication: A review, J. Environ. Sci., 114, 259–285, 2022.
Liu, H., Man, H., Cui, H., Wang, Y., Deng, F., Wang, Y., Yang, X., Xiao, Q., Zhang, Q., Ding, Y., and He, K.: An updated emission inventory of vehicular VOCs and IVOCs in China, Atmos. Chem. Phys., 17, 12709–12724, https://doi.org/10.5194/acp-17-12709-2017, 2017.
Liu, H., Meng, Z., Lv, Z., Wang, X., Deng, F., Liu, Y., Zhang, Y., Shi, M., Zhang, Q., and He, K.: Emissions and health impacts from global shipping embodied in US–China bilateral trade, Nat. Sustain., 2, 1027–1033, 2019.
Liu, Y., Li, L., An, J., Huang, L., Yan, R., Huang, C., Wang, H., Wang, Q., Wang, M., and Zhang, W.: Estimation of biogenic VOC emissions and its impact on ozone formation over the Yangtze River Delta region, China, Atmos. Environ., 186, 113–128, 2018.
Liu, Z., Gao, W., Yu, Y., Hu, B., Xin, J., Sun, Y., Wang, L., Wang, G., Bi, X., Zhang, G., Xu, H., Cong, Z., He, J., Xu, J., and Wang, Y.: Characteristics of PM2.5 mass concentrations and chemical species in urban and background areas of China: emerging results from the CARE-China network, Atmos. Chem. Phys., 18, 8849–8871, https://doi.org/10.5194/acp-18-8849-2018, 2018.
Louvaris, E. E., Florou, K., Karnezi, E., Papanastasiou, D. K., Gkatzelis, G. I., and Pandis, S. N.: Volatility of source apportioned wintertime organic aerosol in the city of Athens, Atmos. Environ., 158, 138–147, 2017.
Lu, Q., Murphy, B. N., Qin, M., Adams, P. J., Zhao, Y., Pye, H. O. T., Efstathiou, C., Allen, C., and Robinson, A. L.: Simulation of organic aerosol formation during the CalNex study: updated mobile emissions and secondary organic aerosol parameterization for intermediate-volatility organic compounds, Atmos. Chem. Phys., 20, 4313–4332, https://doi.org/10.5194/acp-20-4313-2020, 2020.
May, A. A., Levin, E. J. T., Hennigan, C. J., Riipinen, I., Lee, T., Collett, J. L., Jimenez, J. L., Kreidenweis, S. M., and Robinson, A. L.: Gas-particle partitioning of primary organic aerosol emissions: 3. Biomass burning, J. Geophys. Res.-Atmos., 118, 11327–11338, 2013.
McDonald, B. C., de Gouw, J. A., Gilman, J. B., Jathar, S. H., Akherati, A., Cappa, C. D., Jimenez, J. L., Lee-Taylor, J., Hayes, P. L., McKeen, S. A., Cui, Y. Y., Kim, S., Gentner, D. R., Isaacman-VanWertz, G., Goldstein, A. H., Harley, R. A., Frost, G. J., Roberts, J. M., Ryerson, T. B., and Trainer, M.: Volatile chemical products emerging as largest petrochemical source of urban organic emissions, Science, 359, 760–764, 2018.
Miao, R., Chen, Q., Shrivastava, M., Chen, Y., Zhang, L., Hu, J., Zheng, Y., and Liao, K.: Process-based and observation-constrained SOA simulations in China: the role of semivolatile and intermediate-volatility organic compounds and OH levels, Atmos. Chem. Phys., 21, 16183–16201, https://doi.org/10.5194/acp-21-16183-2021, 2021.
Ming, L., Jin, L., Li, J., Fu, P., Yang, W., Liu, D., Zhang, G., Wang, Z., and Li, X.: PM2.5 in the Yangtze River Delta, China: Chemical compositions, seasonal variations, and regional pollution events, Environ. Pollut., 223, 200–212, 2017.
Morino, Y., Chatani, S., Tanabe, K., Fujitani, Y., Morikawa, T., Takahashi, K., Sato, K., and Sugata, S.: Contributions of condensable particulate matter to atmospheric organic aerosol over Japan, Environ. Sci. Technol., 52, 8456–8466, 2018.
Morino, Y., Chatani, S., Fujitani, Y., Tanabe, K., Murphy, B. N., Jathar, S. H., Takahashi, K., Sato, K., Kumagai, K., and Saito, S.: Emissions of condensable organic aerosols from stationary combustion sources over Japan, Atmos. Environ., 289, 119319, https://doi.org/10.1016/j.atmosenv.2022.119319, 2022.
Murphy, B. N., Woody, M. C., Jimenez, J. L., Carlton, A. M. G., Hayes, P. L., Liu, S., Ng, N. L., Russell, L. M., Setyan, A., Xu, L., Young, J., Zaveri, R. A., Zhang, Q., and Pye, H. O. T.: Semivolatile POA and parameterized total combustion SOA in CMAQv5.2: impacts on source strength and partitioning, Atmos. Chem. Phys., 17, 11107–11133, https://doi.org/10.5194/acp-17-11107-2017, 2017.
Nault, B. A., Jo, D. S., McDonald, B. C., Campuzano-Jost, P., Day, D. A., Hu, W., Schroder, J. C., Allan, J., Blake, D. R., Canagaratna, M. R., Coe, H., Coggon, M. M., DeCarlo, P. F., Diskin, G. S., Dunmore, R., Flocke, F., Fried, A., Gilman, J. B., Gkatzelis, G., Hamilton, J. F., Hanisco, T. F., Hayes, P. L., Henze, D. K., Hodzic, A., Hopkins, J., Hu, M., Huey, L. G., Jobson, B. T., Kuster, W. C., Lewis, A., Li, M., Liao, J., Nawaz, M. O., Pollack, I. B., Peischl, J., Rappenglück, B., Reeves, C. E., Richter, D., Roberts, J. M., Ryerson, T. B., Shao, M., Sommers, J. M., Walega, J., Warneke, C., Weibring, P., Wolfe, G. M., Young, D. E., Yuan, B., Zhang, Q., de Gouw, J. A., and Jimenez, J. L.: Secondary organic aerosols from anthropogenic volatile organic compounds contribute substantially to air pollution mortality, Atmos. Chem. Phys., 21, 11201–11224, https://doi.org/10.5194/acp-21-11201-2021, 2021.
Presto, A. A., Miracolo, M. A., Kroll, J. H., Worsnop, D. R., Robinson, A. L., and Donahue, N. M.: Intermediate-volatility organic compounds: A potential source of ambient oxidized organic aerosol, Environ. Sci. Technol., 43, 4744–4749, 2009.
Presto, A. A., Nguyen, N. T., Ranjan, M., Reeder, A. J., Lipsky, E. M., Hennigan, C. J., Miracolo, M. A., Riemer, D. D., and Robinson, A. L.: Fine particle and organic vapor emissions from staged tests of an in-use aircraft engine, Atmos. Environ., 45, 3603–3612, 2011.
Pye, H. O. T. and Seinfeld, J. H.: A global perspective on aerosol from low-volatility organic compounds, Atmos. Chem. Phys., 10, 4377–4401, https://doi.org/10.5194/acp-10-4377-2010, 2010.
Qi, L., Liu, H., Shen, X., Fu, M., Huang, F., Man, H., Deng, F., Shaikh, A. A., Wang, X., Dong, R., Song, C., and He, K.: Intermediate-volatility organic compound emissions from nonroad construction machinery under different operation modes, Environ. Sci. Technol., 53, 13832–13840, 2019.
Qi, L., Zhao, J., Li, Q., Su, S., Lai, Y., Deng, F., Man, H., Wang, X., Shen, X., Lin, Y., Ding, Y., and Liu, H.: Primary organic gas emissions from gasoline vehicles in China: Factors, composition and trends, Environ. Pollut., 290, 117984, https://doi.org/10.1016/j.envpol.2021.117984, 2021.
Qin, M., Hu, A., Mao, J., Li, X., Sheng, L., Sun, J., Li, J., Wang, X., Zhang, Y., and Hu, J.: PM2.5 and O3 relationships affected by the atmospheric oxidizing capacity in the Yangtze River Delta, China, Sci. Total Environ., 810, 152268, https://doi.org/10.1016/j.scitotenv.2021.152268, 2022.
Ren, B., Zhu, J., Tian, L., Wang, H., Huang, C., Jing, S., Lou, S., An, J., Lu, J., Rao, P., Fu, Q., Huo, J., and Li, Y.: An alternative semi-quantitative GC/MS method to estimate levels of airborne intermediate volatile organic compounds (IVOCs) in ambient air, Atmos. Environ., X6, 100075, https://doi.org/10.1016/j.aeaoa.2020.100075, 2020.
Robinson, A. L., Donahue, N. M., Shrivastava, M. K., Weitkamp, E. A., Sage, A. M., Grieshop, A. P., Lane, T. E., Pierce, J. R., and Pandis, S. N.: Rethinking organic aerosols: Semivolatile emissions and photochemical aging, Science, 315, 1259–1262, 2007.
Shrivastava, M., Fast, J., Easter, R., Gustafson Jr., W. I., Zaveri, R. A., Jimenez, J. L., Saide, P., and Hodzic, A.: Modeling organic aerosols in a megacity: comparison of simple and complex representations of the volatility basis set approach, Atmos. Chem. Phys., 11, 6639–6662, https://doi.org/10.5194/acp-11-6639-2011, 2011.
Shrivastava, M. K., Cappa, C. D., Fan, J., Goldstein, A. H., Guenther, A. B., Jimenez, J. L., Kuang, C., Laskin, A., Martin, S. T., Ng, N. L., Petaja, T., Pierce, J. R., Rasch, P. J., Roldin, P., Seinfeld, J. H., Shilling, J., Smith, J. N., Thornton, J. A., Volkamer, R., Wang, J., Worsnop, D. R., Zaveri, R. A., Zelenyuk, A., and Zhang, Q.: Recent advances in understanding secondary organic aerosol: Implications for global climate forcing, Rev. Geophys., 55, 509–559, 2017.
Sun, Y., Jiang, Q., Wang, Z., Fu, P., Li, J., Yang, T., and Yin, Y.: Investigation of the sources and evolution processes of severe haze pollution in Beijing in January 2013, J. Geophys. Res.-Atmos., 119, 4380–4398, 2014.
Tang, J., Li, Y., Li, X., Jing, S., Huang, C., Zhu, J., Hu, Q., Wang, H., Lu, J., Lou, S., Rao, P., and Huang, D.: Intermediate volatile organic compounds emissions from vehicles under real world conditions, Sci. Total Environ., 788, 147795, https://doi.org/10.1016/j.scitotenv.2021.147795, 2021.
Tao, J., Zhang, L., Cao, J., and Zhang, R.: A review of current knowledge concerning PM2.5 chemical composition, aerosol optical properties and their relationships across China, Atmos. Chem. Phys., 17, 9485–9518, https://doi.org/10.5194/acp-17-9485-2017, 2017.
Tkacik, D. S., Presto, A. A., Donahue, N. M., and Robinson, A. L.: Secondary organic aerosol formation from intermediate-volatility organic compounds: Cyclic, linear, and branched alkanes, Environ. Sci. Technol., 46, 8773–8781, 2012.
Tsimpidi, A. P., Karydis, V. A., Zavala, M., Lei, W., Molina, L., Ulbrich, I. M., Jimenez, J. L., and Pandis, S. N.: Evaluation of the volatility basis-set approach for the simulation of organic aerosol formation in the Mexico City metropolitan area, Atmos. Chem. Phys., 10, 525–546, https://doi.org/10.5194/acp-10-525-2010, 2010.
Tsinghua University: Multiresolution Emission Inventory for China (MEIC-2017), http://meicmodel.org, last access: 31 July 2021.
US EPA: Community Modeling and Analysis System (CMAQ, Version 5.3), https://cmascenter.org/cmaq/, last access: 21 July 2021a.
US EPA: The Sparse Matrix Operator Kernel Emissions (SMOKE), https://cmascenter.org/smoke, last access: 21 July 2021b.
US EPA: Final Report, SPECIATE Version 5.1, Database Development Documentation, https://www.epa.gov/air-emissions-modeling/speciate-51-and-50-addendum-and-final-report, last access: 8 August 2021c.
Woody, M. C., Baker, K. R., Hayes, P. L., Jimenez, J. L., Koo, B., and Pye, H. O. T.: Understanding sources of organic aerosol during CalNex-2010 using the CMAQ-VBS, Atmos. Chem. Phys., 16, 4081–4100, https://doi.org/10.5194/acp-16-4081-2016, 2016.
Wu, L., Wang, X., Lu, S., Shao, M., and Ling, Z.: Emission inventory of semi-volatile and intermediate-volatility organic compounds and their effects on secondary organic aerosol over the Pearl River Delta region, Atmos. Chem. Phys., 19, 8141–8161, https://doi.org/10.5194/acp-19-8141-2019, 2019.
Wu, L., Ling, Z., Liu, H., Shao, M., Lu, S., Wu, L., and Wang, X.: A gridded emission inventory of semi-volatile and intermediate volatility organic compounds in China, Sci. Total Environ., 761, 143295, https://doi.org/10.1016/j.scitotenv.2020.143295, 2021.
Xu, L., Guo, H., Boyd, C. M., Klein, M., Bougiatioti, A., Cerully, K. M., Hite, J. R., Isaacman-VanWertze, G., Kreisberg, N. M., Knote, C., Olson, K., Koss, A., Goldstein, A. H., Hering, S. V., de Gouw, J., Baumann, K., Lee, S., Nenes, A., Weber, R. J., and Ng, N. L.: Effects of anthropogenic emissions on aerosol formation from isoprene and monoterpenes in the southeastern United States, P. Natl. Acad. Sci. USA, 112, 37–42, 2015.
Yang, W., Li, J., Wang, W., Li, J., Ge, M., Sun, Y., Chen, X., Ge, B., Tong, S., Wang, Q., and Wang, Z.: Investigating secondary organic aerosol formation pathways in China during 2014, Atmos. Environ., 213, 133–147, 2019.
Yao, T., Li, Y., Gao, J., Fung, J. C. H., Wang, S., Li, Y., Chan, C. K., and Lau, A. K. H.: Source apportionment of secondary organic aerosols in the Pearl River Delta region: Contribution from the oxidation of semi-volatile and intermediate volatility primary organic aerosols, Atmos. Environ., 222, 117111, https://doi.org/10.1016/j.atmosenv.2019.117111, 2020.
Yu, K., Zhu, Q., Du, K., and Huang, X.-F.: Characterization of nighttime formation of particulate organic nitrates based on high-resolution aerosol mass spectrometry in an urban atmosphere in China, Atmos. Chem. Phys., 19, 5235–5249, https://doi.org/10.5194/acp-19-5235-2019, 2019.
Yuan, B., Shao, M., Lu, S., and Wang, B.: Source profiles of volatile organic compounds associated with solvent use in Beijing, China, Atmos. Environ., 44, 1919—-1926, 2010.
Zhang, H., Yee, L. D., Lee, B. H., Curtis, M. P., Worton, D. R., Isaacman-VanWertz, G., Offenberg, J. H., Lewandowski, M., Kleindienst, T. E., Beaver, M. R., Holder, A. L., Lonneman, W. A., Docherty, K. S., Jaoui, M., Pye, H. T. O., Hu, W., Day, D. A., Campuzano-Jost, P., Jimenez, J. L., Guo, H., Weber, R. J., de Gouw, J., Koss, A. R., Edgerton, E. S., Brune, W., Mohr, C., Lopez-Hilfiker, F. D., Lutz, A., Kreisberg, N. M., Spielman, S. R., Hering, S. V., Wilson, K. R., Thornton, J. A., and Goldstein, A. H.: Monoterpenes are the largest source of summertime organic aerosol in the southeastern United States, P. Natl. Acad. Sci. USA, 115, 2038–2043, 2018.
Zhang, Q., Jimenez, J. L., Canagaratna, M. R., Allan, J. D., Coe, H., Ulbrich, I., Alfarra, M. R., Takami, A., Middlebrook, A. M., Sun, Y. L., Dzepina, K., Dunlea, E., Docherty, K., DeCarlo, P. F., Salcedo, D., Onasch, T., Jayne, J. T., Miyoshi, T., Shimono, A., Hatakeyama, S., Takegawa, N., Kondo, Y., Schneider, J., Drewnick, F., Borrmann, S., Weimer, S., Demerjian, K., Williams, P., Bower, K., Bahreini, R., Cottrell, L., Griffin, R. J., Rautiainen, J., Sun, J. Y., Zhang, Y. M., and Worsnop, D. R.: Ubiquity and dominance of oxygenated species in organic aerosols in anthropogenically-influenced Northern Hemisphere midlatitudes, Geophys. Res. Lett., 34, L13801, https://doi.org/10.1029/2007GL029979, 2007.
Zhang, Q., Jimenez, J. L., Canagaratna, M. R., Ulbrich, I. M., Ng, N. L., Worsnop, D. R., and Sun, Y.: Understanding atmospheric organic aerosols via factor analysis of aerosol mass spectrometry: a review, Anal. Bioanal. Chem., 401, 3045–3067, 2011.
Zhang, Y., Vijayaraghavan, K., and Seigneur, C.: Evaluation of three probing techniques in a three-dimensional air quality model, J. Geophys. Res., Atmos., 110, D02305, https://doi.org/10.1029/2004JD005248, 2005.
Zhao, B., Wang, S., Donahue, N. M., Jathar, S. H., Huang, X. F., Wu, W., Hao, J., and Robinson, A. L.: Quantifying the effect of organic aerosol aging and intermediate-volatility emissions on regional scale aerosol pollution in China, Sci. Rep.-UK, 6, 28815, https://doi.org/10.1038/srep28815, 2016.
Zhao, Y., Hennigan, C. J., May, A. A., Tkacik, D. S., De Gouw, J. A., Gilman, J. B., Kuster, W. C., Borbon, A., and Robinson, A. L.: Intermediate-volatility organic compounds: A large source of secondary organic aerosol, Environ. Sci. Technol., 48, 13743–13750, 2014.
Zhao, Y., Kreisberg, N. M., Worton, D. R., Isaacman, G., Weber, R. J., Liu, S., Day, D. A., Russell, L. M., Markovic, M. Z., VandenBoer, T. C., Murphy, J. G., Hering, S. V., and Goldstein, A. H.: Insights into secondary organic aerosol formation mechanisms from measured gas/particle partitioning of specific organic tracer compounds, Environ. Sci. Technol., 47, 3781–3787, 2013.
Zhao, Y., Nguyen, N. T., Presto, A. A., Hennigan, C. J., May, A. A., and Robinson, A. L.: Intermediate volatility organic compound emissions from on-road diesel vehicles: Chemical composition, emission Factors, and estimated secondary organic aerosol production, Environ. Sci. Technol., 49, 11516–11526, 2015.
Zhao, Y., Nguyen, N. T., Presto, A. A., Hennigan, C. J., May, A. A., and Robinson, A. L.: Intermediate Volatility Organic Compound Emissions from On-Road Gasoline Vehicles and Small Off-Road Gasoline Engines, Environ. Sci. Technol., 50, 4554–4563, 2016.
Zheng, M., Cass, G. R., Schauer, J. J., and Edgerton, E. S.: Source Apportionment of PM2.5 in the Southeastern United States Using Solvent-Extractable Organic Compounds as Tracers, Environ. Sci. Technol., 36, 2361–2371, 2002.
Zhu, S., Wang, Q., Qiao, L., Zhou, M., Wang, S., Lou, S., Huang, D., Wang, Q., Jing, S., Wang, H., Chen, C., Huang, C., and Yu, J. Z.: Tracer-based characterization of source variations of PM2.5 and organic carbon in Shanghai influenced by the COVID-19 lockdown, Faraday Discuss., 226, 112, https://doi.org/10.1039/D0FD00091D, 2021.