the Creative Commons Attribution 4.0 License.
the Creative Commons Attribution 4.0 License.
 | 10 Jan 2023
Measurement of Henry's law and liquid-phase loss rate constants of peroxypropionic nitric anhydride (PPN) in deionized water and in n-octanol
Kevin D. Easterbrook
Mitchell A. Vona
Kiana Nayebi-Astaneh
Amanda M. Miller
The Henry's law solubility (HS) and liquid-phase loss rate constants (kl) of the tropospheric trace gas constituents peroxyacetic nitric anhydride (PAN; CH3C(O)O2NO2, commonly known as peroxyacetyl nitrate) and peroxypropionic nitric anhydride (PPN; C2H5C(O)O2NO2, also known as peroxypropionyl nitrate) in deionized (DI) water and of PPN in n-octanol were measured using a flow bubble apparatus at temperatures between 5.0 and 25.0 ∘C. For PAN in DI water, the observed values for HS,aq are consistent with the literature, whereas the solubility of PPN in DI water is slightly lower than literature values, ranging from = (1.49 ± 0.05) M atm−1 at 25.0 ∘C to = (7.01 ± 0.25) M atm−1 at 5.0 ∘C (stated uncertainties are at the 1σ level). The data are best described by = + and = + , where T is in kelvin. For n-octanol, the PPN solubility ranges from = at 25.0 ∘C to = at 5.0 ∘C and is best described by = + . n-Octanol–water partition coefficients (KOW) for PPN were determined for the first time, ranging from 59 ± 4 at 25.0 ∘C to 29 ± 3 at 5.0 ∘C. Observed loss rate constants in DI water are consistent with recent literature and larger than the thermal dissociation rates for both PAN and PPN, consistent with a hydrolysis mechanism, whereas kl values in n-octanol are significantly smaller than gas-phase dissociation rate constants, likely owing to a “cage effect” in the organic liquid. The results imply that uptake of either PAN or PPN on cloud water and organic aerosol is negligible but that uptake of PPN may constitute an overlooked source of peroxy radicals in organic aerosol.
- Article
(2555 KB) - Full-text XML
-
Supplement
(764 KB) - BibTeX
- EndNote


The peroxycarboxylic nitric anhydrides (PANs; also referred to as peroxyacyl nitrates, molecular formula RC(O)O2NO2, R≠H), are important trace gas constituents of the troposphere (Roberts, 1990, 2007; Gaffney and Marley, 2021). Formed as by-products by the same photochemistry that produces ozone (O3) and photochemical smog, the relative abundances of PANs allow insights into the dominant hydrocarbons involved in the O3-production process (Williams et al., 1997; Roberts et al., 2007). Their formation and fate affect the budgets of nitrogen oxides (i.e., NOx = NO + NO2) and the abundances of radicals such as the hydroxyl radical (OH), the hydroperoxyl radical (HO2), and organic peroxy radicals (RO2) and, ultimately, O3 and aerosol production rates (Roberts, 1990, 2007). The phytotoxic PANs are prone to thermal decomposition in warm climates but are longer-lived in parts of the troposphere where temperatures are lower. For the two most abundant PANs, peroxyacetic and peroxypropionic nitric anhydride (PAN and PPN, often referred to as peroxyacetyl and peroxypropionyl nitrate, respectively), the rate constants for photolysis and reaction with OH are relatively small (< 5 × 10⁻⁷ s−1) in the troposphere (Talukdar et al., 1995; Harwood et al., 2003). Further, because the products of PAN (or PPN) photolysis may recombine and regenerate PAN (or PPN), their effective lifetimes are often much larger than suggested by these loss rate constants. For example, Harwood et al. (2003) calculated an effective lifetime of 4 months in the upper troposphere. Under these conditions, dissolution in cloud or fog droplets followed by hydrolysis (Roberts et al., 1996; McFadyen and Cape, 1999) or stomatal uptake (Sparks et al., 2003; Teklemariam and Sparks, 2004) constitute potential loss pathways. Hence, knowledge of their temperature-dependent Henry's law (H) and loss rate constants (kl) for both aqueous and non-polar liquid phases is of interest.
There are several variants of H constants in use (Sander et al., 2022). From a thermodynamic point of view, the dimensionless Henry's law solubility constant (), defined as the ratio of liquid- over gas-phase concentration, is preferred. Atmospheric chemists typically use Henry solubility in units of M atm−1 (; for simplicity, referred to as H in the remainder of this paper), which is defined as the ratio of liquid-phase concentration (M) over the partial pressure (atm) and is related to by
Here, T is the temperature in kelvin, and R is the universal gas constant (0.08205 ). As summarized in Appendix B of Staudinger and Roberts (2001), the temperature dependence of H is related to the enthalpy and entropy of solvation, and , and is often described using a Van't Hoff-type equation, i.e.,
or, if H (i.e., ) is used,
Here, AH, BH, and CH are simple curve-fitting parameters. Equation (3) is used to parameterize H constants by the National Aeronautics and Space Administration Jet Propulsion Laboratory (NASA-JPL) evaluation panel of chemical kinetics data for use in atmospheric studies (Burkholder et al., 2020). Because and (and hence AH and BH) for the PANs are not significantly temperature-dependent in the range of interest to atmospheric chemists, the third term is usually omitted (i.e., CH = 0) (Burkholder et al., 2020).
For the most abundant of the PANs, PAN, H, and kl constants in deionized (DI) water have been measured over a range of temperatures pertinent to the lower troposphere in a handful of studies (Kames and Schurath, 1995; Kames et al., 1991; Holdren et al., 1984; Frenzel et al., 2000; Lee, 1984). Measurements below room temperature are of particular interest because fog droplets and clouds (which can act as sinks for PANs) are generally more prevalent under those conditions (Koracin et al., 2001). For the second-most abundant of the PANs, PPN, in contrast, there has only been a single study measuring H and kl constants in DI water (Kames and Schurath, 1995), though it is clear from these data that the uptake of PAN and PPN on cloud droplets is negligible. Nevertheless, significant enhancements in the PPN:PAN ratio have been observed in fog-processed air in New England (Roberts et al., 1996), rationalized at least in part by reactive uptake of the peroxyacetyl (PA) radical (formed from thermal dissociation of PAN) on fog droplets that is faster than the reformation of PAN via PA + NO2 (Villalta et al., 1996).
The Henry's law solubility and liquid-phase loss rate constants of PAN in n-octanol have been reported by Roberts (2005) to gain insight into this molecule's potential uptake on organic aerosol and non-polar stomatal media. Analogous data for PPN do not exist, though PPN likely exhibits greater partitioning to organic phases than PAN because of its larger aliphatic side chain. Knowledge of the air–octanol and air–water partitioning constants allows the widely used octanol–water partition coefficient (KOW) to be calculated:
This constant provides a direct estimate of hydrophobicity and of partitioning of a molecule from water to organic media such as lipids and waxes as well as natural organic matter, including organic aerosol (Mackay and Parnis, 2020), but has not been previously determined for PPN.
In this work, we report the H and kl constants for PAN and PPN in DI water to corroborate the data by Kames and Schurath (1995) and for PPN in n-octanol at temperatures between 5.0 and 25.0 ∘C. We calculate KOW values for PPN and estimate rates for its wet deposition and uptake rates on organic aerosol in the atmosphere.
Aliquots of PAN (or PPN) in tridecane solution were synthesized from reaction of acidified peroxycarboxylic acid solutions with concentrated nitric acid (Mielke and Osthoff, 2012; Williams et al., 2000) and stored in a freezer until use.
Gas streams containing PAN or PPN in nitrogen (N2) were generated using diffusion sources as described by Furgeson et al. (2011) and depicted within the dashed box in Fig. 1. At the start of each experiment, a solution containing PAN (or PPN) was placed in a three-neck glass vessel submerged into a dewar containing an ice-water bath. The N2 gas flow was set to ∼ 40 standard (0 ∘C, 1 bar) cubic centimetres per minute (sccm) via a 50 µm diameter critical orifice (Lenox Laser) and a regulator back pressure of 25 pounds per square inch (psi; 1.7 bar). The source of the N2 gas was the “blow-off” from a liquid N2 dewar (not shown), chosen because of its high purity. The output of the diffusion source was directed to a fume hood via a two-way perfluoroalkoxy (PFA) Teflon valve (Swagelok) and allowed to stabilize over a period of several hours.
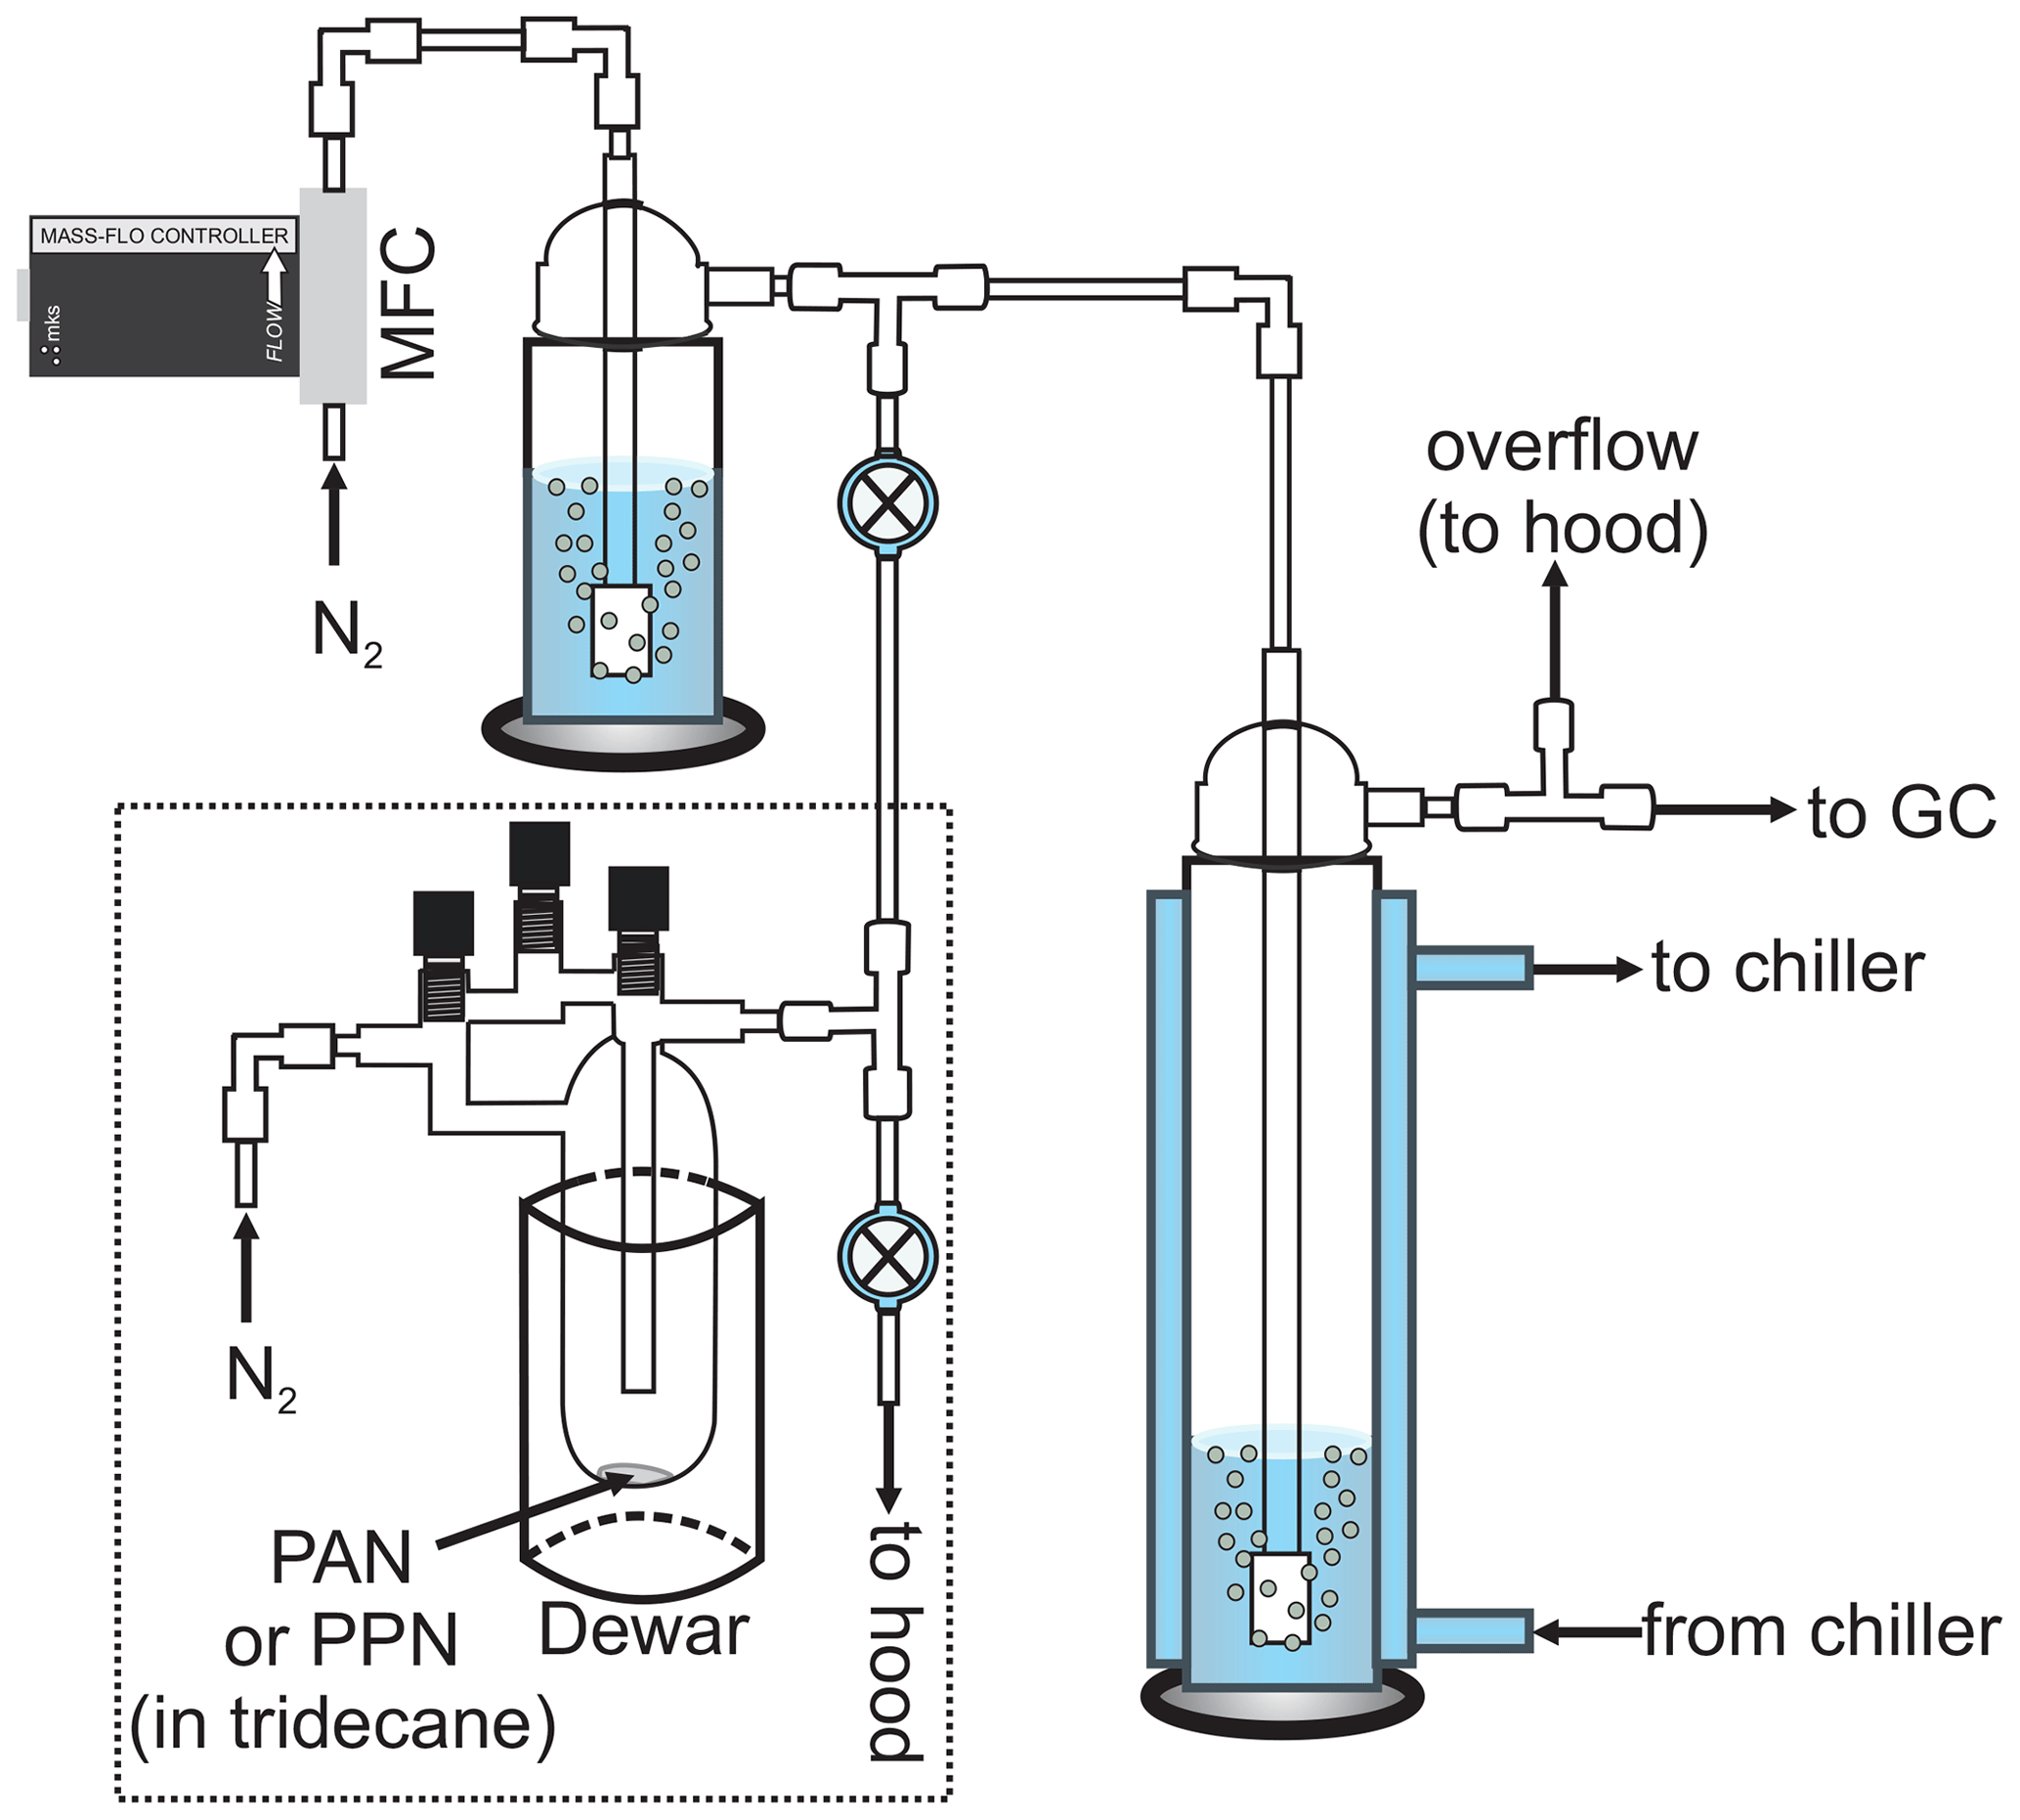
Figure 1Schematic of the experimental apparatus (not to scale). The dashed line encompasses the PAN (or PPN) diffusion source. MFC: mass flow controller. The bubbler shown in the top left was removed for experiments with n-octanol.
Henry's law solubility and liquid-phase loss rate constants were measured using a jacketed, Pyrex bubble column apparatus (internal volume ∼ 175 mL, diameter ∼ 4.5 cm, height ∼ 35 cm; Fig. 1) similar to those described by Kames and Schurath (1995) and Roberts (2005). The gas-phase PAN (or PPN) concentration downstream of the bubble column was monitored by a gas chromatograph with electron capture detector (GC-ECD), which sampled at an inlet flow rate of 75 sccm. The Varian GC-ECD described by Tokarek et al. (2014) was used for most of the experiments (see schedule in Tables S1–S4 in the Supplement), though some measurements were also carried out using the Hewlett Packard (HP) GC described in Rider et al. (2015) and Zborowska et al. (2021). The Varian GC-ECD was equipped with a 30 m long megabore column (Restek RTX-1701, film thickness 1 µm) and a 0.5 mL stainless steel sample loop (VICI Cheminert). It was operated at an oven temperature of 25 ∘C and an ECD temperature of ∼ 100 ∘C, with N2 carrier gas (from the aforementioned liquid N2 dewar) at a carrier gas flow rate of ∼ 40 mL min−1 and a make-up gas flow rate of ∼ 8.1 mL min−1. The HP GC-ECD was equipped with a 15 m long megabore column (Restek RTX-200, film thickness 1 µm) and a 2.0 mL stainless steel sample loop (VICI Cheminert). It was also operated at an oven temperature of 25 ∘C and at an ECD temperature of 105 ∘C, but with helium (He) carrier gas at a flow rate of ∼ 19.4 mL min−1 and N2 make-up gas at a flow rate of ∼ 44.0 mL min−1. The GCs were set to automatically inject every 120 s for experiments with PAN or every 360 s for experiments with PPN. For experiments with PAN, fluorinated ethylene propylene (FEP) tubing (Saint-Gobain) and PFA Teflon fittings (Entegris) were used, and the GC sampled through a PFA Teflon filter (Pall, 2 µm pore size) housed in a PFA Teflon in-line filter holder (Cole-Parmer RK-06103-13). For experiments with PPN, tubing downstream of the bubble column were replaced with (∼ 0.32 cm) outer diameter (o.d.) stainless tubing and fittings (Swagelok), and the GC inlet filter and holder were removed because of memory effects with the fluoropolymer tubing and fittings.
In a typical experiment, the bubble column apparatus (right-hand side of Fig. 1) was filled with a known volume (Vl) of liquid solution, i.e., either DI water (18 MΩ cm−1, Thermo Scientific Barnstead Nanopure Model D11931) or n-octanol (ACS reagent grade, ≥ 99 % purity, used as received). This apparatus was temperature-controlled using an external chiller circulator (Lauda Proline RP 1290 for experiments with the Varian GC-ECD or VWR 13271-100 for experiments with the HP GC-ECD). Once the desired temperature was achieved, the gas stream containing PAN (or PPN) was bubbled through the water (or n-octanol) by opening the two-way valve (top of Fig. 1) and closing the two-way valve connected to the waste line. After ∼ 5 min the incoming gas stream was directed towards a waste line (by opening the two-way valve connected to it). Gas-phase PAN (or PPN) mixing ratios ranged from ∼ 10 to ∼ 300 ppbv at this stage. For experiments with PPN, the tee fitting was briefly (∼ 30 s) back-flushed with N2 delivered via a calibrated mass flow controller (MFC; MKS Instruments, 500 sccm capacity for experiments with the Varian GC-ECD, 5000 sccm capacity for experiments with the HP GC-ECD) until the two-way valve connecting the source to the bubble column apparatus and N2 flow was closed. For experiments with DI water, the N2 flow was humidified using a bubbler to minimize evaporation of solvent in the main bubble column. The PAN (or PPN) concentration (cg) was then monitored as a function of time (t) by either GC. The experiment was repeated, systematically varying the (volumetric) flow-rate-to-volume ratio () as summarized in Tables S1–S4.
The concentration decays due to a combination of first-order loss and gas–liquid equilibration, i.e., partitioning of PAN (or PPN) from the liquid reservoir to the gas stream. Kames and Schurath (1995) showed that under these conditions, the analyte's concentration decreases according to the following relationship:
Here, cg,t is the analyte's concentration in the gas phase at time t, kl is the loss rate constant of PAN (or PPN) in the liquid phase, and is the dimensionless Henry solubility. Integration of Eq. (5) yields
Since the chromatographic peak area (A) is proportional to cg (Tokarek et al., 2014), linear regression analysis of plots of versus yields the values of as the slope and kl as the intercept. In this work, peak areas were determined by fitting parameters of a Gaussian expression to the observed peaks as described by Tokarek et al. (2014) using an automated macro in Igor Pro (Wavemetrics Inc.). An important assumption is that the GC-ECD responds linearly to concentration, which was experimentally verified by following concentration decays over several orders of magnitude without observing a change in slope (e.g., Fig. S1 in the Supplement).
The H and kl constants measured in this work allow constraints to be placed on the heterogeneous uptake of the PANs. Under conditions of rapid gas–liquid equilibration, the first-order rate constant with respect to heterogeneous processing (khet) is given by (Schwartz, 2003):
Here, L is the ratio of the liquid volume divided by the total volume of an air parcel. The formulism of Eq. (7) can be applied to liquid water (Laq and kl,aq) or organic aerosol (Lorg and kl,org). Hence, Eq. (7) may be used to calculate the loss rate of a molecule with respect to wet deposition (kwet) or organic aerosol uptake (korg).
Another quantity that may be derived from knowledge of H and kl constants is the reactive uptake probability (γ) for aqueous and (liquid) organic aerosol (Villalta et al., 1996):
Here, ω is the mean molecular speed (, where M is the molecular weight, e.g., 0.1351 kg mol−1 for PPN), and Dl is the liquid-phase diffusion coefficient (m2 s−1), a quantity that can vary by many orders of magnitude depending on aerosol morphology (Shiraiwa et al., 2011). In this work, the magnitude of Dl was estimated using the semiempirical equation by Reddy and Doraiswamy (1967):
Here, Ml is the molecular weight of the solvent; μ is the solvent viscosity (mPa s); V1 and V2 are the molar volumes of the solute and solvent (cm3 g−1 mol), respectively; and ψ is a constant equal to 8.5 × 10⁻⁸ when > 1.5 and 10 × 10−8 when ≤ 1.5 (Reddy and Doraiswamy, 1967).
Once a value of γ is estimated, the rate constant with respect to heterogeneous uptake in the kinetic limit (i.e., for submicron-sized aerosol) is then given by
where SA is the specific surface area density of the aerosol (Davidovits et al., 2006).
Five consecutive chromatograms from a sample experiment are shown in Fig. 2. In this example, the bubble column apparatus was filled with 150 mL of DI water at a temperature of 5.00 ∘C, which was equilibrated with PPN. The dominant peak in the chromatogram is PPN, eluting at ∼ 288 s. The peak eluting at ∼ 87 s (whose area is ∼ 5 % that of PPN) is due to ethyl nitrate (EN), a by-product of the PPN synthesis (Williams et al., 2000). There was also a small peak at ∼ 136.5 s corresponding to PAN, another (though very minor) by-product of PPN synthesis. The relative elution times of EN, PAN, and PPN are consistent with their capacity factors of medium-polarity columns (Roberts et al., 1989).
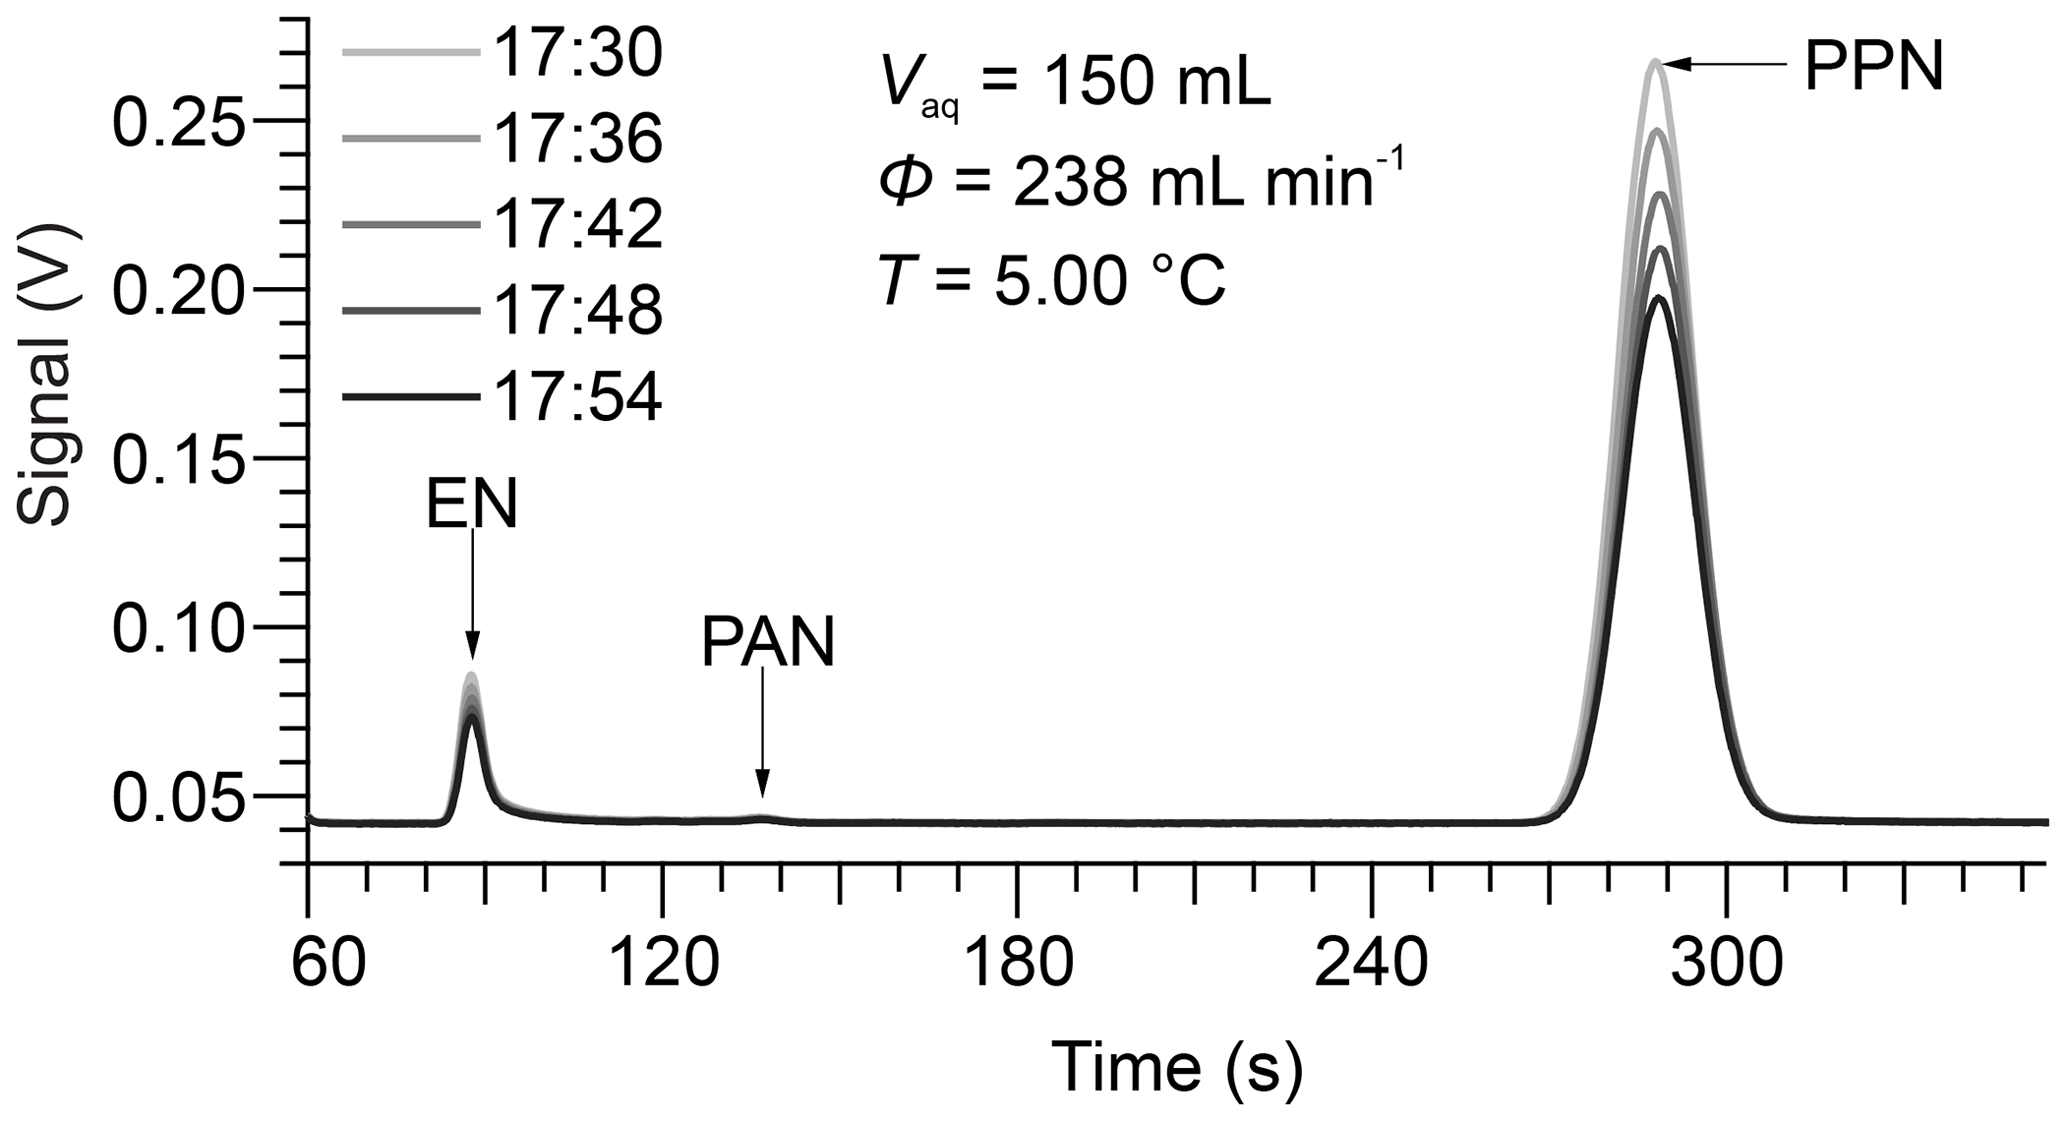
Figure 2Sample chromatograms recorded by the Varian GC-ECD operated with N2 carrier gas at a flow rate of 40 mL min−1. Here, the GC sampled the gas eluting from 150 mL DI water at a temperature of 5.00 ∘C at a volumetric flow rate of 238 mL min−1. The GC injected automatically every 360 s, at the time (HH:MM) shown in the legend.
The chromatograms show a decrease in gas-phase concentrations over time as humidified N2 is bubbled through the water column at a volumetric flow rate of 238 mL min−1. Representative plots of versus t for PPN in DI water are shown in Fig. 3. The subset of the data plotted in Fig. 2 is highlighted in bold and red colour. Example plots of versus t for PPN in n-octanol are shown in Fig. S1. Plots such as those shown in Figs. 3 and S1 were linear with Pearson correlation coefficients (r) > 0.99 for all experiments. Experiments with PPN in n-octanol usually required more time than those with DI water to equilibrate initially (as judged by initial deviation from linearity of plots of versus t). Because of the much slower decay rate, however, samples lasted for up to 3 d and allowed several flow conditions (i.e., different values of ) to be probed in a single experiment.
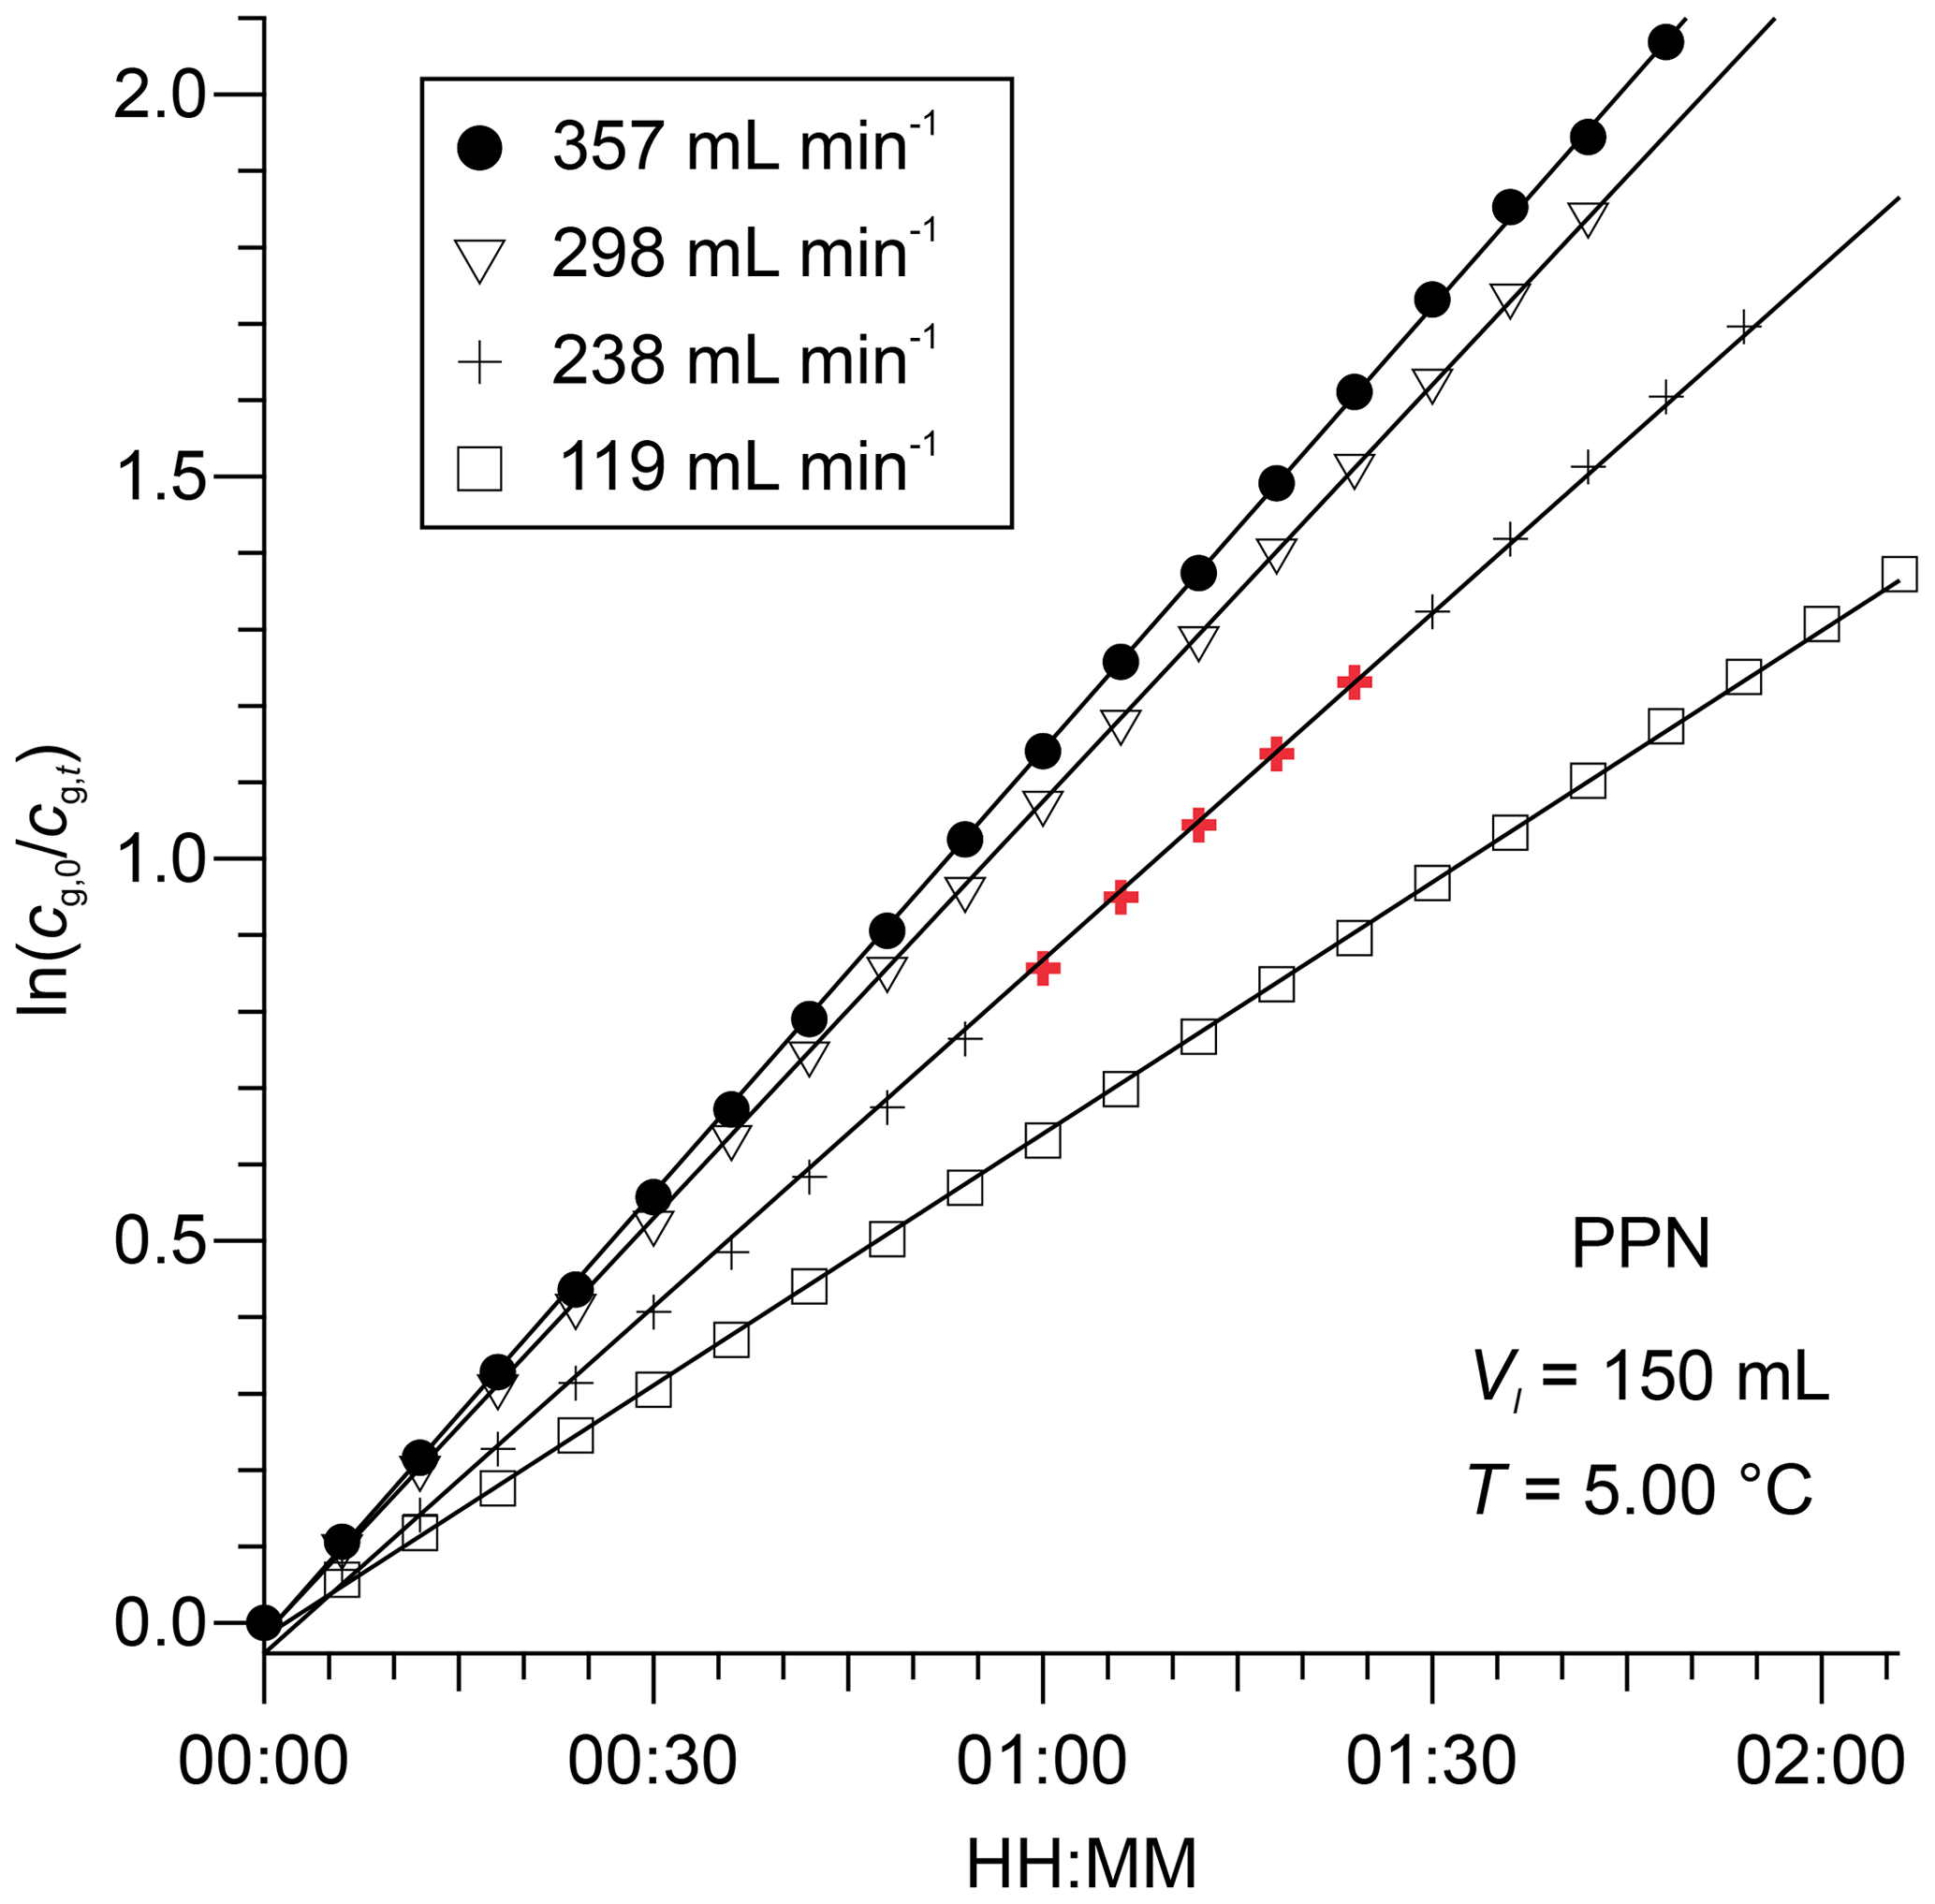
Figure 3Plots of for PPN versus t, observed downstream from 150 mL of DI water at 5.00 ∘C for four different volumetric flow rates. The data from Fig. 2 are highlighted in bold and red colour.
Table 1Summary of Henry's law solubility constants.

a Literature evaluation with uncertainty factor of 2 to 10.
b Calculated based on structure–activity relationships.
NA: not available (not tabulated); n/d: not determined.
Sample plots of versus (viz. Eq. 6) for experiments with PAN and PPN in DI water at temperatures of 20, 12.5, and 5.0 ∘C are shown in Fig. 4. The error bars shown here and in the remaining figures as well as the uncertainties stated in all tables are at the 1σ precision level. Analogous plots for experiments with PPN in n-octanol are shown in Fig. S2. Linear regression analysis yielded slopes equal to (Tables S5–S7), from which H was calculated using Eq. (1). The results are summarized in Table 1, alongside available literature values.
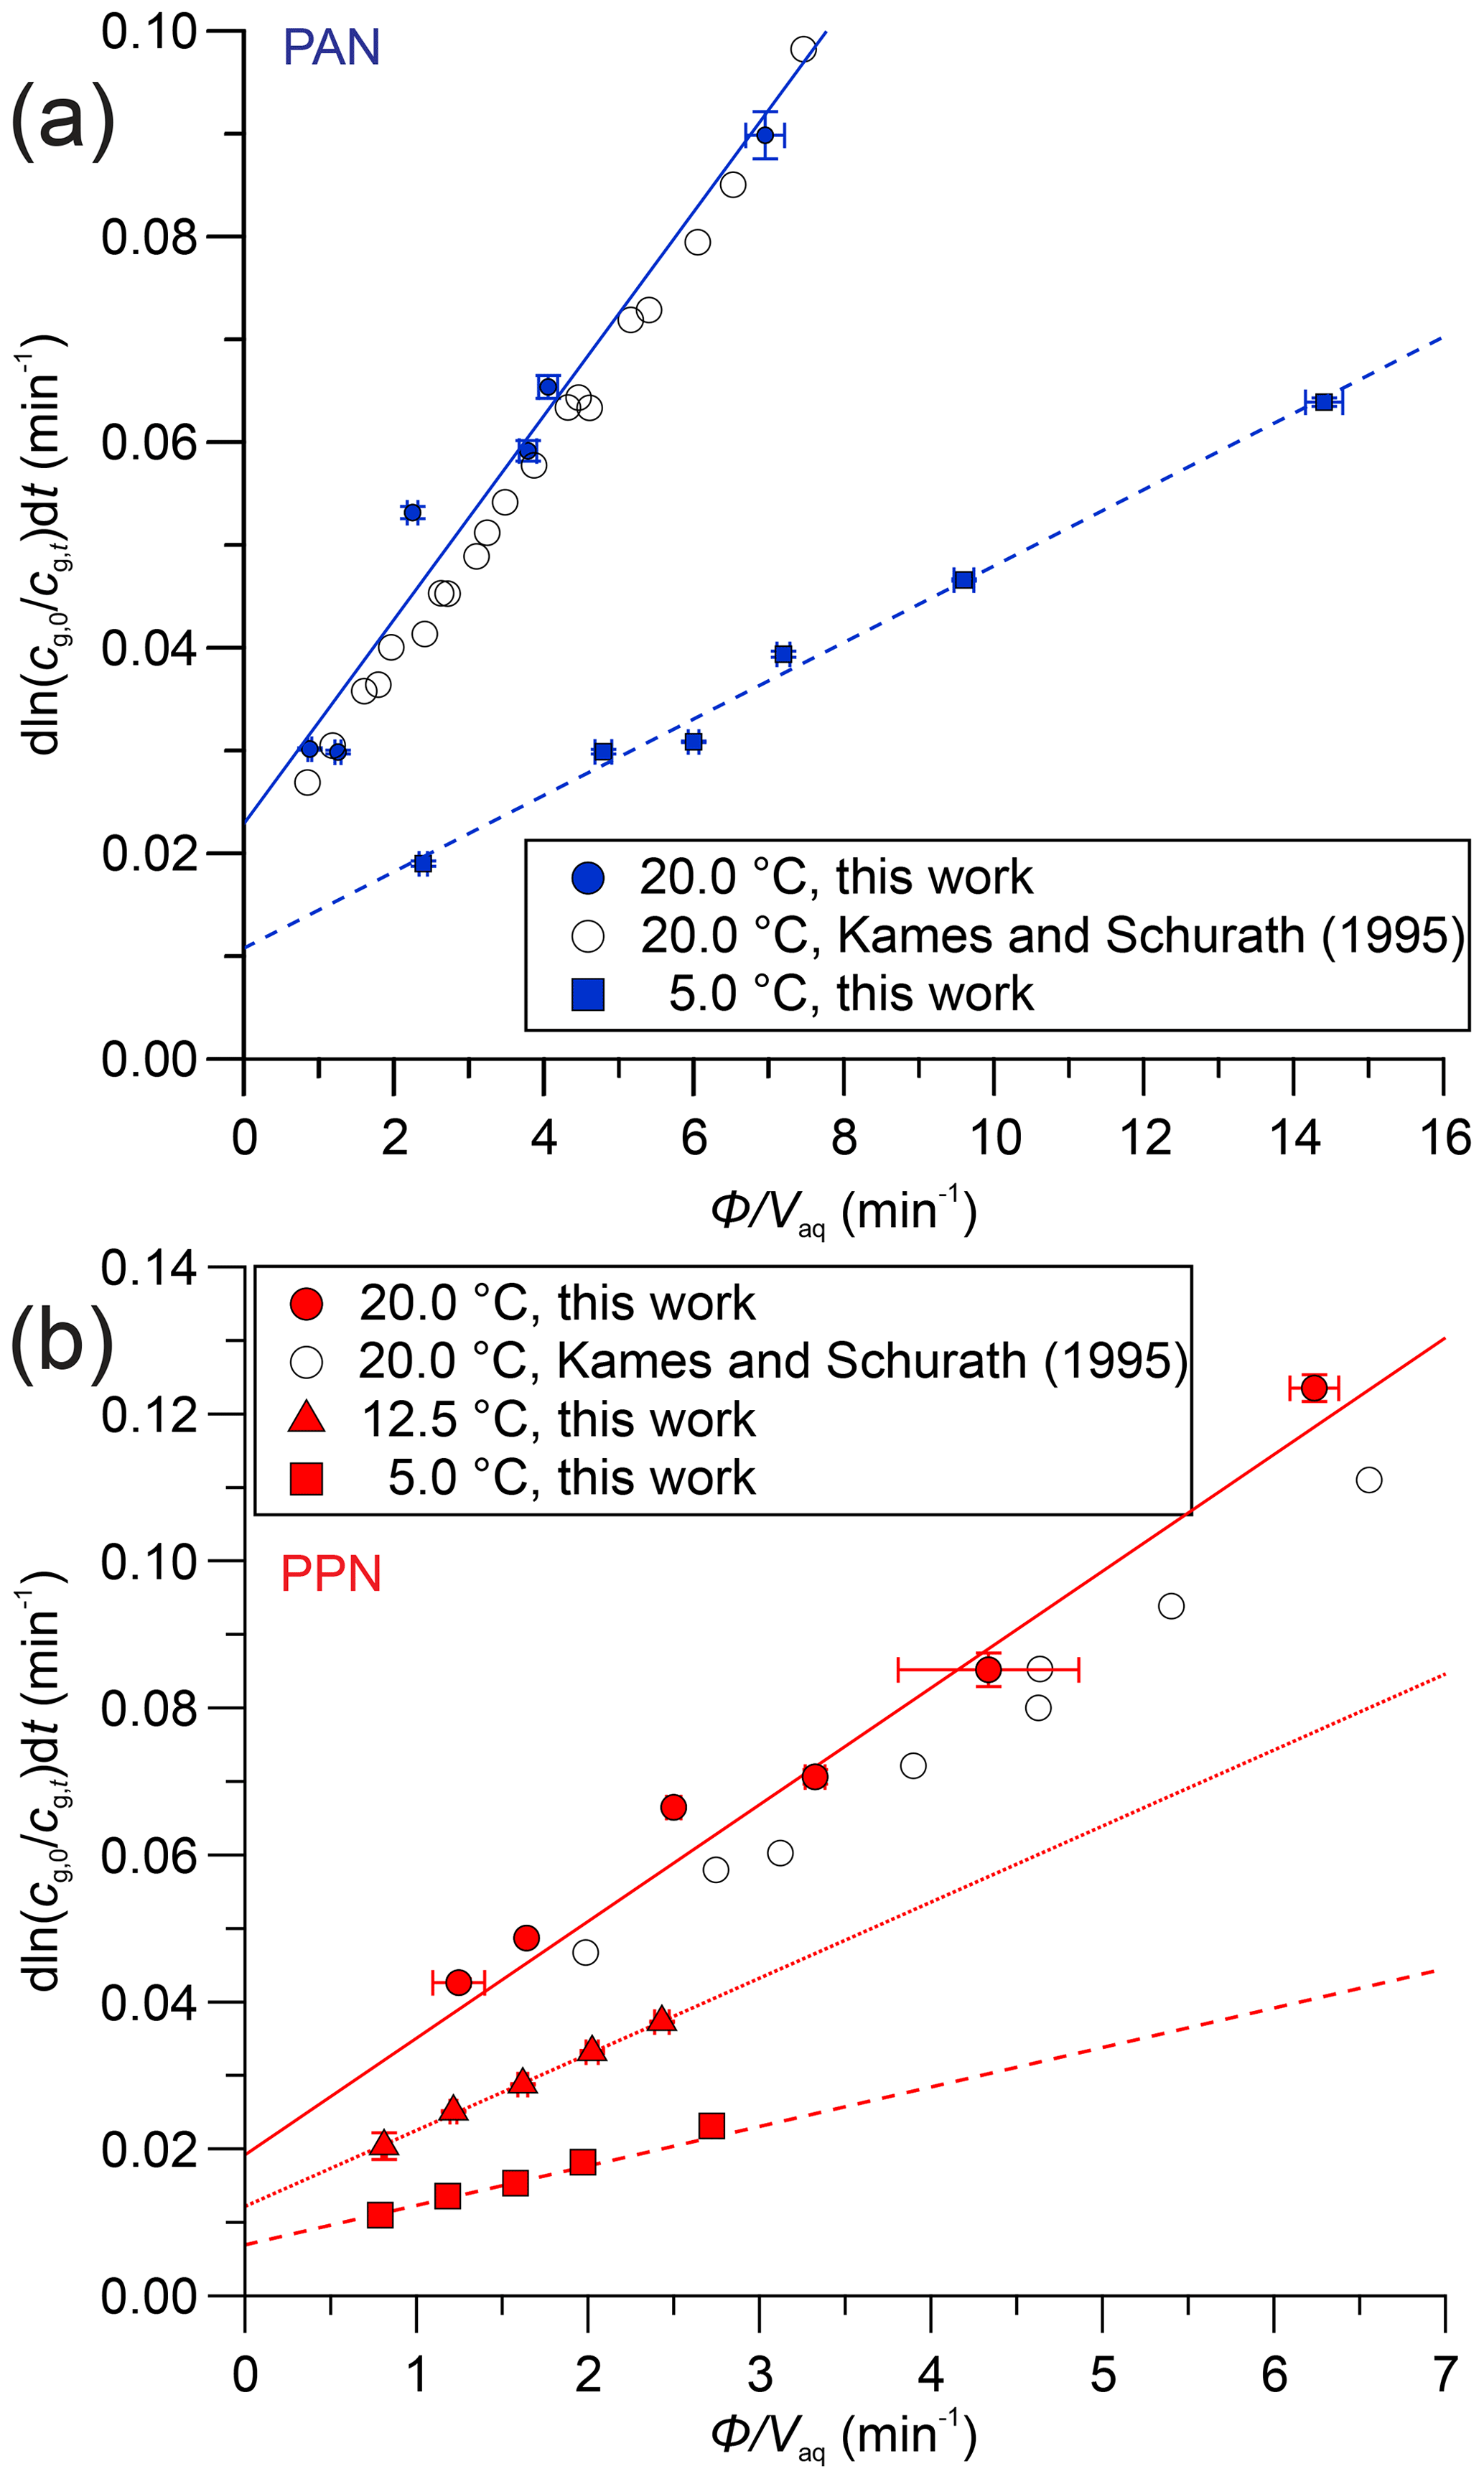
Figure 4(a) Plots of versus for PAN in DI water at 20.0 ∘C (•) and 5.0 ∘C (▪). Literature data at 20.0 ∘C were extracted from Figs. 4 and 5 of Kames and Schurath (1995) using “Engauge Digitizer” software (Mitchell et al., 2020) and are shown as open symbols (∘). The lines are linear fits to the data at each temperature. (b) Same plot as panel (a) but for PPN in DI water and also showing data at 12.5 ∘C (▴).
Table 2Temperature dependence of Henry's law solubility constants derived by linear fitting of Eq. (3) with CH=0 to the data shown in Fig. 5.
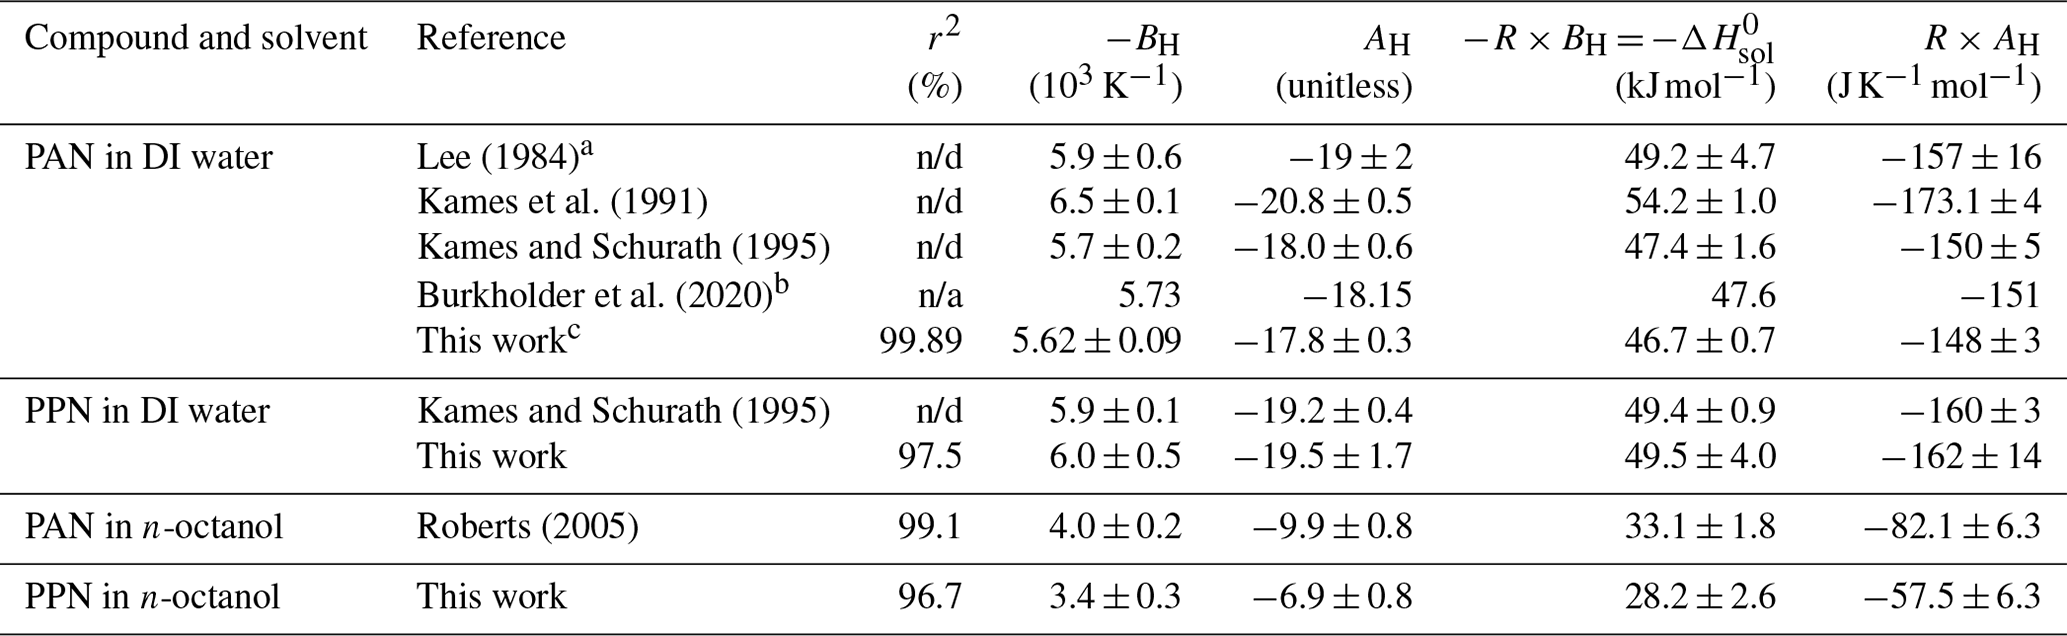
a Value for and uncertainties were calculated by Kames and Schurath (1995) based on data provided by Lee (1984).
b Uncertainty factor of 2 to 10. c Data from this work combined with those of (Kames and Schurath, 1995);
n/d: not disclosed; n/a: not applicable.
Figure 5 graphically summarizes the H constants measured in this work, along with available literature data, including estimates from the GROup contribution Method for Henry's law Estimate (GROMHE) structure–activity relationship model (Raventos-Duran et al., 2010). The data are presented as Van't Hoff plots, i.e., by plotting H on a logarithmic scale versus (with T in kelvin). Fits of Eq. (3) in Igor Pro to the data shown in Fig. 5 yielded CH terms whose ± 1σ uncertainty encompassed zero, such that the CH term was set to zero in subsequent fits. The results, i.e., values for AH and BH derived from Eq. (3) and linear fits to the data, are shown as solid lines in Fig. 5 and are summarized in Table 2. Fits to literature values are shown as dashed lines.
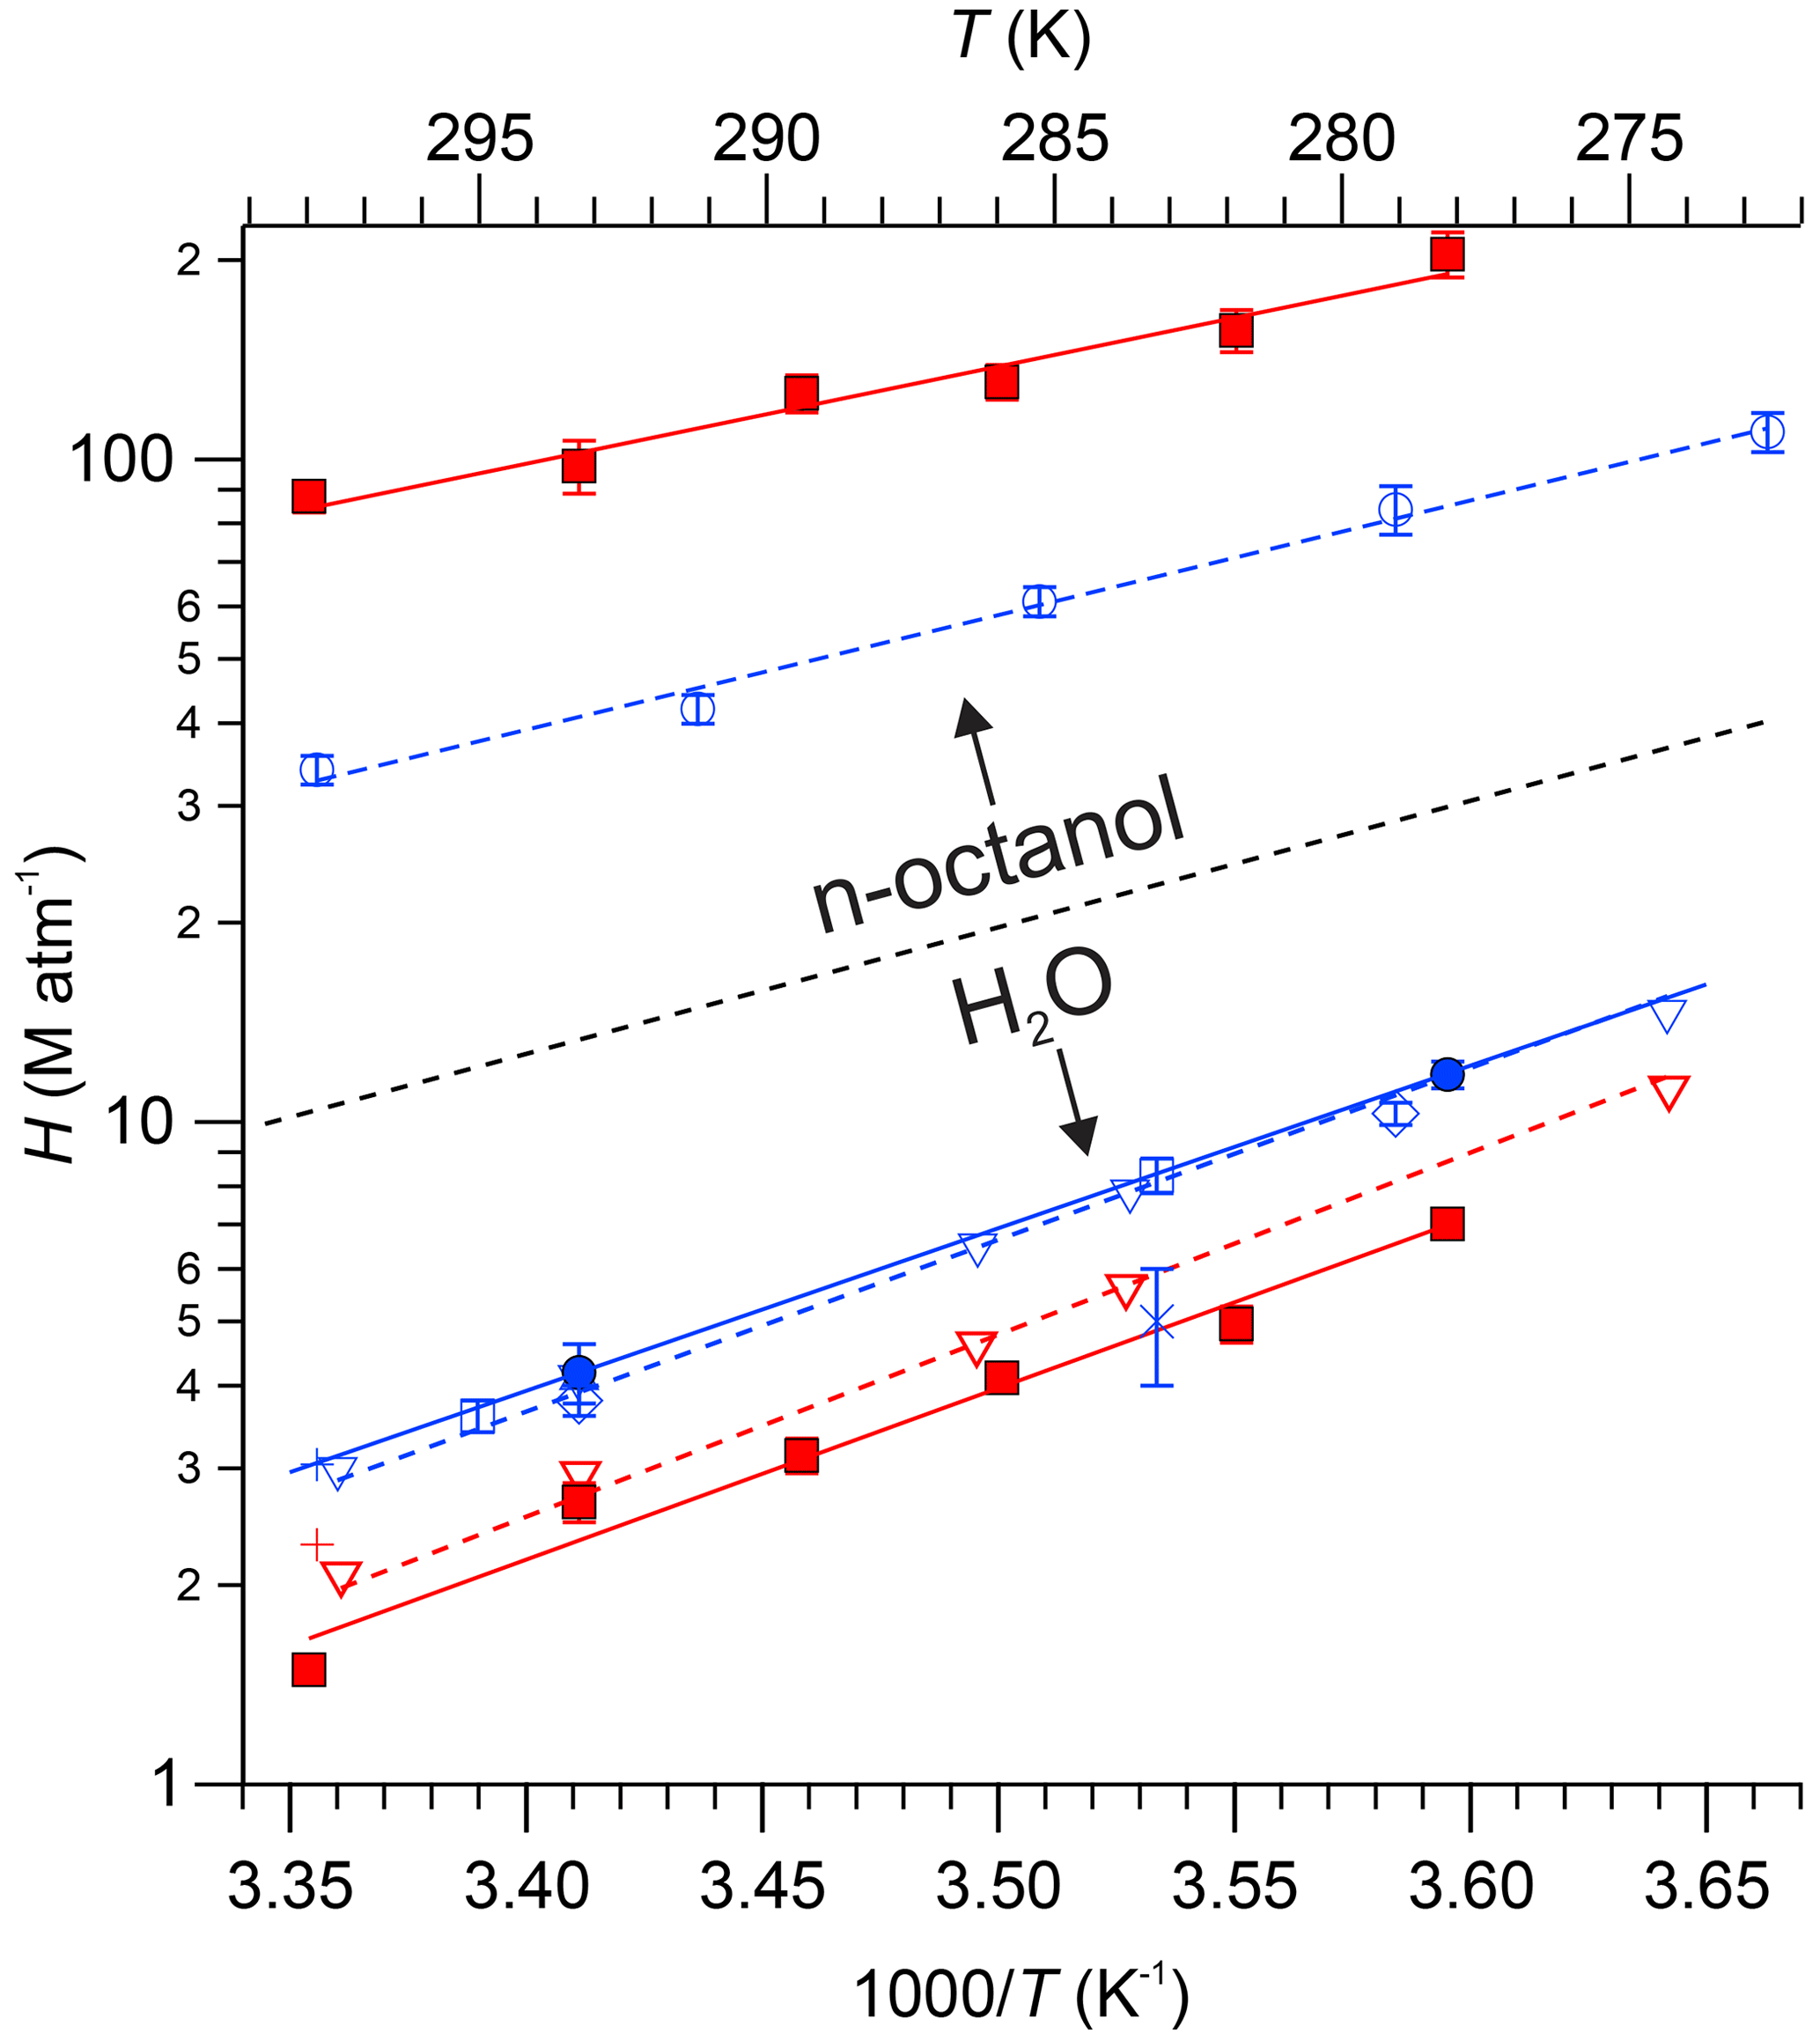
Figure 5Henry's law constants for PAN (blue colour) and PPN (red colour) in n-octanol and DI water as functions of temperature. Data from this work are shown as solid symbols (• for PAN and ▪ for PPN). Data from Fig. 6 of Kames and Schurath (1995) for PAN and PPN were extracted using “Engauge Digitizer” software (Mitchell et al., 2020) and are shown as ▿ and - -. Other literature data are shown as follows: □ Lee (1984), × Holdren et al. (1984), △ Kames et al. (1991), ◊ Frenzel et al. (2000), ∘ and - - Roberts (2005), + Raventos-Duran et al. (2010). The dashed black line serves as a visual indicator to separate results obtained with n-octanol (top portion of graph) from those obtained with DI water (bottom).
Our measurements of H for PAN in DI water are in good agreement with the majority of the available literature. Because of this, we combined our data with those of Kames and Schurath (1995) to yield the expression = + , where T is in kelvin (Table 2). For PPN in DI water, on the other hand, our H data are systematically lower than those by Kames and Schurath (1995) and are best described by the expression = + (Table 2).
Henry's law constants for PPN in n-octanol ranged from (88 ± 5) M atm−1 at 25.0 ∘C to (204 ± 16) M atm−1 at 5.0 ∘C and were larger than those of PAN in n-octanol (Fig. 5). The data are best described by the expression = + (Table 2). The H constants of both compounds exhibit similar temperature dependence with ≈ kJ mol−1 and ≈ kJ mol−1 (Table 2).
Table 3n-Octanol–water partition coefficients of PAN and PPN calculated using Eq. (4).

n/d: not determined.
Using the measured H constants for PPN in DI water and n-octanol and Eq. (4), values of KOW of PPN were calculated. The octanol–water partition coefficient of PPN ranges from 59 ± 4 at 25 ∘C to 29 ± 3 at 5 ∘C, a factor of ∼ (4.1 ± 0.6) larger than those reported by Roberts (2005) for PAN (Table 3).
Table 4Summary of liquid-phase loss rate constants.
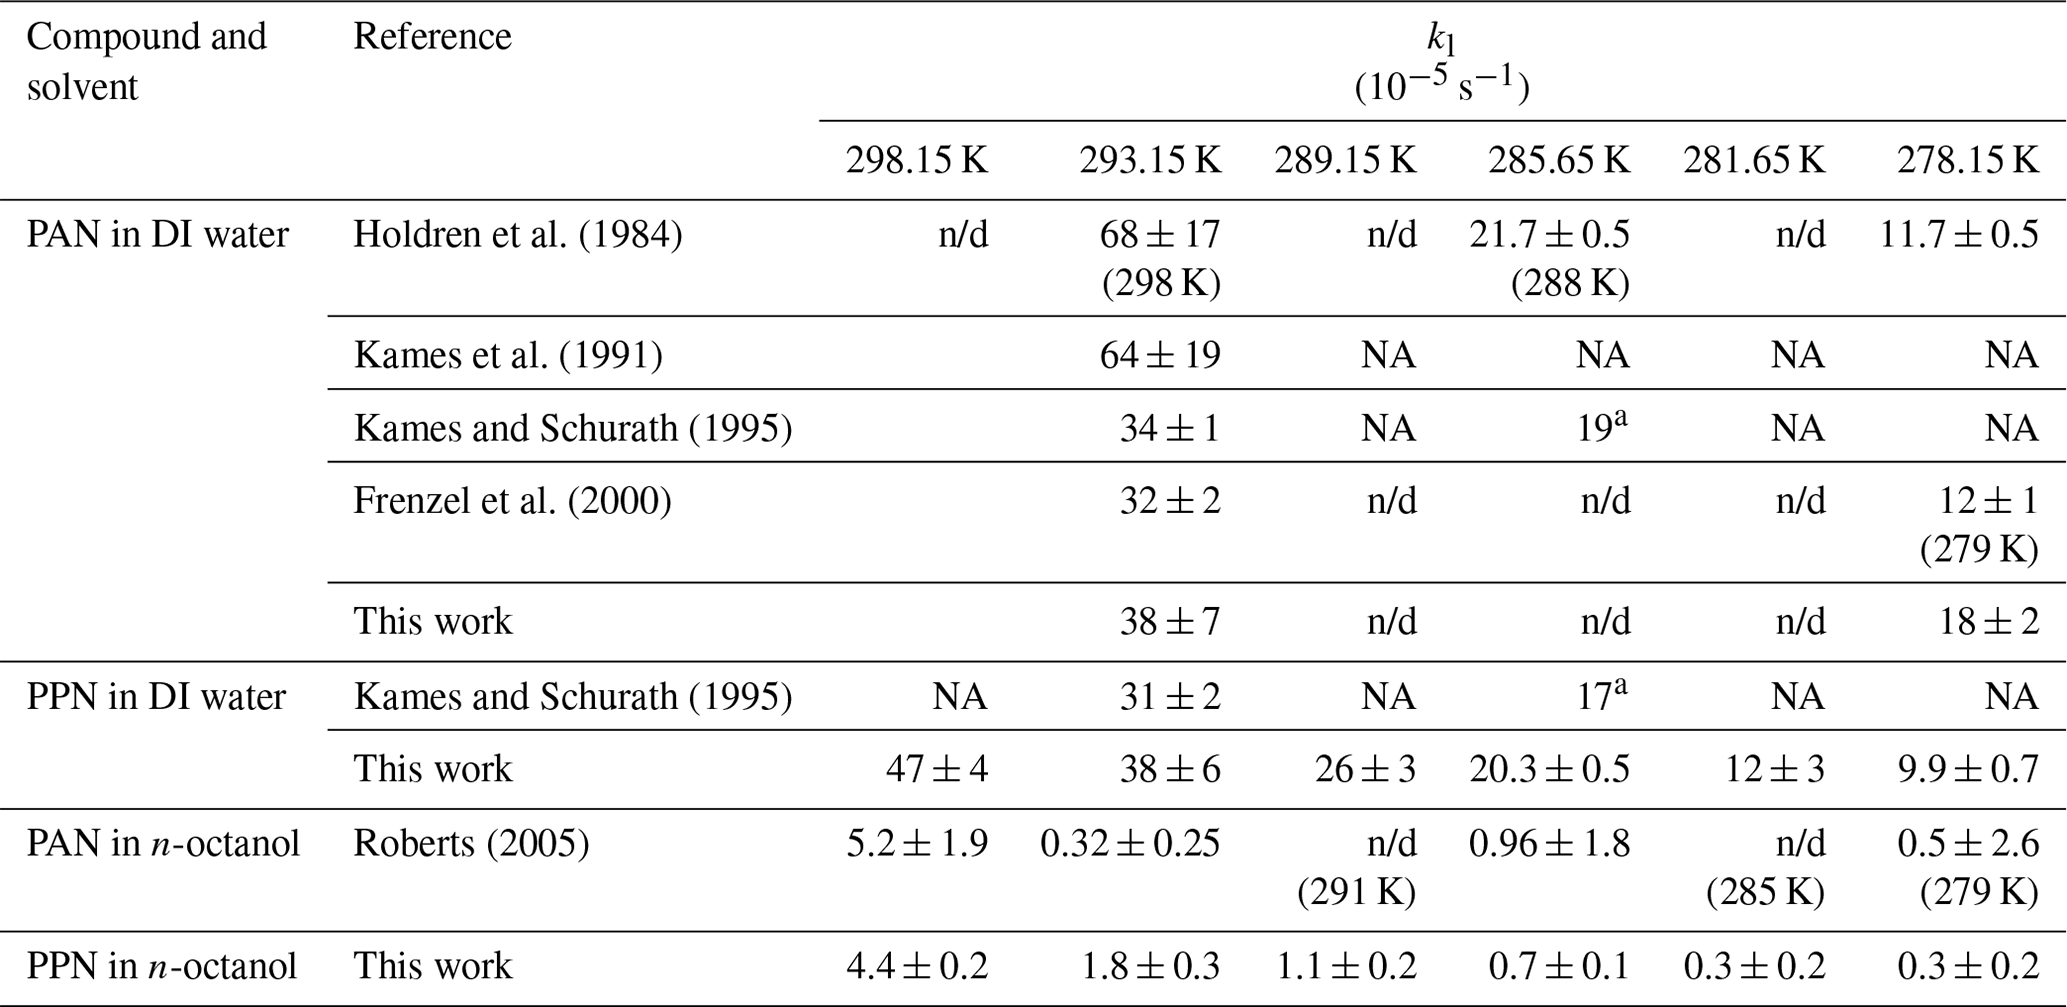
a Value estimated from Fig. 7 of Kames and Schurath (1995).
NA: not available (not tabulated); n/d: not determined.
Table 5Temperature dependence of liquid-phase loss rate constants.
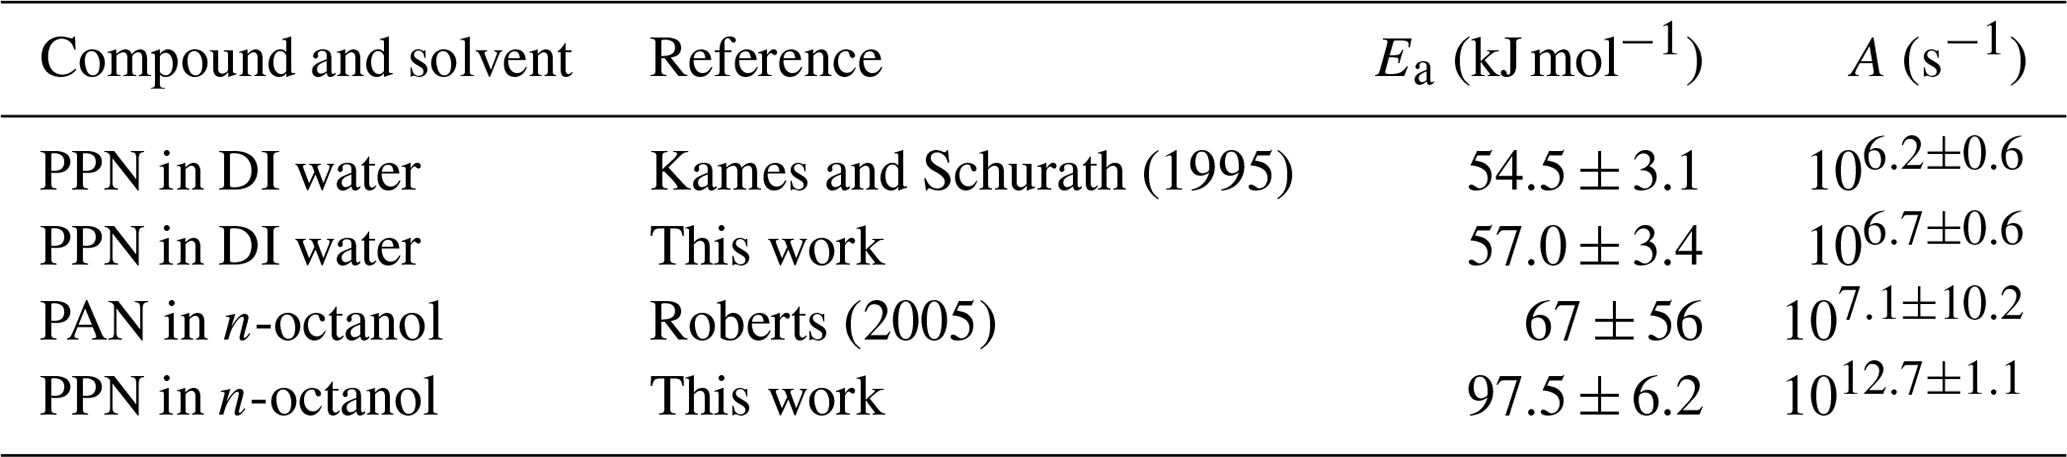
Loss rate constants determined from the intercepts of plots such as those shown in Fig. 4 are summarized in Table 4. Values for are plotted versus in Fig. 6 alongside literature values, including data extracted from Fig. 7 of Kames and Schurath (1995) and the rate constants for thermal dissociation of PAN and PPN (Kabir et al., 2014). All kl values in DI water are larger than (whereas all kl values in n-octanol are smaller than) the thermal decomposition rates of PAN and PPN (Fig. 6). Table 5 summarizes linear regression parameters to the data shown in Fig. 6, i.e., the temperature dependence of kl. The loss rate constant of PPN in n-octanol increases when a small amount of a radical scavenger, α-tocopherol (Niki and Noguchi, 2004), is added to the solution (Fig. S3) but is still smaller than PPN's thermal decomposition rate constant in the gas phase as well as its loss rate constant in DI water (Table S8).
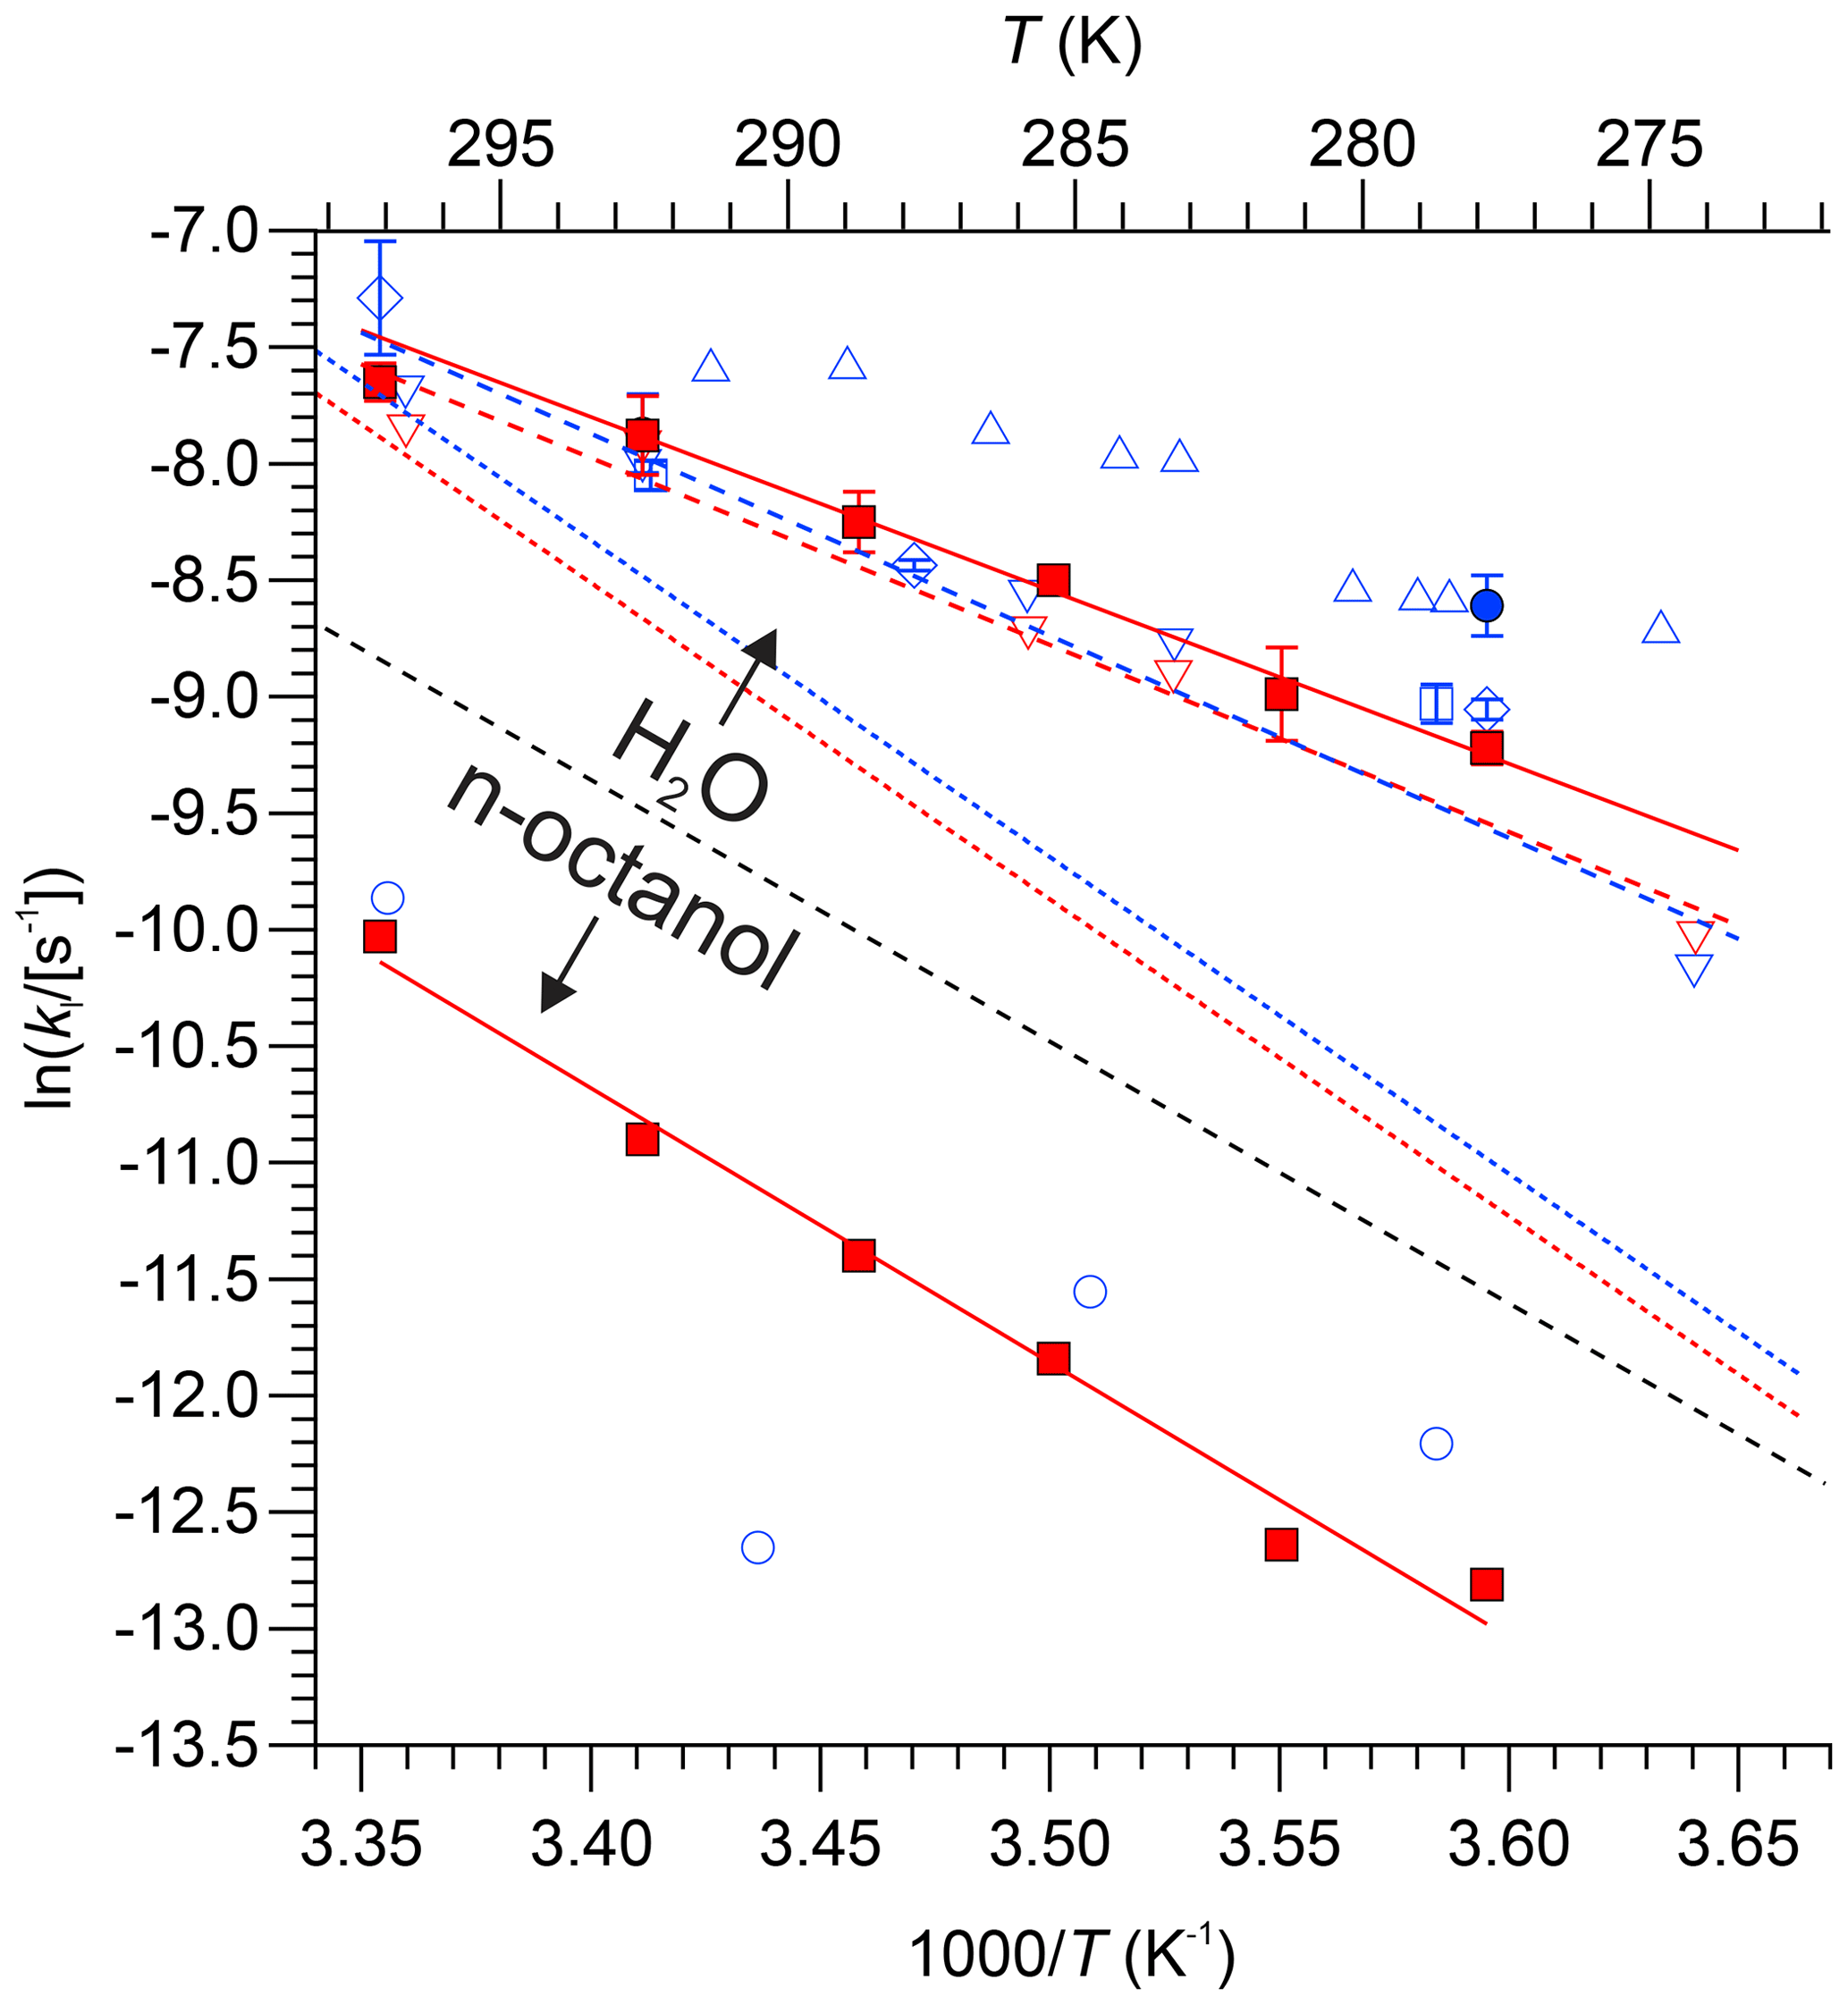
Figure 6Natural logarithm of kl of PAN (blue colour) and PPN (red colour) in DI water and n-octanol plotted versus . Data from this work are shown as solid symbols (• for PAN and □ for PPN). Literature data: × Holdren et al. (1984), △ Kames et al. (1991), ▿ and - - Kames and Schurath (1995), ◊ Frenzel et al. (2000), ∘ Roberts (2005). Error bars for the data by Roberts (2005) are omitted for clarity. The dashed blue and red lines (- - -) are the expressions by Kabir et al. (2014) for thermal dissociation of PAN and PPN, respectively. The dashed black line serves as a visual indicator to separate results obtained with n-octanol (bottom portion of graph) from those obtained with DI water (top).
The results of this work allow constraints to be placed on the uptake of PPN by aqueous and organic matter in the atmosphere. The liquid water content of the atmosphere is highly variable and ranges from < 3 × 10⁻⁶ g m−3 in the cloud-free atmosphere under low aerosol loading (Nenes et al., 2021) to > 3 g m−3 in cumulonimbus clouds in the tropics (Rosenfeld and Lensky, 1998). Using values of kl,aq and measured in this work and Eq. (7), we calculated the lifetimes with respect to hydrolysis (τwet = ) of PAN and PPN for a range of atmospheric conditions including high (inorganic) aerosol loadings, clouds, and fog at 293 K (Table S9) and 278 K (Table S10). The calculated wet deposition lifetimes of PPN (and PAN) vary from several days (e.g., in the presence of marine fog) to years.
Reactive uptake probabilities calculated using Eq. (8) are summarized in Table S11. For DI water, γ values are on the order of ∼ 10−6 for both PAN and PPN at 278 and 293 K. For n-octanol, γ values are larger, varying between 4 × 10⁻⁶ (at 278 K) and 2 × 10⁻⁶ (293 K) for PAN and between 0.7 × 10⁻⁵ (278 K) and 1.1 × 10⁻⁵ (293 K) for PPN.
4.1 Solubility of PAN and PPN in DI water
The H data observed in this work for PAN (Fig. 5, blue colour) are in excellent agreement with the majority of the recent literature (Kames and Schurath, 1995; Kames et al., 1991; Frenzel et al., 2000; Lee, 1984), which gives confidence in the accuracy of the measurements presented in this paper. The only outlier is the data point by Holdren et al. (1984), which is inconsistent with all other measurements and appears to be in error. On the other hand, the H constants of PPN in DI water observed in this work (Fig. 5, red colour) are systematically smaller than those by Kames and Schurath (1995), the only other study of water solubility of PPN. At 293.15 K, for example, a value of Haq = (2.67 ± 0.18) M atm−1 was observed in this work, ∼ 8 % lower than the literature value of (2.90 ± 0.06) M atm−1. The gap is larger (∼ 17 %) when values are calculated based on the parameters in Table 2. The reason (or reasons) for this difference and whose measurement is ultimately more accurate is uncertain, though the results in this work are corroborated by the excellent agreement for PAN with the literature (Fig. 5).
The kl values for PAN and PPN in DI water (Fig. 6) are also consistent with literature values: they are smaller than those reported for PAN by Kames et al. (1991) and marginally larger than the values reported for PAN and PPN by Kames and Schurath (1995). In DI water, all measured kl constants are larger than the thermal dissociation rates of either PAN or PPN (shown as dashed lines in Fig. 6), consistent with the hydrolysis mechanism hypothesized by Kames et al. (1991).
In general, accurate measurements of kl in unbuffered DI water are challenging because the hydrolysis rate constants are larger in the presence of salts (Kames and Schurath, 1995) and pH-dependent, i.e., base-catalyzed (Lee, 1984) and slower in acidic solutions (Frenzel et al., 2000). Hence, impurities may potentially bias experimental data for unbuffered DI water. The largest source of impurities is the sample loading stage because gas streams containing PAN or PPN in high purity are challenging to generate. A contributing factor for the observed differences for PPN between this work and the study of Kames and Schurath (1995) may thus have been the method of PPN generation: in this work, a diffusion source was used, whereas Kames and Schurath (1995) used a photochemical source based on 3-pentanone photolysis in the presence of NO2 to generate PPN in situ. Both of these types of sources co-emit water-soluble impurities. It is clear that EN was emitted in this work, though only in minute quantities (Fig. 2) that in all likelihood did not affect the solubility of PPN. In contrast, the photochemical source used by Kames and Schurath (1995) likely co-emitted, as they put it, “rather high mixing ratios” (∼ 3000 ppmv) of 3-pentanone and would have also co-emitted a myriad of water-soluble photochemical by-products such as hydroperoxides, aldehydes, and α,β-dicarbonyls such as glyoxal (Rider et al., 2015). Furthermore, formation of photochemical side products would have been accentuated in their work since they utilized a 254 nm Hg lamp whose high operating temperature heightens undesired secondary photochemistry (Rider et al., 2015). It is unclear whether these impurities would have altered the bulk properties of the water contained in their bubble column and hence led to different H and kl values, but it is certainly conceivable. Both diffusion and photochemical sources may have also co-emitted some NO2 generated from thermal decomposition of PAN or PPN, whose presence can increase the effective lifetime of PANs with respect to the thermal dissociation (Sehested et al., 1998), though fortunately this compound is many orders of magnitude less water-soluble than either PAN or PPN (Sander, 2015) such that the potential presence of NO2 is inconsequential.
4.2 Solubility of PAN and PPN in n-octanol and KOW values
This work represents, to the best of our knowledge, the first and only measurement of the solubility of PPN in an organic liquid and the first determination of KOW for this compound.
The measured Hoct and KOW constants are a factor of ∼ 2.4 ± 0.3 and ∼ 4.1 ± 0.6 larger for PPN than those reported by Roberts (2005) for PAN (Tables 1 and 3). These ratios are, qualitatively, rationalized by PPN's longer aliphatic side chain and are of similar relative magnitude to the KOW constants reported by MacKay et al. (2006) for ethyl and methyl acetate (5.4:1.5 ≈ 3.6) as well as ethyl and methyl formate (2.13:1.07 ≈ 2.0); i.e., the results are reasonable.
Wang et al. (2017) predicted gas–water and gas–organic partitioning coefficients for PAN and PPN using three independent prediction methods; however, their predicted values diverged considerably between each other and differed by several orders of magnitude from the experimental values reported in this work, especially for air–water partitioning. This is broadly consistent with the conclusions of their paper that noted challenges of theoretical methods to accurately predict Henry's law constants, particularly for multifunctional compounds such as PAN or PPN.
The kl values measured for PPN in n-octanol (Fig. 6) are consistent with (but more precise than) those observed by Roberts (2005) for PAN and much smaller than the gas-phase thermal dissociation rate constants at all temperatures. The lower kl value is, qualitatively, rationalized by a solvent or “cage” effect, where PPN and PAN dissociate, but the relative lipophobic fragments recombine faster than they react. When a known radical scavenger, α-tocopherol, was added, kl increased but remained below the thermal dissociation limit (Fig. S3 and Table S8), consistent with this interpretation.
4.3 Atmospheric implications
The results of this work allow constraints to be placed on the heterogeneous uptake of PPN in the atmosphere.
The calculated wet deposition lifetimes of PPN (and PAN) are on the order of years (Tables S9 and S10), substantiating the conclusion by Kames and Schurath (1995) and others that wet deposition of these molecules in the troposphere is generally too slow to matter. The only potential exception is the marine environment, where the phase ratio (; Tables S9 and S10) is large and can exceed 10−4 for both PAN and PPN. Furthermore, Kames and Schurath (1995) measured a loss rate constant of 4.4 × 10⁻³ s−1 for filtered seawater, a factor of ∼ 24 larger than that for DI water. The reason(s) for the larger kl values is (are) not known, but the larger values suggest the presence of one (or more) reaction pathway(s) in addition to hydrolysis. Assuming this larger kl value for marine boundary layer (MBL) fog or cloud droplets, τwet is on the order of tens of days for PPN and approximately half that for PAN (Tables S9 and S10). This suggests that wet deposition may potentially have contributed to the enhancement of the PPN:PAN ratio observed in the Gulf of Maine (Roberts et al., 1996). However, under the conditions of drizzling MBL fog as observed during the New England Air Quality Study (NEAQS) in 2004, the suspended droplets would more likely resemble pure water droplets as opposed to droplets resembling oceanic surface water, which in turn would imply hydrolysis lifetimes on the order of hundreds of days and a negligible loss by wet deposition.
This work has shown that the H constants of PPN in n-octanol are larger than those for PAN in n-octanol, which suggests that PPN will be more soluble in organic aerosol (OA). Assuming Lorg = 5 × 10⁻¹¹ (Roberts, 2005) and further assuming that n-octanol is a good proxy for OA, we calculate an equilibrium fraction between 2 × 10⁻⁷ at 5 ∘C and 1 × 10⁻⁷ at 25 ∘C for the partitioning of PPN on OA, approximately double that of PAN but still orders of magnitude too small to be of consequence to the gas-phase concentration of PPN. For example, assuming an aerosol surface area characteristic of the polluted lower troposphere of SA = 1000 µm2 cm−3 and 50 % (liquid) organic aerosol content and using γ = 1 × 10⁻⁵ estimated in this work for OA at 293 K (Table S11), the first-order rate constant of PPN uptake (korg) would be ∼ 3 × 10⁻⁷ s−1, or a lifetime of ∼ 43 d, which is negligible. Further, the viscosity of OA is often larger than assumed for the calculations in Table S11; i.e., Dl can be many orders of magnitude smaller than 10−9 m2 s−1 (Shiraiwa et al., 2011). On the other hand, uptake of a radical precursor such as PPN on OA may very well initiate secondary radical chemistry within the particle phase that is believed to yield oligomeric and humic-like substances (Lim et al., 2010), which in turn suggests that uptake of PPN should not be ignored. Our work provides the first estimates of γ values for PPN (Table S11) since there are, to the best of our knowledge, no experimental measurements of γ for PPN in the open literature. However, our γ estimates for PAN are at odds with a recent publication by Sun et al. (2022), who reported γ values in the range of (6–9) × 10−5 for ambient aerosol at high relative humidity (RH) which are substantially larger than those calculated for DI water in this work (∼ 10−6; Table S11). They argued that the large uptake of ambient aerosol would be driven by chemical loss of PAN within the particle phase via unspecified redox reactions, yielding a substantially larger kl, which is reminiscent of the observation by Kames and Schurath (1995) for filtered seawater. However, because the uptake of PAN scales with , a factor of ∼ 15 larger uptake in turn would require a ∼ 200× larger liquid-phase reaction rate constant, which seems unrealistic or would require some currently unknown chemistry.
The and associated T and data for the experiments discussed are tabulated in the Supplement. Raw data (i.e., digitized chromatograms) have been placed in an online repository, accessible at https://doi.org/10.5683/SP3/IYXA3G (Osthoff, 2022), and are also available from the corresponding author (hosthoff@ucalgary.ca) upon request.
The supplement related to this article is available online at: https://doi.org/10.5194/acp-23-311-2023-supplement.
MAV (PPN in water using the Varian GC-ECD), KDE (PPN in n-octanol using the Varian GC-ECD), KNA (PAN in water using the HP GC-ECD), and AMM (PAN in water using the Varian GC-ECD) carried out the experiments and reduced the data. MAV and KNA synthesized PPN and PAN, respectively. HDO conceptualized the experiments and drafted the manuscript with input from KDE.
The contact author has declared that none of the authors has any competing interests.
Publisher's note: Copernicus Publications remains neutral with regard to jurisdictional claims in published maps and institutional affiliations.
This research has been supported by the Natural Sciences and Engineering Research Council of Canada (grant no. RGPIN/03849-2016). Kevin D. Easterbrook received an NSERC undergraduate student research award (USRA).
This paper was edited by Eleanor Browne and reviewed by Rolf Sander and one anonymous referee.
Burkholder, J. B., Sander, S. P., Abbatt, J., Barker, J. R., Cappa, C., Crounse, J. D., Dibble, T. S., Huie, R. E., Kolb, C. E., Kurylo, M. J., Orkin, V. L., Percival, C. J., Wilmouth, D. M., and Wine, P. H.: Chemical Kinetics and Photochemical Data for Use in Atmospheric Studies, Evaluation No. 19, JPL Publication 19-5, Jet Propulsion Laboratory, Pasadena, http://jpldataeval.jpl.nasa.gov (last access: 5 January 2021), 2019.
Davidovits, P., Kolb, C. E., Williams, L. R., Jayne, J. T., and Worsnop, D. R.: Mass accommodation and chemical reactions at gas-liquid interfaces, Chem. Rev., 106, 1323–1354, https://doi.org/10.1021/cr040366k, 2006.
Frenzel, A., Kutsuna, S., Takeuchi, K., and Ibusuki, T.: Solubility and reactivity of peroxyacetyl nitrate (PAN) in dilute aqueous salt solutions and in sulphuric acid, Atmos. Environ., 34, 3641–3644, https://doi.org/10.1016/S1352-2310(00)00132-1, 2000.
Furgeson, A., Mielke, L. H., Paul, D., and Osthoff, H. D.: A photochemical source of peroxypropionic and peroxyisobutanoic nitric anhydride, Atmos. Environ., 45, 5025–5032, https://doi.org/10.1016/j.atmosenv.2011.03.072, 2011.
Gaffney, J. S. and Marley, N. A.: The Impacts of Peroxyacetyl Nitrate in the Atmosphere of Megacities and Large Urban Areas: A Historical Perspective, ACS Earth Space Chem., 5, 1829–1841, https://doi.org/10.1021/acsearthspacechem.1c00143, 2021.
Harwood, M. H., Roberts, J. M., Frost, G. J., Ravishankara, A. R., and Burkholder, J. B.: Photochemical studies of CH3C(O)OONO2 (PAN) and CH3CH2C(O)OONO2 (PPN): NO3 quantum yields, J. Phys. Chem. A, 107, 1148–1154, https://doi.org/10.1021/jp0264230, 2003.
Holdren, M. W., Spicer, C. W., and Hales, J. M.: Peroxyacetyl nitrate solubility and decomposition rate in acidic water, Atmos. Environ., 18, 1171–1173, https://doi.org/10.1016/0004-6981(84)90148-3, 1984.
Kabir, M., Jagiella, S., and Zabel, F.: Thermal Stability of n-Acyl Peroxynitrates, Int. J. Chem. Kinet., 46, 462–469, https://doi.org/10.1002/kin.20862, 2014.
Kames, J. and Schurath, U.: Henry's law and hydrolysis rate constants for peroxyacyl nitrates (PANs) using a homogeneous gas-phase source, J. Atmos. Chem., 21, 151–164, https://doi.org/10.1007/BF00696578, 1995.
Kames, J., Schweighoefer, S., and Schurath, U.: Henry's law constant and hydrolysis of peroxyacetyl nitrate (PAN), J. Atmos. Chem., 12, 169–180, https://doi.org/10.1007/BF00115778, 1991.
Koracin, D., Lewis, J., Thompson, W. T., Dorman, C. E., and Businger, J. A.: Transition of stratus into fog along the California coast: Observations and modeling, J. Atmos. Sci., 58, 1714–1731, https://doi.org/10.1175/1520-0469(2001)058<714:Tosifa>2.0.Co;2, 2001.
Lee, Y. N.: Kinetics of some aqueous-phase reactions of peroxyacetyl nitrate, Brookhaven National Lab., Upton, NY, USA, BNL-34735; CONF-840489-4; ON:DE84011911, 1984.
Lim, Y. B., Tan, Y., Perri, M. J., Seitzinger, S. P., and Turpin, B. J.: Aqueous chemistry and its role in secondary organic aerosol (SOA) formation, Atmos. Chem. Phys., 10, 10521–10539, https://doi.org/10.5194/acp-10-10521-2010, 2010.
Mackay, D. and Parnis, J. M.: Multimedia environmental models: the fugacity approach, 3rd edn., Taylor & Francis, Boca Raton, FL, USA, ISBN 9780367809829, https://doi.org/10.1201/9780367809829, 2020.
Mackay, D., Shiu, W. Y., Ma, K.-C., and Lee, S. C.: Handbook of physical–chemical properties and environmental fate for organic chemicals, 2nd Edn., CRC/Taylor & Francis, Boca Raton, FL, ISBN 9780429150074, https://doi.org/10.1201/9781420044393, 2006.
McFadyen, G. G. and Cape, J. N.: Spring time sources and sinks of Peroxyacetyl Nitrate in the UK and its contribution to acidification and nitrification of cloud water, Atmos. Res., 50, 359–371, https://doi.org/10.1016/s0169-8095(98)00102-1, 1999.
Mielke, L. H. and Osthoff, H. D.: On quantitative measurements of peroxycarboxylic nitric anhydride mixing ratios by thermal dissociation chemical ionization mass spectrometry, Int. J. Mass Spectrom., 310, 1–9, https://doi.org/10.1016/j.ijms.2011.10.005, 2012.
Mitchell, M., Muftakhidinov, B., Winchen, T., Wilms, A., van Schaik, B., badshah400, and Mo-Gul: The Gitter Badger, Zbigniew Jędrzejewski-Szmek, kensington, & kylesower, markummitchell/engauge-digitizer: Nonrelease (v12.2.1), Zenodo [code], https://doi.org/10.5281/zenodo.3941227, 2020.
Nenes, A., Pandis, S. N., Kanakidou, M., Russell, A. G., Song, S., Vasilakos, P., and Weber, R. J.: Aerosol acidity and liquid water content regulate the dry deposition of inorganic reactive nitrogen, Atmos. Chem. Phys., 21, 6023–6033, https://doi.org/10.5194/acp-21-6023-2021, 2021.
Niki, E. and Noguchi, N.: Dynamics of Antioxidant Action of Vitamin E, Accounts Chem. Res., 37, 45–51, https://doi.org/10.1021/ar030069m, 2004.
Osthoff, H.: Support data for Measurement of Henry's law and liquid-phase loss rate constants of peroxypropionic nitric anhydride (PPN) in deionized water and in n-octanol, V1, Borealis [data set], https://doi.org/10.5683/SP3/IYXA3G, 2022.
Raventos-Duran, T., Camredon, M., Valorso, R., Mouchel-Vallon, C., and Aumont, B.: Structure-activity relationships to estimate the effective Henry's law constants of organics of atmospheric interest, Atmos. Chem. Phys., 10, 7643–7654, https://doi.org/10.5194/acp-10-7643-2010, 2010.
Reddy, K. A. and Doraiswamy, L. K.: Estimating Liquid Diffusivity, Ind. Eng. Chem. Fund., 6, 77–79, https://doi.org/10.1021/i160021a012, 1967.
Rider, N. D., Taha, Y. M., Odame-Ankrah, C. A., Huo, J. A., Tokarek, T. W., Cairns, E., Moussa, S. G., Liggio, J., and Osthoff, H. D.: Efficient photochemical generation of peroxycarboxylic nitric anhydrides with ultraviolet light-emitting diodes, Atmos. Meas. Tech., 8, 2737–2748, https://doi.org/10.5194/amt-8-2737-2015, 2015.
Roberts, J. M.: The atmospheric chemistry of organic nitrates, Atmos. Environ. A-Gen., 24, 243–287, https://doi.org/10.1016/0960-1686(90)90108-Y, 1990.
Roberts, J. M.: Measurement of the Henry's law coefficient and first order loss rate of PAN in n-octanol, Geophys. Res. Lett., 32, L08803, https://doi.org/10.1029/2004gl022327, 2005.
Roberts, J. M.: PAN and Related Compounds, in: Volatile Organic Compounds in the Atmosphere, edited by: Koppmann, R., Blackwell Publishing, Oxford, UK, 221–268, ISBN 9781405131155, 2007.
Roberts, J. M., Fajer, R. W., and Springston, S. R.: Capillary gas chromatographic separation of alkyl nitrates and peroxycarboxylic nitric anhydrides, Anal. Chem., 61, 771–772, https://doi.org/10.1021/ac00182a026, 1989.
Roberts, J. M., Parrish, D. D., Norton, R. B., Bertman, S. B., Holloway, J. S., Trainer, M., Fehsenfeld, F. C., Carroll, M. A., Albercook, G. M., Wang, T., and Forbes, G.: Episodic removal of NOy species from the marine boundary layer over the North Atlantic, J. Geophys. Res.-Atmos., 101, 28947–28960, https://doi.org/10.1029/96jd02632, 1996.
Roberts, J. M., Marchewka, M., Bertman, S. B., Sommariva, R., Warneke, C., de Gouw, J., Kuster, W., Goldan, P., Williams, E., Lerner, B. M., Murphy, P., and Fehsenfeld, F. C.: Measurements of PANs during the New England Air Quality Study 2002, J. Geophys. Res., 112, D20306, https://doi.org/10.1029/2007jd008667, 2007.
Rosenfeld, D. and Lensky, I. M.: Satellite-Based Insights into Precipitation Formation Processes in Continental and Maritime Convective Clouds, B. Am. Meteorol. Soc., 79, 2457–2476, https://doi.org/10.1175/1520-0477(1998)079<457:Sbiipf>2.0.Co;2, 1998.
Sander, R.: Compilation of Henry's law constants (version 4.0) for water as solvent, Atmos. Chem. Phys., 15, 4399–4981, https://doi.org/10.5194/acp-15-4399-2015, 2015.
Sander, R., Acree, W. E., Visscher, A. D., Schwartz, S. E., and Wallington, T. J.: Henry's law constants (IUPAC Recommendations 2021), Pure Appl. Chem., 94, 71–85, https://doi.org/10.1515/pac-2020-0302, 2022.
Schwartz, S.: Presentation of solubility data: Units and applications, in: Chemicals in the atmosphere: solubility, sources, and reactivity, edited by: Fogg, P. G. T. and Sangster, J., 7, J. Wiley, Hoboken, NJ, 19–42, ISBN 978-0-471-98651-5, 2003.
Sehested, J., Christensen, L. K., Mogelberg, T., Nielsen, O. J., Wallington, T. J., Guschin, A., Orlando, J. J., and Tyndall, G. S.: Absolute and relative rate constants for the reactions CH3C(O)O2 + NO and CH3C(O)O2 + NO2 and thermal stability of CH3C(O)O2NO2, J. Phys. Chem. A, 102, 1779–1789, https://doi.org/10.1021/jp972881a, 1998.
Shiraiwa, M., Ammann, M., Koop, T., and Poschl, U.: Gas uptake and chemical aging of semisolid organic aerosol particles, P. Natl. Acad. Sci. USA, 108, 11003–11008, https://doi.org/10.1073/pnas.1103045108, 2011.
Sparks, J. P., Roberts, J. M., and Monson, R. K.: The uptake of gaseous organic nitrogen by leaves: A significant global nitrogen transfer process, Geophys. Res. Lett., 30, 2189, https://doi.org/10.1029/2003gl018578, 2003.
Staudinger, J. and Roberts, P. V.: A critical compilation of Henry's law constant temperature dependence relations for organic compounds in dilute aqueous solutions, Chemosphere, 44, 561–576, https://doi.org/10.1016/S0045-6535(00)00505-1, 2001.
Sun, M., Zhou, Y., Wang, Y., Qiao, X., Wang, J., and Zhang, J.: Heterogeneous Reaction of Peroxyacetyl Nitrate on Real-World PM2.5 Aerosols: Kinetics, Influencing Factors, and Atmospheric Implications, Environm. Sci. Technol., 56, 9325–9334, https://doi.org/10.1021/acs.est.2c03050, 2022.
Talukdar, R. K., Burkholder, J. B., Schmoltner, A. M., Roberts, J. M., Wilson, R. R., and Ravishankara, A. R.: Investigation of the loss processess for peroxyacetyl nitrate in the atmosphere – UV Photolysis and reaction with OH, J. Geophys. Res., 100, 14163–14173, https://doi.org/10.1029/95JD00545, 1995.
Teklemariam, T. A. and Sparks, J. P.: Gaseous fluxes of peroxyacetyl nitrate (PAN) into plant leaves, Plant Cell Environ., 27, 1149–1158, 2004.
Tokarek, T. W., Huo, J. A., Odame-Ankrah, C. A., Hammoud, D., Taha, Y. M., and Osthoff, H. D.: A gas chromatograph for quantification of peroxycarboxylic nitric anhydrides calibrated by thermal dissociation cavity ring-down spectroscopy, Atmos. Meas. Tech., 7, 3263–3283, https://doi.org/10.5194/amt-7-3263-2014, 2014.
Villalta, P. W., Lovejoy, E. R., and Hanson, D. R.: Reaction probability of peroxyacetyl radical on aqueous surfaces, Geophys. Res. Lett., 23, 1765–1768, https://doi.org/10.1029/96GL01286, 1996.
Wang, C., Yuan, T., Wood, S. A., Goss, K.-U., Li, J., Ying, Q., and Wania, F.: Uncertain Henry's law constants compromise equilibrium partitioning calculations of atmospheric oxidation products, Atmos. Chem. Phys., 17, 7529–7540, https://doi.org/10.5194/acp-17-7529-2017, 2017.
Williams, J., Roberts, J. M., Fehsenfeld, F. C., Bertman, S. B., Buhr, M. P., Goldan, P. D., Hubler, G., Kuster, W. C., Ryerson, T. B., Trainer, M., and Young, V.: Regional ozone from biogenic hydrocarbons deduced from airborne measurements of PAN, PPN, and MPAN, Geophys. Res. Lett., 24, 1099–1102, https://doi.org/10.1029/97GL00548, 1997.
Williams, J., Roberts, J. M., Bertman, S. B., Stroud, C. A., Fehsenfeld, F. C., Baumann, K., Buhr, M. P., Knapp, K., Murphy, P. C., Nowick, M., and Williams, E. J.: A method for the airborne measurement of PAN, PPN, and MPAN, J. Geophys. Res., 105, 28943–28960, https://doi.org/10.1029/2000JD900373, 2000.
Zborowska, A. G., MacInnis, C. Y., Ye, C. Z., and Osthoff, H. D.: On the photolysis branching ratio of methyl ethyl ketone, Atmos. Environ., 254, 118383, https://doi.org/10.1016/j.atmosenv.2021.118383, 2021.