the Creative Commons Attribution 4.0 License.
the Creative Commons Attribution 4.0 License.
 | 22 Feb 2023
Sensitivity of convectively driven tropical tropopause cirrus properties to ice habits in high-resolution simulations
Fayçal Lamraoui
Martina Krämer
Armin Afchine
Adam B. Sokol
Sergey Khaykin
Apoorva Pandey
Zhiming Kuang
Cirrus clouds that form in the tropical tropopause layer (TTL) can play a key role in vertical transport through the upper troposphere and lower stratosphere, which can significantly impact the radiative energy budget and stratospheric chemistry. However, the lack of realistic representation of natural ice cloud habits in microphysical parameterizations can lead to uncertainties in cloud-related processes and cloud–climate feedbacks. The main goal of this study is to investigate the role of different cloud regimes and the associated ice habits in regulating the properties of the TTL. We compare aircraft measurements from the StratoClim field campaign to a set of numerical experiments at the scale of large-eddy simulations (LESs) for the same case study that employ different microphysics schemes. Aircraft measurements over the southern slopes of the Himalayas captured high ice water content (HIWC) up to 2400 ppmv and ice particle aggregates exceeding 700 µm in size with unusually long residence times. The observed ice particles were mainly of liquid origin, with a small amount formed in situ. The corresponding profile of ice water content (IWC) from the ERA5 reanalysis corroborates the presence of HIWC detrained from deep-convective plumes in the TTL but underestimates HIWC by an order of magnitude. In the TTL, only the scheme that predicts ice habits can reproduce the observed HIWC, ice number concentration, and bimodal ice particle size distribution. The lower range of particle sizes is mostly represented by planar and columnar habits, while the upper range is dominated by aggregates. Large aggregates with sizes between 600 and 800 µm have fall speeds of less than 20 cm s−1, which explains the long residence time of the aggregates in the TTL. Planar ice particles of liquid origin contribute substantially to HIWC. The columnar and aggregate habits are in the in situ range with lower IWC and number concentrations. For all habits, the ice number concentration increases with decreasing temperature. For the planar ice habit, relative humidity is inversely correlated with fall speed. This correlation is less evident for the other two ice habits. In the lower range of supersaturation with respect to ice, the columnar habit has the highest fall speed. The difference in ice number concentration across habits can be up to 4 orders of magnitude, with aggregates occurring in much smaller numbers. We demonstrate and quantify the linear relationship between the differential sedimentation of pristine ice crystals and the size of the aggregates that form when pristine crystals collide. The slope of this relationship depends on which pristine ice habit sediments faster. Each simulated ice habit is associated with distinct radiative and latent heating rates. This study suggests that a model configuration nested down to LES scales with a microphysical parameterization that predicts ice shape evolution is crucial to provide an accurate representation of the microphysical properties of TTL cirrus and thus the associated (de)hydration process.
- Article
(21163 KB) - Full-text XML
- BibTeX
- EndNote


Stratosphere–troposphere exchange plays an important role in the composition of the upper troposphere and lower stratosphere (Dessler and Sherwood, 2004; Stohl et al., 2003). Trace gases such as stratospheric water vapor can directly and indirectly impact climate, radiation (Forster and Shine, 1999; Solomon et al., 2010; Gettelman et al., 2011), chemistry (Dvorstov and Solomon, 2001), and dynamics (e.g., Manney et al., 2014). On a global scale, air enters the stratosphere via the tropical tropopause (Brewer, 1949). In the upwelling branch of the Brewer–Dobson circulation (BDC), the water vapor injected in the tropical lower stratosphere is transported meridionally to the temperate stratosphere. Due to the slow nature of the BDC, this process results in a longer residence time of the injected stratospheric water vapor. The tropical tropopause layer (TTL), which reaches from the tropically averaged level of all-sky zero net radiative heating (Gettelman and Forster, 2002; Sherwood and Dessler, 2000, 2001) (14 km, 150 hPa, 355 K) to the upper boundary of 18.5 km (70 hPa, 425 K), is the gateway to the stratosphere (Fu et al., 2007; Fueglistaler et al., 2009). In addition to large-scale processes, determining how convection may contribute to cross-tropopause transport is essential for understanding Earth's climate (Anderson et al., 2017). To identify the key mechanisms that control the stratospheric water vapor, considerable attention has been given to the role of cross-tropopause convective outflow (e.g., Homeyer et al., 2017; Smith et al., 2017; Ueyama et al., 2018). The Asian summer monsoon (ASM) is the dominant contributor to annual water vapor peaks in the lower stratosphere and the associated Asian summer monsoon anticyclone (AMA) (e.g., Fueglistaler et al., 2005; Ueyama et al., 2018; Ploeger et al., 2015). The impact of deep convection on hydration (e.g., Khaykin et al., 2009) and dehydration of the stratosphere (e.g., Sherwood and Dessler, 2001) over the southern slopes of the Himalayas, the Bay of Bengal, and the South China Sea (Fu et al., 2006; Devasthale and Fueglistaler, 2010; Wright et al., 2011; Tissier and Legras, 2016; Legras and Bucci, 2020) is topic of a debate. The amount of water vapor injected into the stratosphere by overshooting convection is regulated by the cold point temperature (CPT) in a process known as freeze-drying (Avery et al., 2017; Brewer, 1949; Evan et al., 2013; Fueglistaler et al., 2005; Holton and Gettelman, 2001; Randel et al., 2006; Schiller et al., 2009). Ice particles injected into the lower stratosphere bypass the cold trap, which is the coldest region in the TTL that modulates the water vapor entering the lower stratosphere via cirrus formation (Jensen et al., 1996) and ice crystals sedimentation (Holton and Gettelman, 2001), sublimate above the level of CPT, and contribute to stratospheric hydration (Anderson et al., 2017; Herman et al., 2017; Chemel et al., 2009; Khaykin et al., 2009). Cirrus clouds trap heat originating from the Earth's surface, scatter incoming shortwave radiation, and affect the intensity of large-scale circulation in the tropics, making them an important regulator (e.g., Dodion et al., 2008) and one of the largest source uncertainties in the prediction (Boucher et al., 2013) of Earth's climate. Spaceborne active remote sensing (i.e., CloudSat and CALIPSO) reported 35 % of cirrus coverage within ±15∘ latitude and 56 % within ±30∘ latitude of the Equator (Sassen et al., 2008, 2009). According to Baran (2012), satellite measurements in the tropics revealed that cirrus cloud cover can be 60 %–80 % at any given time. The net radiative effect of cirrus clouds depends on their macroscopic properties and the size distribution and shape of their ice particles (e.g., Jensen et al., 2009; Lawson et al., 2010; Baran, 2012). A comparison of 19 GCMs (general circulation models) revealed that the most significant discrepancies were in the upper troposphere where ice clouds are dominant (Jiang et al., 2012). Therefore, an accurate understanding of cirrus-related microphysical processes is vital for predicting climate with confidence (e.g., Schmitt et al., 2016).
Current state-of-the-art microphysical parameterizations are primarily tested and designed for the lower and middle troposphere rather than the cold-point tropopause and lower stratosphere, which have very different and complex environmental conditions. The growth of ice particles by vapor deposition in a supersaturated environment is sensitive to the temperature regime, resulting in a distinct ice habit and fall speed (e.g., Phillips et al., 2015). The treatment of ice particles and their shapes in models is very challenging (Pruppacher and Klett, 2010) and has become predominantly independent of measurements (Waliser et al., 2009; Schmitt et al., 2016). Moreover, the microphysical processes of pure ice clouds at these high altitudes are poorly understood due to the difficulty of measuring the key parameters with the required accuracy (Krämer et al., 2016). Most widely used microphysics schemes (e.g., Lin et al., 1983; Thompson et al., 2008) rely on traditional mass–dimensional (m–D) and terminal velocity–dimensional (vt–D) relationships, which have inherent shortcomings and lead to an inaccurate evolution of the density and shape of ice particles (Sulia et al., 2013; Jensen and Harrington, 2015). Other recent attempts (e.g., Morrison and Milbrandt, 2015) included aggregates but without prediction or evolution of ice density. Many recent laboratory (e.g., Järvinen et al., 2018; Harrington and Pokrifka, 2021; Pokrifka et al., 2020) and theoretical (e.g., Przybylo et al., 2019, 2022a, b; Schmitt and Heymsfield, 2010, 2014) studies have examined processes of ice particle growth and provided adequate details on ice crystal complexity, ice habits, and aggregates that are overlooked in most sophisticated microphysical parameterizations. According to ice habit diagrams (e.g., Bailey and Hallett, 2009), the shape of ice can change significantly in response to a temperature change of a few degrees Celsius.
In this study, we explore the ability of commonly used microphysics schemes to reproduce measured peaks of ice water content, ice number concentration, and large ice aggregates in the TTL. For ice crystals, we also explore how their fall speed depends on their habit and how relative humidity over ice impacts the shape that ice crystals attain. Thus, we aim to identify key parameters of these schemes and model configurations that can lead to an adequate representation of TTL cirrus. For the model setup, we stretch our computational resources to their limit and configure a real case study at very high spatial (large eddy simulation (LES) scale) and temporal resolutions. We compare a set of simulations using different schemes to aircraft measurements from the StratoClim campaign 2017.
The remainder of this paper is organized as follows. Section 2 provides an overview of the StratoClim field campaign and aircraft measurements used in this study. Section 3 presents the numerical experiments, including details on the microphysical parameterizations involved. Section 4 discusses the results of the model and the comparison with the measurements. Section 5 summarizes the results and presents recommendations for modelers to adequately simulate TTL cirrus.
2.1 Field campaign and observational data sets
The in situ measurements used in this study are aircraft data from the StratoClim campaign, which took place over the Indian subcontinent from 27 July to 10 August 2017. The M55-Geophysica high-flying research aircraft deployed in Kathmandu, Nepal, was equipped with a comprehensive set of instruments to capture high-quality data sets, which include, but are not limited to, water vapor, number densities, size distributions of ice particles, and meteorological parameters in the subtropical upper troposphere–lower stratosphere (UTLS) region (Khaykin et al., 2022).
In this study, we use in situ measurements of temperature and pressure made by TDC (ThermoDynamic Complex) (Shur et al., 2007) and measurements of the cloud particle number size distribution in the size range of 3–937 µm diameter at a time resolution of 1 Hz (Krämer at al., 2016; Luebke et al., 2016) made by NIXE-CAPS (New Ice eXpEriment: Cloud and Aerosol Particle Spectrometer). The ice water content (IWC) is derived from the particle size distribution with a lower detection limit of ∼ 0.05 ppmv (Krämer at al., 2020; Afchine et al., 2018). Gas-phase water was measured with a sampling rate of 1 Hz using the Lyman-Alpha hygrometer FLASH (Khaykin et al., 2022).
2.2 Case study description
While the aircraft completed eight successful flights during the 2017 Asian monsoon season (Krämer et al., 2020, main article and Supplement), this study focuses on one specific flight (Flight 8, hereafter F8) on 10 August (Fig. 1), which was characterized by a stable anticyclone and intercepted strong overshooting deep convection, high ice water contents, and very large aggregates of ice particles that persisted for an unusually long duration. Moreover, this case study is characterized by overshooting of ice crystals into a supersaturated environment above the tropopause (Khaykin et al., 2022), resulting in their rapid growth via uptake of water vapor, sedimentation, and hence irreversible dehydration (Schoeberl et al., 2018).
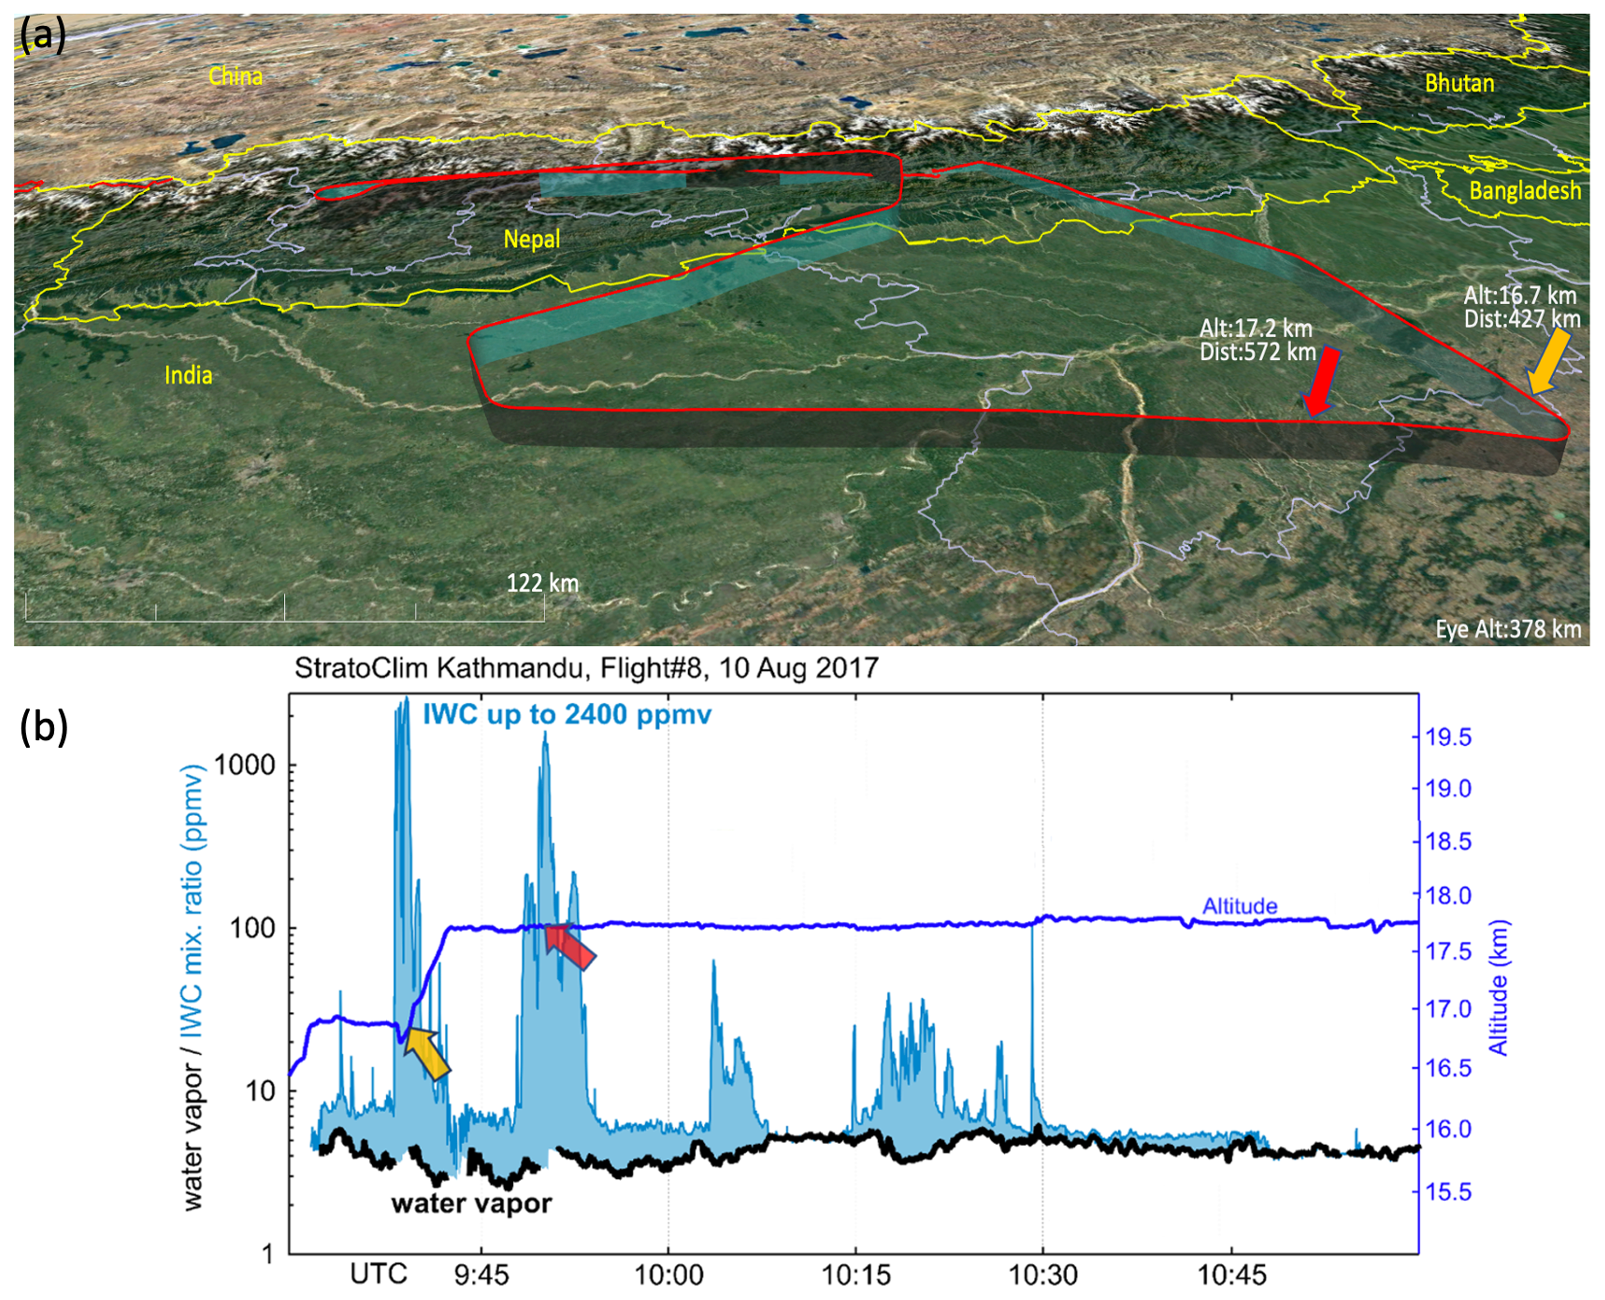
Figure 1(a) Trajectory of Flight 8 and (b) the corresponding time series of water vapor (black), ice water content (light blue), and altitude (dark blue). Yellow and red arrows in both panels indicate the high ice water content's peak location (a) and timing (b). The corresponding altitude and distance from the point of origin are indicted near each arrow (a). The map was made using © Google Earth 2022.
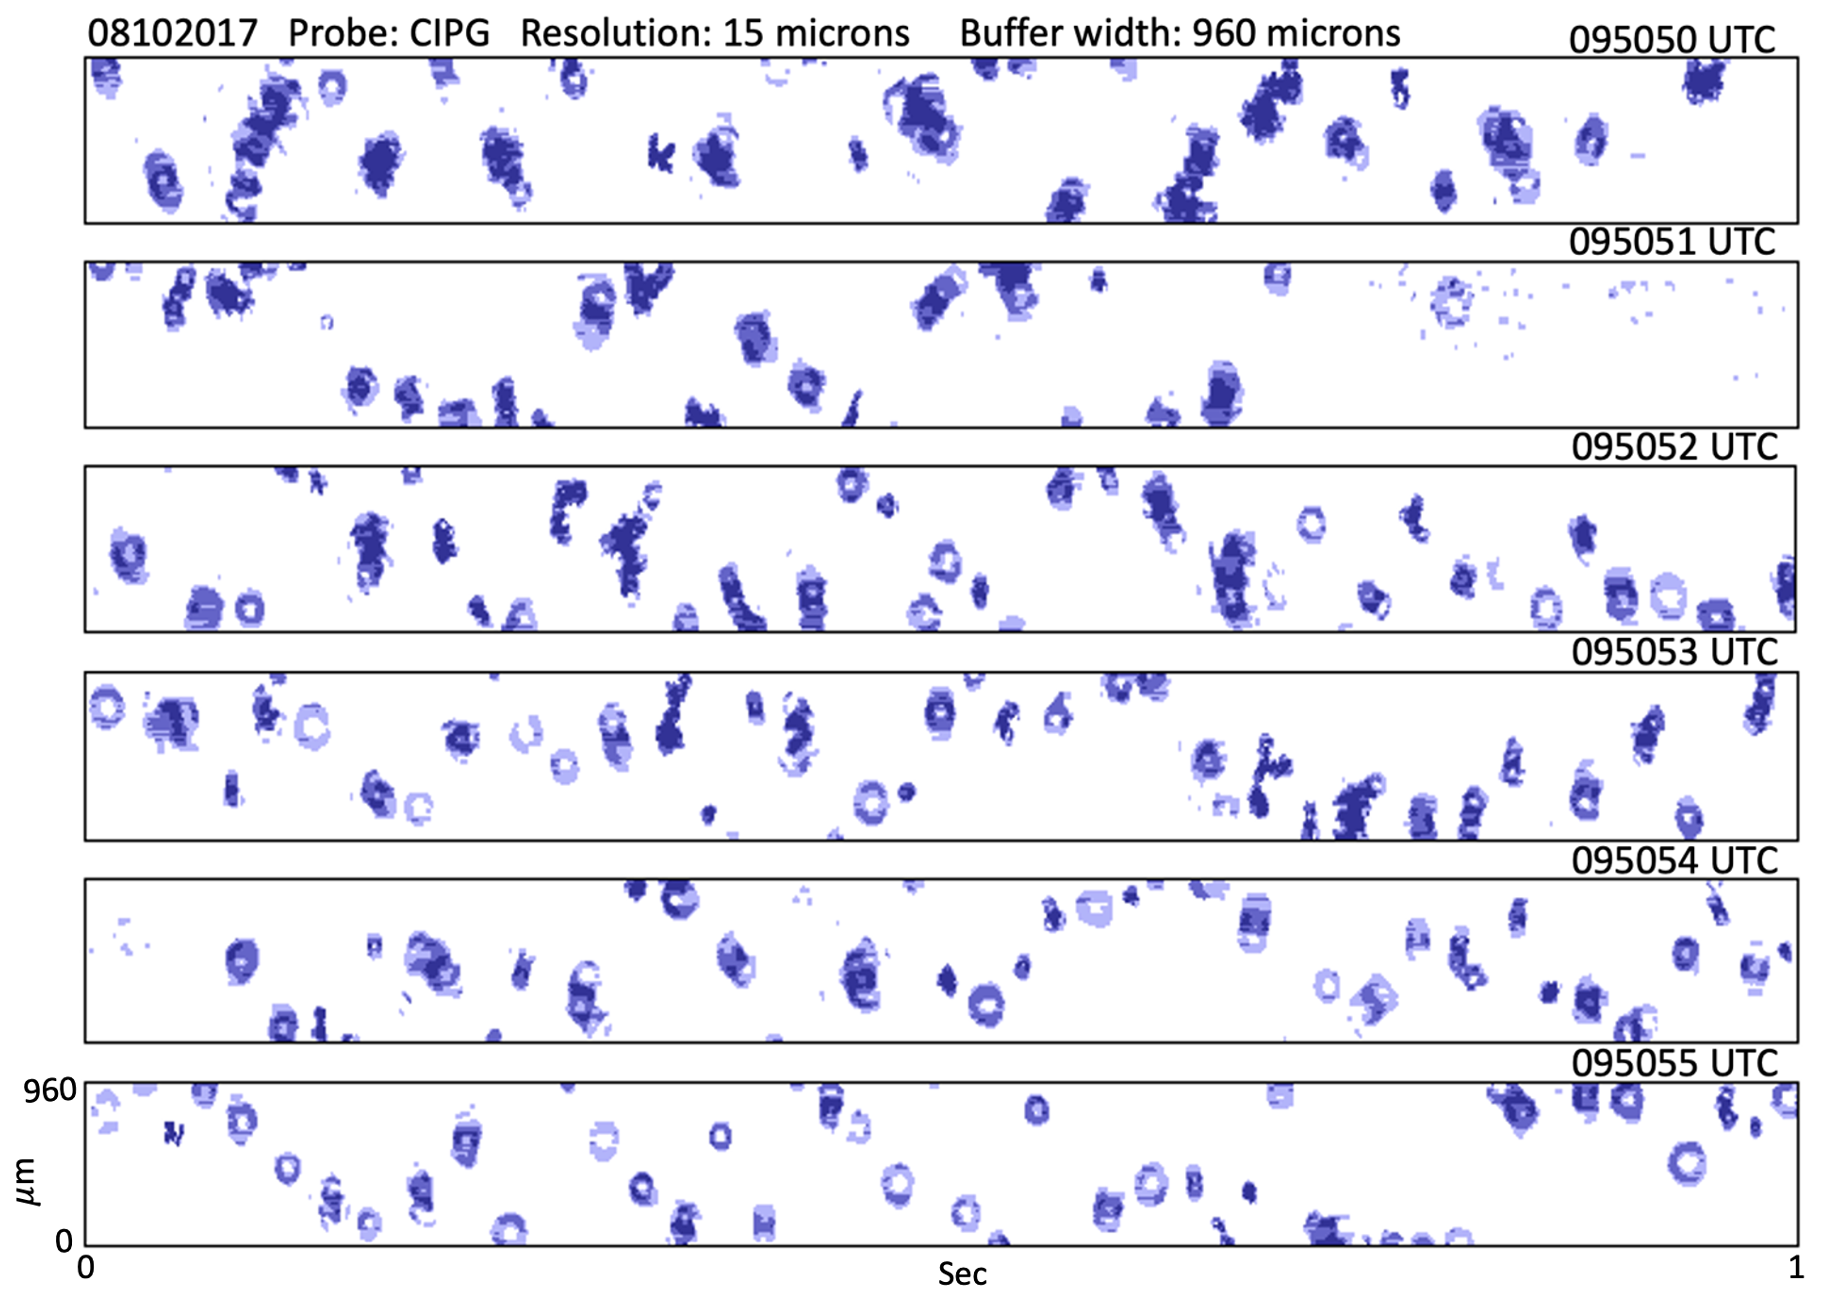
Figure 2Snapshots of ice particle images from the CIPg probe during Flight 8 (F8). Each slide has a height of 960 µm and length of 1 s.
Figure 1 shows the trajectory of F8 along the southern slopes of the Himalayas and the corresponding time series of water vapor, ice water content (IWC), and altitude. High ice water content (HIWC) peaks up to 2400 ppmv are indicated by yellow and red arrows at 09:40 and 9:50 UTC, respectively. In addition to HIWC, large aggregates of ice particles exceeding 700 µm in size and unusually long residence times are measured during F8. With the use of particle images NIXE-CIPg (Cloud Imaging Probe – grayscale), which is part of NIXE-CAPS, ice particles with diameters between 3 and 937 µm are sized and counted (Krämer et al., 2016; Costa et al., 2017). Evidence of these large aggregates is shown in Fig. 2 with six snapshots of ice particles from CIPg probe during F8. These crystals have a highly irregular structure due to the inherent randomness in their growth via the process of aggregation (e.g., Schmitt and Heymsfield, 2010).
3.1 Model setup
All three simulations of the same real case study associated with F8 were performed using Advanced Research version of the Weather Research and Forecasting Model (WRF-ARW) version 4.2, which is a nonhydrostatic, compressible model that uses a hybrid terrain-following coordinate system (Skamarock and Klemp, 2008; Powers et al., 2017). The simulations are configured with four one-way nested domains with 9, 3, 1, and 0.3 km horizontal grid spacings, respectively, encompassing the trajectory of F8 over India (Fig. 3). As our focus is on the TTL, the vertical level configuration has been optimized to achieve 100 m grid spacing for the TTL and high spatial resolutions near the surface and the boundary layer to appropriately simulate fluxes that trigger and sustain deep convection. The 173 vertical levels begin with a 50 m grid spacing near the surface, which gradually increases upward until the level of 6 km to reach a 250 m grid spacing that remains constant upward until the 10 km level. Following this, the grid spacing decreases from 250 m to reach 100 m in the layer between the levels of 13 and 19 km. Beyond that point, it increases again to gradually reach 900 m at model top of 30 km. A sponge layer is employed in the upper 5 km of all domains to damp out any reflection of waves and prevent their buildup below the model top. We apply spectral nudging for the outer domain D01 above the boundary layer to reduce the distortion of large-scale circulation (e.g., Miguez-Macho et al., 2004; Lamraoui et al., 2018). Due to the limitation of storage and computational resources, each of the simulations is a 12 h integration from 00:00 to 12:00 UTC on 10 August 2017 with a 5 min output frequency. For the analysis, we consider only the last 3 h, which corresponds to the time when the aircraft captured peaks of IWC and large ice aggregates. The simulations were driven using the fifth-generation European Centre for Medium-Range Weather Forecasts reanalysis (ERA5) fields (Hersbach et al., 2020).
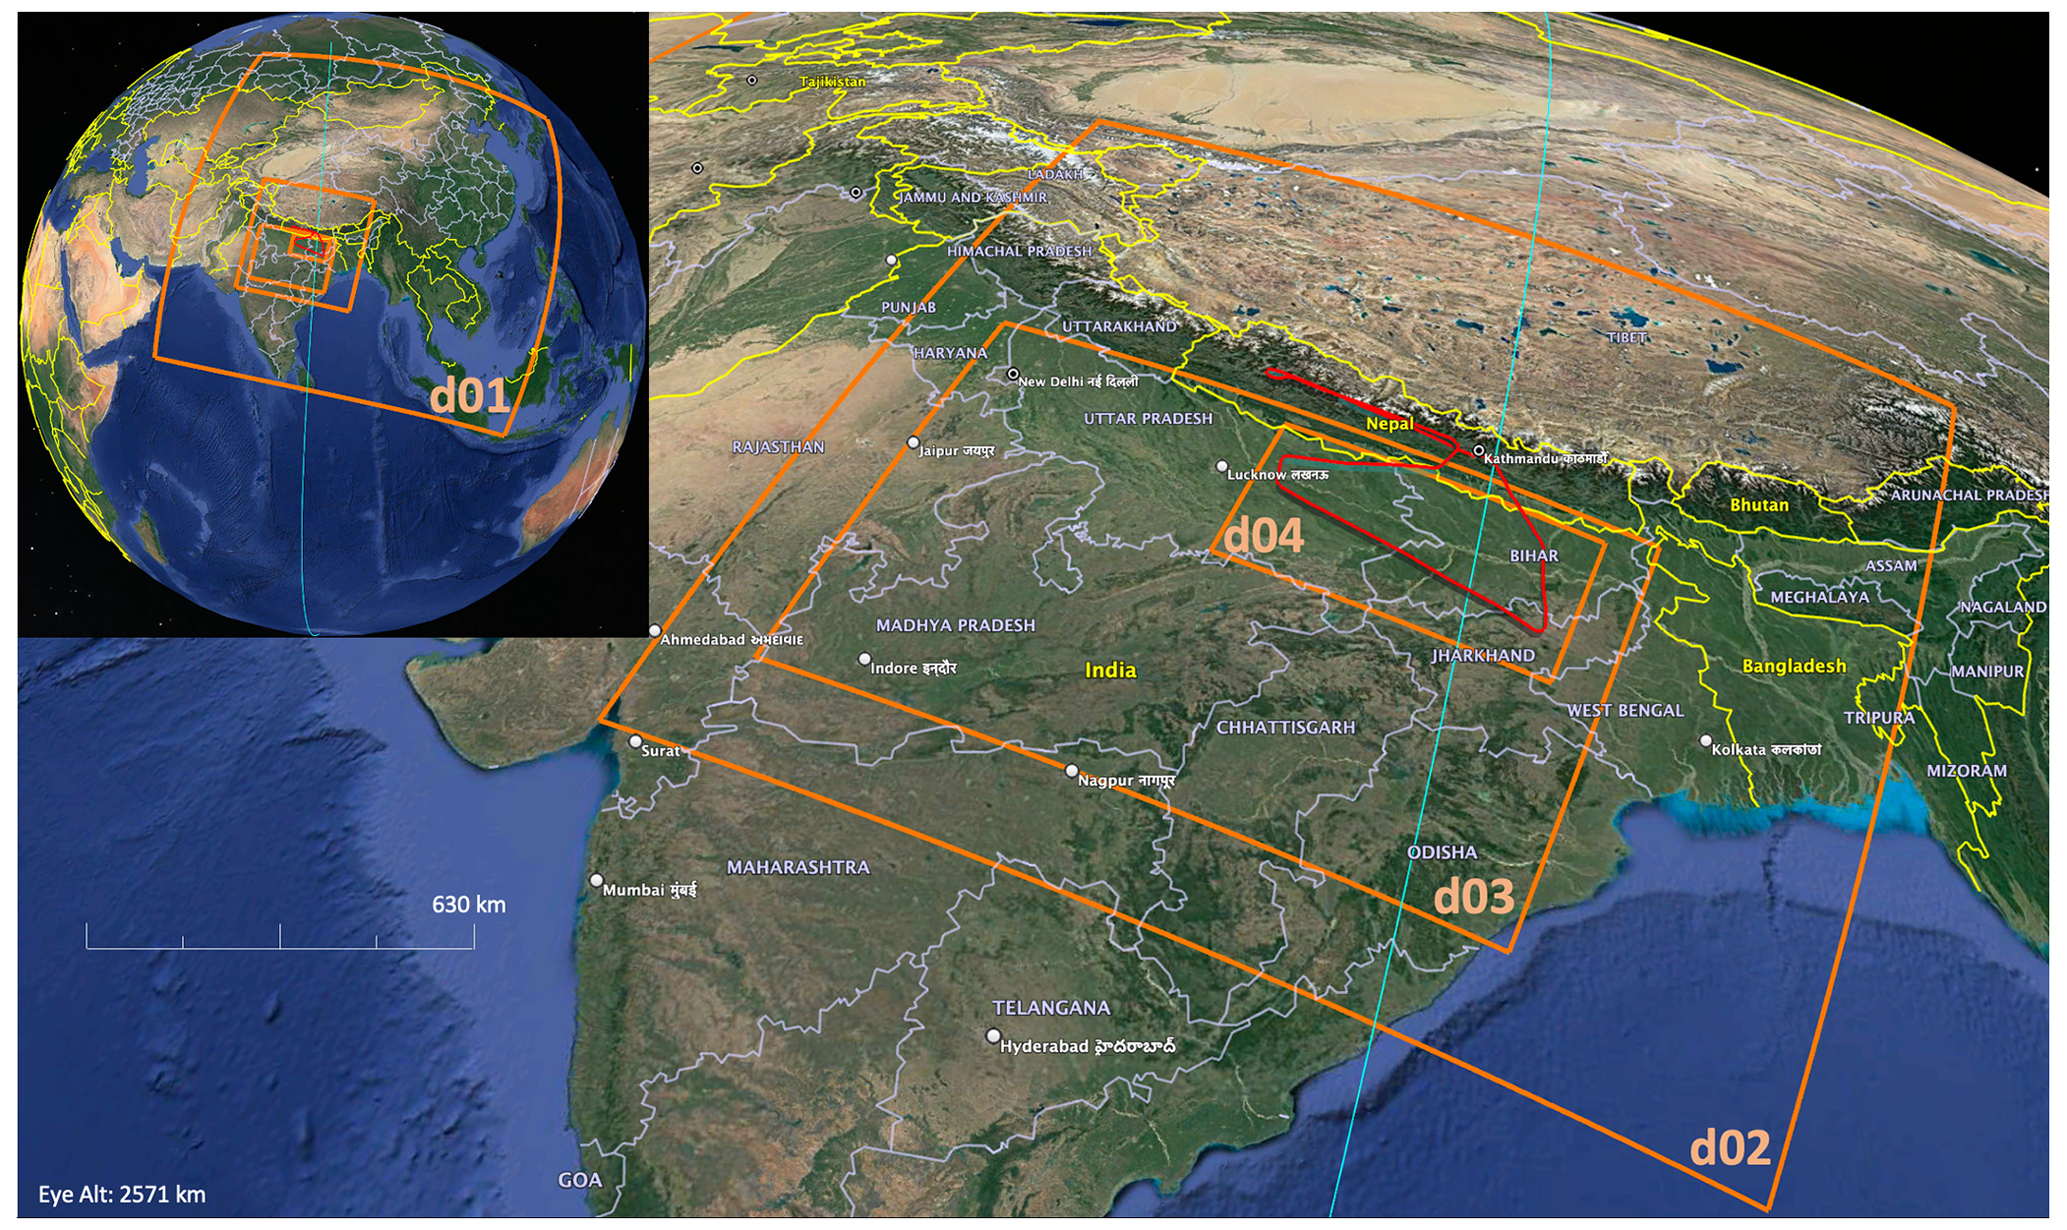
Figure 3The four WRF nested domains (orange), the Flight 8 trajectory (red), and the closest CALIPSO passage (cyan). The map was made using © Google Earth 2022.
Ideally, the WRF-ARW simulations could be compared to not only the StratoClim aircraft measurements but also to concurrent satellite observations of cloud properties, such as those offered by the CloudSat (Stephens et al., 2002) and CALIPSO (Winker et al., 2009) satellites. While CloudSat and CALIPSO did pass over the study region on the same day as StratoClim F8 (Fig. 3), they did so 9 h after F8. Because this time gap exceeds the convective and microphysical timescales relevant to our analysis, a comparison to CloudSat or CALIPSO retrievals would not be appropriate. While geostationary satellites offer measurements that are concurrent with F8 in both space and time, they cannot provide vertically resolved retrievals of cloud microphysical properties and would therefore be of little utility here. We thus focus solely on comparing the simulations to F8 and on the sensitivity of the simulations to the choice of microphysics scheme.
Except for the microphysics scheme option, the simulations are carried out using the same model configuration, which includes the Rapid Radiative Transfer Model for general circulation models (RRTMG; Iacono et al., 2008) for longwave and shortwave radiation, the Eta Similarity Scheme (Janjic, 2002) for the surface layer, the Unified Noah Land Surface Model (Tewari et al., 2004) for land surface physics, and the Shin–Hong Scale-aware Scheme (Shin and Hong, 2015) for the planetary boundary layer (PBL). The New Tiedtke Scheme (Zhang and Wang, 2017) for the convection parameterization is enabled only with the outer domain.
3.2 Model microphysics
We investigate the sensitivity of simulated TTL cirrus clouds to ice morphology and also to microphysical parameterizations with predefined and non-predefined frozen hydrometeor categories. For this reason, we use the following three bulk microphysics schemes (BMSs): the aerosol-aware Thompson scheme (Thompson and Eidhammer, 2014), the predicted particle properties (P3) scheme (Morrison et al., 2015; Milbrandt and Morrison, 2016), and the Jensen Ice-Spheroids Habit Model with Aspect-Ratio Evolution (ISHMAEL) Scheme (Jensen et al., 2017). Size distributions of hydrometeors in BMSs are assumed to be a generalized gamma function. The Thompson and P3 schemes use simple tunable power laws to relate mass and fall speed to the size of each hydrometeor. Schemes with a free-category approach of frozen hydrometeors, such as P3 and Jensen, are advantageous over classical multi-category schemes (e.g., Chen and Tsai, 2016; Thompson and Eidhammer, 2014; Morrison et al., 2009; Milbrandt and Yau, 2005) that require arbitrary and artificial conversion between categories (e.g., Milbrandt et al., 2021), which relies on ad hoc tunable parameters that cannot be directly measured. The Thompson scheme is quasi-two-moment scheme that predicts the mass mixing ratios of cloud water, rain, cloud ice, snow, and graupel, as well as the number concentrations of cloud ice and rain. Artificial transitions between predefined ice categories and the corresponding ad hoc conversion parameters can systematically bias the model output (Morrison and Grabowski, 2008; Lin and Colle, 2009). In addition to mass and number concentration, P3 predicts several other bulk physical ice properties, such as rime mass, rime density, and mean dimension. In P3, the changes in riming state and rime density are transitional, but the growth of ice particle by vapor deposition remains constrained by mass–dimensional (m–D) and fall speed–dimensional (vt–D) relationships that are chosen a priori as in traditional schemes. With the use of m–D and vt–D relationships, it is assumed that all modeled ice particles evolve and sediment along the same trajectory in mass–size and fall speed–size spaces. These relationships do not capture the proper transitions in ice particle mass and fall speed that occur during riming (Jensen and Harrington, 2015). The ISHMAEL scheme predicts the evolution of ice properties, including aspect ratio, mass mixing ratio, number concentration, size, and ice density. Ice particles are modeled as spheroids, and the nucleation temperature controls the number of nucleated species. The evolution of ice shape during vapor growth is verified against wind tunnel data (Jensen and Harrington, 2015). Unlike the other two schemes, this scheme simulates measured habit-dependent riming (e.g., Fukuta and Takahashi, 1999) and its effect on fall speed. The evolution of ice shape from non-rimed to lightly rimed and then to densely rimed is modeled without converting ice mass between predefined ice categories. The shape of the ice particles is controlled by the riming rate, resulting in a reduced vapor growth rate and an increased riming rate compared with traditional BMSs (Jensen and Harrington, 2015). Light riming can expand the minor axis of ice crystals or fill in gaps in their shapes, leading to increased density and fall speed without affecting maximum dimension. The simulated ice habit is determined based on the growth rate, which mainly depends on the capacitance and ventilation coefficient (e.g., Liu et., 2003a). This realistic process conflicts with the widely used m–D and vt–D relationships.
4.1 Convective activity and HIWC at the TTL
Observations have indicated strong convective activity and aircraft-captured peaks of HIWC detrained at the TTL level (Khaykin et al., 2022). We therefore opt for two sanity checks. First, we want to ensure that the model can reproduce the observed convective activity. For this reason, the simulated outgoing longwave radiation (OLR) corresponding to the time of the first HIWC peak measured at 09:40 UTC is shown in Fig. 5. Multiple cells of very low OLR are simulated reflecting strong convective activity. Second, the aircraft was at an approximately constant level of 17 km when the HIWC values were detected. The corresponding IWC profile is used to provide evidence of HIWC plumes in the TTL. Therefore, we use IWC from ERA5 reanalysis within the inner domain encompassing the trajectory of F8. The 99th percentile is used to present HIWC, which refers the top 1 % of simulated or observed IWC values. The 99th percentile of IWC and domain-mean temperature profiles are shown in Fig. 6. Although the ERA5 HIWC is about an order of magnitude lower than the measurements (Fig. 6), it identifies the presence of a HIWC plume at ∼ 125 hPa in the TTL. The profile of domain-mean temperature shown in Fig. 6 indicates a CPT of 192 K at the pressure level of 100 hPa, which is about 5 K warmer than the measured value.
4.2 Sensitivity of simulated microphysical properties to model configuration
In this section, we aim to test the ability of the model to reproduce the microphysical properties observed during F8, including HIWC peaks, ice number concentrations, and large ice particle aggregates. To examine the sensitivity of simulated HIWC to changes in model grid spacing and microphysical parameterizations, we performed a set of simulations configured with four nested domains and three microphysics schemes. All simulations share the same high vertical spatial resolution of 100 m in the TTL (Fig. 4). HIWC in the upper troposphere and TTL, shown in Figs. 7, 8, and 9, indicates sensitivity to grid spacing that varies between schemes. In response to overshooting deep convection, the simulated HIWC profiles shown in these figures reveal a gradual increase over 9 h.
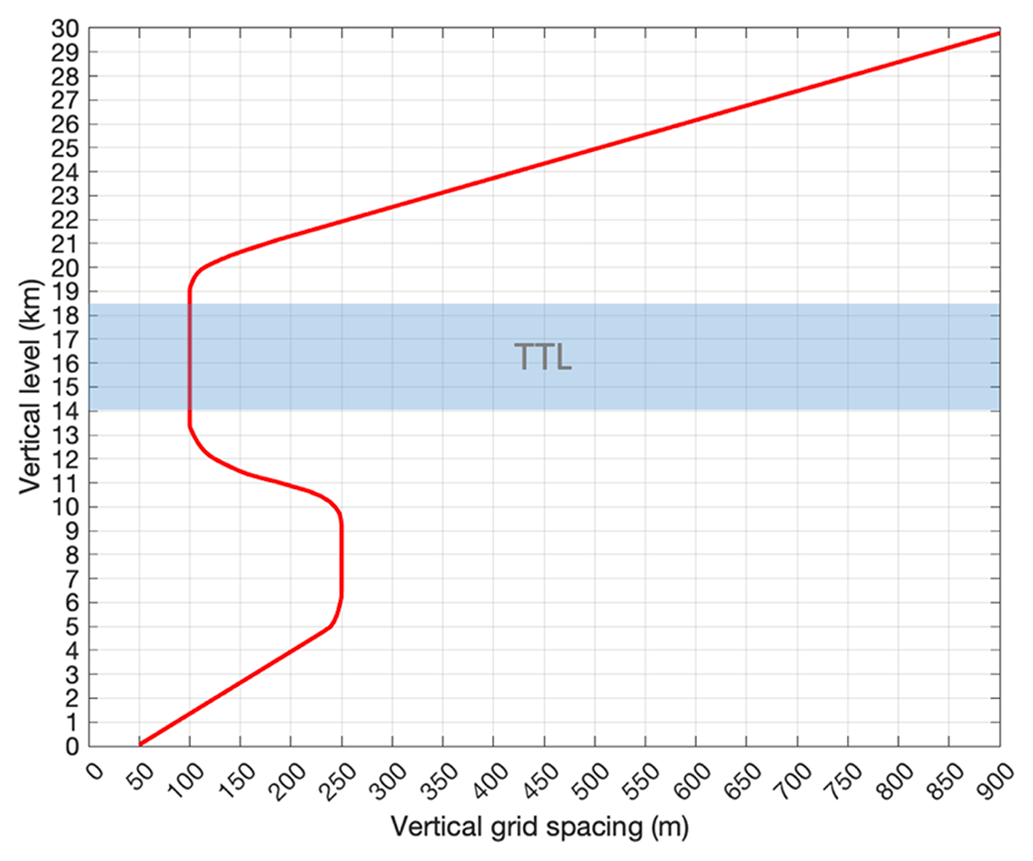
Figure 4Vertical resolution as a function of model vertical level. The shaded blue area represents the TTL.
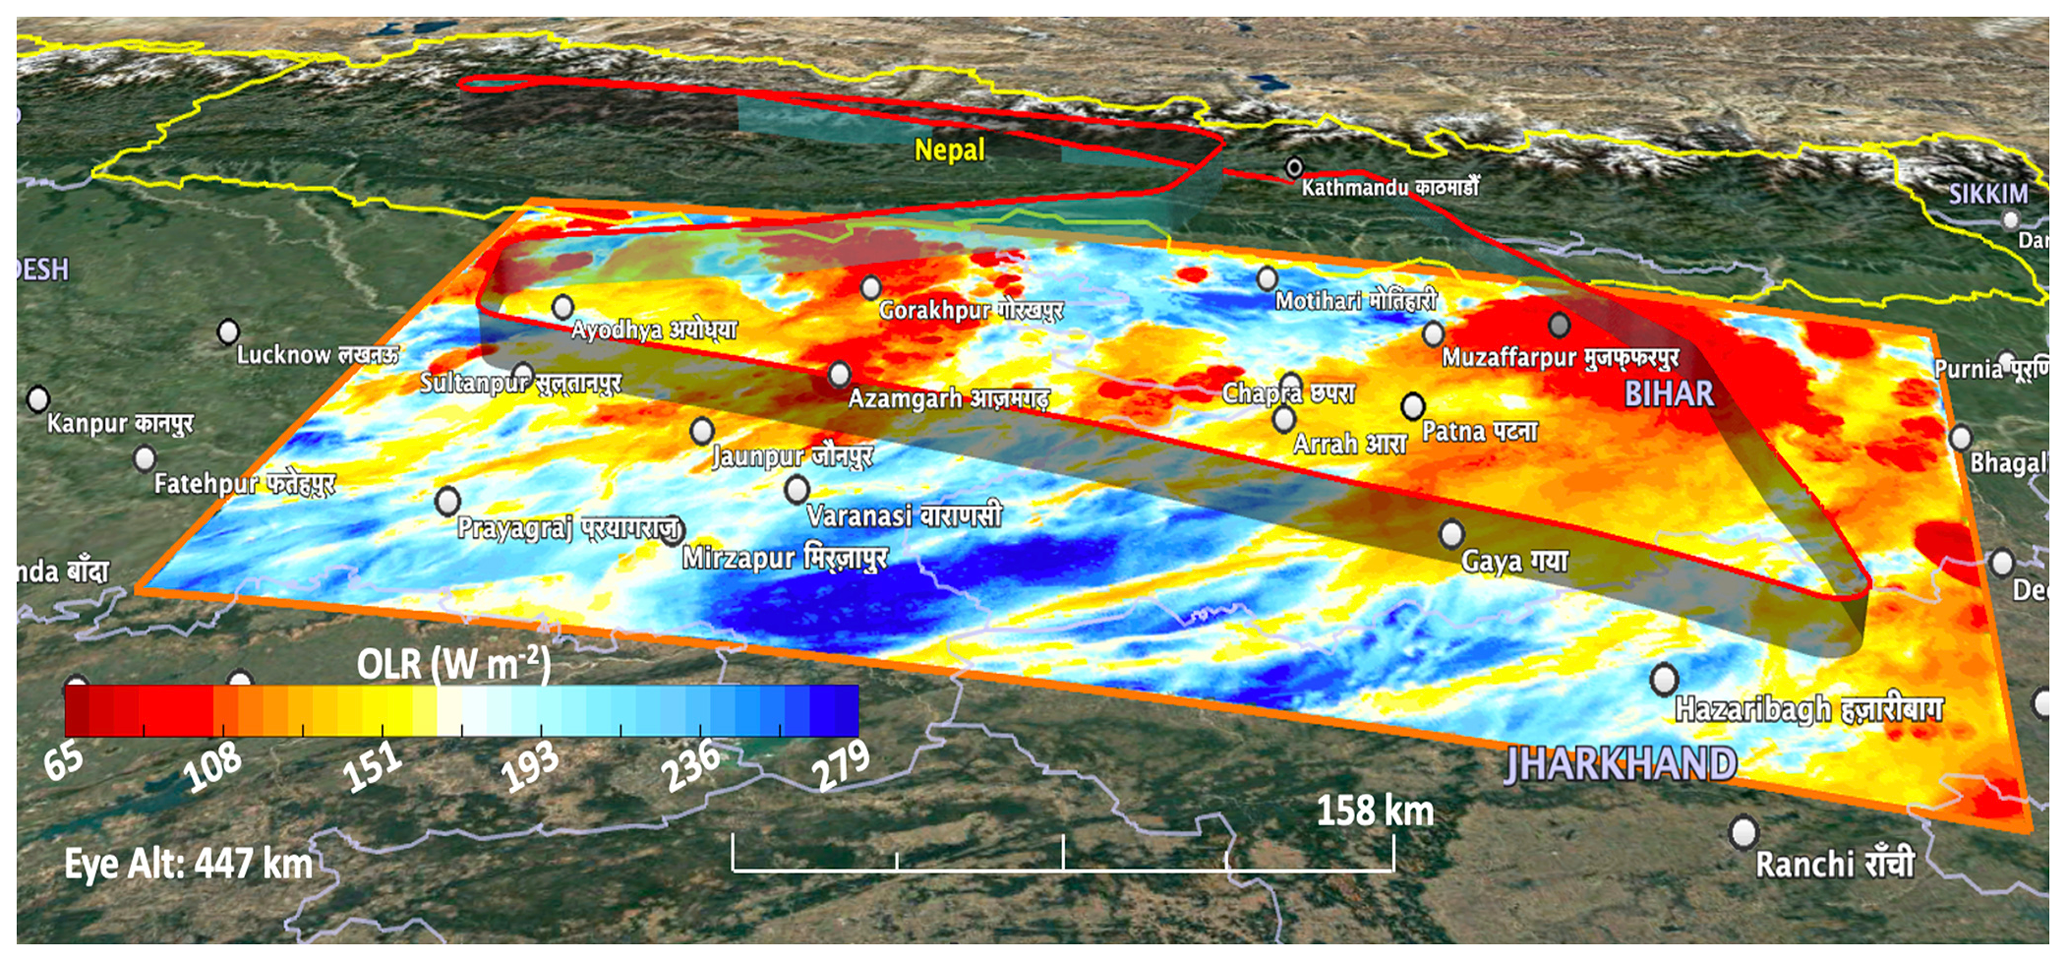
Figure 5High-resolution (0.3 km) simulated OLR at 10:00 UTC on 10 August 2017. The map was made using © Google Earth 2022.
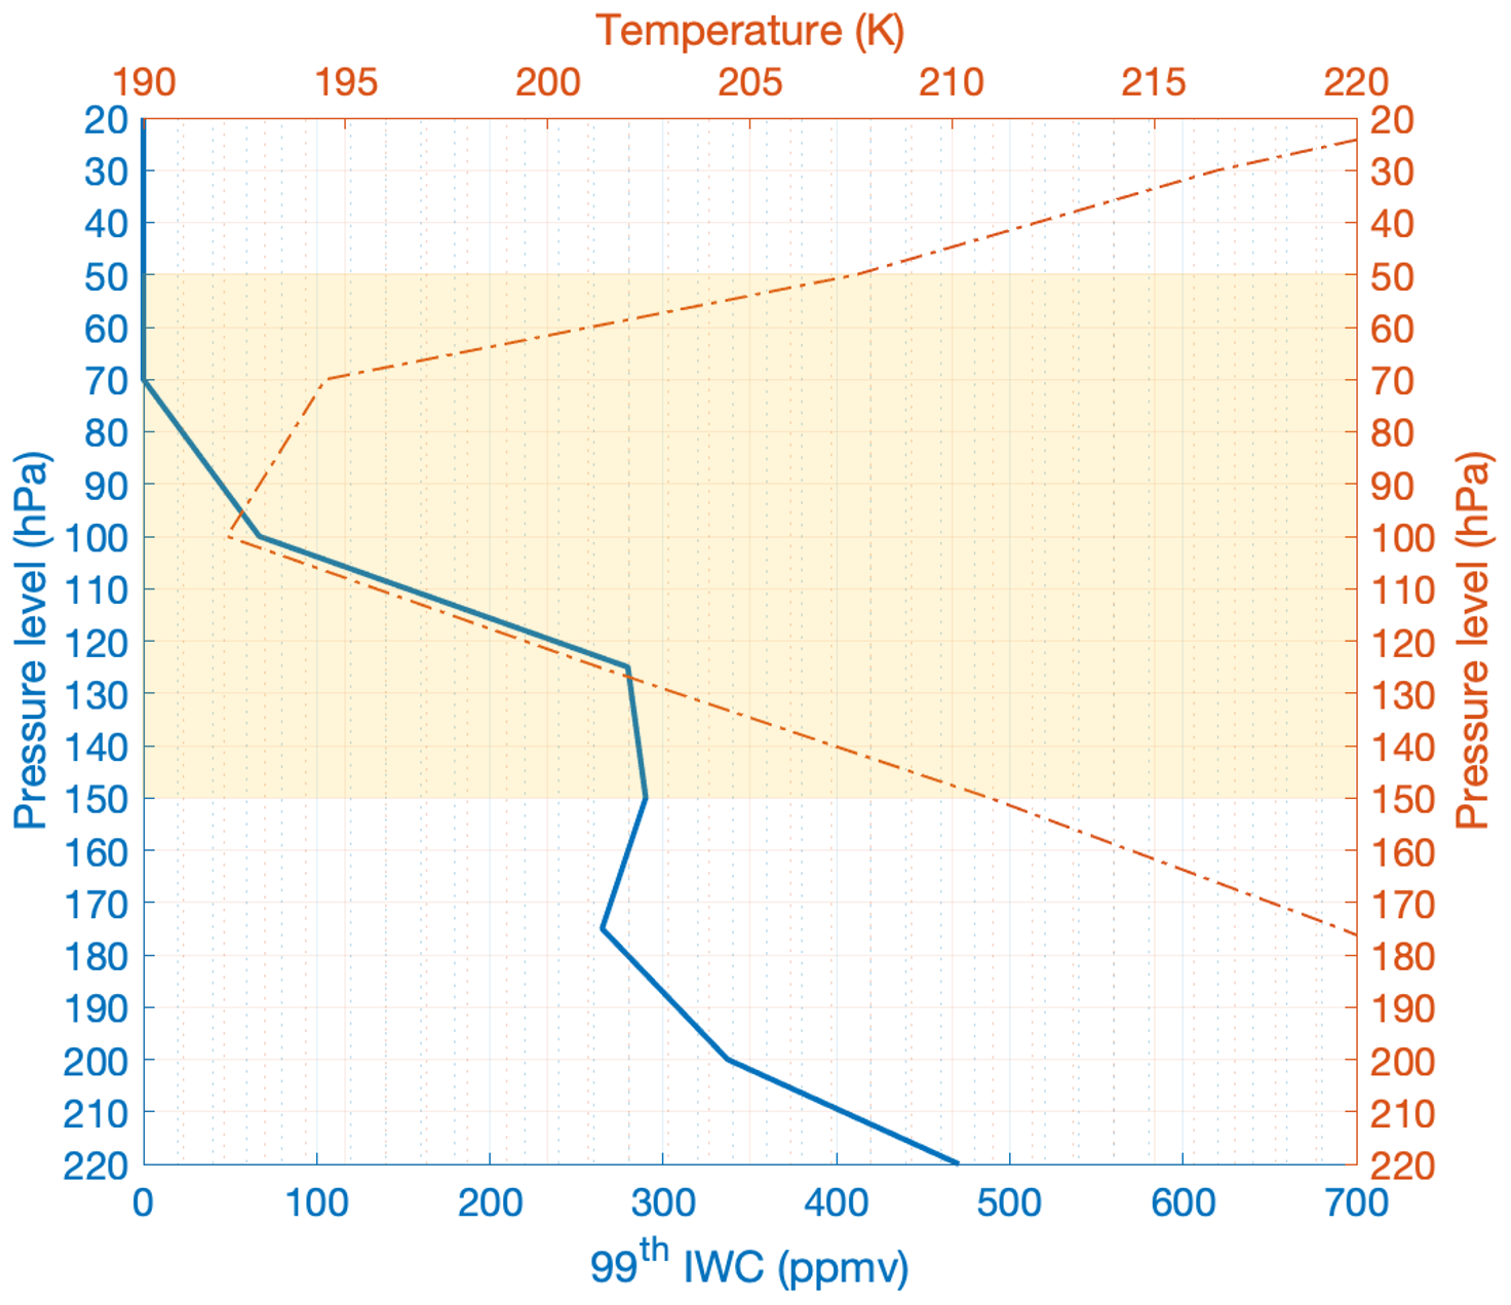
Figure 6Profiles below and within the TTL (yellow shade) in the inner-domain D4 from ERA5 99th percentile of ice water content (solid blue line) and domain-mean temperature (dashed–dotted red line) at 10:00 UTC on 10 August 2017.

Figure 7Profile of 99th percentile of simulated IWC below and within the TTL (cyan shared area) using grid spacing of 0.3 km and three microphysics schemes, i.e., (a) ISHMAEL, (b) P3, and (c) Thompson (TOM), color coded by time (UTC) from 02:00 to 11:00 UTC. The dashed–dotted black line represents the simulated profile at 09:40 UTC (timing of the first captured peak of IWC by aircraft). The red double arrow represents the observed value at the corresponding observation level.
Despite the high spatial resolution in the TTL, the Thompson scheme (Fig. 7) simulates a detrained HIWC in the TTL at ∼ 09:00 UTC but with significant underestimation of more than an order of magnitude relative to the HIWC captured by aircraft at 09:40 UTC (Fig. 1) and even that of ERA5 (Fig. 6).
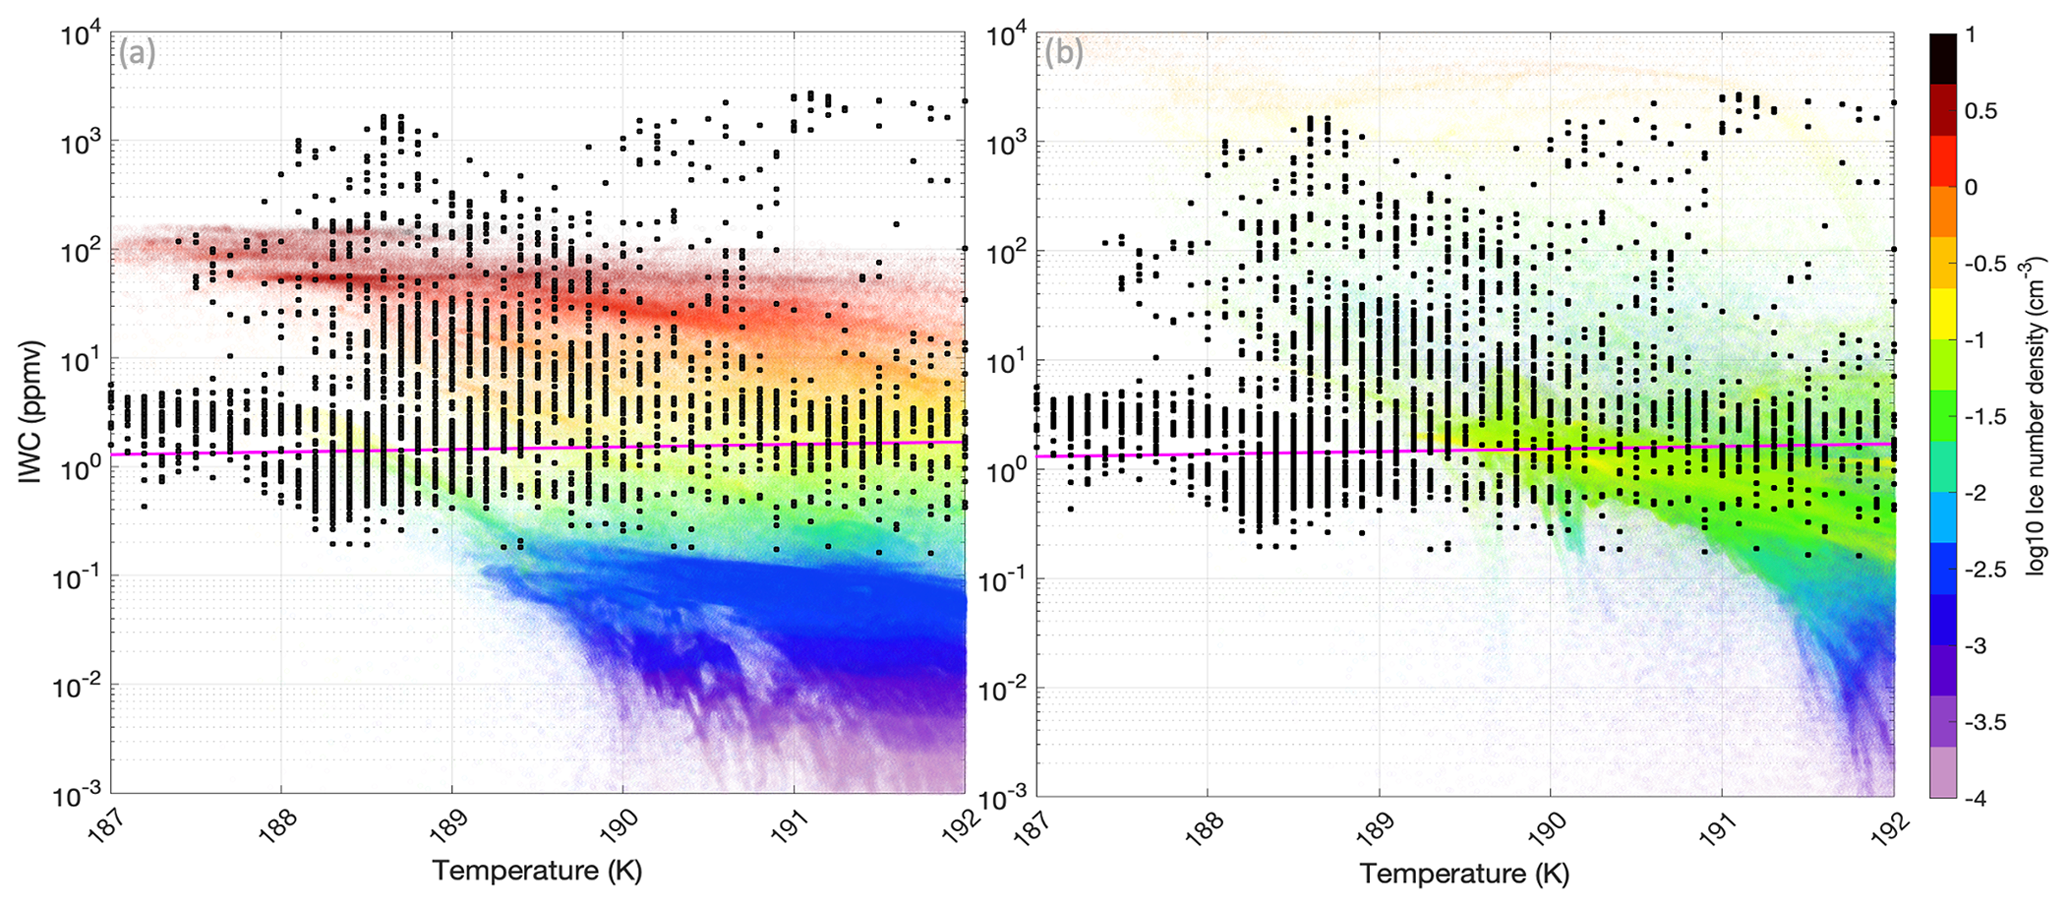
Figure 8Simulated (shaded) and observed (black dots) IWC versus temperature color coded by the log10 of ice number concentration at 17 km and for Dice > 3 µm using the (a) Thompson scheme and (b) P3 scheme.
For the P3 scheme (Fig. 8), the IWC profiles show no significant change between the 9 and 3 km grid spacings. On the other hand, with 1 and 0.3 km grid spacings the difference becomes significant, especially regarding the accelerated increase in the TTL, which is higher in the inner domain. This scheme simulates very high IWC peaks between 08:00 and 10:00 UTC that exceed 3000 ppmv, which is overestimated compared to the measured IWC peak of 2400 ppmv at 09:40 UTC.

Figure 9Simulated (shaded) and observed (black dots) IWC versus temperature color coded by the log10 of ice number concentration at 17 km and Dice > 3 µm using the ISHMAEL scheme from three ice habits: (a) planar, (b) columnar, and (c) aggregate.
The ISHMAEL scheme (Fig. 9) shows improvement in terms of simulated IWC with 1 km grid spacing (like P3) but with less accelerated increase in the TTL. What is unique about the ISHMAEL scheme in this simulation in contrast with the other two schemes is that it can approximately reproduce the IWC peak that is observed during F8 at the same time ∼ 09:40 UTC. No overestimation of HIWC is simulated before ∼ 09:40 UTC or after ∼ 10:00 UTC.
The temporal evolution of the storm is well captured by the model, and the simulation reproduces strong deep-convection cells (Fig. 5) in the domain D4 that are comparable to those observed during the field campaign at the same time. Therefore, for the comparison with F8, we use the simulation data of the entire inner domain D4, which encompasses most of the F8 trajectory.
Following Krämer et al. (2016, 2020), we examine the measured and simulated microphysical properties of cirrus clouds in the TTL using the ice water content–temperature (IWC–T) parameter space (Figs. 8, 9) and ice particle sizes larger than 3 µm. The IWC–T figures enable distinguishing the cirrus clouds with a in situ origin from those with a liquid origin. These two types of cirrus clouds are roughly separated by the median IWC (purple line, Schiller et al., 2008) in Figs. 8 and 9. Above the purple line, the ice particles are of liquid origin and strongly ventilated upwards by deep convection. Below this line, ice particles are associated with weak updrafts and represent mostly in situ cirrus clouds that likely originate from heterogeneous nucleation (or homogeneous nucleation, which is less likely) (Krämer et al., 2016; Cziczo et al., 2013; Jensen et al., 2013). Comparison between the simulation and the observation in Figs. 8 and 9 reveals that most of measured ice particles are of liquid origin with only a small amount in the in situ range. In situ simulated cirrus clouds in all schemes (Figs. 8, 9) are associated with low values of IWC and number concentration, which makes them less influential in regulating HIWC. These two figures support the results shown in Figs. 7, 8, and 9 that show that the ISHMAEL, P3, and Thompson schemes yield reasonable, overestimated, and underestimated values of HIWC, respectively.
For all schemes, higher ice number concentrations are associated with ice particles of liquid origin and strong updrafts. Higher values of IWC are mostly in the lower temperature range. In the temperature range between 187 and 192 K shown in Figs. 8 and 9, the ice number concentration is correlated with IWC, as discussed by Krämer et al. (2020, their Fig. 6). The simulated ice number concentration has a reasonable upper limit of about 10 cm−1, which is comparable to observations (Fig. 10). The measurements indicate lower temperatures reaching 187 K, which is not the case for the simulations (particularly the ISHMAEL and P3 schemes). Only the Thompson and P3 schemes indicate events at T < 188 K, which can be explained by the simulated CPT levels and relative humidity with respect to ice. The Thompson and P3 schemes overestimate the CPT level (Fig. 12), allowing more simulated ice particles to reach higher and colder levels (T < 188). Both schemes have lower supersaturation with respect to ice compared to the ISHMAEL scheme. This lower supersaturation slows the growth of ice particles and prevents them from reaching the sedimentation threshold, thus allowing ice particles to reach higher and colder levels. The ISHMAEL scheme simulates a lower CPT level and higher supersaturation with respect to ice. This leads to accelerated growth rates, more sedimentation, and cold trap at lower levels. The aircraft cruising level corresponds approximately to the observed CPT level.
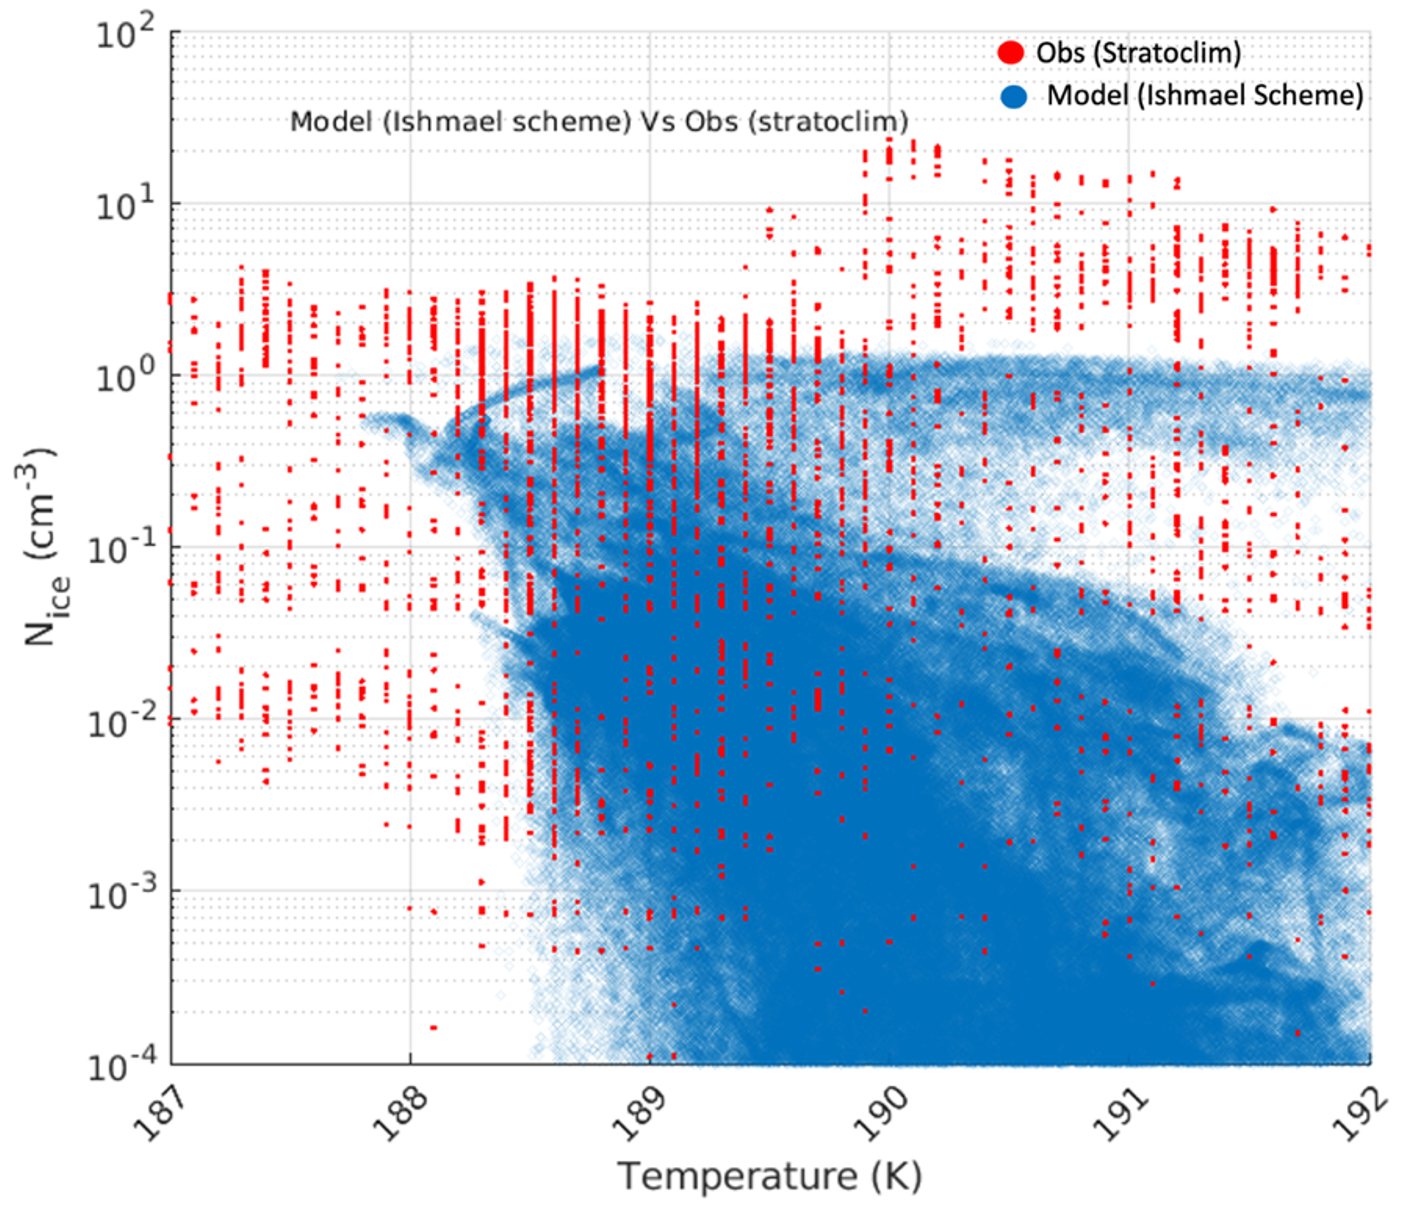
Figure 10Simulated (blue) and observed (red dots) Nice versus temperature at 17 km using the ISHMAEL scheme.
The results with the ISHMAEL scheme shown in Fig. 9 reveal that the ice particles of liquid origin that contribute substantially to HIWC are of planar shape. Columnar and aggregate habits are mostly in the in situ range with very low IWC and number concentration values.
In addition, planar ice particles have the highest number concentration among the three habits, especially at lower temperatures (Fig. 9a). For all habits involved in this study, the number concentration increases with decreasing temperature (Figs. 9 and 10), which corroborates previous studies (e.g., Gryspeerdt et al., 2018; Sourdeval et al., 2018).
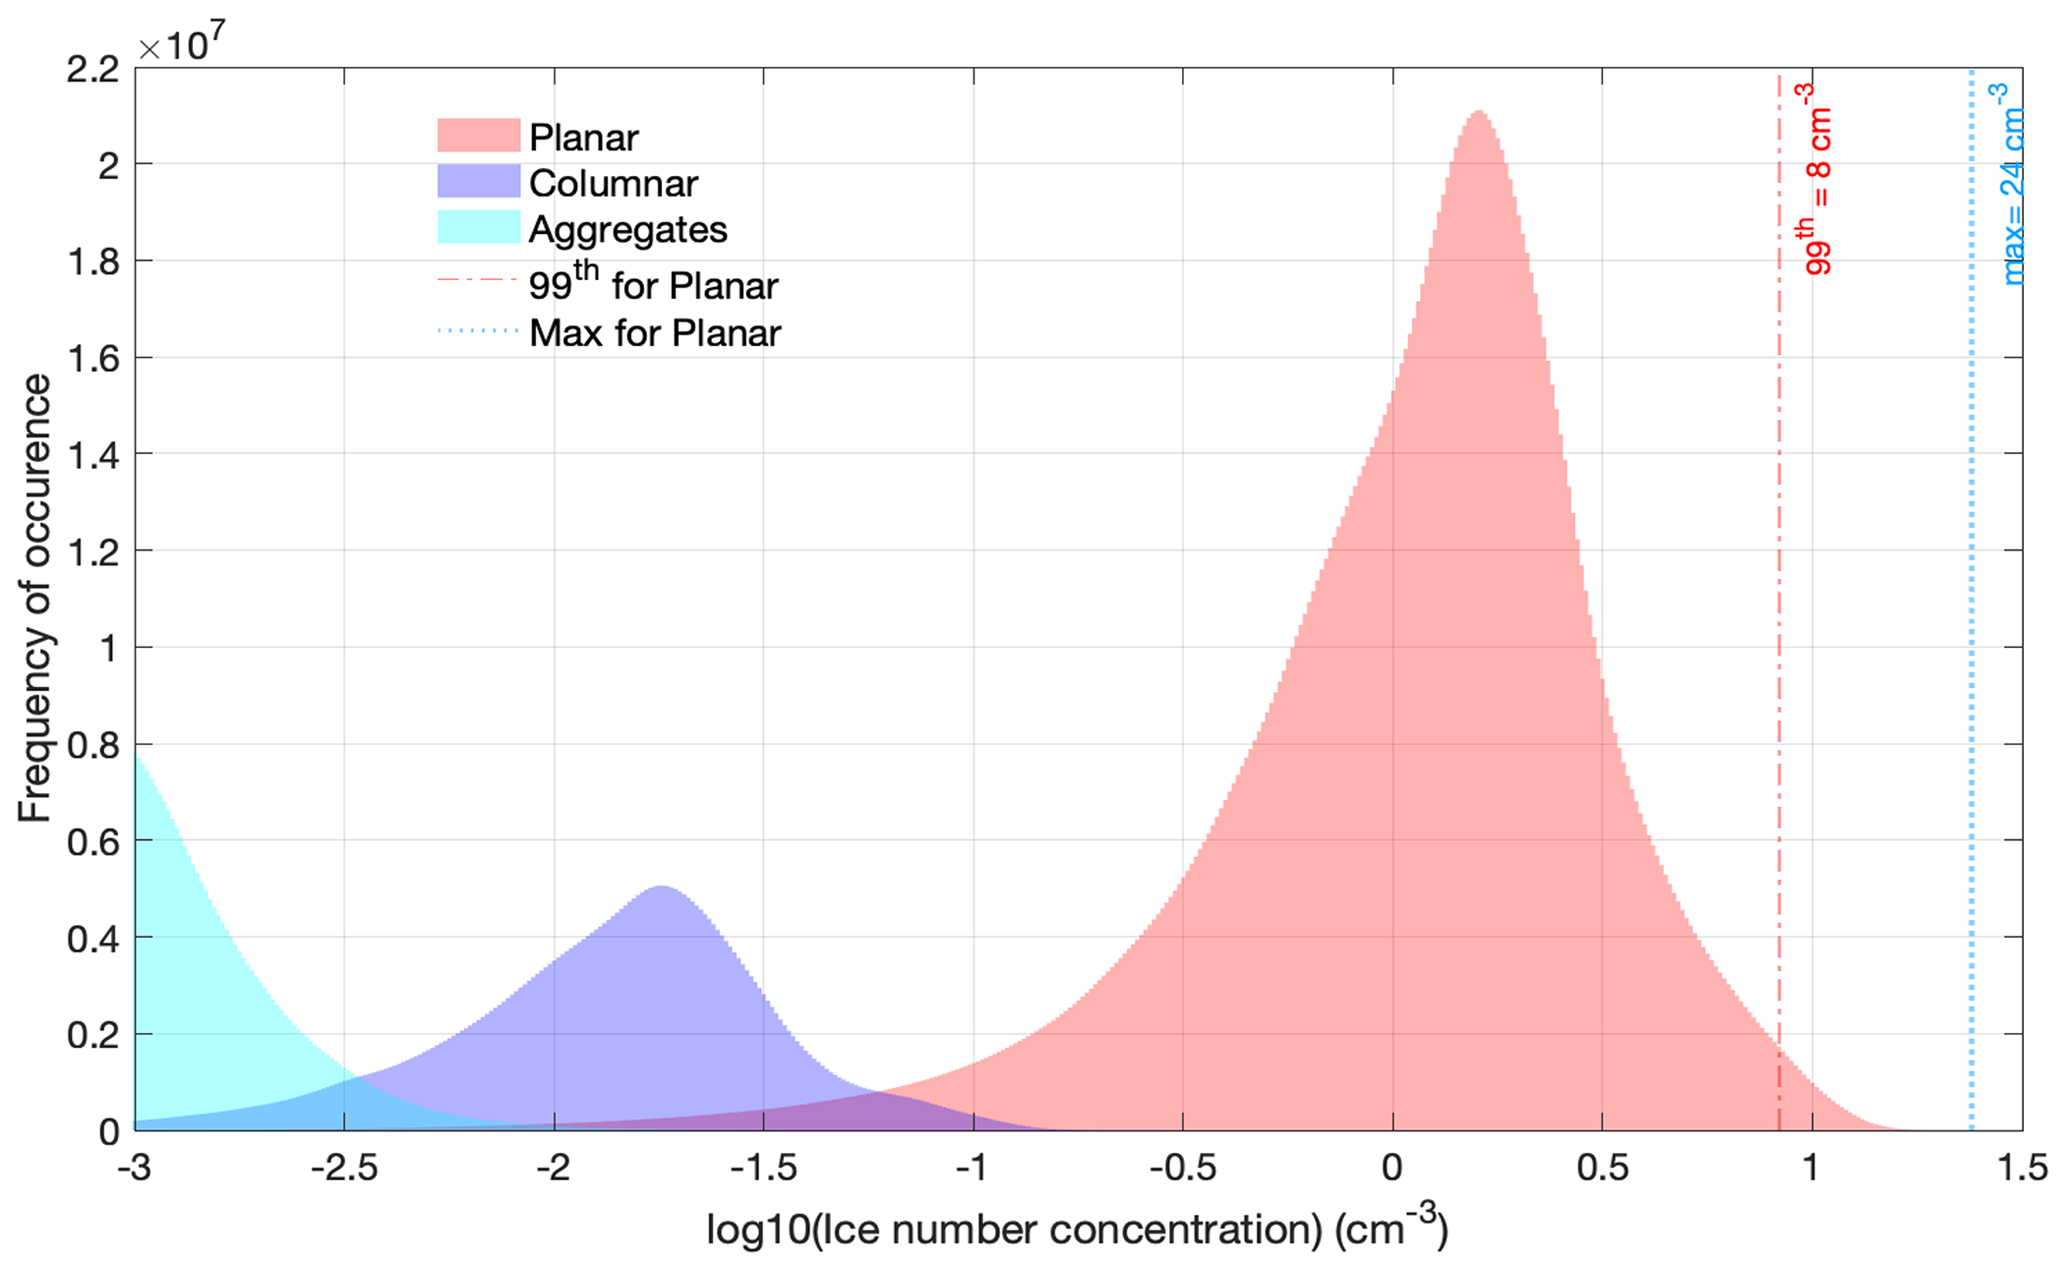
Figure 11Distribution of ice number concentration on a log10 scale using the ISHMAEL scheme for different ice habits: planar (red), columnar (blue), and aggregate (gray).
In addition, the distribution of ice number concentration shown in Fig. 11 exhibits a large spread across ice habits that can reach 4 orders of magnitude. The planar habit takes the lead in terms of high ice number concentration with a 99th percentile of 8 cm−3, followed by the columnar habit, and finally the aggregate habit with the lowest number concentration. As expected, aggregate habits are much less frequent than other habits (e.g., Lawson et al., 2006).

Figure 12Relative humidity with respect to ice versus potential temperature in clouds and outside clouds from observations (red and green) and simulations (gray and blue) using the ISHMAEL (a), P3 (b), and Thompson (c) schemes. The vertical dashed orange line represents the level of cold point temperature (CPT).
In the comparison illustrated in Fig. 12, we examine the relative humidity with respect to ice (RHi), which is a requisite environmental condition necessary for the nucleation and growth of ice crystals (Pruppacher and Klett, 2010; Heymsfield and Miloshevich, 2003). In the TTL, the supersaturation with respect to ice can be reached through different processes such as moisture lifting by strong updrafts (Grabowski and Morrison, 2017) or temperature fluctuations due to gravity waves (Haag et al., 2003). In the inner domain, RHi saturation is mainly caused by moisture uplifting induced by deep convection. This comparison demonstrates that the CPTs from the P3 and Thompson schemes are at potential temperature levels of 380 K and above. On the other hand, the ISHMAEL scheme produces a CPT at the level of 375 K, which is closer to the observed levels of ∼ 371 and 379 K at 09:40 and 09:50 UTC, respectively.
Figure 12 shows that the ISHMAEL scheme produces larger differences between the RHi inside and outside the clouds than the other two schemes around the CPT. Furthermore, ISHMAEL indicates very high values of RHi around CPT, which favors in situ and homogeneous nucleation. Unfortunately, the observation does not provide enough data outside clouds for an adequate comparison with the simulations at and around the CPT level. According to previous laboratory studies (e.g., Bailey and Hallett, 2009), RHi can reach high values of ∼ 160 % at very low temperatures. High RHi values of ∼ 200 % at the tropopause level were also reported in previous field campaign studies (Krämer et al., 2020; Dekoutsidis et al., 2022) but with a very low frequency of occurrence of ∼ 2 %. Simulations overestimate RHi, especially the ISHMAEL scheme. A possible explanation for the existence of such high supersaturations is the low ice number concentration, which is mainly present at low temperatures (Fig. 10). Previous studies (e.g., Jensen et al., 2013) have also indicated that increasing the number of ice crystals leads to decrease in RHi until reaching the saturation. The Thompson and P3 schemes produce smaller ice particles compared to ISHMAEL (Fig. 13) and high ice number concentration (Fig. 8). For this reason, the ISHMAEL scheme produces a higher RHi (Fig. 12). With high RHi and lower temperatures, more in situ nucleation, a faster growth rate of crystals, and larger ice particles are expected. The comparison between the three habits shown in Fig. 11 indicates that large aggregates are mainly associated with low number concentrations, which demonstrates the correlation between aggregates and high supersaturation (Jensen et al., 2013). RHi values of 120 % and 140 % can be considered approximate thresholds for heterogeneous and homogeneous ice nucleation, respectively (e.g., Koop et al., 2000; Kärcher, 2012). Therefore, due to the high supersaturation with respect to ice, more homogeneous and in situ nucleation is associated with ISHMAEL scheme than the other two schemes.
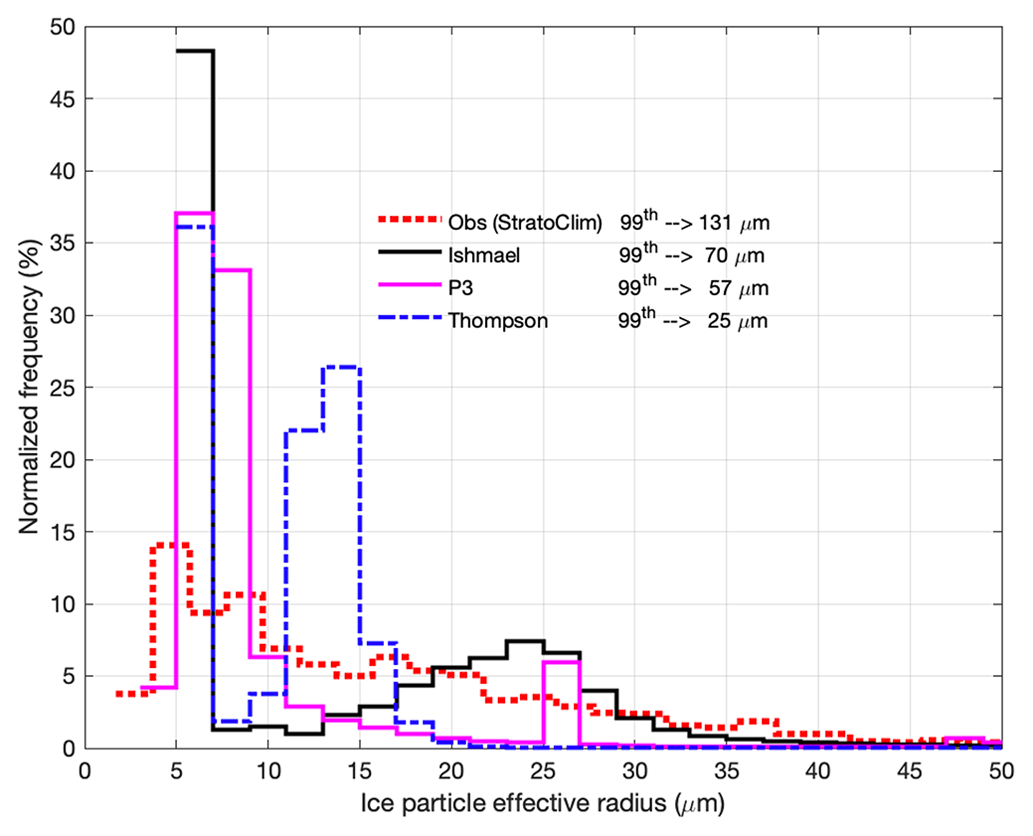
Figure 13Effective radius distribution at 17 km from observations (red) and simulations using the ISHMAEL (black), P3 (purple), and Thompson (blue) schemes.
4.3 Ice particle size distributions
In terms of ice particle sizes, Fig. 13 shows that all simulated effective radius distributions are within smaller size ranges of ice particles compared to the observations, in which the 99th percentile is 131 µm. The effective radii in every grid box are considered, and the histogram is then constructed from these values. The 99th percentiles of effective radii simulated using the ISHMAEL, P3, and Thompson schemes are 70, 57, and 25 µm, respectively. The ISHMAEL scheme produces a bimodal distribution with two peaks at about 5 and 25 µm that show the highest frequencies. For the smaller peak, this can be explained by the presence of freshly nucleated ice particles due to high RHi (Fig. 12) that are of in situ origin. For the larger peak it could be due to the rapid growth of existing particles that are of liquid origin before sedimentation (Fig. 9). The distributions of the Thompson and P3 schemes are shifted toward smaller sizes (especially for Thompson). It can be explained by the slightly warmer CPT (Fig. 12) compared to the other two schemes, which can limit ice crystal growth (Fig. 13) and IWC (Figs. 7 and 8). The distribution of P3 dominates the range of small sizes. In combination with a higher CPT level and lower RHi (Fig. 12), ice particles are more likely to grow slowly, resulting in lower fall speeds, longer residence time, and higher IWC. This explains the overestimation of the simulated IWC using the P3 scheme shown in Fig. 8.
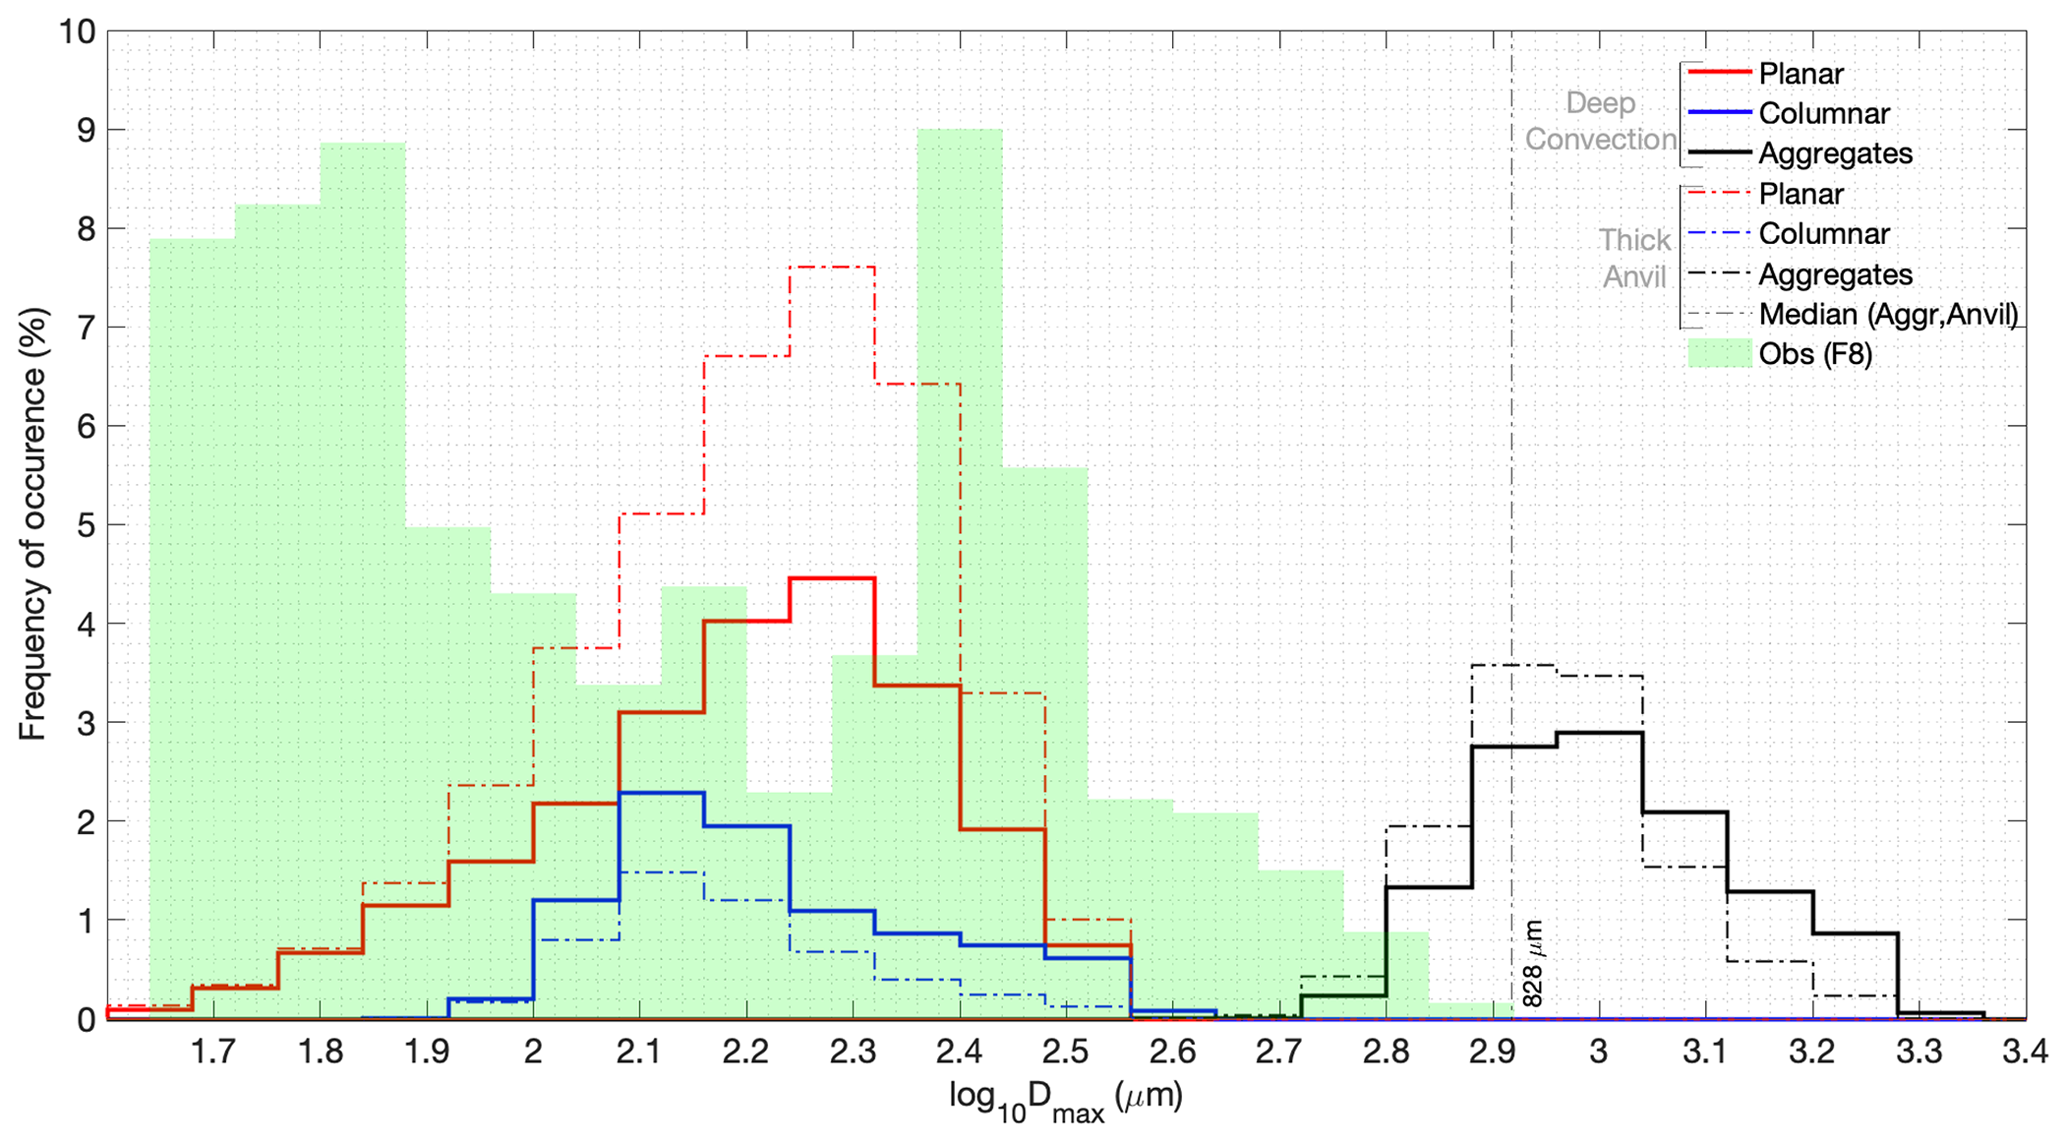
Figure 14Distribution of ice particle maximum dimensions (Dmax) from observations (green shading) and the ISHMAEL scheme within the TTL in the deep-convection (solid line) and anvil (dashed–dotted line) regions for the following ice habits: planar (red), columnar (blue), and aggregate (black).
In this section, we focus on the simulation with the ISHMAEL scheme to examine the sensitivity of TTL cirrus clouds to different ice habits. We use the maximum dimension Dmax (Jensen et al., 2017), which is produced only by the ISHMAEL scheme among all of the schemes involved in this study. The observed ice particles shown in Fig. 2 illustrate very large sizes captured during F8. For a fair comparison with the images captured during the field campaign, Fig. 14 shows the distribution of Dmax from measurements and the ISHMAEL simulation. It demonstrates the bimodality (e.g., Ivanova et al., 2001; Mitchell et al., 2008; Zhao et al., 2011) of the observed and simulated cirrus particle size distributions (PSDs), with an approximate 300 µm shift of the simulated size range towards larger values. The small particle modes are in the sub-100 µm and sub-400 µm size ranges for the observations and simulations, respectively. The bimodality of the PSD over a very wide range of particle sizes indicates a difference in the physics controlling its evolution (Field and Heymsfield, 2003; Sourdeval et al., 2018). Bimodal cirrus PSDs can be explained by aggregation processes and depositional growth. Depending on RHi, bimodality evolves naturally due to condensational growth and sedimentation (e.g., Mitchell et al., 1996). It can be difficult to distinguish aggregation from complex diffusional growth patterns (e.g., Lawson et al., 2006) using only in situ observations of microphysical properties. The lower range of particle size mainly represents nucleation and diffusional growth, while the higher range is dominated by aggregation (Field, 2000). The simulated PSD shown in Fig. 14 provides additional details that distinguish the different ice habits. The first simulated mode of the PSD is dominated by the planar habit followed by the columnar one with a narrower range for sizes < 300 µm. The second mode, however, is only associated with the aggregates that dominate the large end of the PSD (Kajikawa and Heymsfield, 1989; Heymsfield et al., 2002). The large end of the observed PSD > 400 µm shares the same range of simulated aggregates. Observed ice particles with sizes larger than 700 µm only account for 6.4 %, which corroborates the low ice number concentration of the simulated aggregates shown in Figs. 9, 10, and 11. The maximum size of the ice particles captured by F8 is approximately neighboring the simulated median and the most frequent size range of the simulated aggregates. More specifically, in the anvil region the median value of aggregate sizes is 828 µm, which corresponds approximately to the maximum value observed during F8. Moreover, the simulated PSDs for all ice habits shown in Fig. 14 demonstrate a difference between ice particle sizes in the convective and anvil regions. To distinguish between the three life cycle stages of deep convection, the following three ice water path ranges are used: deep convection (IWP > 1000 g m−2), thick anvil (1000 > IWP > 10 g m−2), and thin cirrus (10 > IWP > 0.1 g m−2) (Sokol and Hartmann, 2020). In reference to PSDs in the convective region, the larger end of the PSD in the anvil is smaller for the columnar and aggregate habits. For the planar habit, Fig. 14 shows a broadening of the distribution in the anvil. Despite the overestimation of the simulated particle sizes, the ISHMAEL scheme is the only scheme used in this study that can reproduce the large particle sizes captured by F8 and identify their shape. While the range of particle sizes for each habit is similar in anvil and deep-convective clouds, the largest particles are more frequently found within deep convection.
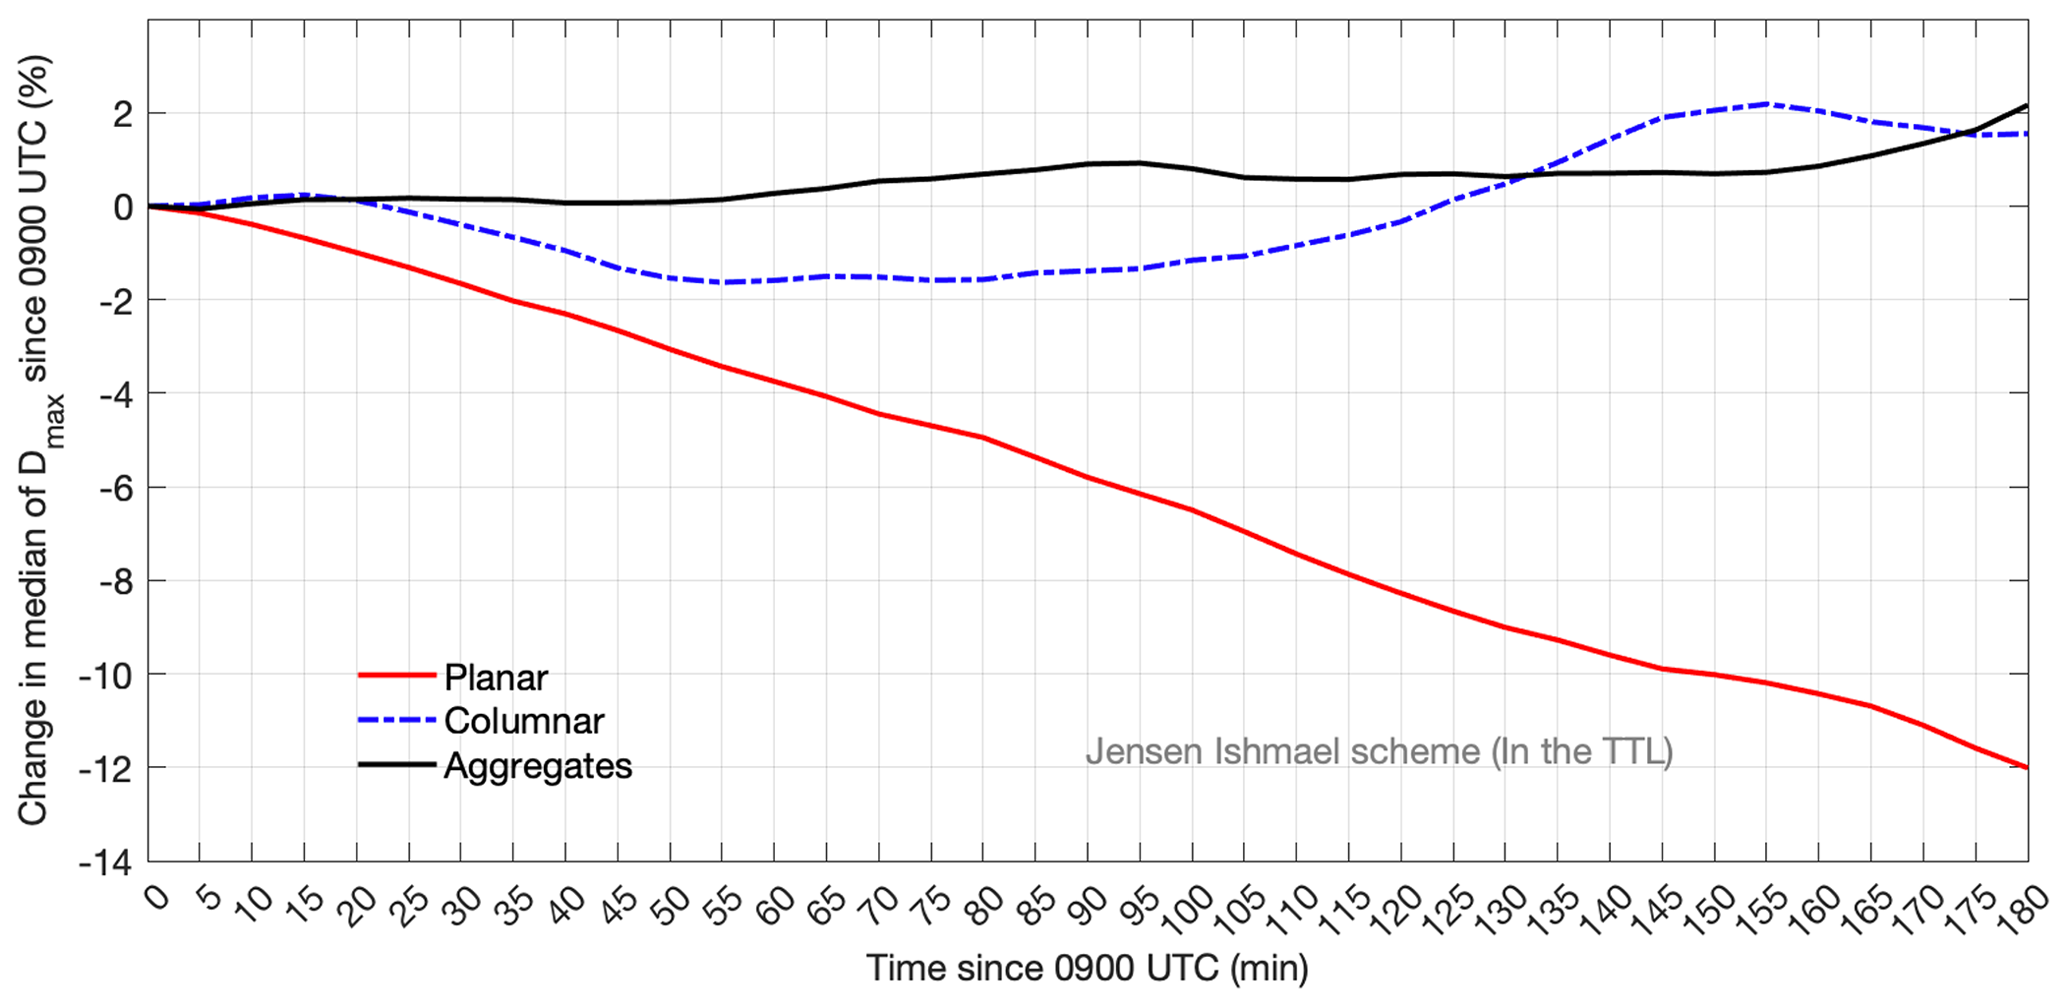
Figure 15Time series (starting from 10 August 2017 at 09:00 UTC) of the change in median value of simulated maximum dimension in the TTL using the ISHMAEL scheme for ice habits: planar (red), columnar (dashed–dotted blue), and aggregate (black).
During F8, very large aggregates of ice particles were observed. For this reason, we want to check whether this tendency is also reproduced by the simulation. Figure 15 shows the time series of the change in the median value of the maximum dimension for the three ice habits in reference to the initial value of 10 August 2017 at 09:00 UTC. The temporal evolution of the aggregate size indicates no decrease in the median value during the whole 3 h (Fig. 15), which backs up the observed persistence of the large aggregates. The size of the columnar habit is similarly constant, fluctuating by less than 2 %. On the other hand, the size of planar ice particles experiences an approximately constant decrease of 4 % per hour. From the PSDs of each ice habit shown in Fig. 14, the planar shape occupies a wide range that envelops that of the columnar habit. The large planar ice particles either fall off if they become sufficiently heavy or contribute to the formation of aggregates. The lower end of the PSD for the planar habit represents mostly small and freshly nucleated ice particles. Moreover, due to the difference in RHi (Fig. 12), the PSD indicates more in situ nucleation of planar ice particles in the anvil than in the convective region (Fig. 14). Therefore, the steady decrease in particle size for the planar habit shown in Fig. 15 is due to the loss of large ice particles in favor of sedimentation or aggregate formation and the increasing nucleation of small ice particles. For the columnar habit, ice particles contribute to aggregate formation and experience growth or sublimation depending on the RHi. The low in situ nucleation rate prevents the ice crystals from reaching the sedimentation threshold and from undergoing a strong decrease in the number of large ice crystals encountered by the planar habit (Fig. 15). Due to the coexistence of the columnar and planar habits, ice aggregates form continuously. The aggregate habit has a hollow structure with a very low density of ice particles that is more than an order of magnitude smaller than the density of the planar and columnar habits. For this reason, ice aggregates can remain longer in the TTL before reaching the critical sedimentation size even when they are large in size.
4.4 Fall speed and growth of ice particles across ice habits
The fall speed of ice particles is one of the factors that determines the lifetimes of cirrus clouds (e.g., Jiang et al., 2019) and thus indirectly affects climate sensitivity (e.g., Sanderson et al., 2008). The corresponding RHi, which can vary significantly (Fig. 12) in the TTL, regulates the rates of nucleation, sublimation, and growth of ice particles. Due to their differences in shapes and density, ice particles can evolve differently in the outflow of deep convection, anvil, and in situ thin cirrus (e.g., Lawson et al., 2019). To further explore the behavior of each ice habit in these three regions in the TTL, Fig. 16 shows scatter plots of fall speed as a function of RHi and color coded by Dmax. The StratoClim field campaign and more specifically the F8 trajectory aimed to sample deep-convective cases. The results of the inner domain D4 (Fig. 3) using the ISHMAEL scheme shown in Fig. 16 are consistent with the observation that indicates the dominance of deep-convective clouds and thick anvil clouds, with a very low occurrence of thin cirrus (Fig. 16). The bottom row of Fig. 16 shows the small amount of thin cirrus, consisting exclusively of planar ice habit with small sizes that are mostly less than 100 µm and low fall speeds below 20 cm s−1. For higher values of RHi ∼ 130 % and above, these planar ice particles are largely formed in situ and are mostly 50 µm or smaller with fall speeds of ∼ 10 cm s−1. These small ice particles explain the extended life cycle of thin cirrus clouds.
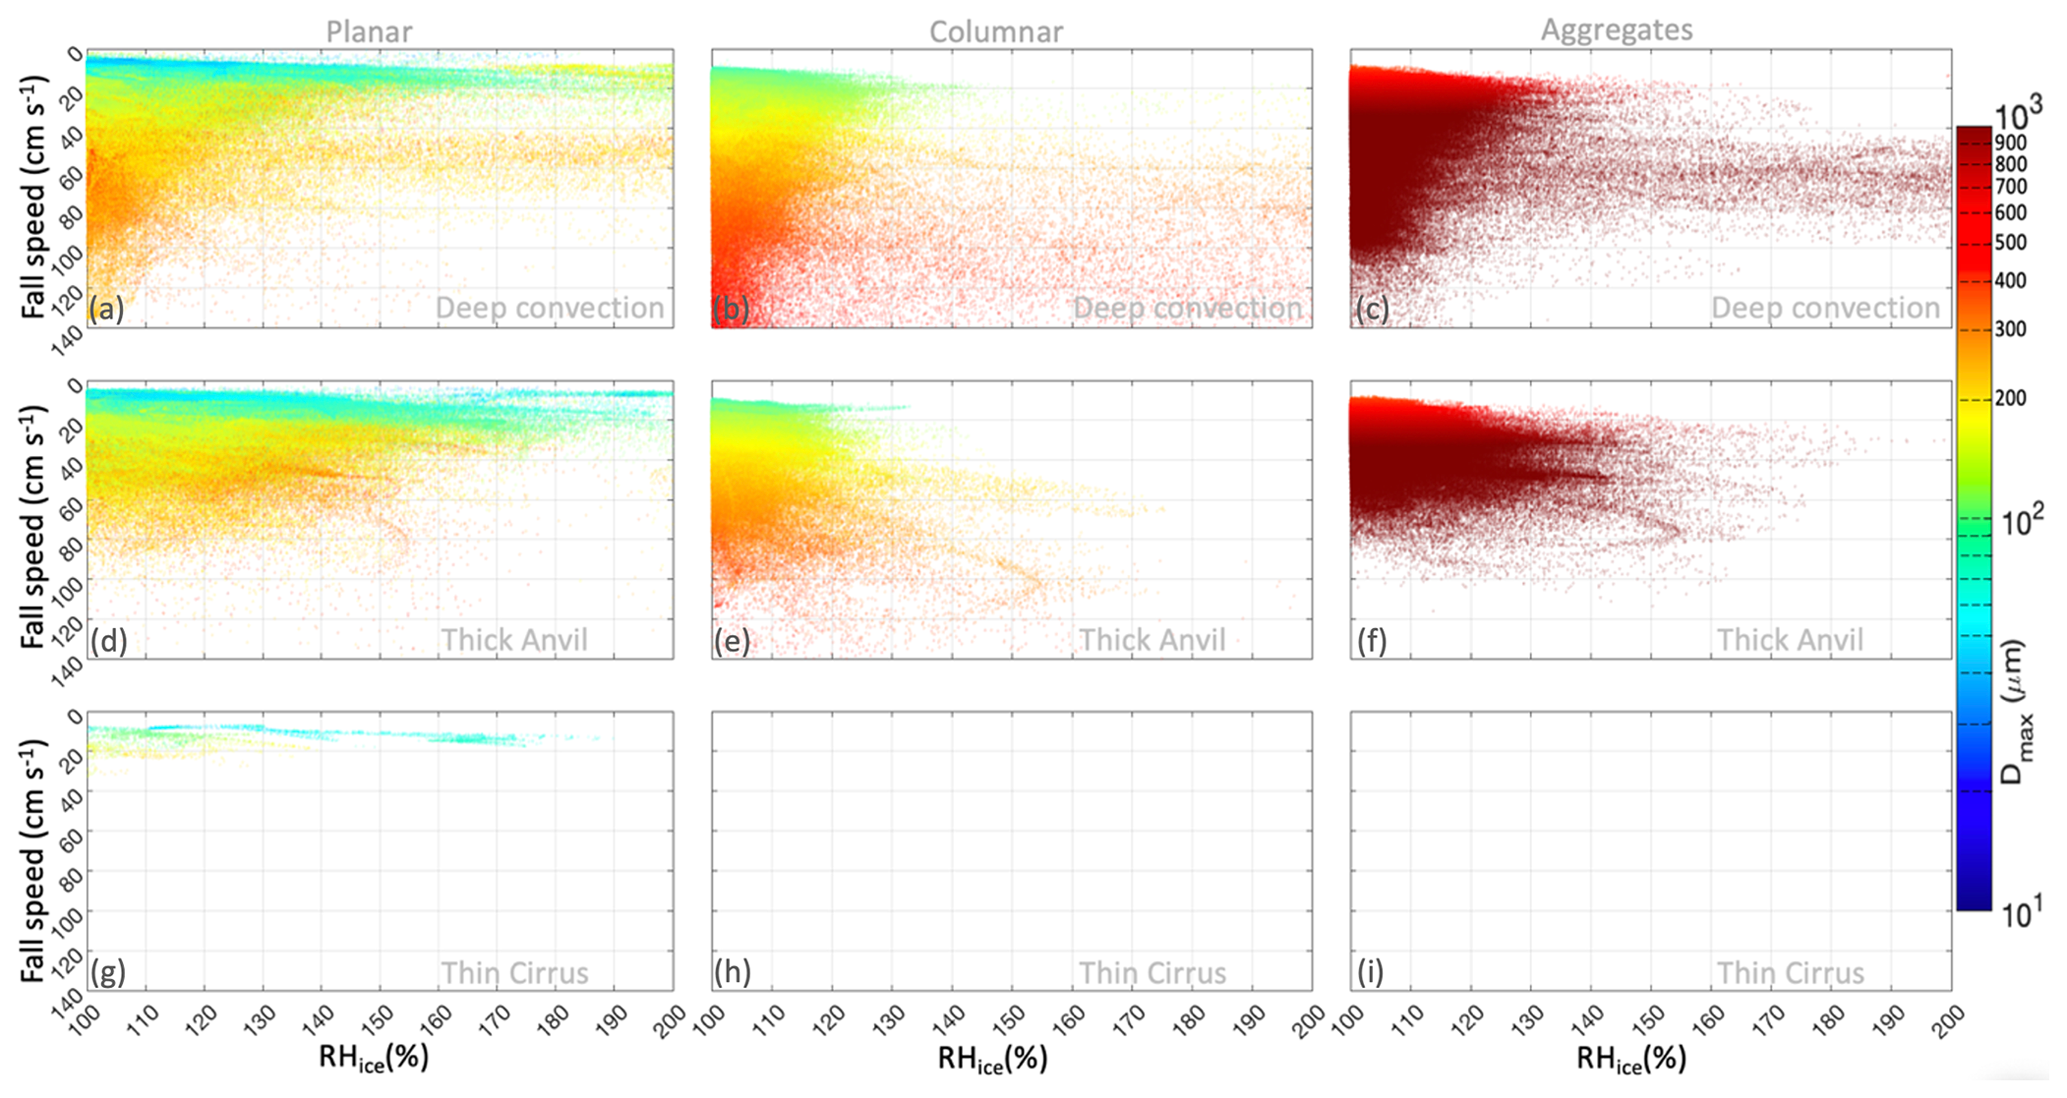
Figure 16Scatter plots of ice particle fall speed as a function of relative humidity with respect to ice (RHi), color coded by maximum dimension (Dmax) for three different ice habits, i.e., planar (a, d, g), columnar (b, e, h), and aggregate (c, f, i), and three different regions, i.e., deep convection (a–c), thick anvil (d–f), and thin cirrus (g–i).
For deep-convection and thick-anvil regions, Fig. 16 (upper and middle rows) shows the coexistence of the three ice habits but with different characteristics. The dependence of fall speed on particle sizes is not similar from one ice habit to another, which is mainly due to the difference in particle shape and density. In terms of fall speed, the deep-convection region within the TTL occupies the largest range, starting from a few centimeters per second for planar ice to over 150 cm s−1 for columnar ice. For planar ice, when RHi < 130 %, Fig. 16 shows the smallest ice particles (< 30 µm) with very slow fall speeds (< 5 m s−1). These particles are mainly of liquid origin and freshly nucleated. On the other hand, planar ice particles associated with higher supersaturation (RHi > 150 %) are more likely to grow and fall in the deep-convection region (upper left). In the anvil (middle left), high supersaturation (RHi > 150 %), very low fall speed, and small particle size indicate prevalent in situ nucleation. In addition, for the planar habit, RHi is inversely correlated with fall speed. This correlation is less evident for the other two ice habits. For the columnar ice habit, Fig. 16 (middle column) shows a shift in fall speeds to higher values, larger particle sizes, and lower supersaturation with respect to ice. These characteristics indicate slower growth and higher sedimentation rates when compared with the planar habit. Larger particles are more likely to sediment with fall velocities ≥ 1 m s−1 (Heymsfield and Wright, 2014) from the outflow (depending on ice density) as soon as they are no longer supported by an updraft. As ice particles sediment, they may contribute to aggregate formation, grow, or sublimate depending on the RHi. High fall speeds and RHi ≳ 130 %, such as experienced with the columnar habit (Fig. 16), may correspond to regrowth downwind of aged ice particles via vapor diffusion (e.g., Gallagher et al., 2012). In contrast, the aggregates demonstrate different behavior from pristine columnar and planar crystals. Very large particle sizes between 600 and 800 µm are associated with very low fall speeds below 20 cm s−1. This explains the longer residence time of aggregates observed during F8. For these ice particles to fall out with a speed of about 30 cm s−1 or faster, they need to reach a size of ∼ 900 µm or larger.

Figure 17Density plots of maximum dimension as a function of fall speed, color coded by bin counts for three different ice habits, i.e., planar (a, d, g), columnar (b, e, h), and aggregate (c, f, i), and three different regions, i.e., deep convection (a–c), thick anvil (d–f), and thin cirrus (g–i). Dashed–dotted lines represent fit lines.
As ice crystals sediment, they may aggregate (Lawson et al., 2019) via differential sedimentation throughout the cloud layer (e.g., Schmitt and Heymsfield, 2010). Large ice crystals with higher fall speeds can collect smaller ice crystals as they fall through clouds and form aggregates. The ratio of the sizes of aggregating crystals and their terminal velocities are important in aggregation (e.g., Kajikawa and Heymsfield, 1989). To explore this relationship and quantify the correlation between maximum dimensions and corresponding fall speeds, Fig. 17 shows density plots that relate these two parameters. Figure 17 reveals the linear relationship across all ice habits and demonstrates comparable shallow slopes of about 3 µm cm−1 s for columnar and planar habits (with a larger spread for the latter). For columnar ice particles, Fig. 17b, e, and h show a sharp correlation. A small change in size can lead to a large change in fall speed, which is supported in Fig. 17 (upper row, middle column) by higher fall speeds. The large spread associated with the planar habit is due to the larger aspect ratio range. The minor axis can evolve broadly and regulates ice crystal density and fall speed without affecting the maximum dimension. On the other hand, the aggregates indicate a sharp correlation and a steep slope of about 27 µm cm−1 s. This reveals a lower sensitivity of fall speed to change in maximum dimension, which is due to very low ice densities for this ice habit.
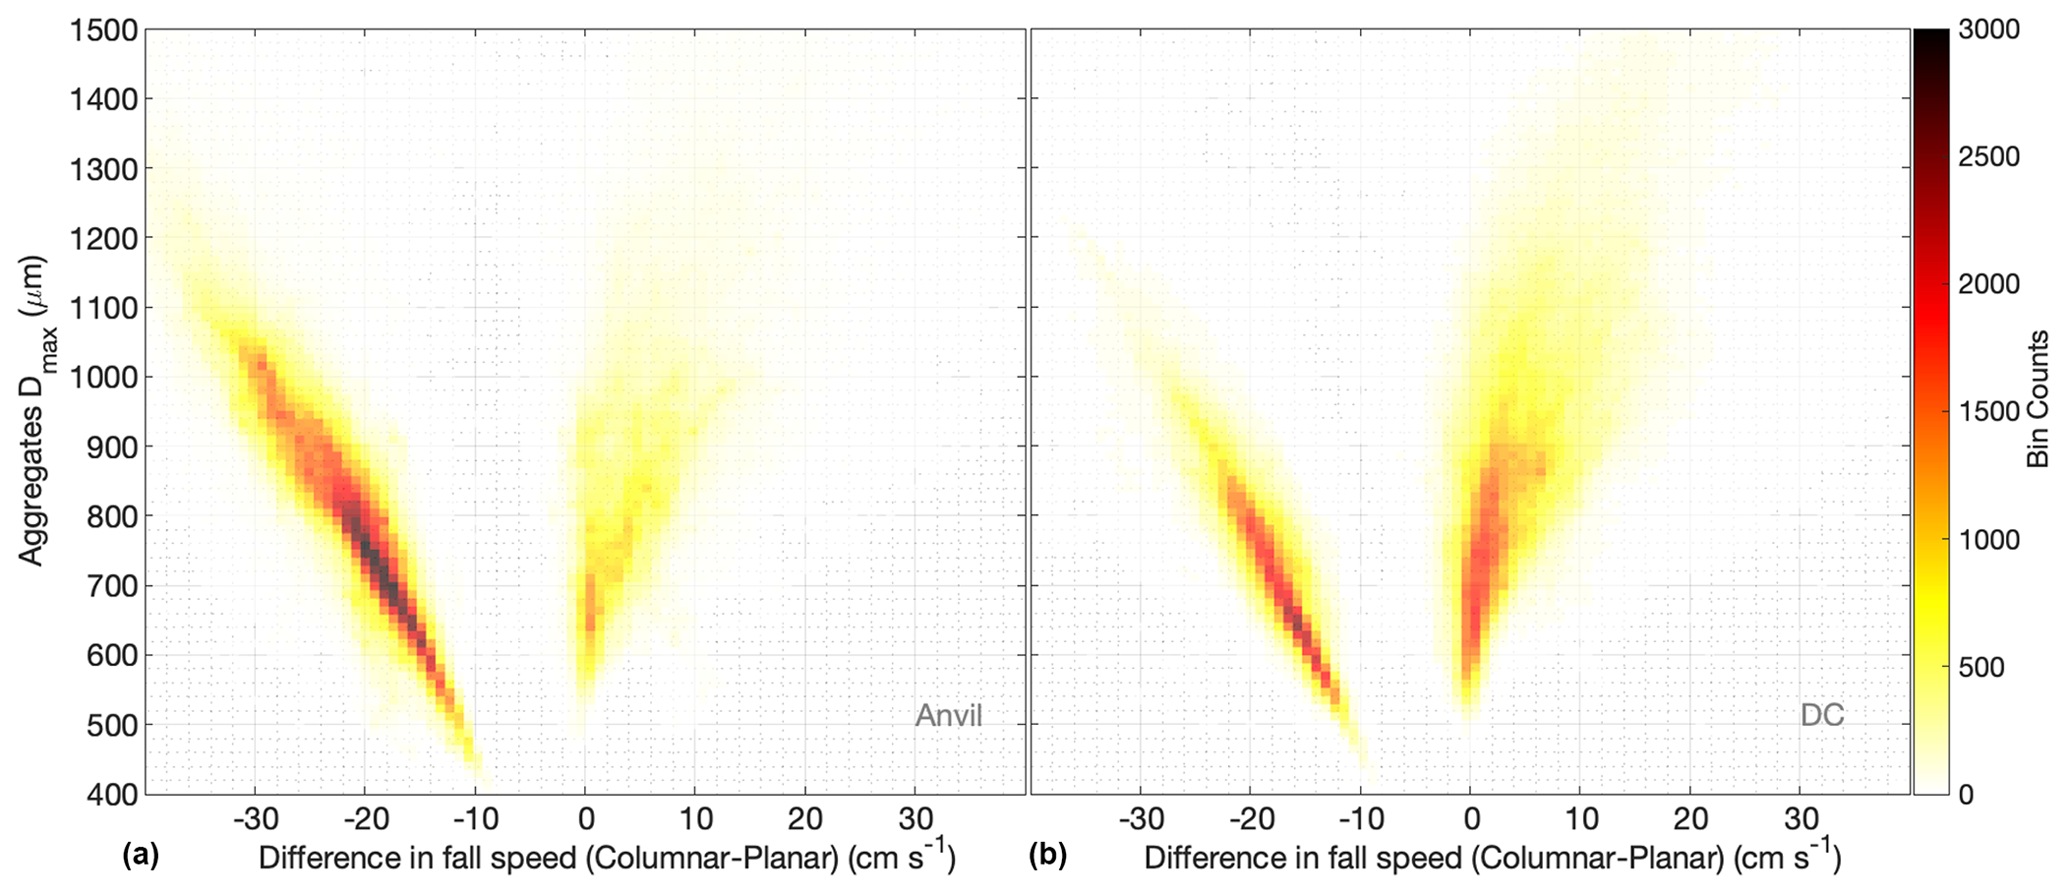
Figure 18Density plots of maximum dimension of aggregates as function of the difference in fall speeds between columnar and planar habits, color coded by bin counts for two regions in the TTL, i.e., deep convection (b) and thick anvil (a).
To explore the relationship between differential sedimentation and maximum dimension (Dmax) of aggregates, Fig. 18 reveals an evident linear relationship between the Dmax of aggregates and the difference in fall speeds between two different ice habits (columnar and planar) throughout the cloudy TTL. This relationship is consistent in the deep-convection (Fig. 18, right) and thick-anvil (Fig. 18, left) regions. Aggregates can also occur involving similar ice habits, but these density plots (Fig. 18) reveal a predominance of aggregation formation through different habits in controlling the maximum dimension of aggregates. In addition, Fig. 18 provides additional details on the differential sedimentation associated with the case of the current study. In the formation of aggregates, which ice habit falls faster is important in determining the slope and the spread of the linear relationship. When the planar habit sediments faster than the columnar habit, the slope of the linear relationship is steep, i.e., about 28 µm cm−1 s, and the linear relationship is sharp. On the other hand, when the columnar habit sediments faster than the planar, the slope of the linear relationship is even steeper, i.e., ∼ 87 µm cm−1 s, and the maximum dimension of the corresponding aggregate is more sensitive to the difference in fall speeds. The spread of the linear relationship in this case is larger.
4.5 Sensitivity of diabatic heating in TTL cirrus to different ice habits
Although this study focuses on the sensitivity of simulated HIWC in the TTL to model configuration and different ice habits, we extend our analysis in this section to explore the sensitivity of diabatic heating to ice habits. We examine the sensitivity of radiative and latent heating rates to different ice habits, spanning 09:00–12:00 UTC. The distributions of the two heating rates are taken over the entire domain at each grid cell every 5 min, which is the output frequency of the simulations. The distributions are divided according to the cloud categories that are based on ice water path thresholds. The heating rates in Fig. 19 show distinct distributions between different cloud morphologies (thick anvil and thin cirrus) and between ice habits. Figure 19 (left column) shows the planar habit with an approximately balanced distribution and an average radiative heating rate of 1.5 K d−1. Moreover, moving away from deep convection, the radiative heating rate associated with planar habit gradually shifts towards a more positive radiative heating rate in thick anvils, with an average of ∼ 2.5 K d−1, and an even more positive rate in thin cirrus, with an average of ∼ 3.5 K d−1. The radiative heating rate associated with thin cirrus clouds is predominantly positive. If only the planar habit is considered, this tendency is consistent with the findings of Hartmann et al. (2018), who found that rising and thinning anvils lead to a net radiative warming effect. Adding more realistic and complex ice habits into the microphysical parameterizations can alter the radiative heating of clouds. Radiative properties of cirrus depend on the optical properties of its ice crystals, which in turn depends on the microphysical properties, such as particle shape, particle size distribution, ice water content (e.g., Key et al., 2002), and number concentration (e.g., Liu et al., 2003b). Previous studies (e.g., Takano and Liou, 1989) found that single-scattering albedo is related to aspect ratio and absorption coefficient of ice crystals. In addition, Fu (1996) calculated the single-scattering properties of columnar and planar habits using the geometric-optics—integral-equation technique (Yang and Liou, 1996). Key et al. (2002) quantified the significant sensitivity of ice cloud radiative properties to ice crystal optical properties of seven ice particle shapes.

Figure 19Histograms of diabatic heating in the TTL from microphysics (b, d, f) and radiation (a, c, e) in the deep-convection (a, b), thick-anvil (c, d), and thin-cirrus (e, f) regions for different ice habits, i.e., columnar (blue) planar (red), and aggregate (black).
The current study reveals a significant change in these microphysical properties across ice habits (Figs. 9, 11, and 16). Additionally, ice crystal capacitance is parameterized differently from one ice habit to another depending on the maximum diameter of the crystals. This affects the growth rate of ice crystals differently, which in turn affects microphysical processes to alter the size distribution of ice crystals (Fig. 14), further modifying radiative heating. For columns and aggregates, the distributions of radiative heating rate are slightly different, with averages of 4 and 4.6 K d−1 in the deep-convection region and 4.6 and 4.3 K d−1 in the thick-anvil region, respectively.
Comparison between the three ice habits indicates that the columnar habit takes the lead in net radiative warming, followed by the aggregate habit, with the planar habit having the lowest net radiative warming. The contribution of the columnar habit versus the planar habit to the net radiative rate is more than double in the deep-convection region and almost double in the thick-anvil region. Therefore, neglecting the shapes of ice particles can lead to an underestimation of the net cloud radiative rate by more than double.
Latent heating rates (Fig. 19, right column) also indicate sensitivity to ice habit and cloud morphology. All distributions are skewed to positive values, except for the planar habit, which indicates an approximately balanced distribution in the deep-convection region. Across different stages of cloud morphology, the positive skewness of the latent heating distributions reflects a predominance of ice particle growth and nucleation. In the deep-convection region and within the TTL, columnar habit growth and sublimation is dominant over the other two habits, with an average latent heating rate of 2.3 K d−1. The average values for the planar and aggregate habits are 1.2 and 2.1 K d−1, respectively. The transition from deep convection to thick anvil indicates a significant narrowing of the latent heating rate distribution associated with columnar habit and a decrease in its average value to 1.52 K d−1. The decrease in the rate of sublimation and the growth of columnar habit is consistent with the higher sedimentation shown in Fig. 16 (middle column). Figure 19 (right column, middle row) also shows dominant positive heating rates associated with aggregates, which reflects continuous aggregate growth in thick anvil. The average latent heating rate associated with aggregates in the anvil is 1.54 K d−1. For thin cirrus clouds with an average latent heat of 0.1 K d−1, Fig. 19 mainly shows lower positive latent heating rates with negligible negative values. Insignificant sublimation and low growth rate will allow ice particles to persist without reaching the sedimentation threshold, resulting in a prolonged residence time in the TTL. This supports the continued nucleation of small ice particles and the slower growth rate demonstrated in Figs. 15 and 16. Comparison of latent warming associated with the three ice habits indicates that aggregate and columnar habits contribute more than twice as much as the planar habit. For diabatic heating in thick anvils, the columnar habit dominates the net radiative warming and aggregate habits dominate net latent warming. The results shown in Fig. 19 quantitatively confirm the major impact that different ice particle habits can bring to diabatic heating and consequently to the TTL cirrus life cycle.
Many previous studies have addressed the impact of ice habits on mixed-phase clouds (e.g., Avramov and Harrington, 2010; Hashino et al., 2020; Harrington et al., 2013; Sulia et al., 2021), but few have investigated their impact on TTL cirrus clouds, which frequently occur in different environments. The properties of cirrus clouds may differ depending on their geographical location (e.g., Heymsfield et al., 2017) and proximity to convection (e.g., Lawson et al., 2019). This study focuses on a specific case study associated with deep convection during the Asian summer monsoon. In this study, we used high-resolution (LES-scale) simulations of a real case study to examine the sensitivity of TTL cirrus clouds to ice habit and cloud regimes.
The main findings of this study allow us to make the following conclusions.
-
Measurements in the TTL during F8 of the StratoClim campaign captured peaks of high ice water content up to 2400 ppmv and ice particle aggregates exceeding 700 µm.
-
ERA5 reanalysis indicates the presence of HIWC in the TTL but with an order of magnitude lower amount than the measured values.
-
Comparison of simulated microphysical properties to Stratoclim measurements shows that simulated HIWC in the TTL is significantly sensitive to horizontal grid spacing only with the ISHMAEL scheme, with HIWC increasing substantially as grid spacing decreases from 3 to 0.3 km.
-
The microphysics scheme that predicts ice habit (ISHMAEL) is the only scheme that reproduces the observed HIWC peak and ice number concentrations.
-
Particular attention was therefore given to the ISHMAEL scheme, the microphysical parameterization predicting the ice habit. The corresponding fall speed and diabatic heating rates for each ice particle shape are compared between convective cloud, thick anvil cloud, and thin cirrus cloud.
-
Stratoclim measurements are dominated by ice particles of liquid origin with a small amount in the in situ range.
-
Simulated in situ cirrus clouds are associated with low IWC and number concentration. Higher values of IWC are mainly of liquid origin and occur at lower temperatures.
-
The simulated ice habits reveal that the ice particles of liquid origin, which substantially contribute to the HIWC, are of planar shape.
-
The columnar and aggregate habits are mostly in the in situ range with small IWC and number concentrations.
-
For all habits, ice number concentration increases with decreasing temperature, which corroborates previous studies (e.g., Gryspeerdt et al., 2018; Sourdeval et al., 2018). The disparity in ice number concentration across ice habits can be up to 4 orders of magnitude, and aggregates are much less frequent than other habits.
-
CPT and RHi, which regulate cirrus clouds, vary across schemes, and the ISHMAEL scheme simulates them adequately.
-
The ISHMAEL scheme can produce the observed bimodal distribution of ice particle sizes. The lower range of the distribution is mainly dominated by nucleation and diffusional growth, while the higher range is dominated by aggregation processes and depositional growth. The simulated bimodality is shifted towards larger values compared to the measurement.
-
The microphysical evolution of TTL cirrus clouds is strongly influenced by the type of ice habit in the cloud. The simulated ice habits evolve differently. The frequency of small planar ice particles increases faster due to enhanced in situ nucleation.
-
High RHi values above 130 % with fall speeds below 10 cm s−1 are only associated with the planar ice habit, leading to an extended life cycle of cirrus clouds.
-
For the planar ice habit, RHi is found to be inversely correlated with fall speed. This correlation is less evident for the other two ice habits.
-
Columnar ice particles sediment rapidly without significant regrowth of aged ice particles, especially in the lower range of supersaturation with respect to ice. As these ice particles sediment, they may contribute to aggregate formation.
-
Simulated aggregates exhibit different characteristics compared to pristine crystals. The large aggregates with sizes between 600 and 800 µm have fall speeds of less than 20 cm s−1, which leads to a long residence time of the aggregates.
-
We demonstrated and quantified the relationship between differential sedimentation of pristine ice crystals and the maximum dimension of aggregates. We found that the slope of this relationship depends on which pristine ice habit sediments faster. Therefore, ice habit could have a significant impact on the cirrus life cycle and the (de)hydration of the TTL by regulating the sedimentation rate and the freeze-drying process.
-
Ice habit also influences in-cloud radiative and latent heating rates, which are known to influence cloud dynamics at a variety of scales (Gasparini et al., 2022; Ramaswamy and Ramanathan, 1989; Sherwood et al., 1994).
These results demonstrate the importance of ice habit in shaping the properties and evolution of tropical cirrus clouds.
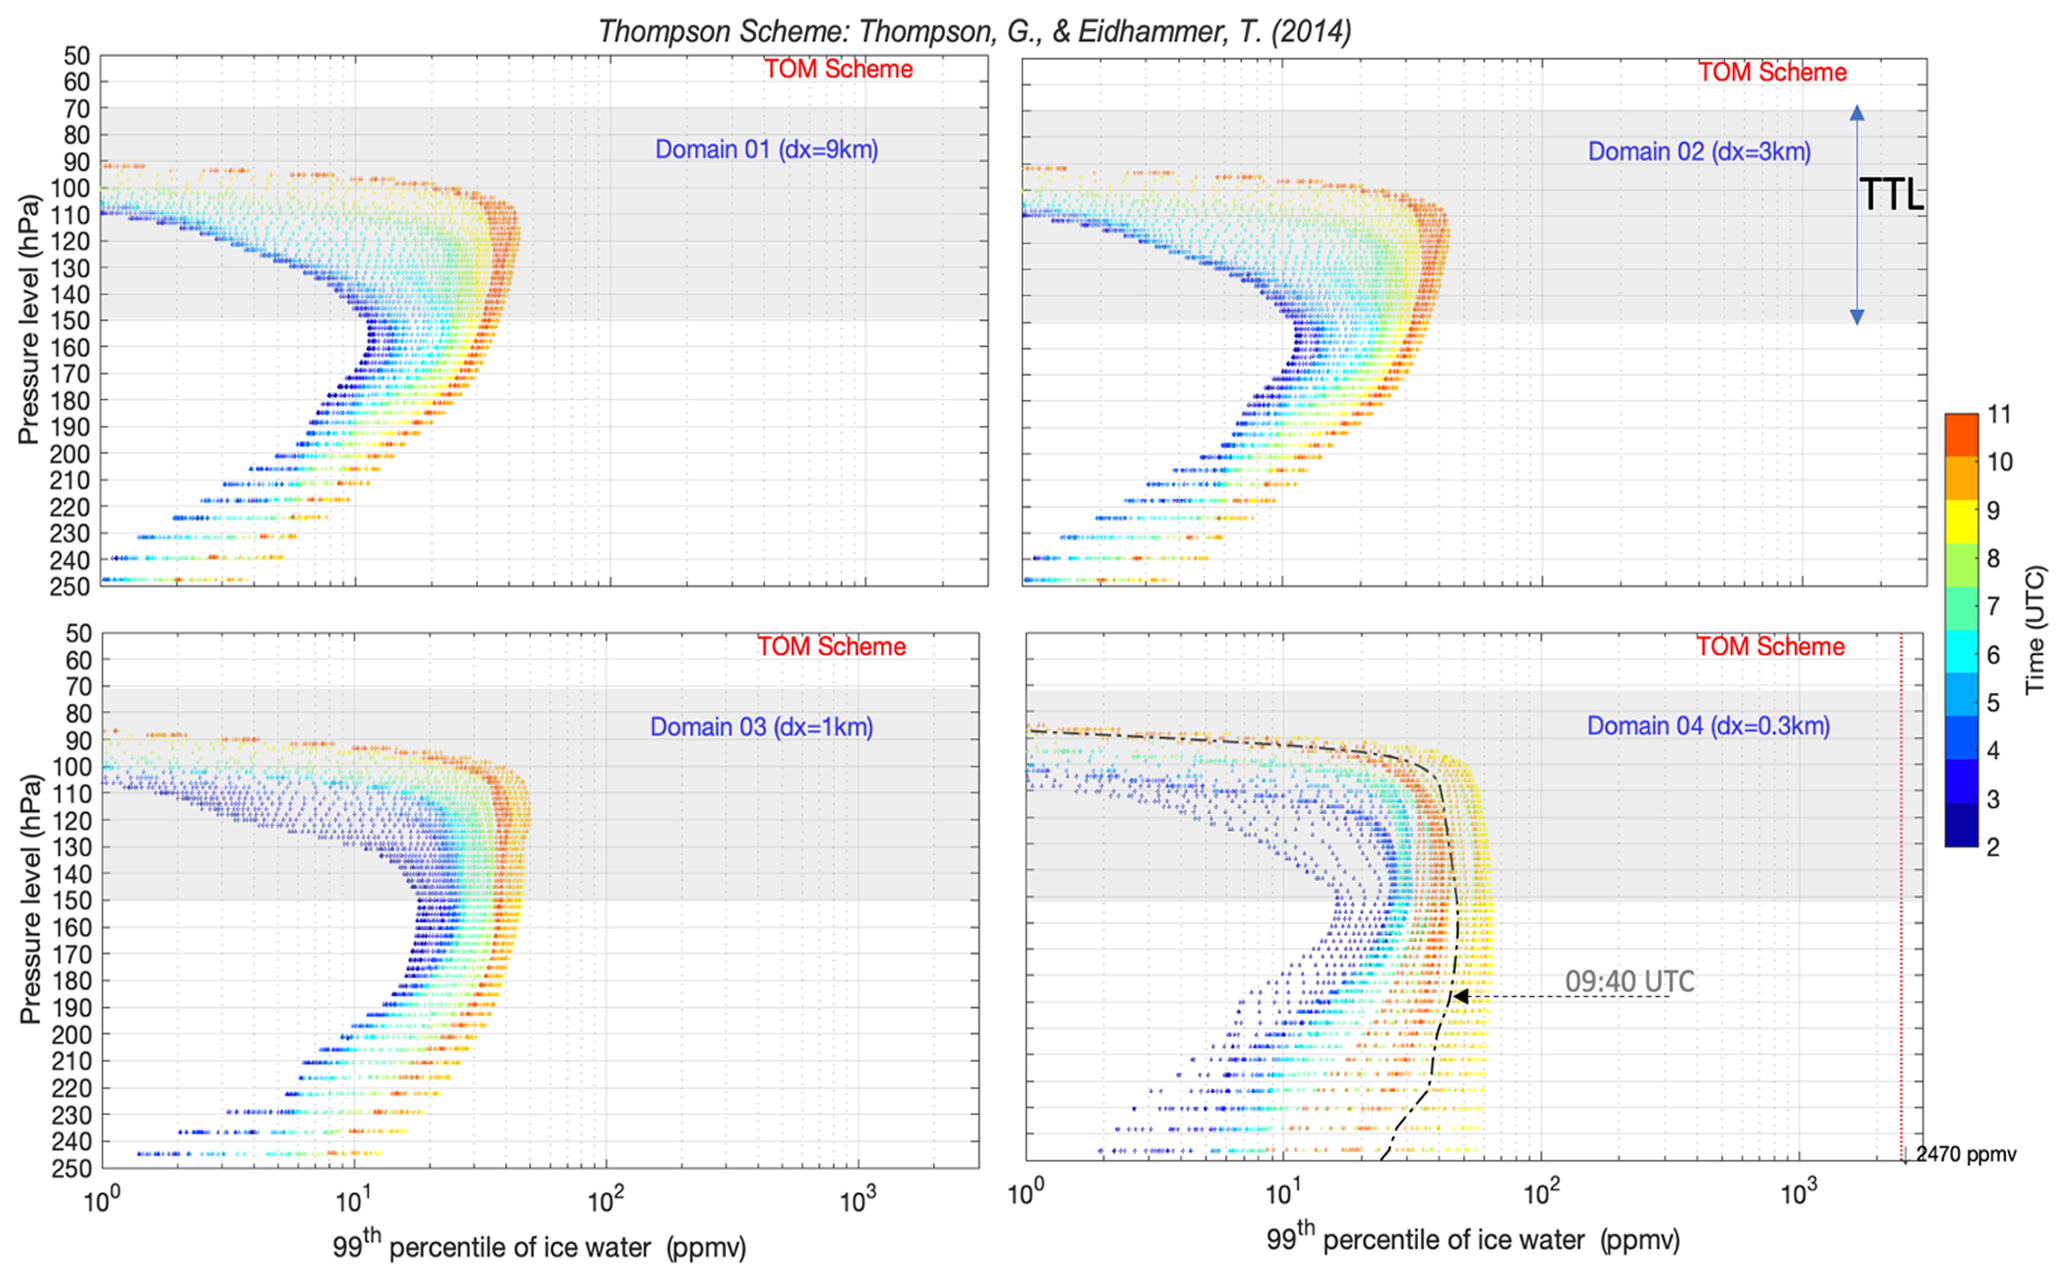
Figure A1Profile of 99th percentile of simulated IWC below and within the TTL (gray shade) using the Thompson microphysics scheme, with a grid spacing of 9 km (upper left), 3 km (upper right), 1 km (lower left), and 0.3 km (lower right) color coded by time (UTC) from 02:00 to 11:00 UTC. The dashed–dotted black line (lower right) represents the simulated profile at 09:40 UTC (timing of the first captured peak of IWC by aircraft), and the vertical dotted red line represents the observed value.
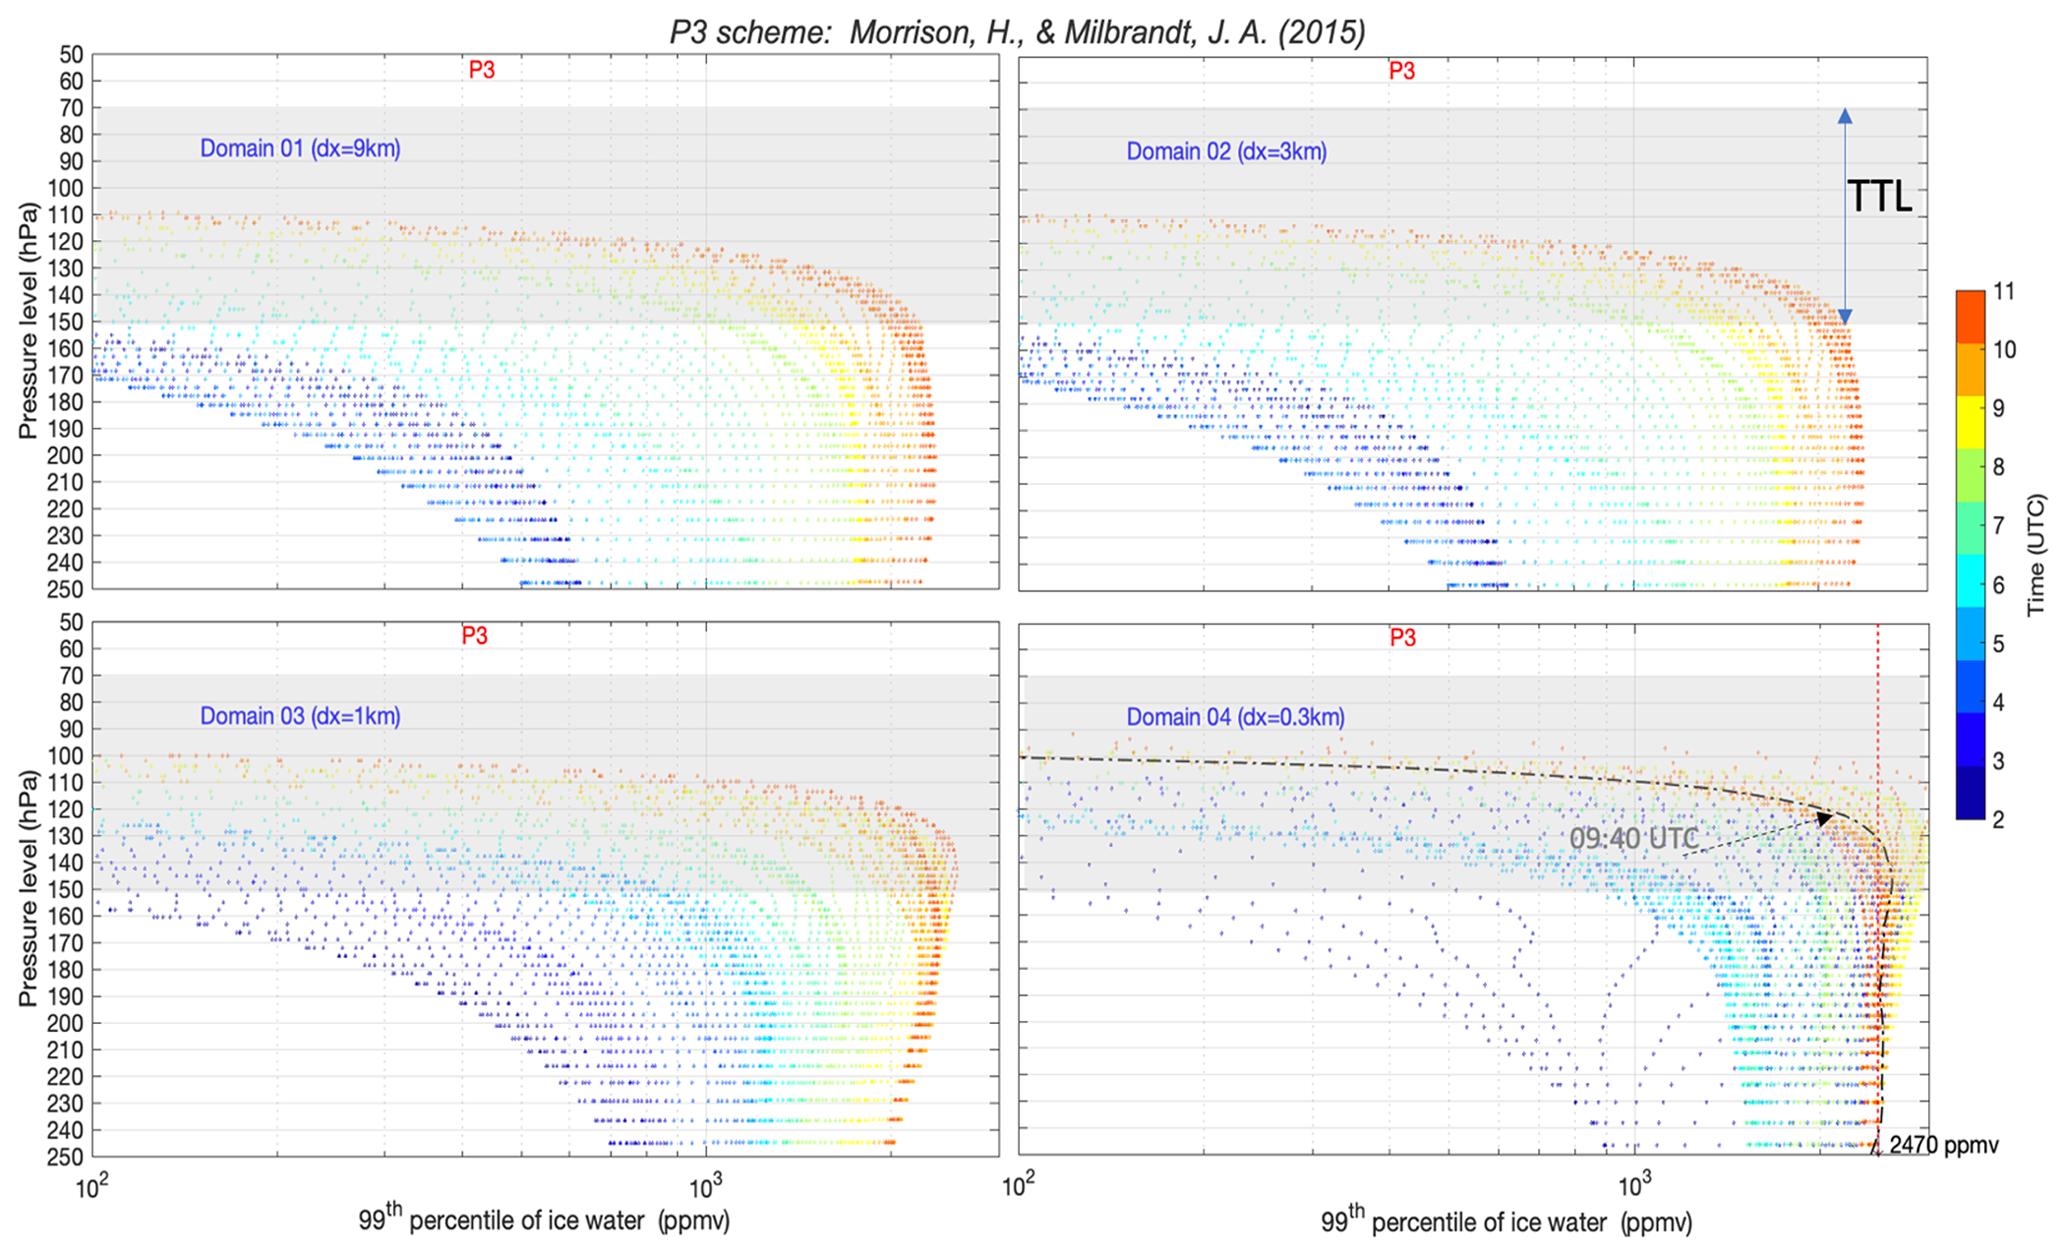
Figure A2Profile of 99th percentile of simulated IWC below and within the TTL (gray shade) using the P3 microphysics scheme, with a grid spacing of 9 km (upper left), 3 km (upper right), 1 km (lower left), and 0.3 km (lower right) color coded by time (UTC) from 02:00 to 11:00 UTC. The dashed–dotted black line (lower right) represents the simulated profile at 09:40 UTC (timing of the first captured peak of IWC by aircraft), and the vertical dotted red line represents the observed value.
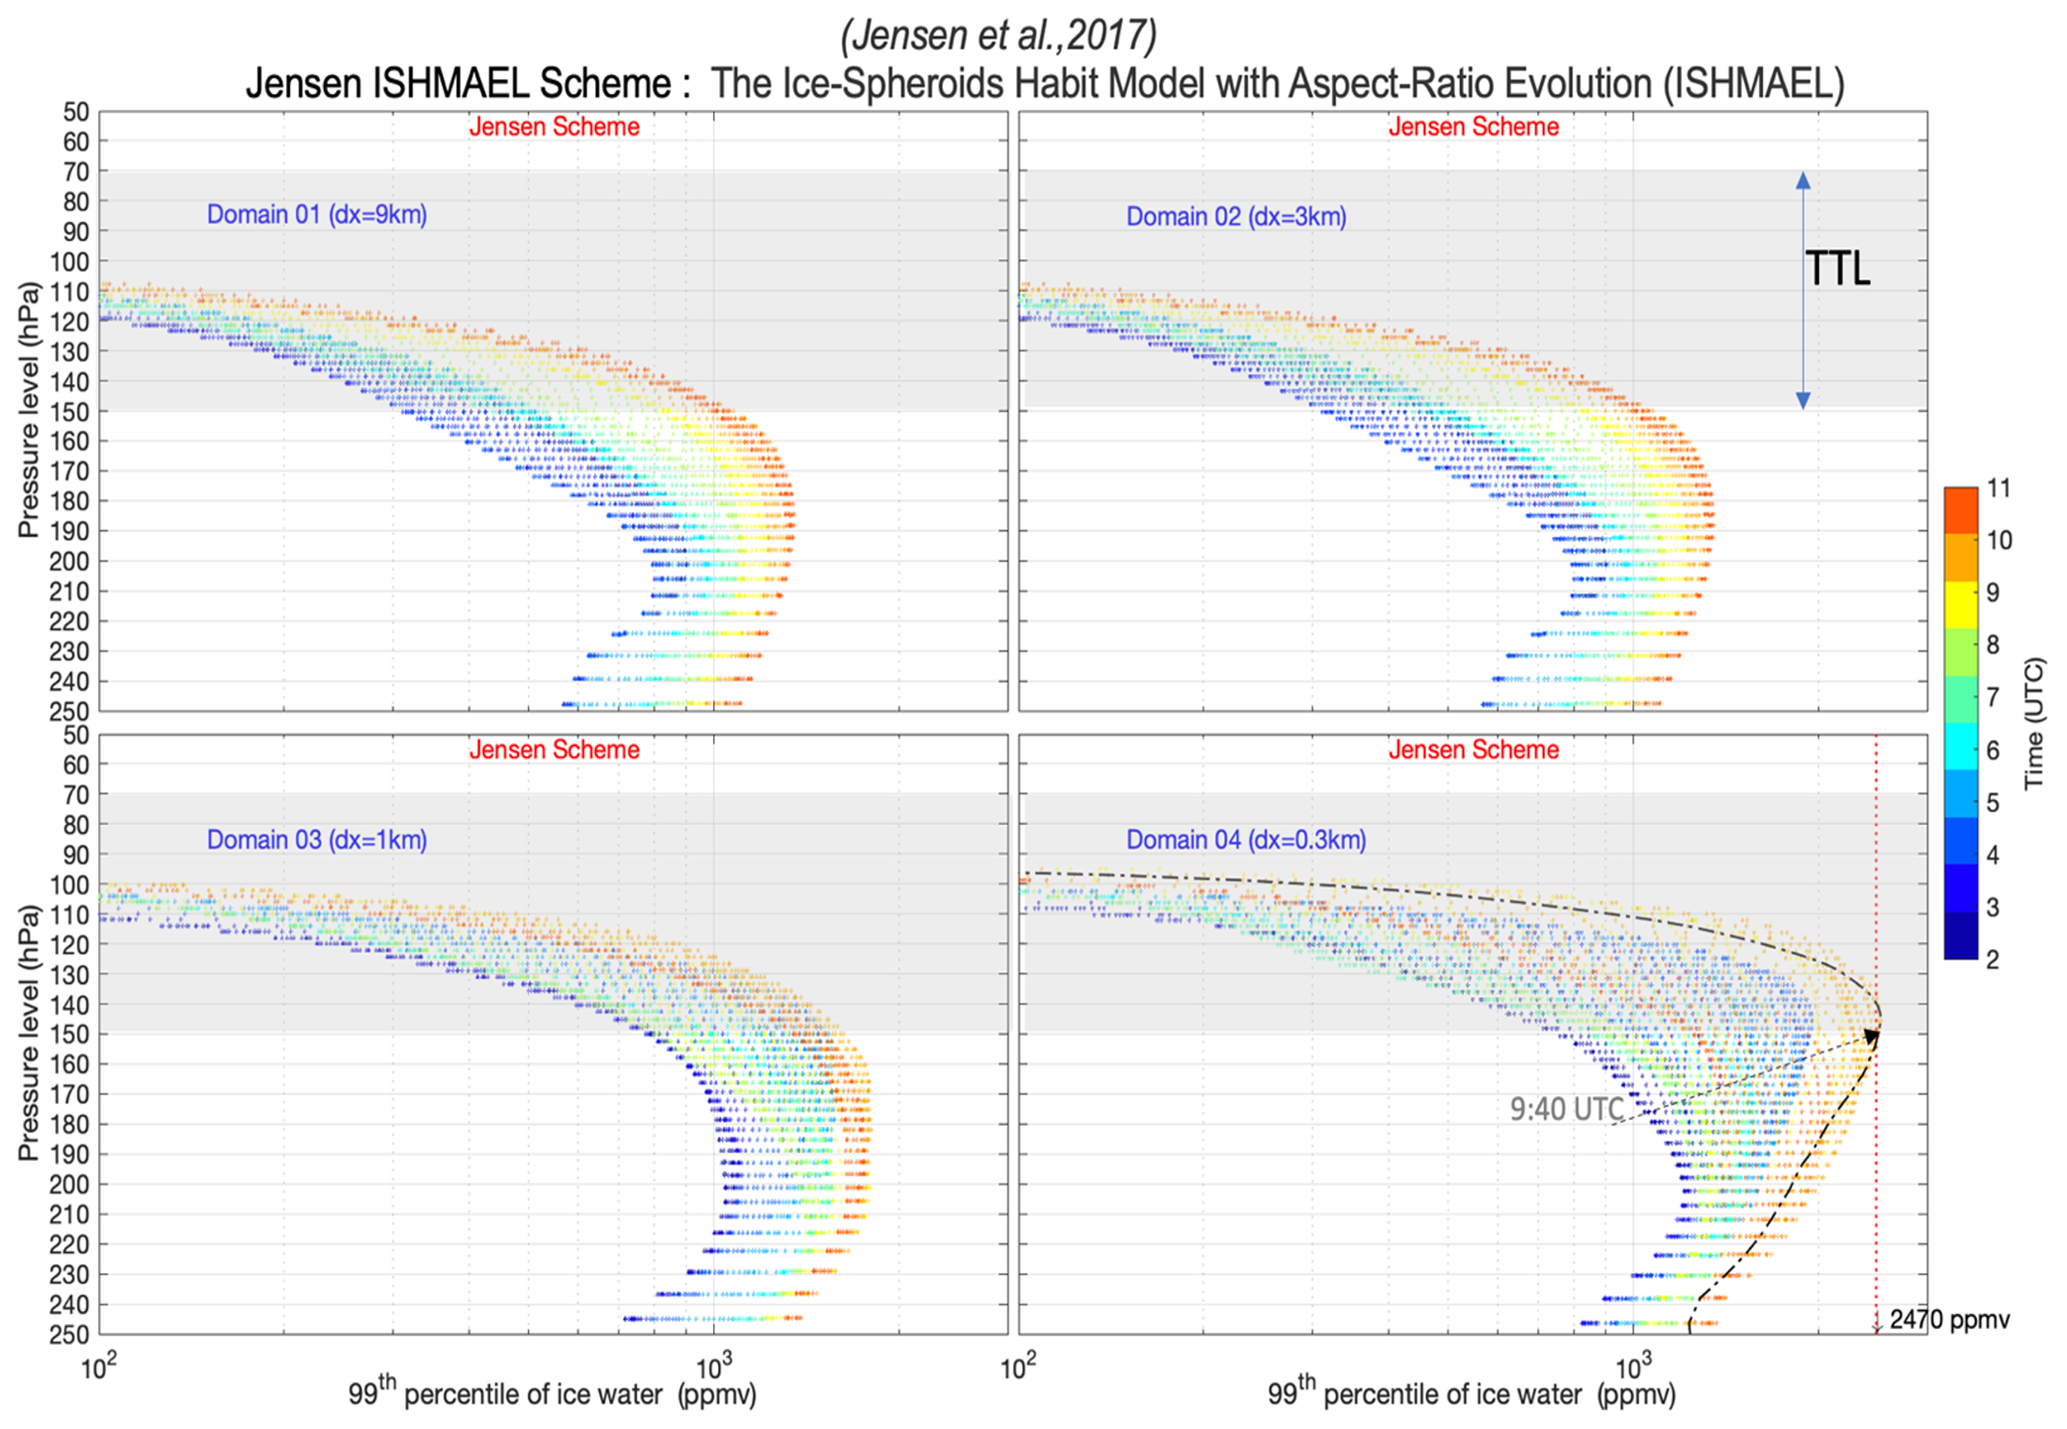
Figure A3Profile of 99th percentile of simulated IWC below and within the TTL (gray shade) using the ISHMAEL microphysics scheme, with a grid spacing of 9 km (upper left), 3 km (upper right), 1 km (lower left), and 0.3 km (lower right) color coded by time (UTC) from 02:00 to 11:00 UTC. The dashed–dotted black line (lower right) represents the simulated profile at 09:40 UTC (timing of the first captured peak of IWC by aircraft), and the vertical dotted red line represents the observed value.
WRF is available from the University Corporation for Atmospheric Research (UCAR) (https://www2.mmm.ucar.edu/wrf/users/download/, last access: 5 December 2022; UCAR, 2022; Powers et al., 2017).
All the data used in this study are openly available through the Harvard Dataverse repository at https://doi.org/10.7910/DVN/PKDDEI (Lamraoui, 2023).
FL, MK, and ZK conceptualized the study. FL ran the model and post-processed the data. MK, AA, and SK provided measurements from the campaign, details about instruments onboard of aircraft, and contributed to the interpretation. FL performed the analysis and writing of the original draft manuscript. FL, MK, AA, ABS, SK, AP, and ZK edited the manuscript and provided feedback on the interpretation of the results.
At least one of the (co-)authors is a member of the editorial board of Atmospheric Chemistry and Physics. The peer-review process was guided by an independent editor, and the authors also have no other competing interests to declare.
Publisher's note: Copernicus Publications remains neutral with regard to jurisdictional claims in published maps and institutional affiliations.
This article is part of the special issue “StratoClim stratospheric and upper tropospheric processes for better climate predictions (ACP/AMT inter-journal SI)”. It is not associated with a conference.
Fayçal Lamraoui and Zhiming Kuang are supported by OISE-1743753 and AGS-1759255. Adam B. Sokol is supported by NASA FINESST (grant no. 80NSSC20K1613). Martina Krämer and Armin Afchine are supported by the Seventh Framework Programme (STRATOCLIM; grant no. 603557). Sergey Khaykin was supported by the Agence Nationale de la Recherche TTL-Xing project (ANR-17-CE01-0015).
This research has been supported by the Office of International Science and Engineering (grant no. OISE-1743753), the Division of Atmospheric and Geospace Sciences (grant no. AGS-1759255), NASA FINESST (grant no. 80NSSC20K1613), the Seventh Framework Programme (STRATOCLIM; grant no. 603557) and the Agence Nationale de la Recherche TTL-Xing project (grant no. ANR-17-CE01-0015).
This paper was edited by Jianzhong Ma and reviewed by Colin Tully and one anonymous referee.
Afchine, A., Rolf, C., Costa, A., Spelten, N., Riese, M., Buchholz, B., Ebert, V., Heller, R., Kaufmann, S., Minikin, A., Voigt, C., Zöger, M., Smith, J., Lawson, P., Lykov, A., Khaykin, S., and Krämer, M.: Ice particle sampling from aircraft – influence of the probing position on the ice water content, Atmos. Meas. Tech., 11, 4015–4031, https://doi.org/10.5194/amt-11-4015-2018, 2018.
Anderson, J. G., Weisenstein, D. K., Bowman, K. P., Homeyer, C. R., Smith, J. B., Wilmouth, D. M., Sayres, D. S., Klobas, J. E., Leroy, S. S., Dykema, J. A., and Wofsy, S. C.: Stratospheric ozone over the United States in summer linked to observations of convection and temperature via chlorine and bromine catalysis, P. Natl. Acad. Sci. USA, 114, E4905–E4913, https://doi.org/10.1073/pnas.1619318114, 2017.
Avery, M. A., Davis, S. M., Rosenlof, K. H., Ye, H., and Dessler, A. E.: Large anomalies in lower stratospheric water vapour and ice during the 2015–2016 El Niño, Nat. Geosci., 10, 405–409, https://doi.org/10.1038/ngeo2961, 2017.
Avramov, A. and Harrington, J. Y.: Influence of parameterized ice habit on simulated mixed phase Arctic clouds, J. Geophys. Res., 115, 1–14, https://doi.org/10.1029/2009JD012108, 2010.
Bailey, M. and Hallett, J.: A comprehensive habit diagram for atmospheric ice crystals: Confirmation from the laboratory, AIRS II, and other field studies, J. Atmos. Sci., 66, 2888–2899, 2009.
Baran, A. J.: From the single-scattering properties of ice crystals to climate prediction: a way forward, Atmos. Res., 112, 45–69, 2012.
Boucher, O., Randall, D., Artaxo, P., Bretherton, C., Feingold, G., Forster, P., Kerminen, V.-M., Kondo, Y., Liao, H., Lohmann, U., Rasch, P., Satheesh, S., Sherwood, S., Stevens, B., and Zhang, X.: Clouds and Aerosols, in: Climate Change 2013: The Physical Science Basis, Contribution of Working Group I to the Fifth Assessment Report of the Intergovernmental Panel on Climate Change, edited by: Stocker, T. F., Qin, D., Plattner, G.-K., Tignor, M., Allen, S. K., Boschung, J., Nauels, A., Xia, Y., Bex, V., and Midgley, P. M., Cambridge University Press, Cambridge, United Kingdom and New York, NY, USA, 571–657, https://doi.org/10.1017/CBO9781107415324.016, 2013.
Brewer, A. W.: Evidence for a world circulation provided my measurements of helium and water vapour distribution in the stratosphere, Q. J. Roy. Meteor. Soc., 75, 351–363, 1949.
Chemel, C., Russo, M. R., Pyle, J. A., Sokhi, R. J., and Schiller, C.: Quantifying the imprint of a severe Hector thunderstorm during ACTIVE/SCOUT-O3 onto the water content in the upper troposphere/lower stratosphere, Mon. Weather Rev., 137, 2493–2514, https://doi.org/10.1175/2008MWR2666.1, 2009.
Chen, J.-P. and Tsai, T.-C.: Triple-moment modal parameterization for the adaptive growth habit of pristine ice crystals, J. Atmos. Sci., 73, 2105–2122, 2016.
Costa, A., Meyer, J., Afchine, A., Luebke, A., Günther, G., Dorsey, J. R., Gallagher, M. W., Ehrlich, A., Wendisch, M., Baumgardner, D., Wex, H., and Krämer, M.: Classification of Arctic, midlatitude and tropical clouds in the mixed-phase temperature regime, Atmos. Chem. Phys., 17, 12219–12238, https://doi.org/10.5194/acp-17-12219-2017, 2017.
Cziczo, D. J., Froyd, K. D., Hoose, C., Jensen, E. J., Diao, M., Zondlo, M. A., Smith J. B., Twohy, C. H., and Murphy, D. M.: Clarifying the dominant sources and mechanisms of cirrus cloud formation, Science, 340, 1320–1324, 2013.
Dessler A. E. and Sherwood, S. C.: Effect of convection on the summertime extratropical lower stratosphere, J. Geophys. Res., 109, D23301, https://doi.org/10.1029/2004JD005209, 2004.
Dekoutsidis, G., Groß, S., Wirth, M., Krämer, M., and Rolf, C.: Characteristics of supersaturation in mid-latitude cirrus clouds and their adjacent cloud-free air, Atmos. Chem. Phys. Discuss. [preprint], https://doi.org/10.5194/acp-2022-717, in review, 2022.
Devasthale, A. and Fueglistaler, S.: A climatological perspective of deep convection penetrating the TTL during the Indian summer monsoon from the AVHRR and MODIS instruments, Atmos. Chem. Phys., 10, 4573–4582, https://doi.org/10.5194/acp-10-4573-2010, 2010.
Dodion, J., Fussen, D., Vanhellemont, F., Bingen, C., Mateshvili, N., Gilbert, K., Skelton, R., Turnball, D., McLeod, S. D., Boone, C. D., Walker, K. A., and Bernath P. F.: Aerosols and clouds in the upper troposphere-lower stratosphere region detected by GOMOS and ACE: Intercomparison and analysis of the years 2004 and 2005, Adv. Space Res., 42, 1730–1742, https://doi.org/10.1016/j.asr.2007.09.027, 2008.
Dvortsov, V. L. and Solomon, S.: Response of the stratospheric temperatures and ozone to past and future increases in stratospheric humidity, J. Geophys. Res., 106, 7505–7514, 2001.
Evan, S., Rosenlof, K. H., Dudhia, J., Hassler, B., and Davis, S. M: The representation of the TTL in a tropical channel version of the WRF model, J. Geophys. Res.-Atmos., 118, 2835– 2848, https://doi.org/10.1002/jgrd.50288, 2013.
Field, P. R.: Bimodal ice spectra in frontal clouds, Q. J. Roy. Meteor. Soc., 126, 379–392, https://doi.org/10.1002/qj.49712656302, 2000.
Field, P. R. and Heymsfield, A. J.: Aggregation and scaling of ice crystal size distributions, J. Atmos. Sci., 60, 544–560, 2003.
Forster, P. M. de F. and Shine, K. P.: Stratospheric water vapor changes as a possible contributor to observed stratospheric cooling, Geophys. Res. Lett., 26, 3309–3312, 1999.
Fu, Q.: An accurate parameterization of the solar radiative properties of cirrus clouds for climate models, J. Climate, 9, 2058– 2082, 1996.
Fu, Q., Hu, Y., and Yang, Q.: Identifying the top of the tropical tropopause layer from vertical mass flux analysis and CALIPSO lidar cloud observations, Geophys. Res. Lett., 34, L14813, https://doi.org/10.1029/2007GL030099, 2007.
Fu, R., Hu, Y., Wright, J. S., Jiang, J. S., Dickinson, R. E., Chen, M., Filipiak, M., Read, W. G., Waters, J. W., and Wu, D. L.: Short circuit of water vapor and polluted air to the global stratosphere by convective transport over the Tibetan Plateau, P. Natl. Acad. Sci. USA, 103, 5664–5669, 2006.
Fueglistaler, S., Bonazzola, M., Haynes, P. H., and Peter, T.: Stratospheric water vapor predicted from the Lagrangian temperature history of air entering the stratosphere in the tropics, J. Geophys. Res.-Atmos., 110, D08107, https://doi.org/10.1029/2004JD005516, 2005.
Fueglistaler, S., Dessler, A. E., Dunkerton, T. J., Folkins, I., Fu, Q., and Mote, P. W.: Tropical tropopause layer, Rev. Geophys., 47, RG1004, https://doi.org/10.1029/2008RG000267, 2009.
Fukuta, N. and Takahashi, T.: The growth of atmospheric ice crystals: a summary of findings in vertical supercooled cloud tunnel studies, J. Atmos. Sci., 56, 1963–1979, 1999.
Gallagher, M. W., Connolly, P. J., Crawford, I., Heymsfield, A., Bower, K. N., Choularton, T. W., Allen, G., Flynn, M. J., Vaughan, G., and Hacker, J.: Observations and modelling of microphysical variability, aggregation and sedimentation in tropical anvil cirrus outflow regions, Atmos. Chem. Phys., 12, 6609–6628, https://doi.org/10.5194/acp-12-6609-2012, 2012.
Gasparini, B., Sokol, A. B., Wall, C. J., Hartmann, D. L., and Blossey, P. N: Diurnal Differences in Tropical Maritime Anvil Cloud Evolution, J. Climate, 35, 1655–1677, 2022.
Gettelman, A. and Forster, P. M. de F.: A climatology of the tropical tropopause layer, J. Meteorol. Soc. Jpn., 80, 911–924, 2002.
Gettelman, A., Hoor, P., Pan, L. L., Randel, W. J., Hegglin, M. I., and Birner, T.: The extratropical upper troposphere and lower stratosphere, Rev. Geophys., 49, RG3003, https://doi.org/10.1029/2011RG000355, 2011.
Grabowski, W. W. and Morrison, H.: Modeling condensation in deep convection, J. Atmos. Sci., 74, 2247–2267, https://doi.org/10.1175/JAS-D-16-0255.1, 2017.
Gryspeerdt, E., Sourdeval, O., Quaas, J., Delanoë, J., Krämer, M., and Kühne, P.: Ice crystal number concentration estimates from lidar–radar satellite remote sensing – Part 2: Controls on the ice crystal number concentration, Atmos. Chem. Phys., 18, 14351–14370, https://doi.org/10.5194/acp-18-14351-2018, 2018.
Haag, W., Kärcher, B., Ström, J., Minikin, A., Lohmann, U., Ovarlez, J., and Stohl, A.: Freezing thresholds and cirrus cloud formation mechanisms inferred from in situ measurements of relative humidity, Atmos. Chem. Phys., 3, 1791–1806, https://doi.org/10.5194/acp-3-1791-2003, 2003.
Harrington, J. Y. and Pokrifka, G. F.: Approximate Models for Lateral Growth on Ice Crystal Surfaces during Vapor Depositional Growth, J. Atmos. Sci., 78, 967–98, https://doi.org/10.1175/JAS-D-20-0307.1, 2021.
Harrington, J. Y., Sulia, K., and Morrison, H.: A Method for Adaptive Habit Prediction in Bulk Microphysical Models. Part II: Parcel Model Corroboration, J. Atmos. Sci., 70, 365–376, https://doi.org/10.1175/JAS-D-12-0152.1, 2013.
Hartmann, D. L., Gasparini, B., Berry, S. E., and Blossey, P. N.: The Life Cycle and Net Radiative Effect of Tropical Anvil Clouds, J. Adv. Model. Earth Sy., 10, 3012–3029, https://doi.org/10.1029/2018MS001484, 2018.
Hashino, T., de Boer, G., Okamoto, H., and Tripoli, G. J.: Relationships between Immersion Freezing and Crystal Habit for Arctic Mixed-Phase Clouds – A Numerical Study, J. Atmos. Sci., 77, 2411–2438, 2020.
Herman, R. L., Ray, E. A., Rosenlof, K. H., Bedka, K. M., Schwartz, M. J., Read, W. G., Troy, R. F., Chin, K., Christensen, L. E., Fu, D., Stachnik, R. A., Bui, T. P., and Dean-Day, J. M.: Enhanced stratospheric water vapor over the summertime continental United States and the role of overshooting convection, Atmos. Chem. Phys., 17, 6113–6124, https://doi.org/10.5194/acp-17-6113-2017, 2017.
Hersbach, H., Bell, B., Berrisford, P., Hirahara, S., Horányi, A., Muñoz-Sabater, J., Nicolas, J., Peubey, C., Radu, R., Schepers, D., Simmons, A., Soci, C., Abdalla, S., Abellan, X., Balsamo, G., Bechtold, P., Biavati, G., Bidlot, J., Bonavita, M., De Chiara, G., Dahlgren, P., Dee, D., Diamantakis, M., Dragani, R., Flemming, J., Forbes, R., Fuentes, M., Geer, A., Haimberger, L., Healy, S., Hogan, R. J., Hólm, E., Janisková, M., Keeley, S., Laloyaux, P., Lopez, P., Lupu, C., Radnoti, G., de Rosnay, P., Rozum, I., Vamborg, F., Villaume, S., and Thépaut, J.-N.: The ERA5 Global Reanalysis, Q. J. Roy. Meteor. Soc., 146, 730, 1999–2049, https://doi.org/10.1002/qj.3803, 2020.
Heymsfield, A. and Wright, R.: Graupel and hail terminal velocities: Does a “supercritical” Reynolds number apply?, J. Atmos. Sci., 71, 3392–3403, https://doi.org/10.1175/JAS-D-14-0034.1, 2014.
Heymsfield, A. J. and Miloshevich, L. M.: Parameterizations for the cross-sectional area and extinction of cirrus and stratiform ice cloud particles, J. Atmos. Sci., 60, 936–956, 2003.
Heymsfield, A. J., Lewis, S., Bansemer, A., Iaquinta, J., Miloshevich, L. M., Kajikawa, M., Twohy, C., and Poellot, M. R.: A general approach for deriving the properties of cirrus and stratiform ice cloud particles, J. Atmos. Sci., 59, 3–29, 2002.
Heymsfield, A. J., Krämer, M., Luebke, A., Brown, P., Cziczo, D. J., Franklin, C., Lawson, P., Lohmann, U., McFarquhar, G., Ulanowski, Z., and Tricht, K. V.: Cirrus Clouds, Meteor. Mon., 58, 2.1–2.26, https://doi.org/10.1175/amsmonographs-d-16-0010.1, 2017.
Holton, J. R. and Gettelman, A.: Horizontal transport and the dehydration of the stratosphere, Geophys. Res. Lett., 28, 2799–2802, 2001.
Homeyer, C. R., McAuliffe, J. D., and Bedka, K. M.: On the Development of Above-Anvil Cirrus Plumes in Extratropical Convection, J. Atmos. Sci., 74, 1617–1633, https://doi.org/10.1175/JAS-D-16-0269.1, 2017.
Iacono, M. J., Delamere, J. S., Mlawer, E. J., Shephard, M. W., Clough, S. A., and Collins, W. D.: Radiative forcing by long-lived greenhouse gases: Calculations with the AER radiative transfer models, J. Geophys. Res., 113, D13103, https://doi.org/10.1029/2008JD009944, 2008.
Ivanova, D., Mitchell, D. L., Arnott, W. P., and Poellot, M.: A GCM parameterization for bimodal size spectra and ice mass removal rates in mid-latitude cirrus clouds, Atmos. Res., 59, 89–113, 2001.
Janjic, Z.: Nonsingular implementation of the Mellor–Yamada level 2.5 scheme in the NCEP Meso model, National Centers for Environmental Prediction, USA, Office Note No. 437, https://repository.library.noaa.gov/view/noaa/11409 (last access: 16 February 2023), 2002.
Järvinen, E., Jourdan, O., Neubauer, D., Yao, B., Liu, C., Andreae, M. O., Lohmann, U., Wendisch, M., McFarquhar, G. M., Leisner, T., and Schnaiter, M.: Additional global climate cooling by clouds due to ice crystal complexity, Atmos. Chem. Phys., 18, 15767–15781, https://doi.org/10.5194/acp-18-15767-2018, 2018.
Jensen, A. and Harrington, J.: Modeling ice crystal aspect ratio evolution during riming: A single-particle growth model, J. Atmos. Sci., 72, 2569–2590, https://doi.org/10.1175/JAS-D-14-0297.1, 2015.
Jensen, A. A., Harrington, J. Y., Morrison, H., and Milbrandt, J. A.: Predicting Ice Shape Evolution in a Bulk Microphysics Model, J. Atmos. Sci., 74, 2081–2104, https://doi.org/10.1175/JAS-D-16-0350.1, 2017.
Jensen, E., Diskin, G., Lawson, Lance, P., S., Bui, T., Hlavka, D., McGill, M., Pfister, L., Toon, O., and Gao, R.: Ice nucleation and dehydration in the Tropical Tropopause Layer, P. Natl. Acad. Sci. USA, 110, 2041–2046, https://doi.org/10.1073/pnas.1217104110, 2013.
Jensen, E. J., Toon, O. B., Selkirk, H. B., Spinhirne, J. D., and Schoeberl, M. R.: On the formation and persistence of subvisible cirrus clouds near the tropical tropopause, J. Geophys. Res.-Atmos., 101, 21361–21375, https://doi.org/10.1029/95JD03575, 1996.
Jensen, E. J., Lawson, P., Baker, B., Pilson, B., Mo, Q., Heymsfield, A. J., Bansemer, A., Bui, T. P., McGill, M., Hlavka, D., Heymsfield, G., Platnick, S., Arnold, G. T., and Tanelli, S.: On the importance of small ice crystals in tropical anvil cirrus, Atmos. Chem. Phys., 9, 5519–5537, https://doi.org/10.5194/acp-9-5519-2009, 2009.
Jiang, J. H., Su, H., Zhai, C., Perun, V. S., Del Genio, A., Nazarenko, L. S., Donner, L. J., Horowitz, L., Seman, C., Cole, J., Gettelman, A., Ringer, M. A., Rotstayn, L., Jeffrey, S., Wu, T., Brient, F., Dufresne, J.-L., Kawai, H., Koshiro, T., Watanabe, M., L'Écuyer, T. S., Volodin, E. M., Iversen, T., Drange, H., Mesquita, M. D. S., Read, W. G., Waters, J. W., Tian, B., Teixeira, J., and Stephens, G. L.: Evaluation of cloud and water vapor simulations in CMIP5 climate models using NASA “A-Train” satellite observations, J. Geophys. Res., 117, D14105, https://doi.org/10.1029/2011JD017237, 2012.
Jiang, Z., Verlinde, J., Clothiaux, E., Aydin, K., and Schmitt, C.: Shapes and Fall Orientations of Ice Particle Aggregates, J. Atmos. Sci., 76, 1903–1916, https://doi.org/10.1175/JAS-D-18-0251.1, 2019.
Kajikawa, M. and Heymsfield, A.: Aggregation of ice crystals, J. Atmos. Sci., 46, 3108–3121, 1989.
Kärcher, B.: Supersaturation Fluctuations in Cirrus Clouds Driven by Colored Noise, J. Atmos. Sci., 69, 435–443, 2012.
Key, J. R., Yang, P., Baum, B. A., and Nasiri, S. L.: Parameterization of shortwave ice cloud optical properties for various particle habits, J. Geophys. Res., 107, 4181, https://doi.org/10.1029/2001JD000742, 2002.
Khaykin, S., Pommereau, J.-P., Korshunov, L., Yushkov, V., Nielsen, J., Larsen, N., Christensen, T., Garnier, A., Lukyanov, A., and Williams, E.: Hydration of the lower stratosphere by ice crystal geysers over land convective systems, Atmos. Chem. Phys., 9, 2275–2287, https://doi.org/10.5194/acp-9-2275-2009, 2009.
Khaykin, S. M., Moyer, E., Krämer, M., Clouser, B., Bucci, S., Legras, B., Lykov, A., Afchine, A., Cairo, F., Formanyuk, I., Mitev, V., Matthey, R., Rolf, C., Singer, C. E., Spelten, N., Volkov, V., Yushkov, V., and Stroh, F.: Persistence of moist plumes from overshooting convection in the Asian monsoon anticyclone, Atmos. Chem. Phys., 22, 3169–3189, https://doi.org/10.5194/acp-22-3169-2022, 2022.
Koop, T., Luo, B., Tsias, A., and Peter, T.: Water activity as the determinant for homogeneous ice nucleation in aqueous solutions, Nature, 406, 611–614, 2000.
Krämer, M., Rolf, C., Luebke, A., Afchine, A., Spelten, N., Costa, A., Meyer, J., Zöger, M., Smith, J., Herman, R. L., Buchholz, B., Ebert, V., Baumgardner, D., Borrmann, S., Klingebiel, M., and Avallone, L.: A microphysics guide to cirrus clouds – Part 1: Cirrus types, Atmos. Chem. Phys., 16, 3463–3483, https://doi.org/10.5194/acp-16-3463-2016, 2016.
Krämer, M., Rolf, C., Spelten, N., Afchine, A., Fahey, D., Jensen, E., Khaykin, S., Kuhn, T., Lawson, P., Lykov, A., Pan, L. L., Riese, M., Rollins, A., Stroh, F., Thornberry, T., Wolf, V., Woods, S., Spichtinger, P., Quaas, J., and Sourdeval, O.: A microphysics guide to cirrus – Part 2: Climatologies of clouds and humidity from observations, Atmos. Chem. Phys., 20, 12569–12608, https://doi.org/10.5194/acp-20-12569-2020, 2020.
Lamraoui, F.: Sensitivity of convectively driven tropical tropopause cirrus to ice habit, Harvard Dataverse, V1 [data set], https://doi.org/10.7910/DVN/PKDDEI, 2023.
Lamraoui, F., Booth, J. F., and Naud, C. M.: WRF Hindcasts of Cold Front Passages over the ARM Eastern North Atlantic Site: A Sensitivity Study, Mon. Weather Rev., 146, 2417–2432, https://doi.org/10.1175/MWR-D-17-0281.1, 2018.
Lawson, R. P., Baker, B. A., Pilson, B., and Mo, Q.: In Situ observations of the microphysical properties of wave, cirrus and anvil clouds. Part II: Cirrus clouds, J. Atmos. Sci., 63, 3186–3203, 2006.
Lawson, R. P., Jensen, E., Mitchell, D. L., Baker, B., Mo, Q., and Pilson, B.: Microphysical and radiative properties of tropical clouds investigated in TC4 and NAMMA, J. Geophys. Res., 115, D00J08, https://doi.org/10.1029/2009JD013017, 2010.
Lawson, R. P., Woods, S., Jensen, E., Erfani, E., Gurganus, C., Gallagher, M., Connolly, P., Whiteway, J., Baran, A. J., May, P., Heymsfield, A., Schmitt, C. G., McFarquhar, G., Um, J., Protat, A., Bailey, M., Lance, S., Muehlbauer, A., Stith, J., Korolev, A., Toon, O. B., and Krämer, M.: A Review of Ice Particle Shapes in Cirrus formed In Situ and in Anvils, J. Geophys. Res.-Atmos., 124, 10049–10090, https://doi.org/10.1029/2018JD030122, 2019.
Legras, B. and Bucci, S.: Confinement of air in the Asian monsoon anticyclone and pathways of convective air to the stratosphere during the summer season, Atmos. Chem. Phys., 20, 11045–11064, https://doi.org/10.5194/acp-20-11045-2020, 2020.
Lin, Y. and Colle, B. A.: The 4–5 December 2001 IMPROVE-2 Event: Observed Microphysics and Comparisons with the Weather Research and Forecasting Model, Mon. Weather Rev., 137, 1372–1392, 2009.
Lin, Y.-L., Farley, R. D., and Orville, H. D.: Bulk Parameterization of the Snow Field in a Cloud Model, J. Climate Appl. Meteor., 22, 1065–1092, 1983.
Liu, H. L., Wang, P. K., and Schlesinger, R. E.: A numerical study of cirrus clouds. Part II: Effects of ambient temperature, stability, radiation, ice microphysics, and microdynamics on cirrus evolution, J. Atmos. Sci., 60, 1097–1119, 2003a.
Liu, H. L., Wang, P. K., and Schlesinger, R. E.: A numerical study of cirrus clouds. Part I: Model description, J. Atmos. Sci., 60, 1075–1084, 2003b.
Luebke, A. E., Afchine, A., Costa, A., Grooß, J.-U., Meyer, J., Rolf, C., Spelten, N., Avallone, L. M., Baumgardner, D., and Krämer, M.: The origin of midlatitude ice clouds and the resulting influence on their microphysical properties, Atmos. Chem. Phys., 16, 5793–5809, https://doi.org/10.5194/acp-16-5793-2016, 2016.
Manney, G. L., Hegglin, M. I., Daffer, W. H., Schwartz, M. J., Santee, M. L., and Pawson, S.: Climatology of Upper Tropospheric-Lower Stratospheric (UTLS) Jets and Tropopauses in MERRA, J. Climate, 27, 3248–3271, https://doi.org/10.1175/JCLI-D-13-00243.1, 2014.
Miguez-Macho, G., Stenchikov, G. L., and Robock, A.: Spectral nudging to eliminate the effects of domain position and geometry in regional climate model simulations, J. Geophys. Res.-Atmos., 109, D13104, https://doi.org/10.1029/2003JD004495, 2004.
Milbrandt, J. A. and Morrison, H.: Parameterization of cloud microphysics based on the prediction of bulk ice particle properties. Part III: Introduction of multiple free categories, J. Atmos. Sci., 73, 975–995, https://doi.org/10.1175/JAS-D-15-0204.1, 2016.
Milbrandt, J. A. and Yau, M. K.: A multimoment bulk microphysics parameterization. Part II: A proposed three-moment closure and scheme description, J. Atmos. Sci., 62, 3065–3081, https://doi.org/10.1175/JAS3535.1, 2005.
Milbrandt, J. A., Morrison, H., Dawson II, D. T., and Paukert, M.: A triple-moment representation of ice in the Predicted Particle Properties (P3) microphysics scheme, J. Atmos. Sci., 78, 439–458, 2021.
Mitchell, D. L., Macke, A., and Liu, Y.: Modeling cirrus clouds, part II, Treatment of radiative properties, J. Atmos. Sci., 53, 2967–2988, 1996.
Mitchell, D. L., Rasch, P., Ivanova, D., McFarquhar, G., and Nousianen, T.: The impact of small ice crystal assumptions on sedimentation rates and GCM simulations, Geophys. Res. Lett., 35, L09806, https://doi.org/10.1029/2008GL033552, 2008.
Morrison, H. and Grabowski, W. W.: Modeling supersaturation and sub-grid scale mixing with two-moment warm bulk microphysics, J. Atmos. Sci., 65, 792–812, 2008.
Morrison, H. and Milbrandt, J. A.: Parameterization of cloud microphysics based on the prediction of bulk ice particle properties. Part I: Scheme description and idealized tests, J. Atmos. Sci., 72, 287–311, 2015.
Morrison, H., Thompson, G., and Tatarskii, V.: Impact of cloud microphysics on the development of trailing stratiform precipitation in a simulated squall line: comparison of one- and two-moment schemes, Mon. Weather Rev., 137, 991–1007, https://doi.org/10.1175/2008MWR2556.1, 2009.
Morrison, H., Morales, A., and Villanueva-Birriel, C.: Concurrent sensitivities of an idealized deep convective storm to parameterization of microphysics, horizontal grid resolution, and environmental static stability, Mon. Weather Rev., 143, 2082—2104, https://doi.org/10.1175/MWR-D-14-00271.1, 2015.
Phillips, V. T., Formenton, M., Bansemer, A., Kudzotsa, I., and Lienert, B.: A parameterization of sticking efficiency for collisions of snow and graupel with ice crystals: Theory and comparison with observations, J. Atmos. Sci., 72, 4885–4902, https://doi.org/10.1175/JAS-D-14-0096.1, 2015.
Ploeger, F., Gottschling, C., Griessbach, S., Grooß, J.-U., Guenther, G., Konopka, P., Müller, R., Riese, M., Stroh, F., Tao, M., Ungermann, J., Vogel, B., and von Hobe, M.: A potential vorticity-based determination of the transport barrier in the Asian summer monsoon anticyclone, Atmos. Chem. Phys., 15, 13145–13159, https://doi.org/10.5194/acp-15-13145-2015, 2015.
Pokrifka, G., Moyle, A., Hanson, L., and Harrington, J.: Estimating surface attachment kinetic and growth transition influences on vapor-grown ice crystalsm J. Atmos. Sci., 77, 2393–2410, https://doi.org/10.1175/JAS-D-19-0303.1, 2020.
Powers, J. G., Klemp, J. B., Skamarock, W. C., Davis, C. A., Dudhia, J., Gill, D. O., Coen, J. L., Gochis, D. J., Ahmadov, R., Peckham, S. E., Grell, G. A., Michalakes, J., Trahan, S., Benjamin, S. G., Alexander, C. R., Dimego, G. J., Wang, W., Schwartz, C. S., Romine, G. S., Liu, Z. Q., Snyder, C., Chen, F., Barlage, M. J., Yu, W., and Duda, M. G.: The Weather Research and Forecasting Model: Overview, System Efforts, and Future Directions, B. Am. Meteorol. Soc., 98, 1717–1737, https://doi.org/10.1175/Bams-D-15-00308.1, 2017.
Pruppacher, H. R. and Klett, J. D.: Microstructure of Atmospheric Clouds and Precipitation, in: Microphysics of Clouds and Precipitation. Atmospheric and Oceanographic Sciences, vol. 18, Springer, Dordrecht, ISBN 978-0-306-48100-0, https://doi.org/10.1007/978-0-306-48100-0_2, 2010.
Przybylo, V. M., Sulia, K. J., Schmitt, C. G., Lebo, Z. J., and May, W. C.: The ice Particle and Aggregate Simulator (IPAS). Part I: Extracting dimensional properties of ice-ice aggregates for microphysical parameterization, J. Atmos. Sci., 76, 1661–1676, https://doi.org/10.1175/JAS-D-18-0187.1, 2019.
Przybylo, V. M., Sulia, K. J., Lebo, Z. J., and Schmitt, C. G: The Ice Particle and Aggregate Simulator (IPAS). Part II: Analysis of a Database of Theoretical Aggregates for Microphysical Parameterization, J. Atmos. Sci., 79, 1633–1649, 2022a.
Przybylo, V. M., Sulia, K. J., Lebo, Z. J., and Schmitt, C. G: The Ice Particle and Aggregate Simulator (IPAS). Part III: Verification and Analysis of Ice–Aggregate and Aggregate–Aggregate Collection for Microphysical Parameterization, J. Atmos. Sci., 79, 1651–1667, 2022b.
Ramaswamy, V. and Ramanathan, V.: Solar Absorption by Cirrus Clouds and the Maintenance of the Tropical Upper Troposphere Thermal Structure, J. Atmos. Sci., 46, 2293–2310, 1989.
Randel, W. J., Wu, F., Vomel, H., Nedoluha, G. E., and Forster, P.: Decreases in stratospheric water vapor after 2001: Links to changes in the tropical tropopause and the Brewer–Dobson circulation, J. Geophys. Res., 111, D12312, https://doi.org/10.1029/2005JD006744, 2006.
Sanderson, B. M., Piani, C., Ingram, W. J., Stone, D. A., and Allen, M. R.: Towards constraining climate sensitivity by linear analysis of feedback patterns in thousands of perturbed-physics GCM simulations, Clim. Dynam., 30, 2–3, https://doi.org/10.1007/s00382-007-0280-7, 2008.
Sassen, K., Wang, Z., and Liu, D.: Global distribution of cirrus clouds from CloudSat/Cloud-Aerosol Lidar and Infrared Pathfinder Satellite Observations (CALIPSO) measurements, J. Geophys. Res.-Atmos., 113, D00A12, https://doi.org/10.1029/2008JD009972, 2008.
Sassen, K., Wang, Z., and Liu, D.: Cirrus clouds and deep convection in the tropics: Insights from CALIPSO and CloudSat, J. Geophys. Res., 114, D00H06, https://doi.org/10.1029/2009JD011916, 2009.
Schiller, C., Kramer, M., Afchine, A., Spelten, N., and Sitnikov, N.: The ice water content of Arctic, mid latitude and tropical cirrus, J. Geophys. Res., 113, D24208, https://doi.org/10.1029/2008JD010342, 2008.
Schiller, C., Grooß, J.-U., Konopka, P., Plöger, F., Silva dos Santos, F. H., and Spelten, N.: Hydration and dehydration at the tropical tropopause, Atmos. Chem. Phys., 9, 9647–9660, https://doi.org/10.5194/acp-9-9647-2009, 2009.
Schmitt, C. and Heymsfield, A. J.: The dimensional characteristics of ice crystal aggregates from fractal geometry, J. Atmos. Sci., 67, 1605–1616, 2010.
Schmitt, C. G. and Heymsfield, A. J.: Observational quantification of the separation of simple and complex atmospheric ice particles, Geophys. Res. Lett., 41, 1301–1307, 2014.
Schmitt, C. G., Heymsfield, A. J., Connolly, P., Järvinen, E., and Schnaiter, M.: A global view of atmospheric ice particle complexity, Geophys. Res. Lett., 43, 11913–11920, https://doi.org/10.1002/2016GL071267, 2016.
Schoeberl, M. R., Jensen, E. J., Pfister, L., Ueyama, R., Avery, M., and Dessler, A. E.: Convective Hydration of the Upper Troposphere and Lower Stratosphere, J. Geophys. Res.-Atmos., 123, 4583–4593, https://doi.org/10.1029/2018JD028286, 2018.
Sherwood, S. C. and Dessler, A. E.: On the control of stratospheric humidity, Geophys. Res. Lett., 27, 2513–2516, 2000.
Sherwood, S. C. and Dessler, A. E.: A model for transport across the tropical tropopause, J. Atmos. Sci., 58, 765–779, 2001.
Sherwood, S. C., Ramanathan, V., Barnett, T. P., Tyree, M. K., and Roeckner, E.: Response of an atmospheric general circulation model to radiative forcing of tropical clouds, J. Geophys. Res., 99, 20829–20845, 1994.
Shin, H. H. and Hong, S.-Y.: Representation of the subgrid-scale turbulent transport in convective boundary layers at gray-zone resolutions, Mon. Weather Rev., 143, 250–271, https://doi.org/10.1175/MWR-D-14-00116.1, 2015.
Shur, G. H., Sitnikov, N. M., and Drynkov, A. V.: A mesoscale structure of meteorological fields in the tropopause layer and in the lower stratosphere over the Southern tropics (Brazil), Russ. Meteorol. Hydrol., 32, 487–494, https://doi.org/10.3103/S106837390708002X, 2007.
Skamarock, W. C. and Klemp, J. B.: A time-split nonhydrostatic atmospheric model for weather research and forecasting applications, J. Comp. Phys., 227, 3465–3485, https://doi.org/10.1016/j.jcp.2007.01.037, 2008.
Smith, J. B., Wilmouth, D. M., Bedka, K. M., Bowman, K. P., Homeyer, C. R., Dykema, J. A., Sargent, M. R., Clapp, C. E., Leroy, S. S., Sayres, D. S., Dean-Day, J. M., Bui, T. P., and Anderson, J. G.: A case study of convectively sourced water vapor observed in the overworld stratosphere over the United States, J. Geophys. Res.-Atmos., 122, 9529–9554, https://doi.org/10.1002/2017jd026831, 2017.
Sokol, A. B. and Hartmann, D. L.: Tropical anvil clouds: Radiative driving toward a preferred state. J. Geophys. Res.-Atmos., 125, e2020JD033107, https://doi.org/10.1029/2020JD033107, 2020.
Solomon, S., Rosenlot, K. H., Portmann, R. W., Daniel, J. S., Davis, S. M., Sanford, T. J., and Plattner, G.-K.: Contributions of stratospheric water vapor to decadal changes in the rate of global warming, Science, 327, 1219–1223, 2010.
Sourdeval, O., Gryspeerdt, E., Krämer, M., Goren, T., Delanoë, J., Afchine, A., Hemmer, F., and Quaas, J.: Ice crystal number concentration estimates from lidar–radar satellite remote sensing – Part 1: Method and evaluation, Atmos. Chem. Phys., 18, 14327–14350, https://doi.org/10.5194/acp-18-14327-2018, 2018.
Stephens, G. L., Vane, D. G., Boain, R. J., Mace, G. G., Sassen, K., Wang, Z., Illingworth, A. J., O'Conner, E. J., Rossow, W. G., Durden, S. L., Miller, S. D., Austin, R. T., Benedetti, A., and Mitrescu, C.: The CloudSat mission and the A-Train, B. Am. Meteorol. Soc., 83, 1771–1790, 2002.
Stohl, A., Bonasoni, P., Cristofanelli, P., Collins, W. J., Feichter, J., Frank, A., Forster, C., Gerasopoulos, E., Gäggeler, H., James, P., Kentarchos, T., Kromp-Kalb, H., Krüger, B., Land, C., Meloen, J., Papayannis, A., Priller, A., Seibert, P., Sprenger, M., Roelofs, G. J., Scheel, H. E., Schnabel, C., Siegmund, P., Tobler, L., Trickl, T., Wernli, H., Wirth, V., Zanis, P., and Zerefos, C.: Stratosphere-troposphere exchange: A review, and what we have learned from STACCATO, J. Geophys. Res., 108, 8516, https://doi.org/10.1029/2002JD002490, 2003.
Sulia, K. J., Harrington, J. Y., and Morrison, H.: A method for adaptive habit prediction in bulk microphysical models. Part III: Applications and studies within a two-dimensional kinematic model, J. Atmos. Sci., 70, 3302–3320, https://doi.org/10.1175/JAS-D-12-0316.1, 2013.
Sulia, K. J., Lebo, Z. J., Przybylo, V. M., and Schmitt, C. G: A New Method for Ice–Ice Aggregation in the Adaptive Habit Model, J. Atmos. Sci., 78, 133–154, 2021.
Takano, Y. and Liou, K. N.: Solar radiative transfer in cirrus clouds. I. Single-scattering and optical properties of hexagonal ice crystals, J. Atmos. Sci., 46, 3–19, 1989.
Tewari, M., Chen, F., Wang, W., Dudhia, J., LeMone, M., Mitchell, K., Ek, M., Gayno, G., Wegiel, J., and Wegiel, J.: Implementation and verification of the unified NOAH land surface model in the WRF model (Formerly Paper Number 17.5), in: Proceedings of the 20th Conference on Weather Analysis and Forecasting, 16th Conference on Numerical Weather Prediction, 14 January 2004, Seattle, WA, USA, 11–15, abstract no. 14.2a, http://n2t.net/ark:/85065/d7fb523p (last access: 5 December 2022), 2004.
Thompson, G. and Eidhammer, T.: A study of aerosol impacts on clouds and precipitation development in a large winter cyclone, J. Atmos. Sci., 71, 3636–3658, 2014.
Thompson, G., Field, P. R., Rasmussen, R. M., and Hall, W. D.: Explicit forecasts of winter precipitation using an improved bulk microphysics scheme, Part II: Implementation of a new snow parameterization, Mon. Weather Rev., 136, 5095–5115, 2008.
Tissier, A.-S. and Legras, B.: Convective sources of trajectories traversing the tropical tropopause layer, Atmos. Chem. Phys., 16, 3383–3398, https://doi.org/10.5194/acp-16-3383-2016, 2016.
Ueyama, R., Jensen, E. J., and Pfister, L.: Convective Influence on the Humidity and Clouds in the Tropical Tropopause Layer During Boreal Summer, J. Geophys. Res.-Atmos., 123, 7576–7593, https://doi.org/10.1029/2018JD028674, 2018.
UCAR: WRF, University Corporation for Atmospheric Research (UCAR) [code], https://www2.mmm.ucar.edu/wrf/users/download/, last access: 5 December 2022.
Waliser, D. E., Li, J. L. F., Woods, C. P., Austin, R. T., Bacmeister, J., Chern, J., Del Genio, A., Jiang, J. H., Kuang, Z. M., Meng, H., Minnis, P., Platnick, S., Rossow, W. B., Stephens, G. L., SunMack, S., Tao, W. K., Tompkins, A. M., Vane, D. G., Walker, C., and Wu, D.: Cloud ice: A climate model challenge with signs and expectations of progress, J. Geophys. Res., 114, D00A21, https://doi.org/10.1029/2008JD010015, 2009.
Winker, D. M., Vaughan, M. A., Omar, A. H., Hu, Y., Powell, K. A., Liu, Z., Hunt, W. H., and Young, S. A.: Overview of the CALIPSO Mission and CALIOP Data Processing Algorithms, J. Atmos. Ocean. Tech., 26, 2310–2323, 2009.
Wright, J. S., Fu, R., Fueglistaler, S., Liu, Y. S., and Zhang, Y.: The influence of summertime convection over Southeast Asia on water vapor in the tropical stratosphere, J. Geophys. Res., 116, D12302, https://doi.org/10.1029/2010JD015416, 2011.
Yang, P. and Liou, K. N.: Geometric-optics – integral-equation method for light scattering by nonspherical ice crystals, Appl. Optics, 35, 6568–6584, 1996.
Zhang, C. and Wang, Y.: Projected Future Changes of Tropical Cyclone Activity over the Western North and South Pacific in a 20-km-Mesh Regional Climate Model, J. Climate, 30, 5923–5941, https://doi.org/10.1175/JCLI-D-16-0597.1, 2017.
Zhao, Y., Mace, G. G., and Comstock, J. M.: The Occurrence of Particle Size Distribution Bimodality in Midlatitude Cirrus as Inferred from Ground-Based Remote Sensing Data, J. Atmos. Sci., 68, 1162–1177, https://doi.org/10.1175/2010JAS3354.1, 2011.