the Creative Commons Attribution 4.0 License.
the Creative Commons Attribution 4.0 License.
 | 09 Feb 2023
Atmospheric nanoparticles hygroscopic growth measurement by a combined surface plasmon resonance microscope and hygroscopic tandem differential mobility analyzer
Zhibo Xie
Huaqiao Gui
Yang Liu
Bo Yang
Haosheng Dai
Hang Xiao
Douguo Zhang
Da-Ren Chen
Jianguo Liu
The hygroscopic growth of atmospheric aerosols plays an important role in regional radiation, cloud formation, and hence climate. Aerosol hygroscopic growth is often characterized by hygroscopic tandem differential mobility analyzers (HTDMAs), and Xie et al. (2020) recently demonstrated that hygroscopic growth measurements of a single particle are possible using a surface plasmon resonance microscope-azimuthal rotation illumination (SPRM-ARI). The hygroscopic properties of ambient aerosols are not uniform and often exhibit large relative humidity (RH) and size variabilities due to different chemical compositions and mixing states. To better understand the contribution of different aerosol components and establish a link between the apparent hygroscopic properties of single particles and bulk aerosols, we conduct combined hygroscopic growth measurements using a SPRM-ARI and an HTDMA as a case study to prove the concept (experimental information: 100–200 nm, during noontime on 28 September 2021 and 22 March 2022 in Hefei, China). According to the distinct hygroscopic growth behavior from single-particle probing using a SPRM-ARI, the individual particles can be classified into three categories defined as non-hygroscopic (NH), less hygroscopic (LH), and more hygroscopic (MH). The mean growth factor (GF) of the three categories can be utilized to reproduce the GF distribution obtained from the HTDMA measurement. The chemical compositions of individual particles from the three categories are identified to be organic carbon (OC), soot (mainly elemental carbon), fly ash, and secondary aerosols (mainly OC and sulfate), using scanning electron microscopy (SEM) with an energy-dispersive spectrometer (EDS). The coupled SPRM–HTDMA measurement suggests a size-dependent variation of aerosol chemical components, i.e., an increase of OC fraction with increasing particle sizes, which agrees reasonably well with the chemical compositions from collected aerosol samples. This likely links the hygroscopic properties of individual particles to their bulk hygroscopic growth and chemical composition.
- Article
(2482 KB) - Full-text XML
-
Supplement
(4885 KB) - BibTeX
- EndNote


The hygroscopic growth of aerosol particles plays an important role in global climate directly by scattering or absorbing incoming solar radiation and indirectly by acting as cloud condensation nuclei and/or ice nuclei (Abbatt et al., 2005; Sloane and Wolff, 1985; Penner et al., 1993). The atmospheric aerosol hygroscopic properties are directly related to their chemical composition and mixing state, which shows pronounced size dependence and temporal variability (Pilinis et al., 1995; Tan et al., 2017). Atmospheric particles are intrinsically internal or external mixtures with inorganic and organic species, and their chemical mixing state is of vital importance to understand their complex physicochemical properties (Krieger et al., 2012; Agarwal et al., 2010). As a result, the aerosol hygroscopic growth factor (GF), which is defined as the ratio of the particle size at a specified relative humidity (RH) to its dry size, is not necessarily uniform but spreads among particles of the same size (Su et al., 2010).
Understanding the complexity of the hygroscopic response on aerosol physicochemical states (e.g., size, composition, phase, and morphology) motivates the necessity to examine the particle hygroscopicity individually (Li et al., 2017; Mikhailov et al., 2015). The hygroscopic properties of individual particles can be examined using various optical imaging techniques, in the form of particles deposited on substrates and levitated particles (Hiranuma et al., 2008; Lv et al., 2018; Peng et al., 2001; Tang et al., 2019). For example, the substrate deposition imaging by traditional 2D imaging methods (e.g., Raman spectroscopy; environmental scanning electron microscopy, ESEM; surface-enhanced Raman spectroscopy) is vertical view mode and will be affected by the imaging angle and orientation (Ebert et al., 2002; Gupta et al., 2015; Craig et al., 2015; Gen and Chan, 2017). The particle imaging by the current 3D method (i.e., atomic force microscopy) requires scanning the imaging particle for a long time, resulting in a long measurement time and increased chances of particle puncture by the scanning probe (Harmon et al., 2010; Morris et al., 2015, 2016). On the other hand, the levitation imaging methods (i.e., electric balance, optical tweezers) are limited for particles with sizes larger than 500 nm, which represent only a very small fraction of particles in the atmosphere (Krieger, et al., 2012).
To extend the application of single-particle techniques to nano-sized particles, a high surface sensitivity imaging technique has been proposed using a surface plasmon resonance microscopy with azimuthal rotation illumination (SPRM-ARI, Kuai et al., 2019). With increased SPRM resolution, it can distinguish the size change of particles smaller than the diffraction limit of the illumination light, allowing for detection of 50 nm polystyrene latex (PSL) particles (Kuai et al., 2019). The SPRM can continuously perform the imaging measurements of single binding events (Wang et al., 2010; Syal et al., 2016), and the light intensity is directly related to the volume of the object (without the photo bleaching and fluorophore scintillation) (Young et al., 2018; Halpern et al., 2014; Wang et al., 2012). Besides, the influence of the RH on SPRM is very minor; i.e., the imaging is not affected by the water vapor on the imaging particle surface (Fang et al., 2016). Therefore, this SPRM-ARI imaging method has already been applied to the hygroscopic growth measurement of 90 nm lab-generated particles (Kuai et al., 2020; Xie et al., 2020).
In this work, the SPRM-ARI imaging method was used in combination with an HTDMA system to characterize the hygroscopic growth of atmospheric nanoparticles with sizes of 100, 150, and 200 nm. By combining the results from the HTDMA and the SPRM-ARI, we classify the individual particles into three modes depending on their distinct hygroscopic growth behaviors and subsequently reconstruct the HTDMA measured GF distribution. The chemical composition of individual particles were quantified using scanning electron microscopy (SEM) with an energy-dispersive spectrometer (EDS), and a chemical closure study is conducted for individual and bulk aerosol particles.
2.1 Atmospheric nanoparticle collection and chemical analysis
The collection of atmospheric nanoparticles was conducted at the Hefei Institute of Physical Science (Fig. S1 in the Supplement), Chinese Academy of Sciences, in Hefei, China (31∘54′31′′ N, 117∘9′36′′ E), at noon of 28 September 2021 and 22 March 2022. As shown in Fig. S1, the site is located in the northwest of the city, where both high-temperature heat sources (thermal power plants) and residential areas are present. The collected nanoparticles can be considered as representative nanoparticles of inland cities in China.

Figure 1Schematic diagram of the SPRM-ARI single nanoparticle moisture absorption system: (a) for the complete system setup and (b) for the gold-coated glass substrate used for SPRM-ARI.
As shown in Fig. 1a, the sampled aerosols were first introduced to a diffusion dryer (TSI 3062), and particles with electrical mobility sizes of 100, 150, and 200 nm were selected using a differential mobility analyzer (DMA) (TSI 3081). The atmospheric nanoparticle size distribution during the sampling period of the above two days was shown in Fig. S2.
For atmospheric nanoparticles on 28 September 2021, classified particles were collected on the substrate surface in the sample cell. Two types of substrates of the same size were used: one with the 45 nm thickness gold coating, which is used for the SPRM-ARI hygroscopic growth measurement, and the other one with the commercial silicon wafer used for the SEM measurement. The gold-coated surface (with thickness deviation of ±5 % within a 26.8 cm2 area) was prepared by an e-beam evaporator (Kurt J. Lesker Company, Lab 18) on a standard microscope cover glass (thickness: 0.17 mm) at a vacuum pressure of < 10−3 mTorr. The size and element distributions of atmospheric nanoparticles were measured by the SEM instrument (SU8220, Hitachi, Japan) with an EDS (Aztec, Oxford, UK).
For atmospheric nanoparticle on 22 March 2022, besides the gold coating substrate, the nanoparticles classified by DMA were also collected using a quartz filter (Tisch Environmental TE-20-301QZ). The sampling flow was 1.5 L min−1, and the collected nanoparticles were used for organic carbon (OC), elemental carbon (EC), and SO content measurement. The content of OC and EC were measured by the traditional thermal-optical analysis (Chow et al., 2004). In the environment of pure gas He and mixed gas He O2, the quartz filter membrane was heated following a pre-set temperature gradient, and the CO2 produced by catalytic oxidation was quantitatively analyzed by a laser detector (Ding et al., 2014). For the SO measurement, the quartz filter membranes with atmospheric nanoparticles were extracted with organic-free Milli-Q water (Direct-Q3, Millipore) using an ultrasonic bath for 20 min, and the content of SO in the extract was measured by ion chromatography (ICS-3000, Dionex). The concentration of OC, EC, and SO reported here were corrected by the blank membrane, and the concentration was converted into µg m−3.
2.2 SPRM-ARI hygroscopicity measurement system
As shown in Fig. 1a, a dynamic RH-controlling element, which consists of a Nafion dryer, a Nafion humidifier (Perma Pure, USA), and a proportional–integral–differential (PID) controller, was employed to control the RH in the sample cell (Dai et al., 2022). By conditioning particle-free air through the Nafion dryer and humidifier, dry air (i.e., ∼ 5 % RH) and humid air (i.e., ∼ 95 %) are generated and mixed through a three-way solenoid valve. The mixing ratio of dry air to humid air is adjusted to equilibrate the mixed flow at the set point RH. The mixed flow is then directed into the sample cell to humidify the DMA-classified atmospheric nanoparticles deposited on the Au-coated surface. The particle deposition and humidification processes were consequently performed via operating a three-way switching valve to reduce the interference of impurities during the growth measurement.
The SPRM-ARI system uses an illumination source of a 635 nm, 54 mW parallel laser. Two orthogonal polarizers are used to eliminate reflected laser signals, allowing the surface plasmon (SP) signals to be collected as far as possible via a charge-coupled device camera (Andor, Neo, UK). Using an objective (100×, numerical aperture (NA) of 1.49; Nikon, Japan) and a pair of scanning galvanometers, the laser beams could be focused on any position in the back focal plane (BFP). In this configuration (as shown in Fig. 1b), the laser beam can rotate around the Au film at a specific angle (θ), which is called the azimuthal rotational illumination. Figure S3 shows the reflection BFP image of the 45 nm Au film. The presence of the symmetrical dark arc on the image verified the existence of the p-polarized SPs. The SP signals of atmospheric nanoparticles on the Au film were recorded as the cell RH was increased. Under the ARI mode, split circular spots are formed if the particle size is less than the diffraction limit. By combining the information of the DMA classification and SEM measurement, the initial sizes of selected atmospheric nanoparticles can be determined (Xie et al., 2020). The statistics of the gray intensity (GI) on the SP images are applied for the SP image processing (Huang et al., 2007). As the GI is directly related to the volume of imaging particles, the GF of the examined particle can be obtained by taking the cubic root of the GI (Kuai et al., 2020).
According to the κ-Köhler theory (Petters and Kreidenweis, 2007; Fan et al., 2020), the hygroscopicity parameter can be calculated using the GF measured by the SPRM-ARI system.
where Gf is the growth factor measured using the SPRM-ARI system, Dd is the dry diameter of the atmospheric particles, RH is the relative humidity in the sample cell (e.g., 84 %), and σs/a is the surface tension of the solution/air interface (i.e., 0.0728 Nm−2). Mw is the molecular weight of water, R is the universal gas constant, T is the absolute temperature (298 K), and ρw is the water density. The deliquescence droplet was selected as the default well-mixed solution.
2.3 HTDMA
A co-located HTDMA was used to measure the hygroscopic growth of atmospheric nanoparticles in a narrow electrical mobility size distribution as those measured using SPRM-ARI. Figure S4 shows the HTDMA setup which consists of a long DMA (TSI 3081), a humidification chamber, and a scanning mobility particle sizer (TSI DMA 3081 and WCPC 3788) system. The sample aerosol is first dried, brought to a steady-state charge distribution in a soft Xray neutralizer, and introduced to the first DMA. The size-classified particles with electrical mobility sizes of 100, 150, and 200 nm are subsequently introduced into a humidifier that conditions the sample flow at the RH set point (i.e., 84 % in this study), and the size distribution of humidified particles is subsequently measured by scanning the voltage of the second DMA.
3.1 Combined SPRM–HTDMA measurements of 100 nm ambient aerosols
Figure 2 shows the measurement of the hygroscopic growth of 100 nm atmospheric particles by SPRM-ARI. The SPRM grayscale images are collected at five conditioning RH levels (i.e., 30 %, 60 %, 80 %, and 90 %). By obtaining the GI of the SPRM images under various RH conditions, the cubic root of the GI ratio can represent the GF for the particle hygroscopic growth. It is found that, during the hygroscopic growth process of 100 nm atmospheric nanoparticles, the SPRM-ARI results were split circular spots, similar to those obtained for the previous SPRM-ARI obtained for the hygroscopic growth of nanoparticles with a pure composition (Xie et al., 2020; Kuai et al., 2020). The above observation also indicates that the atmospheric nanoparticles involved in this work were less than the diffraction limit. The size of the measured particles was determined to be 100 nm by SEM.
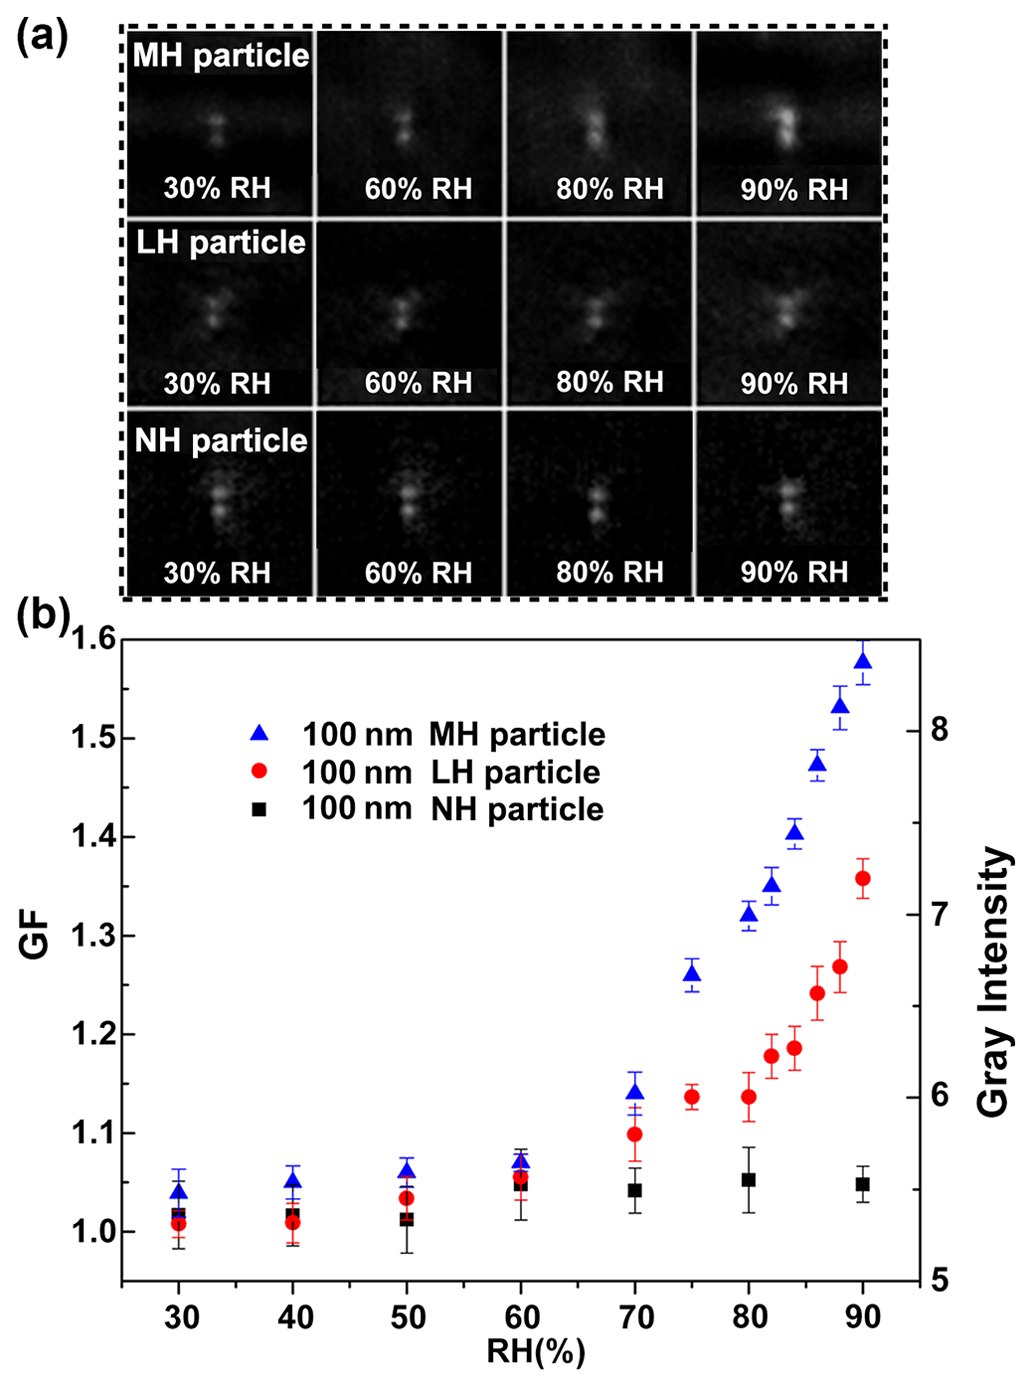
Figure 2(a) SPRM-ARI images and (b) hygroscopic growth factors of 100 nm atmospheric particles on 28 September 2021.
As the RH increased, the SPRM-ARI results could be classified into three types according to the variation of GI values. In the first type, the GI did not obviously change, and the speckled spots on the SPRM images basically retained their shapes at low RH, indicating that the GF of this 100 nm atmospheric particle did not change as the RH increased. Therefore, it can be concluded that the particles are non-hygroscopic (NH). In the second type, the GI of split circular spots gradually changed; i.e., the GI value slowly increased while the circular spots remained segmented, indicating the size of the atmospheric particle after hygroscopic growth remained less than the diffraction limit. Compared with the image captured for particles of the first type, the brightness of the spots increased, indicative of a slightly stronger hygroscopic growth of the particles under elevated RH levels. The GF of this type of particles increased to 1.35 when the RH reached 90 % (Fig. 2b). Therefore, such kinds of particles were classified as less hygroscopic (LH). The last type includes particles which experienced the most significant change in the shape of split circular spots during the hygroscopic growth process. The intensity of the spots was the brightest and the spots started to merge, demonstrating a much stronger hygroscopic growth. They are hence classified as more hygroscopic (MH). The derived GF was 1.58 at the RH level of 90 % and note that no obvious phase transition was observed during the hygroscopic growth process with RH increasing from 30 % to 90 %.
Meanwhile, the bulk hygroscopic growth of 100 nm particles at the RH level of 84 % was measured by the HTDMA, and the humidified particle size distribution is shown in Fig. 3. Assuming that the overall GF distribution is the product of the GF values and the number fraction of three types as mentioned above, the HTDMA measured size distribution can be fitted through a linear combination of three modes (i.e., the NH, LH, and MH), with the derived GFs from SPRM measurement used as the mean diameter growth factors. By adjusting the geometric standard deviation of each mode, the reconstructed size distribution shows a good agreement with the HTDMA measurement. The number fraction of each mode can be derived as the ratio of each reconstructed mode area to the total area of the GF distribution. It was found that 100 nm atmospheric particles primarily consisted of LH and MH particles, with the corresponding factional weight of 45.9 % and 47.1 %, respectively.
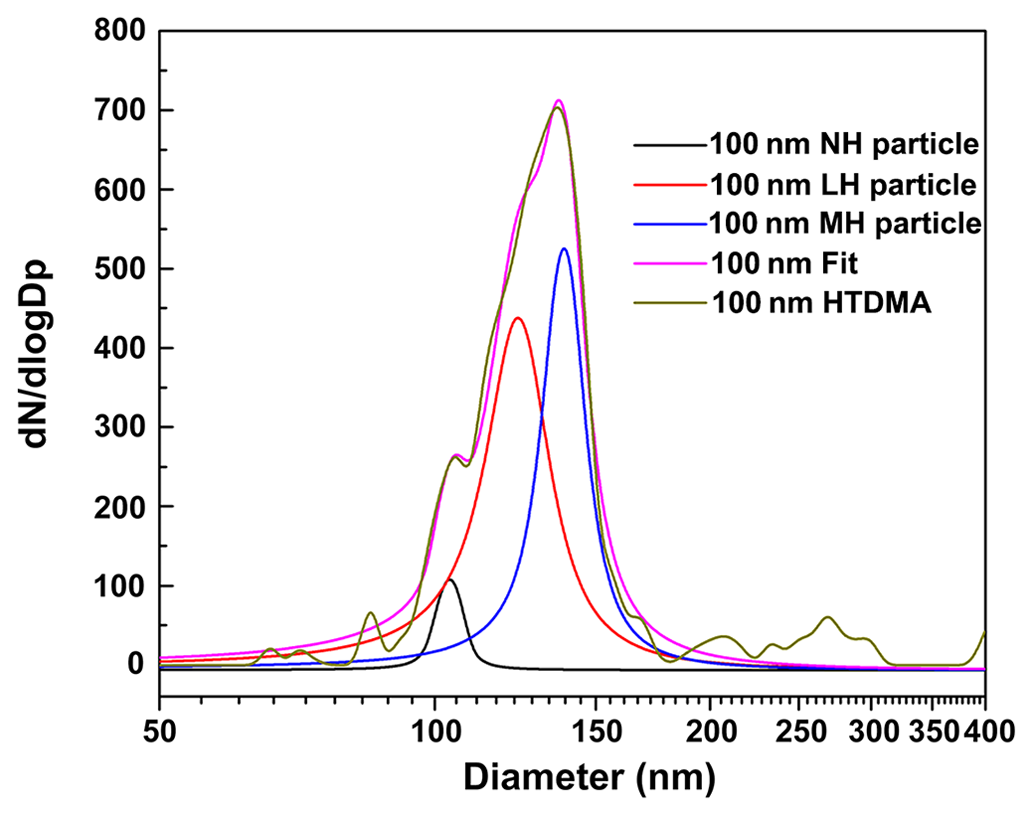
Figure 3HTDMA and peak fitting reconstruction for 100 nm atmospheric particles at 84 % RH on 28 September 2021.
Figure 4 shows the SEM images of typical 100 nm particles and their EDS mapping results from the experiment on 28 September 2021. According to the morphology and EDS mapping, the atmospheric particles can be classified into soot (mainly EC) (Fig. 4a), OC (Fig. 4b), fly ash (Fig. 4c), and secondary aerosol (mainly OC and SO) (Fig. 4d) (Kirpes et al., 2018). Specifically, the EDS of the 100 nm particles shows a strong C element signal while the O element distribution pattern does not match the shape of the particle (Fig. 4a), indicating that they are mainly composed of unoxidized soot from incomplete combustion of fossil fuels (Jacobson et al., 2000). For the OC particles shown in Fig. 4b, there is an obvious O element signal present in addition to the C element signal. We suspect that the OC particles have many different sources in the atmosphere, including direct emission from biogenic sources and secondary formation by volatile organic compounds (VOCs) (Zhang et al., 2017). In Fig. 4c, the SEM-ed particle consists of a cluster of spherical and small particles, which is dominated by Fe and O element signals. The Fe and O elements are evenly distributed over the whole particle profile, indicating that it might belong to fly ash resulting from high temperature combustions (Bondy et al., 2018). Figure 4d shows a potential example of atmospheric secondary aerosol, which consists of both OC and SO compounds. The EDS images show obvious S element signals in addition to the C and O element signals. One unique feature is that the particle is partially bright, likely due to the high conductivity of sulfate compounds. The nonuniformity of SEM brightness suggests that the mixing between OC and sulfate compounds in the particle is not uniform.
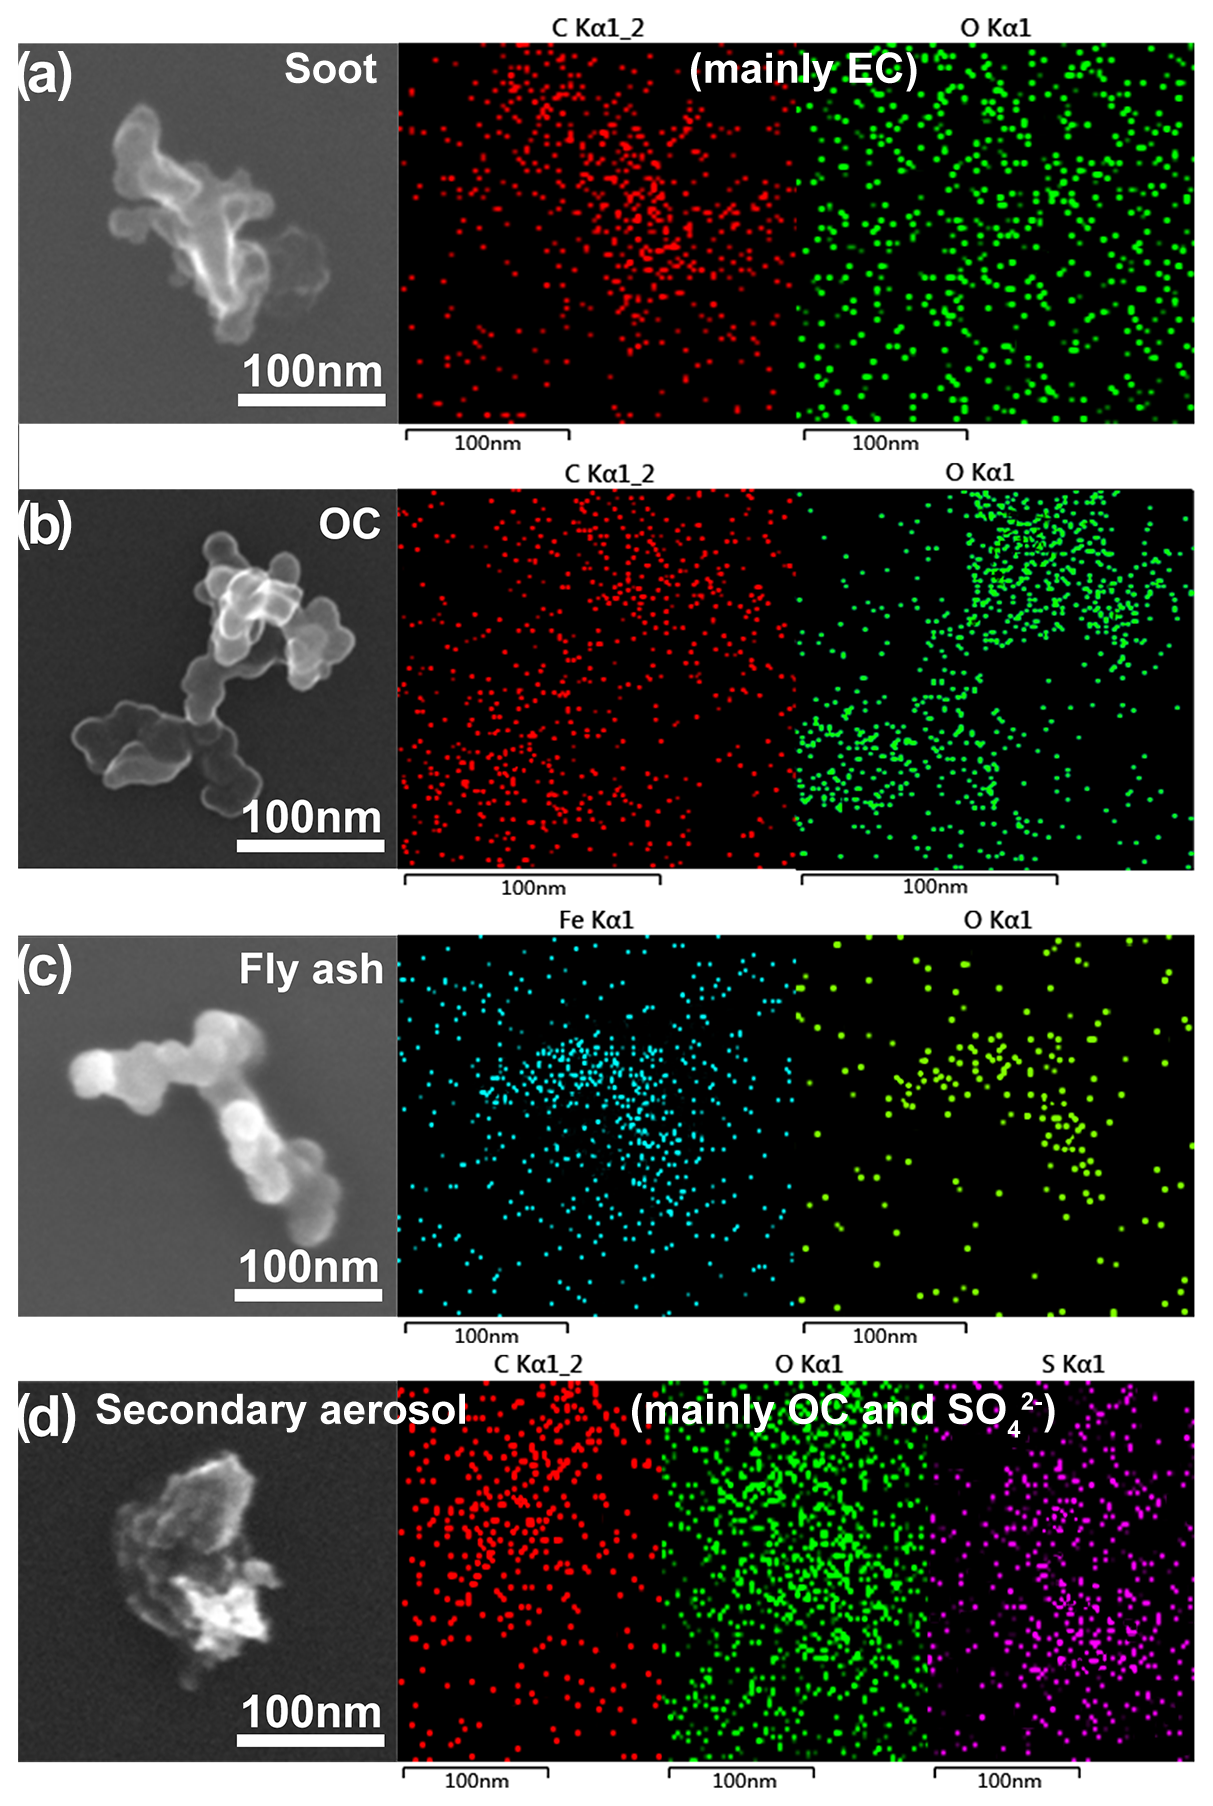
Figure 4SEM and EDS mapping of typical 100 nm atmospheric particles collected i on 28 September 2021.
From the SEM and EDS results, we expect that soot and fly ash likely correspond to the NH particle category identified by SPRM probing, due to their hydrophobic nature. Likewise, the OC particle may correspond to the LH particle category as the typical GF of organic aerosol ranges from 1.05–1.35 at 90 % RH, depending on the O : C ratios (Tang et al., 2019). Owing to the existence of inorganic compounds (i.e., SO), the secondary aerosol particle experiences stronger hygroscopic growth at elevated RH, which is expected to be classified into the MH particle category. Besides, due to the presence of organic components, the MH particle does not exhibit deliquescence but a continuous uptake of water during the humidification process (Estillore et al., 2017).
In summary, we classified the 100 nm atmospheric particles (from the experiment on 28 September 2021) into three different categories (i.e., NH, LH, and MH) according to their distinct hygroscopic growth behaviors from single-particle probing using SPRM-ARI. The mean GF of the three modes can be utilized to reproduce the GF distribution obtained from the HTDMA measurement, such that the number fractions of the three modes can be retrieved. The chemical compositions of individual particles of the three categories are identified to be organic carbon (OC), soot (mainly elemental carbon), fly ash, and secondary aerosols (mainly OC and sulfate), based on the SEM and EDS results. For individual particles, their chemical compositions likely agree with the apparent hygroscopic growth behaviors.
3.2 Size-dependence of SPRM–HTDMA derived chemical composition
Figure 5a and b show the SPRM-ARI results for 150 and 200 nm atmospheric particles. The SPRM imaging results of these particles (shown in Figs. S5 and S6) can also be classified into three categories: no obvious gray signal change for NH particles, enhanced gray signal with no obvious shape changes in the gray circular spots for LH particles, and enhanced gray signal with boundary fusion for MH particles. Compared with the 100 nm particles, there are no obvious changes of hygroscopic growth behaviors for the NH and LH particles (Fig. 5a). However, for the MH particles, their hygroscopic GF decreased as the particle size increased, particularly in the high RH regime (i.e., > 80 %). For example, the GFs of MH particles at 90 % RH are 1.58, 1.51, and 1.46, for 100, 150, and 200 nm particles, respectively.
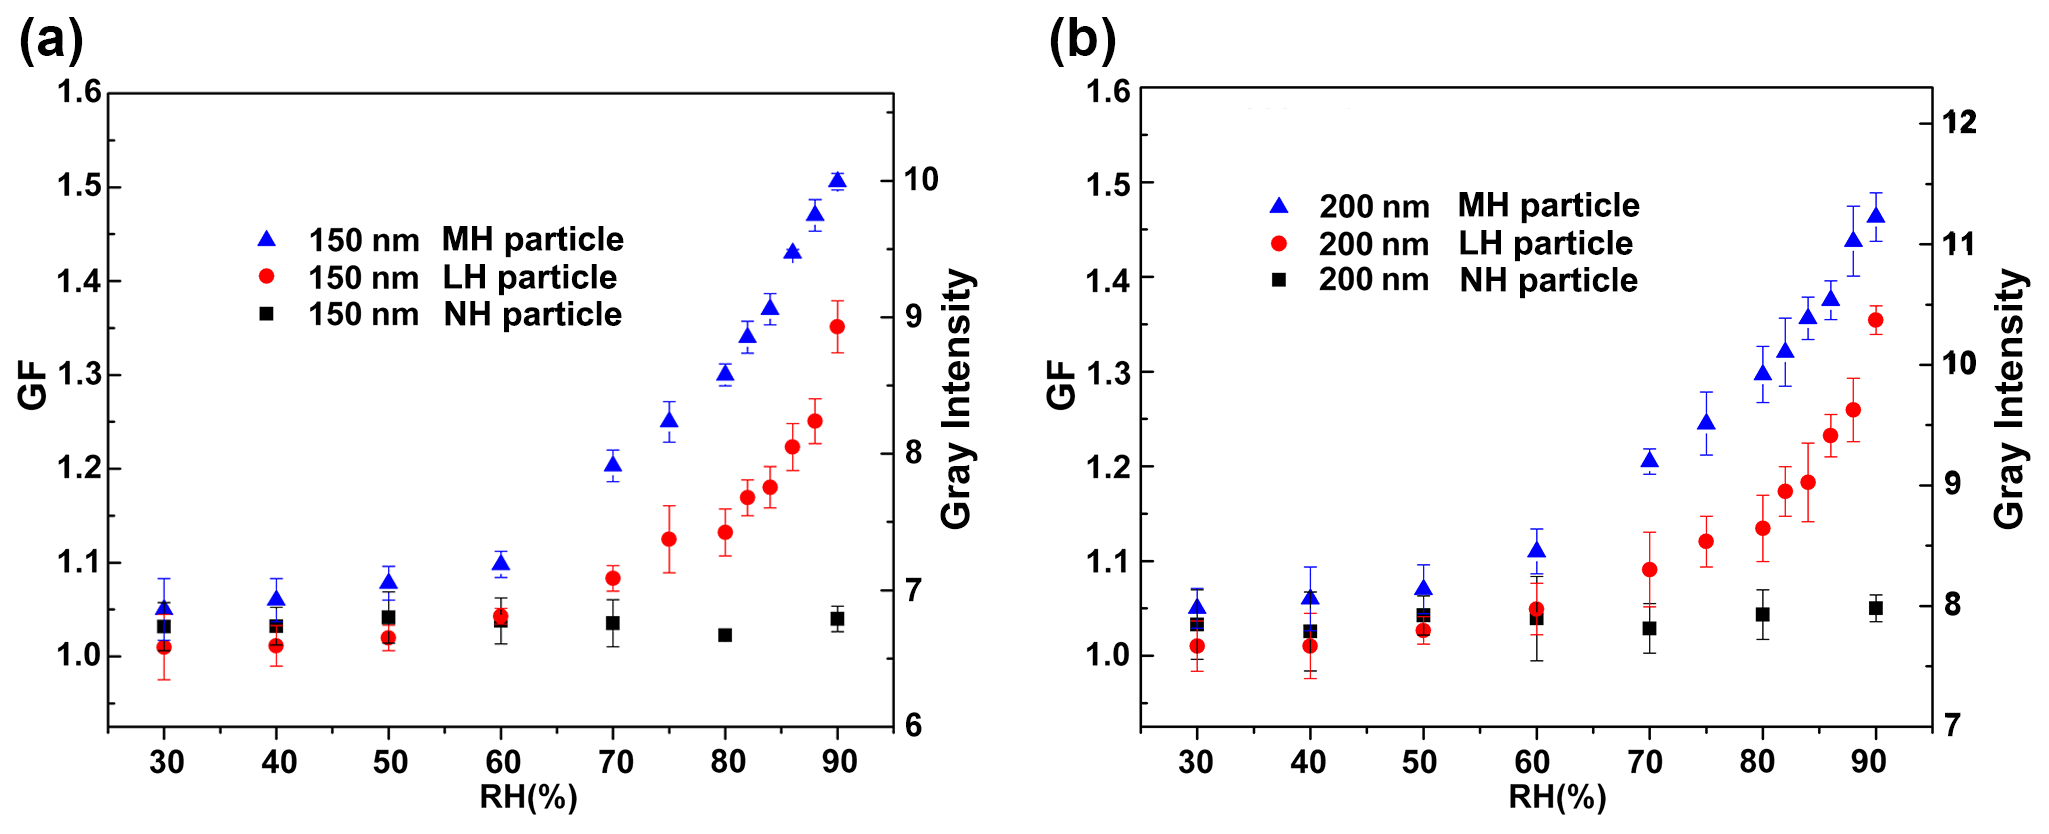
Figure 5SPRM-ARI hygroscopic growth factors of (a) 150 nm and (b) 200 nm atmospheric particles on 28 September 2021.
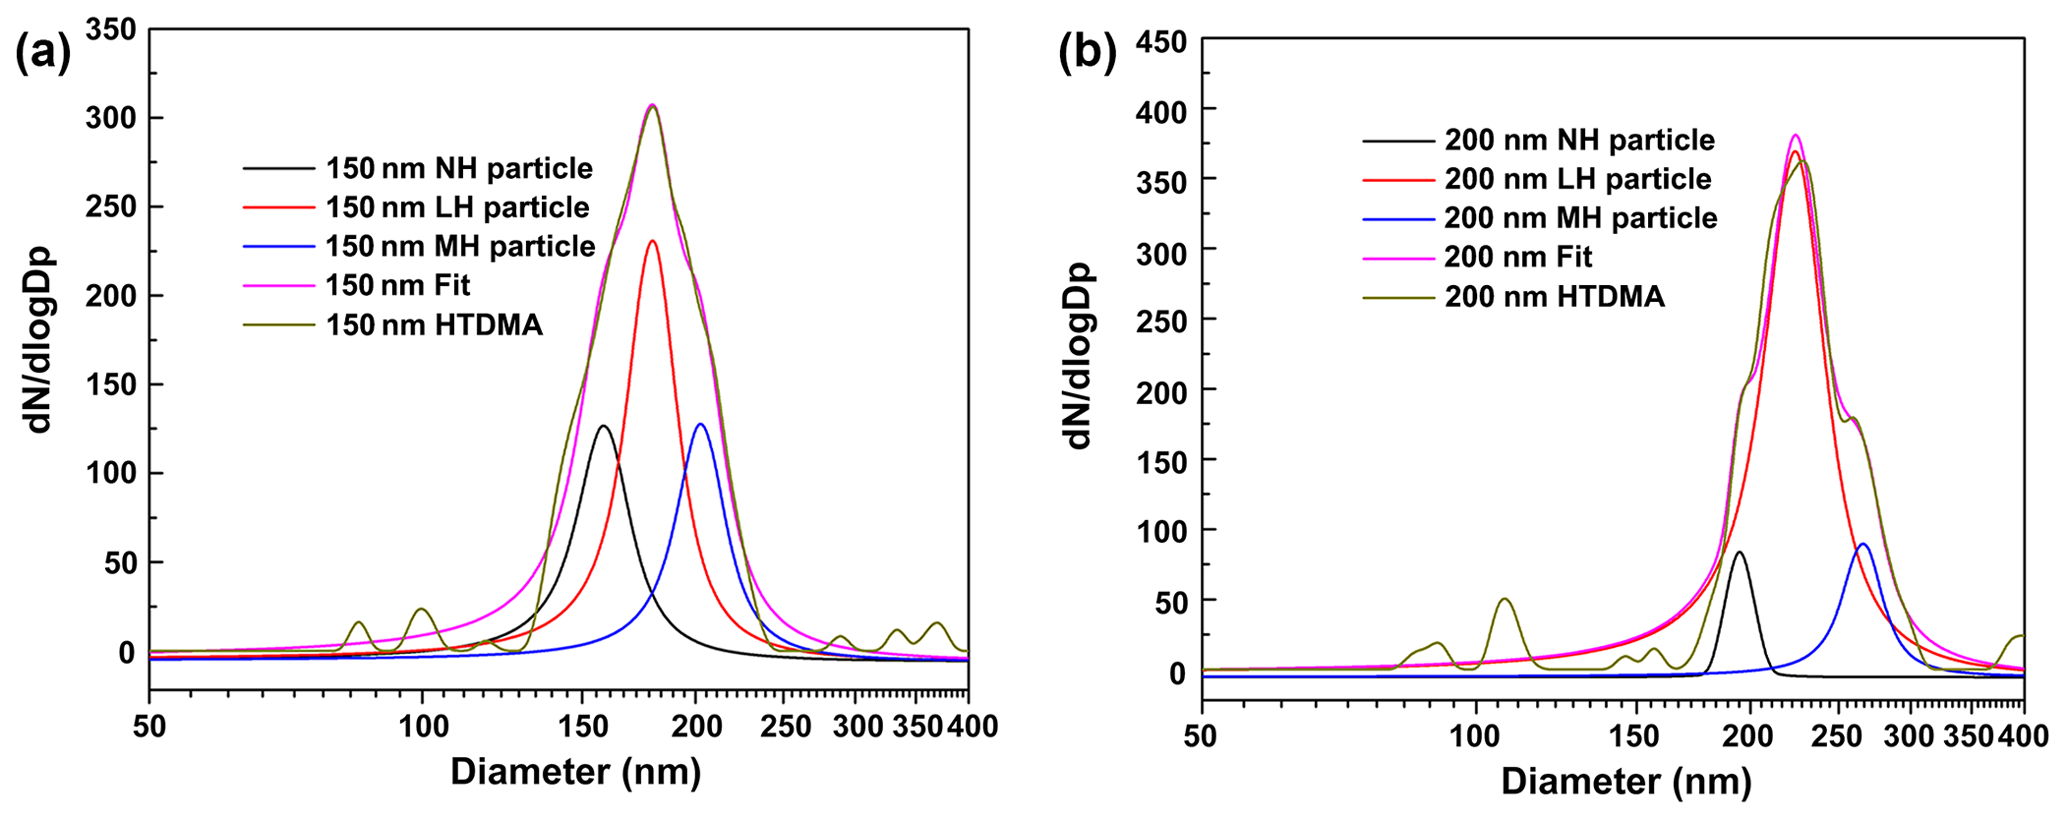
Figure 6HTDMA and peak fitting reconstruction for (a) 150 nm and (b) 200 nm atmospheric particles at 84 % RH on 28 September 2021.
The hygroscopicity parameter κ is calculated using the SPRM-measured GF for particles of 100–200 nm at 84 % RH, and the size-dependent variation of κ is shown in Fig. 7. The κ values of pure ammonium sulfate particles are also shown. It is found that the size-dependent variation of the κ value is negligible for NH and LH particles. For MH particles, the κ value decreases with increasing particle sizes (i.e., from 100 to 200 nm), which indicates that the proportion of organic compounds contained in MH particles gradually increases. As the SPRM-measured GFs can be utilized to reconstruct the humidified size distribution measured by HTDMA, here we use the GF values for 150, and 200 nm particle to fit the humidified size distribution accordingly. As shown in Fig. 6, we notice a significant increase of the LH mode to 78.2 % for 200 nm particles, relative to that of 100 and 150 nm particles. As a result, the number fraction of MH mode decreases, which likely confirms the increase of OC compounds for large particles.
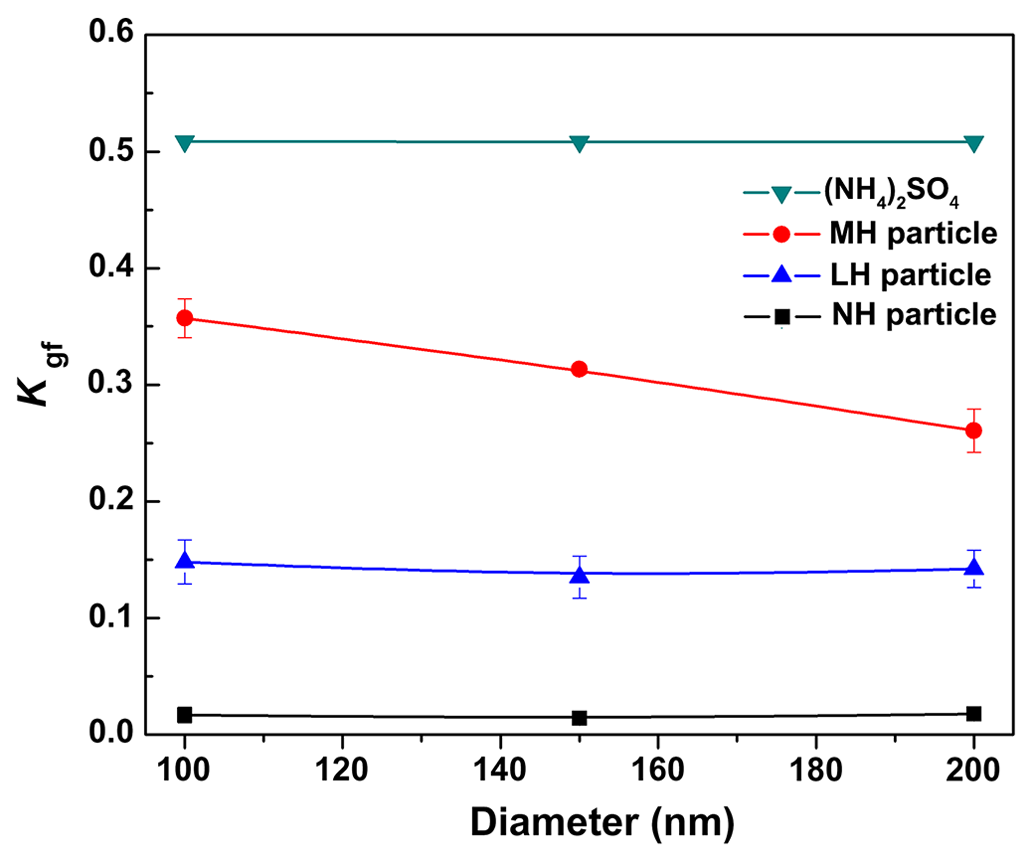
Figure 7κ results for the 100, 150, and 200 nm atmospheric particles at RH on 28 September 2021.
Figures S7 and S8 show the SEM and EDS results of atmospheric particles of 150 and 200 nm collected on 28 September 2021. Like the 100 nm atmospheric particles, the 150 and 200 nm atmospheric particles can also be classified into four categories as mentioned above. One notable difference is that for 150 and 200 nm particles, the clustering feature for fly ash particles becomes more obvious and the OC–sulfate distribution of secondary aerosol particles becomes even less uniform. For example, for 200 nm particles, the sulfate core was found only at the center, covered by the OC shell (i.e., dark particle profile in Fig. S8). Specifically, a core-shell structure gradually formed as particle size increases from 100 to 200 nm, indicating that the growth of secondary aerosol particles is contributed to by condensation of organic compounds in the atmosphere.
3.3 Comparisons of OC, EC, and SO
In order to evaluate the feasibility of coupled SPRM–HTDMA measurement in predicting the variations in particle chemical compositions, we combine chemical analysis from collected aerosol samples to perform a chemical closure study. Here, we analyzed the aerosol samples collected on 22 March 2022. Figure S9 shows the SPRM results of individual particles with sizes of 100, 150, and 200 nm, respectively. It is found that the collected particles can also be divided into three categories according to their distinct hygroscopic properties. Comparing the hygroscopic growth results of atmospheric particles collected on 28 September 2021, the GF of MH particles collected on 22 March 2022 was higher, likely due to the presence of enhanced SO compounds. Additionally, we also notice a slightly decreasing trend of GF for MH particles; i.e., the GFs at 90 % RH are 1.71, 1.66, and 1.62, for 100, 150, and 200 nm particles, respectively.
We use the SPRM-measured GFs to reconstruct the HTDMA measured humidified size distribution and the resulted number fractions for the MH mode are 65 %, 61.2 %, and 56.4 %, for 100, 150, and 200 nm particles, respectively. Whereas, the fractional weights of LH mode increase accordingly, i.e., from 20 % to 29 %. This likely suggests a similar effect of increasing OC on the particle hygroscopic growth as in the experiment from 28 September 2021. The concentrations of OC, EC, and SO of collected particles with different sizes (i.e., 100, 150, and 200 nm) were quantitatively analyzed. Note that we sum up the OC, EC, and SO concentrations and normalized to 1, as shown in Fig. 8. As the particle size increases, the OC fraction increases from 33 % to 42 %, with the SO fraction decreasing accordingly from 56 % to 47 %. It is clear that the increase of OC compounds is reflected in both the coupled SPRM–HTDMA measurement and the chemical analysis results, which suggests that the condensation of organic compounds dominate the hygroscopic growth behavior, particularly for the two experiments conducted in Hefei, China.

Figure 8Quantitative results of atmospheric nanoparticle subgroups collected by a quartz filter membrane on 22 March 2022.
In this work, we investigate the hygroscopic growth of atmospheric particles with electrical mobility sizes of 100, 150, and 200 nm using both single-particle SPRM probing and bulk HTDMA measurement. From a single-particle perspective, the individual particles can be classified into three categories, including NH, LH, and MH particles, depending on their distinct hygroscopic growth behaviors. The mean GF of the three types of particles can be utilized to reproduce the GF distribution obtained from the HTDMA measurement, such that the non-uniform GF distribution can be reconstructed and the number fraction of each mode can be retrieved. The chemical compositions of individual particles are identified using the SEM and EDS mapping and likely agree with their apparent hygroscopic growth behaviors.
For the field experiment we conducted on 28 September 2021 and 22 March 2022, we observed a size-dependent GF for MH particles, i.e., hygroscopic GF of MH particles decreases with increasing particle sizes, indicating weakened hygroscopic growth. The GF of MH particles at 90 % RH decreases from 1.58 to 1.46 as particle size increases from 100 to 200 nm. Additionally, the fitted GF distribution also demonstrates a significant increase of the LH mode to 78.2 % for 200 nm particles, indicating that the OC compound increases likely resulted from particle condensational growth. The hypothesis is confirmed by the SEM and EDS results, which show a reinforced core-shell structure forming as particle size increases from 100 to 200 nm, with the sulfate core at the center covered by an enlarged OC shell.
Our study shows that the SPRM-ARI imaging technique provides a new way for quantifying the hygroscopic growth of individual particles in the nano-size range. The measurement of the hygroscopic growth of individual particles is important for elucidating the dependence of aerosol water uptake on particle size, composition, and morphology. More importantly, the coupled SPRM–HTDMA measurement provide a new perspective on assessing the contribution of single-particle hygroscopic growth to the overall hygroscopic properties of aerosol ensembles, thereby linking the hygroscopic properties of individual particles and bulk aerosols.
The code and data are available upon request from the corresponding author (jszhang@aiofm.ac.cn).
The supplement related to this article is available online at: https://doi.org/10.5194/acp-23-2079-2023-supplement.
ZX designed the instrument and performed the experiment. JZ designed and led the study. HG provided interpretation of results and financial support. YL supported the SPRM experiment. BY and HD performed HTDMA data collection. HX helped with graphic visualization. DZ and DRC supported the experimental verification. JL supervised the project. ZX and JZ prepared the manuscript, with contributions from all co-authors.
The contact author has declared that none of the authors has any competing interests.
Publisher’s note: Copernicus Publications remains neutral with regard to jurisdictional claims in published maps and institutional affiliations.
We acknowledge the funding support from the National Natural Science Foundation of China (grant nos. 41905028, 91544218, 12134013, 62127818), the National Key R&D Program of China (grant no. 2017YFC0209504), the Science and Technological Fund of Anhui Province (grant nos. 1908085MD114, 2108085MD139), the Hefei Municipal Natural Science Foundation (grant no. 2021007), the Key Research & Development program of Anhui Province (grant no. 202104a05020010), and the HFIPS Director's Fund (grant nos. YZJJ2022QN04, BJPY2021A04). The work was partially carried out in the Center for Micro- and Nanoscale Research and Fabrication at the University of Science and Technology of China.
This research has been supported by the National Natural Science Foundation of China (grant nos. 41905028, 91544218, 12134013, and 62127818), the National Key Research and Development Program of China (grant no. 2017YFC0209504), the Science and Technological Fund of Anhui Province (grant nos. 1908085MD114, 2108085MD139), the Hefei Municipal Natural Science Foundation (grant no. 2021007), the Key Research & Development program of Anhui Province (grant no. 202104a05020010) and the HFIPS Director's Fund (grant nos. YZJJ2022QN04, BJPY2021A04).
This paper was edited by Joachim Curtius and reviewed by two anonymous referees.
Abbatt, J., Broekhuizen, K., and Pradeepkumar, P.: Cloud condensation nucleus activity of internally mixed ammonium sulfate/organic acid aerosol particles, Atmos. Environ., 39, 4767–4778, https://doi.org/10.1016/j.atmosenv.2005.04.029, 2005.
Agarwal, S., Aggarwal, S. G., Okuzawa, K., and Kawamura, K.: Size distributions of dicarboxylic acids, ketoacids, α-dicarbonyls, sugars, WSOC, OC, EC and inorganic ions in atmospheric particles over Northern Japan: implication for long-range transport of Siberian biomass burning and East Asian polluted aerosols, Atmos. Chem. Phys., 10, 5839–5858, https://doi.org/10.5194/acp-10-5839-2010, 2010.
Bondy, A. L., Bonanno, D., Moffet, R. C., Wang, B., Laskin, A., and Ault, A. P.: The diverse chemical mixing state of aerosol particles in the southeastern United States, Atmos. Chem. Phys., 18, 12595–12612, https://doi.org/10.5194/acp-18-12595-2018, 2018.
Chow, J., Waston, J., Chen, L., Arnott, W., Moosmüller, H., and Fung, K.: Equivalence of Elemental Carbon by Thermal/Optical Reflectance and Transmittance with Different Temperature Protocols. Environ. Sci. Technol., 38, 4414–4422, https://doi.org/10.1021/es034936u, 2004.
Craig, R. L., Bondy, A. L., and Ault, A. P.: Surface Enhanced Raman Spectroscopy Enables Observations of Previously Undetectable Secondary Organic Aerosol Components at the Individual Particle Level, Anal. Chem., 87, 7510–7514, https://doi.org/10.1021/acs.analchem.5b01507, 2015.
Dai, H., Zhang, J., Gui, H., Shen, L., Wei, X., Xie, Z., Chen, S., Wu, Z., Chen, D., and Liu, J.: Characteristics of aerosol size distribution and liquid water content under ambient RH conditions in Beijing, Atmos. Environ., 291, 119397–119406, https://doi.org/10.1016/j.atmosenv.2022.119397, 2022.
Ding, Q., Liu, J., Lu, Y., Wang, Y., Lu, F., and Shi, J.: Research and development of an on-line carbonaceous aerosol analyzer, Chinese Journal of Scientific Instrument, 35, 1246–1253, https://doi.org/10.19650/j.cnki.cjsi.2014.06.007, 2014.
Ebert, M., Inerle-Hof, M., and Weinbruch, S.: Environmental scanning electron microscopy as a new technique to determine the hygroscopic behaviour of individual aerosol particles, Atmos. Environ., 36, 5909–5916, https://doi.org/10.1016/S1352-2310(02)00774-4, 2002.
Estillore, A., Morris, H., Or, V., Lee, H., Alves, M., Marciano, M., Laskina, O., Qin, Z., Tivanski, A., and Grassian, H.: Linking hygroscopicity and the surface microstructure of model inorganic salts, simple and complex carbohydrates, and authentic sea spray aerosol particles, Phys. Chem. Chem. Phys., 19, 21101–21111, https://doi.org/10.1039/c7cp04051b, 2017.
Fan, X., Liu, J., Zhang, F., Chen, L., Collins, D., Xu, W., Jin, X., Ren, J., Wang, Y., Wu, H., Li, S., Sun, Y., and Li, Z.: Contrasting size-resolved hygroscopicity of fine particles derived by HTDMA and HR-ToF-AMS measurements between summer and winter in Beijing: the impacts of aerosol aging and local emissions, Atmos. Chem. Phys., 20, 915–929, https://doi.org/10.5194/acp-20-915-2020, 2020.
Fang, Y., Wang, H., Yu, H., Liu, X., Wang, W., Chen, H. Y., and Tao, N. J.: Plasmonic Imaging of Electrochemical Reactions of Single Nanoparticles, Acc. Chem. Res., 49, 2614–2624, https://doi.org/10.1021/acs.accounts.6b00348, 2016.
Gen, M. and Chan, C. K.: Electrospray surface-enhanced Raman spectroscopy (ES-SERS) for probing surface chemical compositions of atmospherically relevant particles, Atmos. Chem. Phys., 17, 14025–14037, https://doi.org/10.5194/acp-17-14025-2017, 2017.
Gupta, D., Eom, H.-J., Cho, H.-R., and Ro, C.-U.: Hygroscopic behavior of NaCl–MgCl2 mixture particles as nascent sea-spray aerosol surrogates and observation of efflorescence during humidification, Atmos. Chem. Phys., 15, 11273–11290, https://doi.org/10.5194/acp-15-11273-2015, 2015.
Halpern, A., Wood, J., Wang, Y., and Corn, R.: Single-Nanoparticle Near-Infrared Surface Plasmon Resonance Microscopy for Real-Time Measurements of DNA Hybridization Adsorption, ACS Nano., 8, 1022–1030, https://doi.org/10.1021/nn405868e, 2014.
Harmon, C. W., Grimm, R. L., McIntire, T. M., Peterson, M. D., Njegic, B., Angel, V. M., Alshawa, A., Underwood, J. S., Tobias, D. J., Gerber, R. B., Gordon, M. S., Hemminger, J. C., and Nizkorodov, S. A.: Hygroscopic growth and deliquescence of NaCl nanoparticles mixed with surfactant SDS, J. Phys. Chem. B., 114, 2435–2449, https://doi.org/10.1021/jp909661q, 2010.
Hiranuma, N., Brooks, S. D., Auvermann, B. W., and Littleton, R.: Using environmental scanning electron microscopy to determine the hygroscopic properties of agricultural aerosols, Atmos. Environ., 42, 1983–1994, https://doi.org/10.1016/j.atmosenv.2007.12.003, 2008.
Huang, B., Yu, F., and Zare, R.: Surface Plasmon Resonance Imaging Using a High Numerical Aperture Microscope Objective, Anal. Chem., 79, 2979–2983, https://doi.org/10.1021/ac062284x, 2007.
Jacobson, M. C., Hansson, H. C., Noone, K. J., and Charlson, R. J.: Organic atmospheric aerosols: Review and state of the science, Rev. Geophys., 38, 267–294, https://doi.org/10.1029/1998RG000045, 2000.
Kirpes, R. M., Bondy, A. L., Bonanno, D., Moffet, R. C., Wang, B., Laskin, A., Ault, A. P., and Pratt, K. A.: Secondary sulfate is internally mixed with sea spray aerosol and organic aerosol in the winter Arctic, Atmos. Chem. Phys., 18, 3937–3949, https://doi.org/10.5194/acp-18-3937-2018, 2018.
Krieger, U. K., Marcolli, C., and Reid, J. P.: ChemInform Abstract: Exploring the Complexity of Aerosol Particle Properties and Processes Using Single Particles Techniques, Chem. Soc. Rev., 41, 6631–6662, https://doi.org/10.1002/chin.201248273, 2012.
Kuai, Y., Chen, J., Tang, X., Xiang, Y., Lu, F., Kuang, C., Xu, L., Shen, W., Cheng, J., Gui, H., Zou, G., Wang, P., Ming, H., Liu, J., Liu, X., Lakowicz, J., and Zhang, D.: Label-free surface-sensitive photonic microscopy with high spatial resolution using azimuthal rotation illumination, Sci. Adv., 5, 1–10, https://doi.org/10.1126/sciadv.aav5335, 2019.
Kuai, Y., Xie, Z., Chen, J., Gui, H., Xu, L., Kuang, C., Kuang, C., Wang, P., Xu, L., Liu J., Lakowicz, J., and Zhang, D.: Real-Time Measurement of the Hygroscopic Growth Dynamics of Single Aerosol Nanoparticles with Bloch Surface Wave Microscopy, ACS Nano., 14, 9136–9144, https://doi.org/10.1021/acsnano.0c04513, 2020.
Li, R., Hu, Y., Li, L., Fu, H., and Chen, J.: Real-time aerosol optical properties, morphology and mixing states under clear, haze and fog episodes in the summer of urban Beijing, Atmos. Chem. Phys., 17, 5079–5093, https://doi.org/10.5194/acp-17-5079-2017, 2017.
Lv, X. J., Wang, Y., Cai, C., Pang, S. F., Ma, J. B., and Zhang, Y. H.: Investigation of gel formation and volatilization of acetate acid in magnesium acetate droplets by the optical tweezers, Spectrochim. Acta A. Mol. Biomol. Spectrosc., 200, 179–185, https://doi.org/10.1016/j.saa.2018.04.027, 2018.
Mikhailov, E. F., Mironov, G. N., Pöhlker, C., Chi, X., Krüger, M. L., Shiraiwa, M., Förster, J.-D., Pöschl, U., Vlasenko, S. S., Ryshkevich, T. I., Weigand, M., Kilcoyne, A. L. D., and Andreae, M. O.: Chemical composition, microstructure, and hygroscopic properties of aerosol particles at the Zotino Tall Tower Observatory (ZOTTO), Siberia, during a summer campaign, Atmos. Chem. Phys., 15, 8847–8869, https://doi.org/10.5194/acp-15-8847-2015, 2015.
Morris, H. S., Grassian, V. H., and Tivanski, A. V.: Humidity-dependent surface tension measurements of individual inorganic and organic submicrometre liquid particles, Chem. Sci., 6, 3242–3247, https://doi.org/10.1039/c4sc03716b, 2015.
Morris, H. S., Estillore, A. D., Laskina, O., Grassian, V. H., and Tivanski, A. V.: Quantifying the Hygroscopic Growth of Individual Submicrometer Particles with Atomic Force Microscopy, Anal. Chem., 88, 3647–3654, https://doi.org/10.1021/acs.analchem.5b04349, 2016.
Peng, C., Chan, M., and Chan, C.: The Hygroscopic Properties of Dicarboxylic and Multifunctional Acids: Measurements and UNIFAC Predictions, Environ. Sci. Technol., 35, 4495–4501, https://doi.org/10.1021/es0107531, 2001.
Penner, J., Charlson, R., Hales, J., Laulainen, N., Novakov, R., Radke, J., Schwartz, S., and Travis, L.: Quantifying and Minimizing Uncertainty of Climate Forcing by Anthropogenic Aerosols, B. Am. Meteorol. Soc., 75, 375–400, https://doi.org/10.1175/1520-0477(1994)075<0375:QAMUOC>2.0.CO;2, 1993.
Petters, M. D. and Kreidenweis, S. M.: A single parameter representation of hygroscopic growth and cloud condensation nucleus activity, Atmos. Chem. Phys., 7, 1961–1971, https://doi.org/10.5194/acp-7-1961-2007, 2007.
Pilinis, C., Pandis, S., and Seinfeld, J.: Sensitivity of direct climate forcing by atmospheric aerosols to aerosol size and composition, J. Geophys. Res., 100, 18739–18754, https://doi.org/10.1029/95JD02119, 1995.
Sloane, C. and Wolff, G.: Prediction of ambient light scattering using a physical model responsive to relative humidity: Validation with measurements from detroit, Atmos. Environ., 19, 669–680, https://doi.org/10.1016/0004-6981(85)90046-0, 1985.
Su, H., Rose, D., Cheng, Y. F., Gunthe, S. S., Massling, A., Stock, M., Wiedensohler, A., Andreae, M. O., and Pöschl, U.: Hygroscopicity distribution concept for measurement data analysis and modeling of aerosol particle mixing state with regard to hygroscopic growth and CCN activation, Atmos. Chem. Phys., 10, 7489–7503, https://doi.org/10.5194/acp-10-7489-2010, 2010.
Syal, K., Iriya, R., Yang, Y., Yu, H., Wang, S., Haydel, S. E., Chen, H. Y., and Tao, N.: Antimicrobial Susceptibility Test with Plasmonic Imaging and Tracking of Single Bacterial Motions on Nanometer Scale, ACS Nano., 10, 845–852, https://doi.org/10.1021/acsnano.5b05944, 2016.
Tan, H., Cai, M., Fan, Q., Liu, L., Li, F., Chan, P. W., Deng, X., and Wu, D.: An analysis of aerosol liquid water content and related impact factors in Pearl River Delta, Sci. Total. Environ., 579, 1822–1830, https://doi.org/10.1016/j.scitotenv.2016.11.167, 2017.
Tang, M., Chan, C. K., Li, Y. J., Su, H., Ma, Q., Wu, Z., Zhang, G., Wang, Z., Ge, M., Hu, M., He, H., and Wang, X.: A review of experimental techniques for aerosol hygroscopicity studies, Atmos. Chem. Phys., 19, 12631–12686, https://doi.org/10.5194/acp-19-12631-2019, 2019.
Wang, S., Shan, X., Patel, U., Huang, X., Lu, J., Li, J., and Tao, N.: Label-free imaging, detection, and mass measurement of single viruses by surface plasmon resonance, P. Natl. Acad. Sci. USA, 107, 16028–16032, https://doi.org/10.1073/pnas.1005264107, 2010.
Wang, W., Yang, Y., Wang, S., Nagaraj, V. J., Liu, Q., Wu, J., and Tao, N.: Label-free measuring and mapping of binding kinetics of membrane proteins in single living cells, Nat. Chem., 4, 846–853, https://doi.org/10.1038/NCHEM.1434, 2012.
Xie, Z., Kuai, Y., Liu J., Gui, H., Zhang, J., Dai, H., Xiao, H., Chen, D., and Zhang, D.: In Situ Quantitative Observation of Hygroscopic Growth of Single Nanoparticle Aerosol by Surface Plasmon Resonance Microscopy, Anal. Chem., 92, 11062–11071, https://doi.org/10.1021/acs.analchem.0c00431, 2020.
Young, G., Hundt, N., Cole, D., Fineberg, A., Andrecka, J., Tyler, A., Olerinyova, A., Ansari, A., Marklund, E., Collier, M., Chandler, S., Tkachenko, O., Allen, J., Crispin, M., Billington, N., Takagi, Y., Sellers, J., Eichmann, C., Selenko, P., Frey, L., Benesch, J., and Kukura, P.: Quantitative mass imaging of single biological macromolecules, Science, 360, 423–427, https://doi.org/10.1126/science.aar5839, 2018.
Zhang, J., Chen, Z., Lu, Y., Gui, H., Liu, J., Liu, W., Wang, J., Yu, T., Cheng, Y., Chen, Y., Ge, B., Fan, Y., and Luo, X.: Characteristics of aerosol size distribution and vertical backscattering coefficient profile during 2014 APEC in Beijing, Atmos. Environ., 148, 30–41, https://doi.org/10.1016/j.atmosenv.2016.10.020, 2017.