the Creative Commons Attribution 4.0 License.
the Creative Commons Attribution 4.0 License.
 | 01 Feb 2023
Projected increases in wildfires may challenge regulatory curtailment of PM2.5 over the eastern US by 2050
Chandan Sarangi
Yun Qian
L. Ruby Leung
Yang Zhang
Yufei Zou
Yuhang Wang
Anthropogenic contribution to the overall fine particulate matter (PM2.5) concentrations has been declining sharply in North America. In contrast, a steep rise in wildfire-induced air pollution events with recent warming is evident in the region. Here, based on coupled fire–climate–ecosystem model simulations, summertime wildfire-induced PM2.5 concentrations are projected to nearly double in North America by the mid-21st century compared to the present. More strikingly, the projected enhancement in fire-induced PM2.5 (∼ 1–2 µg m−3) and its contribution (∼ 15 %–20 %) to the total PM2.5 are distinctively significant in the eastern US. This can be attributed to downwind transport of smoke from future enhancement of wildfires in North America to the eastern US and associated positive climatic feedback on PM2.5, i.e., perturbations in circulation, atmospheric stability, and precipitation. Therefore, the anticipated reductions in PM2.5 from regulatory controls on anthropogenic emissions could be significantly compromised in the future in the densely populated eastern US.
- Article
(10450 KB) - Full-text XML
-
Supplement
(811 KB) - BibTeX
- EndNote


-
Wildfire–PM2.5 associations are studied based on unprecedented two-way coupled fire–climate–ecosystem model simulations.
-
A steep rise in wildfire-induced air pollution events with recent warming is evident in the region.
-
The transported smoke from enhanced wildfires in North America can severely affect air quality over the eastern US.
Wildfires are widespread burning events in forests, shrublands, and grazing lands. In North America (mainly Canada and the US), particulate matter emissions from wildfires are a significant source of regional air pollution (Shi et al., 2019; McClure and Jaffe, 2018; van der Werf et al., 2010; Jaffe et al., 2008). Since the 1980s, the number of large wildfires and the length of the wildfire season have been increasing, and the trends are projected to continue in the future over the western US, Alaska, and Canada (Kitzberger et al., 2017; Kirchmeier-Young et al., 2017; Abatzoglou and Williams, 2016; Partain et al., 2016; Jolly et al., 2015; Westerling et al., 2006; Gillett et al., 2004). Accordingly, particulate emissions from wildfires are also anticipated to increase in North America in the 21st century (Knorr et al., 2017; Liu et al., 2016; Val Martin et al., 2015). Human exposure to high concentrations of wildfire-emitted airborne particulate matter of diameter ≤ 2.5 µm (PM2.5) is known to have substantial adverse effects on pulmonary and cardiovascular functioning (Haikerwal et al., 2021; Black et al., 2017), which contribute significantly to global and regional all-cause mortality (Zhang et al., 2020; Hong et al., 2019; Yang et al., 2019; Ford et al., 2018; Johnston et al., 2012). Therefore, a better understanding of the future changes in wildfire-induced PM2.5 and its contribution to the total surface PM2.5 is essential.
In the last 2 decades, ambient air quality in the US has substantially improved due to a decline in PM2.5 by ∼ 40 % (US EPA, 2018). The decrease in PM2.5 is primarily due to curtailment of anthropogenic emissions resulting from US-based efforts to meet regulations such as the Clean Air Act (US EPA, 2009), Cross-State Air Pollution Rule, Regional Haze Rule, and the motor vehicles emissions standards. Consequently, air quality over the contiguous US (CONUS) and Canada has improved steadily such that it is predicted to achieve the targeted National Ambient Air Quality Standards in the future (Nolte et al., 2018). Under this promising scenario, the influence of wildfire-emissions on the total PM2.5 becomes even more crucial. Depending on the competition between climate-induced increase in wildfires and the regulatory control on anthropogenic emissions, future enhancement in wildfire-induced PM2.5 may compromise the reduction in anthropogenic PM2.5 concentrations in certain regions. In agreement, recent studies have highlighted the potential for future enhancement in wildfire-induced pollution to diminish the reducing trend in PM2.5, primarily over the western US (O'Dell et al., 2019; Ford et al., 2018; Val Martin et al., 2015; Yue et al., 2013).
While the fractional wildfire-burned area and fire intensities are the greatest over the western US and Canadian regions within North America, anthropogenic emissions dominate the ambient PM2.5 concentration over the eastern US. The inherent geographical separation between the regions with large wildfire emissions and anthropogenic emissions leads to a pertinent question: will future enhancement in wildfires over the western US and Canada have significant effects on PM2.5 over the eastern US? Addressing this question is crucial because the declining trend in PM2.5 over the eastern US is the major contributor to the observed 40 % decrease in PM2.5 over the US in the last 2 decades (US EPA, 2018). Eastward advection of wildfire smoke from Canada and the western US has been found to severely hamper the surface air quality of the central and eastern US under the influence of the prevailing westerlies during the summer months (Brey et al., 2018; Wu et al., 2018; Gunsch et al., 2018; Kaulfus et al., 2017; Dempsey, 2013). The transported wildfire smoke can influence the meteorology and climate via the radiative impact of carbonaceous emissions, changes in land albedo, and cloud system perturbations (Ward et al., 2012; Liu et al., 2014). These fire–weather interactions can have positive feedback on the locally emitted PM2.5 in the eastern US by surface cooling and boundary layer suppression (Guan et al., 2020). At the same time, fire-triggered ecosystem changes can induce negative feedback on PM2.5 by reducing the future wildfires over North America (Zou et al., 2020). Thus, two-way interactions between fires and climate that are important for predicting future changes in wildfire locations, intensities, and durations (Harris et al., 2016) as well as associated particulate emissions are essential. However, past studies have mostly employed simple statistical models based on statistical regressions of present-day fire-burned area on the meteorological fields (Liu et al., 2016; Spracklen et al., 2009; Yue et al., 2013; Val Martin et al., 2015) and, more recently, one-way coupled modeling (Ford et al., 2018; O'Dell et al., 2019).
Here, based on new two-way coupled fire–climate–ecosystem simulations, we demonstrate the significance of wildfire-induced contributions to ambient PM2.5 over the eastern US due to enhanced wildfire smoke transportation and smoke-induced changes in weather in the eastern US. This enhancement in wildfire-induced PM2.5 may potentially challenge the targeted policy-driven reduction in PM2.5 in the eastern US. Next, our model setup, experiments, and methodology are explained in Sect. 2, followed by results and discussion in Sect. 3. The study is summarized in Sect. 4.
2.1 RESFire–CESM model description
We employ the open-source REgion-Specific ecosystem feedback Fire (RESFire) model coupled with the Community Land Model version 4.5 and the Community Atmosphere Model version 5 (CAM5) of the Community Earth System Model (CESM) version 1 (Zou et al., 2019; Neale et al., 2013) to perform two-way coupled simulations. RESFire provides state-of-the-art capabilities to simulate the complex fire–climate–ecosystem interactions globally for fires occurring over wildland, cropland, and peatland. Although wildfires dominate in the North American region, RESFire simulates both wildfires and prescribed fires. Moreover, this integrated setup includes climatic feedback from fire-induced aerosol direct and indirect radiative effects and associated weather changes. It also includes feedback from fire-induced vegetation distribution changes and associated biophysical processes such as evapotranspiration and surface albedo. Sofiev et al. (2012) described the fire plume rise parameterization. Other features in CLM4.5 and CAM5, such as the photosynthesis scheme (Sun et al., 2012), the MAM3 aerosol module (Liu et al., 2012), and the cloud macrophysics scheme (Park et al., 2014), allow for more comprehensive assessments of the climate effects of fires through their interactions with vegetation and clouds. Fire–ecosystem interactions are modeled by simulating fire-induced vegetation mortality and regrowth (and associated land cover change) in RESFire. This approach has been introduced in Zou et al. (2019), and the simulated ecological and climatic effects of wildfires have been evaluated in two sets of sensitivity experiments in Zou et al. (2020). Although fire–climate–ecosystem interactions are considered in this study, our focus is on the fire-induced changes in PM2.5 over Canada and the US, so the two vegetation-focused sensitivity experiments reported in Zou et al. (2020) are not included in this paper. Please refer to Zou et al. (2019) and Zou et al. (2020) for more details about the simulation of fire–ecosystem interactions.
2.2 Numerical experiment and methodology
We designed two sets of simulations for the present-day and future scenarios to quantify the impacts of fire–climate–ecosystem interactions (Table 1). The spatial resolution is 0.9∘ (lat) × 1.25∘ (long) with a time step of 30 min. In each set of simulations, we conducted a default all-emissions-included control run (XALL, where x=2000 or 2050 indicates the present day or future, respectively) and a sensitivity run with no wildfire emissions to the atmosphere (XWEF, where X is the same as for the control runs). The ALL runs are designed to simulate fully interactive fire disturbances such as fire emissions with plume rise and fire-induced land cover changes in the present day (representative of the 2000s, 2000ALL) and a moderate future emission scenario (representative of the 2050s, 2050ALL) via the RCP4.5. The only difference between the ALL and WEF scenario is that wildfire emissions are absent in the WEF scenario. Specifically, in the WEF runs, the online-simulated fire emissions are not passed to the CAM5 atmosphere model so that the difference between the ALL and WEF runs can be used to isolate the atmospheric impacts of fire–climate interactions.
For the present-day experiments, we used the spun-up states from Zou et al. (2019) as initial conditions for both meteorological and chemical variables. Sea surface temperature (SST) for the present day was obtained from the Met Office Hadley Centre (HadISST). Present-day non-fire emissions from anthropogenic and other sources were based on ACCMIP (Lamarque et al., 2010) for the year 2000. We replaced the prescribed GFED2 fire emissions (van der Werf et al., 2006) in the default setting of CESM with the online-coupled fire emissions generated by the RESFire model. Zou et al. (2019) provided more details of the physics parameterizations and modeling experiment settings used in these simulations. Land use and land cover data for 2000 and 2050 from the Land-Use History A product (Hurtt et al., 2006) are used to initialize the 2000ALL and 2000WEF as well as the 2050ALL and 2050WEF simulations, respectively. Following the above setup, the future scenario 2050ALL experiment accounts for both fuel load changes associated with the projected land use and land cover change (LULCC) in the 2050s and fire weather changes driven by the SST and sea ice forcing from a coupled CESM simulation following the greenhouse gas (GHG) forcing of the RCP4.5 scenario. The global-mean GHG mixing ratios in the CAM5 atmosphere model were fixed at year 2000 levels in all the present-day experiments, and they were replaced by those of the RCP4.5 scenario with the well-mixed assumption and monthly variations. However, the future population and socioeconomic conditions were identical to those of the present day, so there was no explicit impact of human-induced mitigation/enhancement effects on wildfires in the future projection in all the future experiments. Future human impacts were considered implicitly in LULCC-induced fuel load changes in the RCP4.5 scenario.
The net projected changes by the 2050s in emissions, meteorology, and air quality during summer months (JJA: June, July, August) are estimated by comparing decadal-mean values simulated by 2000ALL with 2050ALL. Wildfire-induced enhancement in PM2.5 concentration in the present day and mid-21st century is estimated by comparing 2000ALL with 2000WEF and 2050ALL with 2050WEF, respectively. Further, the projected increase in wildfire-induced PM2.5 in the future is calculated by comparing the simulated wildfire effect of the 2050s (2050ALL−2050WEF) with that of the 2000s (2000ALL−2000WEF). With large spatiotemporal variability, the projected changes in transported fire-emissions from the western US and Canada to the eastern US by the 2050s and the corresponding impacts are summarized using probability distribution functions. The latter provide information for not only the mean but also variability and extreme values to quantify the simulated changes for the three subregions.
3.1 Model evaluation
Zou et al. (2019) performed comprehensive evaluation of the RESFire-simulated wildfire-burned area distribution, associated carbon emissions, and terrestrial carbon balance to demonstrate reasonable model skill. Zou et al. (2020) compare global fire simulations by RESFire–CESM with modeling results reported in the literature to show better agreement with the GFED4.1s benchmark data and predict more prominent changes in the future than those predicted by Kloster et al. (2010, 2012). These differences might come from differences in the climate sensitivities of the fire models and scenarios and other input data used to make future projections.
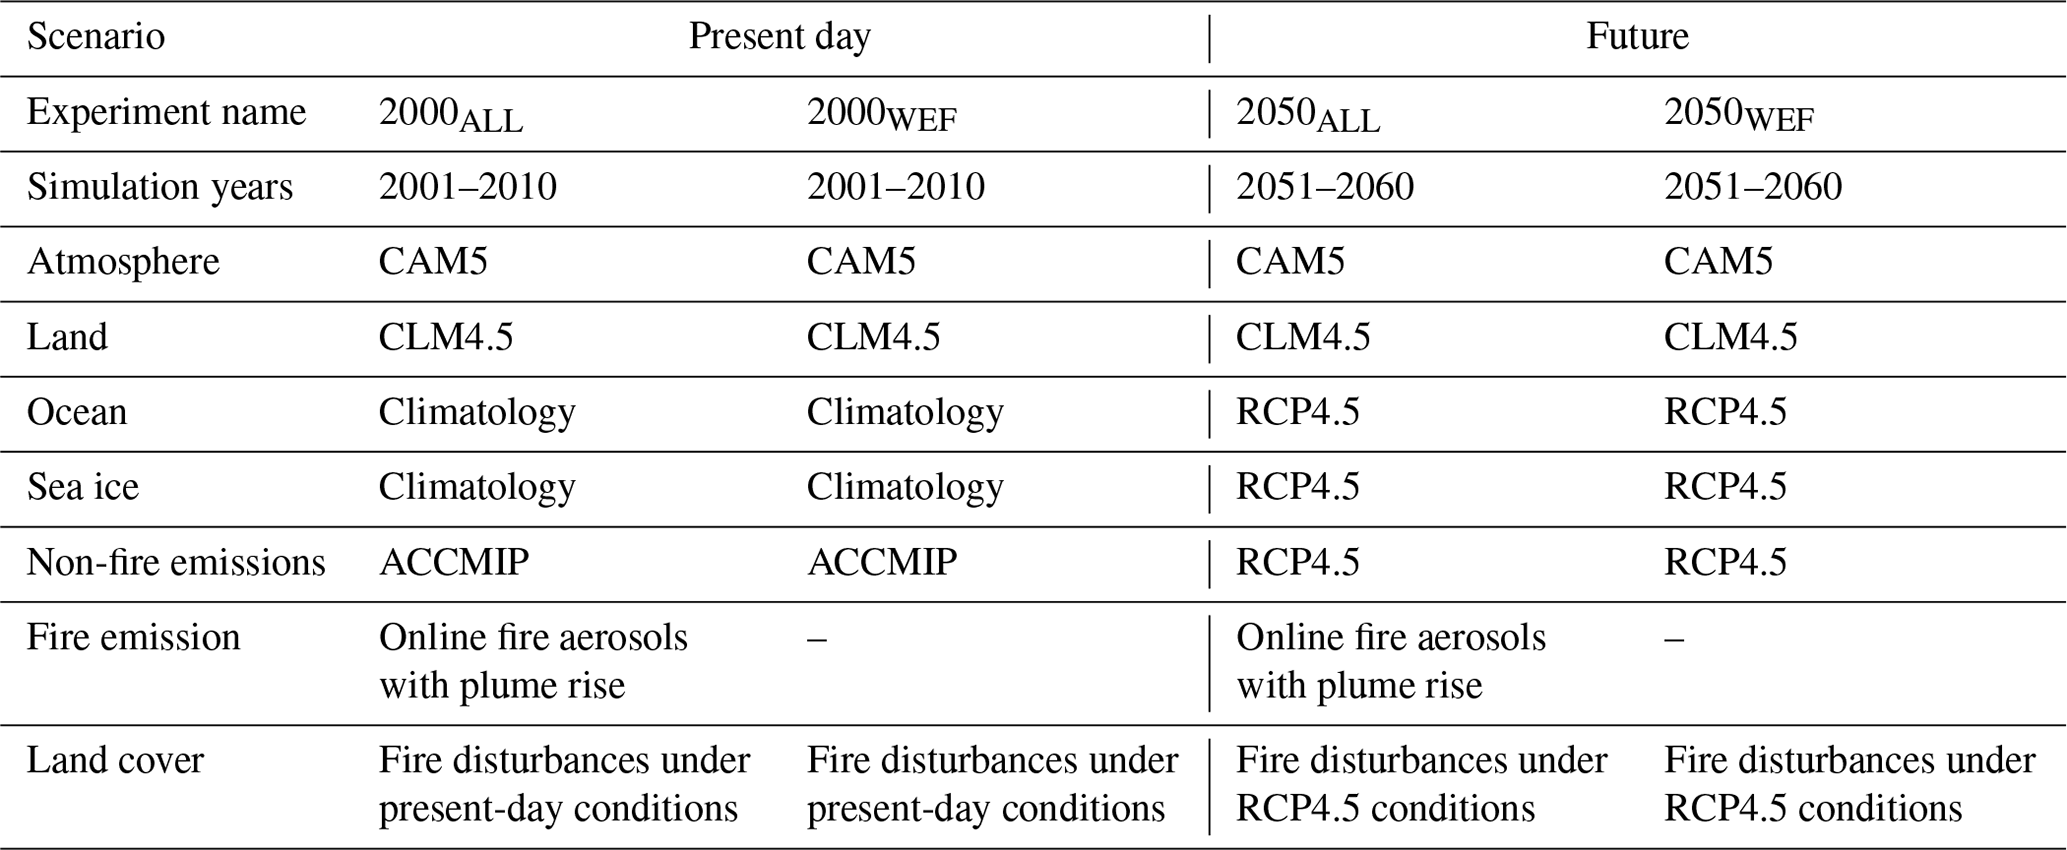
Here, we evaluate the simulated surface PM2.5 against satellite estimates (Fig. 1) over North America. The PM2.5 concentration is calculated as the sum of sulfate, nitrate, fine sea salt (first two size bins), fine dust (first size bin), black carbon (BC), and organic aerosol (OC) at the surface level of the model. OC is the sum of primary organic matter (POM) and secondary organic aerosol (SOA), and SOA is the sum of secondary species formed from toluene, monoterpenes, isoprene, benzene, and xylene. Figure 1 compares the observed and simulated mean annual PM2.5 averaged over 2001–2010. The 10-year-average satellite AOD-derived annual-mean surface PM2.5 concentrations (Van Donkelaar et al., 2018) are regridded to the model grid (Fig. 1a) and then compared with the RESFire simulations in the 2000ALL present-day run (Fig. 1b). The spatial distribution of annual surface PM2.5 is reasonably well simulated but also has some biases. To quantify the biases, we also estimated the correlation coefficient as well as normalized mean biases (NMBs) of the simulated values compared against the satellite-retrieved values over two subregions. Quantitatively, the NMB values over the western US (WUS) and eastern US (EUS) are 18 % and 7 %, respectively (Fig. 1c–d). In addition, the spatial variability in the 2001–2010 averaged annual AOD distribution (Supplement Fig. S1) is also well represented in our simulation, although the model underestimates high AOD values. Similar spatial variability and biases in AOD and PM2.5 were also found when a comparison was performed for only summer months (JJA). The simulated PM2.5 has also been evaluated against the ground-based Interagency Monitoring of Protected Visual Environments (IMPROVE) data, showing similar spatial pattern and biases (10 %–25 %) (Supplement Fig. S2). The biases are smaller over the eastern US and southwestern US region. The simulated PM2.5 values over California match quite well with the observed annual-mean values. However, the biases over the northwestern US region are ∼ 30 %–40 %, a portion of which could be attributed to possible biases in the model's meteorology in the northwestern US region. Nonetheless, both satellite and in situ evaluation indicates that our simulation biases are largely within the uncertainty range among the various satellite- and ground-based datasets, which have normalized mean biases ranging from −3.3 %–33.3 % when benchmarked against the ground-based IMPROVE data over the contiguous US (Diao et al., 2019; Val Martin et al., 2015).
Discrepancies between the simulated and observed PM2.5 values may be attributed to several potential reasons. First, the satellite-derived data have a non-zero lower bound of PM2.5 concentrations, so the ambient background concentrations for relatively cleaner regions such as the western US may be overestimated (Fig. 1c), also the sampling frequencies between these datasets are different. Second, year-2000-based constant non-fire emissions were used in the RESFire simulation, which may result in overestimation of the PM2.5 concentrations from non-fire sources during 2001–2010 when anthropogenic emissions and PM2.5 concentrations continue to decrease (US EPA, 2018). This overestimation is prominent in regions dominated by non-fire sources such as the southeastern US. Third, large uncertainties in fuel consumption and emission factors preclude an accurate estimation of the primary fire emissions in the model, especially for the eastern US, where large fractions of low-intensity prescribed fires consume only under-canopy fuels such as litter and duff layers. The fire model may fail to capture the subtle distinctions between low-intensity prescribed fires and forest fires, so more fuels are consumed and result in higher emissions. Lastly, comparison of a coarsely resolved simulation against in situ observations also contributes to uncertainty. Differences in the degree to which fire–climate interactions and other physical processes and feedbacks are represented by the models can explain the slight differences in estimating the present-day mean wildfire-induced change in PM2.5 over local and downwind regions between our simulations and previous studies. Nonetheless, reasonable simulation of the spatial distribution of wildfire-burned area, AOD, and near-surface particulate concentration (mean bias of ∼ 10 %–20 %) instills confidence about the fidelity of our model setup in particulate pollution simulation, which is the focus of this study.
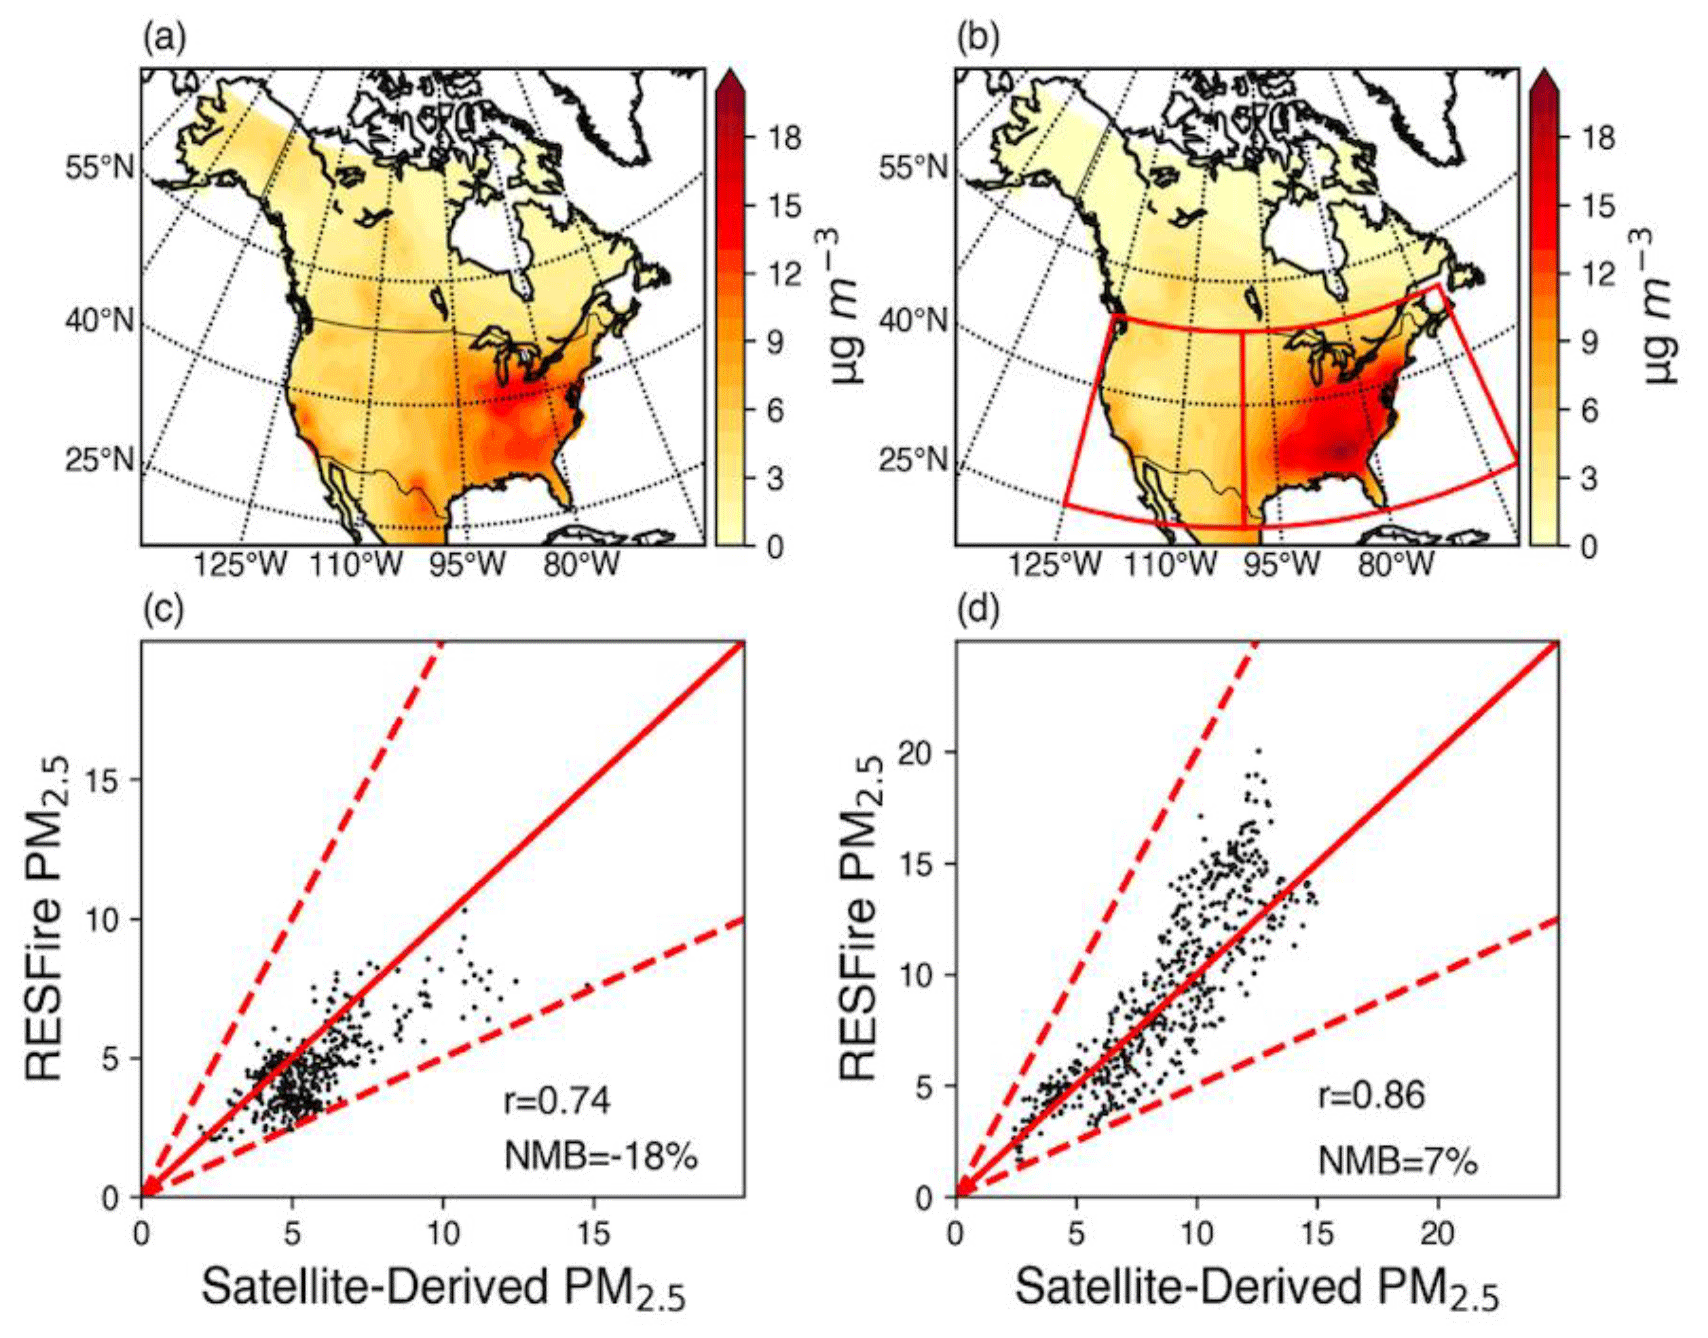
Figure 1Comparison of the 10-year-averaged (2001–2010) annual-mean surface PM2.5 concentration between observations and RESFire simulations. (a) Satellite-derived surface PM2.5 concentrations (with dust and sea salt removed) estimated by van Donkelaar et al. (2018) (available at https://sedac.ciesin.columbia.edu/data/set/sdei-global-annual-gwr-pm2-5-modis-misr-seawifs-aod, last access: 5 November 2021). (b) The 2000ALL simulated surface PM2.5 concentrations (with dust and sea salt removed) averaged over 2001–2010; the red boxes denote the two subregions (EUS and WUS) shown in Fig. 2 in the main text. (c) Comparison of simulated and satellite-based gridded surface PM2.5 concentrations in the WUS subregion; the number of samples is equal to the number of land grids (∼ 450). (d) Same as (c) but in the EUS subregion. The number of samples is equal to the number of land grids (∼ 375). The solid and dashed red lines denote the 1:1 ratio line and ± 100 % biases, respectively. The correlation coefficients and NMB values are shown at the lower-right corner of each subplot.
3.2 Fire-induced changes in burned area and PM2.5
The decadal-mean annual fire-burned area simulated for the present day shows widespread wildfires over all of North America (Fig. 2a). Specifically, Canada and the forested areas of the northwestern (> 36∘ N latitude) and southeastern (< 36∘ N latitude) US are most intensely affected by wildfires in the present day. By the mid-21st century, a striking increase of a factor of 2–5 in fire-burned area is projected over Canada, Alaska, the Pacific Northwest, and portions of the western US by the 2050s (Fig. 2b). A distinct positive shift in the probability density function (PDF) of annual fire-burned area is evident in the future, with the decadal-mean difference statistically significant at the 99 % confidence level (Zou et al., 2020). A small and statistically insignificant change in interannual variability (∼ 0.4 Mha yr−1) of fire-burned areas is also simulated between the present and future. Specifically, our model predicts more than a doubling of burned area in boreal regions of Canada in the future, in line with a previous projection for Canada (Wotton et al., 2017). Future enhancement in fire-burned area is ∼ 20 %–50 % in most fire grids over the western coast of the US, which is higher than that over the eastern US (Fig. 2a and c). The increase over the western US is closer to the lower bound of that derived from statistical model ensemble projections for the western US in the mid-21st century (Yue et al., 2013). The statistics-based projections of future burned area over North America were likely too high because fire-induced land cover change, fuel load reduction, and other factors could induce a negative fire feedback, which was not considered in previous fire projection studies (Zou et al., 2020).
Annual fire-burned area in the southeastern US shows a decline in the future (Fig. 2c), as precipitation is projected to increase in that region (discussed later). Note that all future fire changes between 2050ALL and 2000ALL are primarily associated with climate warming in response to the increase in greenhouse gas (GHG) concentrations in the RCP4.5 scenario. No direct impacts of population and socioeconomic changes on wildfires are included in our simulations, although these factors contribute to changes in GHG emissions (via the Representative Concentration Pathway – RCP – scenario) that influence the climate simulated in 2000ALL and 2050ALL. As about 80 % of the projected fire changes in the future are restricted to the summer season (JJA) (Fig. 2d), we focus on analysis of the summer-mean wildfire-induced PM2.5 and its projected future changes over North America.
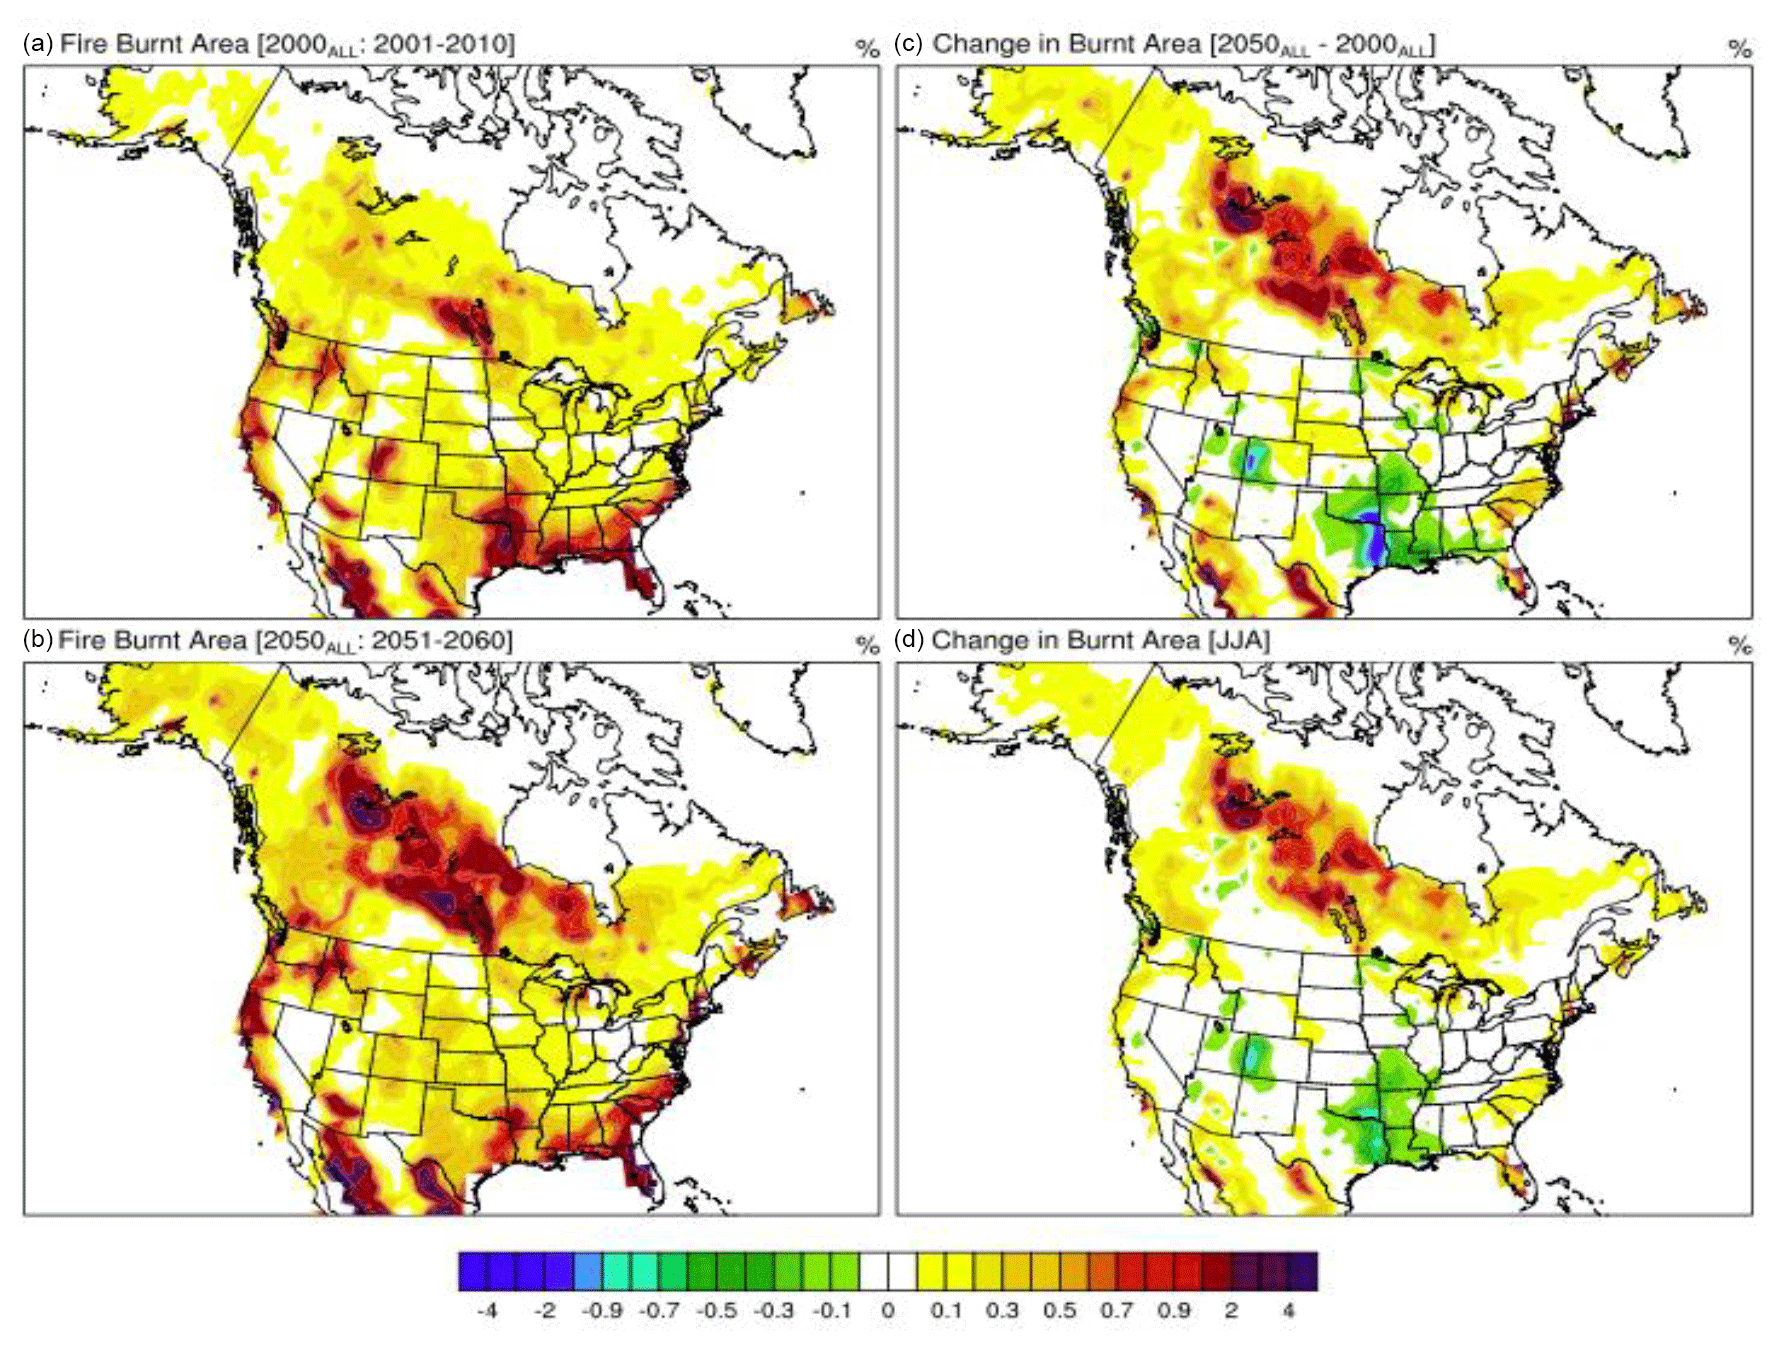
Figure 2Spatial distribution of fire-burned area. (a–d) Spatial distribution of simulated decadal-mean annual burned area (as a percentage) over North America for the present day (a) and the mid-21st century (b) and the net change between the 2050s and the 2000s (c). (d) Same as (c) but for wildfire-burned area during summer only (JJA). The color bar illustrates the grid fraction of area burned.
The simulated 10-year-averaged summer-mean wildfire-induced PM2.5 values in 2000ALL are more than 0.5 µg m−3 over a large part of North America in the present day, with noticeably larger values (> 1 µg m−3) in Canada and the northwestern, central, and southeastern US (Fig. 3a). Interestingly, the spatial distribution of wildfire-induced PM2.5 > 1 µg m−3 resembles an inverted horseshoe shape. The inverted horseshoe-shaped spatial distribution is also consistent with the wildfire smoke climatology derived from the satellite-guided operational smoke product of the Hazard Mapping System (HMS) during 2005–2015 (Brey et al., 2018; Kaulfus et al., 2017). By the mid-21st century, the spatial extent of the horseshoe shape for areas with wildfire-induced PM2.5 enhancement > 1 µg m−3 expands significantly to span most regions of North America, with the most pronounced enhancement occurring over Canada (Fig. 3b). The PDFs of the spatial distribution for the three regions can be seen in Fig. 3c–e. Specifically, wildfire-induced PM2.5 in the 2000s over Canada and the WUS and EUS during summer is ∼ 1–3, 1–3, and 0.6–1.2 µg m−3, respectively. Maximum values within the WUS region are found over the Pacific Northwest, with most areas having wildfire-induced PM2.5 values of ∼ 2–3 µg m−3. Similarly, the southern states have relatively high wildfire-induced PM2.5 concentrations of ∼ 2–4 µg m−3 within the EUS in the present-day simulation.
Compared to the 2000s, the wildfire-induced JJA-averaged PM2.5 values are almost doubled to ∼ 3–6 µg m−3 over Canada in the 2050s (Fig. 3b and c). Consistently, the values of wildfire-induced PM2.5 over the WUS (mainly coastal) also doubled in the 2050s compared to the 2000s, with modal values of ∼ 2–2.5 µg m−3 (Fig. 3d). Most interestingly, the enhancement in wildfire-induced summer-mean PM2.5 over the northern EUS is also significant by the 2050s (Fig. 3b). Largely, the summer-mean wildfire-induced PM2.5 concentration over the EUS increases from ∼ 0.8 to ∼ 2 µg m−3 in the mid-century to values of 1.2–3.0 µg m−3 (Fig. 3e). The summer-mean wildfire-induced PM2.5 is thus projected to double in North America by the 2050s compared to the 2000s, with a substantial coverage over the EUS. An important finding from these PDFs appears to be that there are fewer grids with < 1 µg m−3 wildfire-induced PM2.5 or, alternatively, that more regions are being influenced by PM2.5, and many areas that were already seeing wildfire impacts are seeing enhanced impacts. Such enhancement is found not only at the surface but also in an elevated atmospheric layer over the EUS between 900 and 700 hPa. This is nonintuitive given the fact that the increase in fire-burned area by mid-century over the EUS is not substantial.
Figure 3Spatial distribution of PM2.5 concentrations. Spatial distribution of decadal-mean wildfire-induced enhancement in summer (JJA) PM2.5 concentration over North America for the present day (2000ALL-2000WEF) (a) and the future (2050ALL–2050WEF) (b). The grids with statistical significance of 90 % are identified by black dots. (c–e) Probability density functions (PDFs) of wildfire contribution within the three regions shown in Fig. 2b for Canada (CND: black box) (c), the WUS (red box) (d), and the EUS (blue box) (e), respectively, for the 2000s (blue) and the 2050s (red). Only grids over land in North America are used to generate the PDFs. The y axis indicates the probability of occurrence of different PM2.5 values shown on the x axis. The color bar illustrates PM2.5 in micrograms per cubic meter.
As anthropogenic- and wildfire-induced PM2.5 concentrations may change differently with time across North America, next, we investigate the relative contribution of wildfire-induced PM2.5 to the total PM2.5 in the future. Prominent enhancement of the wildfire contribution is apparent in the entire domain by the 2050s (Fig. 4a–b). Largely, during the 2000s, the simulated fractional contribution of wildfires to PM2.5 is ∼ 15 %–50 % in Canada (Fig. 4a). Specifically, a bi-modal distribution is simulated over Canada with modal values around 18 % and 30 % (Fig. 4c). Over the WUS, the present-day simulated percentage contributions of wildfire-induced values are 5 %–25 % (Fig. 4a), with modal values between 10 %–20 % (Fig. 4d). Note that many areas located in the Pacific Northwest have higher values of ∼ 30 %–40 % (Fig. 4a). At the same time, the fractional contribution by wildfire-induced PM2.5 is ∼ 5 %–10 % in most areas of the EUS in the present day (Fig. 4f). Nevertheless, some areas in the central US also have higher values of ∼ 10 %–25 % (Fig. 4a).
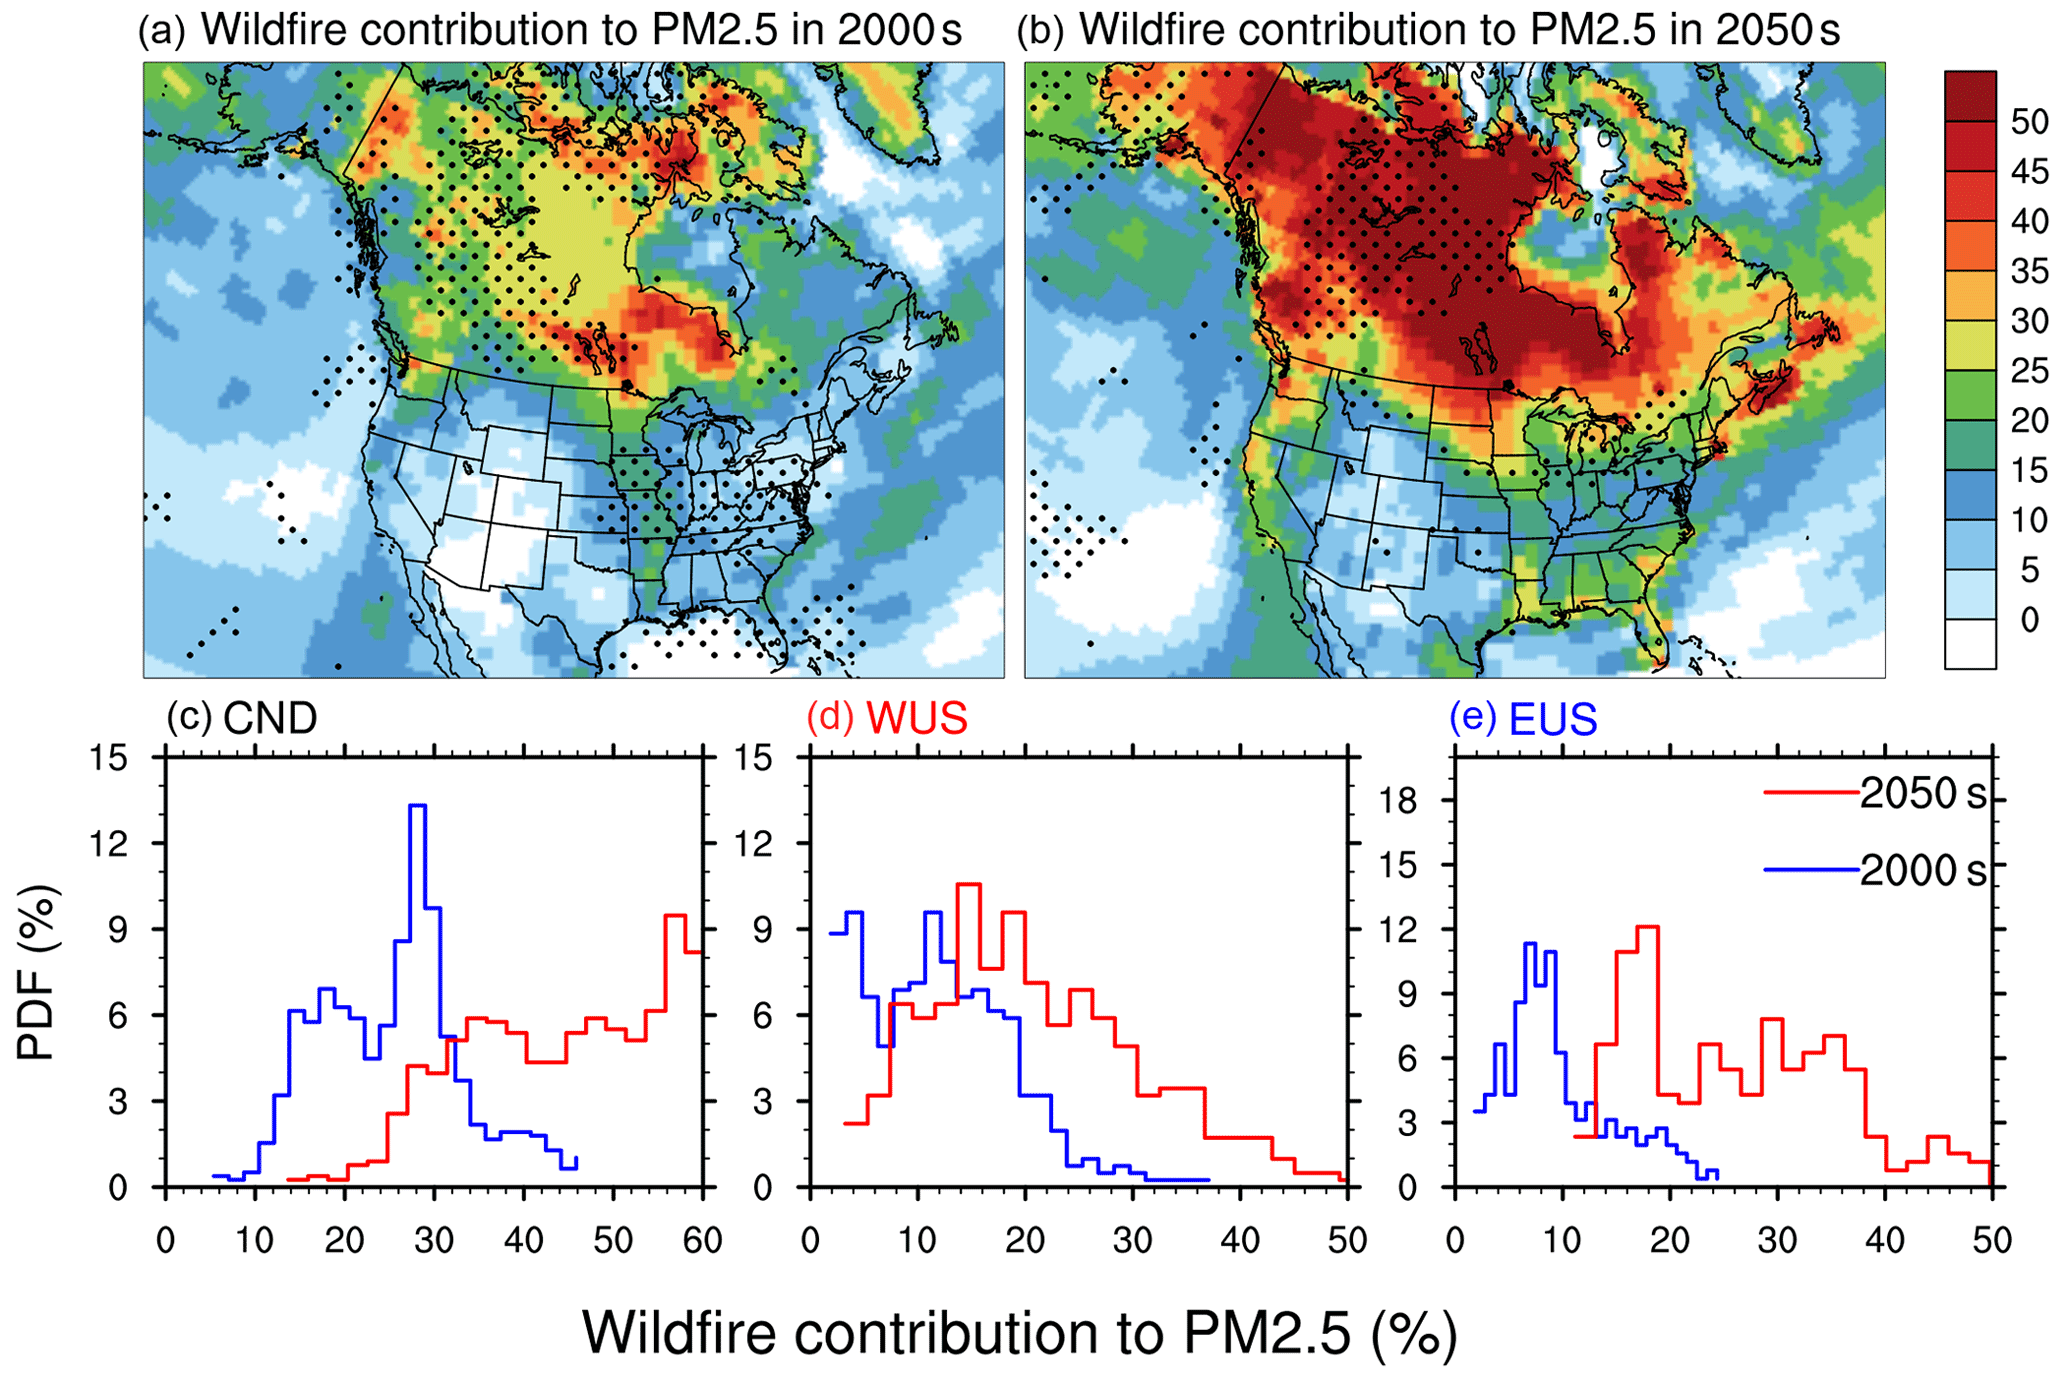
Figure 4Spatial distribution and probability density function of the percentage contribution of wildfire emissions. (a–b) Spatial distribution of the percentage contribution of wildfire emissions to decadal-averaged summer (JJA) mean PM2.5 concentrations over North America during the present day (a) and the future (b). The percentage contribution of wildfire-induced PM2.5 to the total PM2.5 concentrations is calculated as (2000ALL–2000WEF) 2000ALL and (2050ALL–2050WEF) 2050ALL for the present and future, respectively. The grids with statistical significance of 90 % are identified by black dots. (c–e) Probability density functions (PDFs) of the percentage of wildfire contribution within the three regions shown in Fig. 2d for Canada (CND: black box) (c), the WUS (red box) (d), and the EUS (blue box) (e), respectively, for the 2000s (blue) and the 2050s (red). Only grids over land in North America are used to generate the PDFs. The y axis indicates the probability of occurrence of different PM2.5 values shown on the x axis.
The wildfire contributions in the 2050s show a clear shift towards higher values in all subregions compared to the 2000s (Fig. 4b). Over Canada, the values shifted from 15 %–30 % in the 2000s to ∼ 30 %–60 % in the 2050s; a nearly 2-fold increase in the fractional contribution of wildfire emissions to the total PM2.5 concentration is simulated (Fig. 4b and corresponding PDF in Fig. 4c). Similarly, the contribution values increased to ∼ 10 %–35 % in the 2050s, compared to 10 %–20 % in the 2000s over the WUS (Fig. 4b), thereby featuring a broadening of the bi-modal distribution of wildfire contribution (Fig. 4d). The shift in the percentage contribution is most prominent for the higher values, corresponding to some areas located in the Pacific Northwest and on the west coast of the US (Fig. 4b). Consistent with Fig. 3b, the shift in the contribution values over the EUS is also very distinct, revealing an increase in the mode values from 6 %–10 % in the 2000s to ∼ 16 %–20 % by the 2050s (Fig. 4b and e). Thus, our results underscore a large increase in not only absolute values but also the contribution of wildfire emissions over the EUS in the future.
3.3 Mechanistic understanding of the underlying processes
The larger enhancement in the relative contribution of wildfire emissions to the total surface PM2.5 in the EUS in the 2050s can be explained by three mechanisms. First, due to the increase in Canadian and western US wildfires, downwind transport of wildfire smoke plumes to the EUS will be enhanced by the 2050s. This long-range transport to the atmospheric column of the EUS can happen within a few days of the fire occurrence (Supplement Fig. S3a and b). Using HMS-detected smoke plumes, recent studies identified a strong positive association between the transported smoke plumes in the atmospheric column and collocated surface PM2.5 enhancement in the EUS (Brey et al., 2018; Wu et al., 2018; Gunsch et al., 2018; Kaulfus et al., 2017; Larsen et al., 2017; Dempsey, 2013). HMS is an operational smoke detection product over North.
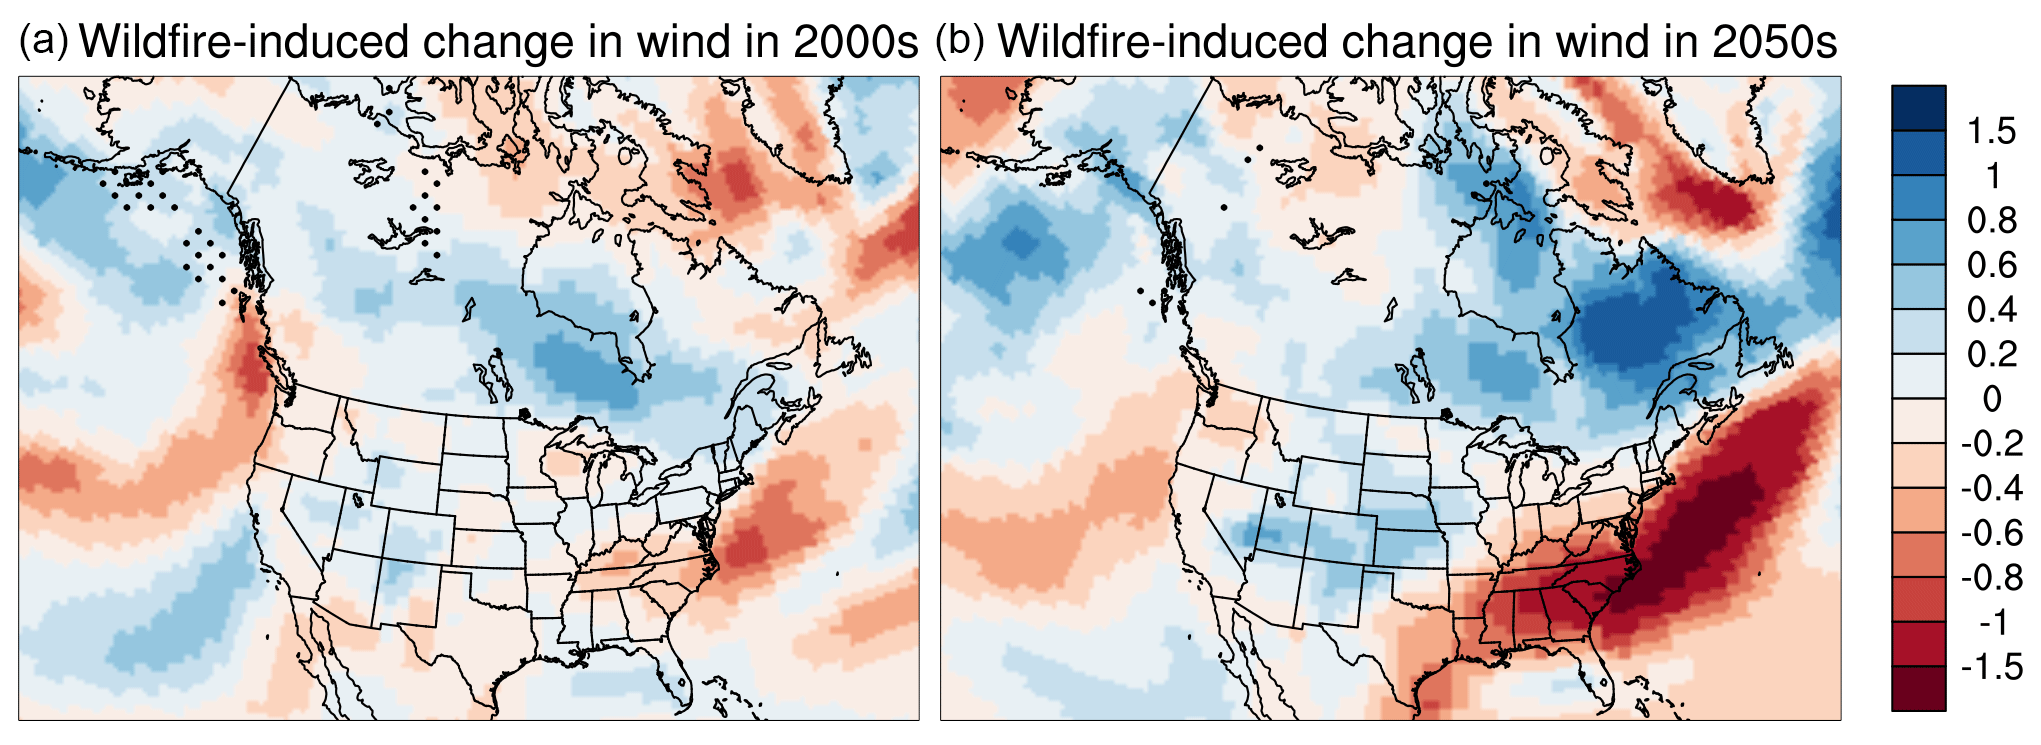
Figure 5Spatial distribution of decadal-mean summer (JJA) wildfire-induced future changes ((2050ALL–2050WEF)–(2000ALL–2000WEF)). (a) Wind speed below 850 hPa for 2050ALL–2000ALL, (b) wind speed below 850 hPa for 2050WEF–2000WEF. The unit is meters per second. The grids with statistical significance of 90 % are identified by black dots.
America developed by the National Oceanic and Atmospheric Administration (NOAA) and operated by the National Environmental Satellite, Data, and Information Service (NESDIS), available at http://satepsanone.nesdis.noaa.gov/FIRE/fire.html (last access: 20 November 2022). Specifically, these studies found that the smoke plumes transported from Canada are located at an altitude of ∼ 1–3 km over the EUS (Colarco et al., 2004; Wu et al., 2018). Due to mixing by the daytime boundary layer and deposition, the smoke plumes enhance the surface PM2.5 concentration over the EUS (Wu et al., 2018; Colarco et al., 2004; Rogers et al., 2020; Dreessen et al., 2015). Hence HMS smoky days may be a useful proxy for wildfire-induced surface PM2.5 over North America. In agreement, Brey et al. (2018) showed that the HMS-based smoke plumes observed over the EUS are significantly aged, suggestive of their long-range-transport origin. Consistent with the observed temporal change in HMS pattern, Xue et al. (2021) estimated using the mid-visible Multi-Angle Implementation of Atmospheric Correction (MAIAC) satellite-derived aerosol optical depth (AOD) that Canadian and western US fires have caused an increase in the daily PM2.5 over Montana, North Dakota, South Dakota, and Minnesota by 18.3, 12.8, 10.4, and 10.1 µg m−3, respectively, between August 2011 (a low-fire month) and August 2018 (a high-fire month). In summary, the visually apparent satellite-based signatures of wildfire smoke across Canada and the EUS provide necessary, though not sufficient, support for the influence of Canadian smoke plumes on EUS air quality. Although, the change in burned area over the northeastern EUS is negligible compared to the western US and Canadian regions, there are some enhancements seen over the east coast of the US, which can also contribute to enhanced fire emissions.
In the future, the wildfire-induced change in speed of the westerly jet flows over Canada wildfire regions is increased (Fig. 5a–b). It indicates that the westerly-induced transported wildfire emissions from Canada boreal forests to the eastern half of North America and the EUS will be enhanced in the future compared to that in the present era. On the one hand, the wildfire-induced changes in wind speed over the EUS are reduced in the future, which implies that the local emissions over the EUS are less dispersed. Simultaneously, this will also cause the transporting smoke plumes to slow down and be subjected to relatively more boundary layer mixing over the EUS and dry deposition/settling enhancements, thereby contributing to the enhanced PM2.5 values at the surface. The westerly winds over the western US below 40∘ N are also strengthened in the future (Fig. 5a–b) compared to the present day, which indicates more advection flux wildfire emissions to the EUS. Thus, the net effect is more removal of wildfire-emitted PM2.5 from the WUS and more influx of wildfire-emitted PM2.5 in the EUS.
Along with these dynamical changes, other climatic feedbacks simulated can also contribute to enhancement of EUS pollution. Specifically, the enhancement of wildfire-induced smoke aerosols increases solar absorption and scattering in the future (Fig. 6a). This reduces the incoming solar radiation reaching the surface (Fig. 6b) and induces surface cooling. With atmospheric warming and surface cooling, lower-tropospheric stability is enhanced by wildfire aerosols in the future (Fig. 6c). The smoke plumes which reach the eastern US are at an elevated altitude due to the self-lofting property of absorbing aerosols as they travel downwind, but the smoke over the western US is at near-surface elevation as it is at its source region. This can explain the more significant atmospheric stability simulated over the eastern US compared to the source regions in western US and boreal forests of Canada. Relatively stronger atmospheric stability over the eastern US imposes a stronger thermal capping that traps more anthropogenic aerosols and particulate matter near the surface over the EUS (already an emission hotspot). At the same time, future increase in wildfire emissions also leads to greater reduction in monthly rainfall (Fig. 6d) over the EUS, which may additionally strengthen the positive feedback to surface PM2.5 over the EUS by reducing wet scavenging of transported wildfire smoke to the EUS. Thus, wildfire-emitted aerosols induce positive feedback on the surface PM2.5 concentration over the EUS through fire–climate interactions that vary on a regional scale. Moreover, the above-discussed dynamical changes in the future can also feedback these simulated thermodynamical and precipitation changes, exaggerating the enhancement in PM2.5 values over the EUS in the future. However, due to computational constraints, no direct quantification of the magnitude of these feedbacks (with aerosol–radiation and aerosol–cloud interactions turned off) on PM2.5 is performed and would be taken up in future studies.
Lastly, the reason for why the contribution of wildfire emissions to the total surface PM2.5 in the EUS is so substantial in the 2050s is the drastic reduction in anthropogenic contribution to the surface PM2.5 over the EUS in the future primarily due to policy-driven reduction in anthropogenic emissions under the RCP4.5 scenario. Specifically, the simulated ambient summer mean PM2.5 concentration exhibits widespread declines in the future (Supplement Fig. S4), with reduction in PM2.5 concentration over the eastern US in the range of 4–15 µg m−3, which is greatest within North America. Thus, a large reduction in anthropogenic contribution combined with increased downwind advection of Canadian smoke and the associated positive feedbacks can explain the projected dominance of wildfire emissions over the EUS in the future.
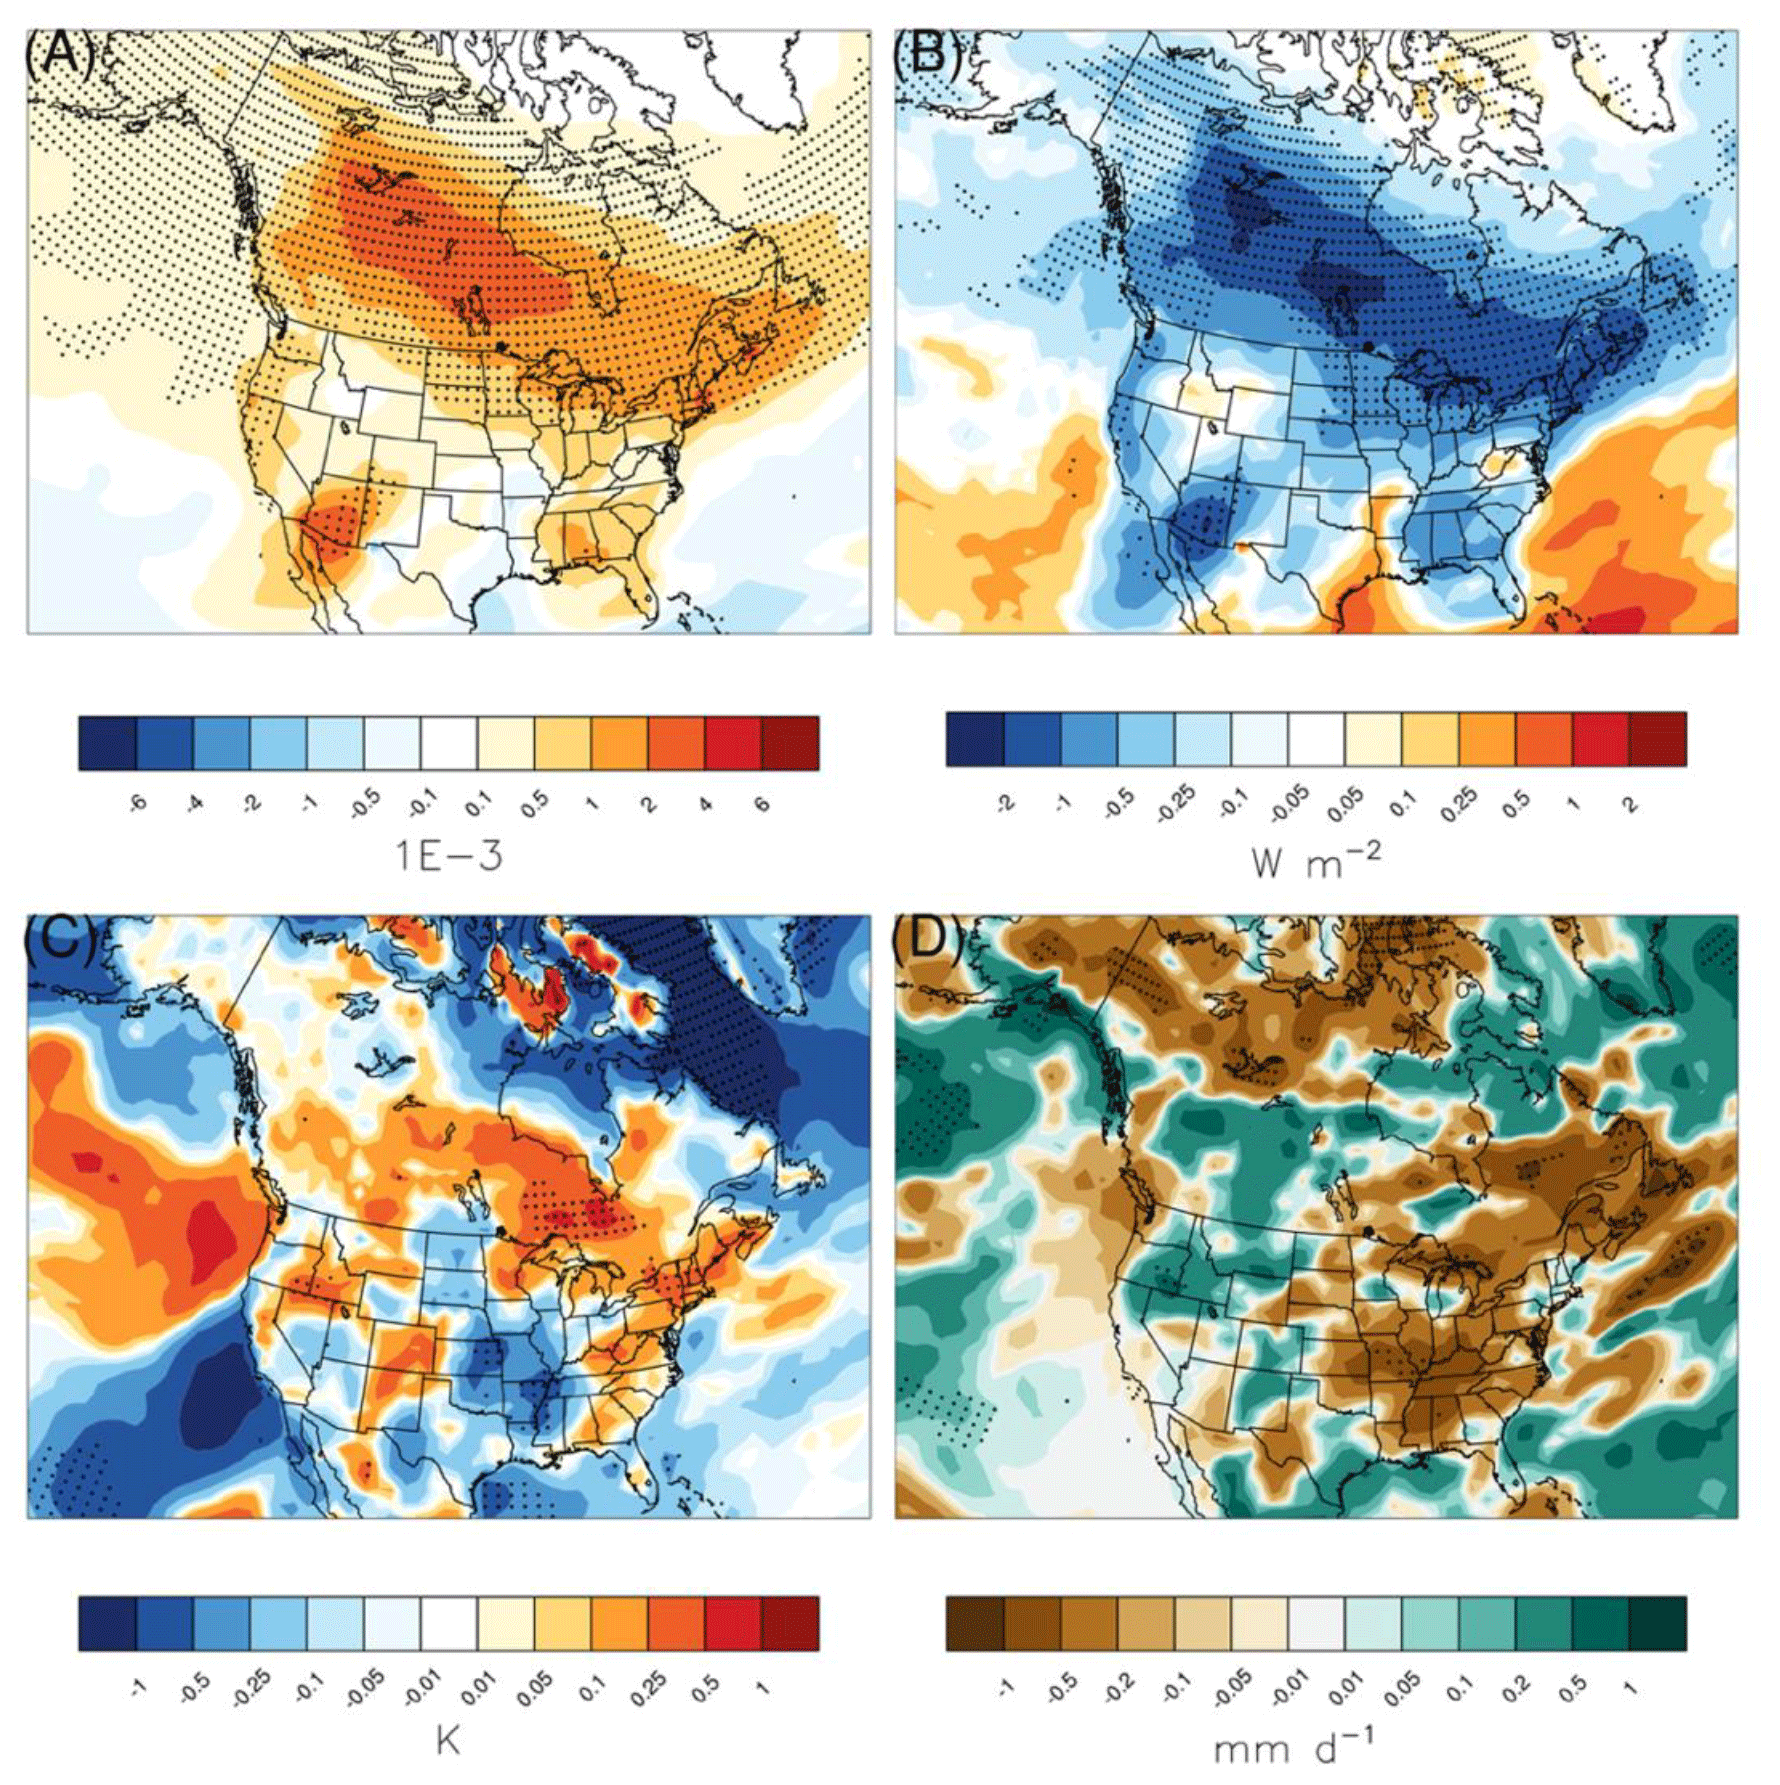
Figure 6Spatial distribution of decadal-mean summer (JJA) wildfire-induced future changes ((2050ALL–2050WEF)–(2000ALL–2000WEF)). (a) Aerosol absorption optical depth at 550 nm, (b) aerosol direct radiative forcing at the surface, (c) lower-tropospheric stability calculated as the difference between the potential temperature at 900 and 1000 hPa, (d) summer-averaged precipitation rates over North America. Areas marked with black dots indicate grids where changes are significant at the 95 % confidence level.
3.4 Future implications and uncertainties
However, is the simulated future enhancement in wildfire contribution over the EUS substantial enough to affect the surface PM2.5 values over the EUS in the future? The World Health Organization (WHO) air quality guidelines for annual and daily PM2.5 concentration are 10 and 25 µg m−3, respectively. As no specific guideline for seasonal-mean PM2.5 in the summer is available, we use the annual guideline value as a reference to understand the implication of wildfire emissions for ambient PM2.5 concentration in the future. Interestingly, the mean summertime PM2.5 concentration in the wildfire-emission-free (WEF) scenario is projected to remain within 10 µg m−3 over most of North America, except for the southeastern US (∼ 15 % of the domain) (Fig. 7a). However, the ALL scenario projects an increase in the exposure concentration level such that values > 10 µg m−3 are common in Canada and the EUS in the future (Fig. 7b). Quantitatively, over Canada, the entire PDF of PM2.5 concentration shifts towards higher values by ∼ 5–6 µg m−3. Specifically, the modal value shifts from ∼ 6 µg m−3 in 2050WEF to 11–12 µg m−3 in 2050ALL (Fig. 7c), so PM2.5 concentration is projected to surpass the WHO guidelines over a large fraction of Canada in the future. Similarly, the entire PDF of PM2.5 concentration shifts towards higher values by ∼ 2–3 µg m−3 over the EUS, with the mode of the PDF increasing from ∼ 7–8 µg m−3 in 2050WEF to ∼ 10–11 µg m−3 in 2050ALL (Fig. 7e). The modal value of summer mean PM2.5 over the WUS increases from ∼ 6 µg m−3 in 2050WEF to ∼ 7–8 µg m−3 in 2050ALL (Fig. 7d), although a few grid cells show PM2.5 values greater than 10 µg m−3 (Fig. 7b).
Clearly, the climate-induced enhancement in fires and its influence via the advected wildfire smoke to the EUS can have significant implications for air quality management in the future. The PM2.5 enhancement in the future over the southern states within the EUS is large (Fig. 7a–b), which is consistent with the results of Figs. 3 and 4. However, the future change in burned area over the same region is negligible or mostly reducing (Fig. 1c–d). Thus, it can be argued that the simulated enhancement is mostly related to the dynamic perturbations and thermodynamical feedbacks due to wildfire emissions (Fig. 6). As the rate of anthropogenic emissions is also the highest regionally over the southeastern states, the impact of these wildfire-induced climatic feedbacks on local air quality is distinctly seen over the EUS.
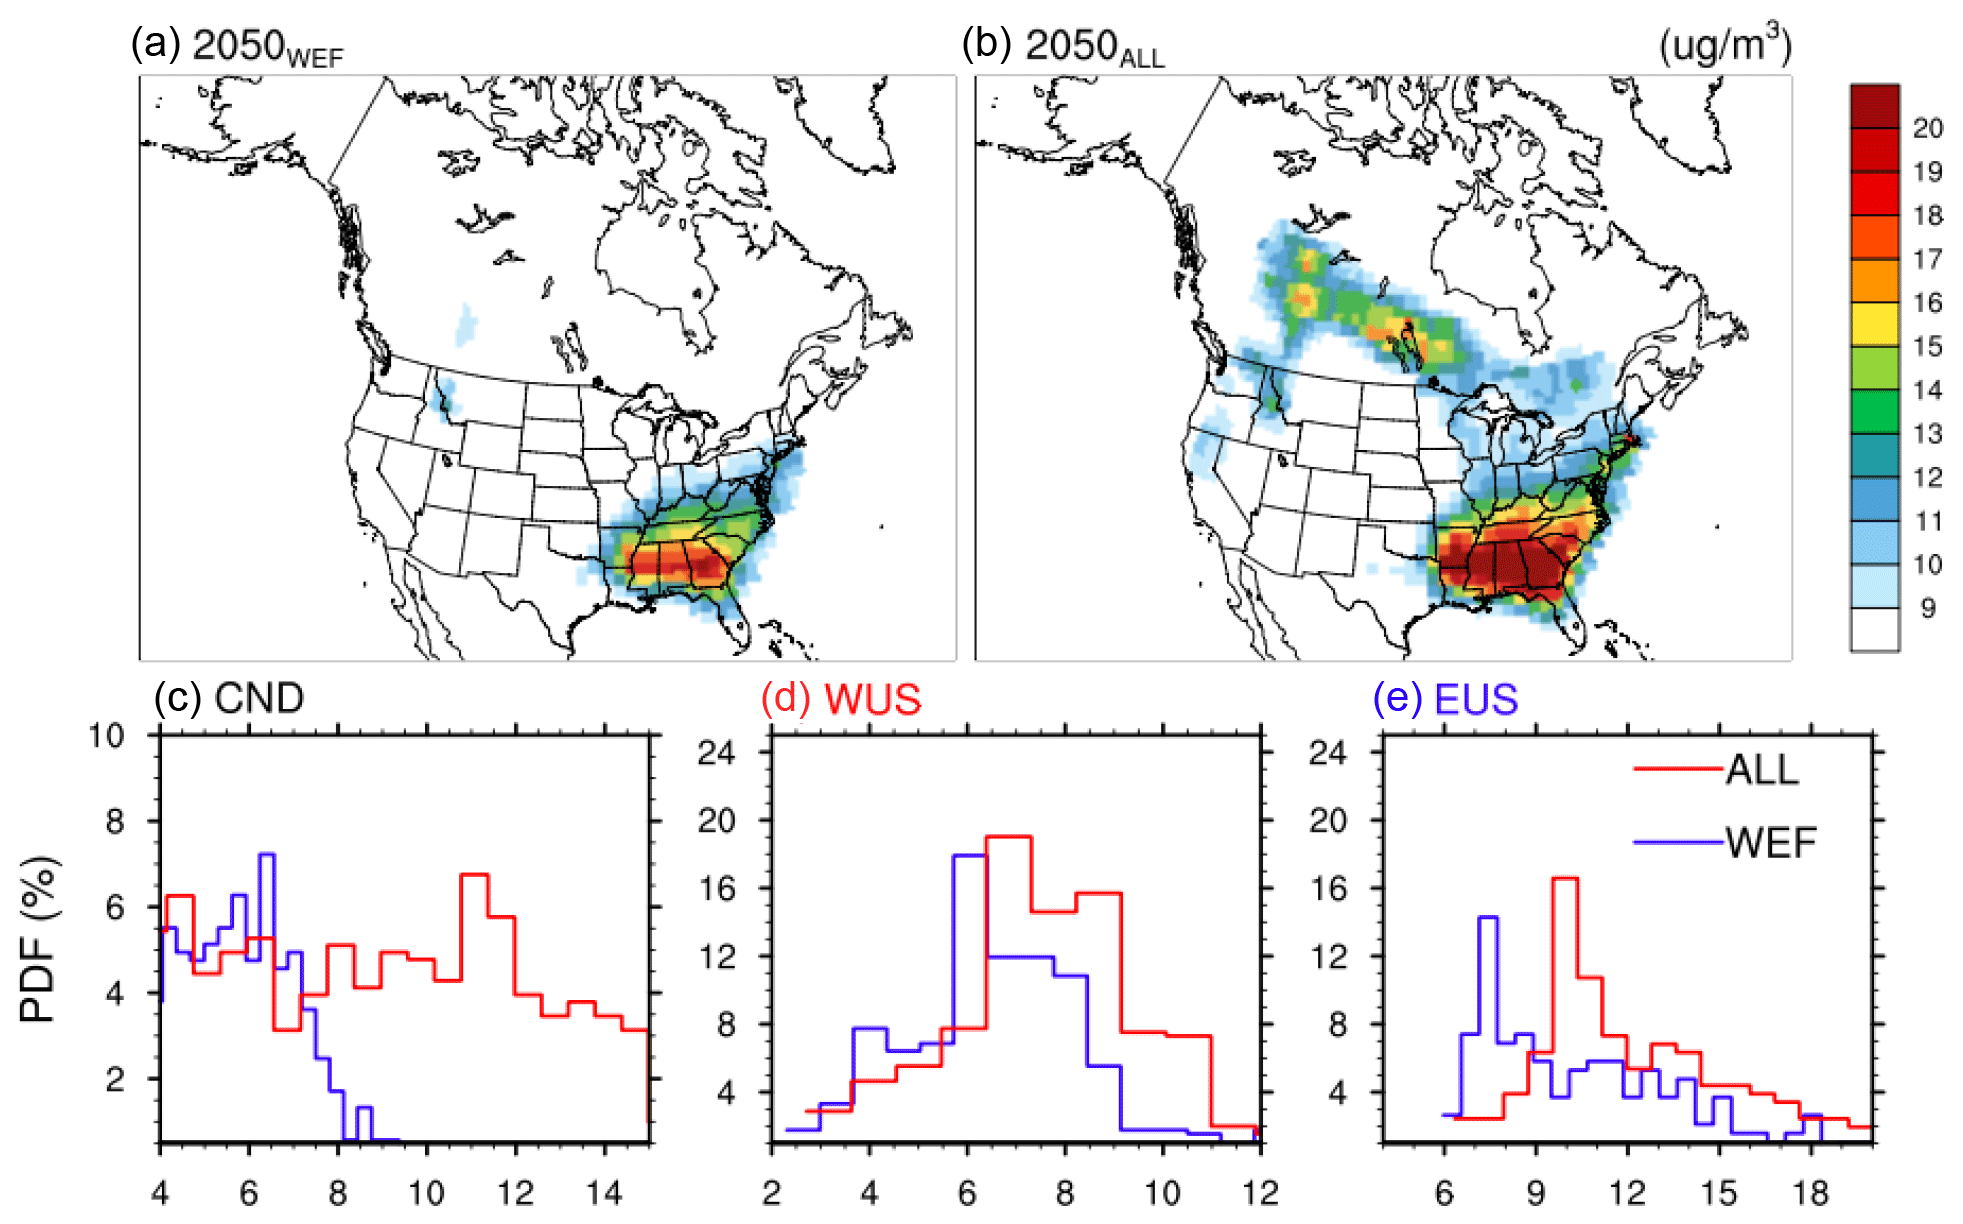
Figure 7Spatial distribution and probability density function of PM2.5 concentration in the 2050s. (a–b) Spatial distribution of decadal-average summer (JJA) mean PM2.5 concentration over North America in the mid-21st century from 2050WEF (wildfire-emission-free) (a) and 2050ALL (wildfire-emission-inclusive) (b). (c–e) Probability density functions (PDFs) of the same within the three regions shown in Fig. 2b for Canada (CND) (c), the western US (WUS) (d), and the eastern US (EUS) (e), respectively, for the 2050WEF (blue) and 2050ALL (red) runs. The y axis indicates the probability of occurrence of different PM2.5 values shown on the x axis. Only grids over land in North America are used to generate the PDFs. Note the different ranges of values shown on the y and x axis in (c)–(e). The color bar and the x axis for panels (c)–(e) indicate PM2.5 values.
Note that our simulated present-day estimates of wildfire-induced PM2.5 values as well as the percentage contribution of wildfire emissions are within the range of reported values in previous studies over the domain, which augment the fidelity of our future projections. Specifically, our simulated present-day estimates of wildfire-induced PM2.5 values are also within the range of reported values in previous studies over the domain. Reported values of wildfire-induced PM2.5 over the WUS during summertime vary from ∼ 1 µg m−3 (Jaffe et al., 2008) to ∼ 2 µg m−3 (Park et al., 2007) and ∼ 3 µg m−3 (Ford et al., 2018), with the highest values documented over the Pacific Northwest and west coast regions (∼ 1–4 µg m−3) (O'Dell et al., 2019). The wildfire-induced PM2.5 over the EUS during summertime varies from ∼ 1 µg m−3 (Park et al., 2007) to ∼ 2.5 µg m−3 (∼ 3 µg m−3 in the southeastern US) (Ford et al., 2018). Consistently, our simulated present-day estimates of wildfire contribution values are also within the range of reported values in previous studies. For example, Meng et al. (2019) found that wildfires can be the largest sectoral contributor (∼ 18 %–59 %) to the population-weighted PM2.5 in various subregions of Canada. Over the WUS, the present-day percentage contribution of wildfire-induced PM2.5 to the total PM2.5 is reported to be ∼ 12 % (Liu et al., 2017), ∼ 15 % (Park et al., 2007), and ∼ 30 % (Ford et al., 2018), with higher values of ∼ 40 % in the Pacific Northwest (O'Dell et al., 2019). Over the EUS our simulated values are also within the range of previously reported values of ∼ 5 % (Park et al., 2007) and ∼ 15 %–18 % (Ford et al., 2018). However, our two-way coupled simulations illustrate that future enhancement in the wildfire-associated PM2.5 over the EUS could be greater compared to the western US, which is not emphasized explicitly in any of the previous studies (although Ford et al., 2018, illustrated an increase in PM2.5 over the mid-US and central US from Canadian fires). These could be since inclusion of the wildfire-induced climatic feedbacks in our simulation is an unprecedented exercise. Please also note that our study is focused on the JJA period, and the wildfires in the western US mainly occur during August–September, so the results should be compared consciously.
Nonetheless, inherent limitations in our simulations may introduce uncertainties in the projected future changes. For example, our reported changes in PM2.5 concentrations based on relatively coarse-resolution simulations and decadal averages likely represent a low-end estimate compared to changes at regional and daily/weekly scales. Moreover, our experiments do not consider the direct human influences such as population change and socioeconomic development on wildfires, which may aggravate the increase in PM2.5 concentrations over the densely populated EUS in the future. Common sources of uncertainty in modeling burned area and fire emission and fire aerosol and smoke are also present in our model. Fire smoke, in particular, is extremely hard to measure and evaluate. Lastly, inherent uncertainties in the physics parameterizations used in the model, sensitivity of climate to GHG emissions, and the RCP scenarios should also be noted. Thus, ensemble modeling considering different emissions scenarios, population, and future time periods and the use of a finer spatial resolution may provide a more robust and better quantification of the wildfire-induced impact on policy-regulated improvements in PM2.5 over the EUS.
In summary, online-coupled fire–climate–ecosystem simulations project a nearly 2-fold increase in wildfire-induced summer-mean surface PM2.5 concentration by the mid-21st century over all of North America. In a wildfire-emission-free future, a large portion of North America will have PM2.5 values below the WHO guidelines. But in a future with wildfire emissions, the improvements from policy-driven reductions in anthropogenic PM2.5 will be compromised by the projected doubling of PM2.5 from wildfires. More strikingly, wildfire-induced enhancement in surface PM2.5 values and percentage contribution of the wildfire emissions over the EUS could be substantial by mid-century. This is mainly because of the large enhancement in fires over North America by the 2050s and associated increase in the amount of downwind transport of smoke to the EUS. In addition, enhancement of smoke transport induces a positive climate feedback to PM2.5 concentrations over the EUS by increasing the lower-tropospheric stability and reducing wet-scavenging rates. Despite the inherent limitations, this study highlights the natural versus anthropogenic contributions and the non-local nature of air pollution that can complicate regulatory strategies aimed at improving air quality over the eastern US in a warmer future.
The model code and scripts are available at https://portal.nersc.gov/project/m1660/yang560/wildfire (Sarangi and Qian, 2023).
The HMS data used in this paper are available for free through the link https://www.ospo.noaa.gov/Products/land/hms.html (NOAA, 2023). The model simulation data are available at https://portal.nersc.gov/project/m1660/yang560/wildfire (Sarangi and Qian, 2023).
The supplement related to this article is available online at: https://doi.org/10.5194/acp-23-1769-2023-supplement.
YQ, CS, and LRL designed this study. CS did the model and satellite analysis and wrote the first draft of the manuscript. YuZ performed the simulations. All authors provided inputs throughout the study and helped in the drafting and submission process.
At least one of the (co-)authors is a member of the editorial board of Atmospheric Chemistry and Physics. The peer-review process was guided by an independent editor, and the authors also have no other competing interests to declare.
Publisher’s note: Copernicus Publications remains neutral with regard to jurisdictional claims in published maps and institutional affiliations.
This article is part of the special issue “The role of fire in the Earth system: understanding interactions with the land, atmosphere, and society (ESD/ACP/BG/GMD/NHESS inter-journal SI)”. It is a result of the EGU General Assembly 2020, 4–8 May 2020.
Chandan Sarangi acknowledges the New Faculty Initiation grant from IIT Madras (project number CE/20-21/065/NFIG/008961) and support from Aqua-HPC at IIT Madras. PNNL is operated by Battelle Memorial Institute for the US Department of Energy under contract DE-AC06-76RLO-1830.
This research was funded under assistance agreement no. RD835871 by the US Environmental Protection Agency to Yale University through the SEARCH (Solutions for Energy, AiR, Climate, and Health) Center. It has not been formally reviewed by the EPA. The views expressed in this document are solely those of the SEARCH Center and do not necessarily reflect those of the EPA. The EPA does not endorse any products or commercial services mentioned in this publication. This research was also partly funded by Office of Science, U.S. Department of Energy Biological and Environmental Research, as part of the Regional and Global Model Analysis and Multisector Dynamics program areas.
This paper was edited by Yuan Wang and reviewed by two anonymous referees.
Abatzoglou, J. T. and Williams, A. P.: Impact of anthropogenic climate change on wildfire across western US forests, P. Natl. Acad. Sci. USA, 113, 11770–11775, https://doi.org/10.1073/pnas.1607171113, 2016.
Black, C., Tesfaigzi, Y., Bassein, J. A., and Miller, L. A.: Wildfire smoke exposure and human health: Significant gaps in research for a growing public health issue, Environ. Toxicol. Pharmacol., 55, 186–195, https://doi.org/10.1016/j.etap.2017.08.022, 2017.
Brey, S. J., Ruminski, M., Atwood, S. A., and Fischer, E. V.: Connecting smoke plumes to sources using Hazard Mapping System (HMS) smoke and fire location data over North America, Atmos. Chem. Phys., 18, 1745–1761, https://doi.org/10.5194/acp-18-1745-2018, 2018.
Colarco, P. R., Schoeberl, M. R., Doddridge, B. G., Marufu, L. T., Torres, O., and Welton, E. J.: Transport of smoke from Canadian forest fires to the surface near Washington, D.C., Injection height, entrainment, and optical properties, J. Geophys. Res.-Atmos., 109, https://doi.org/10.1029/2003JD004248, 2004.
Dempsey, F.: Forest Fire Effects on Air Quality in Ontario: Evaluation of Several Recent Examples, Bull. Am. Meteorol. Soc., 94, 1059–1064, https://doi.org/10.1175/BAMS-D-11-00202.1, 2013.
Diao, M., Holloway, T., Choi, S., O'Neill, S. M., Al-Hamdan, M. Z., Van Donkelaar, A., Martin, R. V., Jin, X., Fiore, A. M., Henze, D. K., Lacey, F., Kinney, P. L., Freedman, F., Larkin, N. K., Zou, Y., Kelly, J. T., and Vaidyanathan, A.: Methods, availability, and applications of PM2.5 exposure estimates derived from ground measurements, satellite, and atmospheric models, J. Air Waste Manage. Assoc., 69, 1391–1414, https://doi.org/10.1080/10962247.2019.1668498, 2019.
Dreessen, J., Sullivan, J., and Delgado, R.: Observations and impacts of transported Canadian wildfire smoke on ozone and aerosol air quality in the Maryland region on June 9–12, 2015, J. Air Waste Manage. Assoc., 66, 842–862, https://doi.org/10.1080/10962247.2016.1161674, 2016.
Ford, B., Val Martin, M., Zelasky, S. E., Fischer, E. V., Anenberg, S. C., Heald, C. L., and Pierce, J. R.: Future Fire Impacts on Smoke Concentrations, Visibility, and Health in the Contiguous United States, GeoHealth, 2, 229–247, https://doi.org/10.1029/2018GH000144, 2018
Gillett, N. P.: Detecting the effect of climate change on Canadian forest fires, Geophys. Res. Lett., 31, L18211, https://doi.org/10.1029/2004GL020876, 2004.
Guan, S., Wong, D. C., Gao, Y., Zhang, T., and Pouliot, G.: Impact of wildfire on particulate matter in the southeastern United States in November 2016, Sci. Total Environ., 724, 138354, https://doi.org/10.1016/j.scitotenv.2020.138354, 2020.
Gunsch, M. J., May, N. W., Wen, M., Bottenus, C. L. H., Gardner, D. J., VanReken, T. M., Bertman, S. B., Hopke, P. K., Ault, A. P., and Pratt, K. A.: Ubiquitous influence of wildfire emissions and secondary organic aerosol on summertime atmospheric aerosol in the forested Great Lakes region, Atmos. Chem. Phys., 18, 3701–3715, https://doi.org/10.5194/acp-18-3701-2018, 2018.
Haikerwal, A., Doyle, L. W., Wark, J. D., Irving, L., and Cheong, J. L.: Wildfire smoke exposure and respiratory health outcomes in young adults born extremely preterm or extremely low birthweight, Environ. Res., 197, 111159, https://doi.org/10.1016/j.envres.2021.111159, 2021.
Harris, R. M. B., Remenyi, T. A., Williamson, G. J., Bindoff, N. L., and Bowman, D. M. J. S.: Climate–vegetation–fire interactions and feedbacks: trivial detail or major barrier to projecting the future of the Earth system?, WIREs Clim. Chang., 7, 910–931, https://doi.org/10.1002/wcc.428, 2016.
Hong, C., Zhang, Q., Zhang, Y., Davis, S. J., Tong, D., Zheng, Y., Liu, Z., Guan, D., He, K., and Schellnhuber, H. J.: Impacts of climate change on future air quality and human health in China, P. Natl. Acad. Sci. USA, 116, 17193–17200, https://doi.org/10.1073/pnas.1812881116, 2019.
Hurtt, G. C., Frolking, S., Fearon, M. G., Moore, B., Shevliakova, E., Malyshev, S., Pacala, S. W., and Houghton, R. A.: The underpinnings of land-use history: three centuries of global gridded land-use transitions, wood-harvest activity, and resulting secondary lands, Glob. Change Biol., 12, 1208–1229, https://doi.org/10.1111/j.1365-2486.2006.01150.x, 2006.
Jaffe, D., Hafner, W., Chand, D., Westerling, A., and Spracklen, D.: Interannual Variations in PM2.5 due to Wildfires in the Western United States, Environ. Sci. Technol., 42, 2812–2818, https://doi.org/10.1021/es702755v, 2008.
Johnston, F. H., Henderson, S. B., Chen, Y., Randerson, J. T., Marlier, M., DeFries, R. S., Kinney, P., Bowman, D. M. J. S., and Brauer, M.: Estimated Global Mortality Attributable to Smoke from Landscape Fires, Environ. Health Perspect., 120, 695–701, https://doi.org/10.1289/ehp.1104422, 2012.
Jolly, W. M., Cochrane, M. A., Freeborn, P. H., Holden, Z. A., Brown, T. J., Williamson, G. J., and Bowman, D. M. J. S.: Climate-induced variations in global wildfire danger from 1979 to 2013, Nat. Commun., 6, 7537, https://doi.org/10.1038/ncomms8537, 2015.
Kaulfus, A. S., Nair, U., Jaffe, D., Christopher, S. A., and Goodrick, S.: Biomass Burning Smoke Climatology of the United States: Implications for Particulate Matter Air Quality, Environ. Sci. Technol., 51, 11731–11741, https://doi.org/10.1021/acs.est.7b03292, 2017.
Kirchmeier-Young, M. C., Zwiers, F. W., Gillett, N. P., and Cannon, A. J.: Attributing extreme fire risk in Western Canada to human emissions, Clim. Change, 144, 365–379, https://doi.org/10.1007/s10584-017-2030-0, 2017.
Kitzberger, T., Falk, D. A., Westerling, A. L., and Swetnam, T. W.: Direct and indirect climate controls predict heterogeneous early-mid 21st century wildfire burned area across western and boreal North America, PLoS One, 12, e0188486, https://doi.org/10.1371/journal.pone.0188486, 2017.
Kloster, S., Mahowald, N. M., Randerson, J. T., Thornton, P. E., Hoffman, F. M., Levis, S., Lawrence, P. J., Feddema, J. J., Oleson, K. W., and Lawrence, D. M.: Fire dynamics during the 20th century simulated by the Community Land Model, Biogeosciences, 7, 1877–1902, https://doi.org/10.5194/bg-7-1877-2010, 2010.
Kloster, S., Mahowald, N. M., Randerson, J. T., and Lawrence, P. J.: The impacts of climate, land use, and demography on fires during the 21st century simulated by CLM-CN, Biogeosciences, 9, 509–525, https://doi.org/10.5194/bg-9-509-2012, 2012.
Knorr, W., Dentener, F., Lamarque, J.-F., Jiang, L., and Arneth, A.: Wildfire air pollution hazard during the 21st century, Atmos. Chem. Phys., 17, 9223–9236, https://doi.org/10.5194/acp-17-9223-2017, 2017.
Lamarque, J.-F., Bond, T. C., Eyring, V., Granier, C., Heil, A., Klimont, Z., Lee, D., Liousse, C., Mieville, A., Owen, B., Schultz, M. G., Shindell, D., Smith, S. J., Stehfest, E., Van Aardenne, J., Cooper, O. R., Kainuma, M., Mahowald, N., McConnell, J. R., Naik, V., Riahi, K., and van Vuuren, D. P.: Historical (1850–2000) gridded anthropogenic and biomass burning emissions of reactive gases and aerosols: methodology and application, Atmos. Chem. Phys., 10, 7017–7039, https://doi.org/10.5194/acp-10-7017-2010, 2010.
Liu, J. C., Mickley, L. J., Sulprizio, M. P., Dominici, F., Yue, X., Ebisu, K., Anderson, G. B., Khan, R. F. A., Bravo, M. A., and Bell, M. L.: Particulate air pollution from wildfires in the Western US under climate change, Climatic Change, 138, 655–666, https://doi.org/10.1007/s10584-016-1762-6, 2016.
Liu, X., Easter, R. C., Ghan, S. J., Zaveri, R., Rasch, P., Shi, X., Lamarque, J.-F., Gettelman, A., Morrison, H., Vitt, F., Conley, A., Park, S., Neale, R., Hannay, C., Ekman, A. M. L., Hess, P., Mahowald, N., Collins, W., Iacono, M. J., Bretherton, C. S., Flanner, M. G., and Mitchell, D.: Toward a minimal representation of aerosols in climate models: description and evaluation in the Community Atmosphere Model CAM5, Geosci. Model Dev., 5, 709–739, https://doi.org/10.5194/gmd-5-709-2012, 2012.
Liu, Y., Goodrick, S., and Heilman, W.: Wildland fire emissions, carbon, and climate: Wildfire–climate interactions, Forest Ecol. Manag., 317, 80–96, https://doi.org/10.1016/j.foreco.2013.02.020, 2014.
Liu, J. C., Mickley, L. J., Sulprizio, M. P., Dominici, F., Yue, X., Ebisu, K., Anderson, G. B., Khan, R. F. A., Bravo, M. A., and Bell, M. L.: Particulate air pollution from wildfires in the Western US under climate change, Clim. Change, 138, 655–666, https://doi.org/10.1007/s10584-016-1762-6, 2016.
Meng, J., Martin, R. V., Li, C., van Donkelaar, A., Tzompa-Sosa, Z. A., Yue, X., Xu, J.-W., Weagle, C. L., and Burnett, R. T.: Source Contributions to Ambient Fine Particulate Matter for Canada, Environ. Sci. Technol., 53, 10269–10278, https://doi.org/10.1021/acs.est.9b02461, 2019.
McClure, C. D. and Jaffe, D. A.: US particulate matter air quality improves except in wildfire-prone areas, P. Natl. Acad. Sci. USA, 115, 7901–7906, https://doi.org/10.1073/pnas.1804353115, 2018.
Neale, R. B., Richter, J., Park, S., Lauritzen, P. H., Vavrus, S. J., Rasch, P. J., and Zhang, M.: The Mean Climate of the Community Atmosphere Model (CAM4) in Forced SST and Fully Coupled Experiments, J. Clim., 26, 5150–5168, https://doi.org/10.1175/JCLI-D-12-00236.1, 2013.
NOAA: Hazard Mapping System Fire and Smoke Product, NOAA [data set], https://www.ospo.noaa.gov/Products/land/, last access: 27 January 2023.
Nolte, C. G., Spero, T. L., Bowden, J. H., Mallard, M. S., and Dolwick, P. D.: The potential effects of climate change on air quality across the conterminous US at 2030 under three Representative Concentration Pathways, Atmos. Chem. Phys., 18, 15471–15489, https://doi.org/10.5194/acp-18-15471-2018, 2018.
O'Dell, K., Ford, B., Fischer, E. V., and Pierce, J. R.: Contribution of Wildland-Fire Smoke to US PM2.5 and Its Influence on Recent Trends, Environ. Sci. Technol., 53, 1797–1804, https://doi.org/10.1021/acs.est.8b05430, 2019.
Park, R. J., Jacob, D. J., and Logan, J. A.: Fire and biofuel contributions to annual mean aerosol mass concentrations in the United States, Atmos. Environ., 41, 7389–7400, https://doi.org/10.1016/j.atmosenv.2007.05.061, 2007.
Park, S., Bretherton, C. S., and Rasch, P. J.: Integrating Cloud Processes in the Community Atmosphere Model, Version 5, J. Clim., 27, 6821–6856, https://doi.org/10.1175/JCLI-D-14-00087.1, 2014.
Partain, J. L., Alden, S., Strader, H., Bhatt, U. S., Bieniek, P. A., Brettschneider, B. R., Walsh, J. E., Lader, R. T., Olsson, P. Q., Rupp, T. S., Thoman, R. L., York, A. D., and Ziel, R. H.: An Assessment of the Role of Anthropogenic Climate Change in the Alaska Fire Season of 2015, Bull. Am. Meteorol. Soc., 97, S14–S18, https://doi.org/10.1175/BAMS-D-16-0149.1, 2016.
Rogers, H. M., Ditto, J. C., and Gentner, D. R.: Evidence for impacts on surface-level air quality in the northeastern US from long-distance transport of smoke from North American fires during the Long Island Sound Tropospheric Ozone Study (LISTOS) 2018, Atmos. Chem. Phys., 20, 671–682, https://doi.org/10.5194/acp-20-671-2020, 2020.
Sarangi, C. and Qian, Y.: Wildfire simulation data and codes, portal.nersc [data set and code], https://portal.nersc.gov/project/m1660/yang560/wildfire, last access: 27 January 2023.
Shi, H., Jiang, Z., Zhao, B., Li, Z., Chen, Y., Gu, Y., Jiang, J. H., Lee, M., Liou, K., Neu, J. L., Payne, V. H., Su, H., Wang, Y., Witek, M., and Worden, J.: Modeling Study of the Air Quality Impact of Record-Breaking Southern California Wildfires in December 2017, J. Geophys. Res.-Atmos., 124, 6554–6570, https://doi.org/10.1029/2019JD030472, 2019.
Sofiev, M., Ermakova, T., and Vankevich, R.: Evaluation of the smoke-injection height from wild-land fires using remote-sensing data, Atmos. Chem. Phys., 12, 1995–2006, https://doi.org/10.5194/acp-12-1995-2012, 2012.
Spracklen, D. V., Mickley, L. J., Logan, J. A., Hudman, R. C., Yevich, R., Flannigan, M. D., and Westerling, A. L.: Impacts of climate change from 2000 to 2050 on wildfire activity and carbonaceous aerosol concentrations in the western United States, J. Geophys. Res., 114, D20301, https://doi.org/10.1029/2008JD010966, 2009.
Sun, Y., Gu, L., and Dickinson, R. E.: A numerical issue in calculating the coupled carbon and water fluxes in a climate model, J. Geophys. Res.-Atmos., 117, D22, https://doi.org/10.1029/2012JD018059, 2012.
US EPA (US Environmental Protection Agency): Integrated Science Assessment (ISA) For Particulate Matter (Final Report), EPA/600/R-08/139F.Washington, DC, USA, 2009.
US EPA (US Environmental Protection Agency): Our Nation's Air, https://gispub.epa.gov/air/trendsreport/2018 (last access: 20 November 2022), 2018.
Val Martin, M., Heald, C. L., Lamarque, J.-F., Tilmes, S., Emmons, L. K., and Schichtel, B. A.: How emissions, climate, and land use change will impact mid-century air quality over the United States: a focus on effects at national parks, Atmos. Chem. Phys., 15, 2805–2823, https://doi.org/10.5194/acp-15-2805-2015, 2015.
van der Werf, G. R., Randerson, J. T., Giglio, L., Collatz, G. J., Kasibhatla, P. S., and Arellano, A. F.: Interannual variability in global biomass burning emissions from 1997 to 2004, Atmos. Chem. Phys., 6, 3423–3441, https://doi.org/10.5194/acp-6-3423-2006, 2006.
van der Werf, G. R., Randerson, J. T., Giglio, L., Collatz, G. J., Mu, M., Kasibhatla, P. S., Morton, D. C., DeFries, R. S., Jin, Y., and van Leeuwen, T. T.: Global fire emissions and the contribution of deforestation, savanna, forest, agricultural, and peat fires (1997–2009), Atmos. Chem. Phys., 10, 11707–11735, https://doi.org/10.5194/acp-10-11707-2010, 2010.
Van Donkelaar, A., Martin, R. V., Brauer, M., Hsu, N. C., Kahn, R. A., Levy, R. C., Lyapustin, A., Sayer, A. M., and Winker, D. M.: Global Annual PM2.5 Grids from MODIS, MISR and SeaWiFS Aerosol Optical Depth (AOD) with GWR, 1998–2016, Palisades NY: NASA Socioeconomic Data and Applications Center (SEDAC), https://doi.org/10.7927/H4ZK5DQS, 2018.
van Donkelaar, A., Martin, R. V., Li, C., and Burnett, R. T.: Regional Estimates of Chemical Composition of Fine Particulate Matter Using a Combined Geoscience-Statistical Method with Information from Satellites, Models, and Monitors, Environ. Sci. Technol., 53, 2595–2611, https://doi.org/10.1021/acs.est.8b06392, 2019.
Ward, D. S., Kloster, S., Mahowald, N. M., Rogers, B. M., Randerson, J. T., and Hess, P. G.: The changing radiative forcing of fires: global model estimates for past, present and future, Atmos. Chem. Phys., 12, 10857–10886, https://doi.org/10.5194/acp-12-10857-2012, 2012.
Wotton, B. M., Flannigan, M. D., and Marshall, G. A.: Potential climate change impacts on fire intensity and key wildfire suppression thresholds in Canada, Environ. Res. Lett., 12, 095003, https://doi.org/10.1088/1748-9326/aa7e6e, 2017.
Westerling, A. L., Hidalgo, H. G., Cayan, D. R., and Swetnam, T. W.: Warming and Earlier Spring Increase Western U.S. Forest Wildfire Activity, Science, 313, 940–943, https://doi.org/10.1126/science.1128834, 2006.
Wu, Y., Arapi, A., Huang, J., Gross, B., and Moshary, F.: Intra-continental wildfire smoke transport and impact on local air quality observed by ground-based and satellite remote sensing in New York City, Atmos. Environ., 187, 266–281, https://doi.org/10.1016/j.atmosenv.2018.06.006, 2018.
Xue, Z., Gupta, P., and Christopher, S.: Satellite-based estimation of the impacts of summertime wildfires on PM2.5; concentration in the United States, Atmos. Chem. Phys., 21, 11243–11256, https://doi.org/10.5194/acp-21-11243-2021, 2021.
Yang, P., Zhang, Y., Wang, K., Doraiswamy, P., and Cho, S.-H.: Health impacts and cost-benefit analyses of surface O3 and PM2.5 over the U.S. under future climate and emission scenarios, Environ. Res., 178, 108687, https://doi.org/10.1016/j.envres.2019.108687, 2019.
Yue, X., Mickley, L. J., Logan, J. A., and Kaplan, J. O.: Ensemble projections of wildfire activity and carbonaceous aerosol concentrations over the western United States in the mid-21st century, Atmos. Environ., 77, 767–780, https://doi.org/10.1016/j.atmosenv.2013.06.003, 2013.
Zhang, Y., Yang, P., Gao, Y., Leung, R. L., and Bell, M. L.: Health and economic impacts of air pollution induced by weather extremes over the continental U.S., Environ. Int., 143, 105921, https://doi.org/10.1016/j.envint.2020.105921, 2020.
Zou, Y., Wang, Y., Ke, Z., Tian, H., Yang, J., and Liu, Y.: Development of a REgion-Specific Ecosystem Feedback Fire (RESFire) Model in the Community Earth System Model, J. Adv. Model. Earth Syst., 11, 417–445, https://doi.org/10.1029/2018MS001368, 2019.
Zou, Y., Wang, Y., Qian, Y., Tian, H., Yang, J., and Alvarado, E.: Using CESM-RESFire to understand climate–fire–ecosystem interactions and the implications for decadal climate variability, Atmos. Chem. Phys., 20, 995–1020, https://doi.org/10.5194/acp-20-995-2020, 2020.