the Creative Commons Attribution 4.0 License.
the Creative Commons Attribution 4.0 License.
 | 15 Dec 2023
Chemically speciated air pollutant emissions from open burning of household solid waste from South Africa
Hatef Firouzkouhi
Judith C. Chow
John G. Watson
Steven Sai Hang Ho
Warren Carter
Alexandra S. M. De Vos
Open burning of household solid waste is a large source of air pollutants worldwide, especially in the Global South. However, waste burning emissions are either missing or have large uncertainties in local, regional, or global emission inventories due to limited emission factor (EF) and activity data. Detailed particulate matter (PM) chemical speciation data are even less available. This paper reports source profiles and EFs for PM2.5 species as well as acidic and alkali gases measured from laboratory combustion of 10 waste categories that represent open burning in South Africa. Carbonaceous materials contributed more than 70 % of PM2.5 mass. Elemental carbon (EC) was most abundant from flaming materials (e.g., plastic bags, textiles, and combined materials), and its climate forcing exceeded the corresponding CO2 emissions by a factor of 2–5. Chlorine had the highest EFs among elements measured by X-ray fluorescence (XRF) for all materials. Vegetation emissions showed high abundances of potassium, consistent with its use as a marker for biomass burning. Fresh PM2.5 emitted from waste burning appeared to be acidic. Moist vegetation and food discards had the highest hydrogen fluoride (HF) and PM fluoride EFs due to fluorine accumulation in plants, while burning rubber had the highest hydrogen chloride (HCl) and PM chloride EFs due to high chlorine content in the rubber. Plastic bottles, plastic bags, rubber, and food discards had the highest EFs for polycyclic aromatic hydrocarbons (PAHs) and nitro-PAHs as well as their associated toxicities. Distinct differences between odd and even carbon preferences were found for alkanes from biological and petroleum-based materials: dry vegetation, paper, textiles, and food discards show preference for the odd-numbered alkanes, while the opposite is true for plastic bottles, plastic bags, and rubber. As phthalates are used as plasticizers, their highest EFs were found for plastic bottles and bags, rubber, and combined materials. Data from this study will be useful for health and climate impact assessments, speciated emission inventories, source-oriented dispersion models, and receptor-based source apportionment.
- Article
(4445 KB) - Full-text XML
-
Supplement
(4899 KB) - BibTeX
- EndNote


Uncontrolled open burning is a common practice to dispose of household or municipal solid waste (MSW) in many rural communities, especially in the Global South (Cook and Velis, 2021; Sharma et al., 2022; Okedere et al., 2019; Das et al., 2018; Bulto, 2020; Reyna-Bensusan et al., 2018; Cheng et al., 2020). While MSW incineration oxidizes nearly all fuel carbon to carbon dioxide (CO2), open burning only fully oxidizes about 58 % of the materials (IPCC, 2006). Open burning has lower combustion efficiencies due to inefficient mixing of fuels and oxygen and low burning temperatures, resulting in emissions of a wide range of air pollutants (Velis and Cook, 2021). MSW is often burned close to community residences. The limited dispersion and dilution increase direct inhalation exposures and exacerbate adverse health effects (Wiedinmyer et al., 2014; Lemieux et al., 2004; Krecl et al., 2021). MSW open-burning emissions deteriorate air quality on neighborhood, urban, and regional scales (Oleniacz et al., 2023). Low-income communities are often more impacted by MSW burning emissions, leading to environmental justice concerns (Nagpure et al., 2015; Martuzzi et al., 2010). It is estimated that exposure to PM2.5 from open burning of solid waste causes at least 270 000 premature deaths globally (Williams et al., 2019) and 10 000–20 000 premature deaths in Africa (Gordon et al., 2023; Kodros et al., 2016) each year. Open burning also contributes to climate change as a result of large carbon dioxide (CO2) and light-absorbing carbon (including black carbon, BC) emissions, two of the largest climate forcers (IPCC, 2013; Reyna-Bensusan et al., 2018; Bond et al., 2013).
Despite the large environmental impacts of uncontrolled MSW open burning, its emissions are not included or are poorly represented in local, regional, and global emission inventories due to lack of emission factor (EF) and amount of MSW burned (activity) data (Cook and Velis, 2021; Ramadan et al., 2022). Most existing inventories only include criteria pollutants (U.S. EPA, 2023) or greenhouse gases (IPCC, 2006) with limited chemical speciation. In addition to criteria pollutants, solid waste burning emits other toxic compounds. Construction timber combustion releases high concentrations of arsenic (As), chromium (Cr), and copper (Cu), while plastic burning releases phthalates, polycyclic aromatic hydrocarbons (PAHs), and dioxins (Velis and Cook, 2021; Wasson et al., 2005). Lemieux (1997, 1998) reported gas and speciated particle emissions from simulated open burning of household waste in barrels. However, the study was limited to testing US households with and without recycling practices. Barrel burning may not represent open pile burning due to different fuel–air interactions. Lemieux et al. (2004) further summarized organic air toxics from open burning of many materials, including MSW, and these data are used in the US Environmental Protection Agency (US EPA) AP-42 Compilation of Air Emissions Factors (U.S. EPA, 1992). Stockwell (2016) measured emissions from laboratory burning of shredded tires, plastic bags, mixed waste, and a variety of biomass species. Gaseous chemical EFs were presented, but PM chemistry was not reported. Jayarathne et al. (2018) reported EFs for PM2.5 (particles with aerodynamic diameter ≤ 2.5 µm) and several components (carbon, ions, metals, and organics) for combustion sources in Nepal, including mixed waste under dry and damp conditions, two types of plastic mixtures, and crop residues. Emissions of criteria pollutants and PM2.5 compositions (carbon, ions, and metals) were reported for several types of MSW in China (Cheng et al., 2020). Several studies characterized PM mass and chemistry for plastics burning (Hoffer et al., 2020; Wu et al., 2021). These studies highlighted a large variation in EFs due to the heterogeneities in waste compositions and burning conditions.
Detailed PM chemical composition data are important for many applications. The association between PM mass exposure and mortality is well established, and exposure to PM2.5 is one of the most important risk factors for premature death in the global burden of disease (Murray et al., 2020). However, as PM is a complex mixture, the toxicity and carcinogenicity of different chemical species are still uncertain (Lighty et al., 2000; Kelly and Fussell, 2012). Epidemiology and toxicology studies of PM chemicals are needed to develop a mechanistic understanding of their health effects. PM compositions are also used to evaluate visibility and climate effects. PM light scattering and absorption properties depend on the hygroscopicity and optical properties of its chemical components (Watson, 2002). BC, or elemental carbon (EC), is the major light-absorbing component of PM and may have a global warming potential 900 times that of CO2 (Bond et al., 2013). Speciated emission inventories have been applied in source-oriented dispersion models to estimate ambient concentrations and deposition patterns and to target effective emission reduction strategies (Reff et al., 2009; Simon et al., 2010). Deposition from MSW burning emissions is a major cause of discoloring of the Taj Mahal in India (Lal et al., 2016). PM chemical composition is necessary for receptor-based source apportionment, which uses the chemical abundance patterns in source profiles to quantify contributions of different sources to ambient PM concentrations (Watson et al., 2016). The source profile collinearities caused by similarities is a major cause of source apportionment uncertainty. Extending chemical analyses beyond conventionally analyzed elements and ions to include particle-phase organics can potentially provide molecular markers to minimize collinearities.
This study used comprehensive laboratory combustion experiments to quantify emissions from 10 types of MSW from South Africa. EFs for CO2 and criteria air pollutants have been reported by Wang et al. (2023). This paper focuses on speciated source profiles and EFs for elements, acidic and alkali gases and ions, PAHs, nitro-PAHs, n-alkanes, and phthalates.
2.1 Waste materials and combustion experiments
MSW materials were collected from typical household refuses by SASOL, a petrochemical and energy company, in the Zamdela community in South Africa. This is part of SASOL's Waste Collection Interventions (WCI) program to assist local communities in MSW collection and disposal in landfills to reduce illegal open burning and improve air quality. The materials were sent to the Desert Research Institute (DRI) in Reno, Nevada, USA, for emission testing. Due to customs restriction and potential deterioration during shipping, the compositions of food discards and vegetation collected by the WCI were characterized, and similar mixtures were collected in Nevada for testing. Food discards included bread, potato and banana peels, lettuce, cucumbers, and tomatoes (Cronjé et al., 2018), and vegetation included basin wild rye, Sandberg bluegrass, crested wheat grass, red willows, and creeping wild rye, representing African bunch grasses, African sumac, and crab grass. The 10 types of waste categories tested include (1) paper, (2) leather/rubber, (3) textiles, (4) hard plastic bottles and food containers, (5) soft plastic bags, (6) dry vegetation (0 % moisture content), (7) natural vegetation (20 % moisture content), (8) damp vegetation (50 % moisture content), (9) food discards, and (10) combined materials. The combined materials were mixtures of all categories based on their mass fractions in MSW. Glass, metals, and ceramics were added to the combination to mimic their influences on burning emissions. Moisture content was measured right after collection in the field. The moisture content for paper, leather/rubber, textiles, and plastics was determined by a laboratory in South Africa by measuring the mass loss gravimetrically after heating a small fraction of samples at 103 ∘C for 30 min. The moisture content for food and vegetation was determined at DRI by baking the samples at 90 ∘C for 24 h. Because material moisture content will likely change during transport and storage, to represent field conditions, the waste materials (except food discards) were oven-dried at 90 ∘C for 24 h, rehydrated to their natural moisture levels with distilled deionized water (DDW), and re-equilibrated for at least 24 h before testing.
The major elemental compositions (i.e., carbon, C; hydrogen, H; nitrogen, N; sulfur, S; and oxygen, O) of the waste materials were measured by an elemental analyzer (Model Flash EA1112, Thermo Scientific). The carbon content was used for the fuel-based EF calculation. The same procedure was used to quantify the elemental compositions of ashes after combustion.
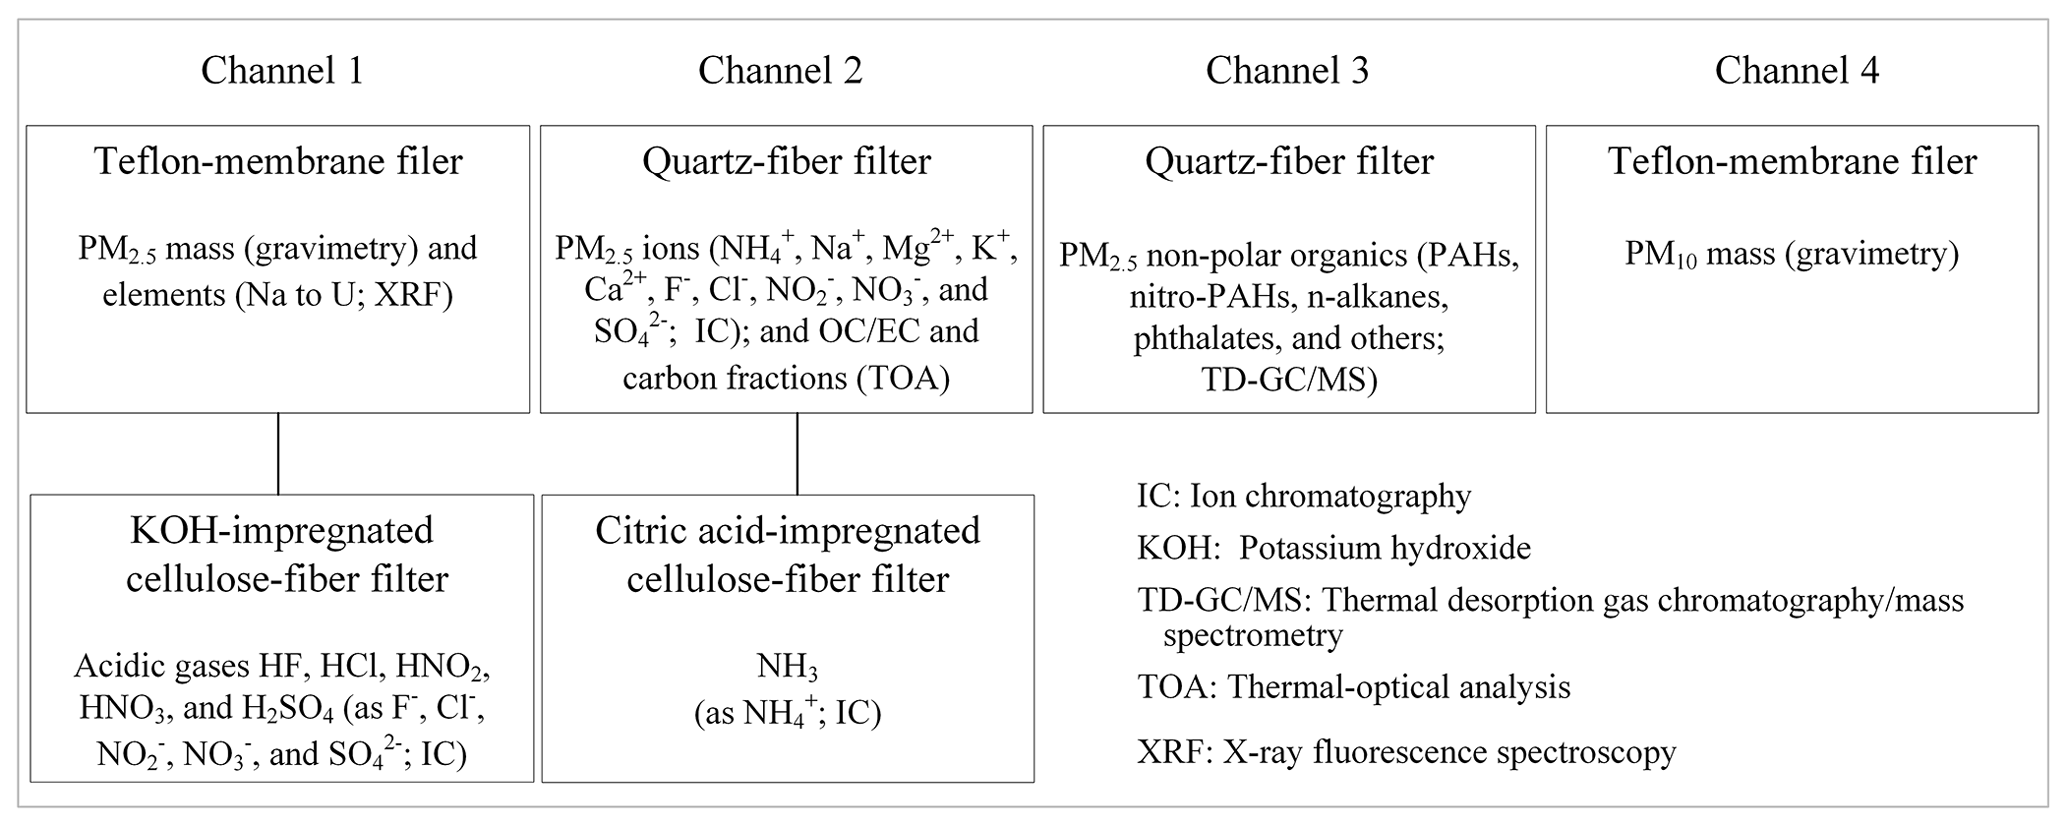
The experimental method has been documented by Wang et al. (2023), and only a brief description is provided here. For each burn, 0.5 to 20 g of waste material was placed in a ceramic crucible and maintained at 450 ∘C to simulate open burning. Each burn typically took 30 min, varying from 16 to 65 min. Paper, textiles, soft plastic bags, vegetation (with dry and natural moisture content), and combined waste had both flaming and smoldering phases, while leather/rubber, plastic bottles, damp vegetation, and food discards only smoldered. A suite of gas and particle analyzers monitored the concentrations in real time, including CO2, carbon monoxide (CO), oxides of nitrogen (NOx), sulfur dioxide (SO2), PM2.5, and PM10 (particles with aerodynamic diameter ≤ 10 µm). Integrated PM samples were collected simultaneously onto four parallel filters that accommodated different chemical analyses (Fig. 1). A total of 29 filter sets were collected, including three replicates for each of the eight fuels, two replicates for vegetation with 20 % and 50 % moisture content, and one field blank.
2.2 Chemical analysis
As shown in Fig. 1, the PM10 filters (Channel 4) were weighed for gravimetric mass concentrations, while the three PM2.5 filters (Channels 1–3) were analyzed for elements, ions, carbon fractions, and organic compounds (Chow and Watson, 2013). Backup filters impregnated with gas-absorbing solutions were analyzed for acidic and alkali gases.
Channel 1 is a Teflon-membrane filter backed by a potassium hydroxide (KOH)-impregnated cellulose-fiber filter. The Teflon-membrane filters were analyzed for PM2.5 mass by gravimetry using microbalances (Model XP-6, Mettler Toledo, Hightstown, NJ) with 1 µg sensitivity (Watson et al., 2017). In addition, 51 elements (from Na to U) were measured using a PANalytical X-ray fluorescence (XRF) analyzer (Model Epsilon 5, Almelo, the Netherlands) (Watson et al., 1999). The backup KOH-impregnated cellulose-fiber filters behind the Teflon-membrane front filter were analyzed for acidic gases, including hydrogen fluoride (HF), hydrochloric acid (HCl), nitrous acid (HNO2), nitric acid (HNO3), and sulfuric acid (H2SO4) as their corresponding ions (i.e., F−, Cl−, NO, NO, and SO) by ion chromatography (IC) (Sturges and Harrison, 1989; Eldering et al., 1991), which are known to emit from waste burning (Christian et al., 2010).
Channel 2 contains a quartz-fiber filter backed by a citric-acid-impregnated cellulose-fiber filter. Half of the quartz-fiber filter was extracted in DDW and analyzed for 10 water-soluble ions, including ammonium (NH), sodium (Na+), magnesium (Mg2+), potassium (K+), calcium (Ca2+), fluoride (F−), chloride (Cl−), nitrite (NO), nitrate (NO), and sulfate (SO) by using Dionex ICS 6000 IC systems (Thermo Scientific, Sunnyvale, CA) (Chow and Watson, 2017). The backup citric-acid-impregnated cellulose-fiber filter behind the quartz-fiber front filter was analyzed for ammonia (NH3) as NH by IC.
Organic and elemental carbon (OC and EC) and eight thermal fractions (i.e., OC1–OC4; pyrolyzed carbon, OP; EC1–EC3) were quantified following the IMPROVE_A thermal/optical protocol using the DRI Model 2015 multiwavelength carbon analyzer (Magee Scientific, Berkeley, CA) (Chow et al., 2007, 2015b; Chen et al., 2015). A 0.5 cm2 punch was taken from the Channel 2 quartz-fiber filter and heated in a pure helium (He) carrier gas at 140 ∘C (OC1), 280 ∘C (OC2), 480 ∘C (OC3), and 580 ∘C (OC4) temperature steps. Next, the carrier gas composition was changed to 98 % He and 2 % O2, and the filter continued to be heated at 580 ∘C (EC1), 740 ∘C (EC2), and 840 ∘C (EC3). Seven lasers with wavelengths ranging from 405 to 980 nm were used to monitor light reflectance (R) and transmittance (T), which were used to calculate wavelength-dependent light absorption. OC and EC were determined at the 635 nm wavelength after R returned to its initial value to correct for OC pyrolysis. The multiwavelength measurement allowed separation of light absorption by black carbon (BC) from brown carbon (BrC), which has unique wavelength dependence based on fuel and combustion conditions (Chow et al., 2015b, 2018, 2021).
A parallel quartz-fiber filter in Channel 3 was analyzed for non-polar organic compounds, including PAHs, nitro-PAHs, alkanes, cycloalkanes, hopanes, steranes, phthalates, and other organics using in-injection port-thermal desorption–gas chromatography mass spectrometry (TD-GC/MS) (Ho et al., 2008; Ho and Yu, 2004; Ho et al., 2011). Aliquots (1.0–1.5 cm2) of the quartz-fiber filters were cut into small pieces, spiked with internal standards, and inserted into TD tubes for analyses.
Chemical data were quality-checked as part of quality assurance (QA) to ensure internal consistency and to achieve mass closure. As shown in Fig. S1, the sum of measured chemical species and reconstructed mass accounted for 73 % and 99 % of gravimetric mass on average, respectively. High coefficients of determination (R2) of 0.98 assure that major PM2.5 constituents (i.e., gravimetric mass, carbon, ions, and elements) are quantified with high quality (Chow et al., 2015a). To obtain chemical source profiles, the chemical concentrations were normalized to PM2.5 mass concentrations. Potential markers and hazardous air pollutant emissions from each waste category were assessed. Fuel-based EFs were calculated based on carbon mass balance techniques (Wang et al., 2023).
3.1 Major PM2.5 compositions
Figure 2 compares average PM2.5 mass fractions for the five major composition categories (i.e., organic matter, OM; EC; ions; mineral; and others). Carbonaceous aerosol (OM and EC) contributed more than 70 % of PM2.5 mass with minor contributions from ions. OM was the most abundant component, accounting for > 50 % of PM2.5 mass. EC had the highest abundances in the flaming materials, including plastic bags (49.4 ± 29.2 %), combined fuels (47.9 ± 13.2 %), textiles (12.8 ± 4.3 %), and dry vegetation (9.1 ± 2.2 %). Detailed mass fractions for each material are shown in Fig. S2. High OC and EC abundances were also found for PM2.5 from waste burning in other studies. For example, Jayarathne et al. (2018) found average OC and EC abundances of 77 % (ranging from 59 % to 114 %) and 2.6 % (ranging from 0 % to 12 %), respectively, for mixed waste in Nepal. Wu et al. (2021) found that carbonaceous components were 80.5 %–91.4 % of PM2.5 for flaming burning of various plastics in China, with OC and EC ranging 45 %–63 % and 7 %–53 %, respectively, which are similar to the flaming emissions in this study.
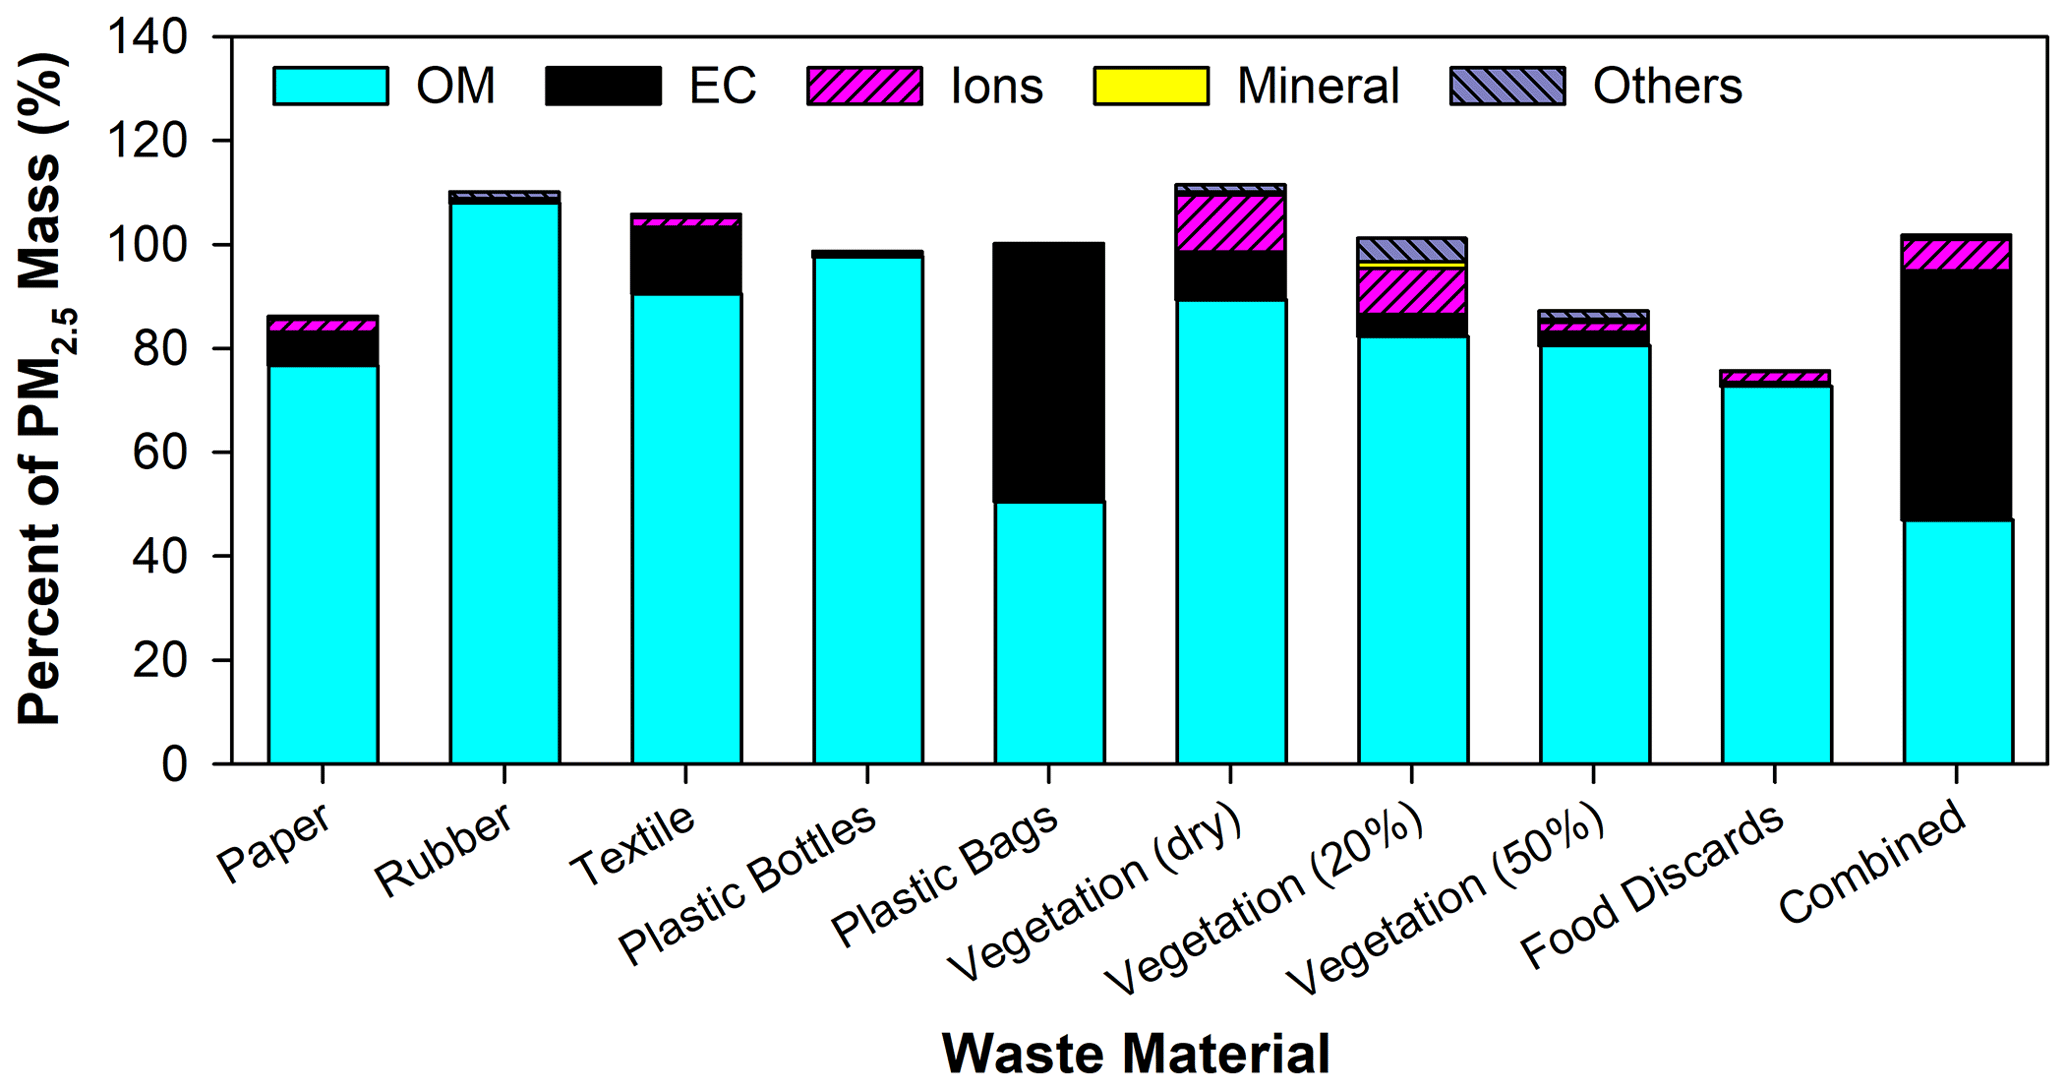
Figure 2Abundances of major PM2.5 compositions (percent of PM2.5 mass) from burning of different waste materials. Organic matter OM = OC × 1.4; ions are the sum of ammonium (NH), sodium (Na+), magnesium (Mg2+), potassium (K+), calcium (Ca2+), fluoride (F−), chloride (Cl−), nitrite (NO), nitrate (NO), and sulfate (SO); minerals = 2.2 × Al + 2.49 × Si + 1.63 × Ca + 2.42 × Fe + 1.94 × Ti. See detailed description of the major composition categories in Sect. S1 in the Supplement.
The abundances of the seven carbon fractions (i.e., OC1–OC4 and EC1–EC3) by source type are shown in Fig. S3. The sum of lower-temperature OC1 and OC2 fractions exceeded 20 % for most fuels, except for plastic bags and combined materials that had intense flaming combustion. Paper and vegetation had higher OC3 + OC4 fractions (15 %–30 %), consistent with their higher charring fractions (pyrolysis of OC to EC during oxygen-free heating). Plastic bags and combined materials had the highest sums of EC1 and EC2 (53 %–70 %), with plastic bags having much higher EC2 (63 %) than EC1 (8 %), indicating higher combustion temperatures. High-temperature EC3 (840 ∘C) was not detected. Carbon fractions varied by moisture content in vegetation samples, with the highest OC3, OC4, and EC1 in dry vegetation due to dominant flaming combustion. As moisture content increased to 50 %, the abundances of OC1 increased, and OC2 remained approximately the same, while OC3, OC4, and EC1 abundances decreased. Similar carbon fraction distributions were found for barrel and pile burning of MSW by Cheng et al. (2020).
Figure 3 shows EFs for PM2.5 and its major components OM and EC. Rubber, plastic bottles, 50 % moisture vegetation, and food discards generated higher EFs for PM2.5 and OM among 10 source types, consistent with their dominant smoldering combustion. Combustion of plastic bottles produced the highest EFs for PM2.5 (651 ± 38 g kg−1) and OM (635 ± 49 g kg−1). As shown in Fig. S2d, over 97 % of the plastic bottle PM2.5 is OM. Rubber had the second-highest EFs for PM2.5 (141 ± 23 g kg−1), with 98 % PM2.5 mass being OM (Fig. S2b). Plastic bags had the highest EFs for EC (17.1 ± 1.9 g kg−1), followed by textiles (5.52 ± 0.24 g kg−1) and combined waste materials (3.44 ± 1.98 g kg−1). Assuming a 100-year global warming potential (GWP) of 900 for EC (Bond et al., 2013), the climate forcing of EC from these materials is a factor of 2–5 higher than that of CO2 (Wang et al., 2023).
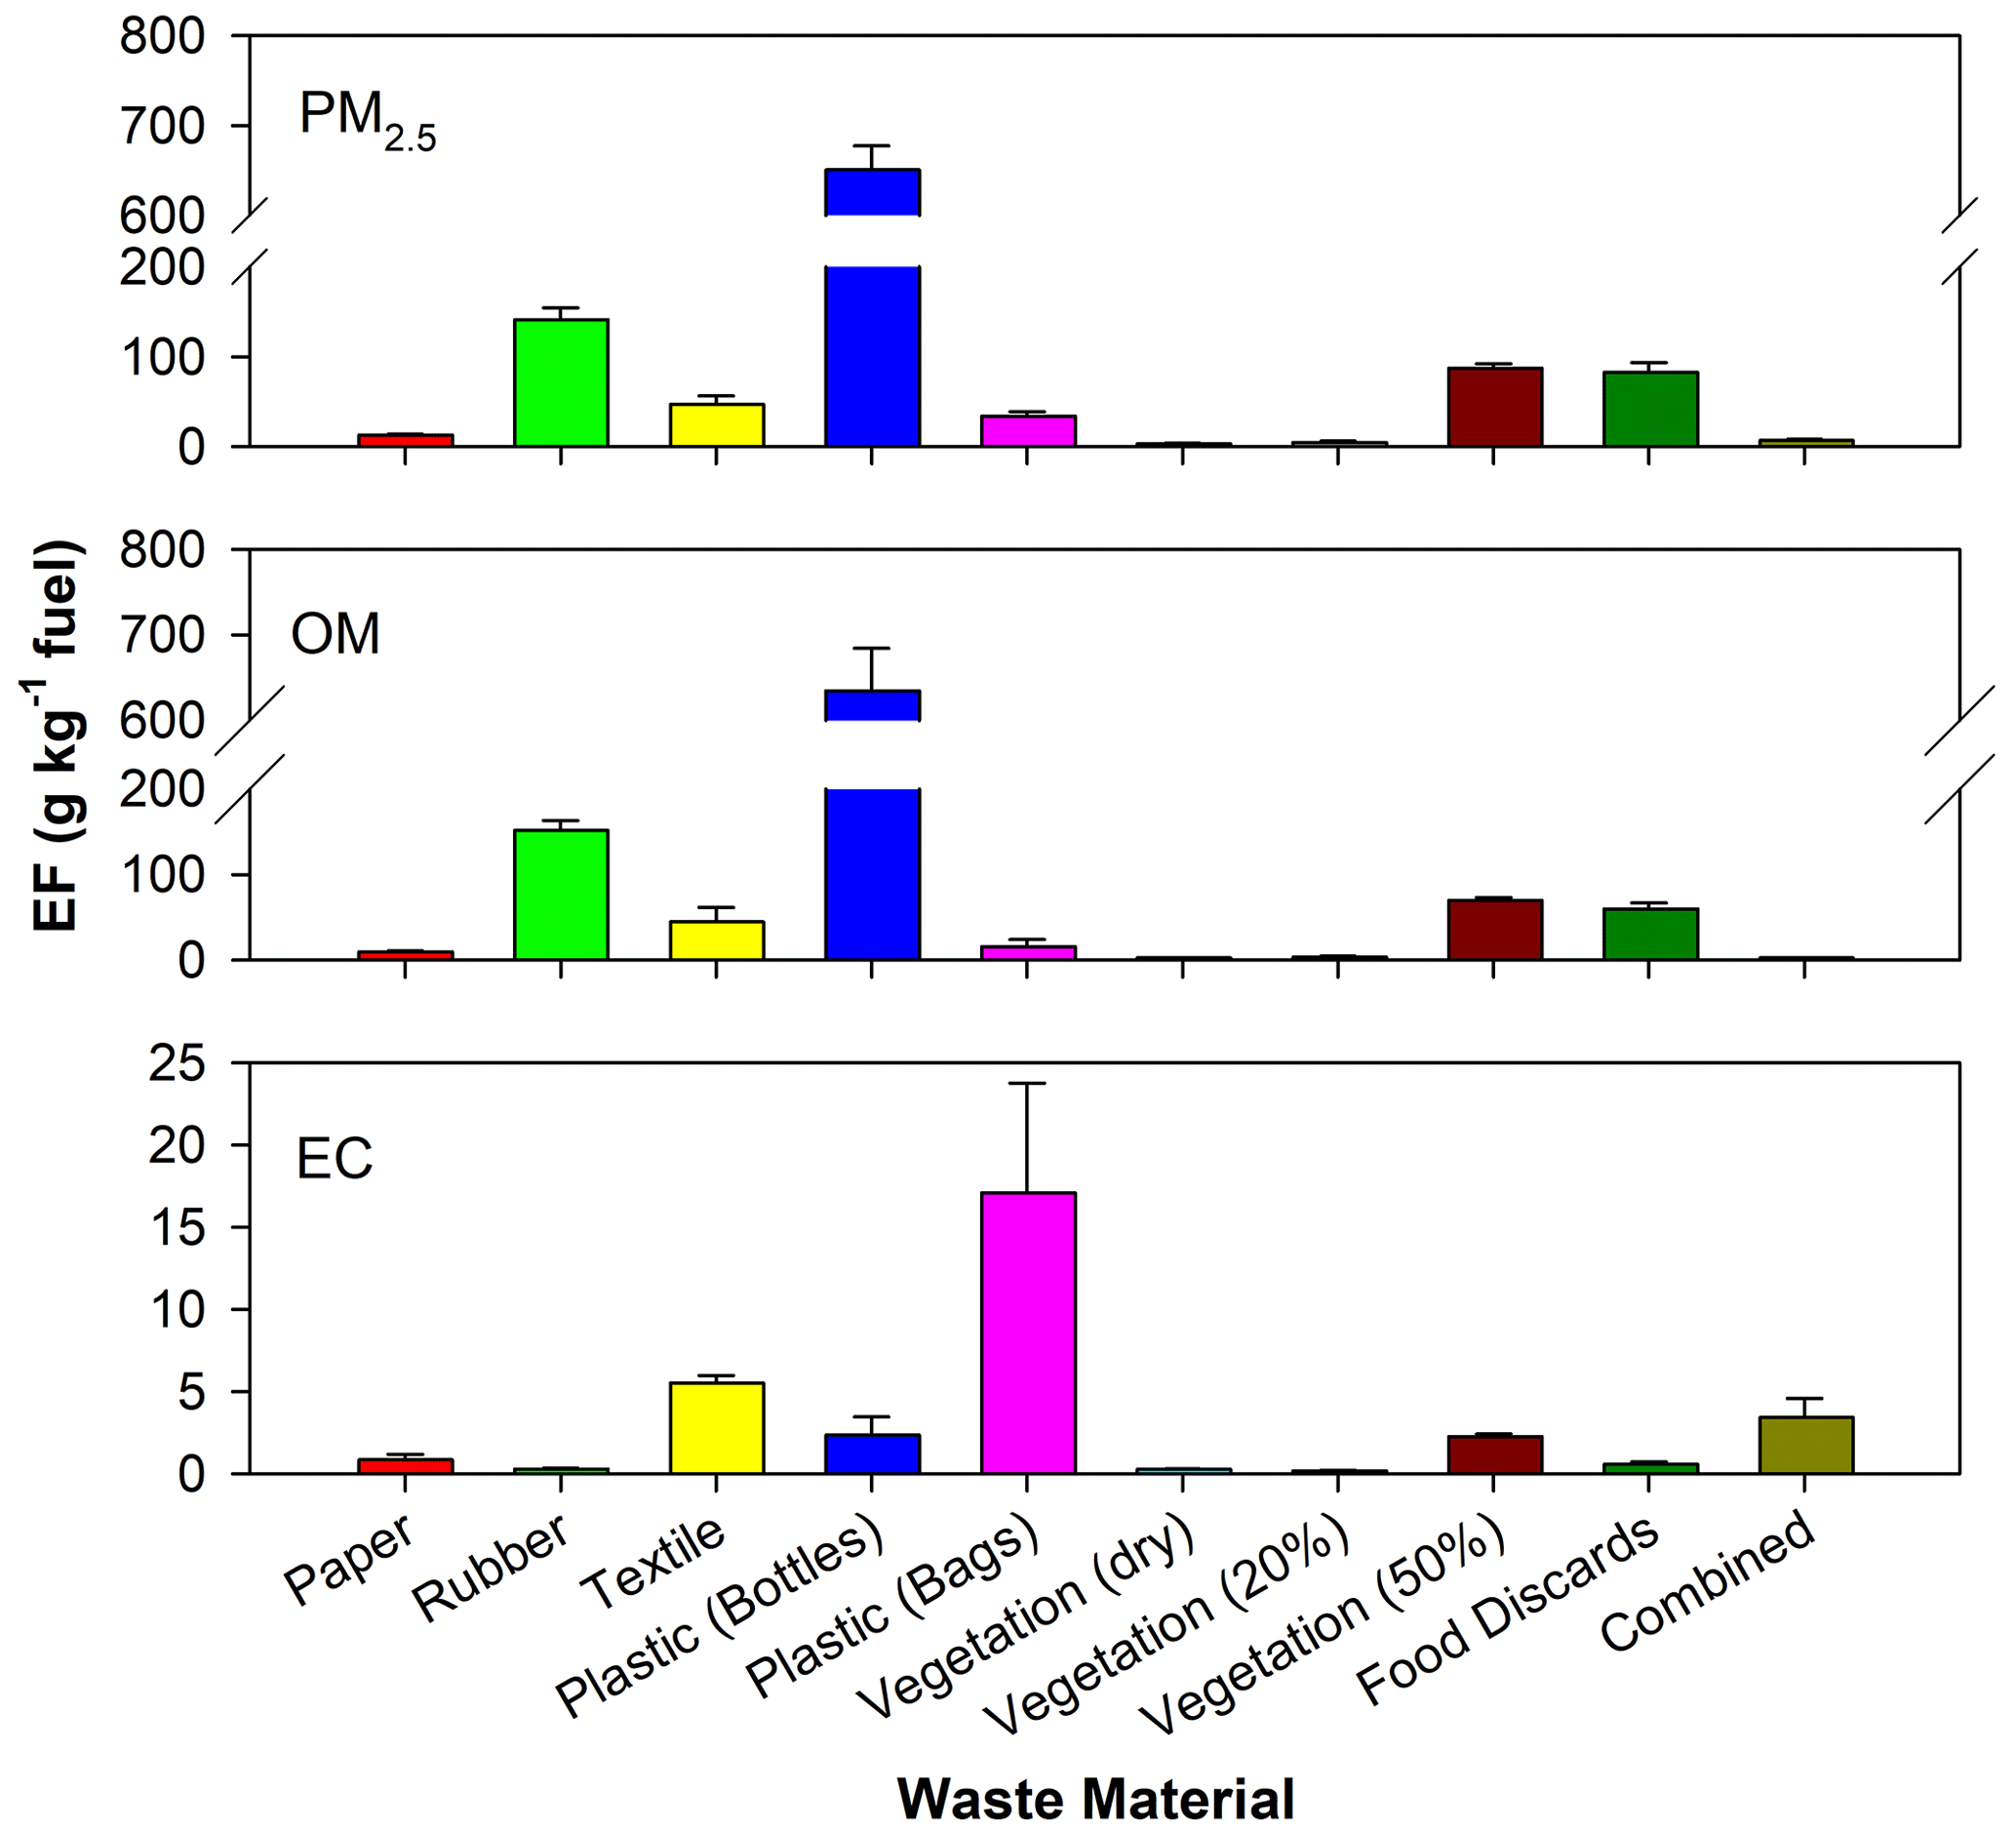
Figure 3Emission factors for PM2.5, organic matter (OM = OC × 1.4), and elemental carbon (EC). The error bars represent the larger of the propagated analytical uncertainty or the standard error in multiple runs.
As 50 % moisture vegetation only smoldered, the PM2.5 EF (88 ± 7 g kg−1) was over an order of magnitude higher than those of dry (3.2 ± 1.3 g kg−1) and 20 % moisture (4.8 ± 2.0 g kg−1) samples. Even though the dry vegetation had a higher EC abundance than the 50 % moisture vegetation (8.2 % vs. 2.6 % of PM2.5), the 50 % moisture vegetation still had a higher EF for EC due to the much higher EF for PM2.5 (Fig. 3). Pokhrel et al. (2021) reported PM (≤ 720 nm) EFs for seven types of African woody biomasses, averaging 19.2 g kg−1 (ranging 13.2–25.1 g kg−1) for burns with MCE < 0.85, which are lower than that for the 50 % moisture sample in this study; on the other hand, PM EFs were 5.0 g kg−1 (ranging 0.82–22.2 g kg−1) for burns with MCE ≥ 0.85, similar to those for the dry and 20 % moisture samples.
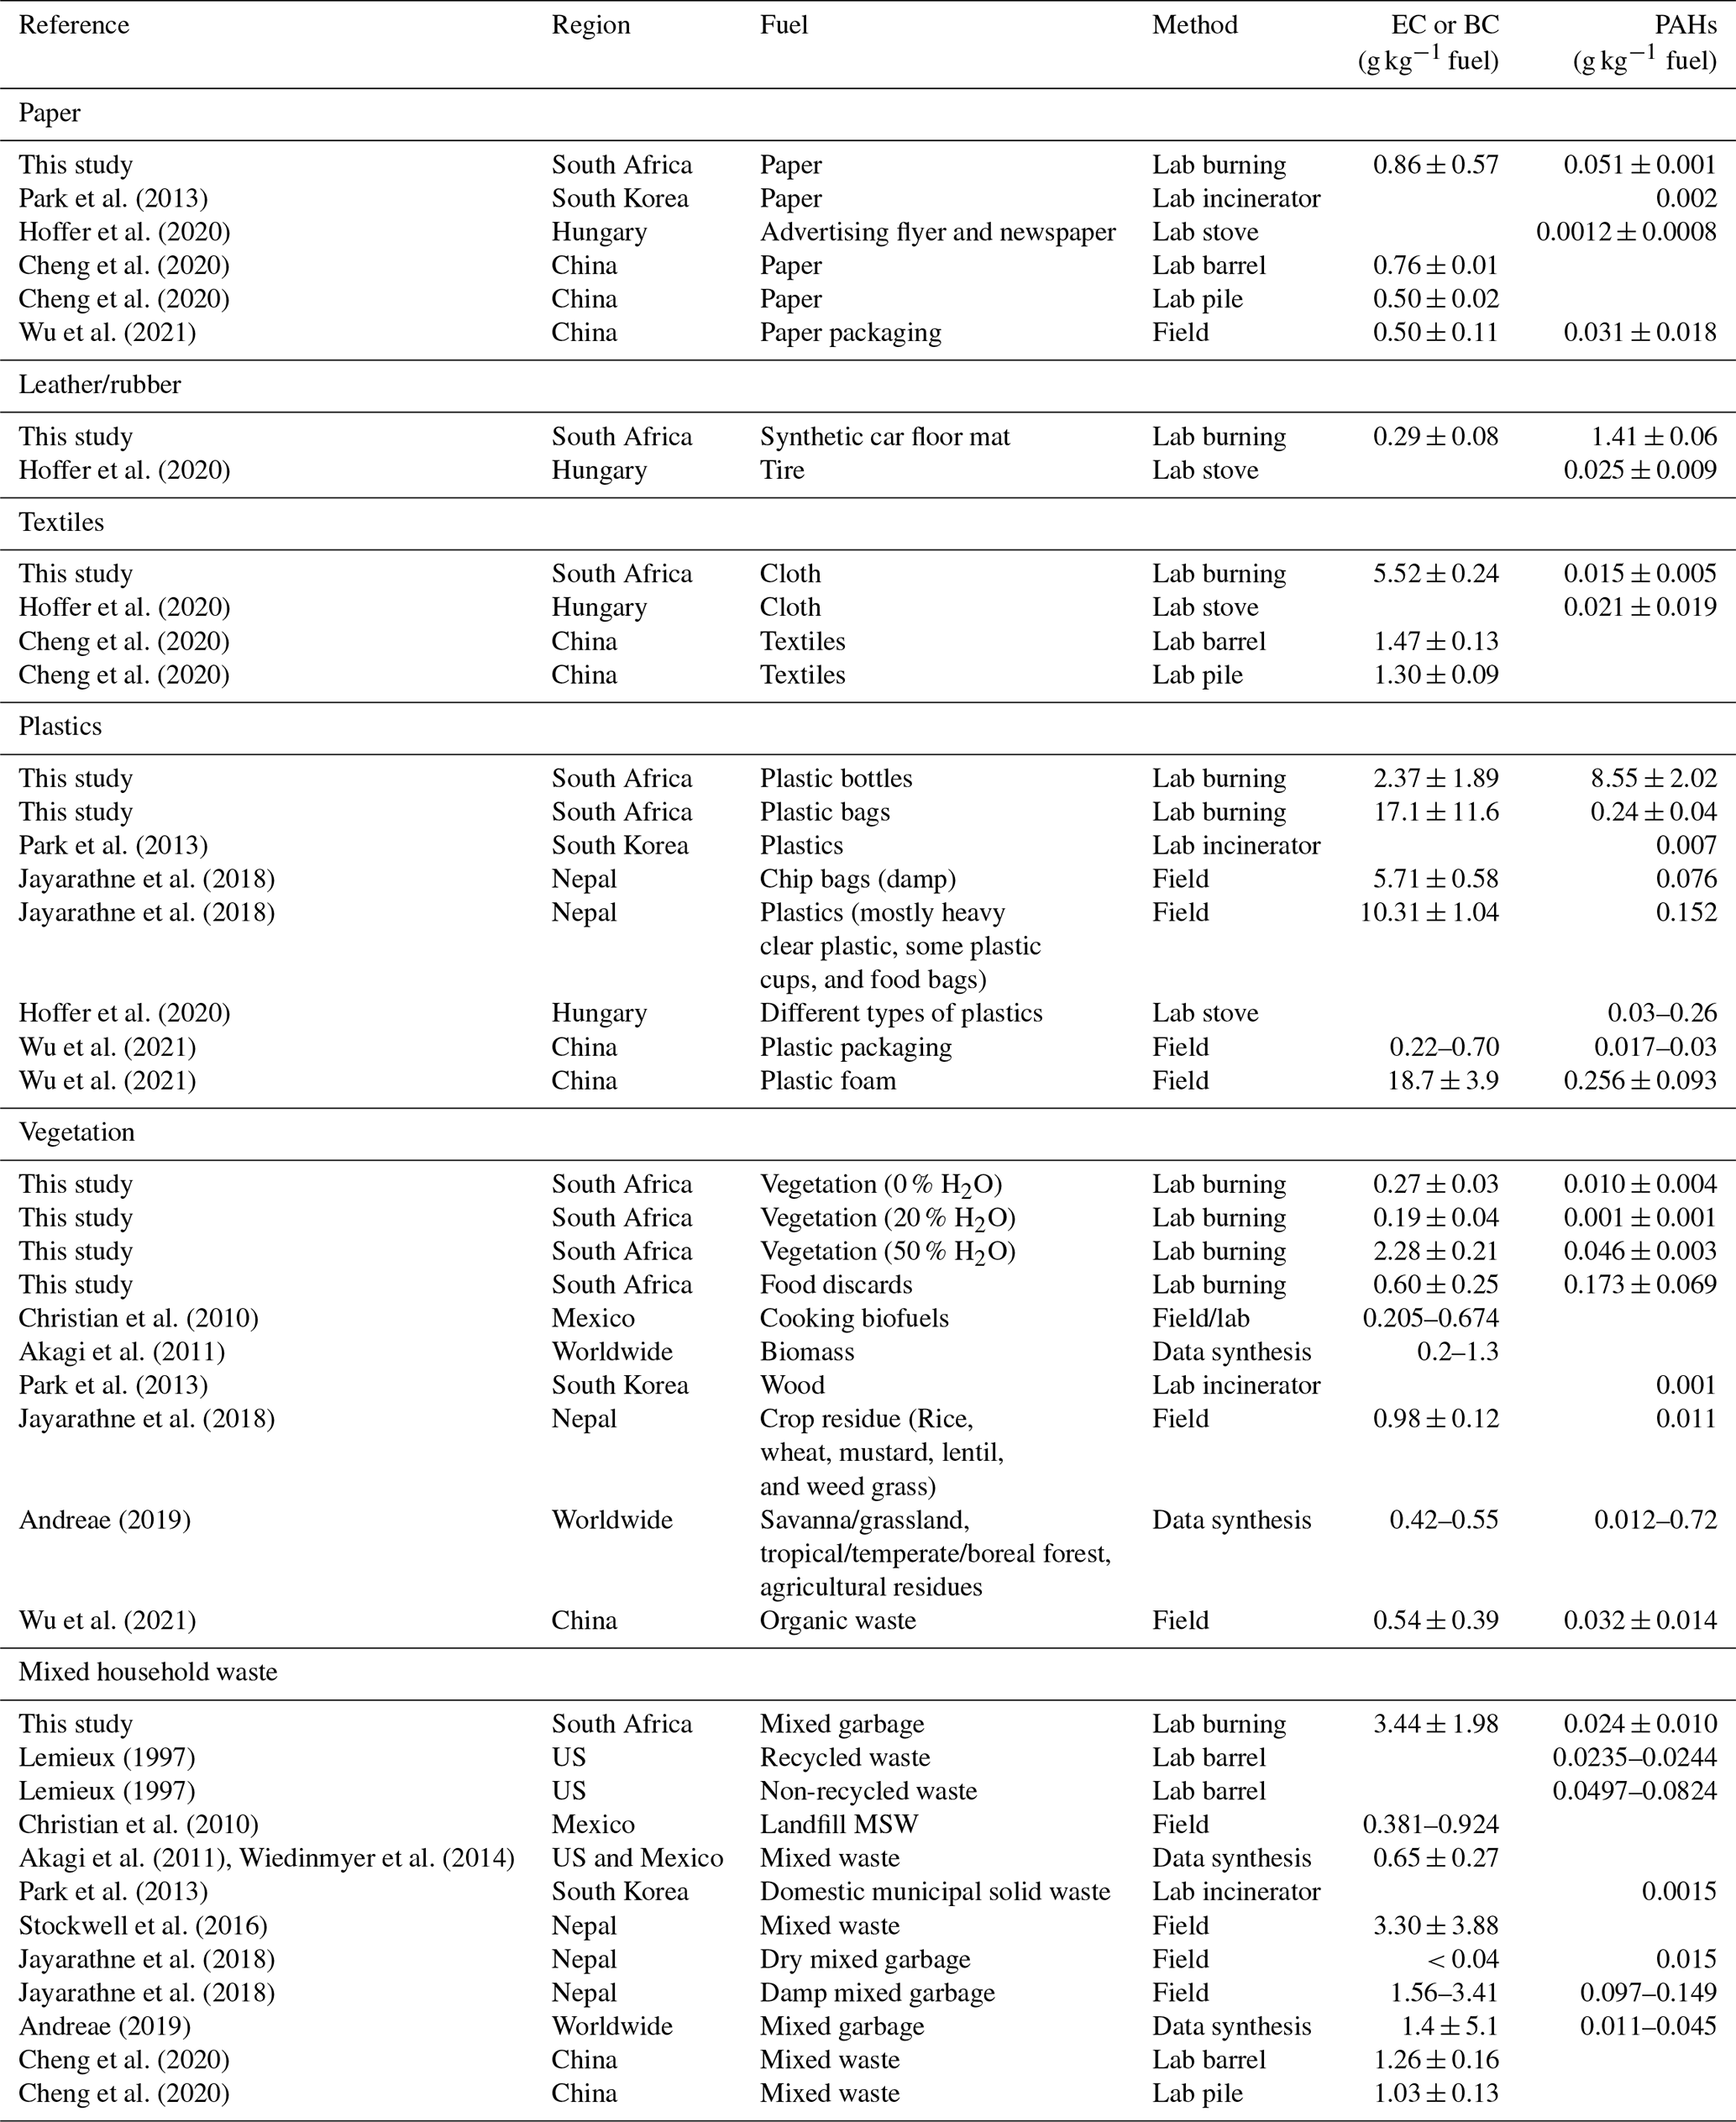
As thermal EC and optical BC are often used interchangeably (Pöschl, 2003), Table 1 compares EC from this study with EC or BC reported in the literature. The EC EF for paper (0.86 ± 0.57 g kg−1) is in the same range as those (0.5–0.76 g kg−1) reported by Cheng et al. (2020) and Wu et al. (2021), while the EF for textiles is about 4 times those reported by Cheng et al. (2020). A wide range of EFs are reported for plastic bottles and bags. The plastic bag EF (17.1 ± 11.6 g kg−1) is in good agreement with plastic foam (18.7 ± 3.9 g kg−1) by Wu et al. (2021) and close to a plastic mixture (10.3 ± 1.0 g kg−1) burned by Jayarathne et al. (2018). Different vegetation types, moisture content, and burning conditions resulted in variable EFs. However, EFs for this study fall in the range reported by Akagi et al. (2011) except for 50 % moisture vegetation that is 75 % higher than the maximum value by Akagi et al. (2011). Andreae (2019) summarized emissions from biomass burning for savanna/grassland, tropical/temperate/boreal forest, and agricultural residue fuels and reported average BC EFs of 0.42–0.55 g kg−1. The EF for mixed materials (3.44 ± 1.98 g kg−1) is similar to those reported for damp mixed garbage (3.30 ± 3.88 g kg−1) in Nepal (Jayarathne et al., 2018; Stockwell et al., 2016) but is 5 times the suggested value (0.65 ± 0.27 g kg−1) for global emission inventory (Akagi et al., 2011; Wiedinmyer et al., 2014). The high variability in the BC EFs (1.4 ± 5.1 g kg−1) for mixed waste burning is also shown by Andreae (2019) and is due to different materials and burning conditions as well as the limited number of studies.
Table 1Comparison of EC or BC and PAH emission factors measured in this study with those from the literature.
3.2 Elements
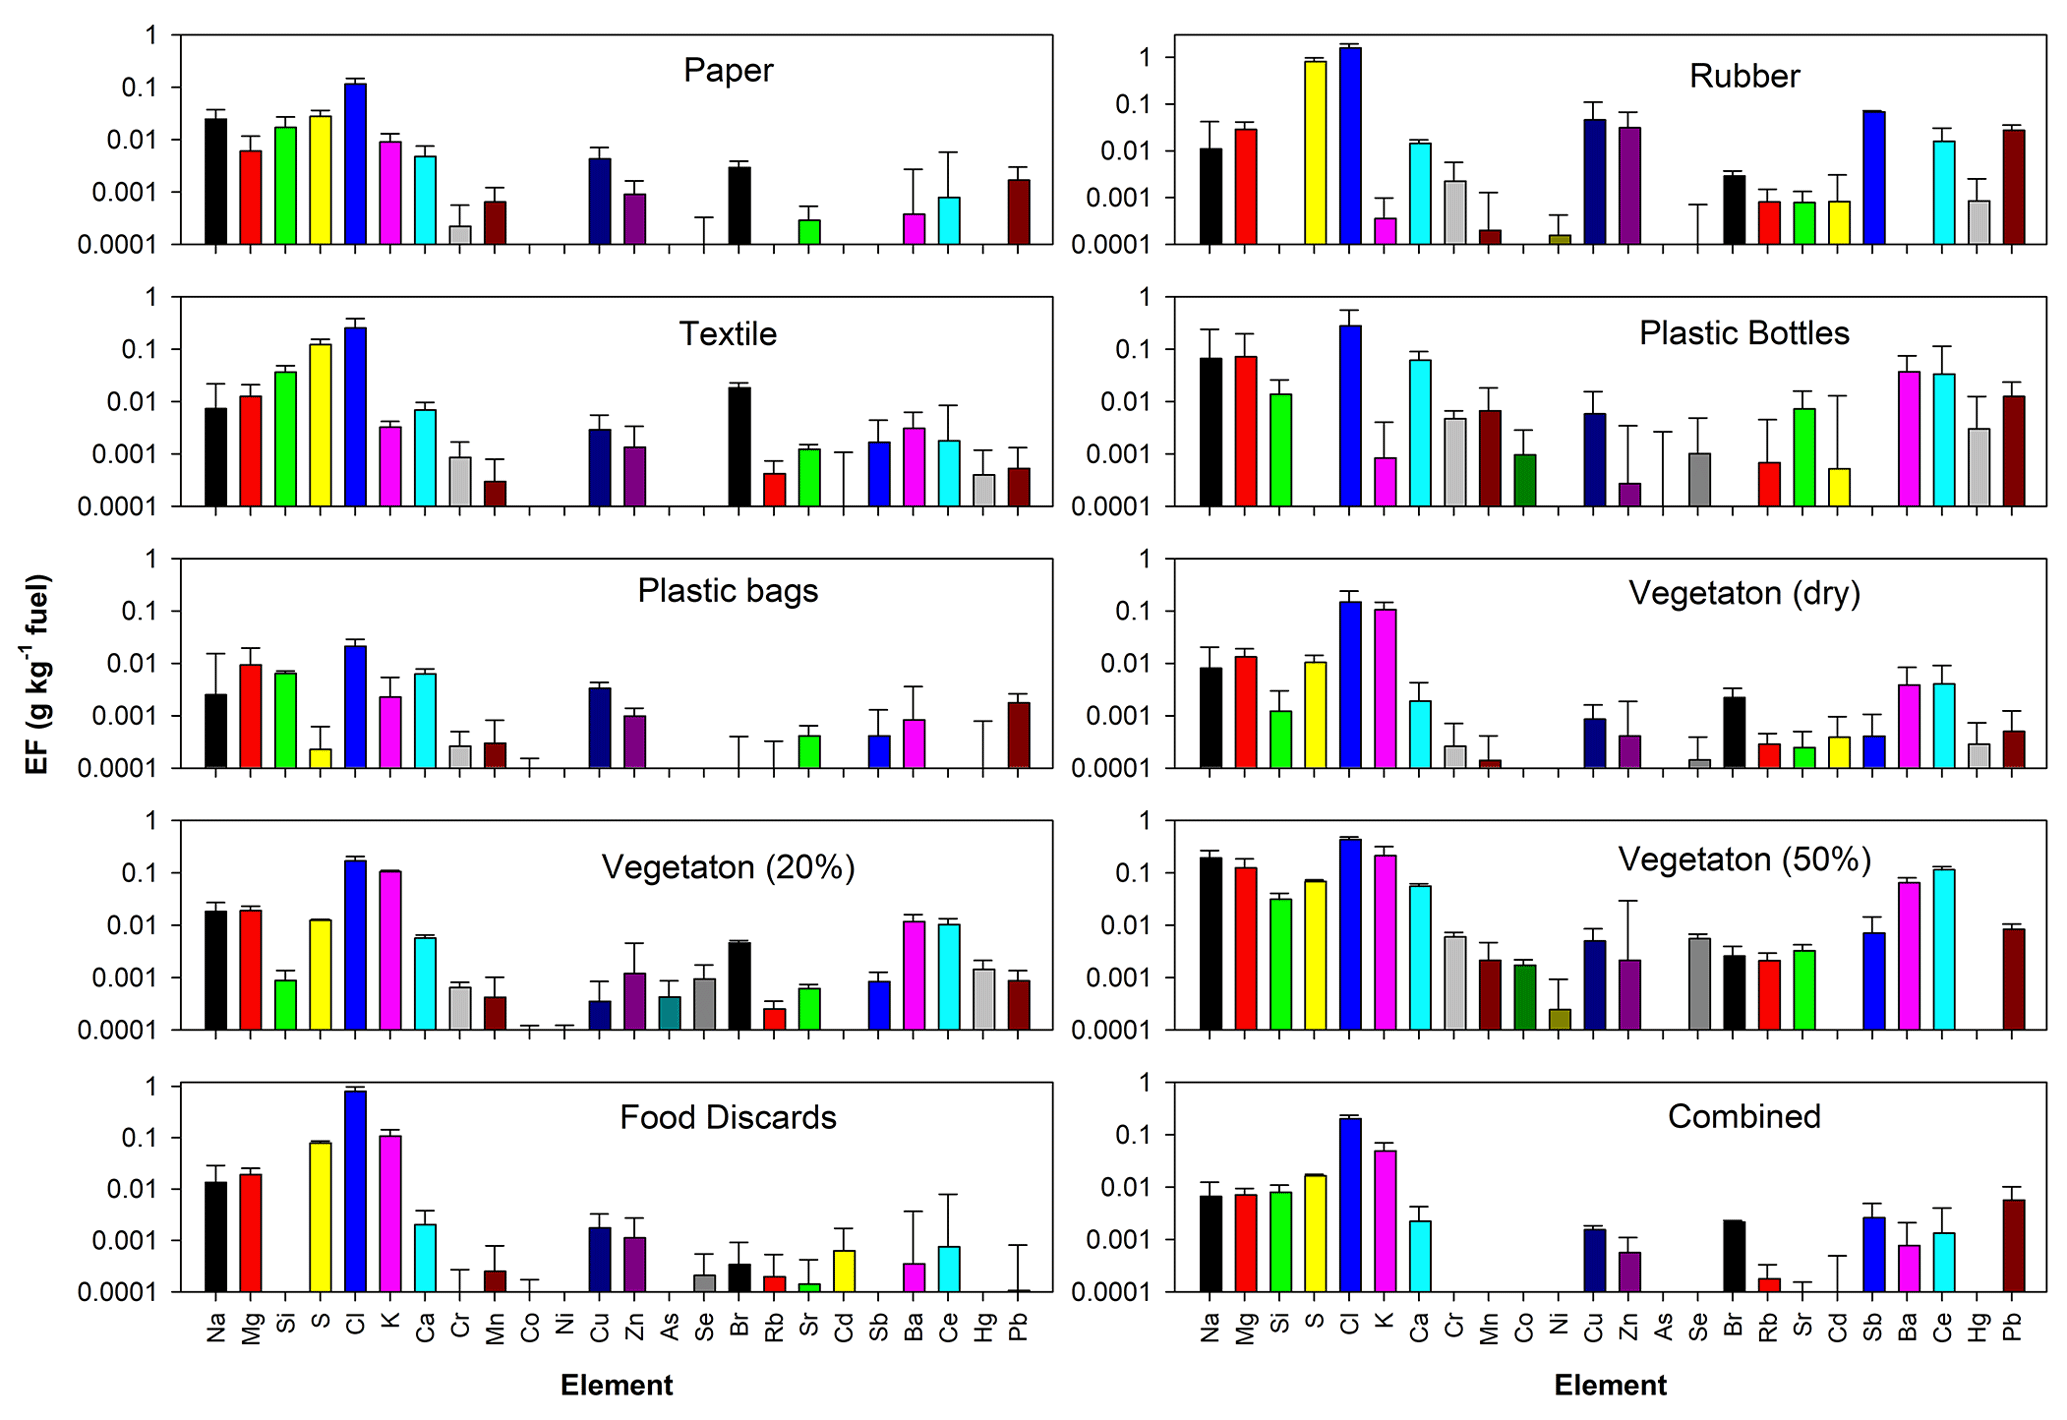
Figure 4 shows EFs for elements measured by XRF with EF values larger than uncertainties for at least 3 of the 10 waste materials or those in the hazardous air pollutant (HAP) list of the US Environmental Protection Agency (U.S. EPA, 2020). Chlorine (Cl) had the highest EFs for all waste materials. Rubber had the highest EFs for Cl and sulfur (S) as well as HAP elements cadmium (Cd), antimony (Sb), and lead (Pb), while the 50 % moist vegetation had the highest EFs for chromium (Cr), cobalt (Co), nickel (Ni), and selenium (Se). Table S2 compares these heavy metal EFs with those reported in the literature. The EFs by Park et al. (2013) are lower than those by other studies for most elements, except for higher zinc (Zn) EFs. For paper burning, both this study and Cheng et al. (2020) found similar EFs for copper (Cu) and Pb. The plastic bottles had much higher EFs for Cr and Pb than plastic bags and other studies; high Cu EFs for plastics are also found from this study and Cheng et al. (2020). The high Cu emissions from paper and plastics likely originate from the Cu compounds used for cyan, green, and reddish-blue printing pigment (Zięba-Palus and Trzcińska, 2011). The EFs for Cr, Zn, and Pb from dry and 20 % moisture vegetation are similar to those by Cheng et al. (2020), while the Cu EFs for 50 % moisture vegetation are similar to that by Cheng et al. (2020). For the combined materials, Cr and Ni are below detection limits in this study, but the EFs for other elements are in the same range as those reported in the literature, with large variations (Lemieux, 1997; Christian et al., 2010; Jayarathne et al., 2018; Cheng et al., 2020).
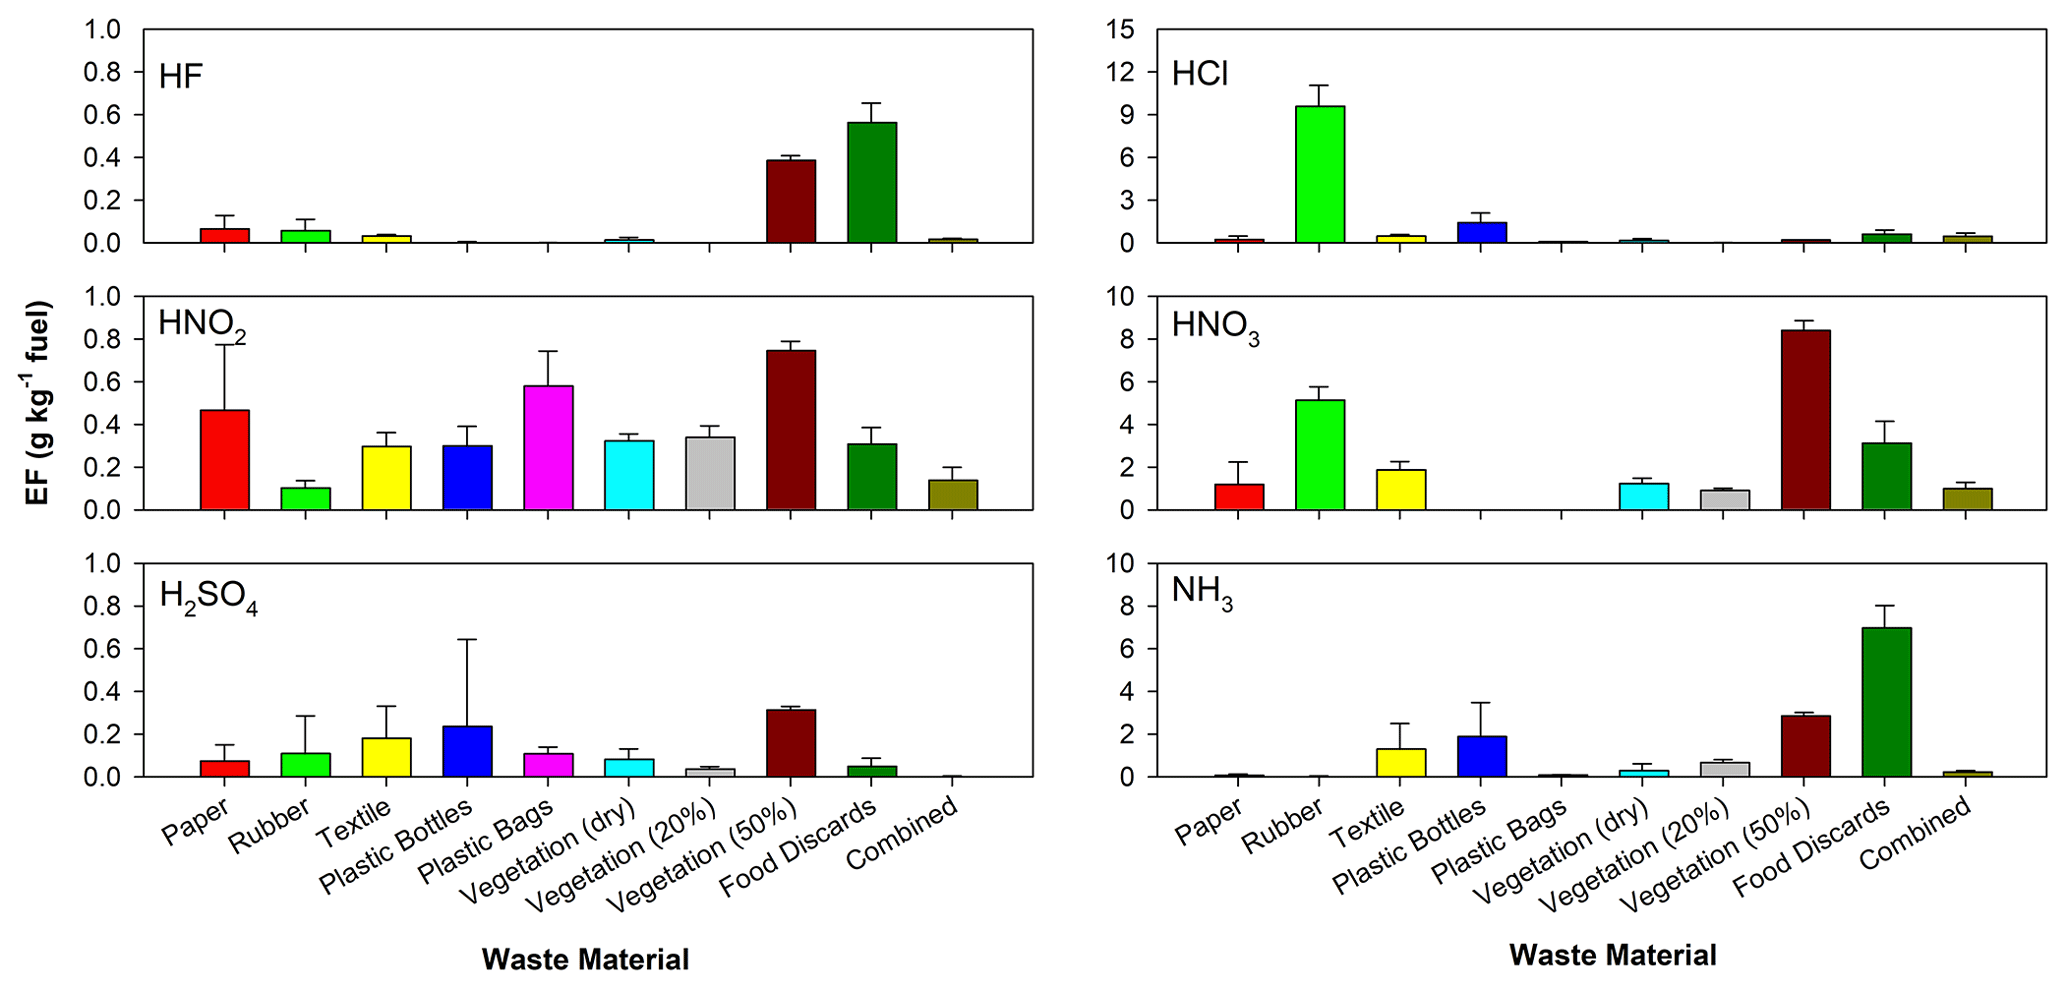
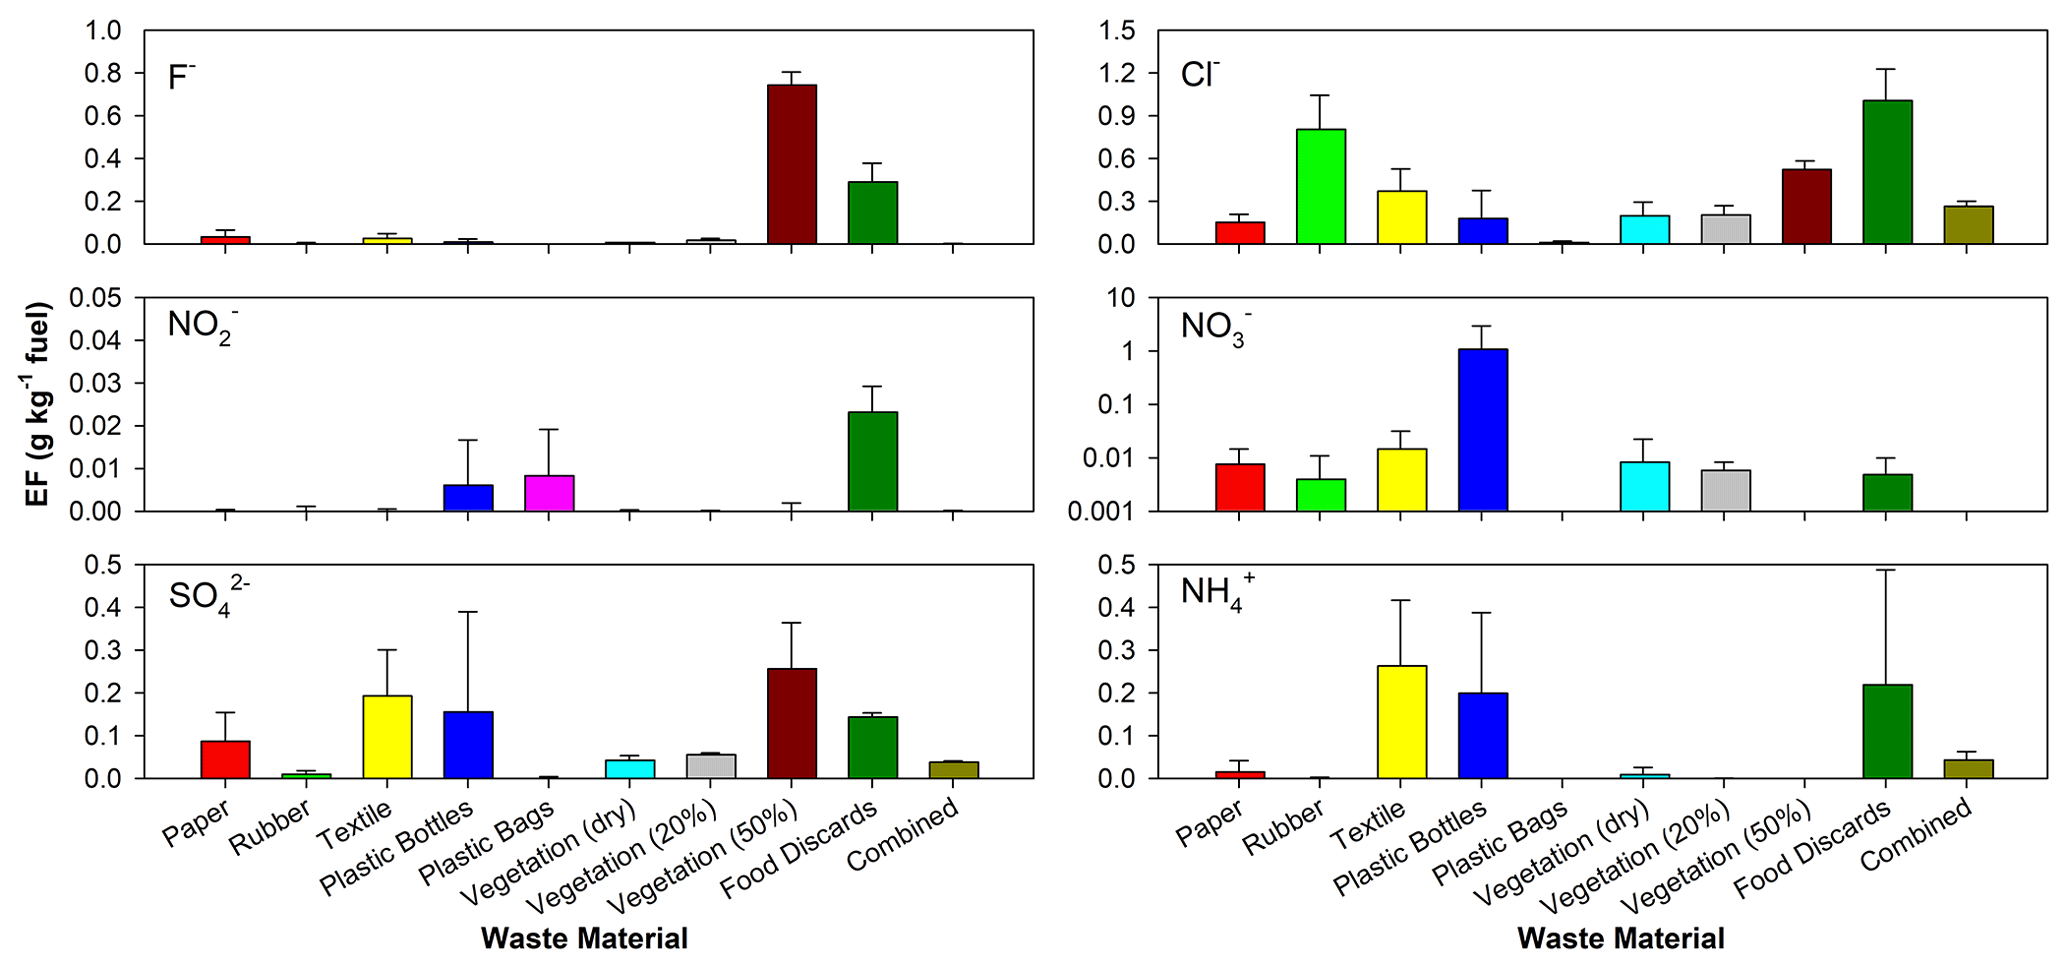
Figure 6Emission factors for ionic particulate species corresponding to the acidic and alkali gases.
The elemental abundances are shown in Fig. S4. Cl abundance ranged from 0.04 ± 0.04 % of PM2.5 mass for plastic bags to 5.1 ± 4.3 % for dry vegetation. The low Cl abundance in the tested plastics was probably due to their lack of polyvinyl chloride (PVC) components. Vegetation samples had higher potassium (K) abundances, consistent with the fact that K is often used as a biomass burning marker. Plastic bottles and bags had lower abundances of most elements than other materials, similar to the findings by Valavanidis et al. (2008). Sb has been reported as a potential marker for solid waste burning because of its use in textiles (flame retardant), batteries, and polyethylene terephthalate (PET) projection (Jayarathne et al., 2018; Christian et al., 2010). Figure S4 shows that Sb had higher abundances in rubber, vegetation, and mixed materials, but with lower abundances in paper, plastics, and food discards, indicating that caution should be taken when using Sb as a waste burning marker due to its high dependence on waste compositions. The Sb abundance in the combined materials (0.035 ± 0.021 %) is similar to the value of 0.025 ± 0.033 % reported by Jayarathne et al. (2018). The combined materials had higher abundances of Pb (0.075 ± 0.062 %) than other waste categories, probably related to the metals and glass added to the mix; this value is similar to the value of 0.057 ± 0.077 % reported by Jayarathne et al. (2018).
3.3 Acidic and alkali gases and ions
Acidic and alkali ionic species are present in both gas and particle phases, and their partition depends on temperature and reactions. Acidic and alkali gases are toxic and corrosive; they can cause adverse effects on human health, materials, and ecosystems if not neutralized soon after emission. Figure S5 shows elevated ionic concentrations for NO and NH on backup filters (i.e., in the form of HNO3 and NH3, respectively). The sum of gaseous ion abundances ranged from 0.6 % (plastic bottles) to 73 % (dry vegetation) of PM2.5, higher than the particulate ion abundances (less than 10 % of PM2.5). Figure S6 shows abundant Cl− and SO for dry and 20 % vegetation. Consistent with high abundances of elemental K, dry vegetation and 20 % moisture vegetation show high K+ abundances. Vegetation with 50 % moisture content had low K+ abundances, probably because the dominant smoldering phase left most K in the ash. The sums of anion equivalents were higher than those for cations for most materials, likely because the hydrogen ion (H+) was not measured; it might be associated with hydrochloric, sulfuric, or nitric acids. Therefore, directly emitted particles appear to be acidic, although these would probably be neutralized by available NH3 soon after emission. The deposition of the acidic waste-burning particles probably contributed to discoloring of the Taj Mahal in India (Lal et al., 2016).
Figures 5 and 6 show that EFs for HCl from rubber as well as HNO3 from rubber, textiles, vegetation, and food discards and NH3 from food discards were 1 to 2 orders of magnitude higher than the corresponding particulate ions. Food discards and 50 % moisture vegetation had the highest EFs for HF and particulate F−, consistent with fluorine accumulation in plants (Jayarathne et al., 2014). The modified combustion efficiencies (MCEs) for the dry (MCE = 0.88) and 20 % moisture (MCE = 0.91) vegetation samples were higher than the 50 % moisture vegetation sample (MCE = 0.79) (Wang et al., 2023). One would expect that the dry and 20 % moisture vegetation samples would cause higher EFs for HF than particulate F− due to preferred partition in the gas phase at higher combustion temperatures and MCEs. However, low HF and F− EFs were observed in these cases. Future study should investigate the partitioning of fluorine among gases, particles, and ashes during biomass burning. Jayarathne et al. (2014) reported F− EFs in the range of 0.7–136 mg kg−1 for several types of biomass burning with an overall average of 32 ± 7 mg kg−1. These values are in the range of dry (7.6 ± 0.6 mg kg−1) and 25 % moisture vegetation (17.8 ± 8.3 mg kg−1), but lower than the 50 % moisture vegetation (744 ± 61 mg kg−1) and food discards (291 ± 88 mg kg−1).
The rubber sample had the highest EF for HCl (9.6 ± 1.5 g kg−1) with an order of magnitude lower EF for PM Cl− (0.8 ± 0.2 g kg−1). Consistent with low elemental Cl emission, the plastic bottles or bags did not have high HCl or Cl− emissions. Lemieux (1997) reported HCl EFs of 1.51–3.28 and 0.086–0.481 g kg−1 for combined waste materials with higher and lower PVC mass fractions, respectively. The EF for lower PVC waste is similar to the values for combined materials (0.47 ± 0.22 g kg−1) measured in this study. These values are lower than the 1.7–9.8 g kg−1 EFs reported by Christian et al. (2010) for landfill MSW burning in Mexico. Stockwell et al. (2016) measured HCl from six mixed garbage samples and found EFs ranging from non-detectable to 3.03 g kg−1. They also found that one sample containing mostly plastic bags did not have detectable HCl, but another sample dominated by hard plastics had a high HCl EF of 77.9 g kg−1, indicating the high sensitivity of HCl EFs to fuel compositions.
Due to high volatilities, NO and NO were in the gas phase (Fig. S5). The waste materials had low sulfur content (Wang et al., 2023); therefore, EFs for both H2SO4 and SO were low. NH3 was in gas phase because the fresh emissions had not reacted with acidic gases to create PM ammonium. Similar to HF emissions, 50 % moisture vegetation (2.86 ± 0.16 g kg−1) and food discards (6.98 ± 1.05 g kg−1) had the highest NH3 EFs. The NH3 EF for the combined materials was 0.23 ± 0.08 g kg−1, within the large variations of 0.94 ± 1.02 g kg−1 reported by Akagi et al. (2011). The NH3 EFs for the vegetation (0.29–2.86 g kg−1) from this study are similar to the EFs of 0.52–2.72 g kg−1 found by Akagi et al. (2011) for different biomass burning emissions. Low EFs for particulate Cl−, NO, SO, and NH were also reported by Pokhrel et al. (2021) for African biomass burning emissions.
3.4 Non-polar organic compounds
The abundances (Fig. 7) and EFs (Fig. S7) for organic groups differ among waste materials. Higher abundances of n-alkanes, phthalate, and PAHs are found for rubber and plastics (Fig. 7), consistent with elevated EFs (Fig. S7). Paper and textile emissions are dominated by n-alkanes. The high abundance of n-alkanes and phthalates in solid waste burning is consistent with prior studies (Jayarathne et al., 2018; Simoneit et al., 2005).
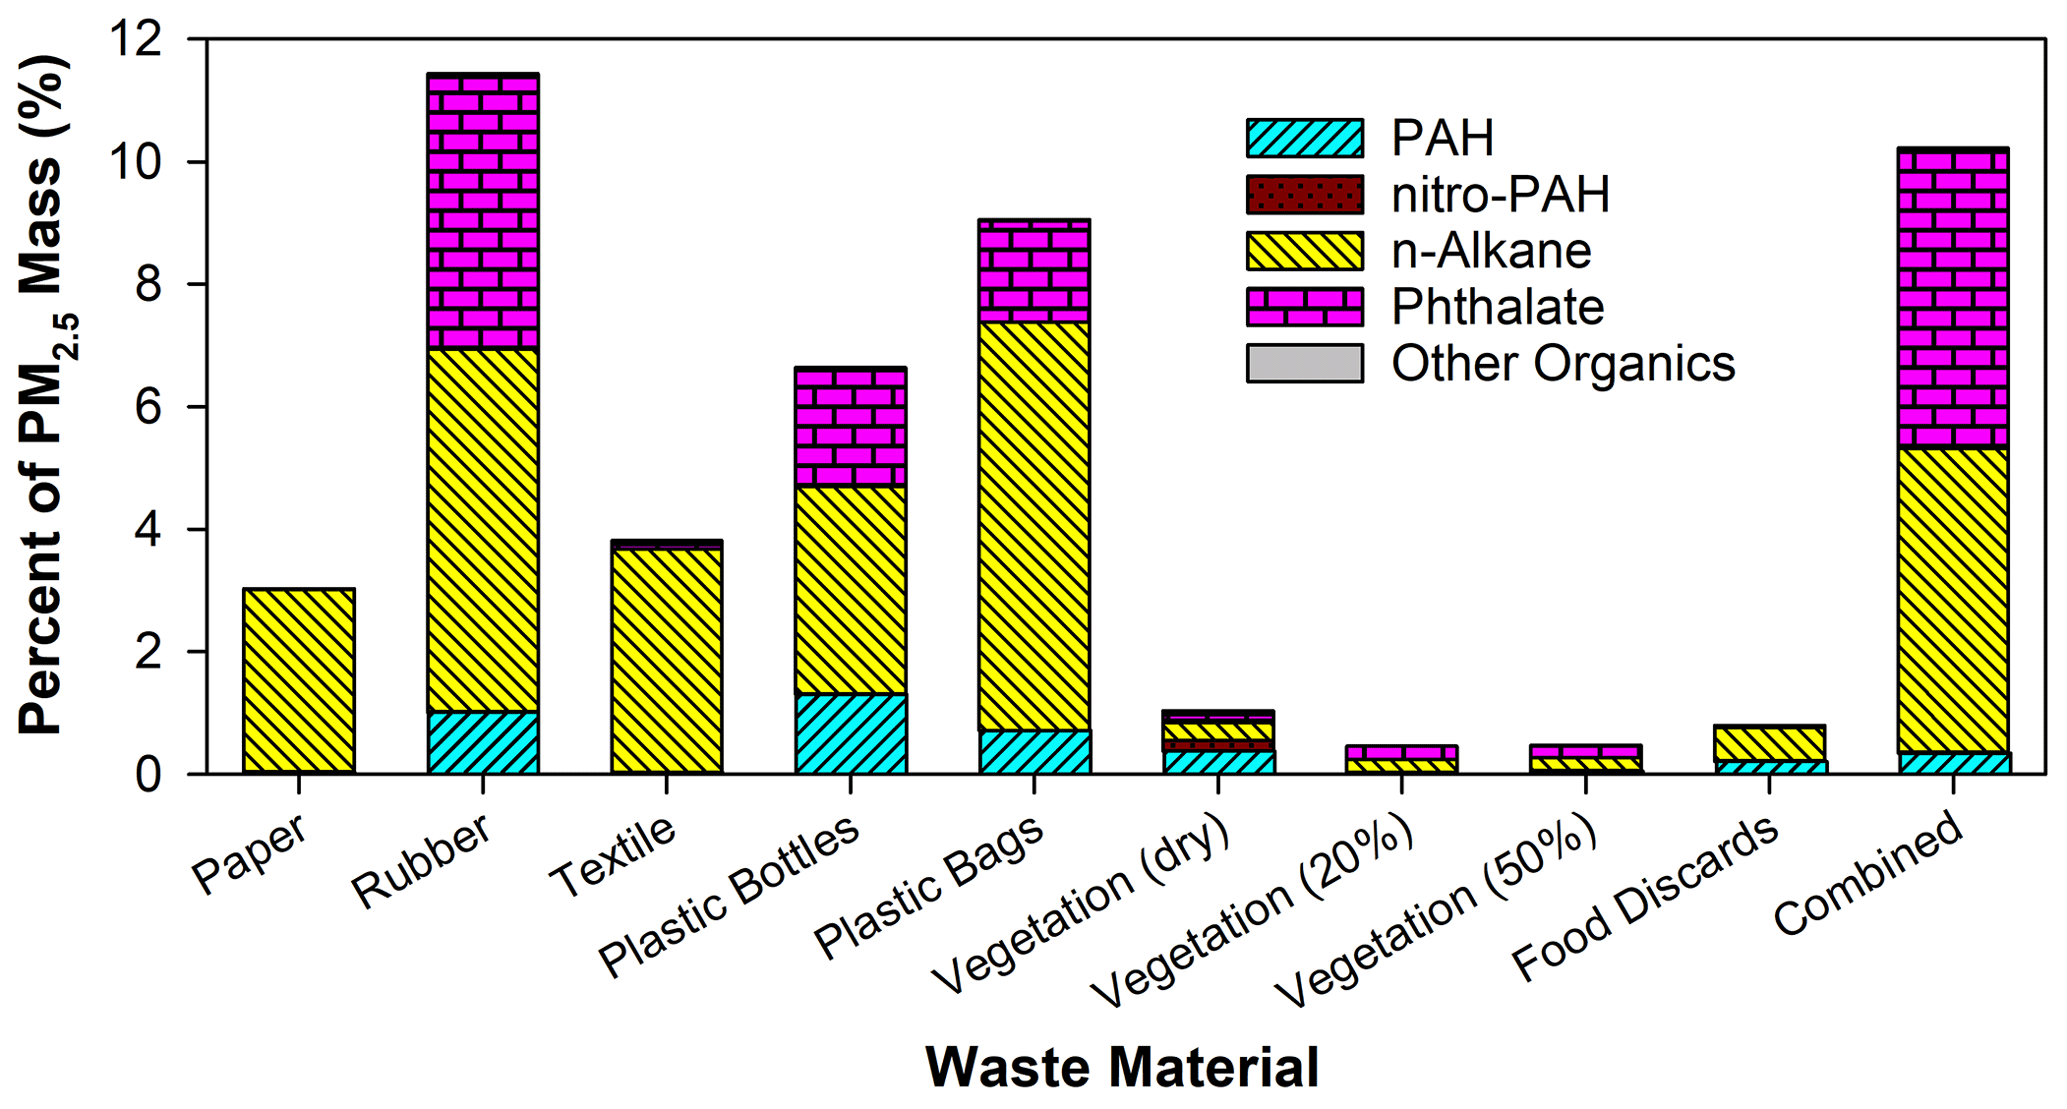
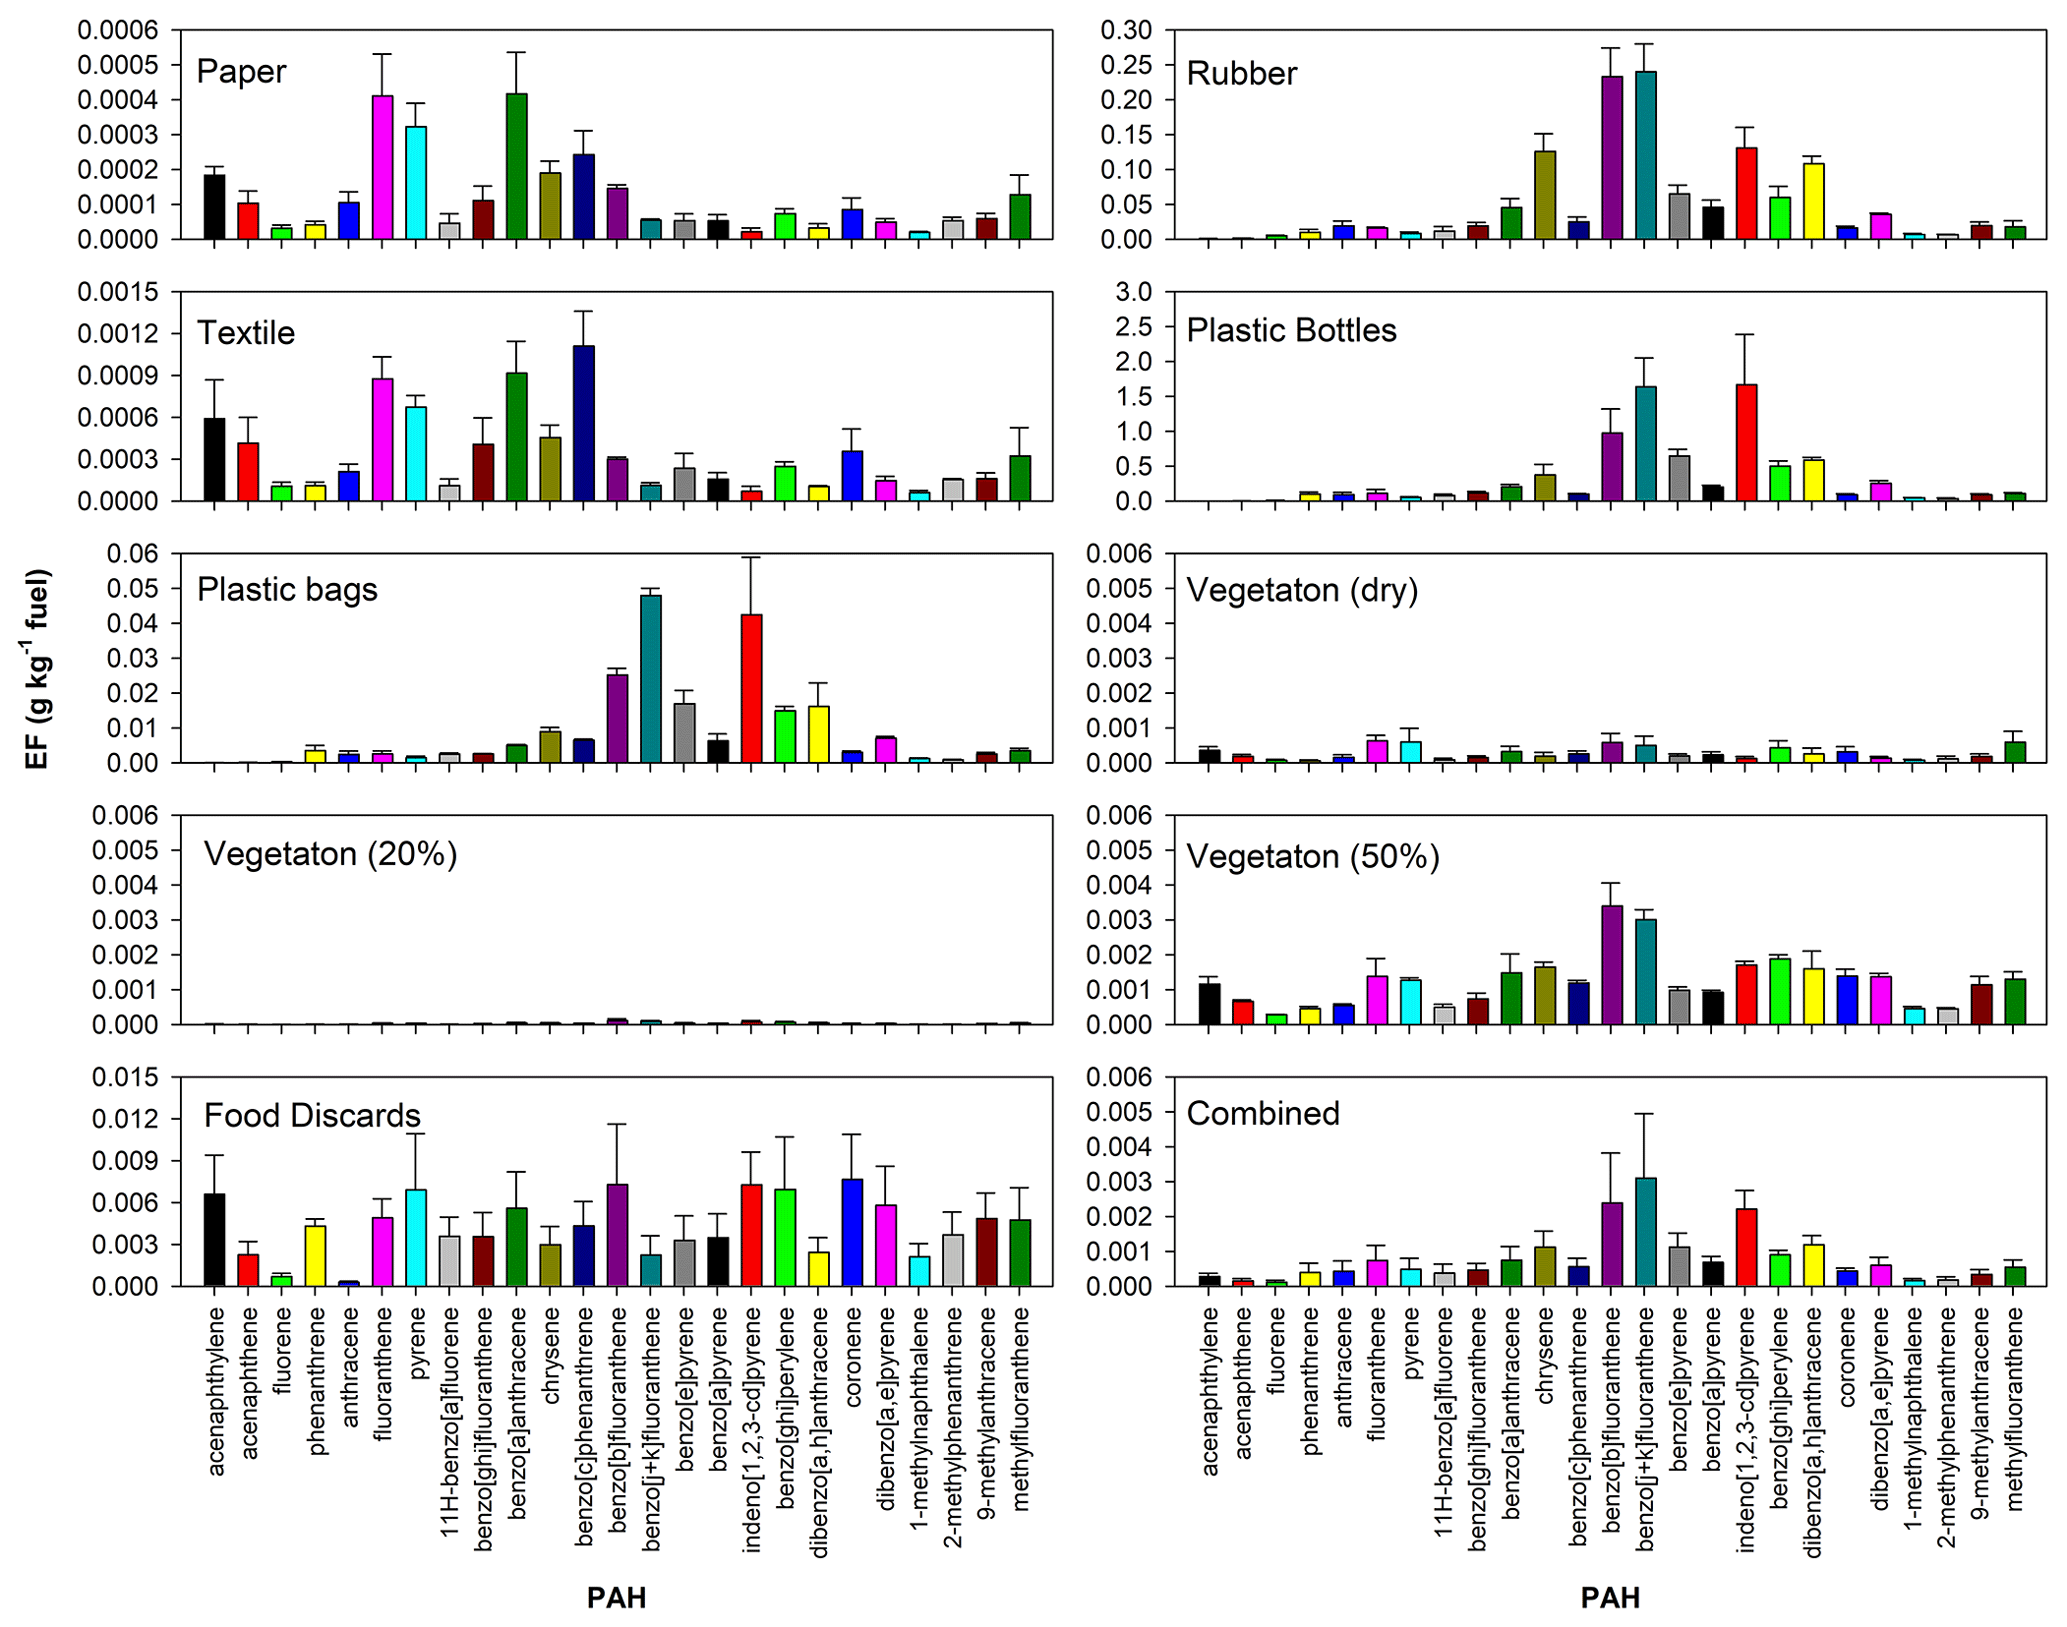
Figure 8 shows the EFs for the most abundant PAHs, including the US EPA priority PAHs (Andersson and Achten, 2015). The PAH distribution shows similar patterns for rubber and plastic bottles/bags, with dominant EFs and abundances (Fig. S8) found for five- and six-ring PAHs (e.g., benzo[b]fluoranthene, benzo[j + k]fluoranthene, and indeno[1,2,3-cd]pyrene), although the relative abundances for rubber differ from those for plastic bottles and bags. Simoneit et al. (2005) also reported that benzo[j + k]fluoranthene (0.02 %–0.036 % of PM10 mass) and indeno[1,2,3-cd]pyrene (0.01 %–0.024 % of PM10 mass) were the most abundant PAHs from plastics combustion. However, their abundances were an order of magnitude lower than the abundances found in this study (0.1 %–0.3 % of PM2.5 mass for both PAH species). Paper and textiles consist mostly of four-ring PAHs, with high EFs for fluoranthene, pyrene, benzo[a]anthracene, and benzo[c]phenanthrene. The PAH EFs for textiles were about twice those for paper. Vegetation and food discard burning emitted a wide range of PAHs, and the EFs varied significantly with moisture content.
PAH EFs from this study and those reported in the literature are compared in Table 1. Note that PAH compounds measured in different studies may be different. The PAH EF for paper from this study (0.051 ± 0.001 g kg−1) is in the same range as that reported by Wu et al. (2021) but is over an order of magnitude higher than those by Park et al. (2013) and Hoffer et al. (2020). Hoffer et al. (2020) also reported much lower PAH EFs for rubber but similar EFs for textiles as compared to this study. The plastic bottle PAH EF from this study is over an order of magnitude higher than the other studies, while the plastic bag and vegetation PAH EFs from this study are consistent with several other studies (Jayarathne et al., 2018; Hoffer et al., 2020; Wu et al., 2021; Andreae, 2019). However, the EFs for food discards are over 10 times higher than those for vegetation. The combined waste PAH EF from this study (0.024 ± 0.010 g kg−1) is close to that for recycled waste (0.0235–0.0244 g kg−1) by Lemieux (1997) and dry mixed waste (0.015 g kg−1) by Jayarathne et al. (2018). These EFs are lower than those reported for non-recycled waste (Lemieux, 1997) and damp mixed waste (Jayarathne et al., 2018).
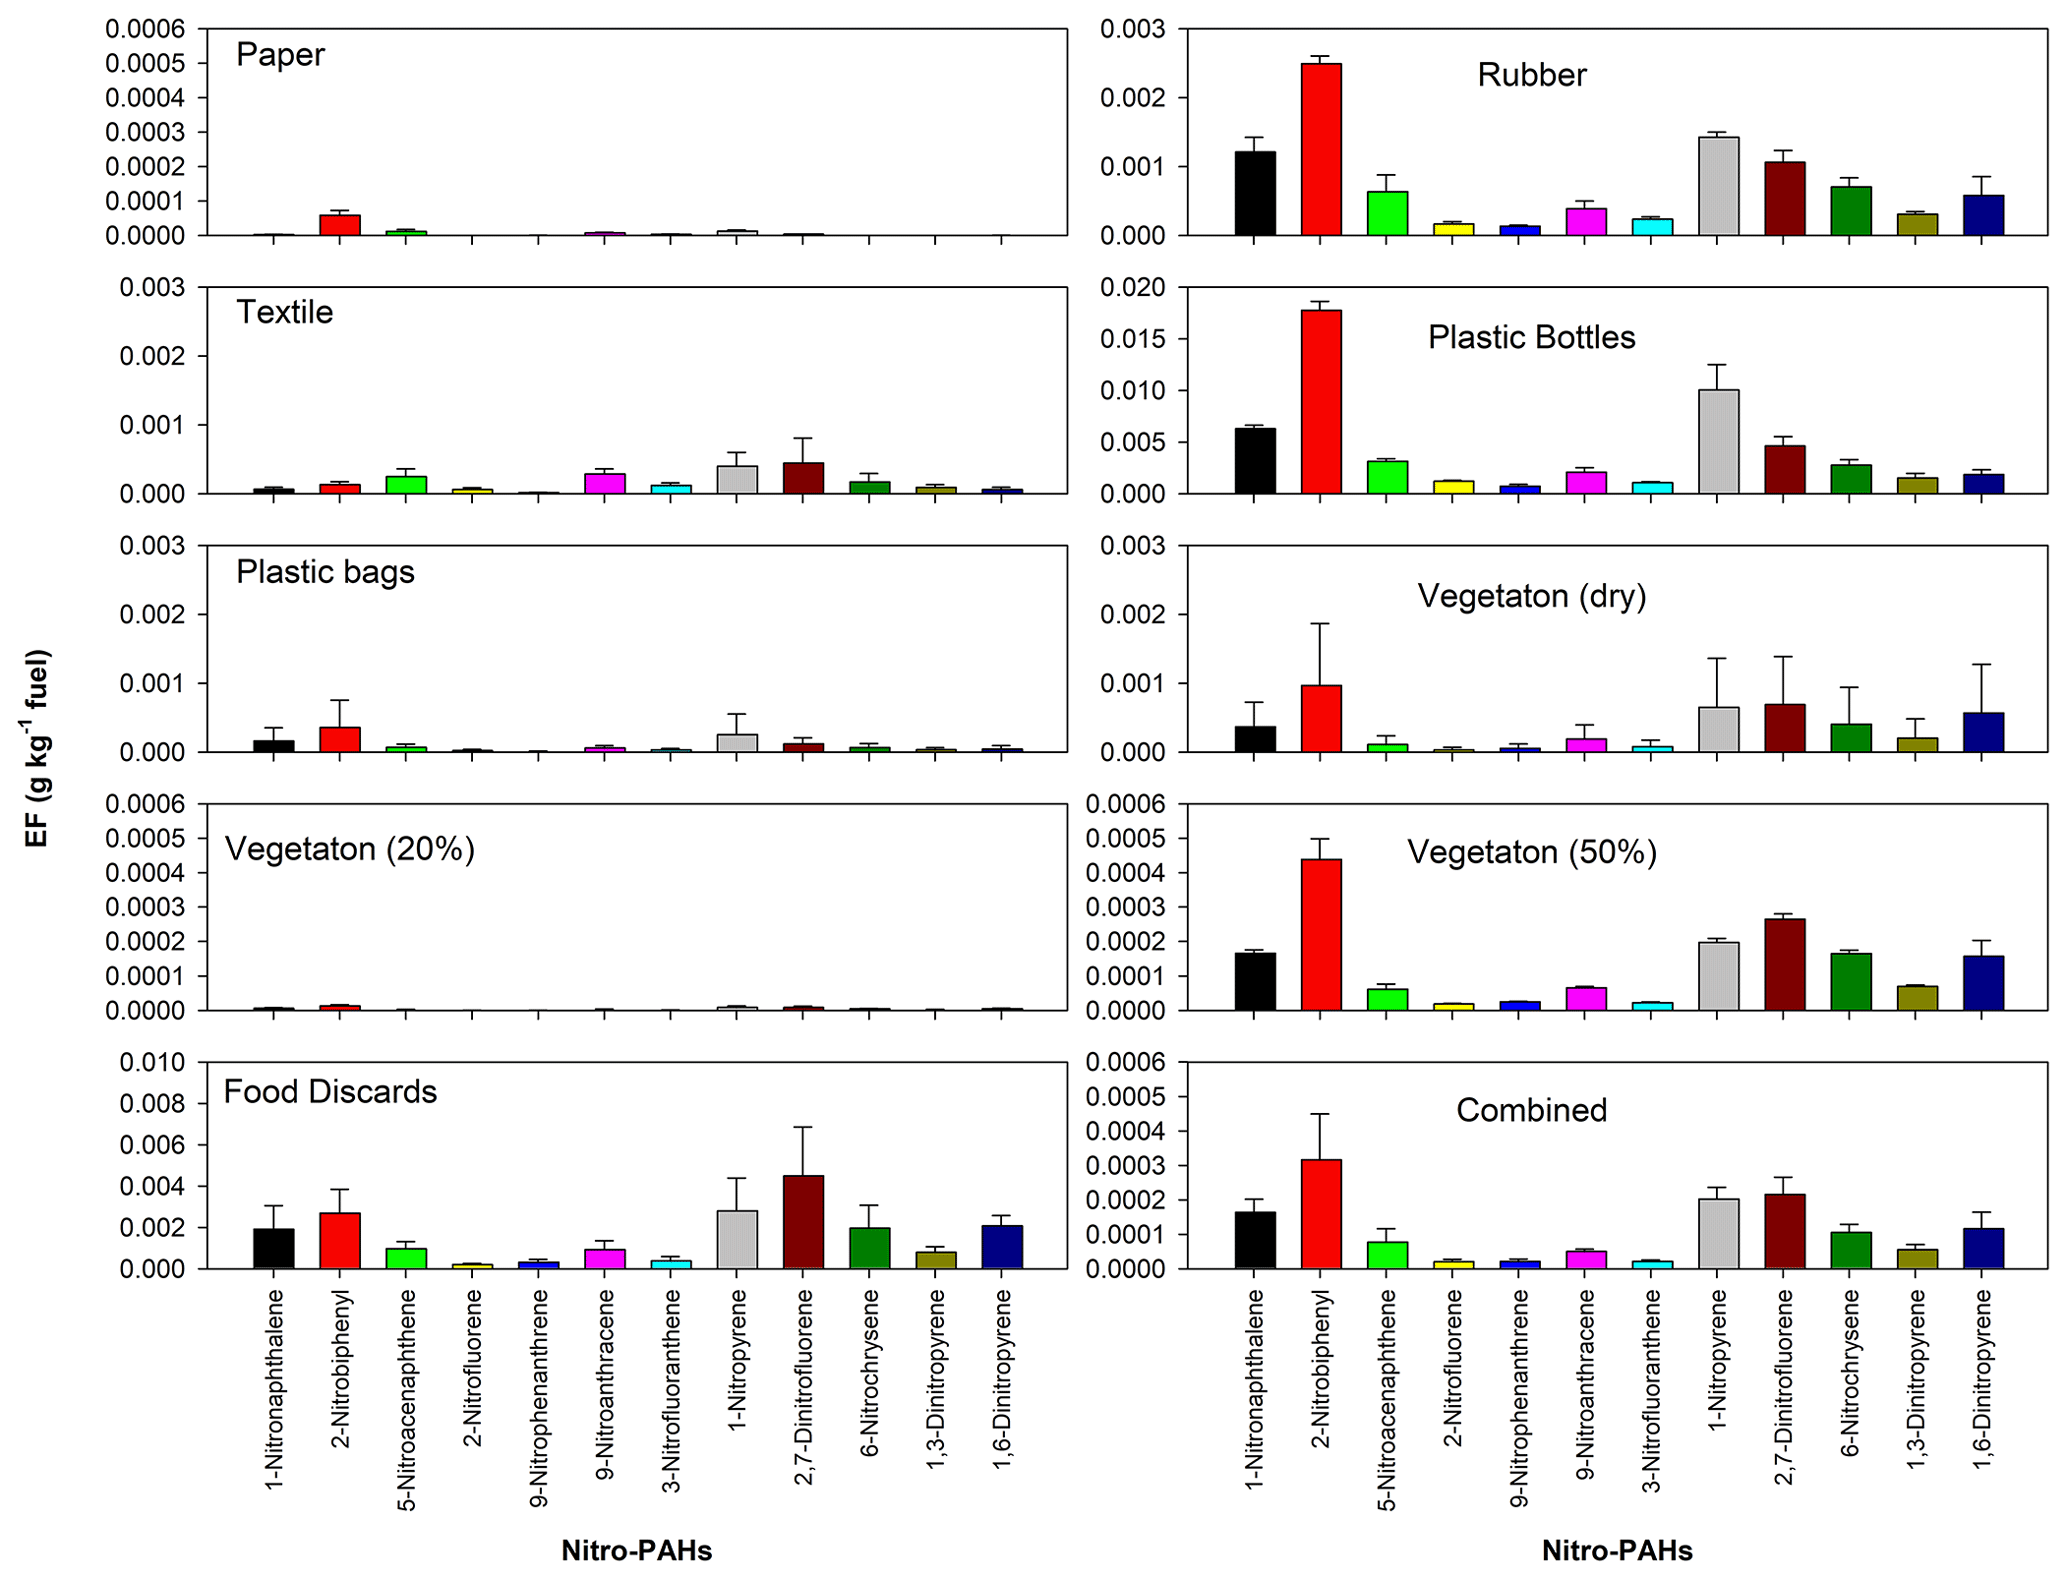
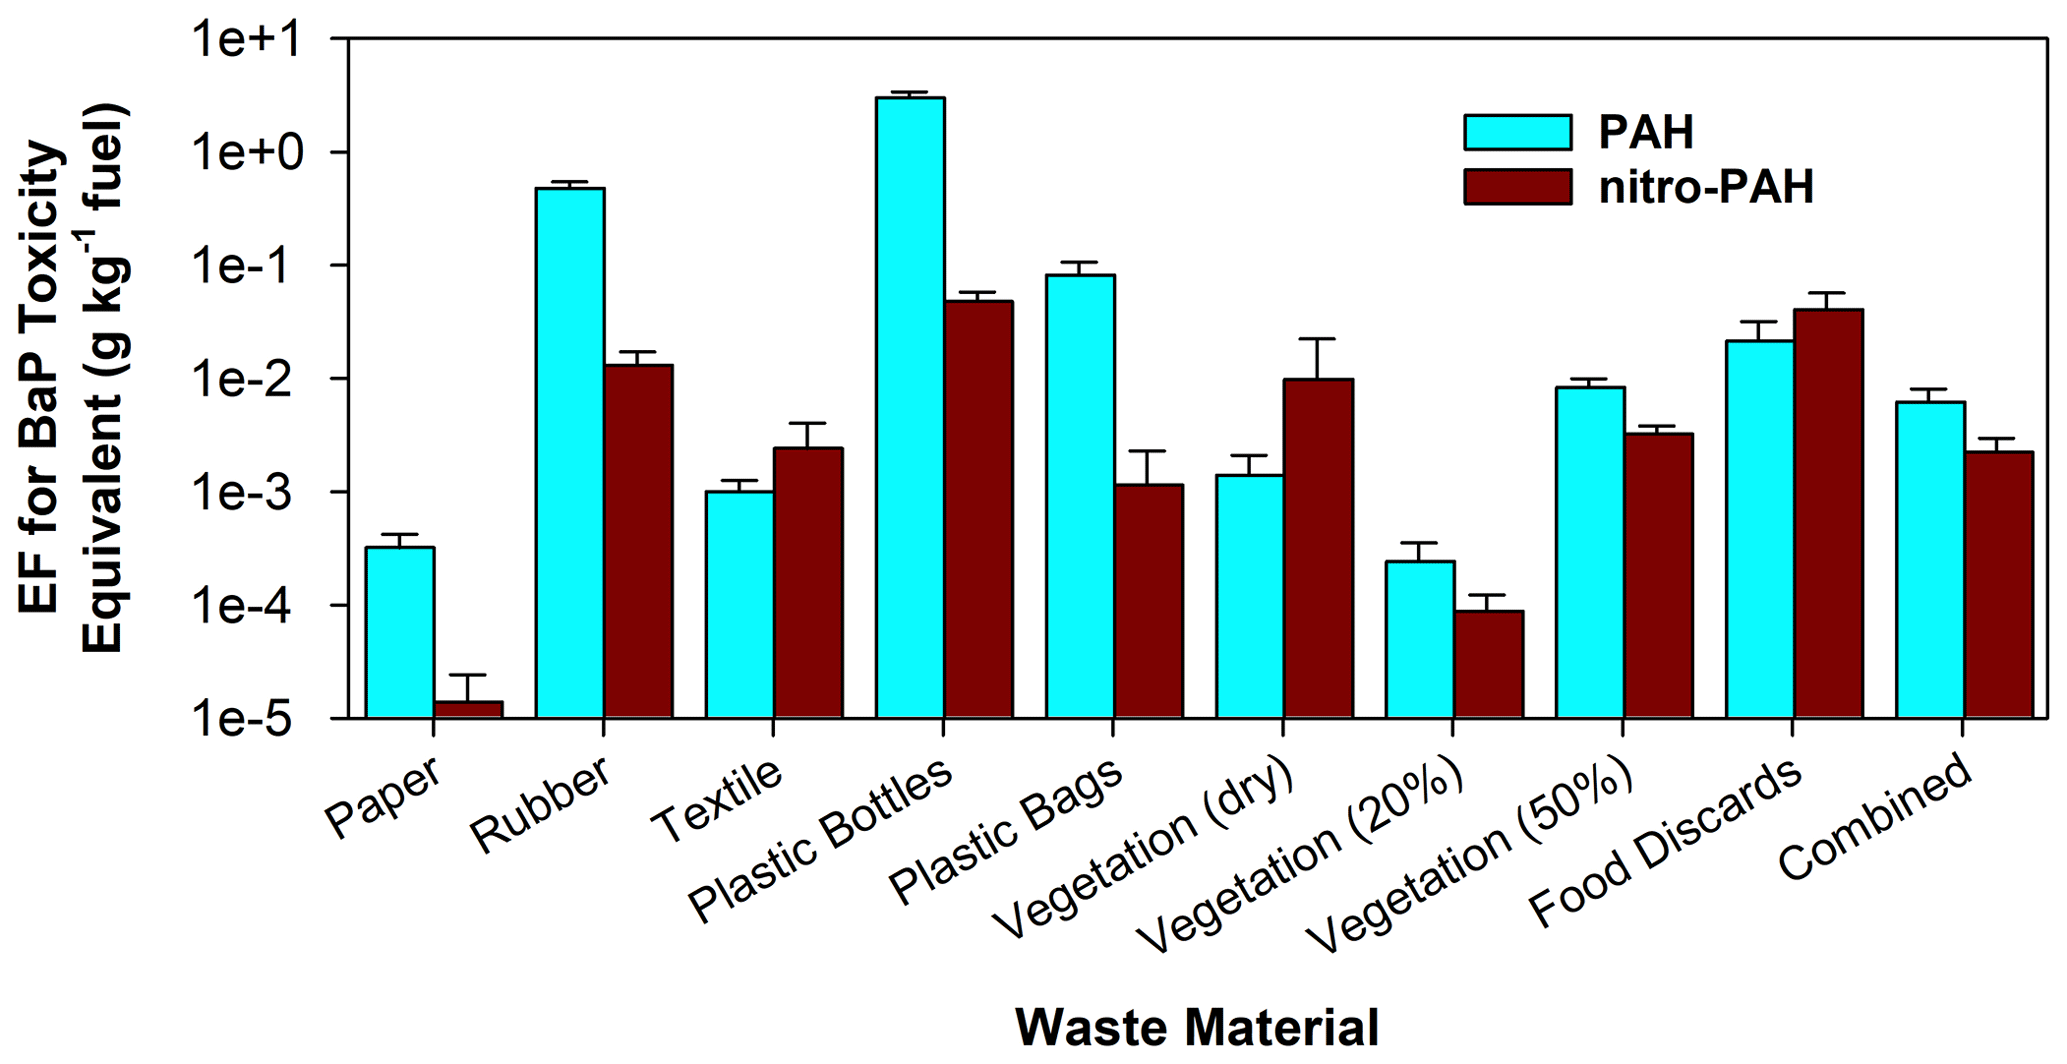
Figure 10Emission factors for total PAHs and nitro-PAHs expressed in benzo[a]pyrene (BaP) toxicity equivalent.
PAH diagnostic ratios have been used to infer PAH sources (Ravindra et al., 2008; Harner et al., 2018); however, not many ratios have been reported for MSW burning emissions (James et al., 2023). Table S3 lists several common PAH diagnostic ratios from this study. While there are similarities among different materials, some distinct ratios can be observed. For example, plastic bottles and bags have significantly (p<0.05) higher and ratios; however, they had much lower emissions of retene, which is a biomass burning emission tracer, than other materials.
Figures 9 and S9 show that 2-nitrobuphenyl is the most abundant nitro-PAH for most MSW. Plastic bottles had the highest nitro-PAH EFs, followed by food discards and rubber. The dry vegetation had higher EFs than the moisture fuels.
The cancer risks of PAHs and nitro-PAHs are often estimated using the equivalents of benzo(a)pyrene (BaPeq), one of the most potent PAHs with known carcinogenic characteristics. The toxic equivalent factor (TEF) for BaP is set to 1, and other PAHs and nitro-PAHs are assigned a TEF value by comparing their relative toxicity to that of BaP (ATSDR, 2022; Samburova et al., 2017; Moradi et al., 2022). For PAHs, dibenzo[a,h]anthracene has the highest TEF of 2.4, followed by BaP, benzo[e]pyrene and dibenzo[a,e]pyrene, with a TEF of 1.0 (ATSDR, 2022; Samburova et al., 2017). For nitro-PAHs, 6-nitrochrysene and 1,6-dinitropyrene have the highest TEF of 10 (ATSDR, 2022). The EFs for BaPeq (BaP toxicity equivalent) were calculated from the sums of the products of the EF and TEF of individual PAHs and nitro-PAHs. Figure 10 shows that plastic bottles, rubber, and plastic bags had the highest PAH EFs for BaPeq, while plastic bottles, food discards, and rubber had the highest nitro-PAH EFs for BaPeq, consistent with their high EFs for PAHs and nitro-PAHs. The PAH BaPeq EFs for paper (0.00032 ± 0.00010 g kg−1) and textiles (0.0010 ± 0.0003 g kg−1) are in similar ranges to those reported by Hoffer et al. (2020): 0.00016 ± 0.00012 g kg−1 for paper and 0.0016 ± 0.0020 g kg−1 for textiles. However, the PAH BaPeq EFs for rubber (0.47 ± 0.06 g kg−1) and plastic bottles (3.0 ± 0.4 g kg−1) were over an order of magnitude higher than the tire and plastics (0.001–0.02 g kg−1) reported by Hoffer et al. (2020). These differences are likely caused by the more efficient oxidation by co-combustion of solid waste with charcoal in the Hoffer et al. (2020) tests, and more PAH species were measured and included in the BaPeq calculation in this study.
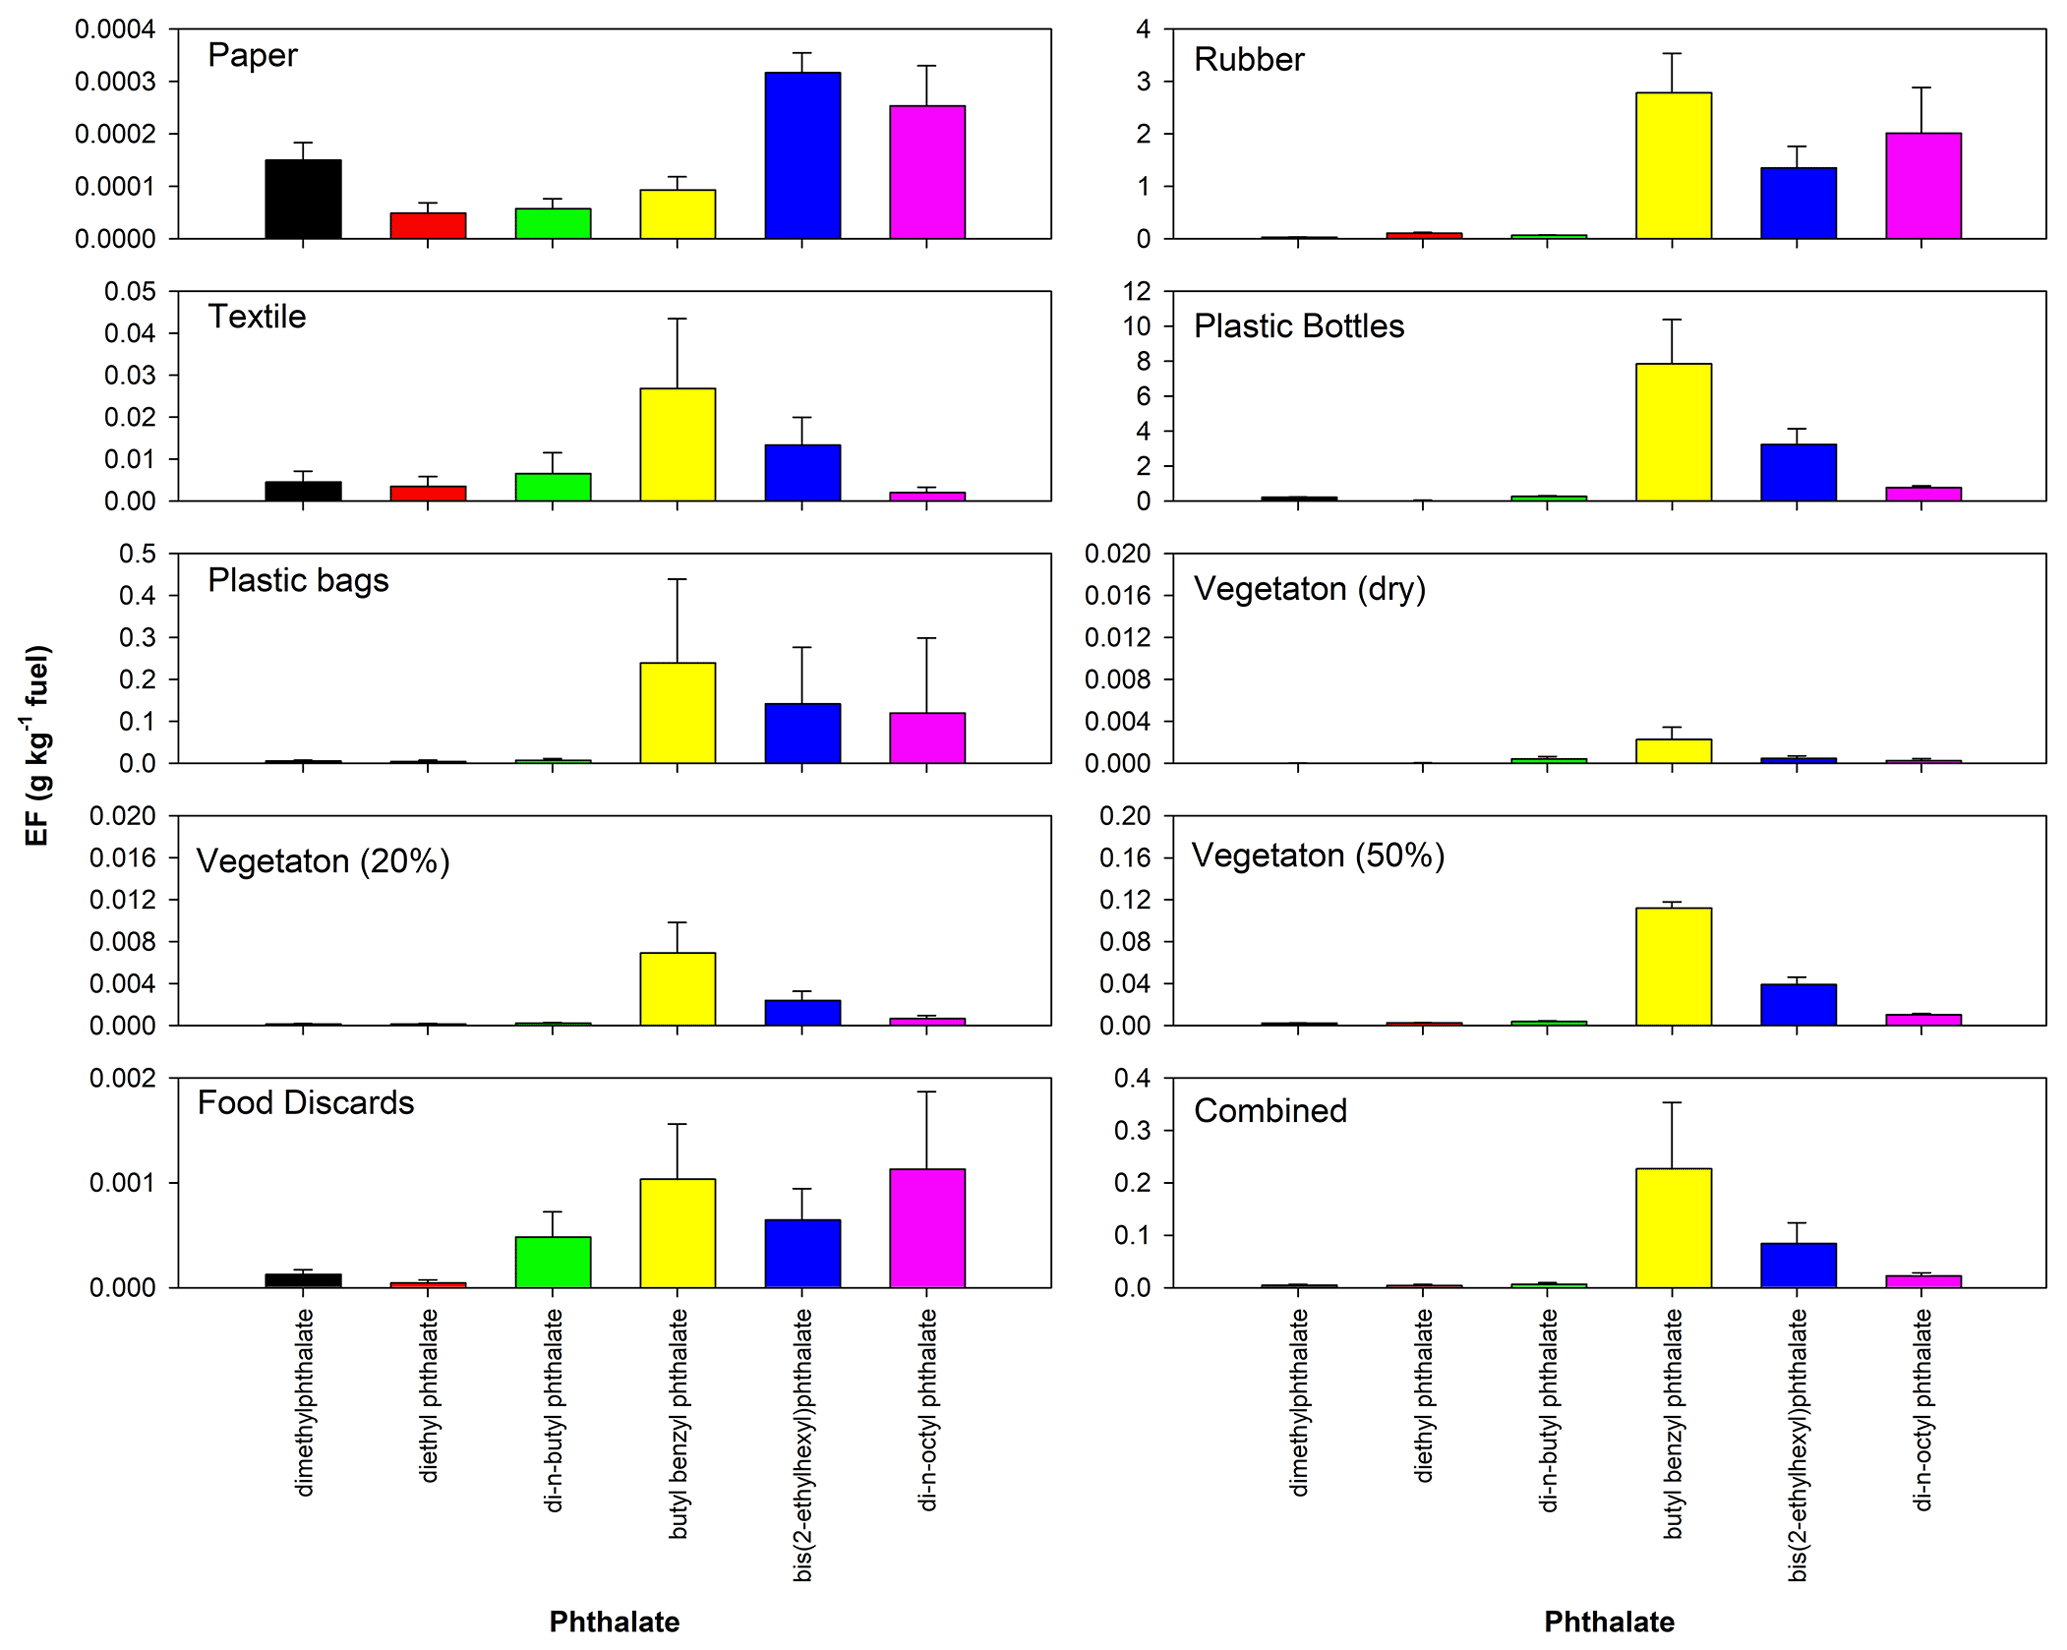
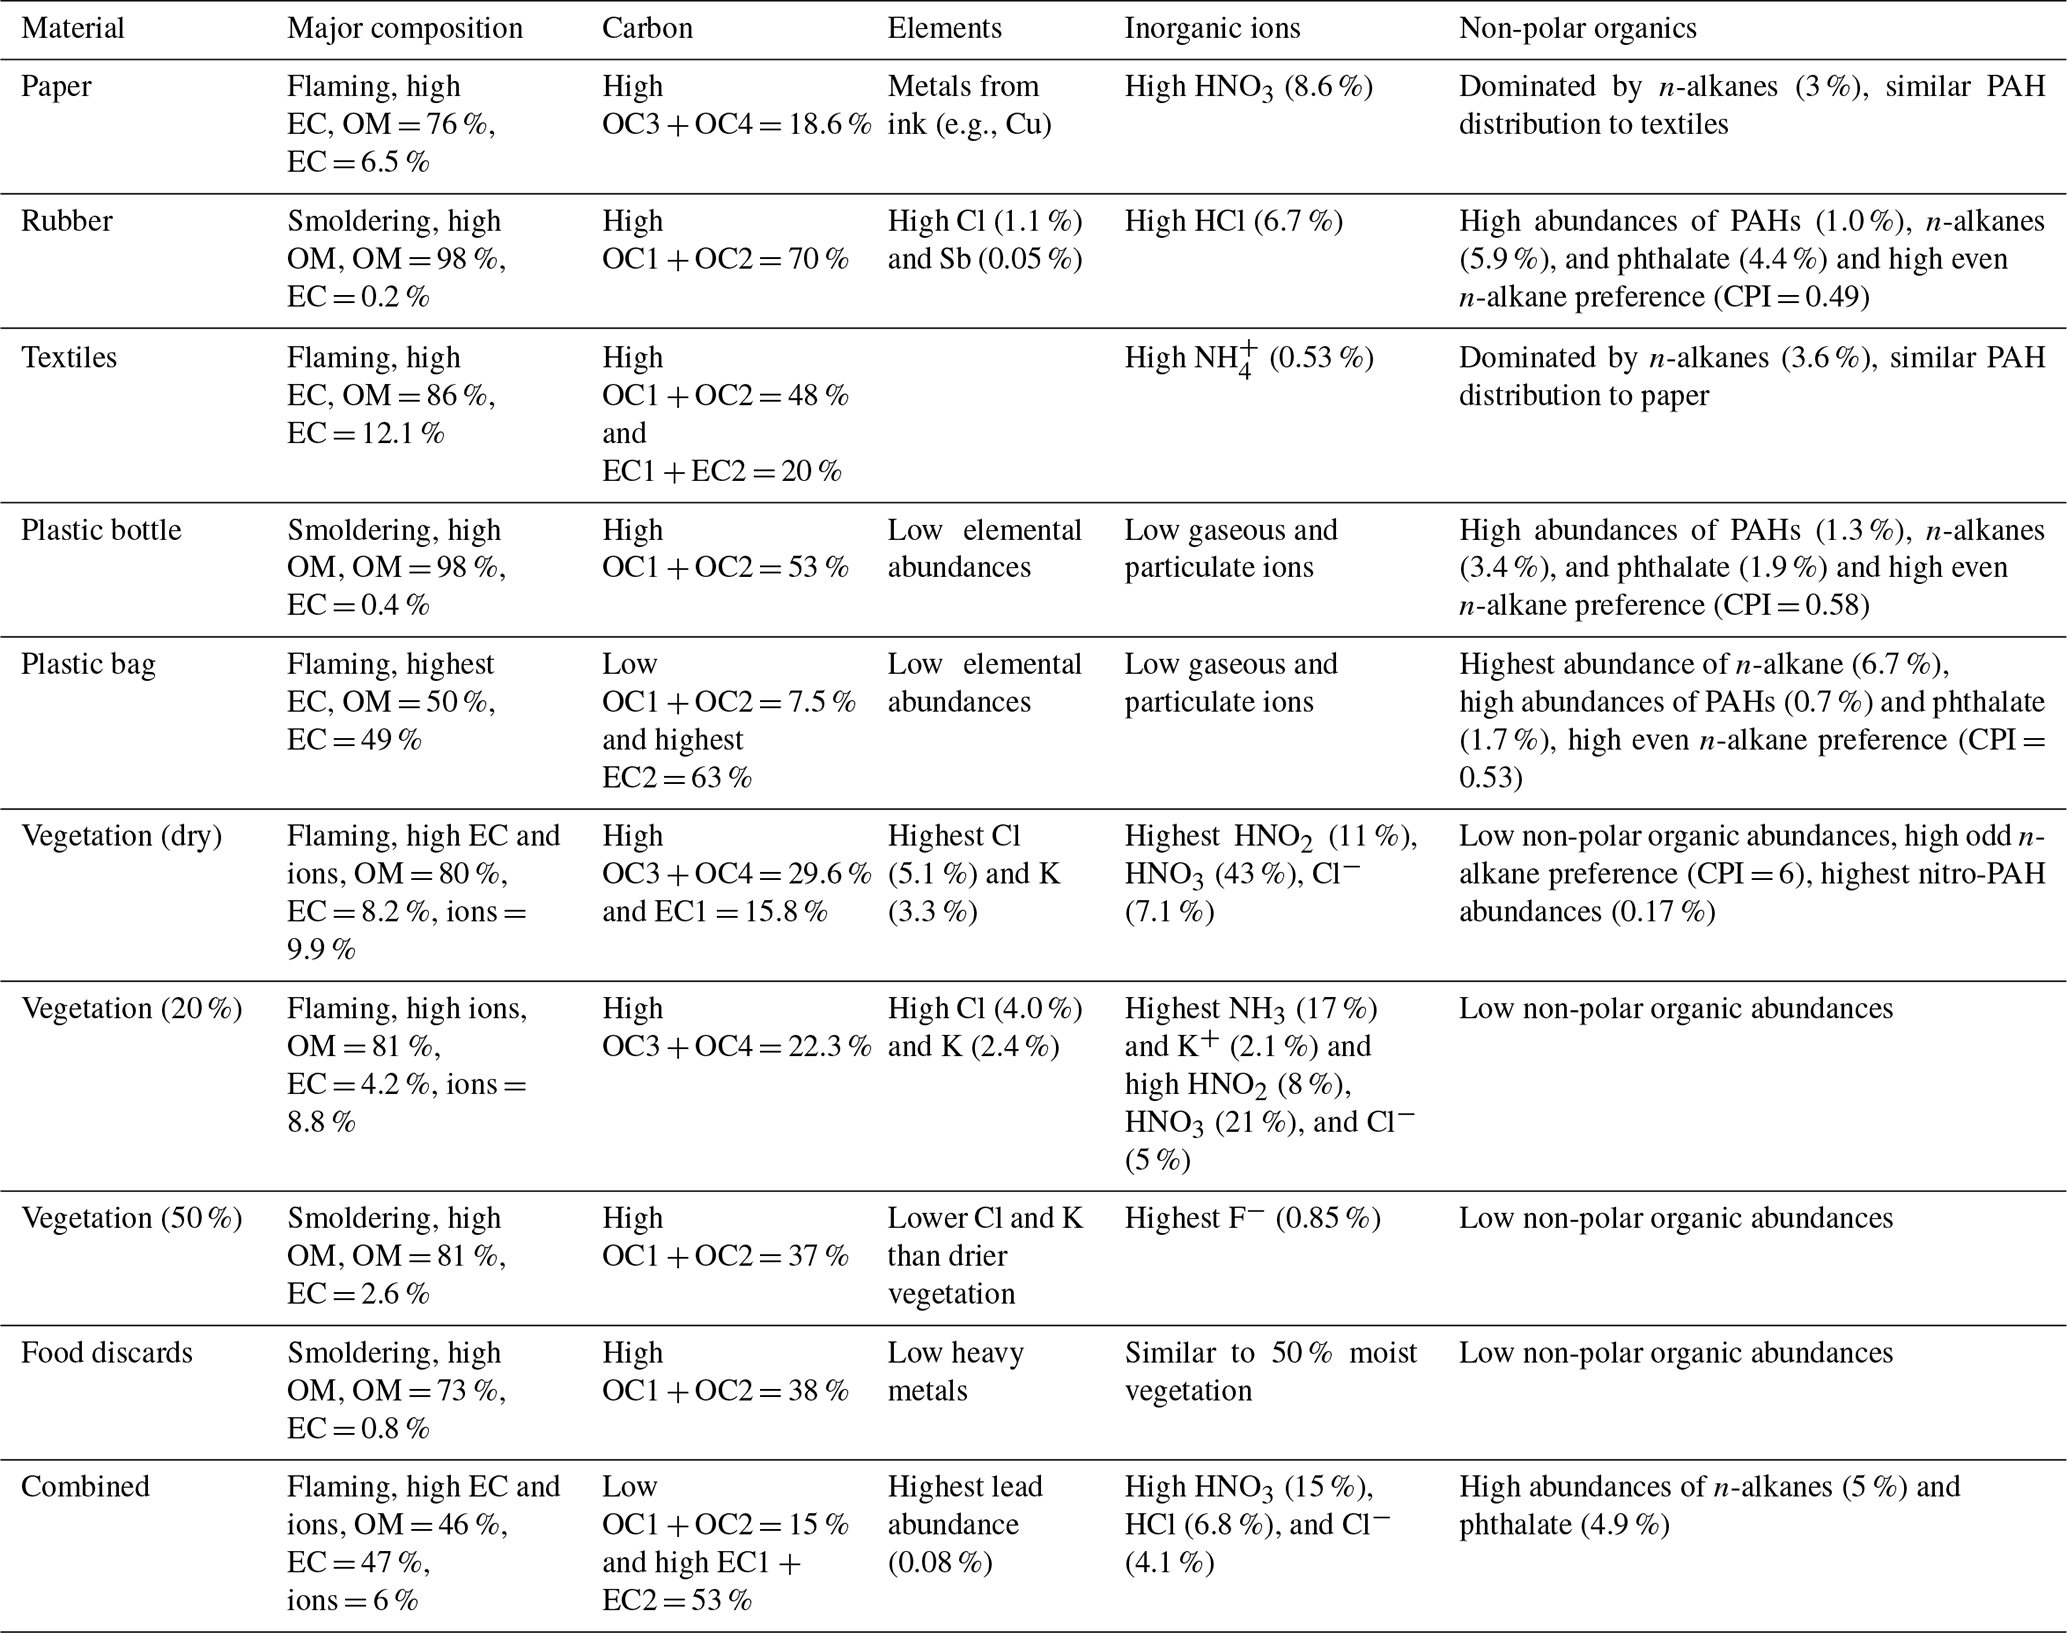
Table 2Summary of chemical abundance characteristics of emissions from open burning of different waste materials.
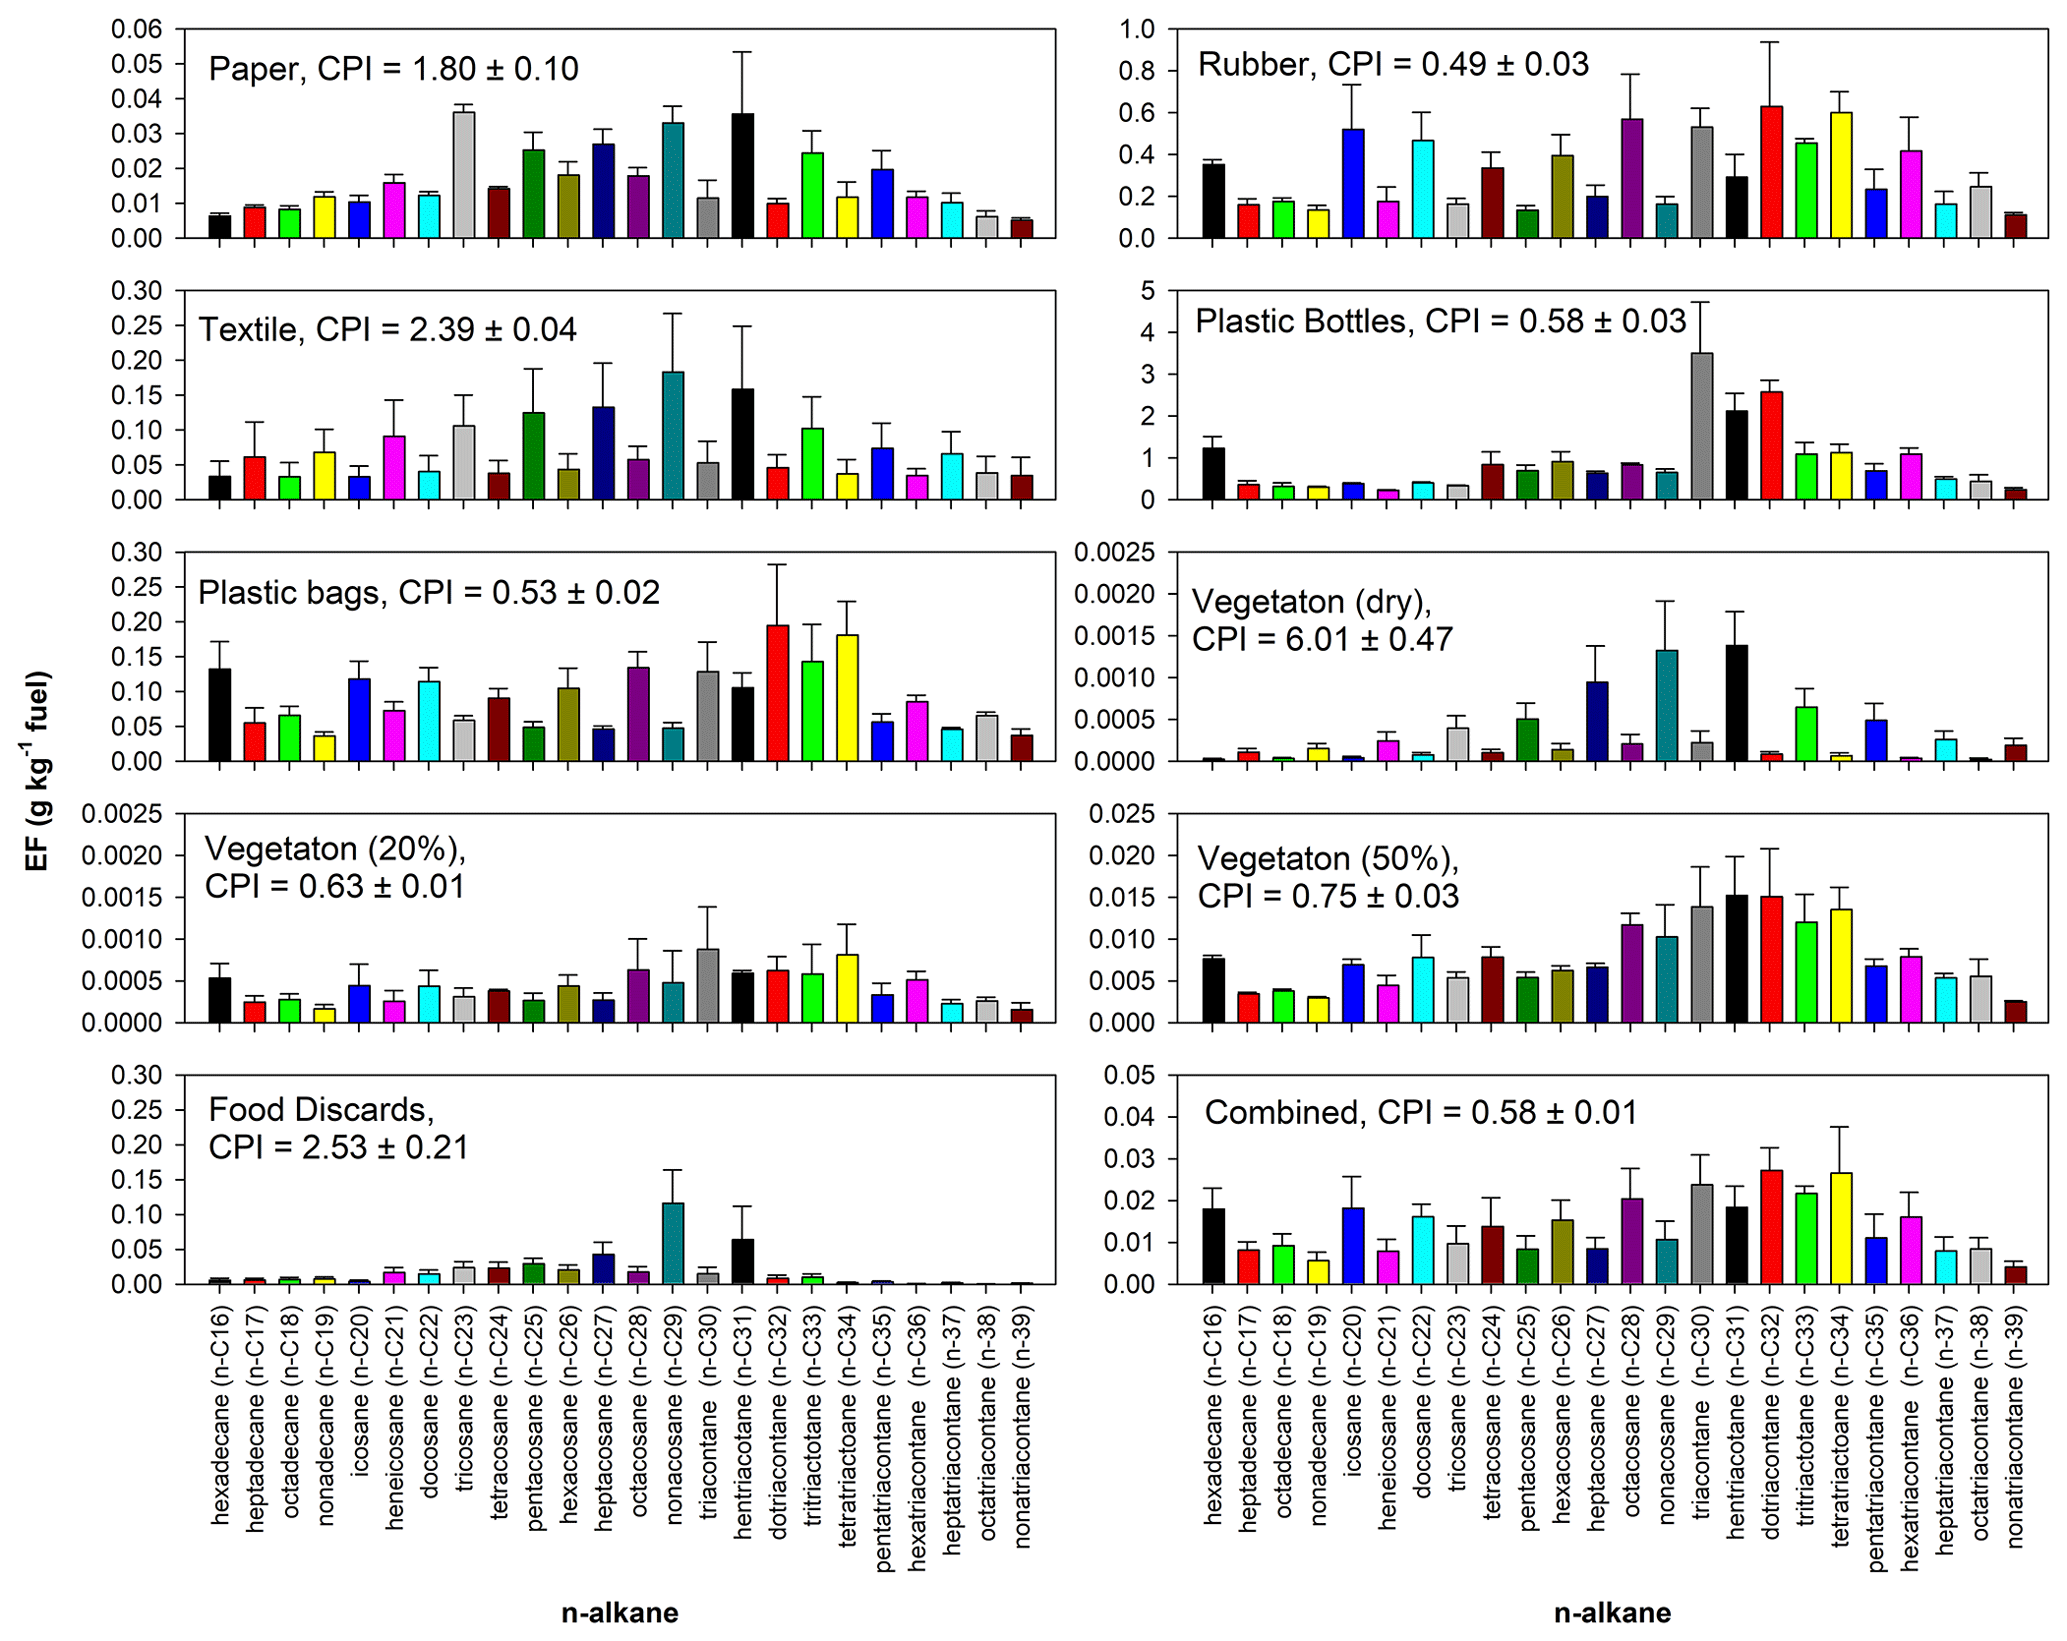
Abundances and EFs for n-alkanes are shown in Figs. S10 and 11, respectively. The most striking preference of odd alkanes over even alkanes was observed for the dry-vegetation emissions, with a carbon preference index (CPI; the ratio of the sums of odd to even carbon numbers) of 6.01 ± 0.47, consistent with literature findings (Rogge et al., 1993; Noblet et al., 2021; Caumo et al., 2020). The higher-than-unity CPI is due to biogenic wax emissions. The EFs for 50 % moisture vegetation were over an order of magnitude higher than those of dry and 20 % moisture vegetation samples. However, the odd n-alkane preference was lost in emissions from moist vegetation, with CPI values of 0.63 ± 0.01 and 0.75 ± 0.03 for vegetation with 20 % and 50 % moisture content, respectively. Paper, textiles, and food discard emissions also showed preference for odd n-alkanes, with CPIs of 1.80 ± 0.10, 2.39 ± 0.04, and 2.53 ± 0.21, respectively. Plastic bottles had the highest EFs for n-alkanes, with C30–C32 having the highest EFs. Synthetic rubber and plastic bags had the second- and third-highest EFs for n-alkanes.
The CPIs for plastic bottles and bags, rubber, and combined waste material were less than 0.6, indicating combustion of petroleum products (Rogge et al., 1993). Jayarathne et al. (2018) reported CPIs of 0.6–1.1 for mixed waste, similar to the combined materials (0.58 ± 0.01) in this study. Simoneit et al. (2005) reported strong preferences for even-carbon-number n-alkanes (CPI = 0.1–0.47) for plastic extracts, but the preference decreased (CPI = 0.68–0.98) in the plastic burning smoke due to thermal cracking. These values are slightly higher but close to those for plastic bottles (0.58 ± 0.03) and plastic bags (0.53 ± 0.02). The carbon number maxima (Cmax) are C30 and C32 for plastic bottles and C32 and C34 for plastic bags, consistent with the values reported by Simoneit et al. (2005).
Phthalates can irreversibly disrupt the endocrine system, metabolism, and multiple organs (Wang and Qian, 2021; Simoneit et al., 2005). Bis(2-ethylhexyl)phthalate (DEHP), one of the most common phthalates, was designated by the US Environmental Protection Agency (EPA) as a probable human carcinogen (Miao et al., 2017). EFs (Fig. 12) and percent PM2.5 abundance (Fig. S11) for phthalates are the highest for plastic bottles and bags, rubber, and combined materials, consistent with phthalates' use as plasticizing agents (Chien et al., 2003). Butyl benzyl phthalate (BBP), DEHP, and di-n-octyl phthalate (DnBP) were the phthalate species with the highest EFs for all waste materials. Rubber had higher abundances of DnBP than plastic bottles or bags. Phthalate EFs from 50 % moisture vegetation are over an order of magnitude higher than the drier vegetation samples, while paper had the lowest phthalate EFs.
3.5 Summary of chemical characteristics and emission factors
Table 2 summarizes the key chemical characteristics of gases and PM2.5 emitted from waste burning. These features can serve as signatures of emission sources in source apportionment studies. OM was the most abundant component (> 50 % of PM2.5 mass) for all waste materials, and EC was more abundant in the flaming fuels, including plastic bags, combined fuels, textiles, and dry vegetation. The sum of the lower-temperature OC1 and OC2 components exceeded 20 % for most fuels, except for plastic bags and combined fuels, which had the highest sums of EC1 and EC2 (53 %–70 %). Cl was the most abundant element in PM2.5 from all waste materials. Vegetation samples had higher abundances of K and K+, confirming their use as biomass burning markers. Paper and textile non-polar organic emissions were dominated by n-alkanes. They had similar PAH distributions with abundant four-ring PAHs (e.g., fluoranthene, pyrene, benzo[a]anthracene, and benzo[c]phenanthrene). Rubber, plastic bottles, and plastic bag emissions have high abundances of PAHs, n-alkanes, and phthalates, with abundant five- and six-ring PAHs (e.g., benzo[b]fluoranthene, benzo[j + k]fluoranthene, and indeno[1,2,3-cd]pyrene). Dry-vegetation emissions produced approximately 10-fold higher PAH abundances than moist-vegetation fuels, with a strong preference for odd n-alkanes and a CPI of 6.01 ± 0.47. In contrast, rubber and plastic bottles and bags showed preference to even n-alkanes, with CPI values less than 0.6. Rubber, plastic bottles and bags, and combined materials had the highest abundance of phthalates, while dry-vegetation burning had the highest abundance of nitro-PAHs.
In term of EFs, Cl had the highest EFs among all elements measured by XRF. Rubber had the highest EFs for particulate Cl and S as well as gaseous HCl due to its most abundant Cl and S in the fuel. Rubber also had the highest EFs for HAP elements (Cd, Sb, and Pb), while 50 % moisture vegetation had the highest EFs for Cr, Co, Ni, and Se. Food discards and 50 % moisture vegetation had the highest EFs for HF, NH3, and particulate F−. The phthalates with the highest EFs are BBP, DEHP, and DnBP. Plastic bottles had the highest EFs for nitro-PAHs, followed by food discards and rubber. Among all measured nitro-PAHs, 2-nitrobiphenyl had the highest EFs for most waste materials.
This study provides detailed chemical speciation of filter samples collected from laboratory combustion of 10 municipal solid waste (MSW) materials, representing open burning of household waste in South Africa. Source profiles and emission factors were calculated. The key conclusions are as follows.
Source profiles representative of local emission sources are critical for accurate source apportionment (Watson et al., 2016). This study expands conventional elements, ions, and carbon fractions to include non-polar organic compounds such as PAHs, nitro-PAHs, alkanes and alkenes, and phthalates. The additional chemical speciation allows improvement in source attributions of open waste burning in South Africa and other regions in the world.
Emission factors derived from the combustion of local materials that represent community-generated solid waste improve the accuracy of emission estimates. Emissions from open burning of MSW are understudied for local, national, and global emission inventories (Wiedinmyer et al., 2014) with a dearth of measurements for waste combustion (Rabaji, 2019; Kwatala et al., 2019). This study contributes to the air quality management and research communities by providing experimentally determined EFs for different waste material categories specific to South Africa. These localized EFs can be used to estimate the emission reductions for SASOL's WCI program and to improve MSW open-burning emission inventories for South Africa and other countries.
EFs for chemical species provide additional information to assess potential health risks associated with exposure to open-burning emissions. The established chemical database can be used for risk assessment to further demonstrate emission reductions for many air toxics (e.g., hazardous gases, heavy metals, and PAHs) beyond criteria pollutants by reducing open waste burning. The EFs for CO2 and EC are also useful for evaluating the climate impacts from MSW open burning.
The EFs determined for nine individual waste categories and the combined waste category offer flexibility in calculating emissions. When the weight composition is known for open-burn piles, emissions of chemical species can be calculated by summing those from individual categories; otherwise, the EFs for the combined categories can be used. EFs for PM2.5 from this study are within the ranges reported in the literature. This study fills a data gap, particularly for speciated profiles and EFs from burning many waste materials, such as paper, leather/rubber, textiles, and food discards.
Results were obtained from laboratory tests simulating real-world conditions. However, the differences in fuel mixtures, packing structure, moisture content, burn conditions, dilution, and aging between laboratory and field conditions will cause differences in chemical compositions and EFs (Hodshire et al., 2019). The EFs might need to be adjusted when real-world burning conditions differ significantly from the test conditions used in this study.
The source profile and emission factor data are available at https://doi.org/10.7910/DVN/QTV9YW (Wang, 2023). Additional data are available upon request.
The supplement related to this article is available online at: https://doi.org/10.5194/acp-23-15375-2023-supplement.
XW, JCC, and JGW designed the study; HF conducted the combustion experiments; SSHH conducted organic speciation; XW performed the data analyses and prepared the original paper draft; WC and ASMDV provided waste materials and resources; all authors reviewed and edited the paper.
The contact author has declared that none of the authors has any competing interests.
Publisher’s note: Copernicus Publications remains neutral with regard to jurisdictional claims made in the text, published maps, institutional affiliations, or any other geographical representation in this paper. While Copernicus Publications makes every effort to include appropriate place names, the final responsibility lies with the authors.
This research was partially funded by SASOL (grant no. 2000751484) and partially by Desert Research Institute internal funding.
This paper was edited by Sergey A. Nizkorodov and reviewed by two anonymous referees.
Akagi, S. K., Yokelson, R. J., Wiedinmyer, C., Alvarado, M. J., Reid, J. S., Karl, T., Crounse, J. D., and Wennberg, P. O.: Emission factors for open and domestic biomass burning for use in atmospheric models, Atmos. Chem. Phys., 11, 4039–4072, https://doi.org/10.5194/acp-11-4039-2011, 2011.
Andersson, J. T. and Achten, C.: Time to Say Goodbye to the 16 EPA PAHs? Toward an Up-to-Date Use of PACs for Environmental Purposes, Polycyclic Aromat. Comp., 35, 330–354, https://doi.org/10.1080/10406638.2014.991042, 2015.
Andreae, M. O.: Emission of trace gases and aerosols from biomass burning – an updated assessment, Atmos. Chem. Phys., 19, 8523–8546, https://doi.org/10.5194/acp-19-8523-2019, 2019.
ATSDR: Guidance for Calculating Benzo(a)pyrene Equivalents for Cancer Evaluations of Polycyclic Aromatic Hydrocarbons Agency for Toxic Substances and Disease Registry (ATSDR), U.S. Department of Health and Human Services, Public Health Service, Atlanta, GA, https://www.atsdr.cdc.gov/pha-guidance/resources/ATSDR-PAH-Guidance-508.pdf (last access: 30 May 2023), 2022.
Bond, T. C., Doherty, S. J., Fahey, D. W., Forster, P. M., Berntsen, T., DeAngelo, B. J., Flanner, M. G., Ghan, S., Kärcher, B., Koch, D., Kinne, S., Kondo, Y., Quinn, P. K., Sarofim, M. C., Schultz, M. G., Schulz, M., Venkataraman, C., Zhang, H., Zhang, S., Bellouin, N., Guttikunda, S. K., Hopke, P. K., Jacobson, M. Z., Kaiser, J. W., Klimont, Z., Lohmann, U., Schwarz, J. P., Shindell, D., Storelvmo, T., Warren, S. G., and Zender, C. S.: Bounding the role of black carbon in the climate system: A scientific assessment, J. Geophys. Res.-Atmos., 118, 5380–5552, https://doi.org/10.1002/jgrd.50171, 2013.
Bulto, T. W.: Impact of Open Burning Refuse on Air Quality: In the Case of “Hidar Sitaten” at Addis Ababa, Ethiopia, Environmental Health Insights, 14, 1–11, https://doi.org/10.1177/1178630220943204, 2020.
Caumo, S., Bruns, R. E., and Vasconcellos, P. C.: Variation of the Distribution of Atmospheric n-Alkanes Emitted by Different Fuels' Combustion, Atmosphere, 11, 643, https://doi.org/10.3390/atmos11060643, 2020.
Chen, L.-W. A., Chow, J. C., Wang, X. L., Robles, J. A., Sumlin, B. J., Lowenthal, D. H., Zimmermann, R., and Watson, J. G.: Multi-wavelength optical measurement to enhance thermal/optical analysis for carbonaceous aerosol, Atmos. Meas. Tech., 8, 451–461, https://doi.org/10.5194/amt-8-451-2015, 2015.
Cheng, K., Hao, W., Wang, Y., Yi, P., Zhang, J., and Ji, W.: Understanding the emission pattern and source contribution of hazardous air pollutants from open burning of municipal solid waste in China, Environ. Pollut., 263, 114417, https://doi.org/10.1016/j.envpol.2020.114417, 2020.
Chien, Y.-C., Ton, S., Lee, M.-H., Chia, T., Shu, H.-Y., and Wu, Y.-S.: Assessment of occupational health hazards in scrap-tire shredding facilities, Sci. Total Environ., 309, 35–46, https://doi.org/10.1016/S0048-9697(03)00009-3, 2003.
Chow, J. C. and Watson, J. G.: Chemical analyses of particle filter deposits, in: Aerosols Handbook: Measurement, Dosimetry, and Health Effects, 2 edn., edited by: Ruzer, L. and Harley, N. H., CRC Press/Taylor & Francis, New York, NY, 179–204, https://doi.org/10.1201/b12668, 2013.
Chow, J. C. and Watson, J. G.: Enhanced ion chromatographic speciation of water-soluble PM2.5 to improve aerosol source apportionment, Aerosol Sci. Eng., 1, 7–24, https://doi.org/10.1007/s41810-017-0002-4, 2017.
Chow, J. C., Watson, J. G., Chen, L.-W. A., Chang, M. C. O., Robinson, N. F., Trimble, D., and Kohl, S.: The IMPROVE_A temperature protocol for thermal/optical carbon analysis: maintaining consistency with a long-term database, J. Air Waste Manage., 57, 1014–1023, 2007.
Chow, J. C., Lowenthal, D. H., Chen, L.-W. A., Wang, X. L., and Watson, J. G.: Mass reconstruction methods for PM2.5: a review, Air Qual., Atmos. Hlth., 8, 243–263, https://doi.org/10.1007/s11869-015-0338-3, 2015a.
Chow, J. C., Wang, X. L., Sumlin, B. J., Gronstal, S. B., Chen, L.-W. A., Hurbain, M. J., Zimmermann, R., and Watson, J. G.: Optical Calibration and Equivalence of a Multiwavelength Thermal/Optical Carbon Analyzer, Aerosol Air Qual. Res., 15, 1145–1159, https://doi.org/10.4209/aaqr.2015.02.0106, 2015b.
Chow, J. C., Watson, J. G., Green, M. C., Wang, X. L., Chen, L.-W. A., Trimble, D. L., Cropper, P. M., Kohl, S. D., and Gronstal, S. B.: Separation of brown carbon from black carbon for IMPROVE and Chemical Speciation Network PM2.5 samples, J. Air Waste Manage., 68, 494–510, https://doi.org/10.1080/10962247.2018.1426653, 2018.
Chow, J. C., Chen, L.-W. A., Wang, X. L., Green, M. C., and Watson, J. G.: Improved estimation of PM2.5 brown carbon contributions to filter light attenuation, Particuology, 56, 1–9, https://doi.org/10.1016/j.partic.2021.01.001, 2021.
Christian, T. J., Yokelson, R. J., Cárdenas, B., Molina, L. T., Engling, G., and Hsu, S.-C.: Trace gas and particle emissions from domestic and industrial biofuel use and garbage burning in central Mexico, Atmos. Chem. Phys., 10, 565–584, https://doi.org/10.5194/acp-10-565-2010, 2010.
Cook, E. and Velis, C.: Global review on safer end of engineered life, Royal Academy of Engineering, London, UK, https://doi.org/10.5518/100/58, 2021.
Cronjé, N., Van Der Merwe, I., and Müller, I.-M.: Household food waste: A case study in Kimberley, South Africa, Journal of Consumer Sciences, 46, 1–9, 2018.
Das, B., Bhave, P. V., Sapkota, A., and Byanju, R. M.: Estimating emissions from open burning of municipal solid waste in municipalities of Nepal, Waste Manage., 79, 481–490, https://doi.org/10.1016/j.wasman.2018.08.013, 2018.
Eldering, A., Solomon, P. A., Salmon, L. G., Fall, T., and Cass, G. R.: Hydrochloric acid: A regional perspective on concentrations and formation in the atmosphere of Southern California, Atmos. Environ. A-Gen., 25, 2091–2102, https://doi.org/10.1016/0960-1686(91)90086-M, 1991.
Gordon, J. N. D., Bilsback, K. R., Fiddler, M. N., Pokhrel, R. P., Fischer, E. V., Pierce, J. R., and Bililign, S.: The Effects of Trash, Residential Biofuel, and Open Biomass Burning Emissions on Local and Transported PM2.5 and Its Attributed Mortality in Africa, GeoHealth, 7, e2022GH000673, https://doi.org/10.1029/2022GH000673, 2023.
Harner, T., Rauert, C., Muir, D., Schuster, J. K., Hsu, Y.-M., Zhang, L., Marson, G., Watson, J. G., Ahad, J., Cho, S., Jariyasopit, N., Kirk, J., Korosi, J., Landis, M. S., Martin, J. W., Zhang, Y., Fernie, K., Wentworth, G. R., Wnorowski, A., Dabek, E., Charland, J.-P., Pauli, B., Wania, F., Galarneau, E., Cheng, I., Makar, P., Whaley, C., Chow, J. C., and Wang, X. L.: Air synthesis review: polycyclic aromatic compounds in the oil sands region, Environ. Rev., 26, 430–468, https://doi.org/10.1139/er-2018-0039, 2018.
Ho, S. S. H. and Yu, J. Z.: In-injection port thermal desorption and subsequent gas chromatography-mass spectrometric analysis of polycyclic aromatic hydrocarbons and n-alkanes in atmospheric aerosol samples, J. Chromatogr. A, 1059, 121–129, https://doi.org/10.1016/j.chroma.2004.10.013, 2004.
Ho, S. S. H., Yu, J. Z., Chow, J. C., Zielinska, B., Watson, J. G., Sit, E. H. L., and Schauer, J. J.: Evaluation of an in-injection port thermal desorption-gas chromatography/mass spectrometry method for analysis of non-polar organic compounds in ambient aerosol samples, J. Chromatogr. A, 1200, 217–227, https://doi.org/10.1016/j.chroma.2008.05.056, 2008.
Ho, S. S. H., Chow, J. C., Watson, J. G., Ng, L. P. T., Kwok, Y., Ho, K. F., and Cao, J. J.: Precautions for in-injection port thermal desorption-gas chromatography/mass spectrometry (TD-GC/MS) as applied to aerosol filter samples, Atmos. Environ., 45, 1491–1496, 10.1016/j.atmosenv.2010.12.038, 2011.
Hodshire, A. L., Akherati, A., Alvarado, M. J., Brown-Steiner, B., Jathar, S. H., Jimenez, J. L., Kreidenweis, S. M., Lonsdale, C. R., Onasch, T. B., Ortega, A. M., and Pierce, J. R.: Aging Effects on Biomass Burning Aerosol Mass and Composition: A Critical Review of Field and Laboratory Studies, Environ. Sci. Technol., 53, 10007–10022, https://doi.org/10.1021/acs.est.9b02588, 2019.
Hoffer, A., Jancsek-Turóczi, B., Tóth, Á., Kiss, G., Naghiu, A., Levei, E. A., Marmureanu, L., Machon, A., and Gelencsér, A.: Emission factors for PM10 and polycyclic aromatic hydrocarbons (PAHs) from illegal burning of different types of municipal waste in households, Atmos. Chem. Phys., 20, 16135–16144, https://doi.org/10.5194/acp-20-16135-2020, 2020.
IPCC: IPCC guidelines for national greenhouse gas inventories, National Greenhouse Gas Inventories Programme Japan, Intergovernmental Panel on Climate Change (IPCC), Geneva, Switzerland, https://www.ipcc-nggip.iges.or.jp/public/2006gl/index.html (last access: 30 May 2023), 2006.
IPCC: Climate change 2013: The physical science basis. Working Group I Contribution to the Fifth Assessment Report of the Intergovernmental Panel on Climate Change, Cambridge University Press Cambridge, UK, and New York, ISBN 978-1-107-66182-0, 2013.
James, B. D., Reddy, C. M., Hahn, M. E., Nelson, R. K., de Vos, A., Aluwihare, L. I., Wade, T. L., Knap, A. H., and Bera, G.: Fire and Oil Led to Complex Mixtures of PAHs on Burnt and Unburnt Plastic during the M/V X-Press Pearl Disaster, ACS Environmental Au, https://doi.org/10.1021/acsenvironau.3c00011, 2023.
Jayarathne, T., Stockwell, C. E., Yokelson, R. J., Nakao, S., and Stone, E. A.: Emissions of Fine Particle Fluoride from Biomass Burning, Environ. Sci. Technol., 48, 12636–12644, https://doi.org/10.1021/es502933j, 2014.
Jayarathne, T., Stockwell, C. E., Bhave, P. V., Praveen, P. S., Rathnayake, C. M., Islam, Md. R., Panday, A. K., Adhikari, S., Maharjan, R., Goetz, J. D., DeCarlo, P. F., Saikawa, E., Yokelson, R. J., and Stone, E. A.: Nepal Ambient Monitoring and Source Testing Experiment (NAMaSTE): emissions of particulate matter from wood- and dung-fueled cooking fires, garbage and crop residue burning, brick kilns, and other sources, Atmos. Chem. Phys., 18, 2259–2286, https://doi.org/10.5194/acp-18-2259-2018, 2018.
Kelly, F. J. and Fussell, J. C.: Size, source and chemical composition as determinants of toxicity attributable to ambient particulate matter, Atmos. Environ., 60, 504–526, https://doi.org/10.1016/j.atmosenv.2012.06.039, 2012.
Kodros, J. K., Wiedinmyer, C., Ford, B., Cucinotta, R., Gan, R., Magzamen, S., and Pierce, J. R.: Global burden of mortalities due to chronic exposure to ambient PM2.5 from open combustion of domestic waste, Environ. Res. Lett., 11, 124022, https://doi.org/10.1088/1748-9326/11/12/124022, 2016.
Krecl, P., de Lima, C. H., Dal Bosco, T. C., Targino, A. C., Hashimoto, E. M., and Oukawa, G. Y.: Open waste burning causes fast and sharp changes in particulate concentrations in peripheral neighborhoods, Sci. Total Environ., 765, 142736, https://doi.org/10.1016/j.scitotenv.2020.142736, 2021.
Kwatala, N., Naidoo, M., Naidoo, S., and Garland, R. M.: Estimated emissions of domestic waste burning in South Africa, 2019 Conference of the National Association for Clean Air, Western Cape, 3–4 October, https://www.naca.org.za/uploads/2019_NACA_Conference_Proceedings.pdf (last access: 10 September 2023), 2019,
Lal, R. M., Nagpure, A. S., Luo, L., Tripathi, S. N., Ramaswami, A., Bergin, M. H., and Russell, A. G.: Municipal solid waste and dung cake burning: discoloring the Taj Mahal and human health impacts in Agra, Environ. Res. Lett., 11, 104009, https://doi.org/10.1088/1748-9326/11/10/104009, 2016.
Lemieux, P. M.: Evaluation of emissions from the open burning of household waste in barrels – Volume 1. Technical Report, National Risk Management Research Laboratory, US Environmental Protection Agency, Cincinnati, OHEPA-600/R-97-134a, https://cfpub.epa.gov/si/si_public_record_Report.cfm?Lab=NRMRL&dirEntryId=115129 (last access: 30 January 2020), 1997.
Lemieux, P. M.: Evaluation of emissions from the open burning of household waste in barrels – Project Summary, National Risk Management Research Laboratory, US Environmental Protection Agency, Cincinnati, OH EPA/600/SR-97/134, https://nepis.epa.gov/Exe/ZyPURL.cgi?Dockey=P1003CKZ.TXT (last access: 30 January 2020), 1998.
Lemieux, P. M., Lutes, C. C., and Santoianni, D. A.: Emissions of organic air toxics from open burning: a comprehensive review, Prog. Energ. Combust., 30, 1–32, https://doi.org/10.1016/j.pecs.2003.08.001, 2004.
Lighty, J. S., Veranth, J. M., and Sarofim, A. F.: Combustion Aerosols: Factors Governing Their Size and Composition and Implications to Human Health, J. Air Waste Manage., 50, 1565–1618, https://doi.org/10.1080/10473289.2000.10464197, 2000.
Martuzzi, M., Mitis, F., and Forastiere, F.: Inequalities, inequities, environmental justice in waste management and health, Eur. J. Public Health, 20, 21–26, https://doi.org/10.1093/eurpub/ckp216, 2010.
Miao, Y., Wang, R., Lu, C., Zhao, J., and Deng, Q.: Lifetime cancer risk assessment for inhalation exposure to di(2-ethylhexyl) phthalate (DEHP), Environ. Sci. Pollut. R., 24, 312–320, https://doi.org/10.1007/s11356-016-7797-4, 2017.
Moradi, M., Hung, H., Li, J., Park, R., Shin, C., Alexandrou, N., Iqbal, M. A., Takhar, M., Chan, A., and Brook, J. R.: Assessment of Alkylated and Unsubstituted Polycyclic Aromatic Hydrocarbons in Air in Urban and Semi-Urban Areas in Toronto, Canada, Environ. Sci. Technol., 56, 2959–2967, https://doi.org/10.1021/acs.est.1c04299, 2022.
Murray, C. J., Aravkin, A. Y., Zheng, P., Abbafati, C., Abbas, K. M., Abbasi-Kangevari, M., Abd-Allah, F., Abdelalim, A., Abdollahi, M., and Abdollahpour, I.: Global burden of 87 risk factors in 204 countries and territories, 1990–2019: a systematic analysis for the Global Burden of Disease Study 2019, The Lancet, 396, 1223–1249, https://doi.org/10.1016/S0140-6736(20)30752-2, 2020.
Nagpure, A. S., Ramaswami, A., and Russell, A.: Characterizing the Spatial and Temporal Patterns of Open Burning of Municipal Solid Waste (MSW) in Indian Cities, Environ. Sci. Technol., 49, 12904–12912, https://doi.org/10.1021/acs.est.5b03243, 2015.
Noblet, C., Besombes, J.-L., Lemire, M., Pin, M., Jaffrezo, J.-L., Favez, O., Aujay-Plouzeau, R., Dermigny, A., Karoski, N., Van Elsuve, D., Dubois, P., Collet, S., Lestremau, F., and Albinet, A.: Emission factors and chemical characterization of particulate emissions from garden green waste burning, Sci. Total Environ., 798, 149367, https://doi.org/10.1016/j.scitotenv.2021.149367, 2021.
Okedere, O. B., Olalekan, A. P., Fakinle, B. S., Elehinafe, F. B., Odunlami, O. A., and Sonibare, J. A.: Urban air pollution from the open burning of municipal solid waste, Environ. Qual. Manage., 28, 67–74, https://doi.org/10.1002/tqem.21633, 2019.
Oleniacz, R., Drzewiecki, W., Gorzelnik, T., Grzesik, K., Kozakiewicz, R., Kowalewski, Z., and Kossakowska, K.: Assessment of the impact of waste fires on air quality and atmospheric aerosol optical depth: A case study in Poland, Energy Reports, 9, 16–38, https://doi.org/10.1016/j.egyr.2023.03.087, 2023.
Park, Y. K., Kim, W., and Jo, Y. M.: Release of Harmful Air Pollutants from Open Burning of Domestic Municipal Solid Wastes in a Metropolitan Area of Korea, Aerosol Air Qual. Res., 13, 1365–1372, https://doi.org/10.4209/aaqr.2012.10.0272, 2013.
Pokhrel, R. P., Gordon, J., Fiddler, M. N., and Bililign, S.: Determination of Emission Factors of Pollutants From Biomass Burning of African Fuels in Laboratory Measurements, J. Geophys. Res.-Atmos., 126, e2021JD034731, https://doi.org/10.1029/2021JD034731, 2021.
Pöschl, U.: Aerosol particle analysis: challenges and progress, Anal. Bioanal. Chem., 375, 30–32, https://doi.org/10.1007/s00216-002-1611-5, 2003.
Rabaji, O. P.: Waste dumping in Sharpeville (Emfuleni Municipality): an investigation of the characteristics and the potential impacts on air quality, M.S., Environmental Management, North-West University, Potchefstroom, South Africa, https://repository.nwu.ac.za/bitstream/handle/10394/33895/Rabaji%20OP%2023891610.pdf?sequence=1 (last access: 10 September 2023), 2019.
Ramadan, B. S., Rachman, I., Ikhlas, N., Kurniawan, S. B., Miftahadi, M. F., and Matsumoto, T.: A comprehensive review of domestic-open waste burning: recent trends, methodology comparison, and factors assessment, J. Mater. Cycles Waste, 24, 1633–1647, https://doi.org/10.1007/s10163-022-01430-9, 2022.
Ravindra, K., Sokhi, R., and Van Grieken, R.: Atmospheric polycyclic aromatic hydrocarbons: Source attribution, emission factors and regulation, Atmos. Environ., 42, 2895–2921, https://doi.org/10.1016/j.atmosenv.2007.12.010, 2008.
Reff, A., Bhave, P. V., Simon, H., Pace, T. G., Pouliot, G. A., Mobley, J. D., and Houyoux, M.: Emissions Inventory of PM2.5 Trace Elements across the United States, Environ. Sci. Technol., 43, 5790–5796, https://doi.org/10.1021/es802930x, 2009.
Reid, J. S., Koppmann, R., Eck, T. F., and Eleuterio, D. P.: A review of biomass burning emissions part II: intensive physical properties of biomass burning particles, Atmos. Chem. Phys., 5, 799–825, https://doi.org/10.5194/acp-5-799-2005, 2005.
Reyna-Bensusan, N., Wilson, D. C., and Smith, S. R.: Uncontrolled burning of solid waste by households in Mexico is a significant contributor to climate change in the country, Environ. Res., 163, 280–288, https://doi.org/10.1016/j.envres.2018.01.042, 2018.
Rogge, W. F., Hildemann, L. M., Mazurek, M. A., Cass, G. R., and Simoneit, B. R. T.: Sources of fine organic aerosol. 2. Noncatalyst and catalyst-equipped automobiles and heavy-duty diesel trucks, Environ. Sci. Technol., 27, 636–651, 1993.
Samburova, V., Zielinska, B., and Khlystov, A.: Do 16 Polycyclic Aromatic Hydrocarbons Represent PAH Air Toxicity?, Toxics, 5, 1–16, https://doi.org/10.3390/toxics5030017, 2017.
Sharma, G., Annadate, S., and Sinha, B.: Will open waste burning become India's largest air pollution source?, Environ. Pollut., 292, 118310, https://doi.org/10.1016/j.envpol.2021.118310, 2022.
Simon, H., Beck, L., Bhave, P. V., Divita, F., Hsu, Y., Luecken, D., Mobley, J. D., Pouliot, G. A., Reff, A., Sarwar, G., and Strum, M.: The development and uses of EPA's SPECIATE database, Atmos. Pollut. Res., 1, 196–206, https://doi.org/10.5094/APR.2010.026, 2010.
Simoneit, B. R. T., Medeiros, P. M., and Didyk, B. M.: Combustion Products of Plastics as Indicators for Refuse Burning in the Atmosphere, Environ. Sci. Technol., 39, 6961–6970, https://doi.org/10.1021/es050767x, 2005.
Stockwell, C. E.: Advanced measurements of undersampled globally significant biomass burning sources, Chemistry, The University of Montana, Missoula, MT, https://scholarworks.umt.edu/etd/10905/ (last access: 1 November 2022), 2016.
Stockwell, C. E., Christian, T. J., Goetz, J. D., Jayarathne, T., Bhave, P. V., Praveen, P. S., Adhikari, S., Maharjan, R., DeCarlo, P. F., Stone, E. A., Saikawa, E., Blake, D. R., Simpson, I. J., Yokelson, R. J., and Panday, A. K.: Nepal Ambient Monitoring and Source Testing Experiment (NAMaSTE): emissions of trace gases and light-absorbing carbon from wood and dung cooking fires, garbage and crop residue burning, brick kilns, and other sources, Atmos. Chem. Phys., 16, 11043–11081, https://doi.org/10.5194/acp-16-11043-2016, 2016.
Sturges, W. T. and Harrison, R. M.: The use of nylon filters to collect HCl: efficiencies, interferences and ambient concentrations, Atmos. Environ., 23, 1987–1996, https://doi.org/10.1016/0004-6981(89)90525-8, 1989.
U.S. EPA: Compilation of Air Pollutant Emissions Factors AP-42, Fifth Edition Section 2.5 Open Burning, U.S. Environmental Protection Agency, Research Triangle Park, NCEPA AP-42, https://www.epa.gov/sites/default/files/2020-10/documents/c02s05.pdf (last access: 17 April 2023), 1992.
U.S. EPA: Initial List of Hazardous Air Pollutants with Modifications, Air Toxics Assessment Group, U.S. Environmental Protection Agency Research Triangle Park, NC, https://www.epa.gov/haps/initial-list-hazardous-air-pollutants-modifications (last access: 20 March 2019), 2020.
U.S. EPA: 2020 National Emissions Inventory Technical Support Document: Waste Disposal – Open Burning – Residential Household Waste, Air Quality Assessment Division, Office of Air Quality Planning and Standards, U.S. Environmental Protection Agency (U.S. EPA) Research Triangle Park, NC, https://www.epa.gov/system/files/documents/2023-03/NEI2020_TSD_Section35_WD_OpenBurning_RHHW.pdf (last access: 23 May 2023), 2023.
Valavanidis, A., Iliopoulos, N., Gotsis, G., and Fiotakis, K.: Persistent free radicals, heavy metals and PAHs generated in particulate soot emissions and residue ash from controlled combustion of common types of plastic, J. Hazard. Mater., 156, 277–284, https://doi.org/10.1016/j.jhazmat.2007.12.019, 2008.
Velis, C. A. and Cook, E.: Mismanagement of Plastic Waste through Open Burning with Emphasis on the Global South: A Systematic Review of Risks to Occupational and Public Health, Environ. Sci. Technol., 55, 7186–7207, https://doi.org/10.1021/acs.est.0c08536, 2021.
Wang, X.: Data for: Air Pollutant Emissions from Open Burning of Household Solid Waste from South Africa, Harvard Dataverse [data set], https://doi.org/10.7910/DVN/QTV9YW, 2023.
Wang, X., Firouzkouhi, H., Chow, J. C., Watson, J. G., Carter, W., and De Vos, A. S. M.: Characterization of gas and particle emissions from open burning of household solid waste from South Africa, Atmos. Chem. Phys., 23, 8921–8937, https://doi.org/10.5194/acp-23-8921-2023, 2023.
Wang, Y. and Qian, H.: Phthalates and Their Impacts on Human Health, Healthcare, 9, 603, https://doi.org/10.3390/healthcare9050603, 2021.
Wasson, S. J., Linak, W. P., Gullett, B. K., King, C. J., Touati, A., Huggins, F. E., Chen, Y., Shah, N., and Huffman, G. P.: Emissions of Chromium, Copper, Arsenic, and PCDDs/Fs from Open Burning of CCA-Treated Wood, Environ. Sci. Technol., 39, 8865–8876, https://doi.org/10.1021/es050891g, 2005.
Watson, J. G.: Visibility: Science and regulation, J. Air Waste Manage., 52, 628–713, 2002.
Watson, J. G., Chow, J. C., and Frazier, C. A.: X-ray fluorescence analysis of ambient air samples, in: Elemental Analysis of Airborne Particles, Vol. 1, edited by: Landsberger, S. and Creatchman, M., Advances in Environmental, Industrial and Process Control Technologies, Gordon and Breach Science, Amsterdam, the Netherlands, 67–96, ISBN 978-9056996277, 1999.
Watson, J. G., Chow, J. C., Engling, G., Chen, L.-W. A., and Wang, X. L.: Source apportionment: Principles and methods, in: Airborne Particulate Matter: Sources, Atmospheric Processes and Health, edited by: Harrison, R. M., Royal Society of Chemistry, London, UK, 72–125, ISBN 978-1782624912, 2016.
Watson, J. G., Tropp, R. J., Kohl, S. D., Wang, X. L., and Chow, J. C.: Filter processing and gravimetric analysis for suspended particulate matter samples, Aerosol Sci. Eng., 1, 193–205, 2017.
Wiedinmyer, C., Yokelson, R. J., and Gullett, B. K.: Global Emissions of Trace Gases, Particulate Matter, and Hazardous Air Pollutants from Open Burning of Domestic Waste, Environ. Sci. Technol., 48, 9523–9530, https://doi.org/10.1021/es502250z, 2014.
Williams, M., Gower, R., Green, J., Whitebread, E., Lenkiewicz, Z., and Schröder, P.: No time to waste: Tackling the plastic pollution crisis before it's too late, Tearfund, London, UK, https://opendocs.ids.ac.uk/opendocs/handle/20.500.12413/14490 (last access: 10 April 2023), 2019.
Wu, D., Li, Q., Shang, X., Liang, Y., Ding, X., Sun, H., Li, S., Wang, S., Chen, Y., and Chen, J.: Commodity plastic burning as a source of inhaled toxic aerosols, J. Hazard. Mater., 416, 125820, https://doi.org/10.1016/j.jhazmat.2021.125820, 2021.
Zięba-Palus, J. and Trzcińska, B. M.: Establishing of Chemical Composition of Printing Ink, J. Forensic Sci., 56, 819–821, https://doi.org/10.1111/j.1556-4029.2011.01734.x, 2011.