the Creative Commons Attribution 4.0 License.
the Creative Commons Attribution 4.0 License.
 | 07 Dec 2023
Strong aerosol cooling alone does not explain cold-biased mid-century temperatures in CMIP6 models
Clare Marie Flynn
Linnea Huusko
Angshuman Modak
Thorsten Mauritsen
The current generation of global climate models from the Coupled Model Intercomparison Project Phase 6 (CMIP6) exhibits a surprisingly cold-biased ensemble-mean mid-20th century global-mean surface temperature anomaly, compared to the previous generation Phase 5 (CMIP5) and to the observed mid-century (1940–1970) temperature anomaly. Most CMIP6 models, 31 of 36 models in contrast to 17 of 27 CMIP5 models, are colder than the uncertainty range of the observed anomaly, indicating that the CMIP6 suppressed warming is not caused by a few cold models. However, no clear cause that sufficiently explains the tendency towards suppressed mid-20th century warming emerges. Whereas models that best match observations exclusively exhibit weaker aerosol forcing than that exhibited by colder models, there is not a clear relationship between mid-century temperatures and aerosol forcing. Likewise, no systematic differences emerge among other model aerosol representations, such as inclusion of aerosol–cloud interactions for ice clouds in the model or the type of aerosol model input data set used, nor variations in greenhouse gas forcing or climate sensitivity, that could explain the suppressed warming. This indicates the presence of another cause, or more likely a set of causes, of the suppressed warming in many CMIP6 models. Thus, the prospect of a strong constraint on present-day aerosol forcing based on the mid-century warming is weakened, even if it is encouraging that those models that do match the observed warming best all have relatively weak aerosol forcing.
- Article
(1655 KB) - Full-text XML
- BibTeX
- EndNote


It may be argued that it is a necessary, though insufficient, criterion that climate models accurately reproduce the observed historical evolution of the global-mean surface temperature anomaly to lend credibility to model-based projections of future warming. Therefore, it was surprising that the latest generation of global climate models from the Coupled Model Intercomparison Project Phase 6 (CMIP6) exhibits a suppressed warming in the mid-20th century relative to the previous generation Phase 5 models (CMIP5) and to the observed historical temperature evolution (Fig. 1). The CMIP5 ensemble-mean historical warming evolution is in much better agreement with the observations than the CMIP6 ensemble-mean for much of the 20th century, and particularly during the mid-century period after a warming signal has already emerged.
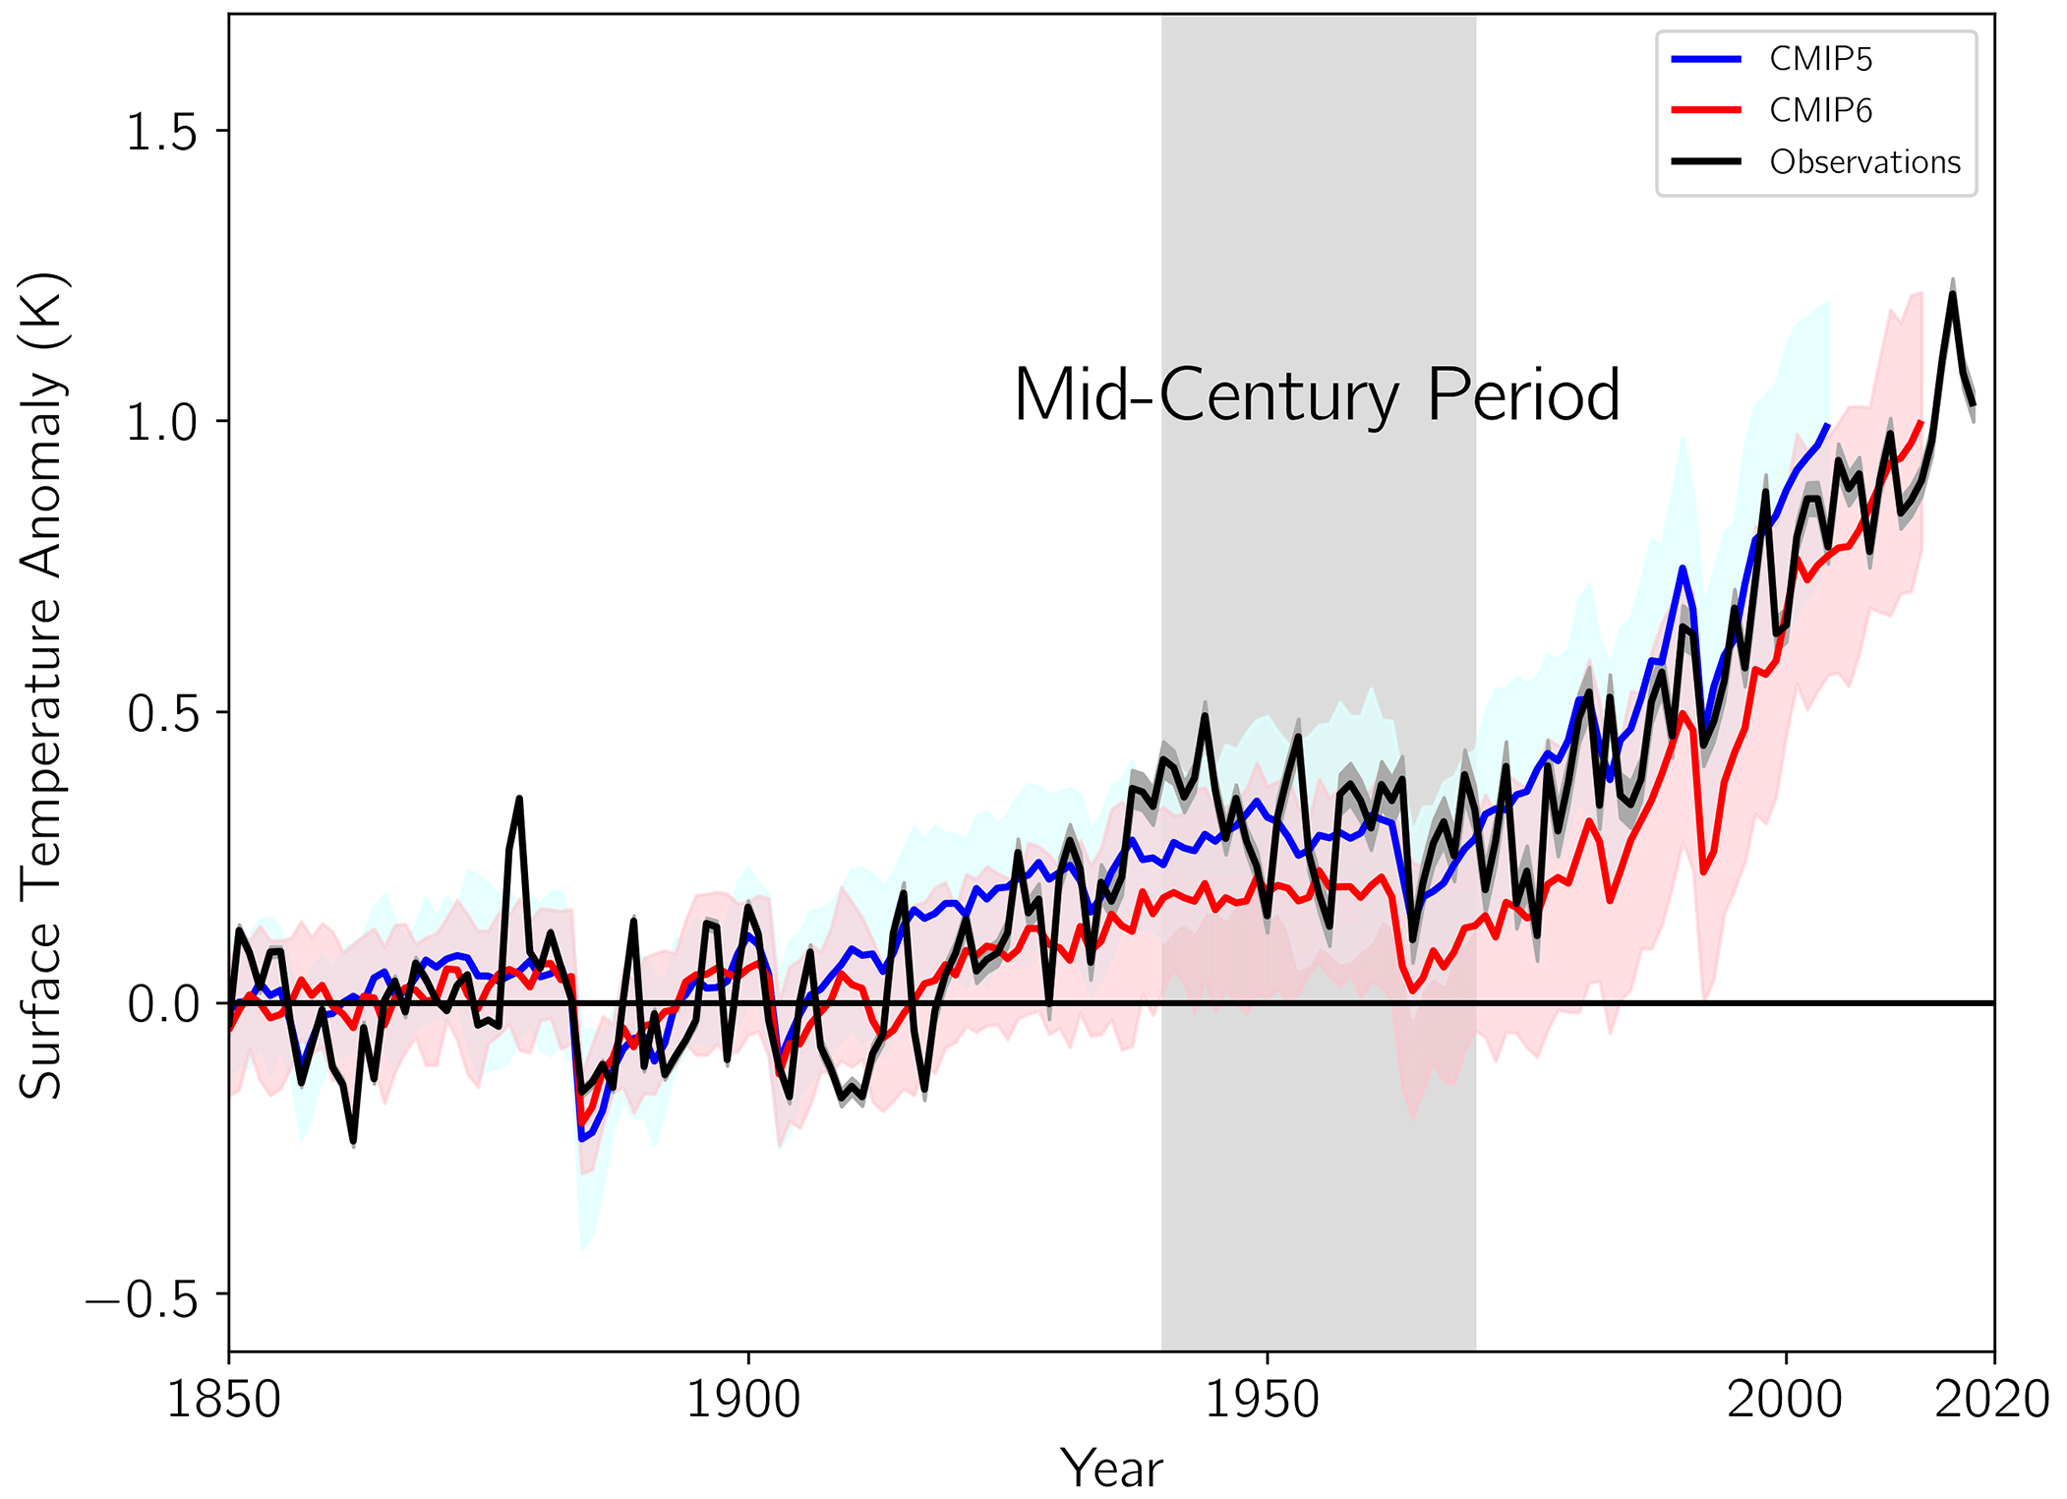
Figure 1Ensemble-mean historical global-mean surface warming evolution in CMIP5 (blue) and CMIP6 (red) compared with the observations (black). Ensemble standard deviation or observational uncertainty as shading for each curve. Baseline is 1850–1900. Vertical light gray shading highlights the mid-20th century period analyzed (1940–1970). Figure based on Flynn and Mauritsen (2020).
We suspected that stronger forcing from anthropogenic aerosols in CMIP6 relative to CMIP5 is primarily responsible for the suppressed mid-century warming (Flynn and Mauritsen, 2020). Other studies have also suggested stronger aerosol forcing as a partial or primary cause of the suppressed warming in individual models or types of models that participated in CMIP6 (Zhang et al., 2021; Smith and Forster, 2021; Dittus et al., 2020; Andrews et al., 2020; Gillett et al., 2021). Anthropogenic aerosols produce a net negative forcing and thus induce a cooling response, such that a too-strong aerosol forcing in CMIP6 appeared as a likely cause of the suppressed warming. The larger atmospheric anthropogenic aerosol burden during the pre-1970s period strongly influenced the response of the global-mean surface temperature, after which stricter air quality regulations began to reduce the aerosol burden (Stevens, 2015). However, the strength of the aerosol forcing remains highly uncertain, with recent assessments estimating that the net present-day aerosol forcing falls within a likely range of −1.6 to −0.6 W m−2 (Bellouin et al., 2020) or −2.0 to −0.6 W m−2 (Forster et al., 2021), based on multiple lines of evidence. This range is in line with previous estimates of the net aerosol forcing based on the previous CMIP generations of models and from the IPCC Fourth Assessment Report, which displayed similarly large ranges for the aerosol forcing (Kiehl, 2007; Forster and Taylor, 2006; Forster et al., 2013), indicating that the uncertainty has not decreased substantially over time. The range of net aerosol forcing estimated for CMIP6 models in this study (Fig. 4; Table 1) and in Smith et al. (2020) does not diverge from previous assessments. To address this uncertainty, Stevens (2015) developed a simple model for the aerosol forcing and argued that a net forcing stronger than −1.0 W m−2 is incompatible with the warming signal observed between 1850 and 1950 and that the net forcing likely lies in the range −1.0 to −0.3 W m−2. This estimate was disputed by Kretzschmar et al. (2017) and Booth et al. (2018), arguing that the comparison of the simple model to global climate models is flawed and that aerosol forcing stronger than −1.0 W m−2 remains plausible. Smith et al. (2021) updated the model developed by Stevens (2015), including modifications based on Kretzschmar et al. (2017) and Booth et al. (2018), and indeed found that aerosol forcing stronger than −1.0 W m−2 was consistent with the historical warming.
Table 1List of CMIP6 models with their mid-century warming, aerosol, and ERF parameters. “Aerosol input type” refers to use of the CMIP6-standard aerosol emissions (E) or aerosol prescribed concentrations (PC) model input data sets. “Ice cloud ACI” includes both cloud albedo and lifetime effects for ice clouds.
Legend for source of present-day aerosol and greenhouse gas ERF estimates: a RFMIP, b Smith et al. (2020), c author contribution, d Mauritsen et al. (2019), e Oshima et al. (2020), f Michou et al. (2020), g Golaz et al. (2019), h van Noije et al. (2021), i Horowitz et al. (2020), j Seland et al. (2020), k O'Connor et al. (2021).
Aerosols may affect the radiation balance through aerosol–radiation interactions (ARIs), or the scattering and absorption of radiation directly by aerosols, and through the indirect aerosol–cloud interactions (ACIs). The ACIs include the aerosol–cloud albedo effect, also known as the first indirect or Twomey effect (Twomey, 1977), and the aerosol–cloud lifetime effect, or the second indirect effect (Albrecht, 1989); these interactions exist for all cloud phases. In the course of model development between CMIP5 and CMIP6, many modeling groups included ACIs in the newer versions of their models for the first time or modified their model's ACIs (Fyfe et al., 2021; Zelinka et al., 2020; Andrews et al., 2019; CNRM-CM6-1, Voldoire et al., 2019; E3SMv1, Golaz et al., 2019; CESM2, Gettelman et al., 2019; HadGEM3-GC3.1, Bodas-Salcedo et al., 2019; MPI-ESM1.2, Mauritsen et al., 2019). Additionally, more CMIP6 models included ACIs for liquid clouds than for ice clouds (Table 1). Recent evidence has indicated that the response to anthropogenic aerosols, in particular ACIs, may account for the suppressed warming in some CMIP6 models, rather than a stronger aerosol forcing alone. Fyfe et al. (2021) obtained a colder 20th century temperature evolution in CanESM5 using the CMIP5 rather than the CMIP6 aerosol input data set, indicating the influence of the response to anthropogenic aerosol on the suppressed warming in this model, while Zhang et al. (2021) identified ACIs as an important driver of the suppressed warming within Earth system models that participated in CMIP6. However, the net effects of ARIs and ACIs on the forcing remain highly uncertain, and indeed the spread in ACIs was found to be one of the main contributors to the spread in the net forcing itself among the CMIP6 models, with ACIs for ice clouds specifically playing a potentially important role (Smith et al., 2020). Smith and Forster (2021) also argued that aerosol forcing alone is not the cause of the suppressed warming, though; in contrast, they identified a combination of stronger aerosol forcing and weaker greenhouse gas forcing, amplified by increased climate sensitivity, in the CMIP6 ensemble-mean relative to the CMIP5 ensemble mean as the cause. The cold bias during the mid-century period previously exhibited by the UKESM1 model was much improved after updates were made to its configuration, despite an absence of substantial weakening of its present-day aerosol forcing, further indicating a cause(s) of the suppressed warming beyond only the aerosol forcing strength, at least for Earth system models (Mulcahy et al., 2023).
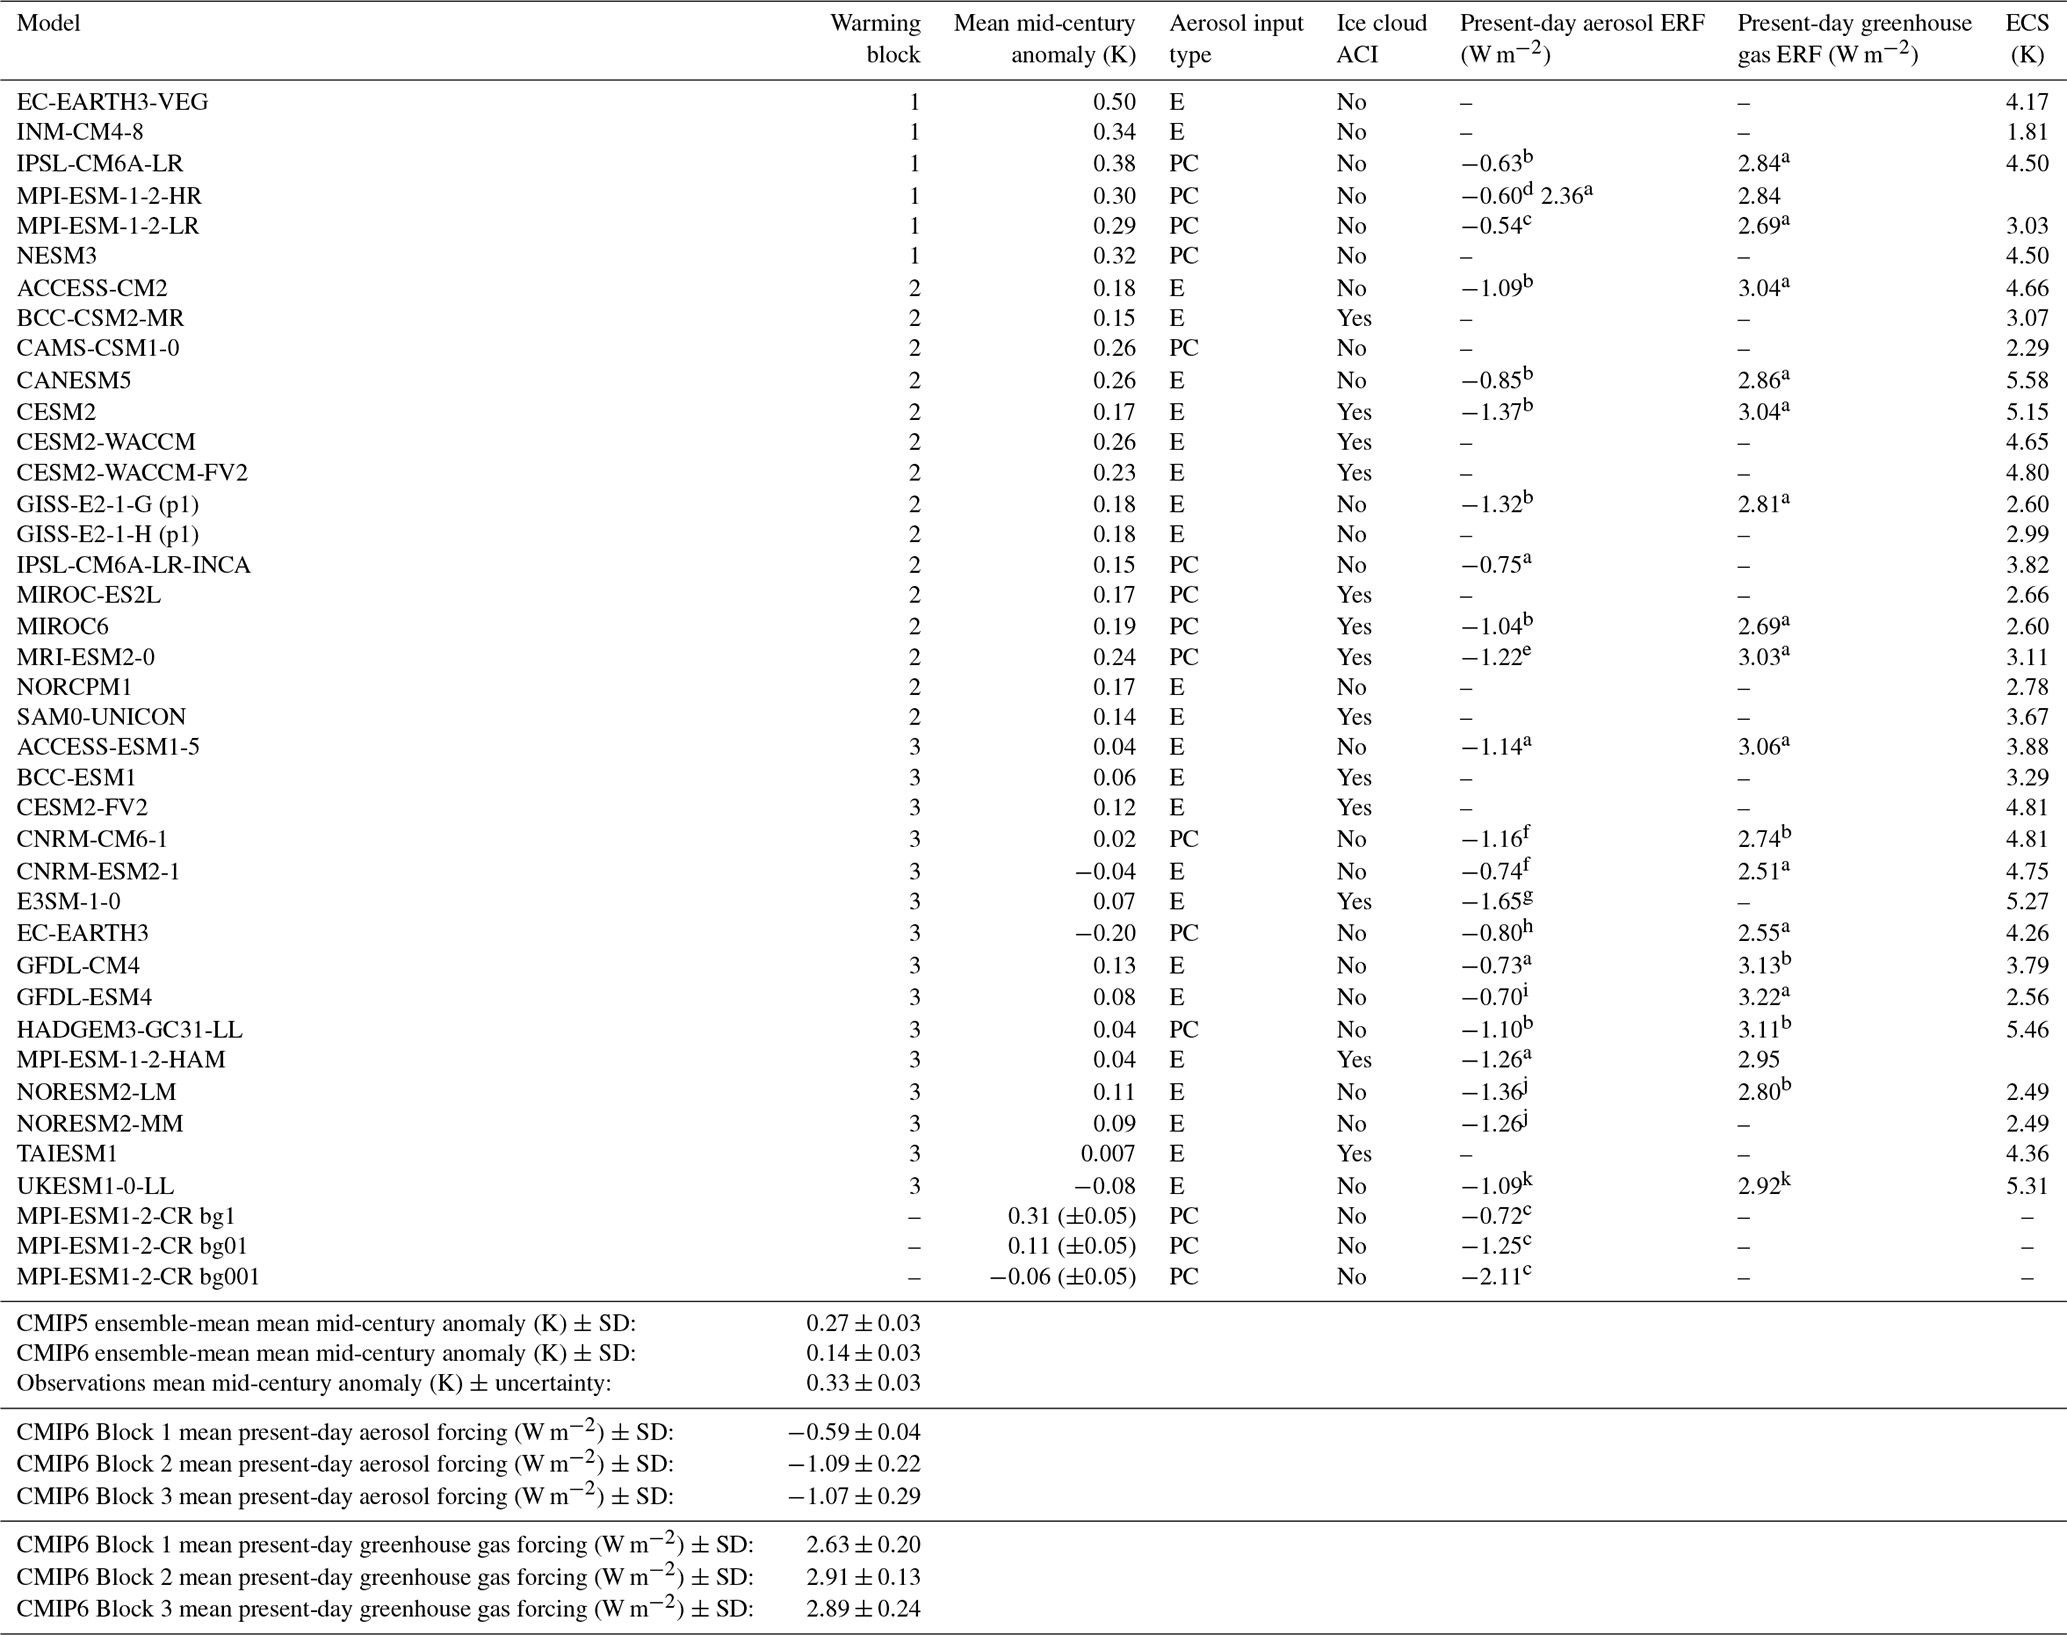
In this study, we investigate whether systematic differences exist within the CMIP6 ensemble that could explain the suppressed warming seen in the CMIP6 ensemble mean and for individual models. CMIP6 contained a range of relatively warm to relatively cold models for the mid-century period (Fig. 2), allowing these models to be differentiated based on the comparison of a model's mean mid-20th century temperature anomaly to the CMIP5 and CMIP6 ensemble-mean mid-20th century anomalies, and thereby to identify potential systematic differences in aerosol forcing, ACIs, or other parameters within CMIP6 that could cause models to exhibit suppressed warming. It should be noted that a cause for the suppressed warming related to a systematic difference between the CMIP5 and CMIP6 ensembles cannot be definitively proven here. Ground work enabling the disentanglement of the various forcing agents was done in the Radiative Forcing Model Intercomparison Project (RFMIP; Pincus et al., 2016), whose experiments are available for CMIP6 models but which were not performed for CMIP5 models. Model aerosol forcing therefore cannot be directly compared between the two eras, as forcings cannot be estimated in a consistent manner.
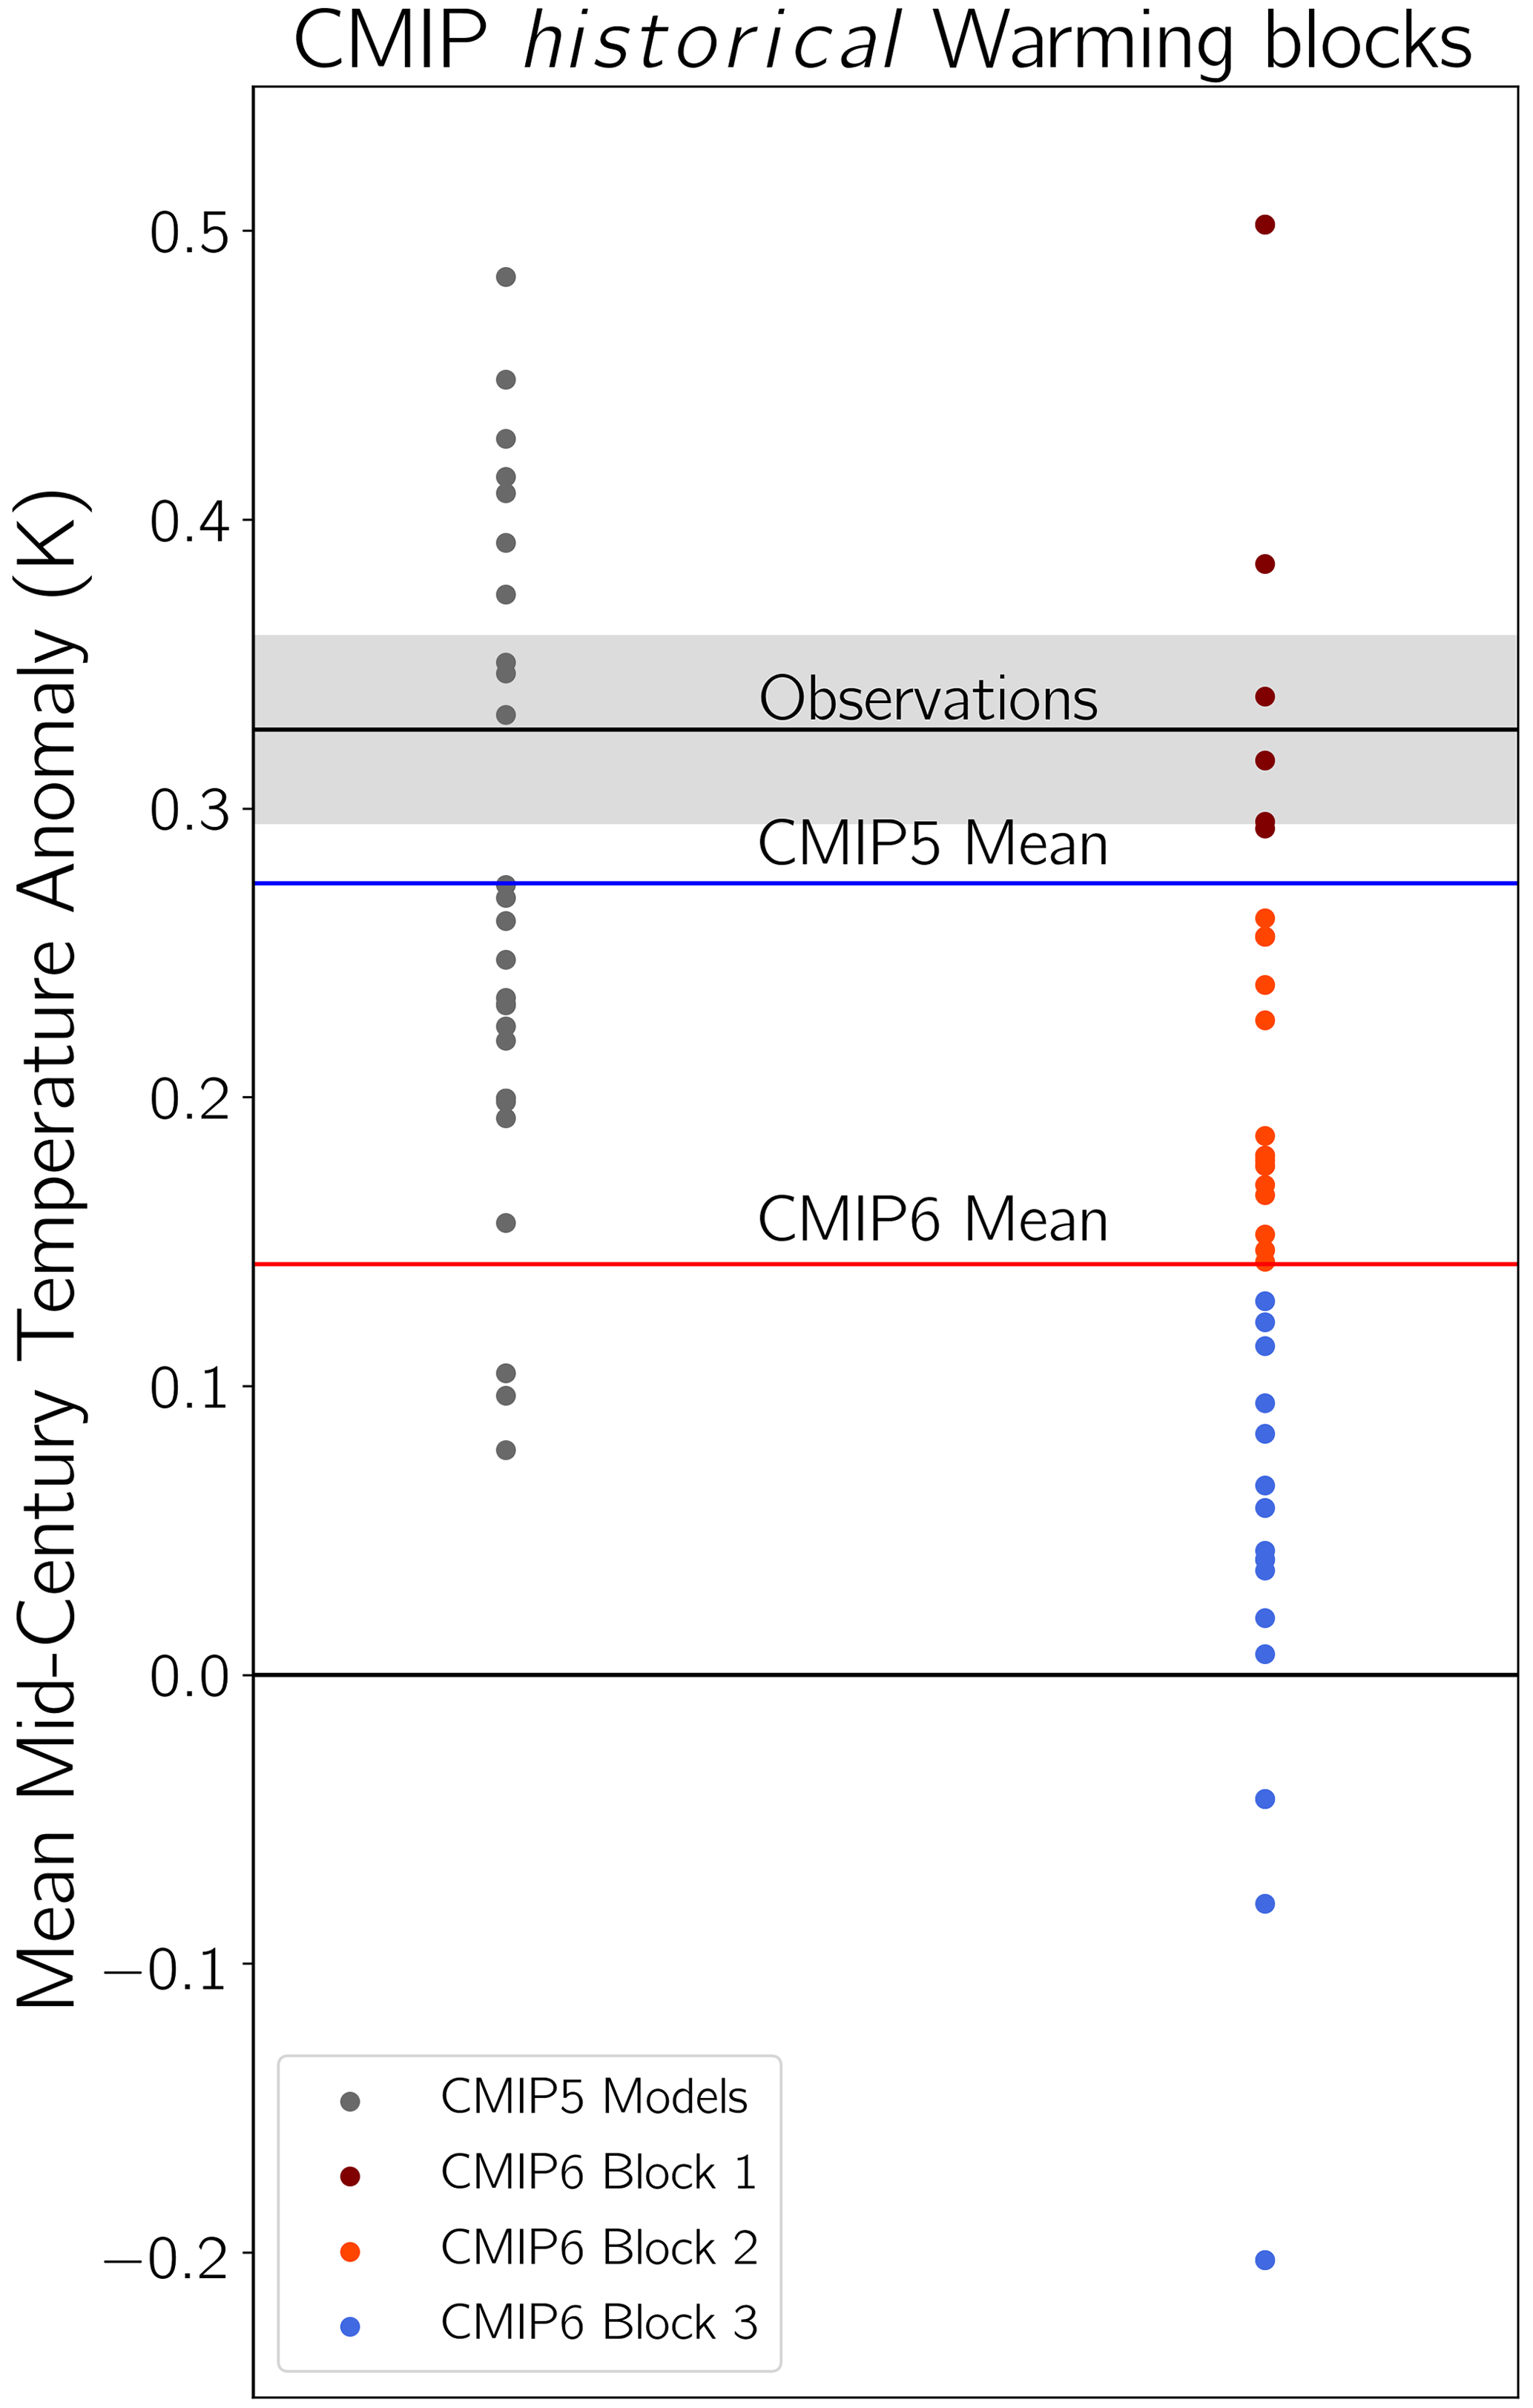
Figure 2Distribution of mean mid-20th century global-mean surface temperature anomalies (K) on the y axis for individual CMIP5 models (dark gray) and individual CMIP6 models from their historical simulations. Mean mid-century temperature anomaly from the observations as a black horizontal line with uncertainty displayed as light gray shading, the CMIP5 ensemble-mean mid-century anomaly as a blue horizontal line, and the CMIP6 ensemble-mean mid-century anomaly as a red horizontal line. Colors for individual CMIP6 models indicate the warming block to which the model belongs: dark red for Block 1, orange for Block 2, and blue for Block 3. x axis has no meaning.
The CMIP6 ensemble analyzed here includes 36 models, as listed in Table 1 along with their mean mid-20th century surface temperature anomalies and various other information. Most model output was downloaded from the Earth System Federation Grid nodes; all MPI-ESM1.2-CR simulations and the fixed-SST MPI-ESM1.2-LR simulations were conducted as part of the study. The information about aerosol input type and ice cloud ACI in Table 1 was found in the online CMIP documentation for individual models (https://search.es-doc.org, last access: 10 October 2022) or by contacting the relevant modeling group. The equilibrium climate sensitivity (ECS) values in Table 1 were taken from Flynn and Mauritsen (2020), Zelinka et al. (2020), and Zelinka (2022), and the method used to compute the ECS is described in those sources.
2.1 Estimation of model and observational historical warming
The historical warming evolution for each model was computed from its historical simulation and the surface temperature variable ts, using the first realization available (typically r1i1p1f1). Global-mean, annual-mean surface temperature anomalies were computed relative to a baseline of 1850–1900 for all models and the observations. The mean mid-20th century surface temperature anomaly, or warming, is computed as the global-mean, annual-mean anomaly averaged over the period 1940–1970, as highlighted in Fig. 1. The observationally based historical warming evolution and anomalies are computed from the Cowtan and Way (2014) version 2.0 surface temperature reconstruction. Land surface temperatures and sea surface temperatures are based on the Hadley Centre/Climatic Research Unit Temperature (HadCRUT) version 4.2.0 and University of Alabama in Huntsville (UAH) version 5.6 global surface temperature datasets, with missing data infilled by kriging. Data coverage uncertainty and reconstruction parameter uncertainty are included in the Cowtan and Way data set, while uncertainty from natural variability is computed based on the 100-member Max Planck Institute for Meteorology MPI-ESM1.1 model Grand Ensemble of historical climate change simulations (Maher et al., 2019). The total observational uncertainty is computed as the coverage uncertainty, reconstruction parameter uncertainty, and uncertainty due to natural climate variability summed in quadrature. The years 1963–1966, corresponding to the cooling following the Mount Agung volcanic eruption, were excluded from the anomaly estimations. The model and observationally based historical warming evolutions and anomalies are computed similarly to Flynn and Mauritsen (2020).
The mean mid-20th century anomalies for each CMIP6 model are used to divide these models into warming blocks based on their position relative to the mean mid-20th century temperature anomaly for the CMIP5 ensemble mean and the CMIP6 ensemble mean (Fig. 2, Table 1); the mean observational anomaly and uncertainty are also shown in Fig. 2 for reference. The CMIP6 models that exhibit mean anomalies warmer than the CMIP5 ensemble mean – the hottest CMIP6 models during the mid-20th century – are grouped into Block 1, containing six models. The models whose mean anomalies fall between the CMIP5 and CMIP6 ensemble means are grouped into Block 2, containing 15 models, and the models whose mean anomalies are colder that the CMIP6 ensemble-mean anomaly – the coldest CMIP6 models during this period – are grouped into Block 3, also containing 15 models. The warming blocks are not relevant to CMIP5 as these models were not analyzed beyond comparison of the distribution of mean mid-century warming anomalies and, accordingly, were not divided into warming blocks.
2.2 Estimation of model effective radiative forcing
Model effective radiative forcings (ERFs; Forster et al., 2016) were estimated exclusively from RFMIP or RFMIP-type fixed-SST simulations, in which sea surface temperatures (SSTs) and sea ice are held constant at their climatological levels to isolate the forcing from surface temperature-mediated slow responses; present-day forcing for CMIP6 is defined as the year 2014 (Pincus et al., 2016). Present-day aerosol ERF was estimated from the piClim-aer simulation, if provided, or taken from the literature, as listed in Table 1; model transient ERF was estimated from the piClim-histaer simulation. It is important to note that the piClim-aer and piClim-histaer simulations hold all aerosols from natural sources, such as volcanoes, constant at pre-industrial values so that only anthropogenic aerosols impact the radiative forcing. Present-day greenhouse gas ERF was estimated from the piClim-ghg simulation or taken from the literature (Table 1), and transient greenhouse gas ERF was estimated from the piClim-histghg simulation. These simulations include forcing from the well-mixed greenhouse gases only.
To compute the present-day ERF, the difference in global-mean, annual-mean net top-of-atmosphere (TOA) radiative fluxes is taken between the piClim-aer or piClim-ghg simulation and the RFMIP piClim-control simulation, in which all forcing agents are held constant at their pre-industrial values (Hansen et al., 2005; Pincus et al., 2016). The mean over all 30 years of the piClim-aer or piClim-ghg simulation is then taken after subtracting the control simulation from these simulations to obtain the present-day ERF estimate. For the present-day aerosol ERF, 21 of the 36 models provided the necessary simulation, while 17 of the 36 models provided the necessary simulation for the present-day greenhouse gas ERF.
The transient aerosol and greenhouse gas ERFs are estimated as the global-mean, annual-mean net TOA radiative flux anomaly relative to that over the period 1850–1900. No further averaging in time is performed. The clear-sky transient aerosol and greenhouse gas ERFs are estimated using the same method, except using the clear-sky rather than all-sky TOA radiative fluxes provided in the model output. For the transient aerosol ERF, 10 models provided the necessary simulation, while only 6 models provided the necessary simulation for the transient greenhouse gas ERF.
2.3 MPI-ESM1.2-CR simulations with different aerosol indirect effect strengths
A set of experiments was performed with the Max Planck Institute coarse-resolution MPI-ESM1.2 (MPI-ESM1.2-CR) model to assess the present-day aerosol ERF with different strengths of the aerosol indirect effect and its influence on mid-century warming. These simulations were configured as atmosphere-only with prescribed SSTs fixed in a preindustrial pattern and a 30-year simulation length, as in the RFMIP fixed-SST simulations. However, aerosol emissions were fixed in the spatial pattern of the year 2005 (Stevens et al., 2017) rather than 2014 so that present day refers to the year 2005 for these simulations. This likely does not significantly impact the comparison to the present-day aerosol ERFs estimated for the CMIP models. Additional CMIP-type historical fully coupled simulations with forcing agents varying according to their observed historical evolutions were also run with MPI-ESM1.2-CR to estimate the mid-20th temperature anomaly. The present-day aerosol ERF and the mid-century temperature anomaly for each simulation were computed following the methods described above for the CMIP models. The model contains ACIs for liquid clouds only. A full description of these simulations can be found in Huusko et al. (2022).
Both types of simulations were run with the default strength for the aerosol indirect effect within MPI-ESM1.2-CR as well as with an enhanced indirect effect. The indirect effect was enhanced by reducing the assumed optical depth of natural background aerosol in the calculation of the Twomey effect by a constant factor of 0.1 and 0.01, respectively, which is a convenient way to artificially change the model's ACI strength (Fiedler et al., 2017; Jiménez-de-la-Cuesta and Mauritsen, 2019; Huusko et al., 2022). Each enhancement of the indirect effect from the default results in a strengthening of the aerosol forcing and an increasing degree of suppressed mid-century warming.
Natural variability in the mid-20th century temperature anomaly was estimated from the historical-type simulations. Each historical-type simulation was run as a three-member ensemble for each indirect effect enhancement, resulting in nine simulations in total. The deviation of each ensemble member from its respective ensemble mean was first computed, and then the standard deviation over all nine deviation values was taken. This standard deviation is taken as the estimate of natural variability in mid-century warming.
Not only is the mid-century warming in CMIP6 colder than CMIP5 and the observations (Fig. 1; Table 1), but the distribution of mean mid-century temperature anomalies from CMIP6 models is also shifted towards colder anomaly magnitudes relative to the CMIP5 distribution (Fig. 2; Table 1). The CMIP5 and CMIP6 ensemble-mean mid-century warming magnitudes are biased cold relative to the observed warming by 0.05 and 0.19 K, respectively; 31 of 36 (86 %) CMIP6 models are colder than the lower uncertainty bound of the observed mid-century warming and 2 of 36 (6 %) CMIP6 models warmer than the upper uncertainty bound, in contrast to 17 of 27 (63 %) models colder and 7 of 27 (26 %) models warmer for CMIP5. These statistics indicate that the suppressed warming is not due to the influence of one or two very cold models. Rather, at least one systematic difference between CMIP phases potentially exists that causes the suppressed warming. Because the CMIP6 individual model warming anomalies span a large range, with some models in better agreement with the observations, some in better agreement with the CMIP6 ensemble-mean anomaly, and some models much colder than all anomalies, systematic differences may exist within the CMIP6 ensemble itself that could explain the suppressed warming.
CMIP6 Block 1 (Fig. 2; Table 1) includes the models with the most realistic mean mid-20th century warming when compared to the observations. This is partially a consequence of the definition for Block 1, because the observational anomaly is larger than that for the CMIP5 ensemble mean. However, it is worthwhile to note this result because good agreement for one period of the warming evolution does not necessarily imply good agreement for another period. The Block 3 models in turn exhibit the least realistic mid-century warming and have a tendency to exhibit the least realistic warming in the late 20th century and early 21st century.
4.1 Comparison of aerosol forcing estimates among warming blocks
The Block 1 models exhibit both the weakest present-day aerosol ERFs and the most realistic mid-20th century temperature anomalies, constituting a systematic difference between the models in Block 1 and the models in Blocks 2 and 3. The mean present-day aerosol ERF for Block 1 is −0.59 (±0.04) W m−2, whereas the means for Blocks 2 and 3 are −1.09 (±0.22) and −1.07 (±0.29) W m−2, respectively (Table 1). The distribution of present-day aerosol ERFs for individual models within Block 1 falls outside those for Blocks 2 and 3, just as its mean ERF magnitude falls outside the standard deviations for Blocks 2 and 3 (Fig. 4; Table 1). Not surprisingly, the transient aerosol ERF for Block 1 is weaker than that for Blocks 2 and 3 throughout most of the 20th century and the early 21st century (Fig. 5). Weak aerosol forcing may thus be the primary cause of the lack of suppressed mid-century warming in the Block 1 models and their better agreement with the observations, while stronger aerosol forcing for Blocks 2 and 3 may be a partial cause of the suppressed warming seen in these models, but it does not explain the variations between and within these model blocks.
Interestingly, the clear-sky transient aerosol forcing for Block 1 is weaker than for Blocks 2 and 3 through the most of the second half of the 20th century (Fig. 5). The clear-sky transient forcing then becomes similar for all three blocks during the late 20th and early 21st centuries. This suggests that a clear-sky aerosol process, such as ARIs, may also contribute to the systematically weaker aerosol forcing exhibited by Block 1.
In contrast, the mean present-day aerosol ERFs for Blocks 2 and 3 are statistically the same, and the distributions of aerosol ERF magnitudes for the Blocks 2 and 3 individual models are quite similar, with the distribution for Block 2 falling wholly within the bounds of that for Block 3 (Fig. 4; Table 1). Additionally, Blocks 2 and 3 exhibit similar transient aerosol ERF magnitudes through the entire historical period (Fig. 5). Because it does not display systematic differences between Blocks 2 and 3, aerosol forcing alone cannot explain the different degrees of suppressed warming displayed by these models, in qualitative agreement with Smith and Forster (2021), Fyfe et al. (2021), and Zhang et al. (2021). This implies that stronger aerosol forcing in combination with at least one other factor must be at play to cause the suppressed warming.
However, some caution must be taken with these results for the all-sky and clear-sky aerosol forcings. Only 3 models within Block 1 provided the piClim-aer simulation necessary to compute the aerosol ERF, compared to 7 models for Block 2 and 11 for Block 3; even fewer provided the piClim-histaer simulation for each block.
Consistent with Stevens (2015), the most realistic mid-20th century warming seen in CMIP6 models, the Block 1 models, is associated with weak aerosol forcing. The warming displayed by all other models falls well below the uncertainty range of the observations (Figs. 2 and 4). However, in contrast to the argument of Stevens (2015), many Block 2 and 3 models that exhibit an aerosol forcing weaker than −1.0 W m−2 also exhibit moderately to substantially suppressed warming, while many Block 2 and 3 models that exhibit aerosol ERFs stronger than −1.0 W m−2 often exhibit mid-century warming rather than cooling. Warming, albeit unrealistic, in this subset of CMIP6 models obtained across a range of weak and strong aerosol ERFs is more consistent with Kretzschmar et al. (2017) and Booth et al. (2018). It should be noted, however, the no model within this subset that exhibits strong aerosol forcing is able to meet a more stringent criterion of being able to reproduce realistic mid-century warming, despite meeting a simpler criterion of exhibiting mid-century warming rather than no warming or cooling.
Further, we have an expectation of the relationship between the mid-century warming and present-day aerosol forcing based on the MPI-ESM1.2-CR model, also shown in Fig. 4. If aerosol forcing differences are the main driver of the magnitude of the mid-century warming, then we might expect the CMIP6 models to fall roughly along the MPI-ESM1.2-CR curve. However, many Block 3 models are located far from this expectation; they display a suppressed mid-century warming relative to the MPI-ESM1.2-CR expectation as well as the CMIP5 and CMIP6 ensemble means. Most Block 1 and 2 models tend to fall roughly along the expectation, being within or just outside the natural variability estimate for the mid-century warming, though more scatter about the curve can be seen for the Block 2 models than for Block 1. These deviations from the expected relationship between aerosol forcing and mid-century warming suggest that more factors than just aerosol forcing difference are important causes of the suppressed warming. Further, it is possible that different processes could be important for different types of models, such as the distinction found in Zhang et al. (2021) for the importance of aerosol emissions for Earth system models compared to global climate models, or the use of fully interactive chemistry in Earth system models and not in less complex models, which influences how aerosol emissions are used by the model and aerosol composition, and thus the forcing.
4.2 Comparison of model aerosol representations among warming blocks
The aerosol forcing comparison above supports the idea that processes in addition to the aerosol forcing itself, such as details of the model aerosol representations, may explain the suppressed warming. We therefore examine here model aerosol representations listed in the CMIP model documentation for potential systematic differences. Two possibilities emerge: the type of aerosol input data set used by the model and whether ACIs for ice clouds specifically were included in the model (Table 1). Other aerosol representation options listed in the documentation did not display variation among CMIP6 models. CMIP6 provided a standardized anthropogenic aerosol emissions input data set and a standardized aerosol prescribed concentrations input data set, to provide as consistent as possible an aerosol input across the models. Block 1 includes 2 models that used the emissions input data set and 4 models that used the prescribed concentration data set, Block 2 includes 10 models that used emissions and 5 that used prescribed concentrations, and Block 3 includes 12 models that used emissions and 3 that used prescribed concentrations. At first, this appears to be differentiation among warming blocks, especially as Block 1 is the only block to contain more models that used prescribed concentrations rather than emissions. But it is more likely that aerosol forcing is the primary cause of the lack of suppressed warming, as Blocks 2 and 3 have a very similar division between the two input types and Fig. 3 shows little systematic difference in mid-century warming or aerosol forcing emerges between models using the emissions input data set and prescribed concentrations input data set. This rules out how a model ingests aerosol boundary conditions and translates that into forcing as a strong influence on the suppressed warming.
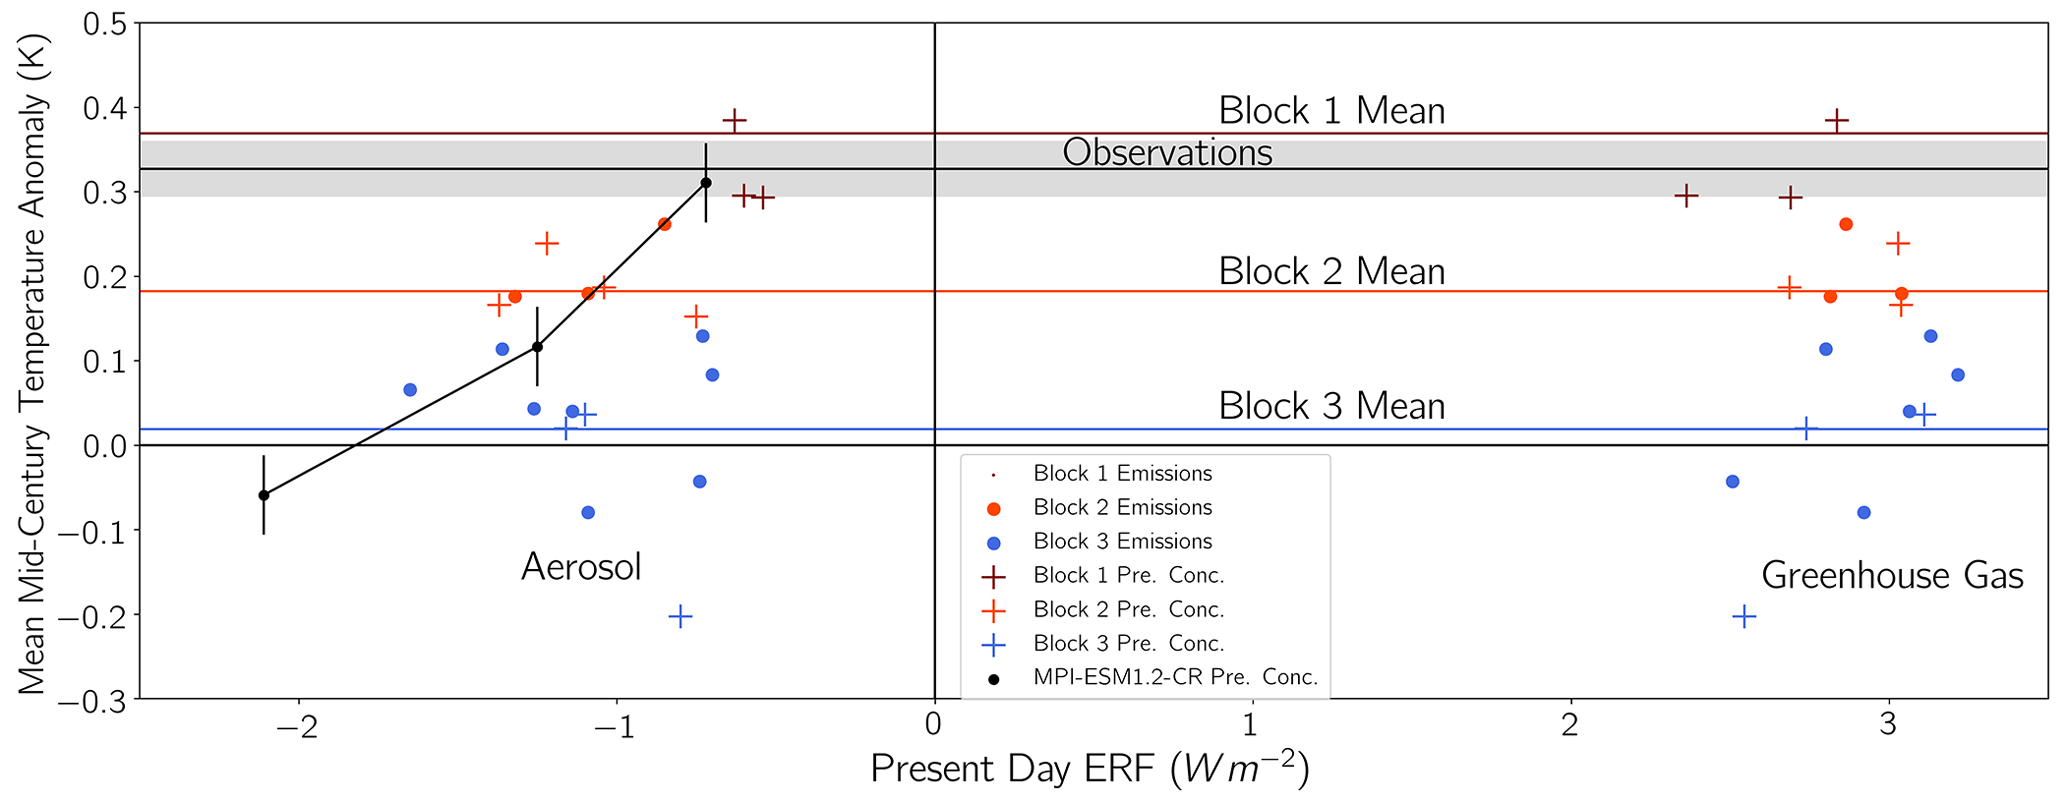
Figure 3Scatter plot of mean mid-20th century surface temperature anomalies (K) on the y axis vs. present-day ERF for aerosol and well-mixed greenhouse gases (W m−2) on the x axis for the CMIP6 models that provided the necessary simulations. Marker colors indicate the warming block to which the individual model belongs, as in Fig. 2, with circles for models using emissions as the aerosol input and plus signs for models using prescribed concentrations instead. MPI-ESM1.2-CR temperature anomalies and present-day aerosol ERF magnitudes plotted as connected black circles, with vertical error bars indicating the estimated uncertainty due to natural variability in the mid-century warming based on these simulations. Mean mid-century warming from the observations plotted as a black horizontal line with uncertainty as light gray shading and mean mid-century warming for Blocks 1, 2, and 3 plotted as red, orange, and blue horizontal lines, respectively, for reference.
The second possibility, ACIs for ice clouds specifically, also initially demonstrated promise for a systematic difference. No models in Block 1 include ACIs for ice clouds, 7 of 15 models in Block 2 do not include ACIs for ice clouds, and 10 of 15 models in Block 3 do not include ACIs for ice clouds. Block 2 is approximately evenly divided between models that do and do not include ACIs for ice clouds, while Block 3 contains twice as many models that do not include ACIs for ice clouds as models that do, suggesting that a lack of ACIs for ice clouds may play a role in the higher degree of suppressed warming seen for Block 3 models compared to Block 2. However, Fig. 4 shows that there is not much difference in mean mid-20th century temperature anomalies between models that do and do not include ACIs for ice clouds. For example, there are two pairs of models in Block 2 that exhibit similar aerosol forcing and warming magnitudes within each pair, despite the inclusion or lack of inclusion of this type of ACIs. In essence, the models that do include ACIs for ice clouds do not differentiate themselves from models that do not in terms of both the mid-century warming or aerosol forcing.
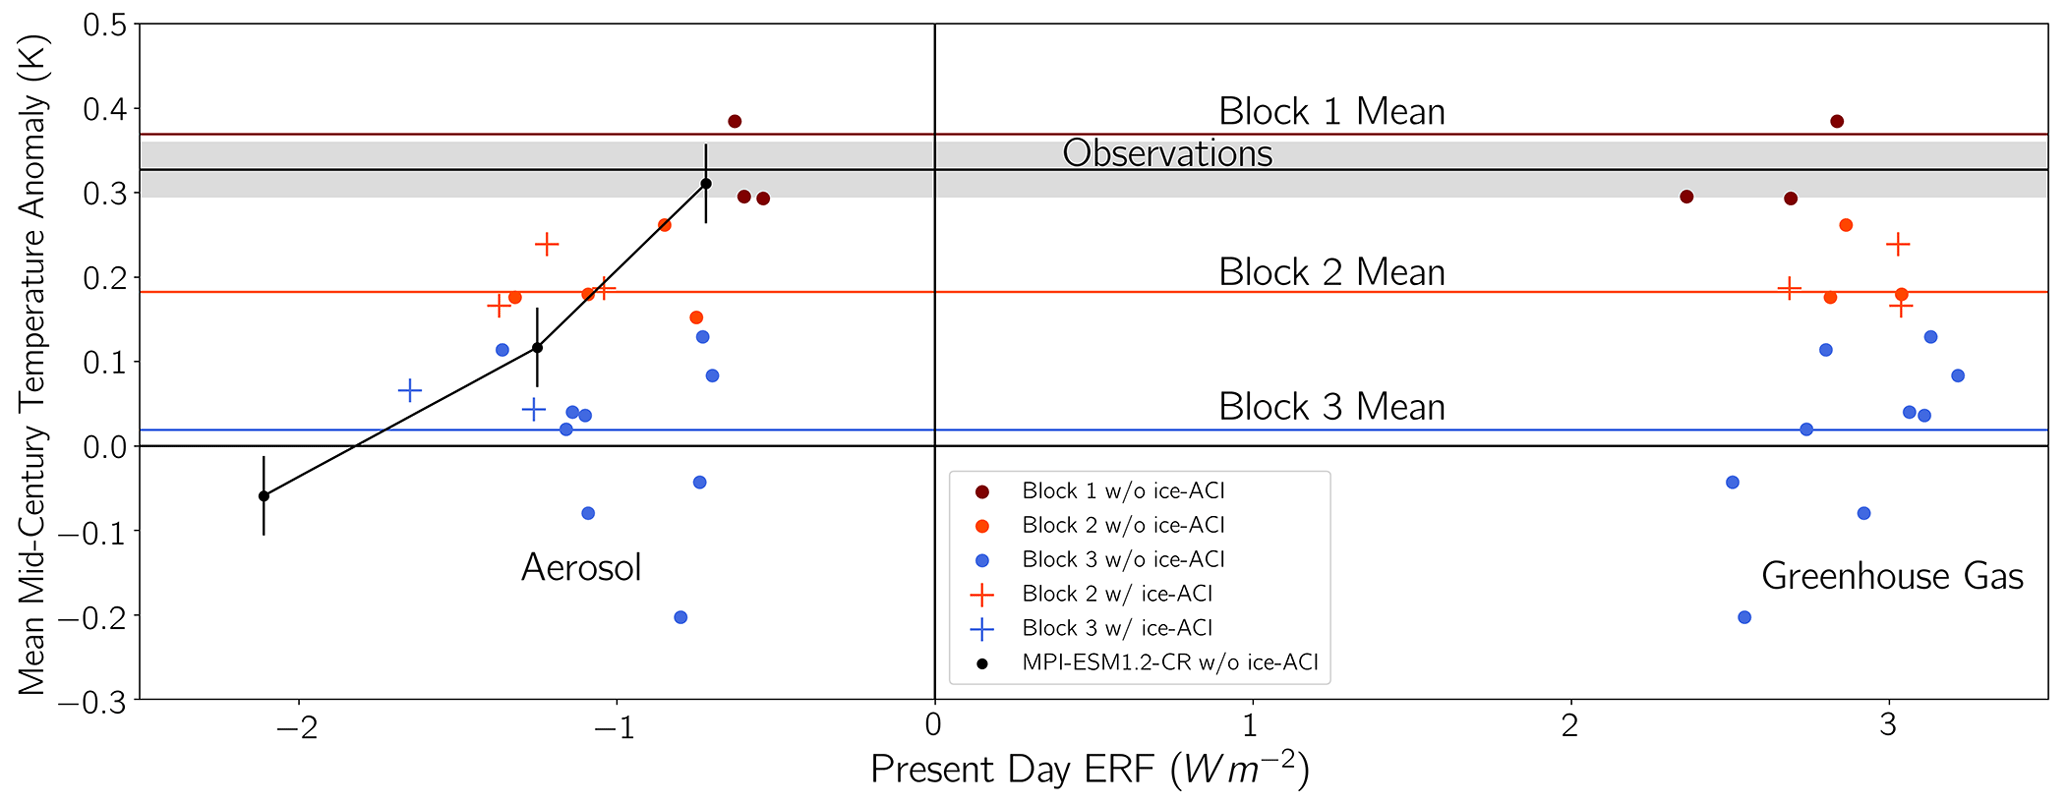
Figure 4Same as in Fig. 3 but with the circle and plus sign markers indicating models lacking aerosol–ice cloud interactions and models that include them, respectively.
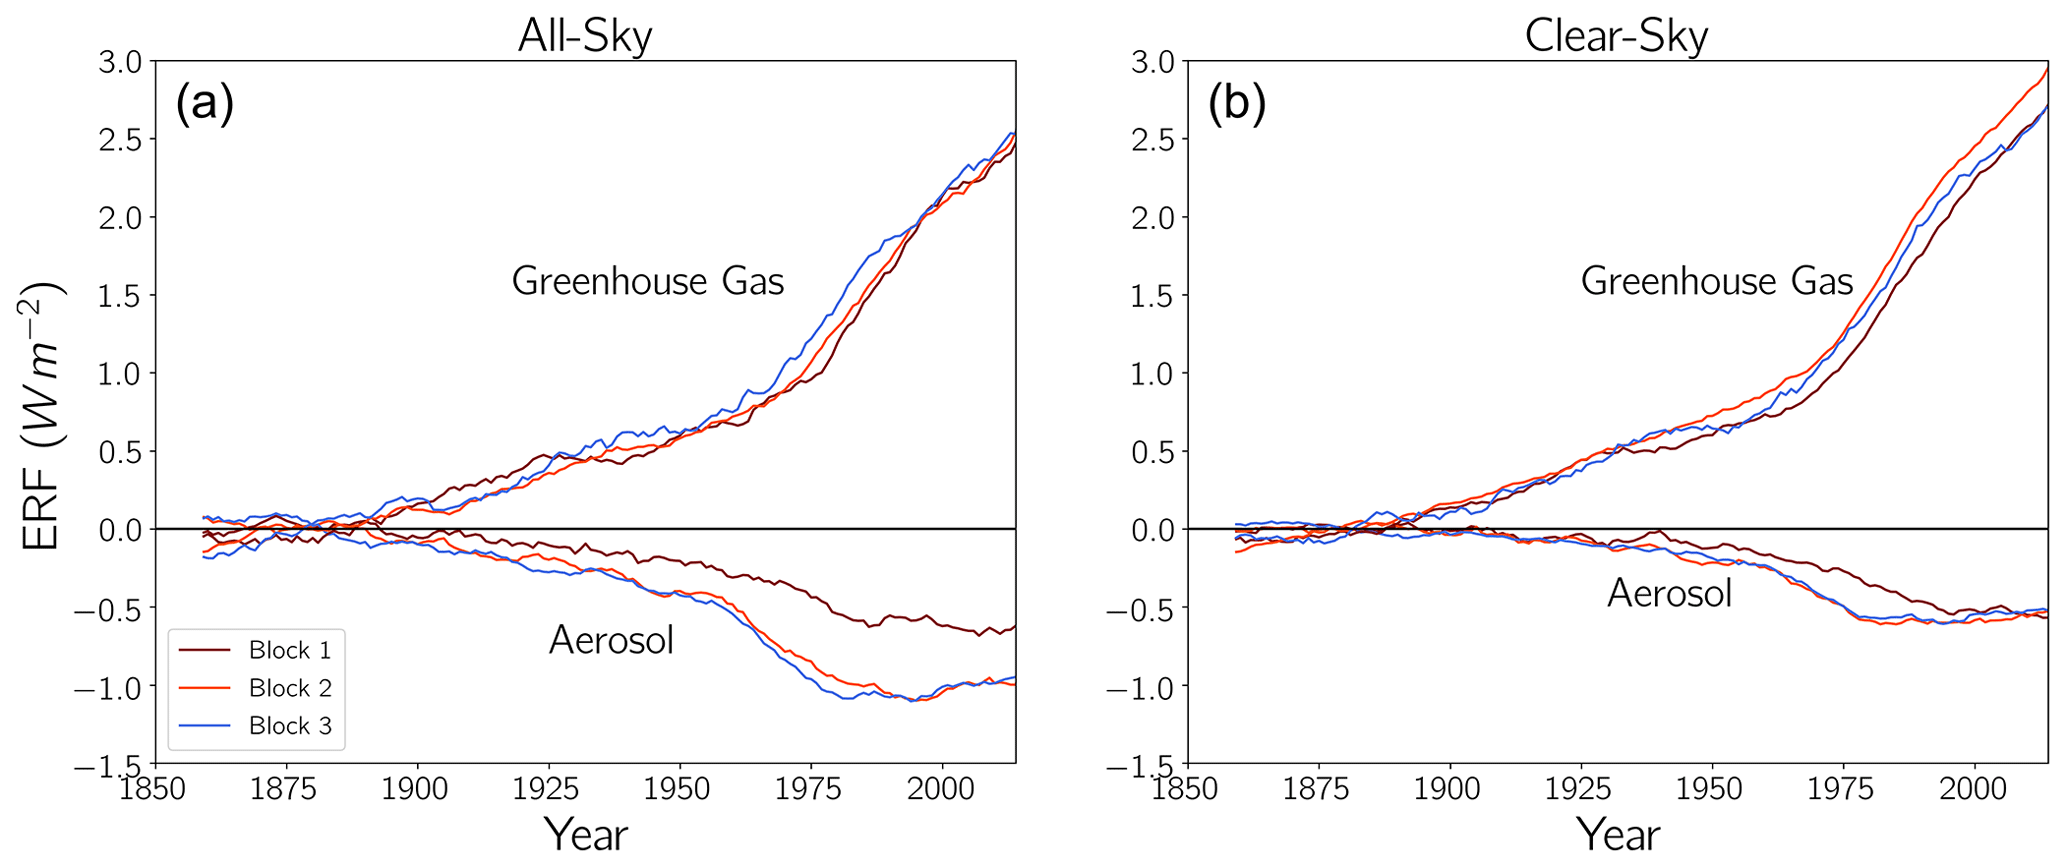
Figure 5Mean historical evolution of the all-sky transient aerosol ERF and well-mixed greenhouse gas ERF (a) for Block 1 (dark red), Block 2 (orange), and Block 3 (blue). Mean historical evolution of the clear-sky transient aerosol and well-mixed greenhouse gas ERF (b) for each warming block.
Other possibilities remain for differences among models in terms of aerosol representation that could not be investigated here due to lack of inclusion in the CMIP documentation and a lack of otherwise easily accessible documentation. These include, among other possibilities, the complexity of the aerosol scheme in models and differences in how aerosol–cloud and aerosol–radiation interactions are represented. These additionally present a potentially promising avenue for further investigation of the causes of the suppressed warming.
The three warming blocks present weak differentiation in terms of their mean present-day greenhouse gas ERF: 2.63 (±0.20), 2.91 (±0.13), and 2.89 (±0.24) W m−2, for Blocks 1, 2, and 3, respectively (Fig. 4; Table 1). Block 1 includes only three models that provided the necessary simulation, Block 2 includes six models, and Block 3 includes nine models, so care must again be taken with these results. This suggests very tentatively that Block 1 models exhibit less greenhouse gas forcing, in light of the standard deviations and small sample sizes. However, if such a difference exists at all among warming blocks, then this alone would actually lead to less warming in the Block 1 models.
The range of Block 3 greenhouse gas ERF magnitudes again contains the entire range for Block 2. While Block 1 contains the smallest greenhouse gas ERF magnitude, its range also overlaps with those for Blocks 2 and 3. Block 3 appears to exhibit a correlation between the greenhouse gas forcing and mean mid-century warming, but it is not quite statistically significant at the 95 % confidence level (r=0.66, p=0.053) and is driven by the three Block 3 models with negative mean mid-20th century temperature anomalies and somewhat smaller greenhouse gas forcing magnitudes (CNRM-ESM2-1, EC-EARTH3, and UKESM1-0-LL). This suggests that a weak greenhouse gas forcing may play some role in the suppressed warming for these three very cold models specifically. However, given the lack of systematic differences among and within warming blocks, and the lack of correlations with the mid-century warming and aerosol forcing, greenhouse gas ERF again likely is not strong a cause of the suppressed mid-century warming in CMIP6.
Systematic differences also did not emerge in ECS among warming blocks, so it is unlikely that differences in climate feedbacks among CMIP6 models amplify or diminish the mid-century warming responses to aerosol or greenhouse gas forcings.
We have investigated the causes of the suppressed warming in CMIP6 models during the mid-20th century by examining the mean warming displayed by the models over the period 1940–1970. The models divide into three warming blocks based on where the model's mid-century warming falls relative to the CMIP5 and CMIP6 ensemble-mean warming, with Block 1 models displaying the warmest and most realistic mid-century warming and Block 3 displaying the coldest and least realistic warming. The distribution of mid-century temperature anomalies shows that CMIP6 is shifted colder relative to CMIP5, rather than a small number of unusually cold CMIP6 models affecting the CMIP6 ensemble mean.
We have not found a satisfactorily complete explanation for the suppressed warming in CMIP6. Model aerosol forcing appeared to be a reasonable culprit, as was suggested in earlier work. However, aerosol forcing was found to play an important but partial role: a systematically weaker aerosol ERF for the small subset of Block 1 models likely accounts for the more realistic mid-century warming seen in these models, and likewise systematically stronger aerosol ERF for the Block 2 and 3 models may partially account for the greater degree of suppressed warming seen in these models. Aerosol forcing, nevertheless, remains insufficient to explain all variations among the many cold-biased models. Greenhouse gas forcing was not found to play an important role in variations of the mid-century warming among CMIP6 models, which, however, does not rule out systematic differences in greenhouse gas forcing between CMIP6 and CMIP5 that influence the mid-century warming, such as found by Smith and Forster (2021). It should again be noted that some caution should be taken with these results, due to the small numbers of models that have submitted the necessary RFMIP simulations at the time of writing; we strongly encourage more models to perform these types of forcing experiments.
We established an expected relationship between aerosol forcing differences and mid-century warming based on the MPI-ESM1.2-CR model. Many Block 3 models fell far away from the expectation curve, and, while these models did not deviate as much as Block 3, the Block 2 models displayed much scatter about the expectation curve. This points to the importance of another process, or a set of processes, in addition to aerosol forcing that cause the suppressed warming. We thus investigated whether model aerosol representations could impact the model response to aerosol forcing, including the inclusion of ACIs for ice clouds and the type of aerosol input data set used by the model. However, despite initially deceiving divisions of CMIP6 models by aerosol input data set used or by whether ACIs for ice clouds were included in the model, these were ultimately not found to have any systematic difference among models in terms of the mid-century warming or aerosol forcing and thus are unlikely to be a cause of the suppressed warming. No other model aerosol configuration options emerged as a potential cause. However, this should not be taken to mean that ACIs, or even ARIs, must be completely ruled out as causes of the suppressed mid-century warming, but rather that they are not direct or obvious causes. This further potentially points to a more much subtle role for differences in aerosol representation among models that can impact representation of ACIs and ARIs within a model and thus remains a promising direction of investigation to uncover the missing causes of the suppressed mid-century warming within CMIP6.
Other possibilities remain for differences among models in terms of aerosol representation that could not be investigated here due to lack of inclusion in the CMIP documentation and a lack of otherwise easily accessible documentation. These include, among other possibilities, the complexity of the aerosol scheme in models and differences in how aerosol–cloud and aerosol–radiation interactions are represented. These additionally present a potentially promising avenue for further investigation of the causes of the suppressed warming.
Qualitatively consistently with recent estimates of the lower bound of aerosol ERF that remains consistent with observed warming, many CMIP6 models exhibit mid-century warming despite very strong aerosol forcing. Interestingly, several CMIP6 models exhibit substantially suppressed warming, or even mid-century cooling, despite an aerosol ERF weaker than the estimated lower-bound constraint of −1.0 W m−2, in contrast to previous work arguing that weaker aerosol forcing should be most consistent with realistic mid-century warming. Though the weak warming, or even global cooling, displayed by these models is unrealistic, warming should be implausible in these models or should have a smaller degree of warming suppression if the estimated lower bound were a strong constraint on the aerosol forcing. This result underscores the difficulty in constraining the aerosol forcing, due to the large number of uncertainties related to it and in aerosol interactions with other aspects of the climate system. This also highlights the need to disentangle whether models represent the historical warming evolution for the correct reasons. Our results partly undermine the hope for constructing a strong constraint on the aerosol forcing based on the mid-20th century warming, since a direct relationship with the mid-century warming does not emerge, even if the models that best matched the observed warming all did have weak aerosol forcing.
The source code for the MPI-ESM1.2 model is freely available online through https://code.mpimet.mpg.de/projects/mpi-esm-license (last access: 1 March 2020; login required) (Mauritsen et al., 2019).
The MPI-ESM1.2-CR simulation output data are available online through Zenodo at https://doi.org/10.5281/zenodo.8054511 (Huusko, 2023). All other model output is freely available online from the Earth System Federation Grid nodes.
The project idea was provided by and analysis performed by CMF. MPI-ESM1.2-CR historical simulations and fixed-SST present-day aerosol forcing simulations were performed and provided by LH. MPI-ESM1.2-LR fixed-SST present-day aerosol forcing simulations were performed and provided by AM. The manuscript was written by CMF, with contributions from LH, AM, and TM.
The contact author has declared that none of the authors has any competing interests.
Publisher’s note: Copernicus Publications remains neutral with regard to jurisdictional claims made in the text, published maps, institutional affiliations, or any other geographical representation in this paper. While Copernicus Publications makes every effort to include appropriate place names, the final responsibility lies with the authors.
We thank the following researchers, in no particular order, for providing information about the aerosol parameters used by their models directly to the authors: Tongwen Wu, Toshihiko Takemura, Dave Bi and Chloe Mackallah, Jason Cole and Neil Swart, Susanne E. Bauer, Wei-Liang Lee, Øyvind Seland and Ingo Bethke, Didier Hauglustaine and Olivier Boucher, Gokhan Danabasoglu and Brian Medeiros, Jian Li, Bin Wang and Young-Min Yang, Roland Séférian, John Dunne, and Chris Golaz and Kai Zhang. We acknowledge the World Climate Research Programme's Working Group on Coupled Modeling and the climate modeling groups listed in Table 1 for producing and making their output available. Computational resources were made available by the Swedish National Infrastructure for Computing (SNIC) at the National Supercomputing Centre (NSC) in Linköping.
This research has been supported by the H2020 European Research Council (grant nos. 820829 and 101003470) and the European Research Council (grant no. 770765). Computational resources have been partially funded by the Swedish Research Council through grant agreement no. 2018-05973.
The article processing charges for this open-access publication were covered by Stockholm University.
This paper was edited by Paulo Ceppi and reviewed by Christopher Smith and one anonymous referee.
Albrecht, B. A.: Aerosols, Cloud Microphysics, and Fractional Cloudiness, Science, 245, 1227–1230, https://doi.org/10.1126/science.245.4923.1227, 1989. a
Andrews, M. B., Ridley, J. K., Wood, R. A., Andrews, T., Blockley, E. W., Booth, B., Burke, E., Dittus, A. J., Florek, P., Gray, L. J., Haddad, S., Hardiman, S. C., Hermanson, L., Hodson, D., Hogan, E., Jones, G. S., Knight, J. R., Kuhlbrodt, T., Misios, S., Mizielinski, M. S., Ringer, M. A., Robson, J., and Sutton, R. T.: Historical Simulations With HadGEM3-GC3.1 for CMIP6, J. Adv. Model. Earth Sy., 12, e2019MS001995, https://doi.org/10.1029/2019MS001995, 2020. a
Andrews, T., Andrews, M. B., Bodas-Salcedo, A., Jones, G. S., Kulhbrodt, T., Manners, J., Menary, M. B., Ridley, J., Ringer, M. A., Sellar, A. A., Senior, C. A., and Tang, Y.: Forcings, feedbacks and climate sensitivity in HadGEM3-GC3.1 and UKESM1, J. Adv. Model. Earth Sy., 11, 4377–4394, https://doi.org/10.1029/2019MS001866, 2019. a
Bellouin, N., Quaas, J., Gryspeerdt, E., Kinne, S., Stier, P., Watson-Parris, D., Boucher, O., Carslaw, K. S., Christensen, M., Daniau, A.-L., Dufresne, J.-L., Feingold, G., Fiedler, S., Forster, P., Gettelman, A., Haywood, J. M., Lohmann, U., Malavelle, F., Mauritsen, T., McCoy, D. T., Myhre, G., Mülmenstädt, J., Neubauer, D., Possner, A., Rugenstein, M., Sato, Y., Schulz, M., Schwartz, S. E., Sourdeval, O., Storelvmo, T., Toll, V., Winker, D., and Stevens, B.: Bounding Global Aerosol Radiative Forcing of Climate Change, Rev. Geophys., 58, e2019RG000660, https://doi.org/10.1029/2019RG000660, 2020. a
Bodas-Salcedo, A., Mulcahy, J. P., Andrews, T., Williams, K. D., Ringer, M. A., Field, P. R., and Elsaesser, G. S.: Strong Dependence of Atmospheric Feedbacks on Mixed-Phase Microphysics and Aerosol-Cloud Interactions in HadGEM3, J. Adv. Model. Earth Sy., 11, 1735–1758, https://doi.org/10.1029/2019MS001688, 2019. a
Booth, B. B. B., Harris, G. R., Jones, A., Wilcox, L., Hawcroft, M., and Carslaw, K. S.: Comments on “Rethinking the Lower Bound on Aerosol Radiative Forcing”, J. Climate, 31, 9407–9412, https://doi.org/10.1175/JCLI-D-17-0369.1, 2018. a, b, c
Cowtan, K. and Way, R. G.: Coverage bias in the HadCRUT4 temperature series and its impact on recent temperature trends, Q. J. Roy. Meteorol. Soc., 140, 1935–1944, https://doi.org/10.1002/qj.2297, 2014. a
Dittus, A. J., Hawkins, E., Wilcox, L. J., Sutton, R. T., Smith, C. J., Andrews, M. B., and Forster, P. M.: Sensitivity of Historical Climate Simulations to Uncertain Aerosol Forcing, Geophys. Res. Lett., 47, e2019GL085806, https://doi.org/10.1029/2019GL085806, 2020. a
Fiedler, S., Stevens, B., and Mauritsen, T.: On the sensitivity of anthropogenic aerosol forcing to model-internal variability and parameterizing a Twomey effect, J. Adv. Model. Earth Sy., 9, 1325–1341, https://doi.org/10.1002/2017MS000932, 2017. a
Flynn, C. M. and Mauritsen, T.: On the climate sensitivity and historical warming evolution in recent coupled model ensembles, Atmos. Chem. Phys., 20, 7829–7842, https://doi.org/10.5194/acp-20-7829-2020, 2020. a, b, c, d
Forster, P., Storelvmo, T., Armour, K., W. Collins, J.-L. D., Frame, D., Lunt, D., Mauritsen, T., Palmer, M., Watanabe, M., Wild, M., and Zhang, H.: The Earth's Energy Budget, Climate Feedbacks and Climate Sensitivity, Cambridge University Press, 923–1054, https://doi.org/10.1017/9781009157896.009, 2021. a
Forster, P. M., Andrews, T., Good, P., Gregory, J. M., Jackson, L. S., and Zelinka, M.: Evaluating adjusted forcing and model spread for historical and future scenarios in the CMIP5 generation of climate models, J. Geophys. Res.-Atmos., 118, 1139–1150, https://doi.org/10.1002/jgrd.50174, 2013. a
Forster, P. M., Richardson, T., Maycock, A. C., Smith, C. J., Samset, B. H., Myhre, G., Andrews, T., Pincus, R., and Schulz, M.: Recommendations for diagnosing effective radiative forcing from climate models for CMIP6, J. Geophys. Res.-Atmos., 121, 12460–12475, https://doi.org/10.1002/2016JD025320, 2016. a
Forster, P. M. F. and Taylor, K. E.: Climate Forcings and Climate Sensitivities Diagnosed from Coupled Climate Model Integrations, J. Climate, 19, 6181–6194, https://doi.org/10.1175/JCLI3974.1, 2006. a
Fyfe, J. C., Kharin, V. V., Santer, B. D., Cole, J. N. S., and Gillett, N. P.: Significant impact of forcing uncertainty in a large ensemble of climate model simulations, P. Natl. Acad. Sci. USA, 118, e2016549118, https://doi.org/10.1073/pnas.2016549118, 2021. a, b, c
Gettelman, A., Hannay, C., Bacmeister, J. T., Neale, R. B., Pendergrass, A. G., Danabasoglu, G., Lamarque, J.-F., Fasullo, J. T., Bailey, D. A., Lawrence, D. M., and Mills, M. J.: High Climate Sensitivity in the Community Earth System Model Version 2 (CESM2), Geophys. Res. Lett., 46, 8329–8337, https://doi.org/10.1029/2019GL083978, 2019. a
Gillett, N. P., Kirchmeier-Young, M., Ribes, A., Shiogama, H., Hegerl, G. C., Knutti, R., Gastineau, G., John, J. G., Li, L., Nazarenko, L., Rosenbloom, N., Seland, Ø., Wu, T., Yukimoto, S., and Ziehn, T.: Constraining human contributions to observed warming since the pre-industrial period, Nat. Clim. Change, 11, 207–212, https://doi.org/10.1038/s41558-020-00965-9, 2021. a
Golaz, J.-C., Caldwell, P. M., Van Roekel, L. P., Petersen, M. R., Tang, Q., Wolfe, J. D., Abeshu, G., Anantharaj, V., Asay-Davis, X. S., Bader, D. C., Baldwin, S. A., Bisht, G., Bogenschutz, P. A., Branstetter, M., Brunke, M. A., Brus, S. R., Burrows, S. M., Cameron-Smith, P. J., Donahue, A. S., Deakin, M., Easter, R. C., Evans, K. J., Feng, Y., Flanner, M., Foucar, J. G., Fyke, J. G., Griffin, B. M., Hannay, C., Harrop, B. E., Hoffman, M. J., Hunke, E. C., Jacob, R. L., Jacobsen, D. W., Jeffery, N., Jones, P. W., Keen, N. D., Klein, S. A., Larson, V. E., Leung, L. R., Li, H.-Y., Lin, W., Lipscomb, W. H., Ma, P.-L., Mahajan, S., Maltrud, M. E., Mametjanov, A., McClean, J. L., McCoy, R. B., Neale, R. B., Price, S. F., Qian, Y., Rasch, P. J., Reeves Eyre, J. E. J., Riley, W. J., Ringler, T. D., Roberts, A. F., Roesler, E. L., Salinger, A. G., Shaheen, Z., Shi, X., Singh, B., Tang, J., Taylor, M. A., Thornton, P. E., Turner, A. K., Veneziani, M., Wan, H., Wang, H., Wang, S., Williams, D. N., Wolfram, P. J., Worley, P. H., Xie, S., Yang, Y., Yoon, J.-H., Zelinka, M. D., Zender, C. S., Zeng, X., Zhang, C., Zhang, K., Zhang, Y., Zheng, X., Zhou, T., and Zhu, Q.: The DOE E3SM Coupled Model Version 1: Overview and Evaluation at Standard Resolution, J. Adv. Model. Earth Sy., 11, 2089–2129, https://doi.org/10.1029/2018MS001603, 2019. a, b
Hansen, J., Sato, M., Ruedy, R., Nazarenko, L., Lacis, A., Schmidt, G. A., Russell, G., Aleinov, I., Bauer, M., Bauer, S., Bell, N., Cairns, B., Canuto, V., Chandler, M., Cheng, Y., Del Genio, A., Faluvegi, G., Fleming, E., Friend, A., Hall, T., Jackman, C., Kelley, M., Kiang, N., Koch, D., Lean, J., Lerner, J., Lo, K., Menon, S., Miller, R., Minnis, P., Novakov, T., Oinas, V., Perlwitz, J., Perlwitz, J., Rind, D., Romanou, A., Shindell, D., Stone, P., Sun, S., Tausnev, N., Thresher, D., Wielicki, B., Wong, T., Yao, M., and Zhang, S.: Efficacy of climate forcings, J. Geophys. Res.-Atmos., 110, D18104, https://doi.org/10.1029/2005JD005776, 2005. a
Horowitz, L. W., Naik, V., Paulot, F., Ginoux, P. A., Dunne, J. P., Mao, J., Schnell, J., Chen, X., He, J., John, J. G., Lin, M., Lin, P., Malyshev, S., Paynter, D., Shevliakova, E., and Zhao, M.: The GFDL Global Atmospheric Chemistry-Climate Model AM4.1: Model Description and Simulation Characteristics, J. Adv. Model. Earth Sy., 12, e2019MS002032, https://doi.org/10.1029/2019MS002032, 2020. a
Huusko, L.: MPI-ESM1.2 data for Aerosol Forcing Does Not Sufficiently Explain the Suppressed Mid-20th Century Warming in CMIP6, Version 1, Zenodo [data set], https://doi.org/10.5281/zenodo.8054511, 2023. a
Huusko, L., Modak, A., and Mauritsen, T.: Stronger Response to the Aerosol Indirect Effect Due To Cooling in Remote Regions, Geophys. Res. Lett., 49, e2022GL101184, https://doi.org/10.1029/2022GL101184, 2022. a, b
Jiménez-de-la-Cuesta, D. and Mauritsen, T.: Emergent constraints on Earth's transient and equilibrium response to doubled CO2 from post-1970s global warming, Nat. Geosci., 12, 902–905, https://doi.org/10.1038/s41561-019-0463-y, 2019. a
Kiehl, J. T.: Twentieth century climate model response and climate sensitivity, Geophys. Res. Lett., 34, L22710, https://doi.org/10.1029/2007GL031383, 2007. a
Kretzschmar, J., Salzmann, M., Mülmenstädt, J., Boucher, O., and Quaas, J.: Comment on Rethinking the Lower Bound on Aerosol Radiative Forcing”, J. Climate, 30, 6579–6584, https://doi.org/10.1175/JCLI-D-16-0668.1, 2017. a, b, c
Maher, N., Milinski, S., Suarez-Gutierrez, L., Botzet, M., Dobrynin, M., Kornblueh, L., Kröger, J., Takano, Y., Ghosh, R., Hedemann, C., Li, C., Li, H., Manzini, E., Notz, D., Putrasahan, D., Boysen, L., Claussen, M., Ilyina, T., Olonscheck, D., Raddatz, T., Stevens, B., and Marotzke, J.: The Max Planck Institute Grand Ensemble: Enabling the Exploration of Climate System Variability, J. Adv. Model. Earth Sy., 11, 2050–2069, https://doi.org/10.1029/2019MS001639, 2019. a
Mauritsen, T., Bader, J., Becker, T., Behrens, J., Bittner, M., Brokopf, R., Brovkin, V., Claussen, M., Crueger, T., Esch, M., Fast, I., Fiedler, S., Fläschner, D., Gayler, V., Giorgetta, M., Goll, D. S., Haak, H., Hagemann, S., Hedemann, C., Hohenegger, C., Ilyina, T., Jahns, T., Jimenéz-de-la Cuesta, D., Jungclaus, J., Kleinen, T., Kloster, S., Kracher, D., Kinne, S., Kleberg, D., Lasslop, G., Kornblueh, L., Marotzke, J., Matei, D., Meraner, K., Mikolajewicz, U., Modali, K., Möbis, B., Müller, W. A., Nabel, J. E. M. S., Nam, C. C. W., Notz, D., Nyawira, S.-S., Paulsen, H., Peters, K., Pincus, R., Pohlmann, H., Pongratz, J., Popp, M., Raddatz, T. J., Rast, S., Redler, R., Reick, C. H., Rohrschneider, T., Schemann, V., Schmidt, H., Schnur, R., Schulzweida, U., Six, K. D., Stein, L., Stemmler, I., Stevens, B., von Storch, J.-S., Tian, F., Voigt, A., Vrese, P., Wieners, K.-H., Wilkenskjeld, S., Winkler, A., and Roeckner, E.: Developments in the MPI-M Earth System Model version 1.2 (MPI-ESM1.2) and Its Response to Increasing CO2, J. Adv. Model. Earth Sy., 11, 998–1038, https://doi.org/10.1029/2018MS001400, 2019 (code available at: https://code.mpimet.mpg.de/projects/mpi-esm-license, last access: 1 March 2020) a, b, c
Michou, M., Nabat, P., Saint-Martin, D., Bock, J., Decharme, B., Mallet, M., Roehrig, R., Séférian, R., Sénési, S., and Voldoire, A.: Present-Day and Historical Aerosol and Ozone Characteristics in CNRM CMIP6 Simulations, J. Adv. Model. Earth Sy., 12, e2019MS001816, https://doi.org/10.1029/2019MS001816, 2020. a
Mulcahy, J. P., Jones, C. G., Rumbold, S. T., Kuhlbrodt, T., Dittus, A. J., Blockley, E. W., Yool, A., Walton, J., Hardacre, C., Andrews, T., Bodas-Salcedo, A., Stringer, M., de Mora, L., Harris, P., Hill, R., Kelley, D., Robertson, E., and Tang, Y.: UKESM1.1: development and evaluation of an updated configuration of the UK Earth System Model, Geosci. Model Dev., 16, 1569–1600, https://doi.org/10.5194/gmd-16-1569-2023, 2023. a
O'Connor, F. M., Abraham, N. L., Dalvi, M., Folberth, G. A., Griffiths, P. T., Hardacre, C., Johnson, B. T., Kahana, R., Keeble, J., Kim, B., Morgenstern, O., Mulcahy, J. P., Richardson, M., Robertson, E., Seo, J., Shim, S., Teixeira, J. C., Turnock, S. T., Williams, J., Wiltshire, A. J., Woodward, S., and Zeng, G.: Assessment of pre-industrial to present-day anthropogenic climate forcing in UKESM1, Atmos. Chem. Phys., 21, 1211–1243, https://doi.org/10.5194/acp-21-1211-2021, 2021. a
Oshima, N., Yukimoto, S., Deushi, M., Koshiro, T., Kawai, H., Tanaka, T. Y., and Kohei, Y.: Global and Arctic effective radiative forcing of anthropogenic gases and aerosols in MRI-ESM2.0, Progress in Earth and Planetary Science, 7, 38, https://doi.org/10.1186/s40645-020-00348-w, 2020. a
Pincus, R., Forster, P. M., and Stevens, B.: The Radiative Forcing Model Intercomparison Project (RFMIP): experimental protocol for CMIP6, Geosci. Model Dev., 9, 3447–3460, https://doi.org/10.5194/gmd-9-3447-2016, 2016. a, b, c
Seland, Ø., Bentsen, M., Olivié, D., Toniazzo, T., Gjermundsen, A., Graff, L. S., Debernard, J. B., Gupta, A. K., He, Y.-C., Kirkevåg, A., Schwinger, J., Tjiputra, J., Aas, K. S., Bethke, I., Fan, Y., Griesfeller, J., Grini, A., Guo, C., Ilicak, M., Karset, I. H. H., Landgren, O., Liakka, J., Moseid, K. O., Nummelin, A., Spensberger, C., Tang, H., Zhang, Z., Heinze, C., Iversen, T., and Schulz, M.: Overview of the Norwegian Earth System Model (NorESM2) and key climate response of CMIP6 DECK, historical, and scenario simulations, Geosci. Model Dev., 13, 6165–6200, https://doi.org/10.5194/gmd-13-6165-2020, 2020. a
Smith, C. J. and Forster, P. M.: Suppressed Late-20th Century Warming in CMIP6 Models Explained by Forcing and Feedbacks, Geophys. Res. Lett., 48, e2021GL094948, https://doi.org/10.1029/2021GL094948, 2021. a, b, c, d
Smith, C. J., Kramer, R. J., Myhre, G., Alterskjær, K., Collins, W., Sima, A., Boucher, O., Dufresne, J.-L., Nabat, P., Michou, M., Yukimoto, S., Cole, J., Paynter, D., Shiogama, H., O'Connor, F. M., Robertson, E., Wiltshire, A., Andrews, T., Hannay, C., Miller, R., Nazarenko, L., Kirkevåg, A., Olivié, D., Fiedler, S., Lewinschal, A., Mackallah, C., Dix, M., Pincus, R., and Forster, P. M.: Effective radiative forcing and adjustments in CMIP6 models, Atmos. Chem. Phys., 20, 9591–9618, https://doi.org/10.5194/acp-20-9591-2020, 2020. a, b, c
Smith, C. J., Harris, G. R., Palmer, M. D., Bellouin, N., Collins, W., Myhre, G., Schulz, M., Golaz, J.-C., Ringer, M., Storelvmo, T., and Forster, P. M.: Energy Budget Constraints on the Time History of Aerosol Forcing and Climate Sensitivity, J. Geophys. Res.-Atmos., 126, e2020JD033622, https://doi.org/10.1029/2020JD033622, 2021. a
Stevens, B.: Rethinking the Lower Bound on Aerosol Radiative Forcing, J. Climate, 28, 4794–4819, https://doi.org/10.1175/JCLI-D-14-00656.1, 2015. a, b, c, d, e
Stevens, B., Fiedler, S., Kinne, S., Peters, K., Rast, S., Müsse, J., Smith, S. J., and Mauritsen, T.: MACv2-SP: a parameterization of anthropogenic aerosol optical properties and an associated Twomey effect for use in CMIP6, Geosci. Model Dev., 10, 433–452, https://doi.org/10.5194/gmd-10-433-2017, 2017. a
Twomey, S.: The Influence of Pollution on the Shortwave Albedo of Clouds, J. Atmos. Sci., 34, 1149–1152, https://doi.org/10.1175/1520-0469(1977)034<1149:TIOPOT>2.0.CO;2, 1977. a
van Noije, T., Bergman, T., Le Sager, P., O'Donnell, D., Makkonen, R., Gonçalves-Ageitos, M., Döscher, R., Fladrich, U., von Hardenberg, J., Keskinen, J.-P., Korhonen, H., Laakso, A., Myriokefalitakis, S., Ollinaho, P., Pérez García-Pando, C., Reerink, T., Schrödner, R., Wyser, K., and Yang, S.: EC-Earth3-AerChem: a global climate model with interactive aerosols and atmospheric chemistry participating in CMIP6, Geosci. Model Dev., 14, 5637–5668, https://doi.org/10.5194/gmd-14-5637-2021, 2021. a
Voldoire, A., Saint-Martin, D., Sénési, S., Decharme, B., Alias, A., Chevallier, M., Colin, J., Guérémy, J.-F., Michou, M., Moine, M.-P., Nabat, P., Roehrig, R., Salas y Mélia, D., Séférian, R., Valcke, S., Beau, I., Belamari, S., Berthet, S., Cassou, C., Cattiaux, J., Deshayes, J., Douville, H., Ethé, C., Franchistéguy, L., Geoffroy, O., Lévy, C., Madec, G., Meurdesoif, Y., Msadek, R., Ribes, A., Sanchez-Gomez, E., Terray, L., and Waldman, R.: Evaluation of CMIP6 DECK Experiments With CNRM-CM6-1, J. Adv. Model. Earth Sy., 11, 2177–2213, https://doi.org/10.1029/2019MS001683, 2019. a
Zelinka, M.: mzelinka/cmip56_forcing_feedback_ecs: Jun 15, 2022 Release, Version v2.2, Zenodo [code], https://doi.org/10.5281/zenodo.6647291, 2022. a
Zelinka, M. D., Myers, T. A., McCoy, D. T., Po-Chedley, S., Caldwell, P. M., Ceppi, P., Klein, S. A., and Taylor, K. E.: Causes of Higher Climate Sensitivity in CMIP6 Models, Geophys. Res. Lett., 47, e2019GL085782, https://doi.org/10.1029/2019GL085782, 2020. a, b
Zhang, J., Furtado, K., Turnock, S. T., Mulcahy, J. P., Wilcox, L. J., Booth, B. B., Sexton, D., Wu, T., Zhang, F., and Liu, Q.: The role of anthropogenic aerosols in the anomalous cooling from 1960 to 1990 in the CMIP6 Earth system models, Atmos. Chem. Phys., 21, 18609–18627, https://doi.org/10.5194/acp-21-18609-2021, 2021. a, b, c, d
- Abstract
- Introduction
- Model experiments and methodology
- Comparison of warming distributions between CMIP5 and CMIP6
- Can anthropogenic aerosols explain the suppressed warming?
- Does greenhouse gas forcing or climate sensitivity play a role?
- Conclusions
- Code availability
- Data availability
- Author contributions
- Competing interests
- Disclaimer
- Acknowledgements
- Financial support
- Review statement
- References