the Creative Commons Attribution 4.0 License.
the Creative Commons Attribution 4.0 License.
 | 16 Nov 2023
Measurement report: Dust and anthropogenic aerosols' vertical distributions over northern China dense aerosols gathered at the top of the mixing layer
Zhuang Wang
Chune Shi
Hao Zhang
Yujia Chen
Xiyuan Chi
Congzi Xia
Suyao Wang
Yizhi Zhu
Kaidi Zhang
Xintong Chen
Over the past decades, northern China has been suffering from persistent air pollution caused by both fine and coarse atmospheric particles. Although there are plenty of theoretical and observational studies on aerosols in northern China, most of them only consider total aerosol concentrations and focus on heavy pollution episodes; the long-term vertical distributions of dust (coarse) and anthropogenic aerosols (fine) and their relationships with the mixing layer height (MLH) have not been revealed. In this study, the dust and anthropogenic aerosols' mass concentration and the MLH were retrieved by polarization Raman lidar over Beijing from May 2019 to February 2022. We found that large amounts of anthropogenic aerosols accumulate at the top of the mixing layer, which is most noticeable in summer, with monthly mean mass concentration up to 57 µg m−3. It is mainly influenced by the southward transport in the upper air, where the atmosphere is relatively stable and moist, favoring hygroscopic growth of particles. Dust mass concentration is discontinuous in the vertical direction, not only on the ground but also in lofted layers that reach up to several kilometers. The heights of these lofted dust layers exhibited apparent seasonal dependence, with the height of the main dust layer gradually ascending from 1.1 km to about 2.5 km from April to June and below 3 km from October to December. In addition, there is a significant negative correlation between bottom anthropogenic aerosols' mass concentration and the MLH, and an inverse function fit is more suitable to characterize this relationship, while the relationship between bottom dust mass concentration and the MLH is insignificant. These results will enhance our understanding of the sophisticated interactions between dust and anthropogenic aerosols, the MLH, and regional transport in northern China. It will also help to refine atmospheric chemistry models and improve surface prediction capabilities.
- Article
(10850 KB) - Full-text XML
-
Supplement
(547 KB) - BibTeX
- EndNote


For the past decades, atmospheric particle pollution has attracted a great deal of public concern in China, because it can decrease visibility and have substantial adverse effects on human health (Liang et al., 2022). Also, coarse and fine particles considerably affect the Earth's climate through direct and indirect effects of aerosols, and there are considerable differences in the effects of the aerosol types and particles' vertical distributions on the Earth's climate (Su et al., 2020; Liu et al., 2022a, b, 2021a). Beijing used to be one of the most polluted cities in China, suffering from persistent atmospheric particulate pollution caused by atmospheric fine particles (anthropogenic aerosols) and coarse particles (Asian dust) (Gui et al., 2022; Zheng et al., 2015; Song et al., 2023; Huang et al., 2014; Xiao et al., 2023). Beijing is surrounded by the Yanshan and Taihang to the north and west, respectively, and the flat North China Plain (NCP) to the south, where atmospheric dispersion is relatively poor. Multiple factors contribute to severe air pollution in Beijing; strong anthropogenic emissions due to rapid urbanization and industrialization are the crucial reasons (Su et al., 2020). In addition, the influence of the Mongolian cyclone, which predisposes East Asian dust to be lifted into the free troposphere (FT) and transported over long distances to the east, also affects Beijing's air quality (Gui et al., 2022; Sun et al., 2001; Xiao et al., 2023). Therefore, the observed aerosol layer in Beijing is usually a mixture of multiple types (natural and anthropogenic).
Previous studies have also shown that meteorological conditions are the key factors controlling air pollution in Beijing (Zhong et al., 2019, 2018; Guo et al., 2014), with weak southerly winds, high relative humidity (RH) levels, a shallow mixing layer height (MLH), and stable atmospheric stratification associated with severe anthropogenic air pollution, while strong northwest wind is closely related to dust aerosol pollution (Wang et al., 2021c, 2020). Among these meteorological factors, the MLH is one of the most critical, as its depth substantially determines the total volume of pollutant dispersal and mixing (Miao et al., 2018). The MLH affects surface aerosol concentrations, which are associated with vertical mixing of aerosols, and can impact the dilution of surface air pollutants through various interaction and feedback mechanisms. The MLH can also significantly affect the aerosol vertical distributions, as most air pollutants tend to accumulate within the mixing layer (ML) (Su et al., 2020). The development of the MLH also accelerates the hygroscopic growth of fine particles within the ML, which is conductive to enhance the surface air pollution (Cheng et al., 2016; Zhang et al., 2023a; Tang et al., 2016). On the other hand, aerosols also have significant radiative feedbacks to the MLH, surface dimming and upper-level heating; the magnitude and sign of the radiative feedback depends on the aerosol type and distribution height of aerosols (Huang et al., 2018; Ding et al., 2016). In a previous comprehensive review, Li et al. (2017) presented sufficient evidence for aerosol and MLH interactions and described their determinants. Thus, in order to more accurately estimate the formation, growth, and dissipation of air pollution and its interactions with the MLH, it is necessary to observe the vertical distribution of aerosol type and its optical properties at high spatial and temporal resolution.
Although field surface observations or column measurements provide detailed optical, chemical, and microphysical characteristics of particles, they do not capture vertical distribution characteristics of aerosol types and their optical properties (Holben et al., 1998). Plenty of numerical simulations and ground-based remote sensing or meteorological radiosonde techniques have been used to acquire aerosol vertical distributions over a short time in Beijing (Zhong et al., 2019; Guo et al., 2016, 2021; Tang et al., 2016; Su et al., 2020; Liu et al., 2021b, 2023), primarily focusing on severe air pollution episodes, which emphasizes the scarcity of long-term continuous measurements with high spatial and temporal resolution. Moreover, although there are more theoretical and observational studies on MLH characteristics and their correlations with surface aerosols (Zhong et al., 2019, 2018; Guo et al., 2016, 2021; Miao et al., 2015, 2018; Tao et al., 2014; Su et al., 2020), most of them only consider the total aerosol concentrations, and the vertical structure and MLH relationships for coarse particles (dust) and fine particles (anthropogenic aerosols) have not been revealed. This has led to a lack of knowledge about the different aerosol types' vertical distribution and their relationship with the MLH. This lack of knowledge hinders the understanding of the long-range transport, mixing and stratification processes of aerosols, leading to uncertainties in the assessment of the aerosol climatic effects and meteorological chemistry models. Therefore, a comprehensive investigation of the dust and anthropogenic aerosols' vertical distributions is urgently needed to facilitate mixing processes of dust with anthropogenic aerosols, as well as quantitative studies of the environmental contributions of different aerosol types.
The PRL (polarization Raman lidar) technique provides a reliable tool to explore the vertical distribution characteristics of dust and anthropogenic aerosols with high spatial and temporal resolution (Ansmann et al., 2012; Tesche et al., 2011a, b, 2009a, b). Moreover, the PRL is also suitable for retrieving the evolution of the MLH (Sicard et al., 2006; Flamant et al., 1997). In this study, we summarize nearly 3 years of PRL observations in Beijing from May 2019 to February 2022. The annual cycle of dust and anthropogenic aerosols' vertical distributions and their relationship with the MLH in Beijing are clarified. The results of the PRL measurements presented here can help to fill gaps in the knowledge of the different aerosol types' vertical distribution and their relationship with the MLH, where limited long-term PRL observations are available. In addition, our observations can also establish a dataset of aerosol optical parameters such as the particle depolarization ratio (PDR) and the lidar ratio (LR) in megacities in northern China. The data can be used to support basic data analysis for spaceborne lidar missions such as CALIPSO (Cloud-Aerosol Lidar and Infrared Pathfinder Satellite Observations) (Winker et al., 2009), ALADIN (Atmospheric LAser Doppler INstrument) (Witschas et al., 2020), and ATLID (Atmospheric Lidar) (Illingworth et al., 2015), upgrading the accuracy of regional terrestrial and global satellite lidar inversions.
The objectives of our study are to (1) present a long-term dataset of aerosol LR, PDR and aerosol types in northern China, (2) elucidate the annual cycle of the dust and anthropogenic aerosols' vertical distributions in Beijing, and (3) reveal the relationship between the MLH and the dust and anthropogenic aerosols' vertical distributions. These results will help improve our understanding of the complex interactions between dust and anthropogenic aerosols, the MLH, and regional transport over northern China. They will also help refine atmospheric chemistry models and improve surface air pollution monitoring and prediction capabilities.
In this section, we specify the instrument, materials, and methods employed throughout the study. Section 2.1 introduces the PRL system, Sect. 2.2–2.5 describes the auxiliary data, and the polarization lidar photometer networking (POLIPHON) method for retrieving dust and anthropogenic aerosols' mass concentration is described in Sect. 2.6. Aerosol Robotic Network (AERONET) aerosol optical parameters were the input parameters of the POLIPHON method, and surface PM10 and PM2.5 mass concentrations are used for validation of POLIPHON method results. The Hybrid Single Particle Lagrangian Integrated Trajectory (HYSPLIT) model and reanalysis data are used for auxiliary analysis.
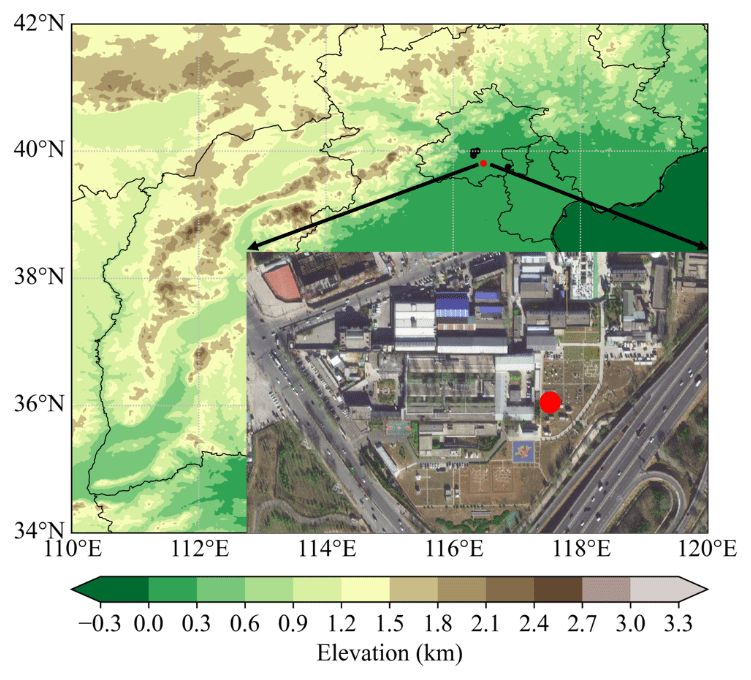
Figure 1Topographic map of the Beijing Meteorological Observation Center (BMOC). The red dot marks the position of PRL observation station, the black dot marks the sun-photometer position, and the lower-right image is the true color image of the BMOC (the true color image of BMOC is available at https://ditu.amap.com/, last access: 14 June 2023).
2.1 Polarization Raman lidar
PRL was deployed at the Beijing Meteorological Observation Center (BMOC; 39.80∘ N, 116.47∘ E) from 22 May 2019 and 20 February 2022 (Fig. 1); it is close to Beijing's 5th Ring Road in the south, with dense traffic and high traffic flow. The PRL was placed in an air-conditioned room equipped with an uninterruptible power supply (UPS) and dehumidifier to detect aerosols over Beijing in continuous mode through a roof skylight, with a temporal resolution of half an hour, approximately 7 min of data collection, and a 23 min interval. The PRL receive system receives 532 nm perpendicular and parallel polarization backscattered signal, 355 nm Mie backscattered signal, and 387 nm nitrogen Raman backscattered signal in both analog and photon counting modes, with a spatial resolution of 7.5 m. More detailed information about the PRL system can be found in our previous study (Wang et al., 2020).
PRL can independently measure the extinction coefficient (EXT355) and backscatter coefficient (BAC355) at 355 nm to determine the LR at 355 nm (LR355). Since the signal-to-noise (SNR) ratio of the Raman channel is quite low, we used a 3 h average PRL backscatter signal profile to retrieve LR355 at night (18:00–06:00 local time) and a 12 h average PRL backscatter signal profile to retrieve LR355 during the day. In addition, a 4-point spatial accumulation followed by a 15-point spatial smoothing was applied on the average PRL backscatter signal profile. Also, an overlap function (Wandinger and Ansmann, 2002) was employed to determine the LR355 for the lower layers. The uncertainty of the overlap correction is too high below 0.25 km; data below 0.25 km were not used for subsequent analysis. The elastic backscatter signal was used to retrieve the EXT532 (Fernald, 1984; Klett, 1981). The Fernald method requires the input of height-dependent LR and reference heights. LR355 is set equal to LR532 (Sugimoto et al., 2002) to retrieve EXT532, and the closest observed LR355 profile is used to constrain the retrieved EXT532. According to Baars et al. (2016), we use the Rayleigh fit and the five criteria given in their appendix to select the optimal reference height. The volume depolarization ratio at 532 nm (VDR532) is retrieved from the ratio of the calibrated perpendicular backscattered signal to the parallel backscattered signal at 532 nm (Freudenthaler et al., 2009; Tesche et al., 2009a), and then PDR532 was derived from VDR532 and BAC532 according to Freudenthaler et al. (2009). Also, the sampled elastic backscatter signal profiles were spatially smoothed by 15 points to reduce the relative error in retrieving EXT532 and PDR532. The PRL-derived aerosol optical depth (AOD) is calculated by integrating the EXT profile from 0.25 to 5 km. Since the aerosols near the ground are not “seen” by the PRL due to the incomplete overlap factor, the average EXT between 0.25 and 0.3 km is employed to fill EXT below 0.25 km, so that AOD will not be grossly underestimated. More details on data retrieval and data validation can also be found in our previous study (Wang et al., 2020).
The relative errors of the retrieved aerosol optical parameters are estimated according to the error propagation law and primarily rely on the SNR of the average PRL backscatter signal profile (Heese et al., 2010), and we excluded signals when the SNR was less than 1, as well as data measured under rain, snow, and low-cloud conditions. Percentages of analyzed PRL measurements from May 2019 to February 2022 are shown in Fig. S1a; the non-analyzed measurements of “shutdown” and “rain or cloud” are due to instrument failure or weather conditions. We filtered out data with relative errors greater than 30 % for PDR532 and greater than 60 % for LR355. For EXT532, data with relative errors greater than 30 % were filtered out when the value was greater than 0.1 km−1, and data with relative errors greater than 100 % were filtered out when the value was less than 0.1 km−1.
The MLH was retrieved using the gradient method (Sicard et al., 2006; Flamant et al., 1997), which is the most classic and widely used method. It gives the MLH as the altitude of the minimum gradient of the range-squared-corrected signal:
P(R) represents the backscatter signal collected by the telescope from the range R. The retrieval range of the gradient method is 0.25–4 km, so the minimum MLH is 0.25 km, and the maximum MLH is 4 km, and a 10-point smoothing of the PRL-derived MLH was applied. All profiles were visually examined, and the MLHs acquired were cross-compared with the pre- and post-heights to ensure the temporal consistency of their evolution. From January 2018 to January 2019, we conducted a study on the aerosol classification of the NCP in farmland about 120 km north of the BMOC (Wang et al., 2021c). We used particle backward trajectories and PRL observations to summarize the aerosol optical parameters in the NCP, which is mainly influenced by two aerosol types; natural dust from the northwest prevailed in spring (March, April, May) and autumn (September, October, November), and anthropogenic aerosols from the NCP were mainly concentrated in summer (June, July, August) and winter (December, January, February). The PDR was found to be the most relevant parameter for aerosol type, and it was used to classify the aerosols. When the PDR is greater than 23 %, it is classified as dust aerosol, and anthropogenic aerosols are determined when the PDR is less than 9 %. When the PDR was between 9 % and 23 %, it was a mixture of dust and anthropogenic aerosols (also called polluted dust). The PRL aerosol classification results are in good agreement with CALIPSO aerosol classification results. The reason the PDR can be used to distinguish between pure dust and polluted dust is that dust mixes with smoke or other anthropogenic aerosols during transport, making the mixed aerosol particles more spherical and resulting in a smaller PDR. The classification of aerosols by the PDR is also widely done in other cities in China (Zhang et al., 2019b; Huang et al., 2015). Therefore, this research still uses the above PDR threshold to classify aerosols.
2.2 AERONET aerosol optical parameters
The sun-photometer-derived aerosol optical parameters were acquired from AERONET (https://aeronet.gsfc.nasa.gov/, last access: 14 April 2023) (Holben et al., 1998; Che et al., 2015, 2019), and data from four sites were collected, namely “Beijing” (39.97∘ N, 116.38∘ E), “Beijing-CAMS” (39.93∘ N, 116.32∘ E), “Beijing_PKU” (39.99∘ N, 116.31∘ E), and “XiangHe” (39.75∘ N, 116.96∘ E). The four AERONET sites around Beijing are shown in Fig. 1. In our study, AOD at 500 nm is utilized to evaluate the representativeness of PRL measurements, and coarse- and fine-mode AOD at 500 nm and coarse- and fine-mode volume concentrations are employed to convert EXT profiles to mass concentration profiles. The monthly average AOD at 500 nm and the conversion factor were obtained by analyzing the sun-photometer-derived aerosol optical parameters around Beijing from May 2019 to February 2022.
2.3 Surface PM10 and PM2.5 mass concentration
The surface PM10 and PM2.5 mass concentrations from 22 May 2019 and 20 February 2022 were downloaded from the Beijing Municipal Ecological and Environmental Monitoring Center (http://beijingair.sinaapp.com/, last access: 14 April 2023). We used the closest observation site to the BMOC (observation number 1005A; 39.97∘ N, 116.47∘ E), about 15 km north of the BMOC. The surface PM10 and PM2.5 mass concentrations were screened before comparison. Firstly, outliers of PM2.5 greater than PM10 were discarded. Then, PM10 and PM2.5 mass concentrations were filtered using the Z score (Barrero et al., 2015). This was achieved by comparing each concentration to the variability of its adjacent points and time series. The filter criteria of the Z score must satisfy three conditions at the same time: (1) the absolute Z score is greater than 4, (2) the increment of the previous value is greater than 9, and (3) the ratio of the value to its central third-order moving average was greater than 2.
2.4 HYSPLIT backward trajectory
The air mass backward trajectories were calculated by the HYSPLIT model, developed by the National Oceanic and Atmospheric Administration (NOAA) and the Global Data Assimilation System (GDAS 1∘) (http://www.ready.noaa.gov, last access: 14 April 2023) (Draxler and Hess, 1998). Considering the significant differences in aerosol mass concentration and types distribution at different altitudes, three trajectory arrival heights were set, 0.1, 2, and 4 km. Hourly, 2 d back trajectories were generated by TrajStat software, which employed HYSPLIT for trajectory calculation. Then, the backward trajectories were clustered from two to four classification directions utilizing MeteoInfo software (http://www.meteothink.org/downloads/index.html, last access: 14 April 2023); detailed information can be found in Wang et al. (2009).
2.5 ERA5 and MERRA reanalysis dataset
In order to filter dust and anthropogenic aerosols' mass concentration profiles at high-RH conditions (>85 %), and to investigate the reliability of the PRL-derived MLH, variables such as RH and boundary layer height (BLH) are needed from the ERA5 reanalysis data of the European Centre for Medium-Range Weather Forecasts (ECMWF). In recent years, several studies have assessed the accuracy of the ERA5 reanalysis data provided by ECMWF based on radiosonde. For example, Luo et al. (2020) found that the mean RH difference below 500 hPa between ERA5 and radiosondes was within 10 %. Guo et al. (2021) found that ERA5 BLH was optimal with the radiosonde BLH by comparing BLH using radiosonde data and various reanalysis data such as ERA5 and MERRA-2 (Modern-Era Retrospective Analysis for Research and Applications, Version 2). The above results show that the RH and BLH of ERA5 reanalysis data have excellent accuracy and have been widely used in various studies. The ERA5 RH profile employed in this paper is divided into 15 layers below 500 hPa, with a temporal and spatial resolution of 1 h and , respectively. To ensure spatial consistency, the RH and BLH data closest to the PRL measurement site were used. In addition, the aerosol optical property data obtained from MERRA-2, including AOD, dust AOD, and black carbon AOD, were also employed in this study, provided by the National Aeronautics and Space Administration (NASA) and the Global Modeling and Assimilation Office (GMAO) (Gelaro et al., 2017).
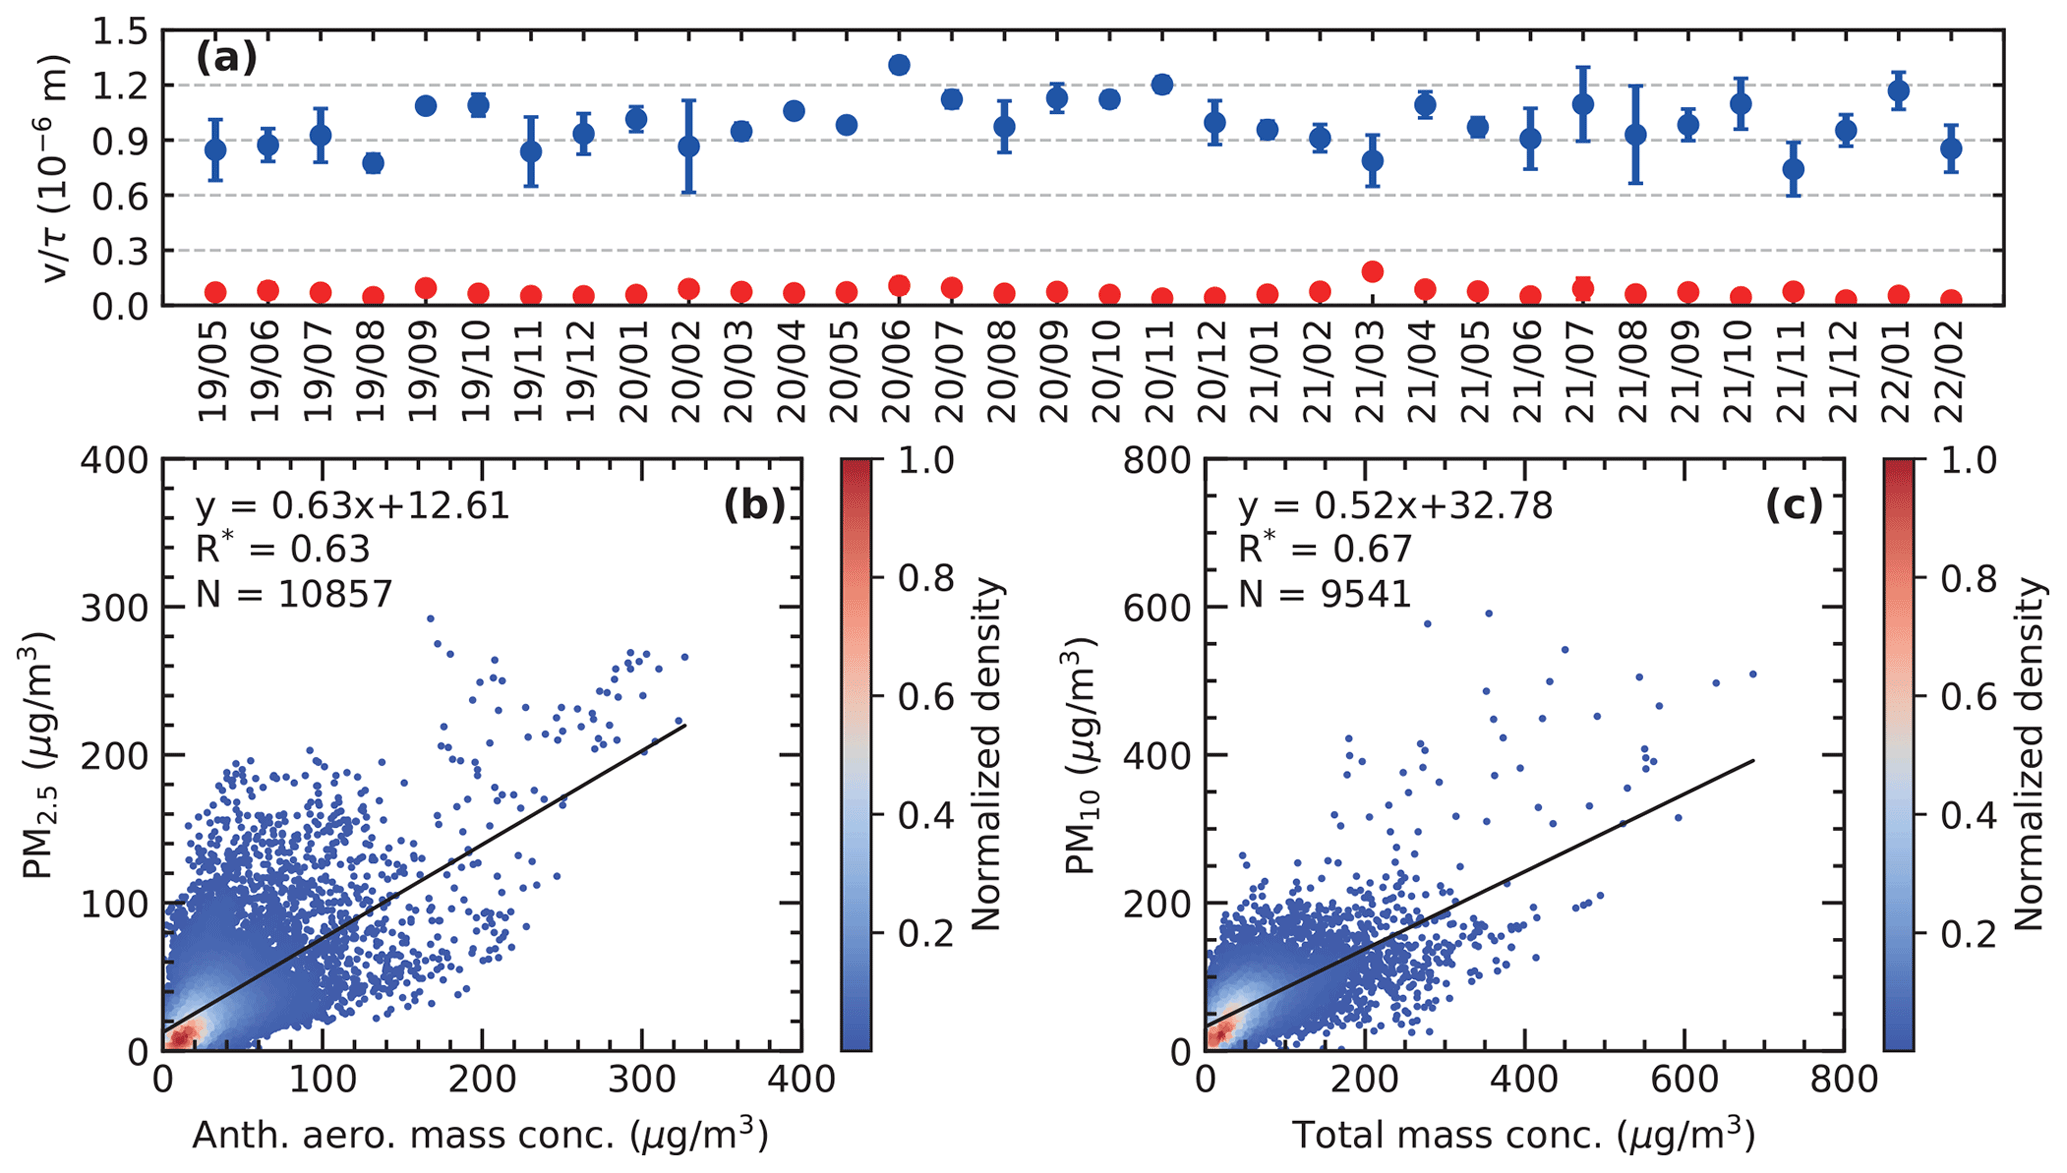
Figure 2Sun-photometer-observed (a) monthly averaged anthropogenic aerosols (blue) and the dust (red) conversion factor from May 2019 to February 2022. Scatter plots show the comparison between (b) surface PM2.5 mass concentration and PRL-derived bottom (0.25 km) anthropogenic aerosols' mass concentration and (c) surface PM10 mass concentration and PRL-derived bottom total mass concentration. The black line is the linear fitting line, and the correlation coefficients are shown at the top left of (b) and (c). N is the number of samples, and the asterisk next to the correlation coefficient R stands for P<0.01.
2.6 Polarization lidar photometer networking (POLIPHON) method
In this study, the POLIPHON method was applied to retrieve dust and anthropogenic aerosols' mass concentration (Sugimoto et al., 2003; Shimizu, 2004; Tesche et al., 2009a, 2011b; Ansmann et al., 2012, 2019). Assuming that dust and anthropogenic aerosols are externally mixed, there are two steps to obtain dust and anthropogenic aerosols' mass concentration with the POLIPHON method. In the first step, the contributions of dust and anthropogenic aerosols to the total BAC532 are separated. Then, EXT532 of dust and anthropogenic aerosols is converted into mass concentration (Ansmann et al., 2012; Mamouri and Ansmann, 2014). The monthly average conversion factors of dust and anthropogenic aerosols are presented in Fig. 2a. The detailed derivation of POLIPHON method and relevant input parameters involved in the POLIPHON method are summarized in the Supplement and Table S1, respectively.
Uncertainties in POLIPHON method are discussed in detail in previous studies (Freudenthaler et al., 2009; Tesche et al., 2009b, 2011a, b; Mamouri and Ansmann, 2014; Mamouri et al., 2015; Wang et al., 2021b; Ansmann et al., 2011; Bravo-Aranda et al., 2015), mainly consisting of two components: the input empirical parameters in Table S1 and the uncertainties of PRL-derived BAC532 and PDR532. In general, the POLIPHON method estimates an uncertainty of 40 % (Ansmann et al., 2011). BravoAranda et al. (2015) compared the POLIPHON method directly with field aircraft measurements and found a relative difference of less than 30 %. In our measurements, the uncertainties of BAC532 and PDR532 below 5 km are 2 %–15 % and 2 %–20 %, respectively. The uncertainty of the retrieved mass concentration is calculated by the law of error propagation. Each input parameter in Table S1 varies within a specified range of values (here we set it as 1 standard deviation), while the other input parameters are set to a fixed value. The sensitivity of the parameters in Table S1 is tested one by one. Combining the uncertainty of BAC532, PDR532, LR, mass density, and conversion factor of dust and anthropogenic aerosols, the uncertainty of mass concentration below 5 km is between 15 % and 70 %.
It must be cautioned that the POLIPHON method is based on the significant difference in particle shape between the two aerosol mixtures. At higher RH, the dust and anthropogenic aerosols' mass concentration separated by POLIPHON method may not be reliable. Firstly, dust and anthropogenic aerosols' mass densities vary with RH, depending on the actual composition of the aerosol mixture. Secondly, the increase in RH may lead to an increase in the conversion factor. Most importantly, the shape of the originally non-spherical particles altered accordingly at high RH. All these changes will lead to an increase in the error of the POLIPHON method. Therefore, scenarios with higher RH (>85 %) must be excluded when retrieving the dust and anthropogenic aerosols' mass concentration (Ansmann et al., 2012, 2011). The RH profile from ERA5 reanalysis data was applied to exclude PRL-derived dust and anthropogenic aerosols' mass concentration profiles under high-RH conditions from May 2019 to February 2022.
To ensure the reliability of the dust and anthropogenic aerosols' mass concentration profiles, the PRL-derived particle mass concentration at 0.25 km was compared with the surface PM10 and PM2.5 mass concentration. Anthropogenic aerosols' mass concentration at 0.25 km was positively correlated with surface PM2.5 mass concentration, with a Pearson correlation R=0.63 (P<0.01; Fig. 2). The total aerosol mass concentration at 0.25 km was compared with the surface PM10 mass concentration and had a Pearson correlation coefficient R=0.67 (P<0.01). Due to the influence of the water vapor effect (Wiegner and Gasteiger, 2015), it is difficult to get completely consistent results in the comparison. Moreover, PM2.5 and PM10 were measured at the ground level 15 km north of BMOC, while dust and anthropogenic aerosols' mass concentration are data at an altitude of 0.25 km above the BMOC. Overall, it can be seen from the significant positive correlation in Fig. 2 that the POLIPHON method can reliably estimate the dust and anthropogenic aerosols' mass concentration in Beijing.
The data presented here were obtained in Beijing, China, by PRL, sun-photometer, and reanalysis data over the period from 22 May 2019 to 20 February 2022. Since PRL data were missing from 16 November 2020 to 29 May 2021 due to laser failure, the sun-photometer observations are used to demonstrate the representativeness of PRL measurements, by statistical comparison of sun-photometer and PRL AOD. Once the representability of the PRL data has been demonstrated, the annual cycle of the AOD and MLH can be analyzed and discussed, as well as the mean vertical profile of the dust and anthropogenic aerosols retrieved by the POLIPHON method.
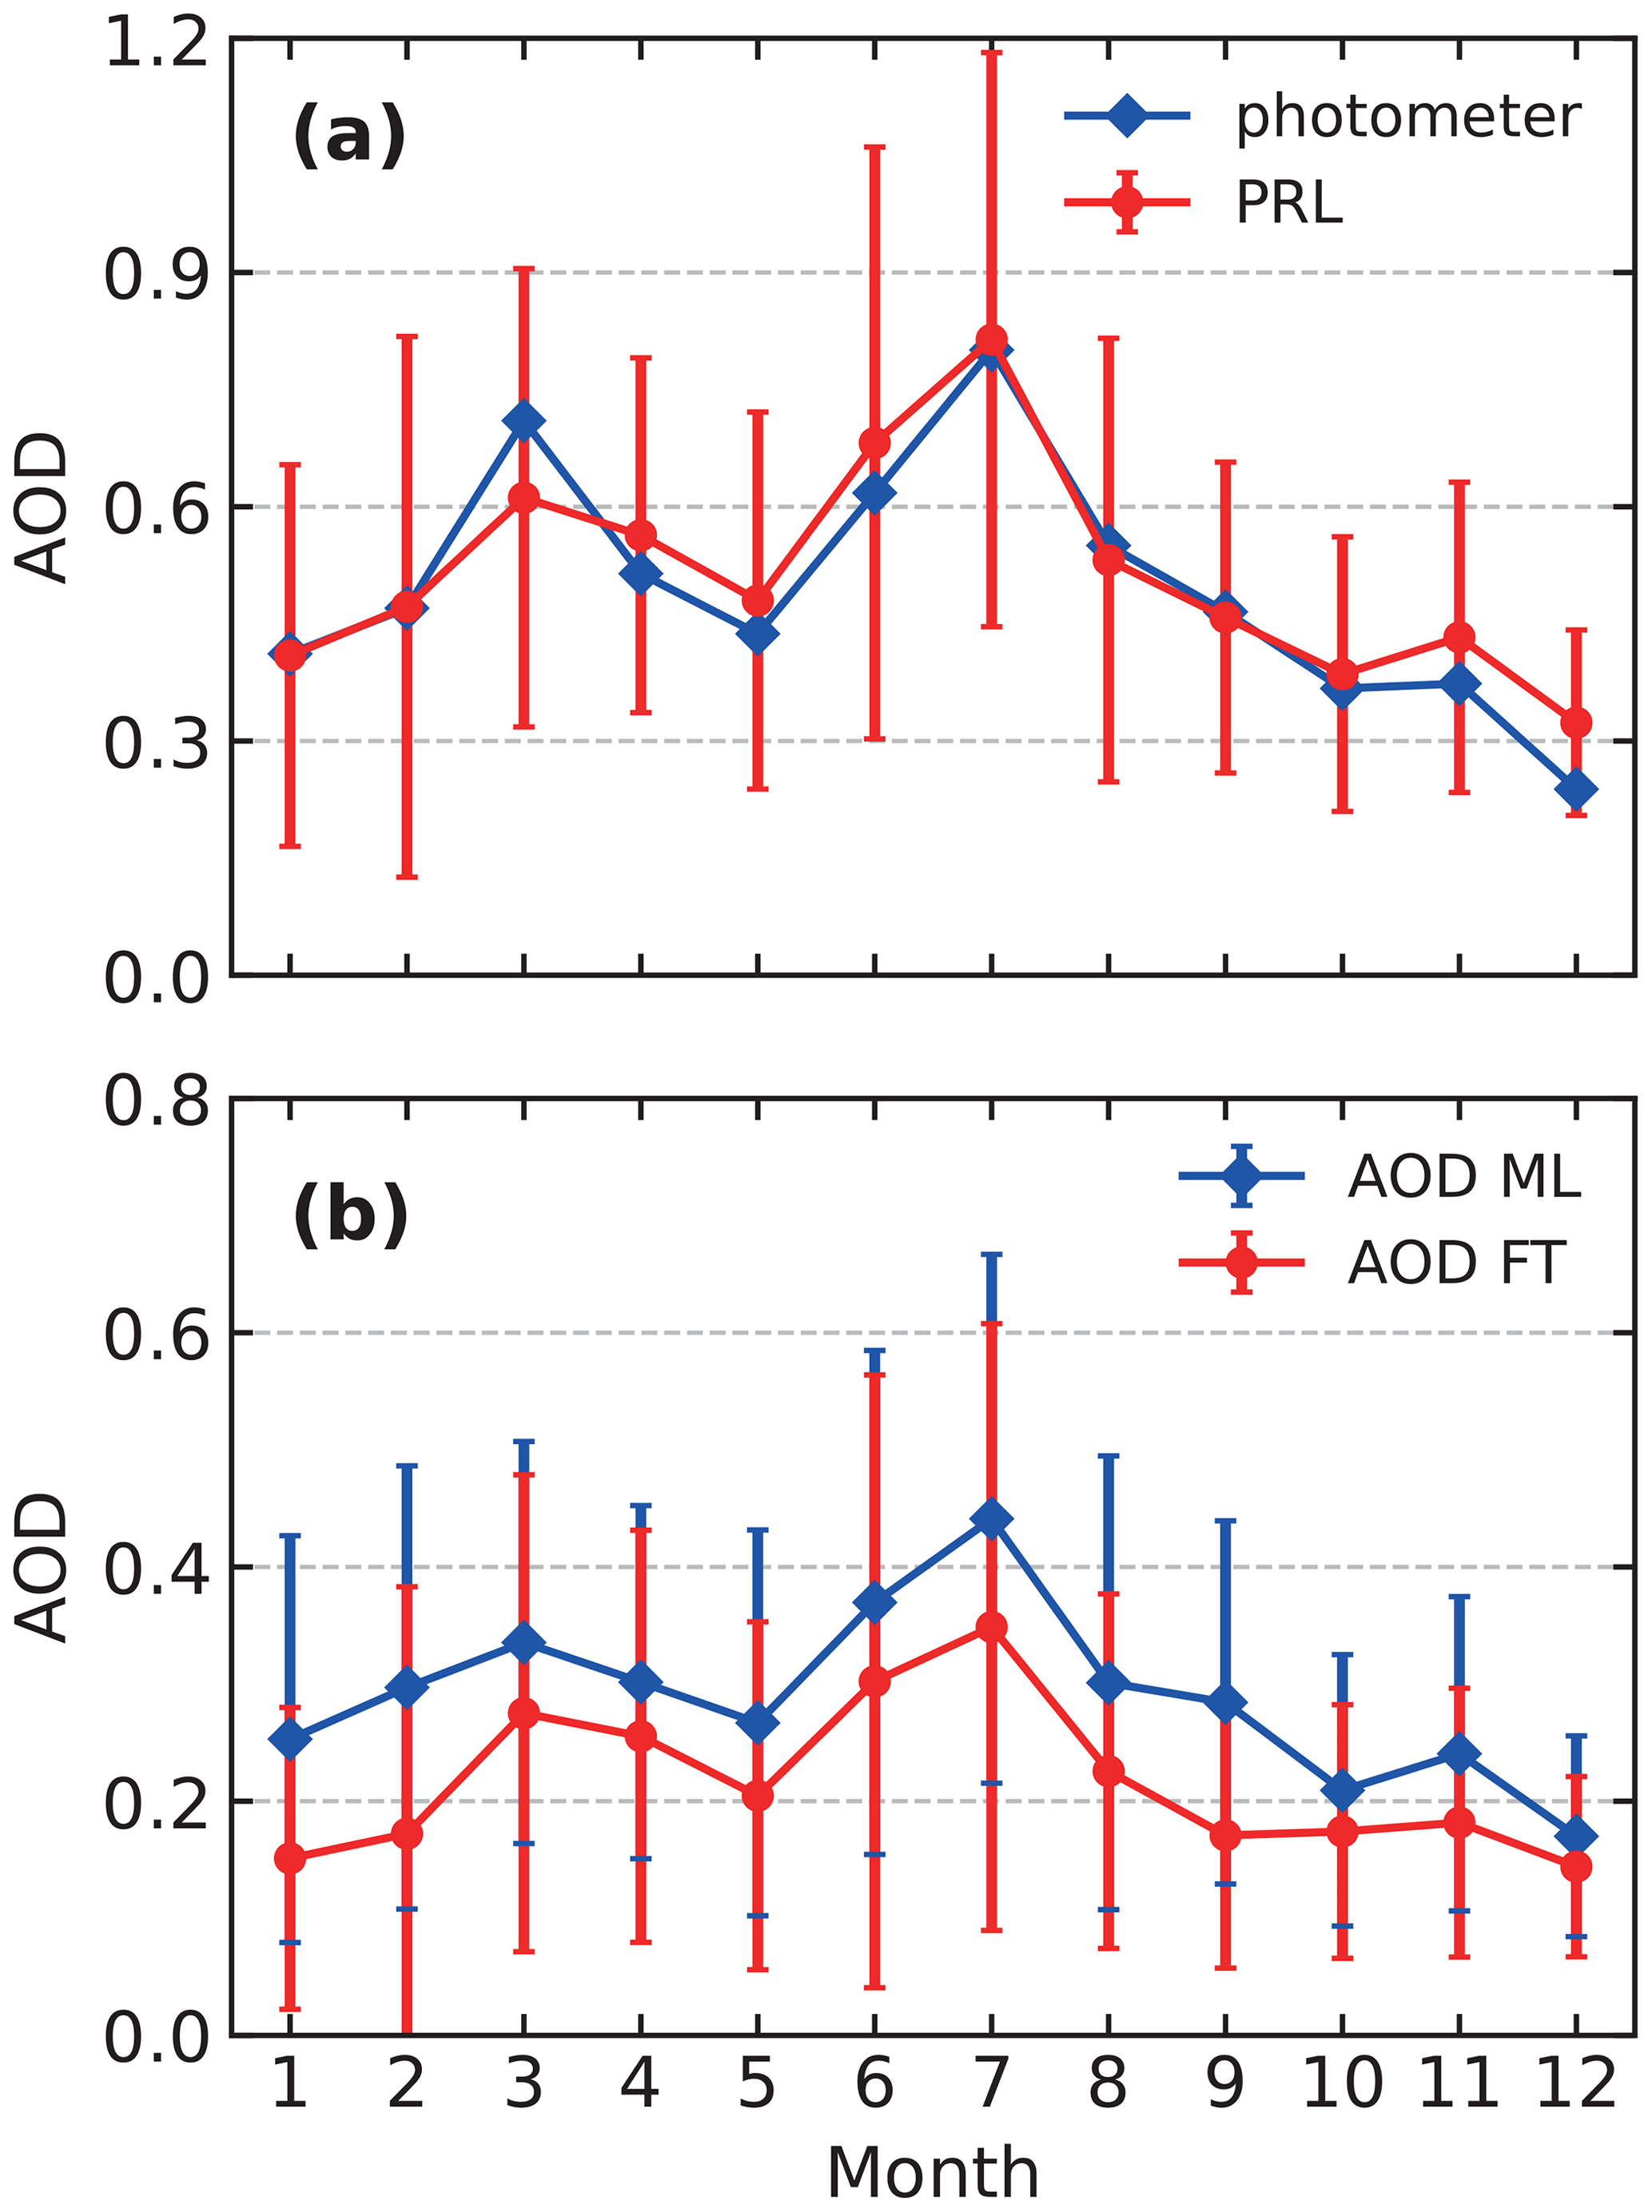
Figure 3Annual cycle of the AOD at 532 nm: (a) PRL-derived and sun-photometer-measured AOD and (b) PRL-derived AOD in the mixing layer (ML) and free troposphere (FT). The envelope over the vertical bars represents 1 standard deviation.
3.1 Annual cycle of AOD
Figure 3a is intended to demonstrate the representativeness of PRL measurements on a statistical basis. This is achieved by comparing the annual cycle of PRL-derived AOD and sun-photometer-measured AOD; the error bar in PRL-derived AOD is calculated as 1 standard deviation. Figure 3a qualitatively and quantitatively shows an excellent agreement between the two datasets, with a Pearson correlation and root mean square error (RMSE) of 0.96 (p<0.01) and 0.018, respectively. The Ångström exponent was employed to convert the sun-photometer-measured AOD at 500 nm to AOD at 532 nm. Although the number of PRL measurements was statistically low, the monthly AOD was similar for both datasets. This result reinforces the representativeness of PRL measurements because it shows that the range of the PRL-derived monthly AOD set is comparable to that of the sun photometer. The difference in the monthly mean AOD between the sun photometer and the PRL ranges from 0.002 to 0.14, with the largest difference occurring in March, where the PRL-derived AOD is 0.14 (18 %) smaller than the sun photometer's AOD, which may be due to the absence of PRL measurements in March 2021. Two mega dust events occurred in March 2021 in Beijing, with the recorded peak AOD at 500 nm larger than 2.5 measured by the sun photometer; the satellite data registered these two massive dust events as the most intense episode at the same time in history over the past 20 years (Gui et al., 2022).
The PRL-derived annual mean AOD is 0.50 ± 0.29 at 532 nm. The annual variation of PRL-derived AOD showed a bimodal feature, with the first peak in March (0.61 ± 0.29), the second peak in July (0.81 ± 0.37), and a minimum AOD in December (0.32 ± 0.12); sun-photometer observations also reveal a similar annual cycle. The high-loading aerosols in July and March are primarily due to long-range transport air pollutants such as Asian dust (more frequent in March) and anthropogenic aerosols (more frequent in July) (Wang et al., 2021c). Figure 3b shows the PRL-derived AOD in the ML and FT. ML AOD is obtained by integrating the EXT profile from the ground to the top of the MLH, while FT AOD is obtained by integrating the EXT profile from the top of the MLH to 5 km. The error bar associated with the monthly mean AOD shows the 1 standard deviation. There are three interesting features in Fig. 3b as follows:
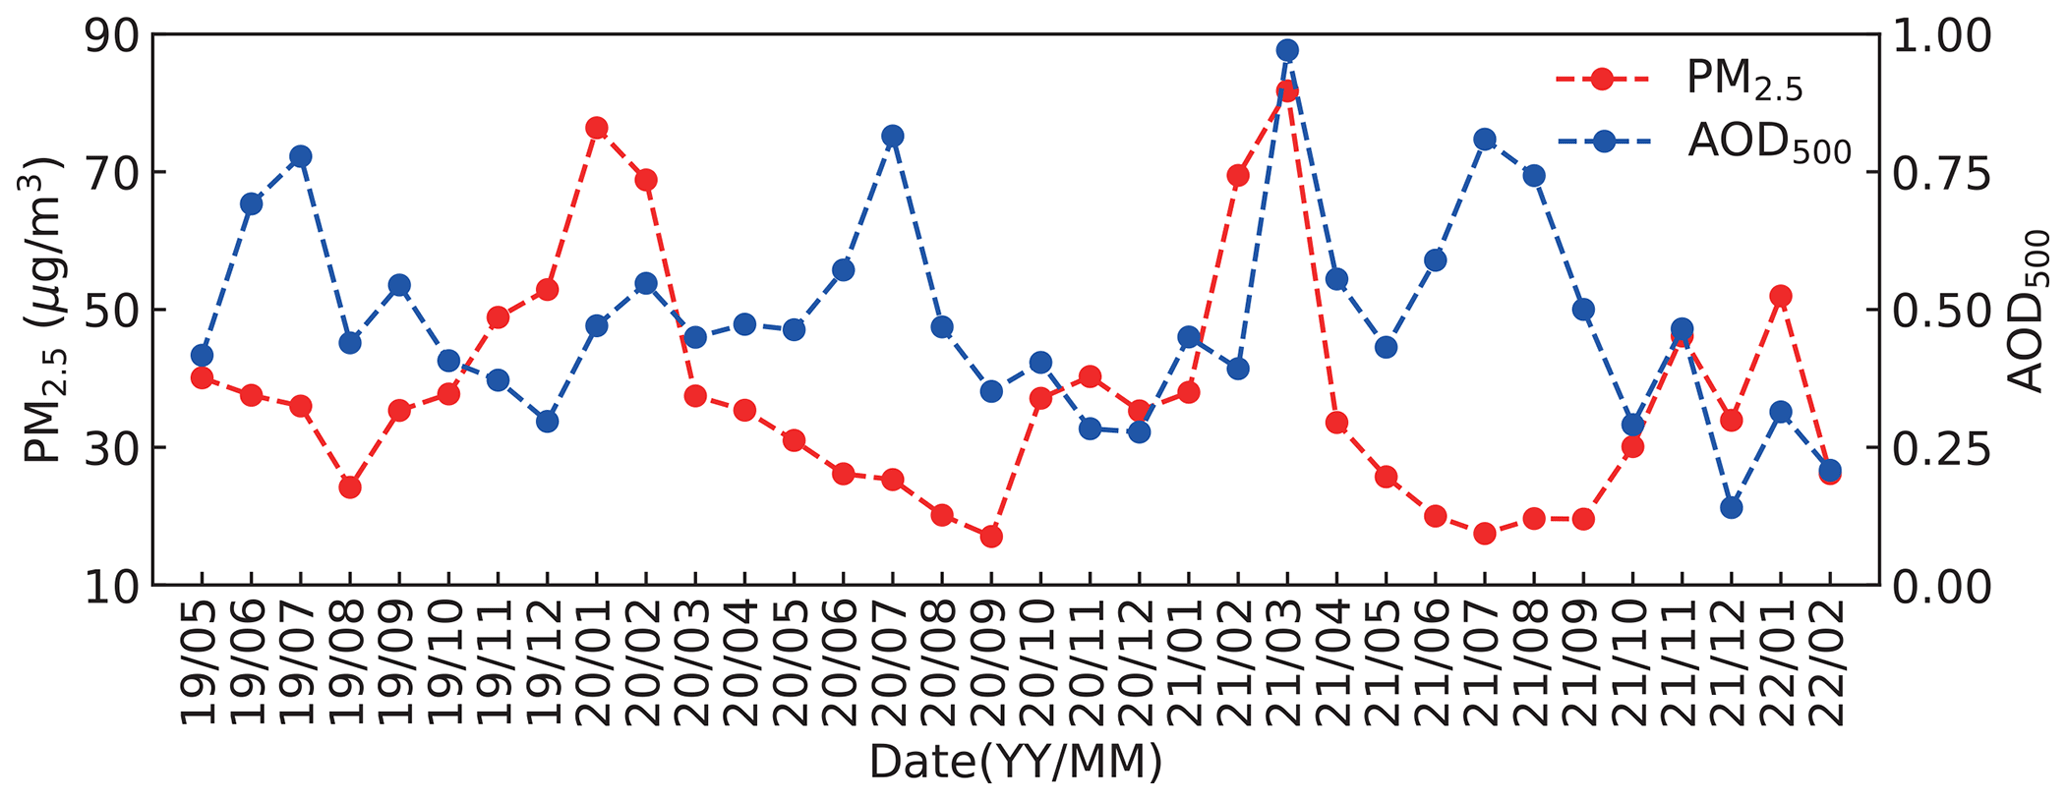
Figure 4Surface monthly mean PM2.5 mass concentration collected from the Beijing Municipal Ecological and Environmental Monitoring Center and AOD at 500 nm measured by the sun photometer from May 2019 to February 2022.
-
FT AOD ranges from 0.14–0.35, implying the presence of aerosol layer above the ML all year round, and FT AOD increases significantly in March and July, which emphasizes the frequent long-range transport of dust and anthropogenic aerosols in spring and autumn.
-
The annual cycle of the ML AOD and FT AOD is almost identical (Pearson correlation R=0.90, P<0.01), exhibiting a bimodal shape with the primary peak (0.44 ± 0.23 in ML and 0.35 ± 0.26 in FT) and secondary peak (0.34 ± 0.17 in ML and 0.28 ± 0.20 in FT) in July and March, respectively. This is a very intriguing result because ML AOD and FT AOD may be regulated by the same mechanisms, such as the regional transport of aerosols. Also note that ML AOD is consistently higher than FT AOD, with more aerosols concentrated within the ML.
-
The annual cycle of AOD observed by the PRL and sun photometer showed the highest level in summer and the lowest in winter, while the surface observation showed diametrically contrary conclusions (Fig. 4). Due to the difference in atmospheric diffusion capacity, high surface PM2.5 concentrations typically occur in winter and the lowest in summer. This implies a high load of aerosols in the upper air of Beijing, which will be discussed in detail in Sect. 3.3.2. An opposite annual cycle of air pollution at the surface and in the whole layer also provides motivation for further investigation of the potential relationship between surface PM2.5 levels and columnar AOD.
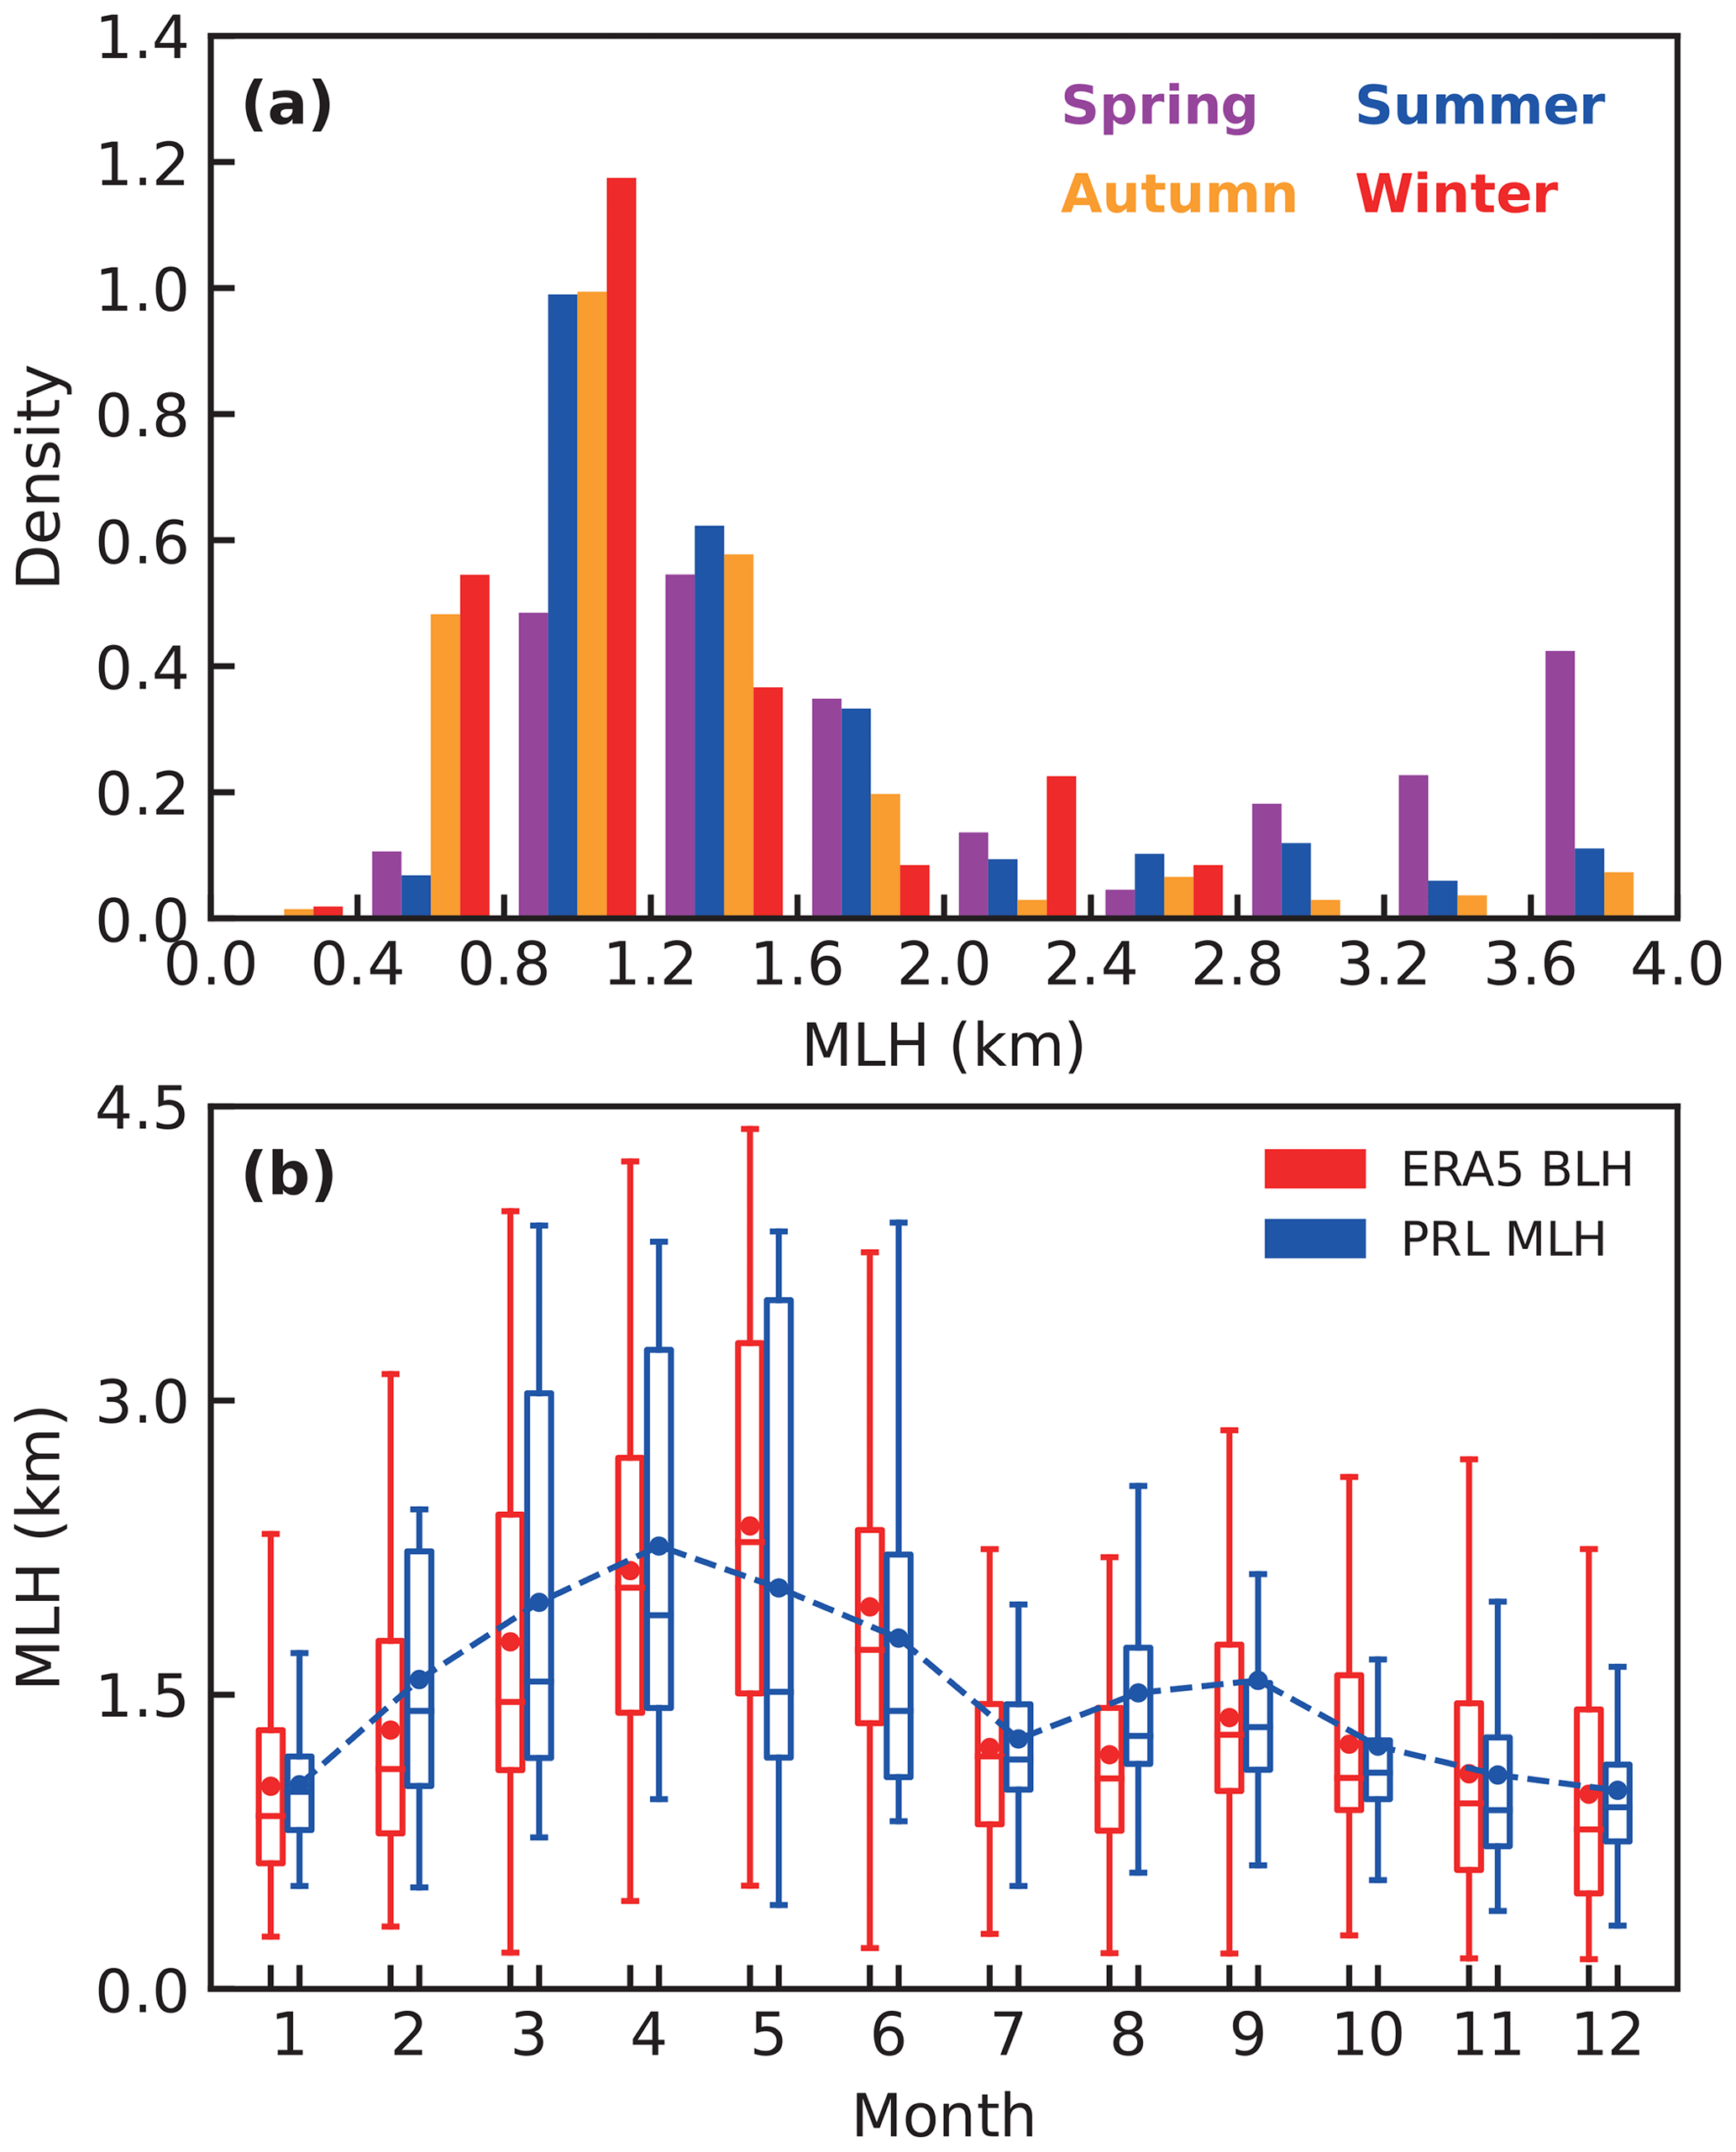
Figure 5Seasonal density distribution of (a) the PRL-derived MLH and (b) the annual cycle of the PRL-derived MLH and BLH in ERA5 reanalysis data. Note that the MLH and BLH are the monthly mean values at 15:00 LT. The box-and-whisker plots show the 5th, 25th, 50th, 75th, and 95th percentiles, and the dots represent the monthly mean MLH.
3.2 Seasonal variability of the MLH, PDR532, and LR355
The MLH illustrates the relationship between the intensity, duration, and extent of air pollution. The maximum MLH in Beijing usually appears at 15:00 local time (LT), so this study focuses on analyzing the characteristics of the MLH at 15:00 LT (Wang et al., 2021a). To investigate the reliability of the PRL-derived MLH, we used the daily and monthly BLH reanalysis data at 15:00 LT from ERA5 to obtain a linear fit with the PRL-derived MLH. The daily and monthly Pearson correlation coefficient between two sequences is 0.78 and 0.92, respectively (Fig. S2), which passed the significance test at the p=0.01 level.
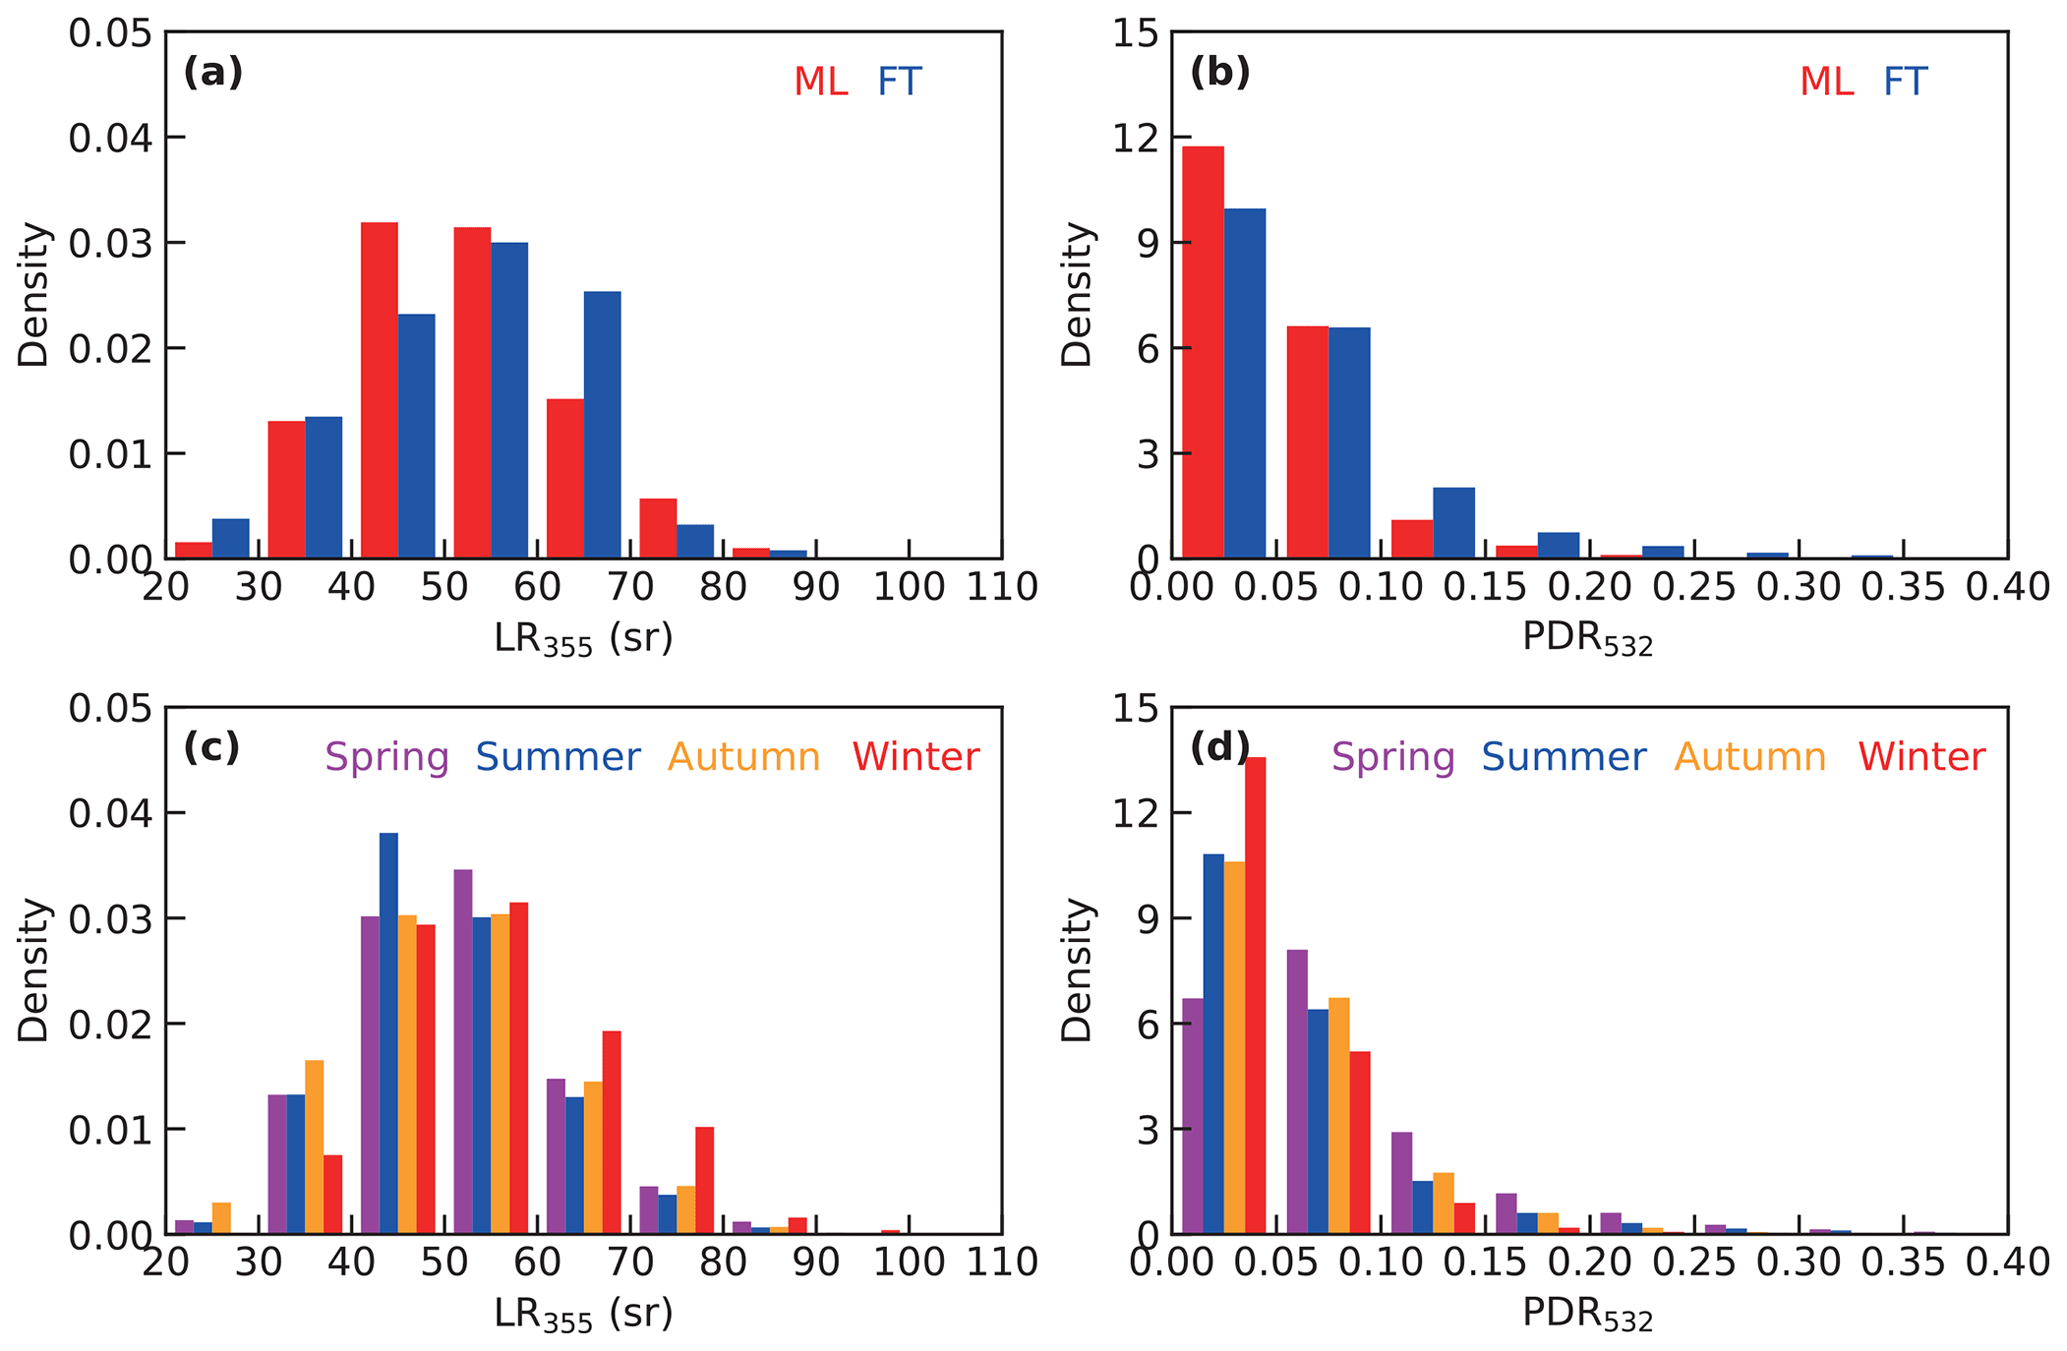
Figure 6Density distribution of PRL-derived aerosol optical parameters: (a) ML LR355 and FT LR355 and (b) ML PDR532 and FT PDR532. Seasonal density distribution of (c) LR355 and (d) PDR532.
Since the nighttime BLH of ERA5 is extremely low, at only tens of meters, the lowest detection height of PRL is 0.25 km. The MLH data retrieved by PRL were employed to investigate the monthly variation characteristics of the MLH in Beijing from May 2019 to February 2022. Figure 5 shows the seasonal density distribution and annual cycle of the MLH. The monthly mean MLH is highest in spring (2.11 ± 1.04 km) and lowest in winter (1.17 ± 0.51 km), and the monthly mean MLH in summer and autumn is 1.59 ± 0.79 km and 1.28 ± 0.68 km, respectively. The monthly mean MLH in autumn usually ranges from 0.91 to 1.43 km, and it is rare for the MLH to be above 2 km. While the MLH in spring is widely distributed (1.24–3.30 km), the high MLH (>2 km) in spring is mainly due to the strengthening of surface wind speeds (Guo et al., 2016; Su et al., 2018). The MLH in summer is mainly distributed between 1.04 and 1.9 km, and the intense solar radiation leads to a maximum MLH of 3.907 km in summer. The MLH in winter usually ranges from 0.81 to 1.31 km, and the high MLH (>2 km) in winter usually occurs in scenarios when strong northwesterly winds are prevalent. Figure 5b shows the 5th, 25th, 50th, 75th, and 95th percentile box plots and the monthly mean MLH in Beijing from May 2019 to February 2022. The monthly mean MLH increased from January to April and showed the first peak in April (2.26 ± 0.94 km), followed by a decline, reaching a minimum in July (1.27 ± 0.41 km). The high and fluctuating MLHs in March, April, and May are mainly attributed to the dynamics of strong winds, although the surface temperature was not high. Cloud and rain prevailed in July and August, especially in July, and less surface solar radiation and lower wind speed (Guo et al., 2016; Wang et al., 2021a) depress the elevation of the daytime MLH. The MLH reaches its second peak (1.57 ± 0.81 km) in September due to the strong solar radiation (Miao et al., 2015), while the height is significantly lower than the MLH in May. In November and December, the weak thermal convection and wind speed result in a relatively lower MLH.
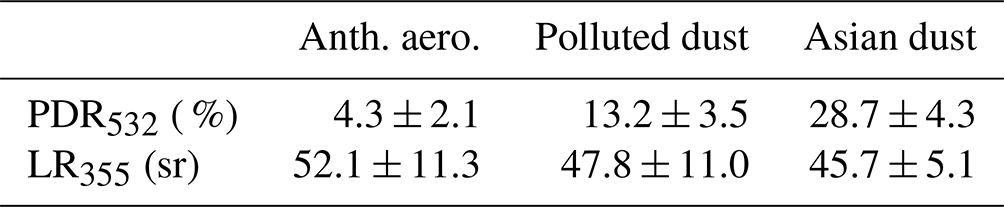
Table 1Annual and seasonal means and 1 standard deviation (calculated with ML estimation) of the PDR532 and LR355.
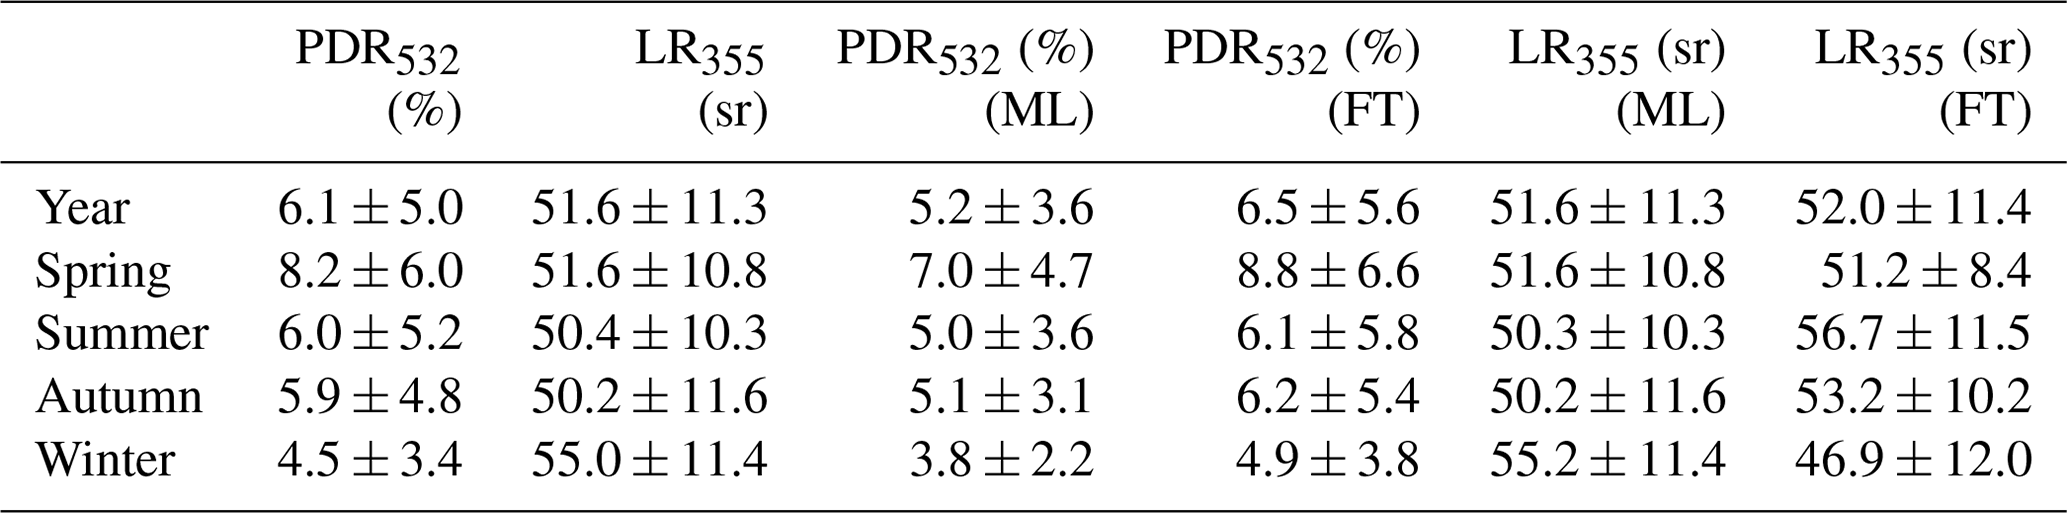
The PDR532 and LR355 seasonal, ML, and FT density distribution from May 2019 to February 2022 are shown in Fig. 6. The broad distributions of seasonal, ML, and FT PDR532 and LR355 indicate the occurrence of very diverse aerosol conditions, including complex aerosol mixtures of anthropogenic and natural aerosol types and compositions. According to Cui et al. (2022), the major fine atmospheric particles sources in Beijing include residential coal, residential biomass, industrial combustion, and industrial process and vehicles' emission, and in addition to all local sources, long-range transport of east Asian dust and anthropogenic pollution from the NCP also contributes to the observed complexity of aerosol mixtures (Wang et al., 2016). As seen in Fig. 6, the PDR532 ranges from values in pure anthropogenic aerosol pollution conditions (0 % to 9 %) to typical values in heavy dust outbreak conditions (up to 39 % at 532 nm). Also, the values of LR355 are between 19 and 96 sr and cluster around 46–61 sr. All mean values and 1 standard deviations of the PRL-derived PDR532 and LR355 are summarized in Table 1. The maximum and minimum values of PDR532 occurred in spring (8.2 % ± 6.0 %) and winter (4.5 % ± 3.4 %), respectively, and the maximum and minimum LR355 values occurred in winter (55.0 ± 11.4 sr) and autumn (50.2 ± 11.6 sr). The value of FT LR355 in the summer is slightly larger than that in ML, while in winter, the value of ML LR355 is considerably higher than that in FT. The values of ML LR355 in winter and FT LR355 in summer are about 55 sr, which is a typical value for anthropogenic aerosols. Moreover, the values of ML PDR532 in winter and FT PDR532 in the summer are 6.1 % ± 5.8 % and 3.8 % ± 2.2 %, respectively, which indicates that anthropogenic aerosols accumulate in the ML in winter and the FT in summer.
3.3 Annual cycle of aerosol vertical profiles
The POLIPHON method allows the conversion of aerosol EXT profiles into dust and anthropogenic aerosols' mass concentration profiles. Vertical profiles of the monthly mean aerosol parameters are shown in Fig. 7, including EXT532, PDR532, POLIPHON-method-retrieved anthropogenic aerosol and dust mass concentration, LR355, and the fraction of dust mass concentration. These monthly mean profiles are the average of a certain number of mutually uncorrelated individual profiles, some of which may contain aerosols only in the ML, while others may contain several aerosol layers in/above the ML. The number of points averaged at different heights is shown in Fig. S1b, excluding cases where the monthly average number of points is less than 1000.
3.3.1 EXT532, PDR532, and LR355
The EXT532 profile exhibits a clear seasonal variation (Fig. 7a). In autumn and winter, the lowest aerosol layer is shallower and has a higher value between 0.19 and 0.32 km−1, and then the EXT532 drops sharply with the increase in altitude. The variation of EXT532 profiles in autumn and winter is mainly explained by meteorological conditions, the lower height of the inversion layer (usually less than 1.5 km), and the ML that is weakly developed (Fig. 5); particles are hard to transport to the upper level. The EXT532 profile in summer is highest in the range of 0.36–0.96 km, with values between 0.27–0.42 km−1, and then EXT532 decreased slowly with increasing altitude. In spring, due to strong wind speed (Guo et al., 2016), the aerosol was lifted to a higher height and then gently decreased. The monthly mean EXT532 profile shows that the highest mean EXT532 is found in July (within the height range of 0.36–0.96 km), and the monthly mean EXT532 in July gradually increases from 0.33 km−1 at 0.25 km to a maximum value of 0.43 km−1 at 0.56 km. EXT532 was lowest in December, with a relatively superficial and thin aerosol layer gathering in the lowest layer (about 0.19 km−1). The evolution of the monthly mean EXT532 profile is also consistent with the previous observations (Zhang et al., 2023b). We further analyzed the top height of the aerosol layer; the top height of the aerosol layer is determined at points where the EXT532 values were below 0.01 km−1. A similar trend was found between the top height of the aerosol layer and the MLH. An extremely high aerosol layer is found in April, May, August, and September (more than 5 km) and the lowest in January (about 3.4 km), implying that the vertical diffusion capacity of aerosols in Beijing is mainly influenced by the MLH.
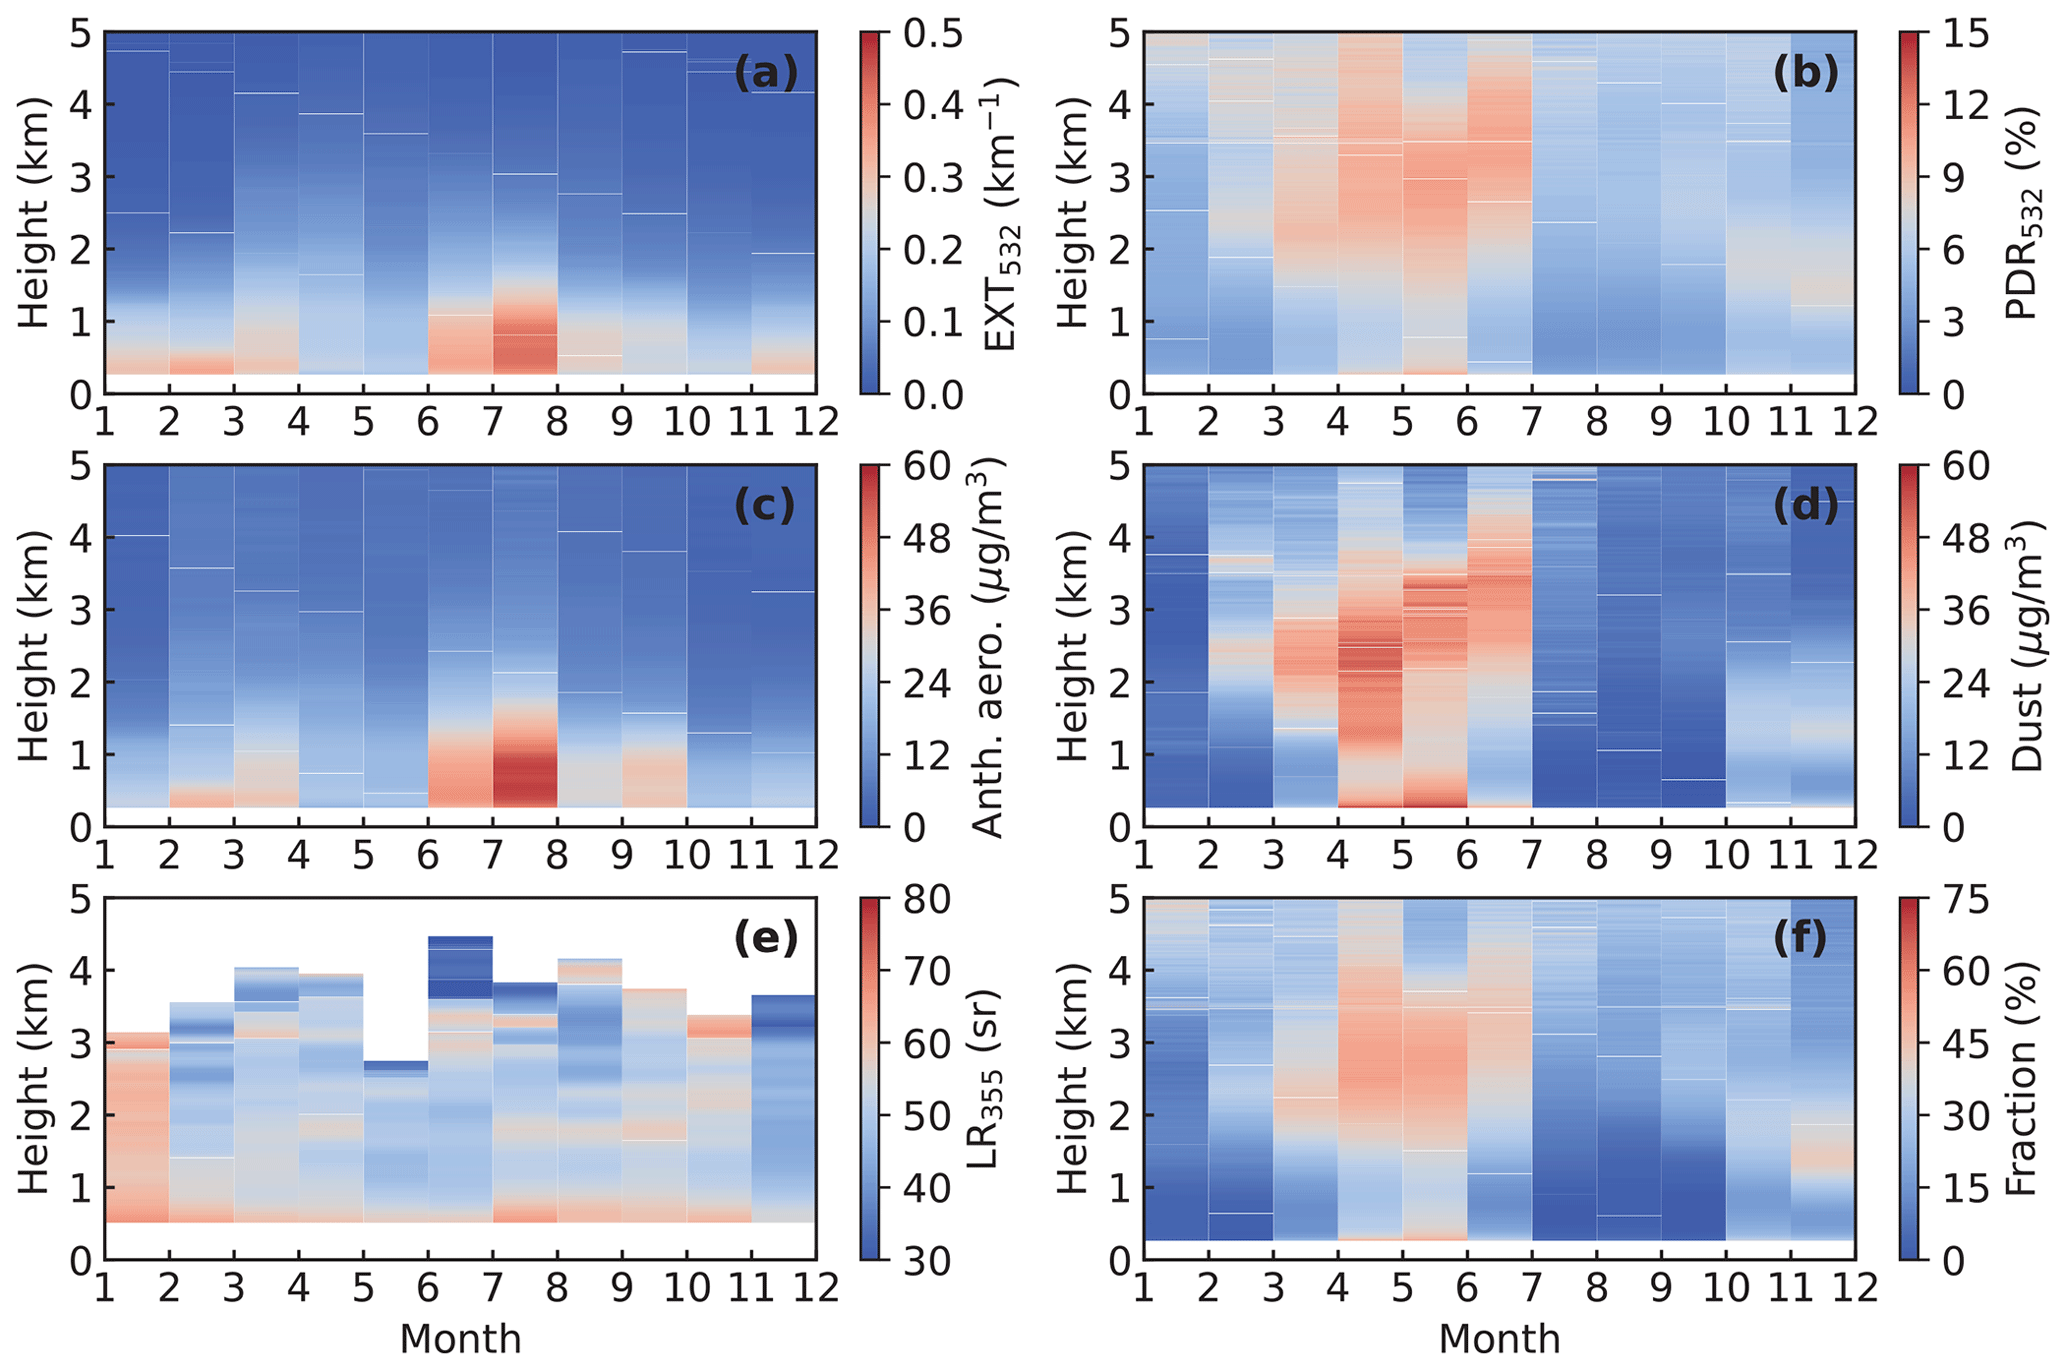
Figure 7Vertical profiles of the monthly mean aerosol optical parameters: (a) EXT532, (b) PDR532 (c) anthropogenic aerosols' mass concentration, (d) dust mass concentration, (e) LR355, and (f) fraction of dust mass concentration in total aerosol mass concentration in Beijing from May 2019 to February 2022.
The PDR532 profile exhibits considerably different seasonal variations than the EXT532 profile (Fig. 7b). In January, February, July, August, and September, the monthly mean PDR532 in the bottom layer (0.25 km) was extremely low (less than 5 %), indicating that the lower atmosphere of Beijing was almost unaffected by dust during this period. The monthly mean PDR532 is highest in April and May, with values around 0.10 at 0.25 km, and the value of PDR532 is between 8 %–12 % in the range of 1.6 to 4.1 km. The high PDR532 values in spring are primarily impacted by the long-range transport of Asian dust. Under the influence of the spring cold front, dust from East Asia (particularly over the Taklimakan Desert and the Gobi Desert) is easily lifted into the FT and transported eastward, affecting the air quality in Beijing (Gui et al., 2022; Miao et al., 2015).
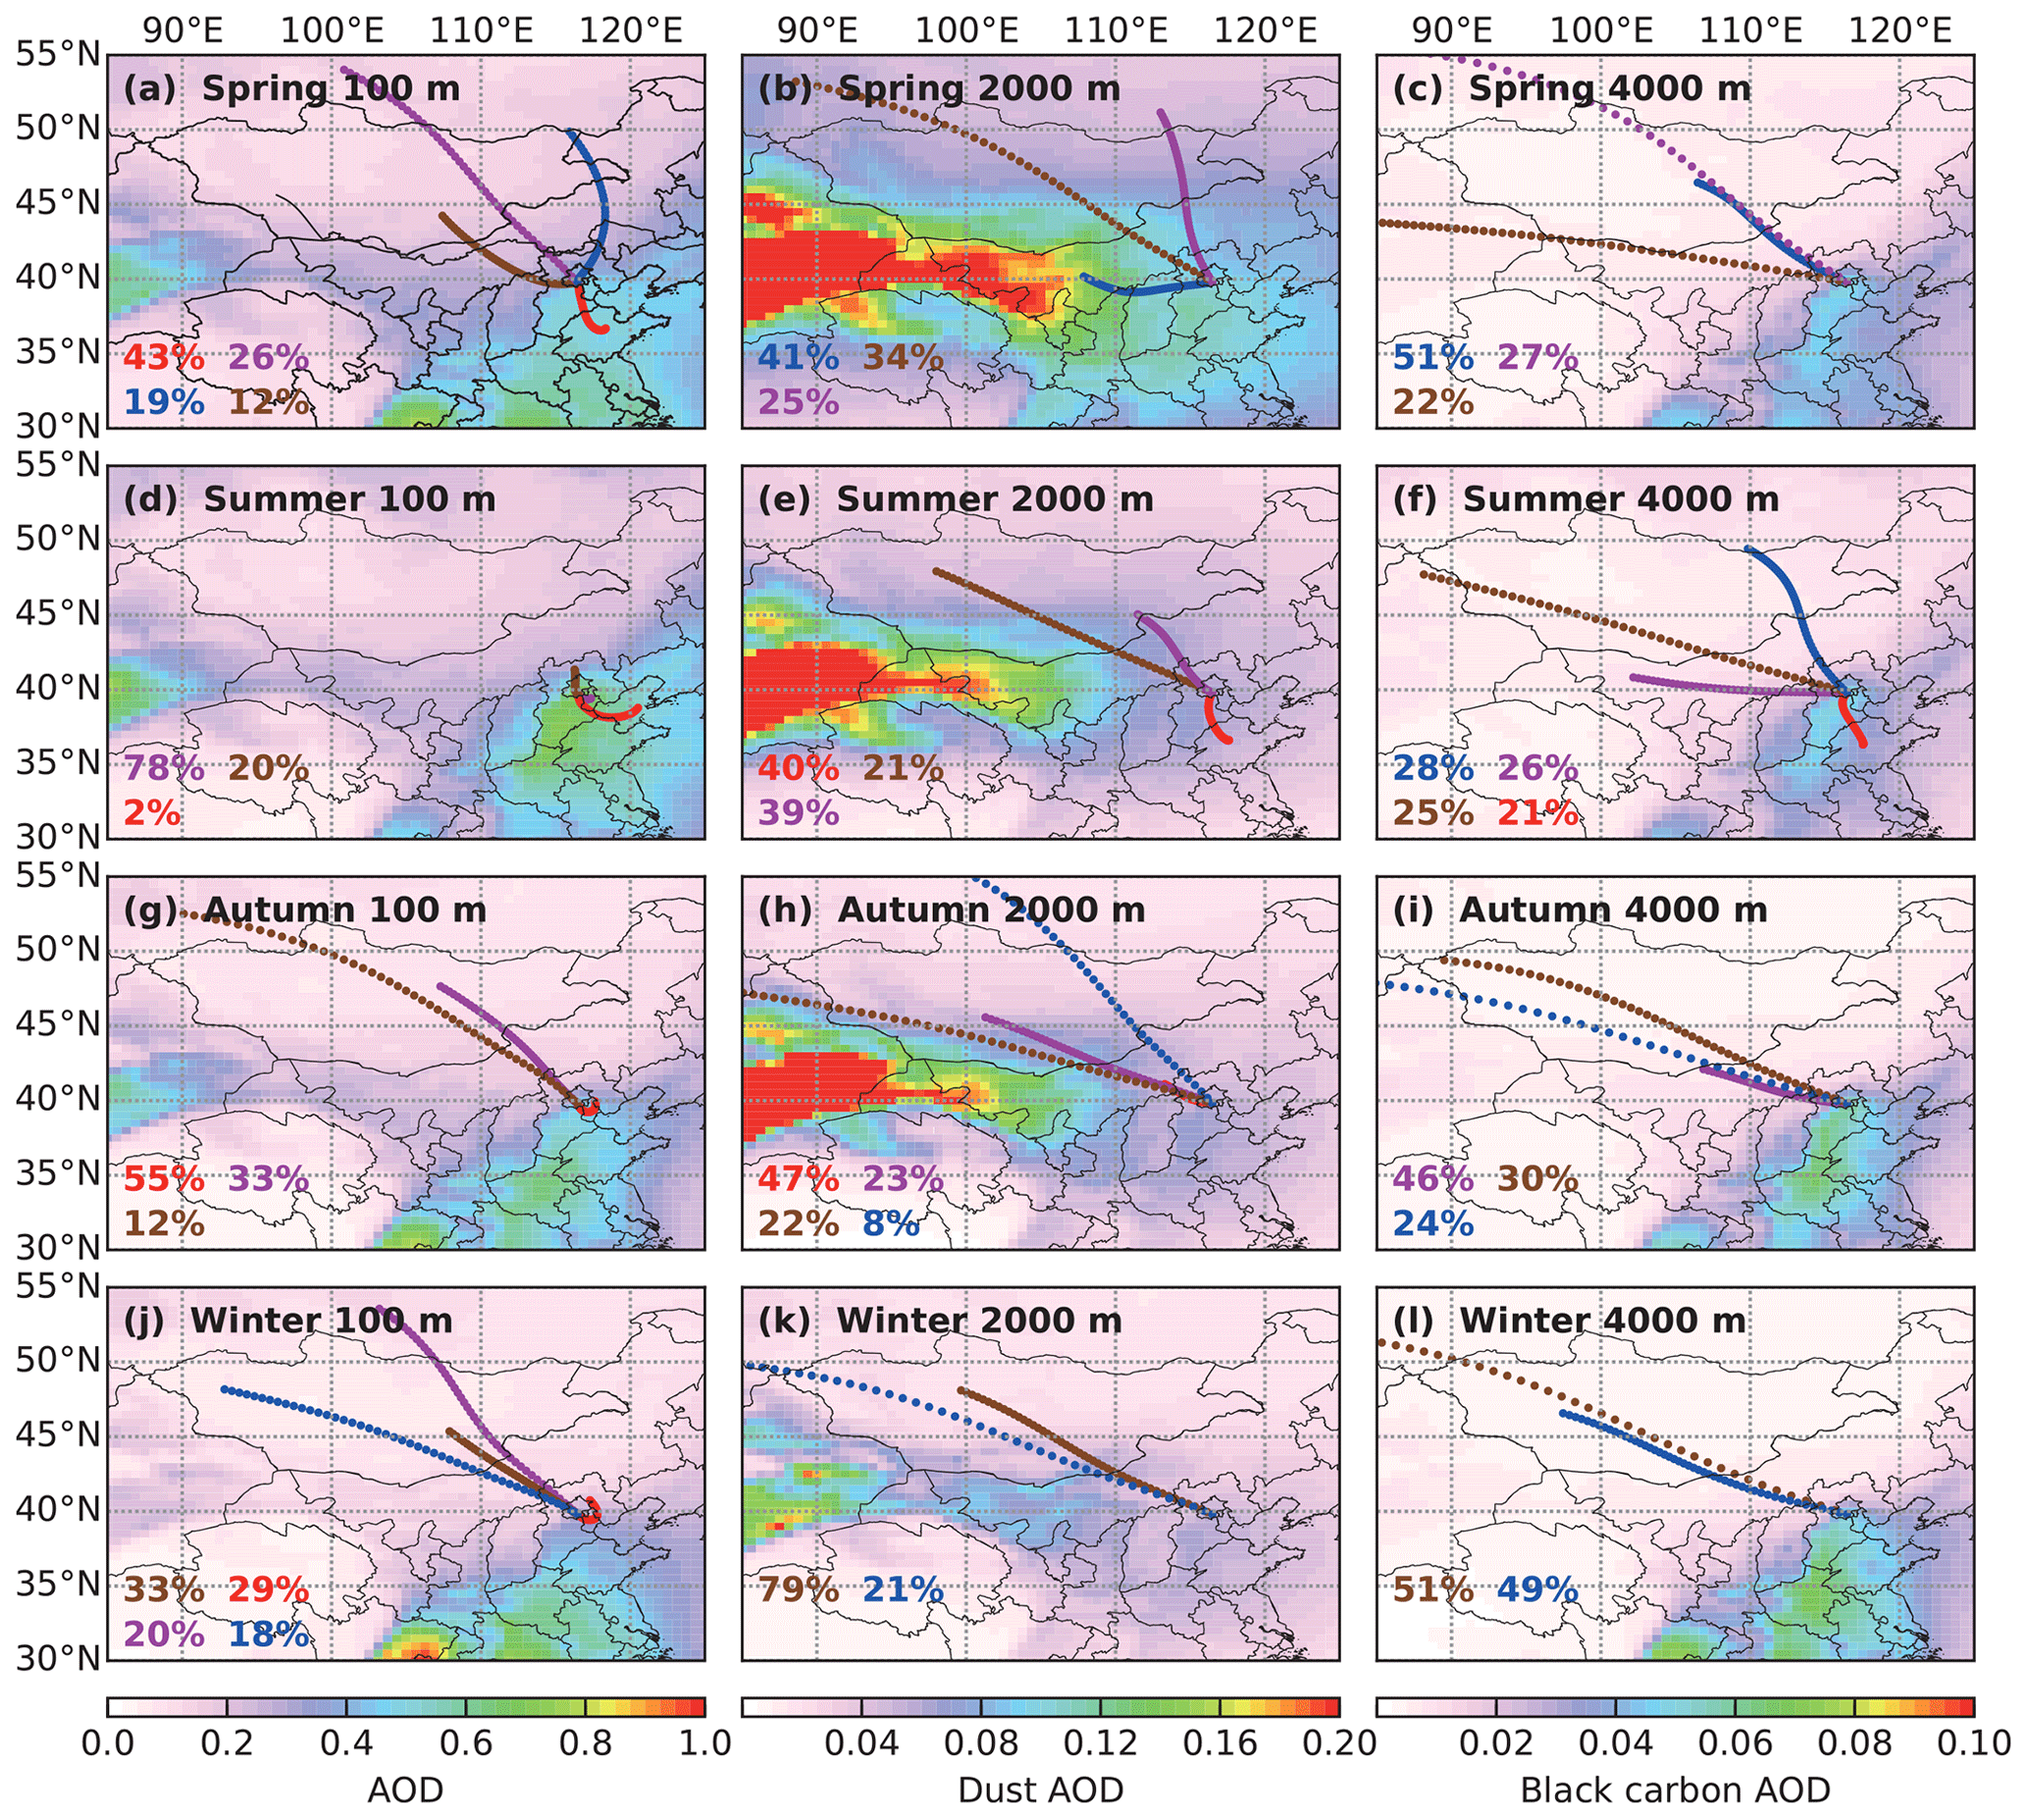
Figure 8Cluster analysis of seasonal 48 h air mass backward trajectories in Beijing from May 2019 to February 2022: initialized at (a) 100 m, (b) 2 km, and (c) 4 km in spring; initialized at (d) 100 m, (e) 2 km, and (f) 4 km in summer; initialized at (g) 100 m, (h) 2 km, and (i) 4 km in autumn; and initialized at (j) 100 m, (k) 2 km, and (l) 4 km in winter. We calculated the hourly air mass backward trajectories during each season. Then, cluster analysis was carried out in two to four category directions. The percentages at the bottom right of each panel indicate the percentage of each backward trajectory. The color in each panel indicates the AOD, dust AOD, and black carbon AOD for each season obtained from the MERRA-2 global reanalysis data.
The LR355 provides the possibility to estimate the properties and sources of the measured aerosols (Fig. 7e). Monthly mean LR355 is highest in January; this is because Beijing is rarely affected by dust aerosol in January. Moreover, building heating leads to a high emission of absorbing air pollutants in January in Beijing (Zheng et al., 2019). The MERRA-2 global reanalysis data also show a higher concentration of black carbon in Beijing in winter (Fig. 8), which is consistent with the PRL observations. The monthly mean LR355 profile of the whole year reveals that the monthly mean LR355 is high below 2 km and has little change with a value of 52–64 sr. However, the monthly mean LR355 profile above 2 km varies dramatically from 35 sr (more scattering) to 67 sr (moderate absorption), indicating the complexity of airborne particles transport in Beijing, the presence of more species, and relatively more aging aerosol layers.
3.3.2 Anthropogenic aerosols
The annual cycle of anthropogenic aerosols' mass concentration retrieved by the POLIPHON method is analogous to that of EXT532 (Fig. 7c), with the lowest anthropogenic aerosols' mass concentration in December, less than 15 µg m−3 in the range of 0.25 to 5 km. The monthly mean anthropogenic aerosols' mass concentration in October, November, and January was comparable; there was a thin aerosol layer below 1.4 km (about 23 µg m−3 at 0.25 km), which is due to the weak solar radiation and the low MLH in autumn and winter (Fig. 5b), inhibiting the upward uplift of particles. From February to May, the MLH gradually rises due to the gradual increase in surface wind speed and solar radiation, and the distribution of aerosol layer also rises significantly, while the monthly mean anthropogenic aerosols' mass concentration at 0.25 km gradually decreases, from 40 µg m−3 in February to 22 µg m−3 in May. In June and July, the largest monthly mean anthropogenic aerosols' mass concentration and the widest aerosol distribution altitude were found, especially in July, up to 57 µg m−3 in the range of 0.4 to 0.9 km. This was observed by PRL measurements and could not be identified by ground observations.
Tang et al. (2015, 2016) found that regional transport contributes considerably to light pollution, while local contribution is dominant in heavy pollution, and low RH and high RH typically correspond to light pollution and heavy pollution, respectively. Under low-RH conditions, local emissions, regional transport, and physicochemical formation processes jointly dominate the aerosol mass concentration due to the substantial influence of regional transport. For high RH, RH plays an important role in the conversion of trace gases into aerosols (Zheng et al., 2015; Cheng et al., 2016). Therefore, the increase in RH is conductive to the formation of particles in the liquid phase, multiphase reactions, and hygroscopic growth processes, and the main source of aerosols in heavy pollution periods will change to local humidity-related physicochemical processes; that is, local secondary processes play a leading role in heavy pollution (Huang et al., 2014; Guo et al., 2014). After the key meteorological factors of air pollution in Beijing are identified, the causes of high anthropogenic aerosols' mass concentration in the upper air (0.4–0.9 km) over Beijing in summer can be clarified according to the above conclusions.
Firstly, there are frequent southern transmission scenarios in the upper air over Beijing in summer. As can be seen from Fig. 8, the air mass backward trajectories at 2 and 4 km in summer are considerably different from the air mass backward trajectories in other seasons. The clustering analysis of the backward trajectories shows that in spring, autumn, and winter, the air masses at 2 and 4 km are primarily from the northwest; the northwest of Beijing is mainly mountainous with a relatively clean air mass; and in the further northwest, dozens of deserts are distributed. However, in summer, 40 % and 21 % of the air mass at 2 and 4 km is transmitted from the south, respectively. The densely populated, industrial NCP is the most polluted area in China (Zhang et al., 2019a). Thus, southerly transport brings anthropogenic aerosols with high RH from the NCP into the upper atmosphere of Beijing. Secondly, the hygroscopic growth of atmospheric particles further strengthens the air pollution in the upper air over Beijing. The atmospheric particle hygroscopicity in Beijing is significantly influenced by the source of air masses (Tang et al., 2016). When southerly air masses dominate, the polluted southerly air masses (heavy polluted and high RH) will enhance the hygroscopicity of atmospheric particles in Beijing, and as the mass fraction of inorganic salts (especially nitrate) increases, the particles undergo sufficient aging and mixing processes, and the particle hygroscopicity can be further increased (Cheng et al., 2016; Zhang et al., 2023a).
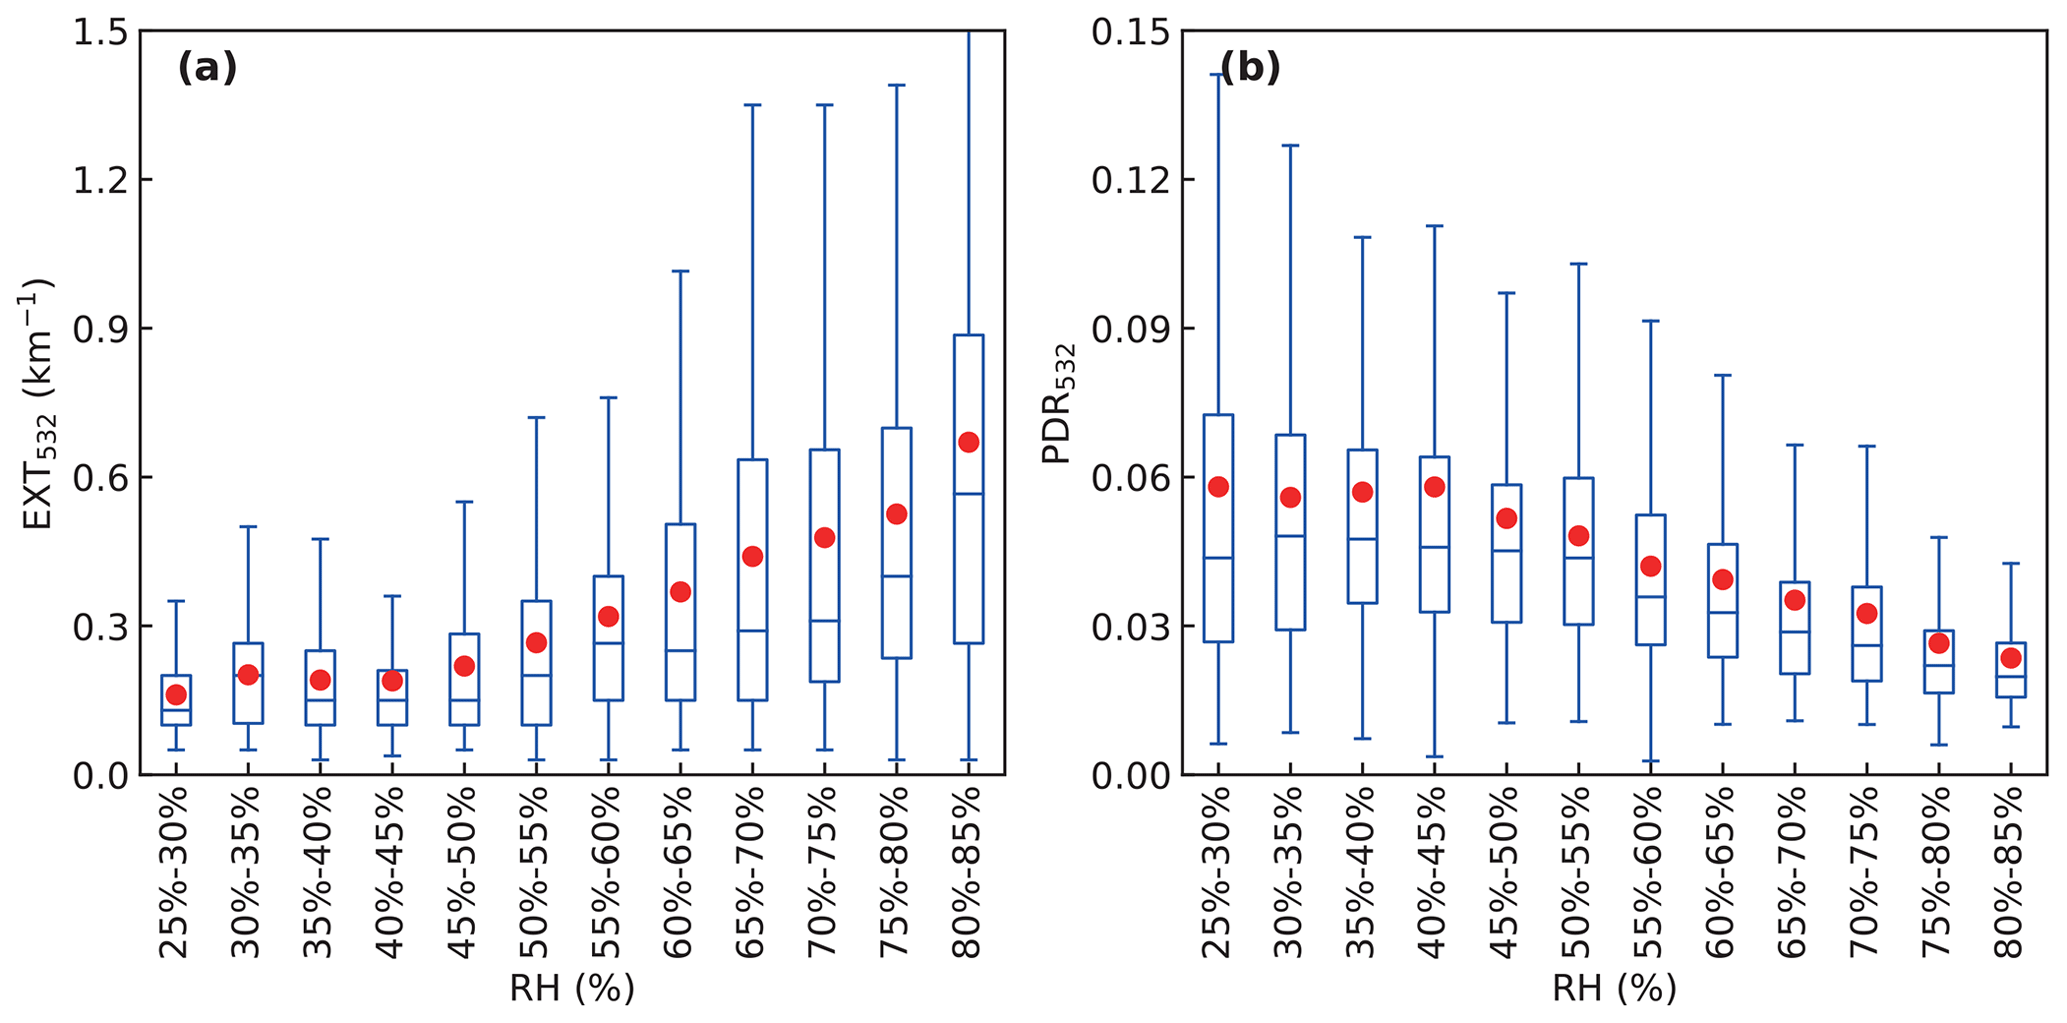
Figure 9The box-and-whisker plots of the relationship between the (a) RH and EXT532, and (b) RH and PDR532 at the top of the mixing layer in summer. The box-and-whisker plots showing the 5th, 25th, 50th, 75th, and 95th percentiles, the red dots represent the mean values.
We further analyzed the relationship between the relative humidity and EXT532 and PDR532 at the top of the mixing layer in summer (Fig. 9). When the RH was greater than 40 %, the EXT532 increased with the increase of RH; that is, the air pollution increased with the increase of humidity. More importantly, with the increase of RH, the PDR532 gradually decreases, indicating that there is hygroscopic growth of particles at the top of the mixing layer. Because the PDR532 is related to hygroscopicity (Dawson et al., 2020), it is inversely proportional to the sphericity of atmospheric particles. Assuming a uniform refractive index, moistened aerosol particles are thought to be more spherical due to condensation of water vapor and surface tension, resulting in a lower PDR532. Thus, there is hygroscopic growth of particles at the top of the mixing layer, but the contribution of hygroscopic growth to anthropogenic aerosols at the top of the mixing layer is still uncertain.
The monthly mean wind speed and RH obtained from the ERA5 reanalysis data further confirm the above scenario, with higher RH and weak southerly wind in Beijing during summer (Fig. 9). Low wind speed is a prerequisite for haze episodes, and high RH is favorable for air pollution formation. In addition, Beijing is cloudy in summer (cloud fraction >50 %) due to the intrusion of the western Pacific subtropical high pressure (Tang et al., 2016). When the cloud fraction increases, solar radiation and the MLH will drop sharply (Fig. 5b). Such unfavorable meteorological conditions (southerly transport, high RH, low MLH, and wind speed) lead to a rapid formation of atmospheric particles in the upper air over Beijing in summer. Therefore, the high anthropogenic aerosols' mass concentration in the upper air (0.4–0.9 km) over Beijing in summer is mainly caused by the southward transport in the upper air, where the atmosphere is relatively stable and moist, favoring hygroscopic growth of particles.
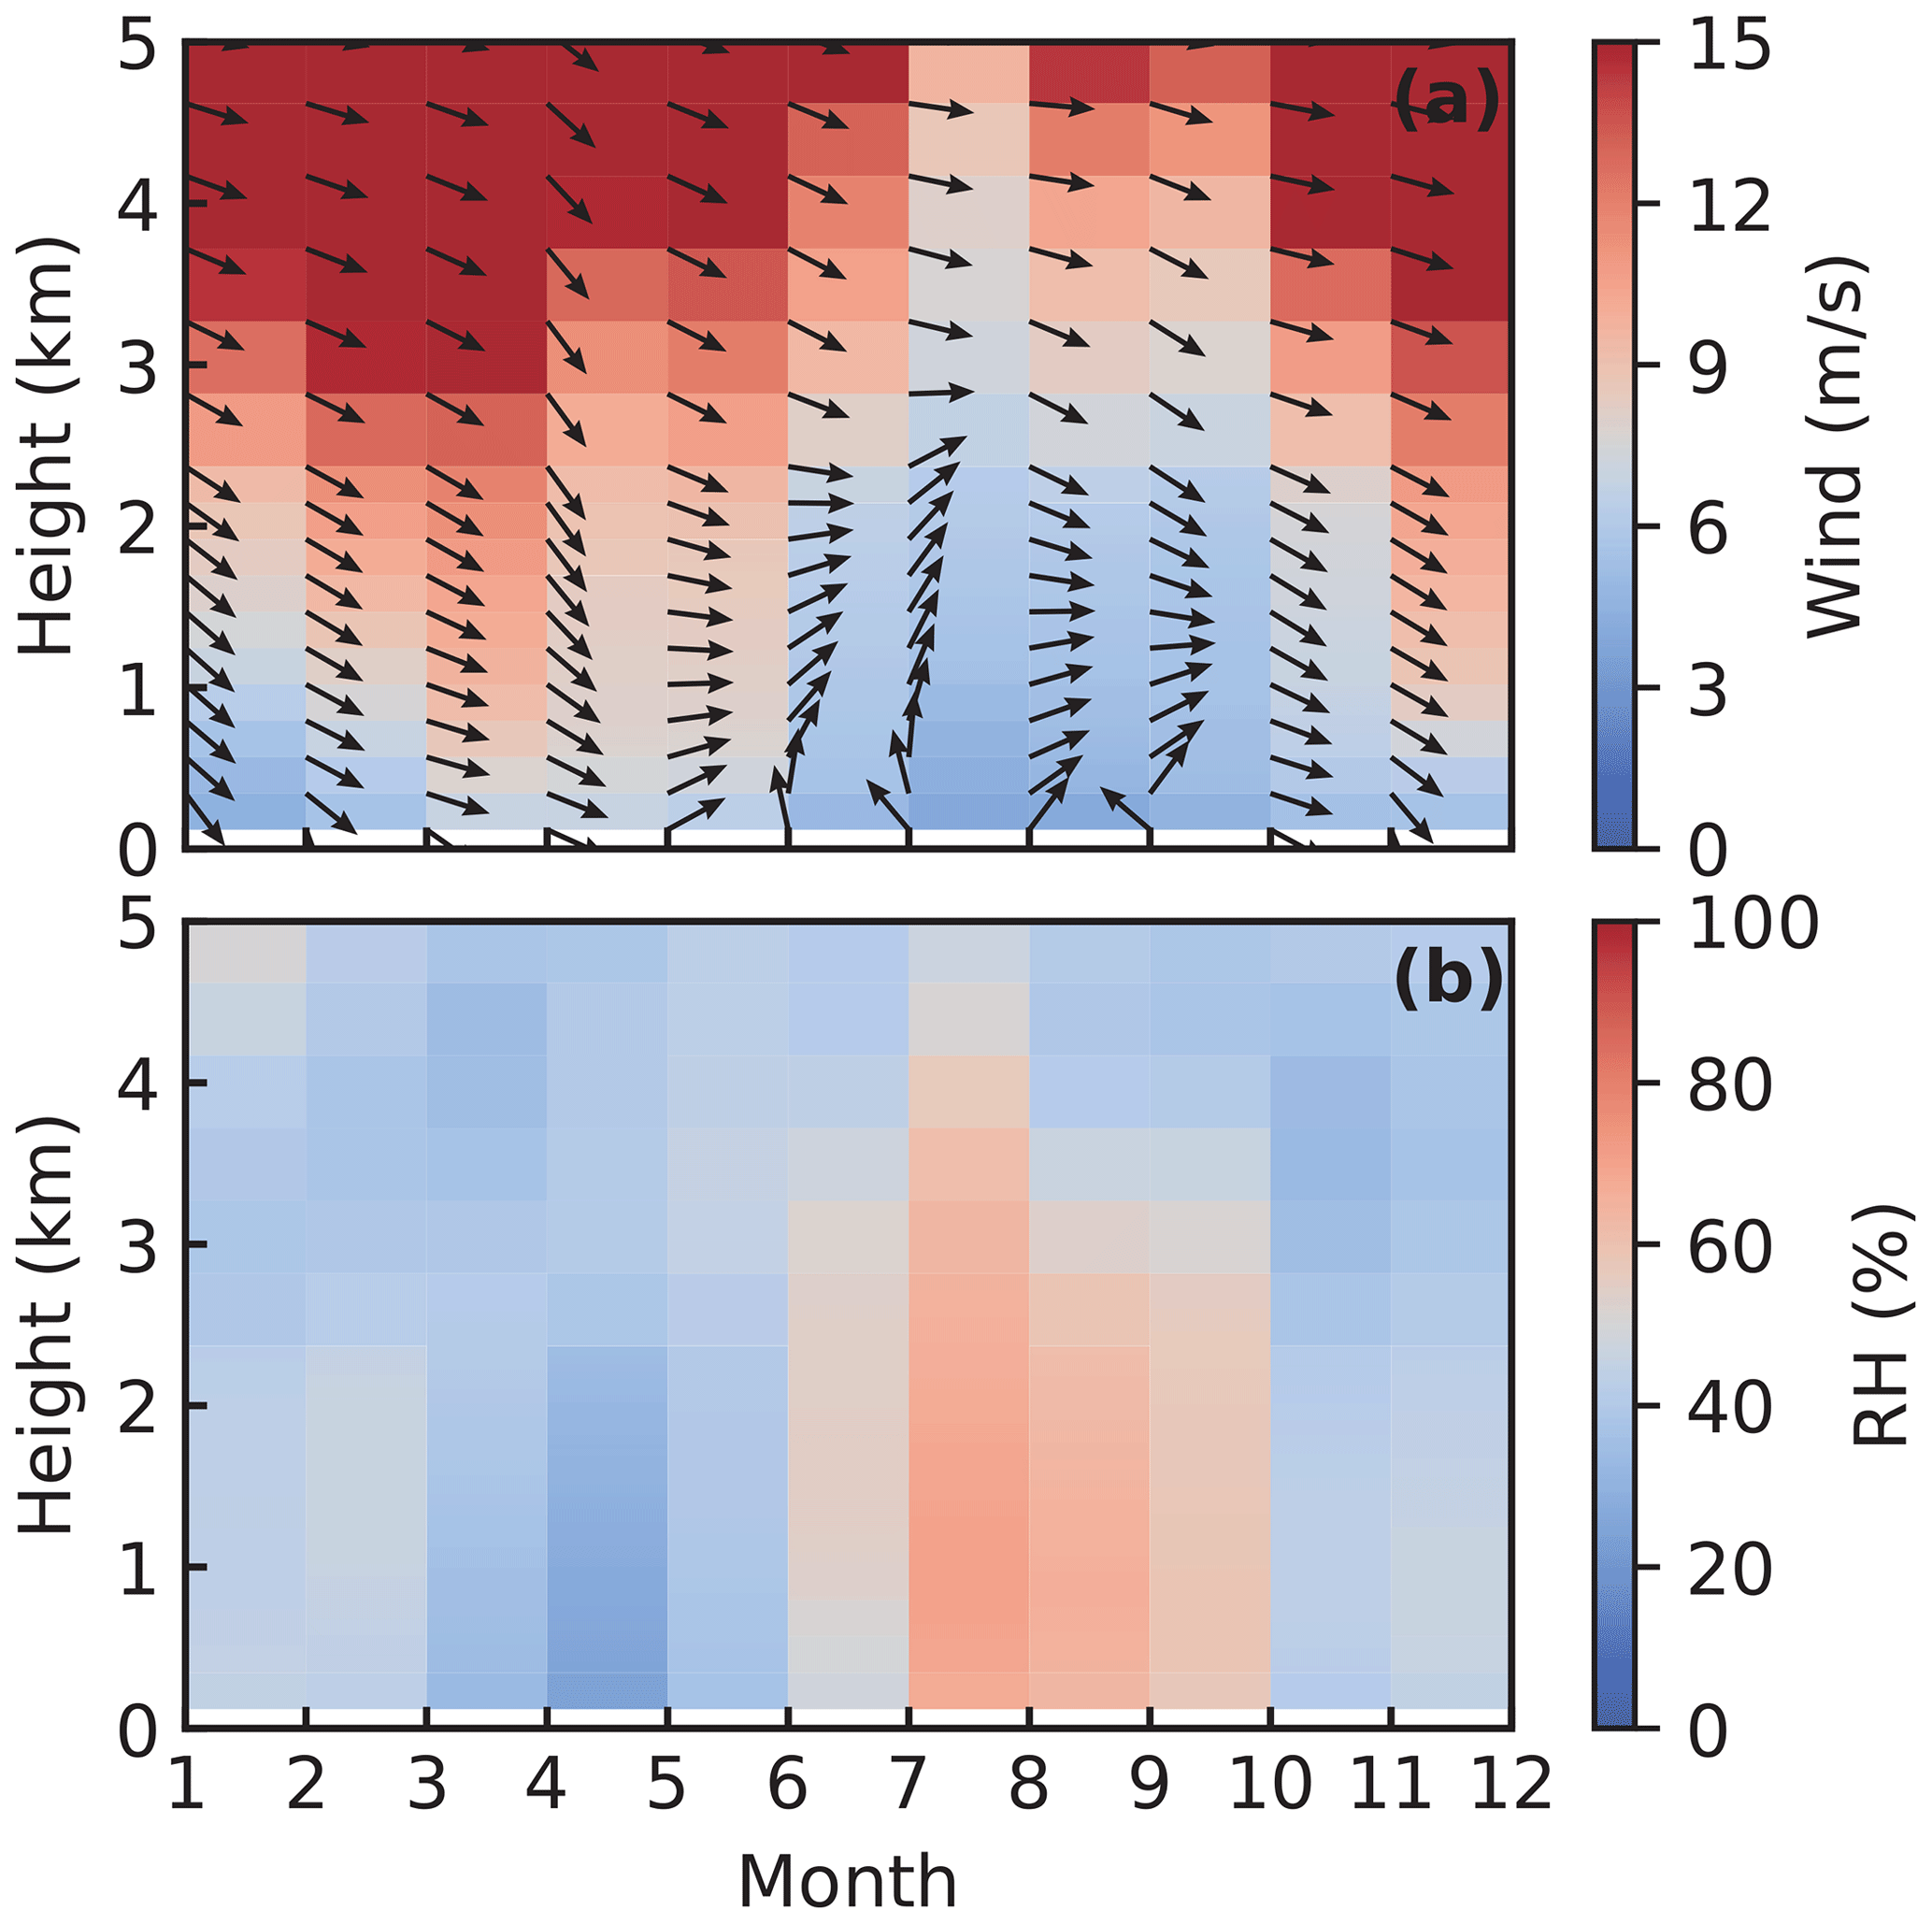
Figure 10Vertical profiles of the monthly mean (a) wind speed and direction and (b) RH obtained from the ERA5 reanalysis data from May 2019 to February 2022. The black arrow in (a) shows the wind direction, and the upward arrow indicates the south wind.
In fact, similar upper-air pollution transport was also found in PRL observations during the rest of the seasons in Beijing. Tao et al. (2014) and our previous studies (Wang et al., 2020) have analyzed the persistent haze episodes of Beijing's upper air in spring, autumn, and winter in detail. Different from summer, the air pollution in the upper air of Beijing is dominated by dust mixed with anthropogenic aerosols in spring, autumn, and winter, accompanied by the hygroscopic growth of atmospheric particles. In contrast, the upper atmosphere of Beijing is most polluted in summer because the southern transport is more frequent (Fig. 8), and the upper air of Beijing is more stable and humid (Fig. 10), which is more favorable for the hygroscopic growth of atmospheric particulates.
3.3.3 Asian dust
Meteorological conditions in Beijing vary significantly between the seasons. Air mass transport patterns are under the influence of strong westerlies over Beijing in spring (Kok et al., 2021; Gui et al., 2022). As early as February, there was substantial dust transport within 1.6–5 km, although it was not visible at the ground (Fig. 7d). From March to June, Beijing was frequently subjected to dust pollution, and the distribution of dust mass concentration at different heights was quite different. The dust mass concentration is 27, 59, 61, and 41 µg m−3 at 0.25 km from March to June, respectively. With the increase in altitude, the dust mass concentration gradually decreased, and then it increased significantly after reaching a certain altitude. Dust aerosol is mainly distributed in 2.1–2.7 km (39–46 µg m−3) in March and more widely distributed in April (1.1–3.0 km), with higher dust mass concentration between 40 and 60 µg m−3. Compared with April, the distribution height of high dust mass concentration in FT increased further in May and June, ranging from 2.3–3.5 and 2.5–3.9 km, respectively. The difference in dust vertical distribution is mainly affected by meteorological factors and dust sources. Firstly, with the increase in temperature and enhancement of convection from April to June, dust particles can be lifted higher into the air. Secondly, as two major dust sources in East Asia, the Taklimakan and Gobi Desert in northwest China have some differences in their eastward transmission paths (Sun et al., 2001). The Gobi Desert dust is transported eastward in the bottom troposphere and often affects the surface air quality in Beijing, while the Taklimakan Desert dust is readily lifted to the upper troposphere and transported eastward.
In July, August, and September, Beijing is rarely affected by dust aerosols (Fig. 7d), with monthly mean dust mass concentration below 5 µg m−3 in the range of 0.25 to 1.5 km and below 10 µg m−3 in the range of 1.5 to 5 km. In October and November, there was also a significant dust transport episode in Beijing, but its concentration and height distribution range were considerably smaller than those from March to June. The dust mass concentration in October and November at 0.25 km is 30 and 34 µg m−3, respectively, and the dust in the lower FT was concentrated in the 1–2 km, with concentrations of around 25 µg m−3. In December and January, the dust mass concentration was less than 5 µg m−3 below 1 km, while dust mass concentration increased slightly to about 10 µg m−3 within 1–2 km. The proportion of dust mass concentration in the total aerosol mass concentration at 0.25 km showed that (Fig. 7f) the highest share is in April (52 %), followed by May (51 %), October (38 %), June (37 %), November (34 %), and March (29 %). In the FT, the proportion of dust mass concentration of the total aerosol mass concentration is 10 %–60 % from March to June and 12 %–43 % from October to November.
In general, the PRL observations show that the dust is widely distributed in height, which can be consistently extended from the surface to more than 5 km; the dust concentration is discontinuous in the vertical direction; and there is stratification, not only on the ground but also in lofted layers that reach up to several kilometers. The heights of these lofted dust layers showed apparent seasonal dependence, with the height of the main dust layer gradually ascending from 1.1 km to about 2.5 km from April to June and below 3 km in autumn.
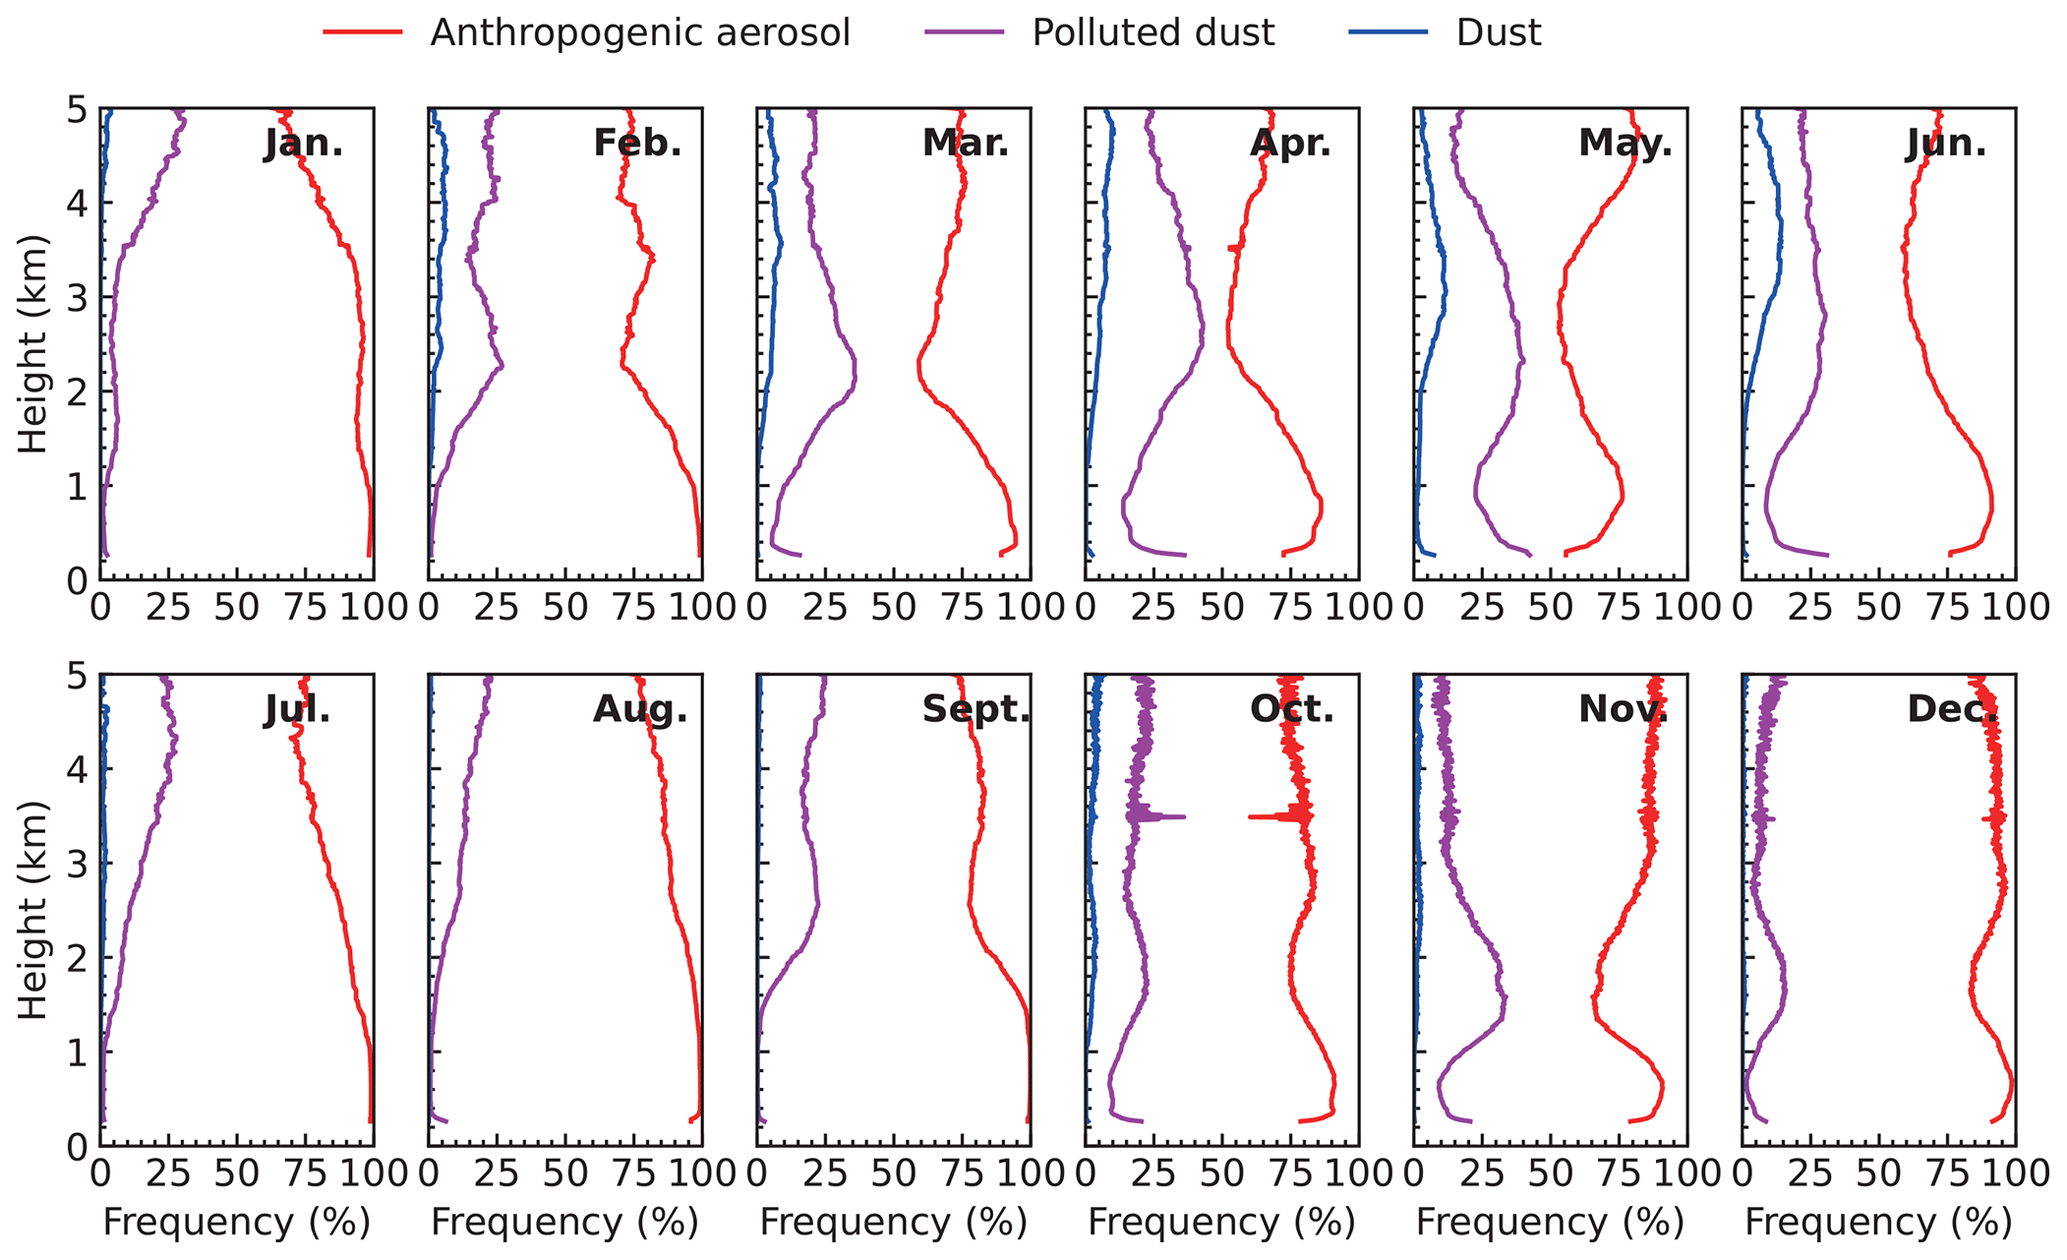
Figure 11Vertical distributions of the monthly mean occurrence frequencies of dust (yellow), polluted dust (magenta), and anthropogenic aerosols (red) in Beijing from May 2019 to February 2022.
Table 2Means and 1 standard deviation of the PDR532 and LR355 for the three aerosol types.
3.3.4 Occurrence frequency of aerosol types
Three aerosol types in Beijing have been identified according to PDR532, Asian dust, anthropogenic aerosols, and their mixtures (polluted dust). The means and 1 standard deviations of the PDR532 and LR355 for the three aerosol types are listed in Table 2, and the vertical occurrence frequency of the three aerosol types is shown in Fig. 11. In general, anthropogenic aerosols occurred more frequently than dust and polluted dust below 5 km. In January, February, July, August, and September, the occurrence frequency of anthropogenic aerosols below 1.1 km is close to 100 %, and the occurrence frequency of anthropogenic aerosols above 1.1 km decreases more steeply in January and February than in July, August, and September, which is consistent with the vertical distribution characteristics of PDR532. From March to June and October to December, the maximum occurrence frequency of anthropogenic aerosols occurred at heights of 0.39 km (95 %), 0.77 km (86 %), 0.9 km (76 %), 0.75 km (91 %), 0.65 km (91 %), 0.62 km (91 %), and 0.69 km (99 %), respectively, none of which was at the bottom (0.25 km), indicating that a large number of elevated aerosols gather over Beijing. It is also mentioned in Sect. 3.3.2 that the southerly winds bring the high polluted and humid air masses from the NCP over Beijing, and under stable meteorological conditions, further hygroscopic growth of atmospheric particles leads to severe air pollution in the upper atmosphere of Beijing (Tao et al., 2014; Tang et al., 2015, 2016). It is worth noting that these upper-layer aerosols may trigger aerosol–radiation feedback effects, which will strengthen the surface air pollution in Beijing (Zhong et al., 2018).
The maximum occurrence frequency of dust typically occurs at 2–4 km in March to June, with a frequency of 0 %–9 % (Fig. 11), and a small amount of dust aerosols also appears in other months, usually above 1 km, with a frequency of less than 3 %. The vertical occurrence frequency of polluted dust also shows considerably seasonal variation. From March to June, polluted dust occurred more frequently (5 %–39 %) below 4 km, and the height of maximum occurrence frequency was about 2.5 km. In addition, the occurrence frequency of polluted dust at 0.25 km is between 10 % and 39 % from March to June, indicating the considerable contribution of dust aerosol to the bottom air pollution in Beijing. From July to September, a small amount of polluted dust occurs above 1.2 km, with a frequency of 0 %–19 %. In October and November, polluted dust is mainly distributed in 0–3 km and contributed more frequently to the bottom layer (0.25 km) and 1.2–2.4 km, up to 30 %. In December, January, and February, the polluted dust usually appeared in 1.1–2.4 km, while the anthropogenic aerosols were concentrated below 1 km, and aerosols tended to be vertically stratified in winter. The stratification of aerosols is mainly caused by the difference of meteorological conditions above (dominated by northwest winds) and below (dominated by southerly winds) the ML. This has been discussed in detail in our previous studies (Wang et al., 2020).
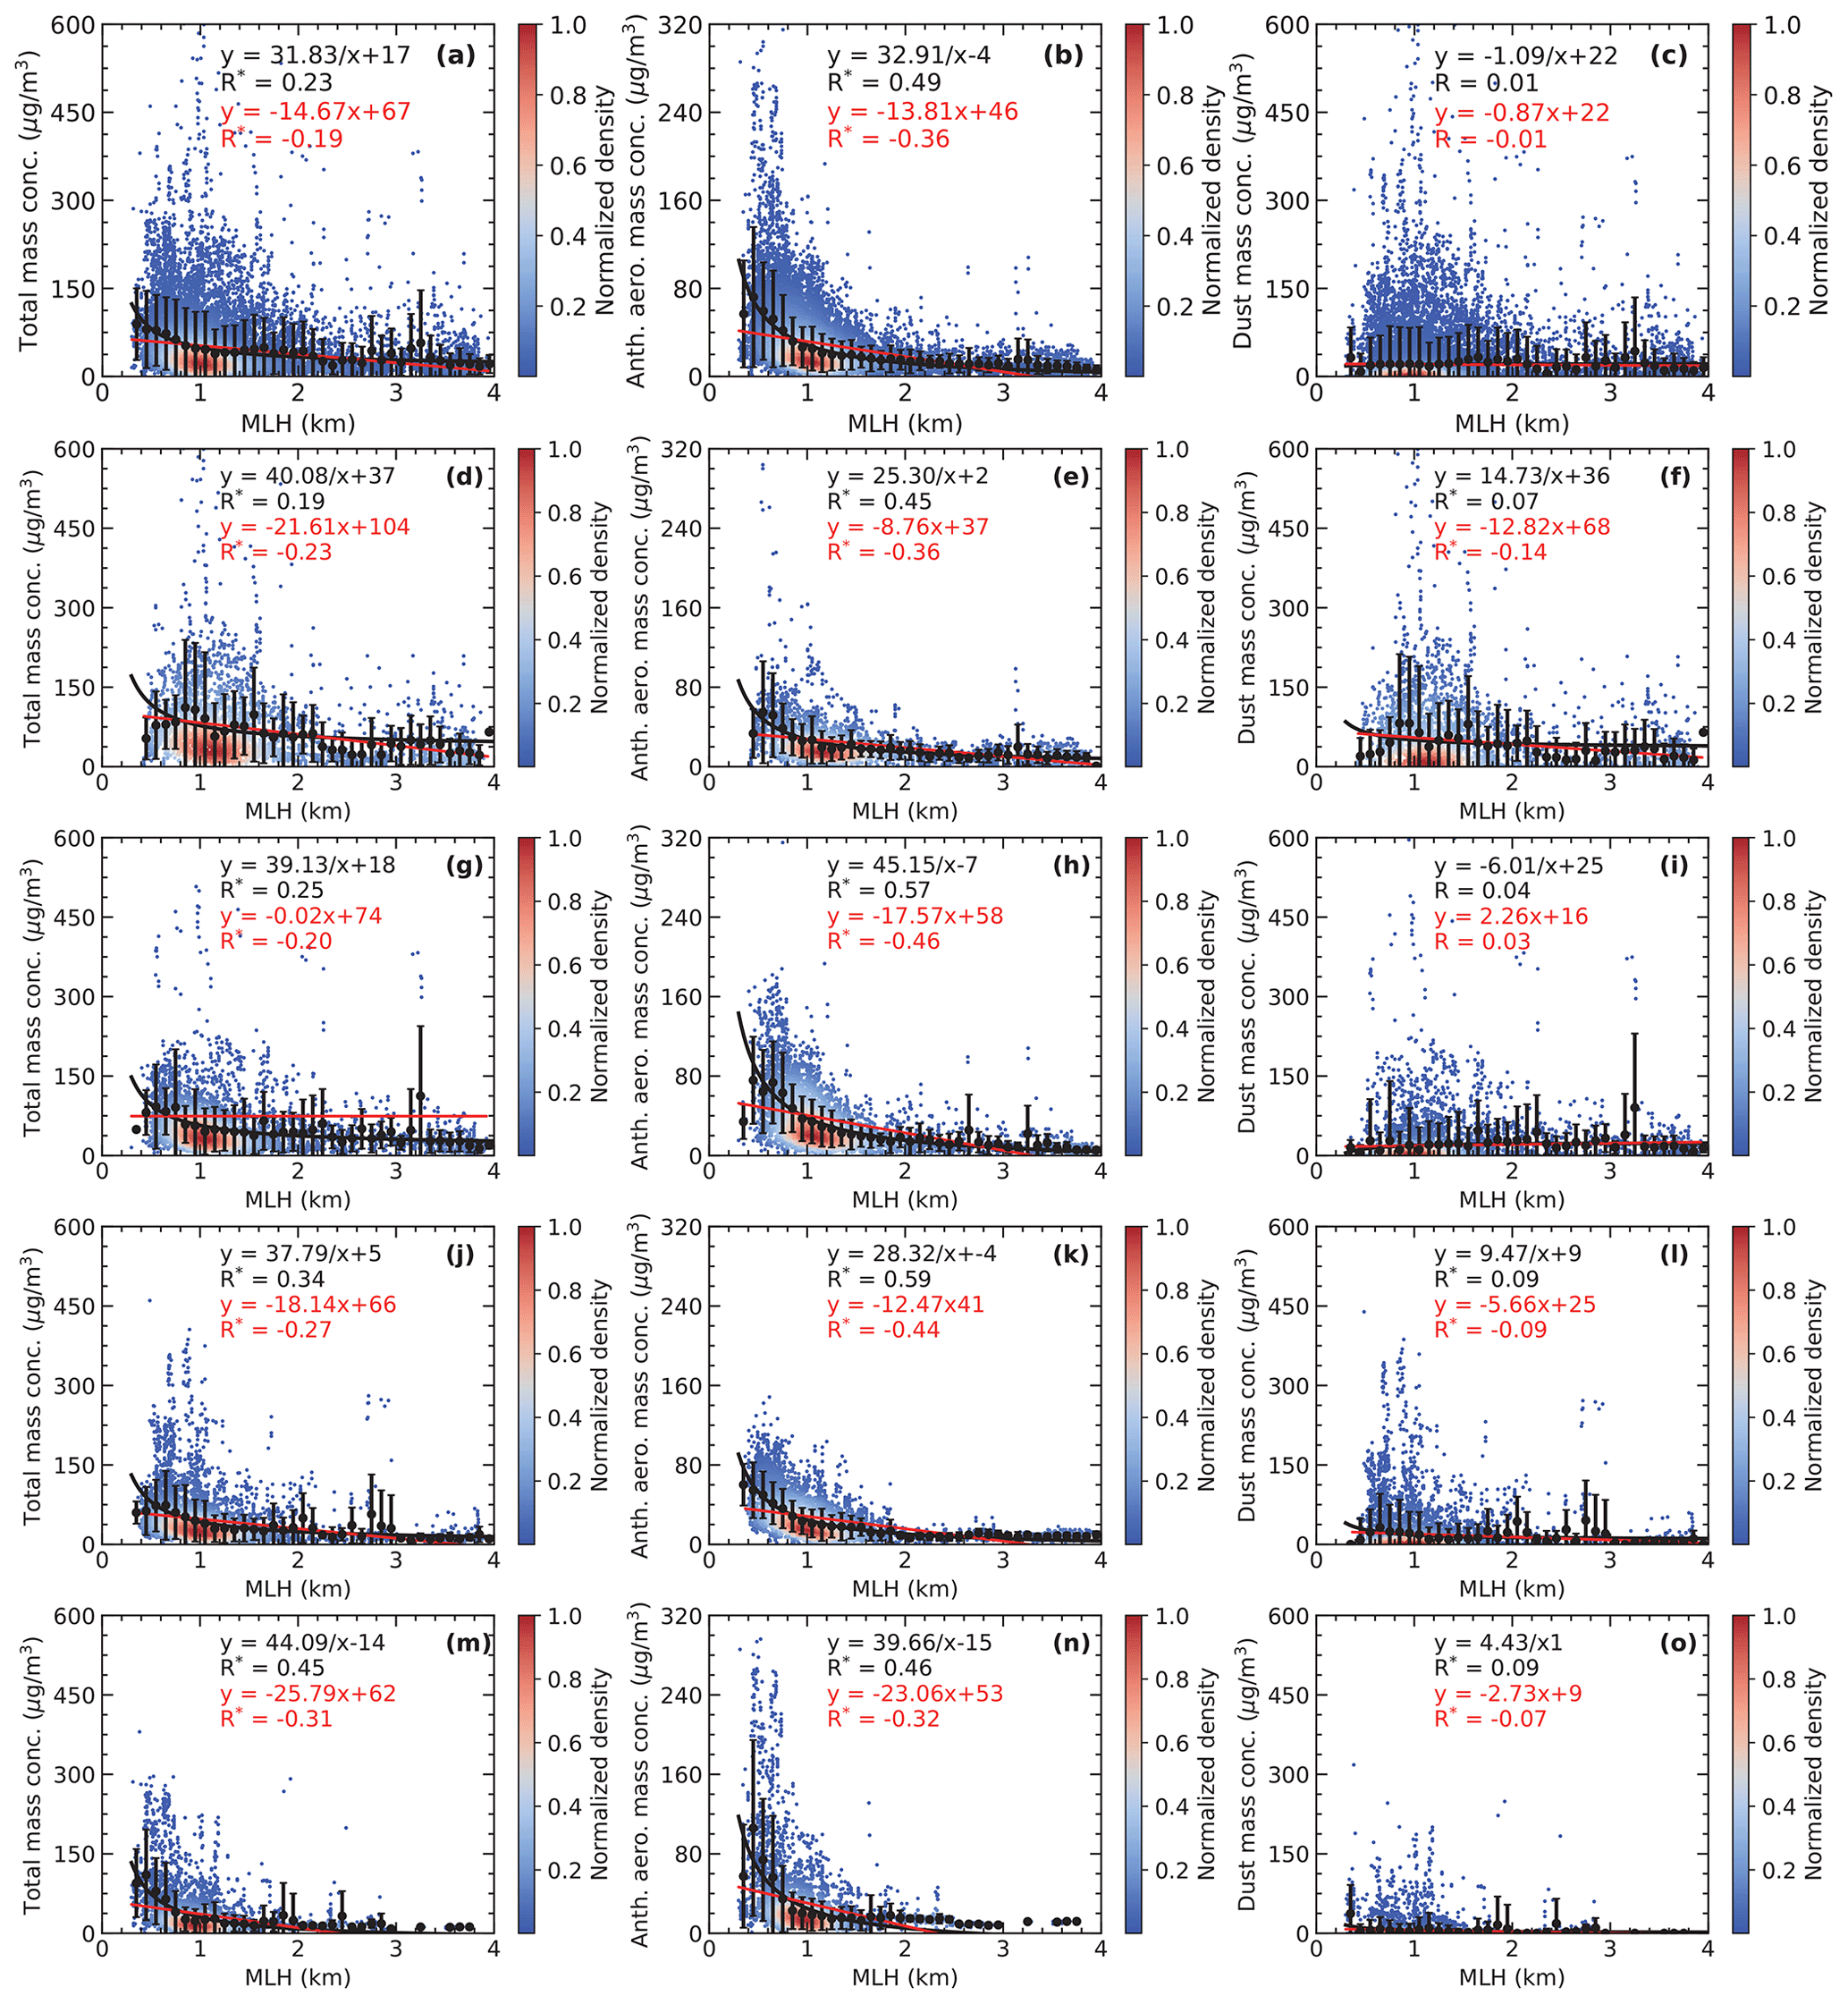
Figure 12The relationship between the PRL-derived MLH and total, anthropogenic aerosols, and dust mass concentration at 0.25 km in (a–c) the whole observation period, (d–f) spring, (g–i) summer, j–l) autumn, and (m–o) winter in Beijing from May 2019 to February 2022. The black dots and vertical bars represent the mean values and 1 standard deviation for each bin. The interval of each bin is 0.2 km. The black and red lines represent the linear fit ( and inverse fit (, respectively. The fitting functions and correlation coefficients for linear fit (black) and inverse fit (red) are shown in the top right of each panel. The asterisks next to the correlation coefficient R indicate statistical significance (P<0.01). Color-shaded points represent normalized sample density.
The vertical structure of the ML is critical to surface air pollution because it affects the volume of air pollutants' mixing (Miao et al., 2018). If the factor driving the variation of surface air pollution with the MLH is meteorological, then the discussion of their relationship can elucidate meteorological effects. We examine the MLH and the bottom (0.25 km) dust and anthropogenic aerosols' mass concentration retrieved by PRL on a case-by-case basis. Scatter plots of the MLH with total, anthropogenic aerosols, and dust mass concentration are shown in Fig. 12a–c. Although total aerosol mass concentration is negatively correlated with the MLH, there are substantial differences and spreads in the correlations between dust and anthropogenic aerosols' mass concentration and the MLH. Linear regression and inverse function fitting methods were applied to characterize the relationship between the MLH and dust/anthropogenic aerosols' mass concentration. Anthropogenic aerosols' mass concentration and the MLH were significantly negatively correlated, with a Pearson correlation of −0.36. In addition, the nonlinear inverse function was in high agreement with the mean of each bin and characterized the relationship between the MLH and anthropogenic aerosols' mass concentration, with a higher correlation coefficient (−0.49, and this improvement was significant for total and anthropogenic aerosols' mass concentration.
Anthropogenic aerosols' mass concentration and the MLH are significantly negatively correlated, while dust mass concentration and the MLH are weakly correlated and not statistically significant (Fig. 12c). In fact, surface air pollution is affected by the combined effects of local emissions and meteorological conditions with different spatial and temporal distributions, and the MLH is only one of these influencing factors. Previous studies (Zhong et al., 2018) also pointed out that anthropogenic air pollution episodes in Beijing are typically divided into two processes, transmission and accumulation. In the transmission stage, air pollution is primarily induced by southerly transport, while in the accumulation stage, meteorological conditions are stagnant, and anthropogenic aerosols usually exhibit explosive growth. Subsequently, the anthropogenic aerosols within the ML scatter more solar radiation back to space, thus increasing the temperature inversion and lowering the MLH, further deteriorating the surface air quality. There is a positive feedback mechanism between the MLH and surface anthropogenic aerosols in this process. Therefore, the MLH shows a significant negative correlation with bottom anthropogenic aerosols' mass concentration. However, dust aerosol in Beijing is governed by regional transport, and the MLH is not the key parameter controlling surface dust mass concentration. Our previous study (Wang et al., 2021c) shows that, for pure dust episodes, air masses are transported from the northwest, with stronger wind speed and a high MLH. For polluted dust episodes, air masses are transported from northwest to the NCP and then transmitted to Beijing by southerly winds, and the generation rate of new particles is further accelerated by the mixing of dust and anthropogenic aerosols (Nie et al., 2014), which is prone to persistent heavy haze events with a low MLH at this time. In addition, local dust sources (soil dust, construction dust, coal dust, and motor vehicle exhaust) in Beijing are usually concentrated on the ground (Wang et al., 2015), which is difficult to transmit to several hundred meters. Therefore, the bottom dust mass concentration is mainly influenced by transport, and the correlation between the bottom dust mass concentration and the MLH is insignificant in long-term statistics.
The analysis in Sect. 3.1 and 3.2 shows that since both the MLH and air pollution in Beijing undergo the most pronounced seasonality, seasonal differences between the MLH and aerosol are analyzed further. Figure 12d–o focus on the seasonal dependence of the MLH and bottom dust and anthropogenic aerosols' mass concentration. There is a significant negative correlation between anthropogenic aerosols and the MLH in four seasons, while dust particles and the MLH are weakly correlated. The maximum magnitude of slope between and anthropogenic aerosols' mass concentration is about 45 km µg m−3 in summer, followed by 40 km µg m−3 in winter. The spring and autumn are comparable, with values of 25 and 28 km µg m−3, respectively. This indicates that the sensitivity of anthropogenic aerosols to the MLH is strongest in summer, followed by winter, and is weakest in spring and autumn. The anthropogenic aerosols do not increase linearly with the decrease in the MLH. When the MLH was less than 1.2 km, anthropogenic aerosols increased rapidly with the decrease in the MLH, while anthropogenic aerosols changed more slowly when the MLH was greater than 1.2 km, and the relationship between the MLH and anthropogenic aerosols is virtually flat when the MLH is greater than 3 km.
In addition, Fig. 13a–c show the total, anthropogenic aerosols, and dust mass concentration profiles as a function of the MLH, as derived by PRL in Beijing from May 2019 to February 2022, with the POLIPHON method applied. Figure 13d–o show the seasonal relationship between the PRL-derived MLH and vertical profiles of total, anthropogenic aerosols, and dust mass concentration. The interval of the MLH is 0.2 km. We require that the number of averaged particle mass concentration profiles and MLH samples is larger than 20 for each interval of the MLH; otherwise, the data will be discarded, as shown in the white area of Fig. 13.
The anthropogenic aerosols' mass concentration within the ML decreases continuously with an increasing ML (Fig. 13b). When the MLH is less than 0.4 km, high total aerosol mass concentration (>50 µg m−3) extends up to 1.6 km, in which the anthropogenic aerosols (about 60 µg m−3) are primarily in the ML, and the dust aerosol (about 50 µg m−3) is mainly above the ML, and this aerosol stratification at a low MLH usually occurs in winter (Fig. 13m–o). When the MLH is between 0.4 and 2.0 km, the anthropogenic aerosols' mass concentration increased from the bottom to the top of the ML and reaches a maximum at the top of the ML (35–60 µg m−3). The accumulation of anthropogenic aerosols at the top of the ML is most significant in summer, with concentrations up to 57 µg m−3, and a similar phenomenon also exists in spring, autumn, and winter, but the aerosol mass concentration is lower. We have discussed this phenomenon in detail in Sect. 3.3.2 because the southward transport is more frequent in summer (Fig. 8), and the air pollutants aloft in Beijing are more stable and moist (Fig. 10), which is favorable for the hygroscopic growth of atmospheric particles at the top of the ML. When the MLH is greater than 2 km, the anthropogenic aerosols' mass concentration from the bottom to high altitude is less than 15 µg m−3, and the atmosphere is relatively clean.
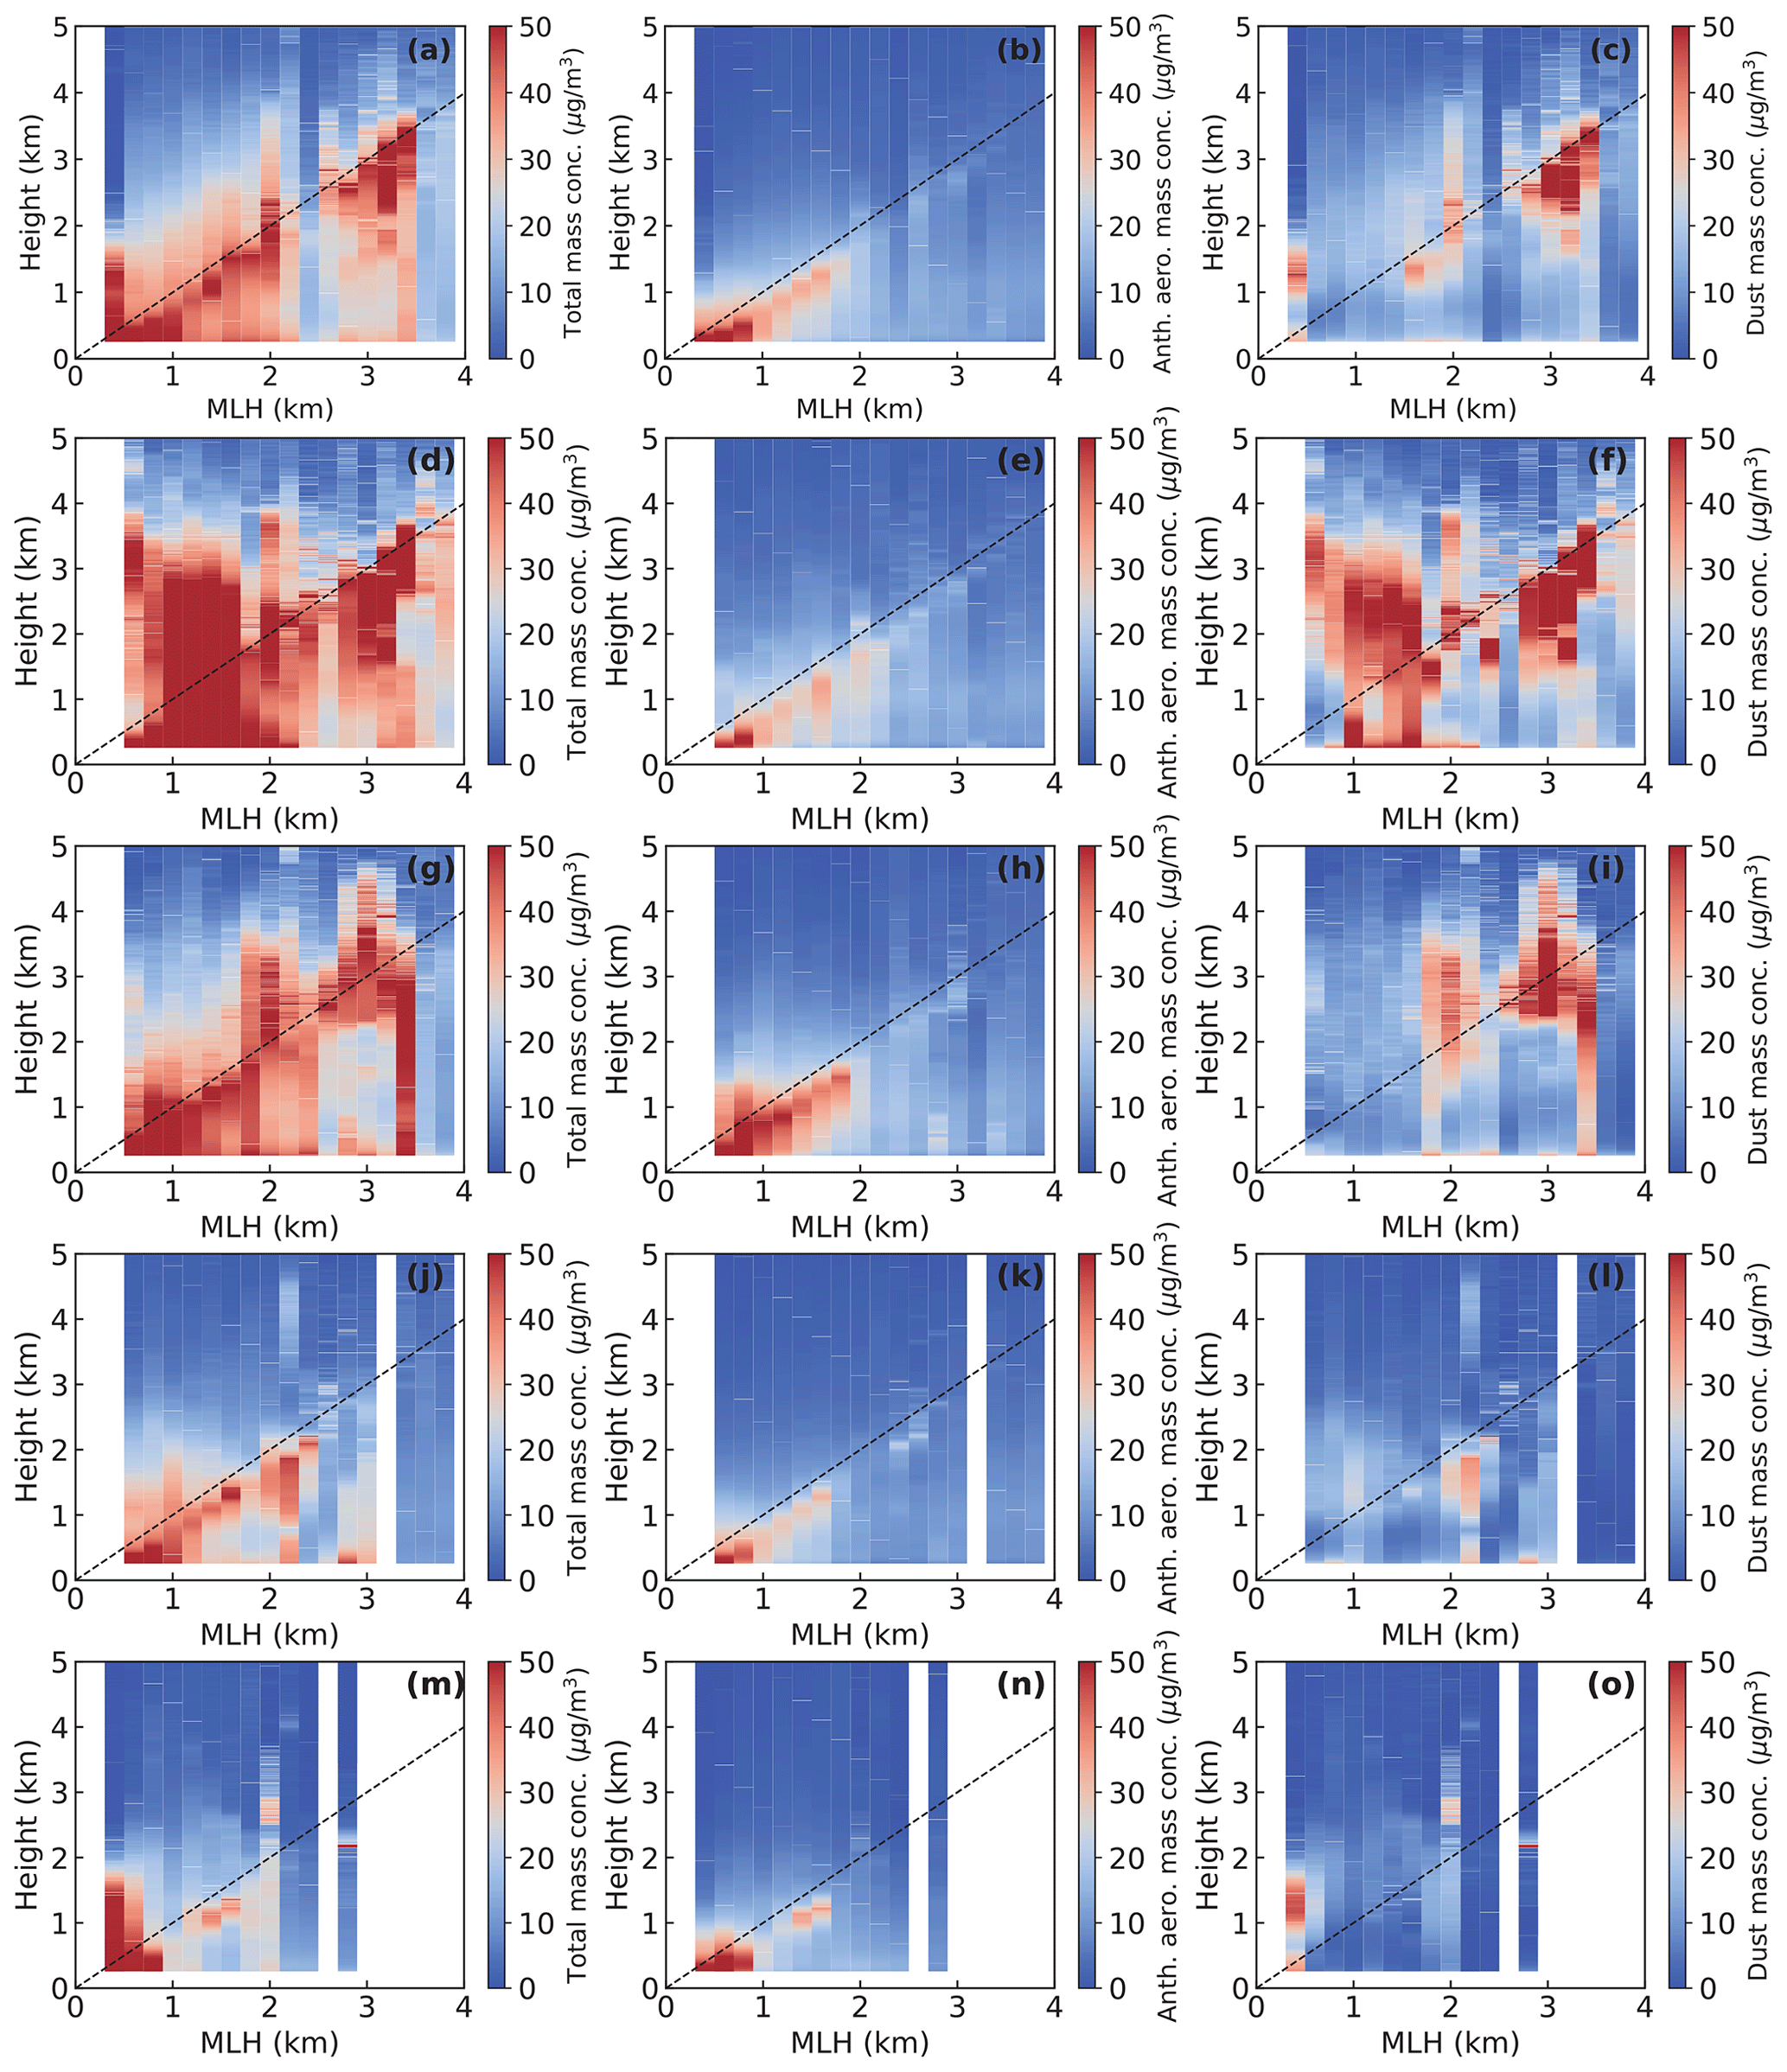
Figure 13The relationship between the PRL-derived MLH and vertical profiles of total, anthropogenic aerosols, and dust mass concentration in (a–c) the whole observation period, (d–f) spring, (g–i) summer, (j–l) autumn, and (m–o) winter for each bin in Beijing from May 2019 to February 2022. The interval of each bin is 0.2 km. The dashed black line represents the MLH.
The relationship between the MLH and anthropogenic aerosols' vertical profiles is quite different from the relationship between the MLH and dust vertical profiles. No matter how much the MLH is, there is always a shallow dust layer in the bottom layer, with mass concentration between 8 and 40 µg m−3 (Fig. 13c), which further confirms that there is no significant correlation between the MLH and the bottom dust mass concentration. Moreover, high dust mass concentration is also distributed near the ML (1.4–3.4 km), with maximum mass concentration up to 104 µg m−3. Seasonal variations show that (Fig. 13d–o), when the MLH ranges from 0.8 to 1.6 km in spring, high dust mass concentration extends up to 3.2 km, while dust aerosols are mainly concentrated near the ML (1.6–3.4 km) when the MLH is greater than 1.6 km. Different from spring, dust mass concentration is relatively low when the ML is less than 1.6 km in summer, while high dust mass concentration is found around ML (1.6–3.4 km). The dust mass concentration in the ML is slightly lower than that above the ML in autumn and winter when the ML is below 1.6 km.
In general, there is a significant negative correlation between bottom anthropogenic aerosols and the MLH. When the MLH is between 0.4 and 2 km, anthropogenic aerosols typically accumulate at the top of the ML, and the bottom anthropogenic aerosols have lower concentrations, especially in summer. Aerosols are prone to stratification when the MLH is less than 0.4 km. The relationship between dust and the MLH is complicated. There is no clear relationship between bottom dust mass concentration and the MLH, while the dust in the upper air tends to be distributed near the ML.
PRL was deployed to investigate the aerosol vertical distributions and their relationship with the MLH over Beijing from 22 May 2019 and 20 February 2022. The broad distributions of seasonal, ML, and FT PDR532 and LR355 were found over Beijing, indicating the occurrence of very diverse aerosol conditions. The PDR532 ranges from values in pure anthropogenic aerosol pollution conditions (0 % to 9 %) to typical values in heavy dust outbreak episodes (up to 39 %). Also, the LR355 is between 19–96 sr and clusters around 46–61 sr. The aerosol classification results also show that, besides anthropogenic aerosols, the maximum occurrence frequency of dust usually occurs at 2–4 km (0 %–9 %) in March to June, and the maximum occurrence frequency of polluted dust usually appears in 2.5 km (13 %–39 %) from February to June and 1.5 km (5 %–30 %) from November to January. These valuable datasets acquired through PRL can be used to improve lidar algorithms for current and/or future satellite lidar missions.
The annual variation of PRL-derived AOD showed a bimodal characteristic, with the first peak in March (0.61 ± 0.29) and the second peak in July (0.81 ± 0.37). In addition, the annual cycle of the ML AOD and FT AOD is virtually identical (Pearson correlation R=0.90, P<0.01); it may be regulated by the same mechanisms, such as regional transport of aerosols. Most importantly, the annual cycle of AOD observed by PRL and the sun photometer was the highest in summer and the lowest in winter, while the surface observation showed diametrically contrary conclusions. This implies a high load of aerosols in the upper air of Beijing. Further retrieval of dust and anthropogenic aerosols' mass concentration by the POLIPHON method revealed that, in June and July, the largest monthly mean anthropogenic aerosols' mass concentration and the widest aerosol distribution altitude were found, especially in July, up to 57 µg m−3 in the range of 0.4 to 0.9 km. The high anthropogenic aerosols' mass concentration in the upper air (0.4–0.9 km) over Beijing in summer is mainly caused by the southward transport in the upper air. The PRL observations show that the dust can be consistently extended from the surface to more than 5 km, and the dust concentration is discontinuous in the vertical direction, not only on the ground but also in lofted layers that reach up to several kilometers. The heights of these lofted dust layers exhibited apparent seasonal dependence, with the height of the main dust layer gradually rising from 1.1 km to about 2.5 km from April to June and below 3 km in autumn and winter.
There is a significant negative correlation between the bottom anthropogenic aerosols' mass concentration and the MLH (, P<0.01) due to the positive feedback mechanism between the MLH and surface anthropogenic aerosols, and an inverse function fit is more suitable to characterize this relationship (, P<0.01). However, there is a weak correlation between the bottom dust mass concentration and the MLH in long-term statistics, which is not statistically significant because the bottom (0.25 km) dust mass concentration is mainly influenced by transport. The relationship between the MLH and anthropogenic aerosols' mass concentration profiles shows that anthropogenic aerosols' mass concentration increases from the bottom to the top of the ML and reaches a maximum at the top of the ML (35–60 µg m−3). The accumulation of anthropogenic aerosols at the top of the ML is most pronounced in summer, with monthly mean mass concentration up to 68 µg m−3, and similar phenomena also exist in spring, autumn, and winter but with lower mass concentration. This is because the upper-air southward transport is more frequent in Beijing in summer, and the atmosphere is more stable and moist, which is more conducive to the hygroscopic growth of atmospheric particles.
Although our results elucidate the long-term vertical distributions of dust (coarse) and anthropogenic aerosols (fine) and their relationships with the mixing layer height, our research also has two shortcomings. Firstly, PRL has an incomplete overlap region, about 0.25 km, which prevents us from capturing the evolution of air pollutants at the lowest level (0–0.25 km). Due to the incomplete overlap region, our inversion of the MLH also starts from 0.25 km, which may lead to overestimation of the MLH. Secondly, due to the limitations of the POLIPHON method, we excluded cases with RH greater than 85 %, and the accumulation of particles at the top of the ML may undergo a significant hygroscopic growth, so the anthropogenic aerosols' mass concentration at the top of the ML may be underestimated, and the hygroscopic growth of aerosols at the top of the ML is also worthy of further detailed exploration. The research on dust and anthropogenic aerosols' vertical distributions and their correlation with the MLH contributes to further understanding of the contribution of dust–anthropogenic aerosols to the environment and climate and helps to supplement the dust–anthropogenic aerosol database with useful empirical information for upgrading atmospheric chemistry models and air pollution forecasting and warning.
Measurement data in this study are available in the data repository maintained by Mendeley Data at https://doi.org/10.17632/7k7czvw7ty.1 (Wang et al., 2023). Additional code and data related to this paper may be requested from the authors.
The supplement related to this article is available online at: https://doi.org/10.5194/acp-23-14271-2023-supplement.
CL and CX conceived and supervised the study; ZW analyzed the Raman lidar data; ZW wrote the manuscript with input from CL, CX, and CS; and HZ reviewed and commented on the paper. All authors contributed to discussing the results and revising the manuscript.
The contact author has declared that none of the authors has any competing interests.
Publisher's note: Copernicus Publications remains neutral with regard to jurisdictional claims made in the text, published maps, institutional affiliations, or any other geographical representation in this paper. While Copernicus Publications makes every effort to include appropriate place names, the final responsibility lies with the authors.
The authors acknowledge the National Oceanic and Atmospheric Administration (NOAA) Air Resources Laboratory (ARL) for the provision of the HYSPLIT transport and dispersion model used in this publication. We thank all the researchers for their efforts in establishing and maintaining the Beijing AERONET site. We would like to thank the Beijing Ecological Environment Monitoring Center for the PM2.5 and PM10 data. We would like to thank the ERA5 and MERRA-2 data developers for providing free and open-source reanalysis materials.
This research was supported by grants from the Anhui Provincial Natural Science Foundation “Jianghuai Meteorological” Joint Fund (2208085UQ04), National Natural Science Foundation of China (No. U21A2027, No. 42005095), the Joint Research Project for Meteorological Capacity Improvement(22NLTSQ011, 22NLTSY006).
This paper was edited by Matthias Tesche and reviewed by two anonymous referees.
Ansmann, A., Wandinger, U., Riebesell, M., Weitkamp, C., and Michaelis, W.: Independent measurement of extinction and backscatter profiles in cirrus clouds by using a combined Raman elastic-backscatter lidar, Appl. Opt., 31, 7113–7131, 1992.
Ansmann, A., Tesche, M., Seifert, P., Groß, S., Freudenthaler, V., Apituley, A., Wilson, K. M., Serikov, I., Linné, H., Heinold, B., Hiebsch, A., Schnell, F., Schmidt, J., Mattis, I., Wandinger, U., and Wiegner, M.: Ash and fine-mode particle mass profiles from EARLINET-AERONET observations over central Europe after the eruptions of the Eyjafjallajökull volcano in 2010, J. Geophys. Res., 116, D00U02, https://doi.org/10.1029/2010jd015567, 2011.
Ansmann, A., Seifert, P., Tesche, M., and Wandinger, U.: Profiling of fine and coarse particle mass: case studies of Saharan dust and Eyjafjallajökull/Grimsvötn volcanic plumes, Atmos. Chem. Phys., 12, 9399–9415, https://doi.org/10.5194/acp-12-9399-2012, 2012.
Ansmann, A., Mamouri, R.-E., Hofer, J., Baars, H., Althausen, D., and Abdullaev, S. F.: Dust mass, cloud condensation nuclei, and ice-nucleating particle profiling with polarization lidar: updated POLIPHON conversion factors from global AERONET analysis, Atmos. Meas. Tech., 12, 4849–4865, https://doi.org/10.5194/amt-12-4849-2019, 2019.
Baars, H., Kanitz, T., Engelmann, R., Althausen, D., Heese, B., Komppula, M., Preißler, J., Tesche, M., Ansmann, A., Wandinger, U., Lim, J.-H., Ahn, J. Y., Stachlewska, I. S., Amiridis, V., Marinou, E., Seifert, P., Hofer, J., Skupin, A., Schneider, F., Bohlmann, S., Foth, A., Bley, S., Pfüller, A., Giannakaki, E., Lihavainen, H., Viisanen, Y., Hooda, R. K., Pereira, S. N., Bortoli, D., Wagner, F., Mattis, I., Janicka, L., Markowicz, K. M., Achtert, P., Artaxo, P., Pauliquevis, T., Souza, R. A. F., Sharma, V. P., van Zyl, P. G., Beukes, J. P., Sun, J., Rohwer, E. G., Deng, R., Mamouri, R.-E., and Zamorano, F.: An overview of the first decade of PollyNET: an emerging network of automated Raman-polarization lidars for continuous aerosol profiling, Atmos. Chem. Phys., 16, 5111–5137, https://doi.org/10.5194/acp-16-5111-2016, 2016.
Barrero, M., Orza, J., Cabello, M., and Cantón, L.: Categorisation of air quality monitoring stations by evaluation of PM10 variability, Sci. Total Environ., 524, 225–236, 2015.
Bravo-Aranda, J. A., Titos, G., Granados-Muñoz, M. J., Guerrero-Rascado, J. L., Navas-Guzmán, F., Valenzuela, A., Lyamani, H., Olmo, F. J., Andrey, J., Alados-Arboledas, L., and Meteorology, P.: Study of mineral dust entrainment in the planetary boundary layer by lidar depolarisation technique, Tellus B, 67, 26180, https://doi.org/10.3402/tellusb.v67.26180, 2015.
Che, H., Zhang, X.-Y., Xia, X., Goloub, P., Holben, B., Zhao, H., Wang, Y., Zhang, X.-C., Wang, H., Blarel, L., Damiri, B., Zhang, R., Deng, X., Ma, Y., Wang, T., Geng, F., Qi, B., Zhu, J., Yu, J., Chen, Q., and Shi, G.: Ground-based aerosol climatology of China: aerosol optical depths from the China Aerosol Remote Sensing Network (CARSNET) 2002–2013, Atmos. Chem. Phys., 15, 7619–7652, https://doi.org/10.5194/acp-15-7619-2015, 2015.
Che, H., Xia, X., Zhao, H., Dubovik, O., Holben, B. N., Goloub, P., Cuevas-Agulló, E., Estelles, V., Wang, Y., Zhu, J., Qi, B., Gong, W., Yang, H., Zhang, R., Yang, L., Chen, J., Wang, H., Zheng, Y., Gui, K., Zhang, X., and Zhang, X.: Spatial distribution of aerosol microphysical and optical properties and direct radiative effect from the China Aerosol Remote Sensing Network, Atmos. Chem. Phys., 19, 11843–11864, https://doi.org/10.5194/acp-19-11843-2019, 2019.
Cheng, Y., Zheng, G., Wei, C., Mu, Q., Zheng, B., Wang, Z., Gao, M., Zhang, Q., He, K., and Carmichael, G.: Reactive nitrogen chemistry in aerosol water as a source of sulfate during haze events in China, Sci. Adv., 2, e1601530, https://doi.org/10.1126/sciadv.1601530, 2016.
Cui, M., Chen, Y., Yan, C., Li, J., and Zhang, G.: Refined source apportionment of residential and industrial fuel combustion in the Beijing based on real-world source profiles, Sci. Total Environ., 826, 154101, https://doi.org/10.1016/j.scitotenv.2022.154101, 2022.
Dawson, K. W., Ferrare, R. A., Moore, R. H., Clayton, M. B., Thorsen, T. J., and Eloranta, E. W.: Ambient aerosol hygroscopic growth from combined Raman lidar and HSRL, J. Geophys. Res.-Atmos., 2020, 125, e2019JD031708, 2020.
Ding, A., Huang, X., Nie, W., Sun, J., Kerminen, V. M., Petäjä, T., Su, H., Cheng, Y., Yang, X. Q., and Wang, M.: Enhanced haze pollution by black carbon in megacities in China, Geophys. Res. Lett., 43, 2873–2879, 2016.
Draxler, R. R. and Hess, G.: An overview of the HYSPLIT_4 modelling system for trajectories, Aust. Meteorol. Mag., 47, 295–308, 1998.
Fernald, F. G.: Analysis of atmospheric lidar observations: some comments, Appl. Opt., 23, 652–653, 1984.
Flamant, C., Pelon, J., Flamant, P. H., and Durand, P.: Lidar determination of the entrainment zone thickness at the top of the unstable marine atmospheric boundary layer, Bound.-Lay. Meteorol., 83, 247–284, 1997.
Freudenthaler, V., Esselborn, M., Wiegner, M., Heese, B., Tesche, M., Ansmann, A., Müller, D., Althausen, D., Wirth, M., and Fix, A.: Depolarization ratio profiling at several wavelengths in pure Saharan dust during SAMUM 2006, Tellus B, 61, 165–179, 2009.
Gelaro, R., McCarty, W., Suárez, M. J., Todling, R., Molod, A., Takacs, L., Randles, C. A., Darmenov, A., Bosilovich, M. G., and Reichle, R.: The modern-era retrospective analysis for research and applications, version 2 (MERRA-2), Climate, 30, 5419–5454, https://doi.org/10.1175/JCLI-D-16-0758.1, 2017.
Gui, K., Yao, W., Che, H., An, L., Zheng, Y., Li, L., Zhao, H., Zhang, L., Zhong, J., Wang, Y., and Zhang, X.: Record-breaking dust loading during two mega dust storm events over northern China in March 2021: aerosol optical and radiative properties and meteorological drivers, Atmos. Chem. Phys., 22, 7905–7932, https://doi.org/10.5194/acp-22-7905-2022, 2022.
Guo, J., Miao, Y., Zhang, Y., Liu, H., Li, Z., Zhang, W., He, J., Lou, M., Yan, Y., Bian, L., and Zhai, P.: The climatology of planetary boundary layer height in China derived from radiosonde and reanalysis data, Atmos. Chem. Phys., 16, 13309–13319, https://doi.org/10.5194/acp-16-13309-2016, 2016.
Guo, J., Zhang, J., Yang, K., Liao, H., Zhang, S., Huang, K., Lv, Y., Shao, J., Yu, T., Tong, B., Li, J., Su, T., Yim, S. H. L., Stoffelen, A., Zhai, P., and Xu, X.: Investigation of near-global daytime boundary layer height using high-resolution radiosondes: first results and comparison with ERA5, MERRA-2, JRA-55, and NCEP-2 reanalyses, Atmos. Chem. Phys., 21, 17079–17097, https://doi.org/10.5194/acp-21-17079-2021, 2021.
Guo, S., Hu, M., Zamora, M. L., Peng, J., Shang, D., Zheng, J., Du, Z., Wu, Z., Shao, M., Zeng, L., Molina, M. J., and Zhang, R.: Elucidating severe urban haze formation in China, P. Natl. Acad. Sci. USA, 111, 17373–17378, https://doi.org/10.1073/pnas.1419604111, 2014.
Heese, B., Flentje, H., Althausen, D., Ansmann, A., and Frey, S.: Ceilometer lidar comparison: backscatter coefficient retrieval and signal-to-noise ratio determination, Atmos. Meas. Tech., 3, 1763–1770, https://doi.org/10.5194/amt-3-1763-2010, 2010.
Holben, B. N., Eck, T. F., Slutsker, I., Tanre, D., Buis, J., Setzer, A., Vermote, E., Reagan, J., Kaufman, Y., and Nakajima, T.: AERONET – A federated instrument network and data archive for aerosol characterization, Remote Sens. Environ., 66, 1–16, 1998.
Huang, J. P., Liu, J. J., Chen, B., and Nasiri, S. L.: Detection of anthropogenic dust using CALIPSO lidar measurements, Atmos. Chem. Phys., 15, 11653–11665, https://doi.org/10.5194/acp-15-11653-2015, 2015.
Huang, R. J., Zhang, Y., Bozzetti, C., Ho, K. F., Cao, J. J., Han, Y., Daellenbach, K. R., Slowik, J. G., Platt, S. M., Canonaco, F., Zotter, P., Wolf, R., Pieber, S. M., Bruns, E. A., Crippa, M., Ciarelli, G., Piazzalunga, A., Schwikowski, M., Abbaszade, G., Schnelle-Kreis, J., Zimmermann, R., An, Z., Szidat, S., Baltensperger, U., El Haddad, I., and Prevot, A. S.: High secondary aerosol contribution to particulate pollution during haze events in China, Nature, 514, 218–222, https://doi.org/10.1038/nature13774, 2014.
Huang, X., Wang, Z., and Ding, A.: Impact of Aerosol PBL Interaction on Haze Pollution: Multi-Year Observational Evidences in North China, Geophys. Res. Lett., 45, https://doi.org/10.1002/2018GL079239, 2018.
Illingworth, A. J., Barker, H., Beljaars, A., Ceccaldi, M., Chepfer, H., Clerbaux, N., Cole, J., Delanoë, J., Domenech, C., and Donovan, D. P.: The EarthCARE satellite: The next step forward in global measurements of clouds, aerosols, precipitation, and radiation, B. Am. Meteorol. Soc., 96, 1311–1332, https://doi.org/10.1175/BAMS-D-12-00227.1, 2015.
Klett, J. D.: Stable analytical inversion solution for processing lidar returns, Appl. Opt., 20, 211–220, 1981.
Kok, J. F., Adebiyi, A. A., Albani, S., Balkanski, Y., Checa-Garcia, R., Chin, M., Colarco, P. R., Hamilton, D. S., Huang, Y., Ito, A., Klose, M., Li, L., Mahowald, N. M., Miller, R. L., Obiso, V., Pérez García-Pando, C., Rocha-Lima, A., and Wan, J. S.: Contribution of the world's main dust source regions to the global cycle of desert dust, Atmos. Chem. Phys., 21, 8169–8193, https://doi.org/10.5194/acp-21-8169-2021, 2021.
Li, Z., Guo, J., Ding, A., Liao, H., Liu, J., Sun, Y., Wang, T., Xue, H., Zhang, H., and Zhu, B.: Aerosol and boundary-layer interactions and impact on air quality, Nat. Sci. Rev., 4, 810–833, https://doi.org/10.1093/nsr/nwx117, 2017.
Liang, L., Han, Z., Li, J., Xia, X., Sun, Y., Liao, H., Liu, R., Liang, M., Gao, Y., and Zhang, R.: Emission, transport, deposition, chemical and radiative impacts of mineral dust during severe dust storm periods in March 2021 over East Asia, Sci. Total Environ., 852, 158459, https://doi.org/10.1016/j.scitotenv.2022.158459, 2022.
Liu, C., Sun, Y., Shan, C., Wang, W., Notholt, J., Palm, M., Yin, H., Tian, Y., Gao, J., and Mao, H.: Long-Term Observations of Atmospheric Constituents at the First Ground-Based High-Resolution Fourier-Transform Spectrometry Observation Station in China, Engineering, 22, 201–214, 2023.
Liu, C., Hu, Q., Zhang, C., Xia, C., Yin, H., Su, W., Wang, X., Xu, Y., and Zhang, Z.: First Chinese ultraviolet–visible hyperspectral satellite instrument implicating global air quality during the COVID-19 pandemic in early 2020, Light Sci. Appl., 11, 1–12, https://doi.org/10.1038/s41377-022-00722-x, 2022a
Liu, C., Xing, C., Hu, Q., Wang, S., Zhao, S., and Gao, M.: Stereoscopic hyperspectral remote sensing of the atmospheric environment: Innovation and prospects, Earth-Sci. Rev., 226, 103958, https://doi.org/10.1016/j.earscirev.2022.103958, 2022b.
Liu, C., Xing, C., Hu, Q., Li, Q., Liu, H., Hong, Q., Tan, W., Ji, X., Lin, H., and Lu, C.: Ground-based hyperspectral stereoscopic remote sensing network: A promising strategy to learn coordinated control of O3 and PM2.5 over China, Engineering, 19, 71–83, https://doi.org/10.1016/j.eng.2021.02.019, 2021a.
Liu, C., Gao, M., Hu, Q., Brasseur, G. P., and Carmichael, G. R.: Stereoscopic monitoring: a promising strategy to advance diagnostic and prediction of air pollution, B. Am. Meteorol. Soc., 102, 730–737, https://doi.org/10.1175/BAMS-D-20-0217.1, 2021b.
Luo, B., Minnett, P. J., Szczodrak, M., Nalli, N. R., and Morris, V.: Accuracy assessment of MERRA-2 and ERA-Interim sea surface temperature, air temperature, and humidity profiles over the atlantic ocean using AEROSE measurements, J. Climate, 33, 6889–6909, https://doi.org/10.1175/jcli-d-19-0955.1, 2020.
Mamouri, R.-E. and Ansmann, A.: Potential of polarization lidar to provide profiles of CCN- and INP-relevant aerosol parameters, Atmos. Chem. Phys., 16, 5905–5931, https://doi.org/10.5194/acp-16-5905-2016, 2016.
Mamouri, R. E. and Ansmann, A.: Fine and coarse dust separation with polarization lidar, Atmos. Meas. Tech., 7, 3717–3735, https://doi.org/10.5194/amt-7-3717-2014, 2014.
Miao, Y., Hu, X. M., Liu, S., Qian, T., Xue, M., Zheng, Y., and Wang, S.: Seasonal variation of local atmospheric circulations and boundary layer structure in the Beijing Tianjin Hebei region and implications for air quality, J. Adv. Model. Earth Syst., 7, 1602–1626, 2015.
Miao, Y., Liu, S., Guo, J., Huang, S., Yan, Y., and Lou, M.: Unraveling the relationships between boundary layer height and PM(2.5) pollution in China based on four-year radiosonde measurements, Environ. Pollut., 243, 1186–1195, https://doi.org/10.1016/j.envpol.2018.09.070, 2018.
Nie, W., Ding, A., Wang, T., Kerminen, V. M., George, C., Xue, L., Wang, W., Zhang, Q., Petaja, T., Qi, X., Gao, X., Wang, X., Yang, X., Fu, C., and Kulmala, M.: Polluted dust promotes new particle formation and growth, Sci. Rep.-UK, 4, 1–6, https://doi.org/10.1038/srep06634, 2014.
Shimizu, A.: Continuous observations of Asian dust and other aerosols by polarization lidars in China and Japan during ACE-Asia, J. Geophys. Res., 109, D19S17, https://doi.org/10.1029/2002JD003253, 2004.
Sicard, M., Pérez, C., Rocadenbosch, F., Baldasano, J., and García-Vizcaino, D.: Mixed-layer depth determination in the Barcelona coastal area from regular lidar measurements: methods, results and limitations, Bound.-Lay. Meteorol., 119, 135–157, 2006.
Song, Y., Xing, C., Liu, C., Lin, J., Wu, H., Liu, T., Lin, H., Zhang, C., Tan, W., Ji, X., Liu, H., and Li, Q.: Evaluation of transport processes over North China Plain and Yangtze River Delta using MAX-DOAS observations, Atmos. Chem. Phys., 23, 1803–1824, https://doi.org/10.5194/acp-23-1803-2023, 2023.
Su, T., Li, Z., and Kahn, R.: Relationships between the planetary boundary layer height and surface pollutants derived from lidar observations over China: regional pattern and influencing factors, Atmos. Chem. Phys., 18, 15921–15935, https://doi.org/10.5194/acp-18-15921-2018, 2018.
Su, T., Li, Z., Li, C., Li, J., Han, W., Shen, C., Tan, W., Wei, J., and Guo, J.: The significant impact of aerosol vertical structure on lower atmosphere stability and its critical role in aerosol–planetary boundary layer (PBL) interactions, Atmos. Chem. Phys., 20, 3713–3724, https://doi.org/10.5194/acp-20-3713-2020, 2020.
Sugimoto, N., Matsui, I., Shimizu, A., Uno, I., Asai, K., Endoh, T., and Nakajima, T.: Observation of dust and anthropogenic aerosol plumes in the northwest Pacific with a two wavelength polarization lidar on board the research vessel Mirai, Geophys. Res. Lett., 29, 1901, https://doi.org/10.1029/2002GL015112, 2002.
Sugimoto, N., Uno, I., Nishikawa, M., Shimizu, A., Matsui, I., Dong, X., Chen, Y., and Quan, H.: Record heavy Asian dust in Beijing in 2002: Observations and model analysis of recent events, Geophys. Res. Lett., 30, 1640, https://doi.org/10.1029/2002GL016349, 2003.
Sun, J., Zhang, M., and Liu, T.: Spatial and temporal characteristics of dust storms in China and its surrounding regions, 1960–1999: Relations to source area and climate, J. Geophys. Res.-Atmos., 106, 10325–10333, https://doi.org/10.1029/2000jd900665, 2001.
Tang, G., Zhu, X., Hu, B., Xin, J., Wang, L., Münkel, C., Mao, G., and Wang, Y.: Impact of emission controls on air quality in Beijing during APEC 2014: lidar ceilometer observations, Atmos. Chem. Phys., 15, 12667–12680, https://doi.org/10.5194/acp-15-12667-2015, 2015.
Tang, G., Zhang, J., Zhu, X., Song, T., Münkel, C., Hu, B., Schäfer, K., Liu, Z., Zhang, J., Wang, L., Xin, J., Suppan, P., and Wang, Y.: Mixing layer height and its implications for air pollution over Beijing, China, Atmos. Chem. Phys., 16, 2459–2475, https://doi.org/10.5194/acp-16-2459-2016, 2016.
Tao, M., Chen, L., Wang, Z., Ma, P., Tao, J., and Jia, S.: A study of urban pollution and haze clouds over northern China during the dusty season based on satellite and surface observations, Atmos. Environ., 82, 183–192, 2014.
Tesche, M., Ansmann, A., Müller, D., Althausen, D., Engelmann, R., Freudenthaler, V., and Groß, S.: Vertically resolved separation of dust and smoke over Cape Verde using multiwavelength Raman and polarization lidars during Saharan Mineral Dust Experiment 2008, J. Geophys. Res., 114, D13202, https://doi.org/10.1029/2009JD011862, 2009a.
Tesche, M., Ansmann, A., Muller, D., Althausen, D., Mattis, I., Heese, B., Freudenthaler, V., Wiegner, M., Esselborn, M., and Pisani, G.: Vertical profiling of Saharan dust with Raman lidars and airborne HSRL in southern Morocco during SAMUM, Tellus B, 61, 144–164, 2009b.
Tesche, M., Gross, S., Ansmann, A., Müller, D., Althausen, D., Freudenthaler, V., and Esselborn, M.: Profiling of Saharan dust and biomass-burning smoke with multiwavelength polarization Raman lidar at Cape Verde, Tellus B, 63, 649–676, https://doi.org/10.1111/j.1600-0889.2011.00548.x, 2011a.
Tesche, M., Müller, D., Gross, S., Ansmann, A., Althausen, D., Freudenthaler, V., Weinzierl, B., Veira, A., and Petzold, A.: Optical and microphysical properties of smoke over Cape Verde inferred from multiwavelength lidar measurements, Tellus B, 63, 677–694, https://doi.org/10.1111/j.1600-0889.2011.00549.x, 2011b.
Wandinger, U. and Ansmann, A.: Experimental determination of the lidar overlap profile with Raman lidar, Appl. Opt., 41, 511–514, 2002.
Wang, M., Tang, G., Liu, Y., Ma, M., Yu, M., Hu, B., Zhang, Y., Wang, Y., and Wang, Y.: The difference in the boundary layer height between urban and suburban areas in Beijing and its implications for air pollution, Atmos. Environ., 260, 118552, https://doi.org/10.1016/j.atmosenv.2021.118552, 2021a.
Wang, Q., Zhuang, G., Huang, K., Liu, T., Lin, Y., Deng, C., Fu, Q., Fu, J. S., Chen, J., Zhang, W., and Yiming, M.: Evolution of particulate sulfate and nitrate along the Asian dust pathway: Secondary transformation and primary pollutants via long-range transport, Atmos. Res., 169, 86–95, https://doi.org/10.1016/j.atmosres.2015.09.013, 2016.
Wang, R., Zou, X., Cheng, H., Wu, X., Zhang, C., and Kang, L.: Spatial distribution and source apportionment of atmospheric dust fall at Beijing during spring of 2008–2009, Environ. Sci. Pollut. Res., 22, 3547–3557, 2015.
Wang, Y., Zhang, X., and Draxler, R.: TrajStat: GIS-based software that uses various trajectory statistical analysis methods to identify potential sources from long-term air pollution measurement data, Environ. Model. Softw., 24, 938–939, https://doi.org/10.1016/j.envsoft.2009.01.004, 2009.
Wang, Z., Liu, C., Xie, Z., Hu, Q., Andreae, M. O., Dong, Y., Zhao, C., Liu, T., Zhu, Y., Liu, H., Xing, C., Tan, W., Ji, X., Lin, J., and Liu, J.: Elevated dust layers inhibit dissipation of heavy anthropogenic surface air pollution, Atmos. Chem. Phys., 20, 14917–14932, https://doi.org/10.5194/acp-20-14917-2020, 2020.
Wang, Z., Liu, C., Dong, Y., Hu, Q., Liu, T., Zhu, Y., and Xing, C.: Profiling of Dust and Urban Haze Mass Concentrations during the 2019 National Day Parade in Beijing by Polarization Raman Lidar, Remote Sens., 13, 3326, https://doi.org/10.3390/rs13163326, 2021b.
Wang, Z., Liu, C., Hu, Q., Dong, Y., Liu, H., Xing, C., and Tan, W.: Quantify the Contribution of Dust and Anthropogenic Sources to Aerosols in North China by Lidar and Validated with CALIPSO, Remote Sens., 13, 1811, https://doi.org/10.3390/rs13091811, 2021c.
Wang, Z., Shi, C., Zhang, H., Xia, C., Chen, Y., Zhu, Y., Wang, S., Chi, X., Zhang, K., Chen, X., Xing, C. and Liu, C.: “Measurement report: Dust and anthropogenic aerosols vertical distributions over Beijing―dense aerosols gathered at the top of the mixing layer”, Mendeley Data, V1, [data set], https://doi.org/10.17632/7k7czvw7ty.1, 2023.
Wiegner, M. and Gasteiger, J.: Correction of water vapor absorption for aerosol remote sensing with ceilometers, Atmos. Meas. Tech., 8, 3971–3984, https://doi.org/10.5194/amt-8-3971-2015, 2015.
Winker, D. M., Vaughan, M. A., Omar, A., Hu, Y., Powell, K. A., Liu, Z., Hunt, W. H., and Young, S. A.: Overview of the CALIPSO mission and CALIOP data processing algorithms, J. Atmos. Ocean. Tech., 26, 2310–2323, https://doi.org/10.1175/2009JTECHA1281.1, 2009.
Witschas, B., Lemmerz, C., Geiß, A., Lux, O., Marksteiner, U., Rahm, S., Reitebuch, O., and Weiler, F.: First validation of Aeolus wind observations by airborne Doppler wind lidar measurements, Atmos. Meas. Tech., 13, 2381–2396, https://doi.org/10.5194/amt-13-2381-2020, 2020.
Xiao, D., Wang, N., Chen, S., Wu, L., Muller, D., Veselovskii, I., Li, C., Landulfo, E., Sivakumar, V., Li, J., Che, H., Fang, J., Zhang, K., Wang, B., Chen, F., Hu, X., Li, X., Li, W., Tong, Y., Ke, J., Wu, L., Liu, C., and Liu, D.: Simultaneous profiling of dust aerosol mass concentration and optical properties with polarized high-spectral-resolution lidar, Sci. Total Environ., 872, 162091, https://doi.org/10.1016/j.scitotenv.2023.162091, 2023.
Zhang, Q., Zheng, Y., Tong, D., Shao, M., Wang, S., Zhang, Y., Xu, X., Wang, J., He, H., Liu, W., Ding, Y., Lei, Y., Li, J., Wang, Z., Zhang, X., Wang, Y., Cheng, J., Liu, Y., Shi, Q., Yan, L., Geng, G., Hong, C., Li, M., Liu, F., Zheng, B., Cao, J., Ding, A., Gao, J., Fu, Q., Huo, J., Liu, B., Liu, Z., Yang, F., He, K., and Hao, J.: Drivers of improved PM2.5 air quality in China from 2013 to 2017, P. Natl. Acad. Sci. USA, 116, 24463–24469, https://doi.org/10.1073/pnas.1907956116, 2019a.
Zhang, S., Shen, X., Sun, J., Che, H., Zhang, Y., Liu, Q., Xia, C., Hu, X., Zhong, J., Wang, J., Liu, S., Lu, J., Yu, A., and Zhang, X.: Seasonal variation of particle hygroscopicity and its impact on cloud-condensation nucleus activation in the Beijing urban area, Atmos. Environ., 302, 119728, https://doi.org/10.1016/j.atmosenv.2023.119728, 2023a.
Zhang, X., Zheng, Y., Che, H., Gui, K., Li, L., Zhao, H., Liang, Y., Yao, W., Zhang, X., Zhao, H., Lu, Y., and Zhang, X.: Seasonal and Diurnal Characteristics of the Vertical Profile of Aerosol Optical Properties in Urban Beijing, 2017–2021, Remote Sens., 15, 475, https://doi.org/10.3390/rs15020475, 2023b.
Zhang, Z., Huang, J., Chen, B., Yi, Y., Liu, J., Bi, J., Zhou, T., Huang, Z., and Chen, S.: Three Year Continuous Observation of Pure and Polluted Dust Aerosols Over Northwest China Using the Ground Based Lidar and Sun Photometer Data, J. Geophys. Res.-Atmos., 124, 1118–1131, https://doi.org/10.1029/2018jd028957, 2019b.
Zheng, G. J., Duan, F. K., Su, H., Ma, Y. L., Cheng, Y., Zheng, B., Zhang, Q., Huang, T., Kimoto, T., Chang, D., Pöschl, U., Cheng, Y. F., and He, K. B.: Exploring the severe winter haze in Beijing: the impact of synoptic weather, regional transport and heterogeneous reactions, Atmos. Chem. Phys., 15, 2969–2983, https://doi.org/10.5194/acp-15-2969-2015, 2015.
Zheng, Y., Che, H., Xia, X., Wang, Y., Wang, H., Wu, Y., Tao, J., Zhao, H., An, L., Li, L., Gui, K., Sun, T., Li, X., Sheng, Z., Liu, C., Yang, X., Liang, Y., Zhang, L., Liu, C., Kuang, X., Luo, S., You, Y., and Zhang, X.: Five-year observation of aerosol optical properties and its radiative effects to planetary boundary layer during air pollution episodes in North China: Intercomparison of a plain site and a mountainous site in Beijing, Sci. Total Environ., 674, 140–158, 2019.
Zhong, J., Zhang, X., Dong, Y., Wang, Y., Liu, C., Wang, J., Zhang, Y., and Che, H.: Feedback effects of boundary-layer meteorological factors on cumulative explosive growth of PM2.5 during winter heavy pollution episodes in Beijing from 2013 to 2016, Atmos. Chem. Phys., 18, 247–258, https://doi.org/10.5194/acp-18-247-2018, 2018.
Zhong, J., Zhang, X., Wang, Y., Wang, J., Shen, X., Zhang, H., Wang, T., Xie, Z., Liu, C., Zhang, H., Zhao, T., Sun, J., Fan, S., Gao, Z., Li, Y., and Wang, L.: The two-way feedback mechanism between unfavorable meteorological conditions and cumulative aerosol pollution in various haze regions of China, Atmos. Chem. Phys., 19, 3287–3306, https://doi.org/10.5194/acp-19-3287-2019, 2019.