the Creative Commons Attribution 4.0 License.
the Creative Commons Attribution 4.0 License.
 | 13 Nov 2023
The role of temporal scales in extracting dominant meteorological drivers of major airborne pollutants
Miaoqing Xu
Jing Yang
Manchun Li
Xiao Chen
Qiancheng Lv
Qi Yao
Bingbo Gao
Ziyue Chen
The influence of individual meteorological factors on different airborne pollutants has been widely studied. However, few studies have considered the effect of temporal scales on the extracted pollutant–meteorology association. Based on convergent cross mapping (CCM), we compared the influence of major meteorological factors on PM2.5, PM10 and O3 concentrations in 2020 at the 3 and 24 h scales respectively. In terms of the extracted dominant meteorological factor, the consistence between the analysis at the 3 and 24 h scales was relatively low, suggesting a large difference even from a qualitative perspective. In terms of the mean p value, the effect of temporal scale on PM (PM2.5 and PM10)–meteorology association was consistent, yet largely different from the temporal-scale effect on O3. Temperature was the most important meteorological factor for PM2.5, PM10 and O3 across China at both the 3 and 24 h scales. For PM2.5 and PM10, the extracted PM–temperature association at the 24 h scale was stronger than that at the 3 h scale. Meanwhile, for summer O3, due to strong reactions between precursors, the extracted O3–temperature association at the 3 h scale was much stronger. Due to the discrete distribution, the extracted association between all pollutants and precipitation was much weaker at the 3 h scale. Similarly, the extracted PM–wind association was notably weaker at the 3 h scale. Due to precursor transport, summertime O3–wind association was stronger at the 3 h scale. For atmospheric pressure, the pollutant–pressure association was weaker at the 3 h scale except for summer, when interactions between atmospheric pressure and other meteorological factors were strong. From the spatial perspective, pollutant–meteorology associations at 3 and 24 h were more consistent in the heavily polluted regions, while extracted dominant meteorological factors for pollutants demonstrated more difference at 3 and 24 h in the less polluted regions. This research suggests that temporal scales should be carefully considered when extracting natural and anthropogenic drivers for airborne pollution.
- Article
(6752 KB) - Full-text XML
- BibTeX
- EndNote


Since 2013, PM2.5-induced haze events have increased dramatically across China (Chen et al., 2020a; Wang et al., 2021a). To address this issue, a series of emission-cut policies were released and strictly implemented, leading to significantly reduced PM2.5 concentrations at the national scale (Wang et al., 2021b, 2022; Xiao et al., 2020). Conversely, with the improvement of PM2.5 pollution, a soaring ground ozone level has been observed since 2013, making composite airborne pollution a rising challenge (Gong et al., 2017; Zheng et al., 2018; Nelson et al., 2021). Against this background, a comprehensive understanding of their composite airborne pollution characteristics and driving factors is key for effectively predicting and managing composite airborne pollutants (Chen et al., 2018, 2019a, c, 2020a).
The major influential factors for airborne pollutants are human factors, which closely relate to their compositions and formation (Cheng et al., 2017; Zhan et al., 2017), and meteorological factors, which closely relate to their dispersion (Chen et al., 2020; Guo et al., 2020; Zhang et al., 2020). Given the strong negative effects of airborne pollution on public health (Kelly et al., 2015; Gao et al., 2017; Yin et al., 2020) and crop yields (Zhou et al., 2018; Xu et al., 2021), massive studies have been conducted on the human and meteorological attribution of composite airborne pollution. For meteorological influencing factors, Yang et al. (2021) studied 284 major cities in China on daily scales and found that PM2.5 was mainly affected by wind, temperature and rainfall, while O3 was mainly affected by temperature, relative humidity and sunshine duration. Wang et al. (2018) established 12 joint regression models and found that the leading meteorological factors of PM2.5 pollution in Zhejiang, based on hour-scale data, were temperature and wind speed. Wang et al. (2018) also found that the emission influencing factor of PM2.5 pollution in Zhejiang, based on the analysis of hour-scale data, was NO2. Zhai et al. (2019) estimated the correlation between PM2.5 concentration and meteorological factors at the 10 d scale and found that the variation trend of PM2.5 and SO2, NO2 and CO was consistent, and SO2 emission control was the main driving factor for PM2.5 variations. In addition to the variation of seasons and geographical locations, the temporal resolutions of data sources can be major reasons for the distinct outputs. Fu et al. (2020) used integrated empirical mode decomposition (EEMD) to decompose the time series data of PM2.5, five other atmospheric pollutants and six meteorological types. On the daily scale, PM2.5 was positively correlated with O3 and the daily maximum and minimum temperatures and negatively correlated with air pressure, while PM2.5 presented an opposite association with these factors at the monthly scale.
Despite many studies having been conducted, notable inconsistence of dominant meteorological and anthropogenic drivers for airborne pollutants was observed between the findings from previous studies. Even if some studies revealed different pollutant–meteorology associations at multiple temporal scales, such research conducted in isolated cities cannot reflect the spatiotemporal variations of temporal effects across China. More importantly, due to the lack of high-temporal-resolution data, previous studies were mainly conducted at the daily scale, while many scholars believe that the application of high-temporal-resolution data leads to a better extraction of pollutant–meteorology association.
To fill this gap, we employed the data of major airborne pollutants, including PM2.5, PM10 and O3; meteorological factors; and some precursors across China with a temporal resolution of 3 and 24 h respectively. By comparing the major drivers for airborne pollutants extracted using data sources with different temporal resolutions, the role of temporal scales in the attribution of composite airborne pollution can be comprehensively understood. This research aims to improve the understanding of how mechanisms and different factors may affect airborne pollutants under various temporal scales and shed useful light on a better management of composite airborne pollution through more effective emission-cut measures.
2.1 Data sources
We obtained 3-hourly meteorological data across China for January–December 2020 from the China Meteorological Administration. The meteorological variables used in this study included temperature, precipitation, wind direction, wind speed and atmospheric pressure, which were closely related to PM2.5, PM10 (Chen et al., 2020a) and O3 concentrations (Chen et al., 2020b). For cities with more than one observation station, the average of records from multiple stations was employed. For a multi-scale comparison, the 24 h meteorological data were produced by conducting an average operation on the 3 h meteorological data. Previous studies have proved that the pollutant–meteorology association presented notable seasonal variations, and if convergent cross mapping (CCM) were conducted based on a whole year's data, the p value would not be significant in many cases and thus the comparison cannot be made. Therefore, in this research, we considered the experiments based on the respective seasonal data. For analysing seasonal variations of pollutant–meteorology association, December, January and February were set as winter; March, April and May as spring; June, July and August as summer and September, October and November as autumn.
Hourly concentration data of PM2.5, PM10 and O3 during the same period were obtained from China National Environmental Monitoring Centre, CNEMC. The meteorological data were matched according to cities and air pollutant stations, and the pollution monitoring station nearest the city was selected as its surrounding meteorological conditions. A total of 101 cities were successfully matched. For cities with more than one observation station, the average of records from multiple stations was employed. To match the temporal scale of meteorological data, the per-3 and per-24 h pollutant data were produced by conducting an average operation on the hourly concentration data.
2.2 Advanced causation model
Since 2013, when PM2.5 pollution was observed across China, research on airborne pollution has been widely conducted. Amongst a diversity of topics, research on the meteorological influences on major airborne pollutants (e.g. PM2.5 and O3) has received growing emphasis. However, the major challenge for extracting and comparing the influence of individual meteorological factors lies in the complex interactions between multiple meteorological factors, which cause large uncertainties when applying traditional correlation analysis (Chen et al., 2020a). To address this issue, we employed an advanced causation model, convergent cross mapping (CCM), to quantify the influence of each meteorological factor on PM2.5, PM10 and O3. By removing the influence of disturbing factors, CCM (Sugihara et al., 2012) is capable of extracting reliable coupling between two variables in complex ecosystems. CCM calculates the causal influence of variable A on the target variable B as the p value, ranging from 0 to 1. Like the correlation coefficient, the p value can be used for comparing the influence of multiple variables on the target variable.
Thanks to its advantage in effectively extracting the asymmetric, bidirectional association between two variables and identifying mirage correlation in complex ecosystems with a diversity of variables, we have widely employed CCM to evaluate the influence of multiple meteorological factors on PM2.5 (Chen et al., 2017, 2018), O3 (Cheng et al., 2019; Chen et al., 2020b) and net primary production (NPP) (Gao et al., 2022) and achieved reliable outputs. Based on a multi-model comparison experiment, our recent research (Chen et al., 2022) proved that CCM was the most suitable model for causation inference in complex atmospheric environments. CCM is specifically designed to deal with the nonlinear relationship between two variables and is fully suitable for the nonlinear relationship between atmospheric factors. Compared to other mainstream statistical models, CCM was advantageous in identifying unique pollutant–meteorology association in local areas while maintaining general characteristics of pollutant–meteorology association across China. Furthermore, CCM-generated meteorology–pollutant associations were highly consistent with prior knowledge. For this research we also employed CCM to quantify and compare the influence of temperature, precipitation, wind speed, wind direction and atmospheric pressure on PM2.5, PM10 and O3 concentrations. CCM automatically considers all possible interaction forms and lag effects between the time series of two variables, which effectively reduces the influence of interference and avoids the influence of other factors. CCM is largely automatic in removing the uncertainty of manual settings, and only the setting of three parameters is required: τ (time lag), E (number of dimensions) and b (number of nearest neighbours). For this research, τ, E and b were set as 2, 3 and 4 d, as per previous studies (Chen et al., 2018, 2020b).
Based on rarely employed 3 h meteorological data sources, we compared the effects of temporal scales on the extracted pollutant–meteorology causation. Due to the data limitation at the 3 h scale, which did not include humidity and sunshine duration, we could only consider a limited number of meteorological factors (temperature, precipitation, wind speed, wind direction and atmospheric pressure). This is fewer than in our previous studies based on meteorological data at the 24 h scale and why some meteorological factors (e.g. humidity and sunshine duration) were missed in this research. However, since we compared the same set of these major meteorological factors at both 3 and 24 h scales, the calculated consistence and difference could effectively reveal the potential effects of different temporal scales on the quantitative (the detailed p value) and qualitative (the dominant meteorological factor) findings of pollutant–meteorology association. The limited number of meteorological factors had limited influence on the temporal effects on pollutant–meteorology association. This is because CCM simply considers the causality between the target variable and one influencing variable and removes the influence from other variables (Sugihara et al., 2012; Chen et al., 2020). Another limitation of these data was that this data set only included 1 year's data and thus the inter-annual variation of temporal effects on pollutant–meteorology association could not be revealed. In this research, we revealed the existence of strong temporal effects on pollutant–meteorology association, which can be fully supported by the 1-year data with four seasons (four complete time series with more than 90 records at 24 h scale and 720 records at 3 h scale). Meanwhile, the temporal variation of temporal effects on pollutant–meteorology association and its influencing factors should be further investigated in future studies, when the long-time-series data sets of 3 h meteorological data become available.
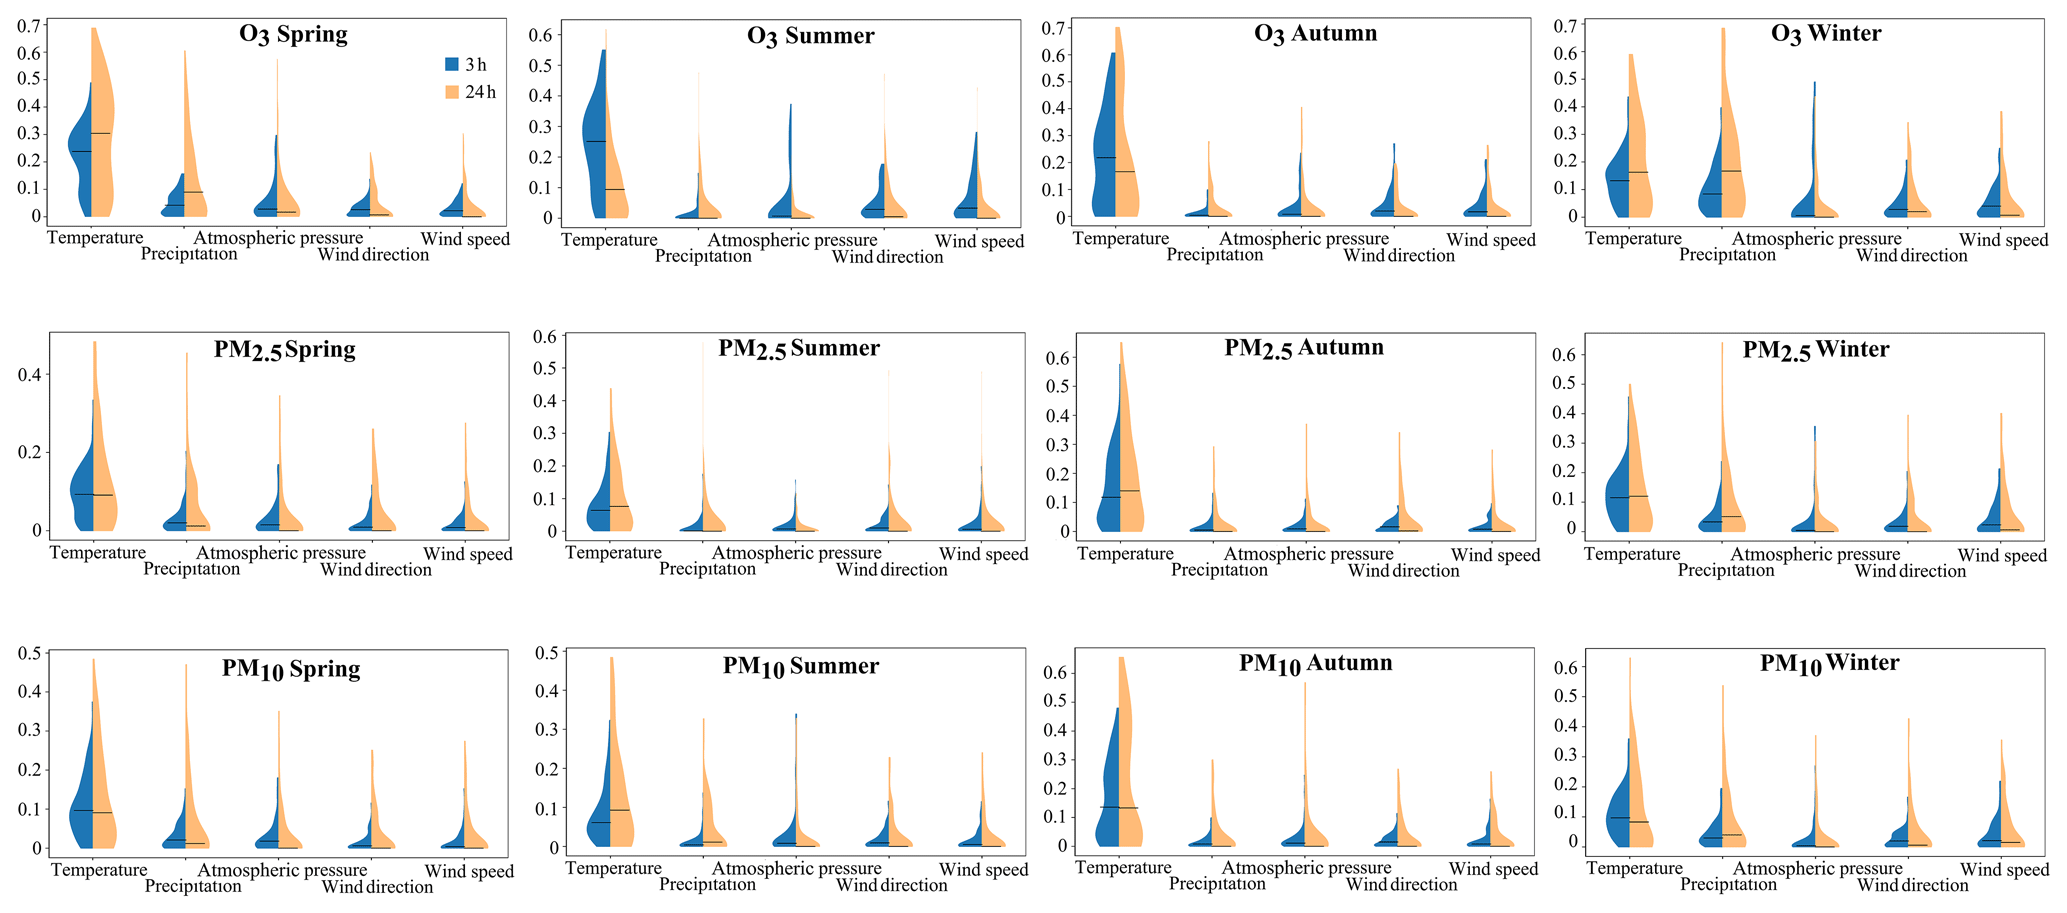
Figure 1The violin chart of the p value of individual meteorological factors for PM2.5, PM10 and O3 across China at 3 and 24 h scales.
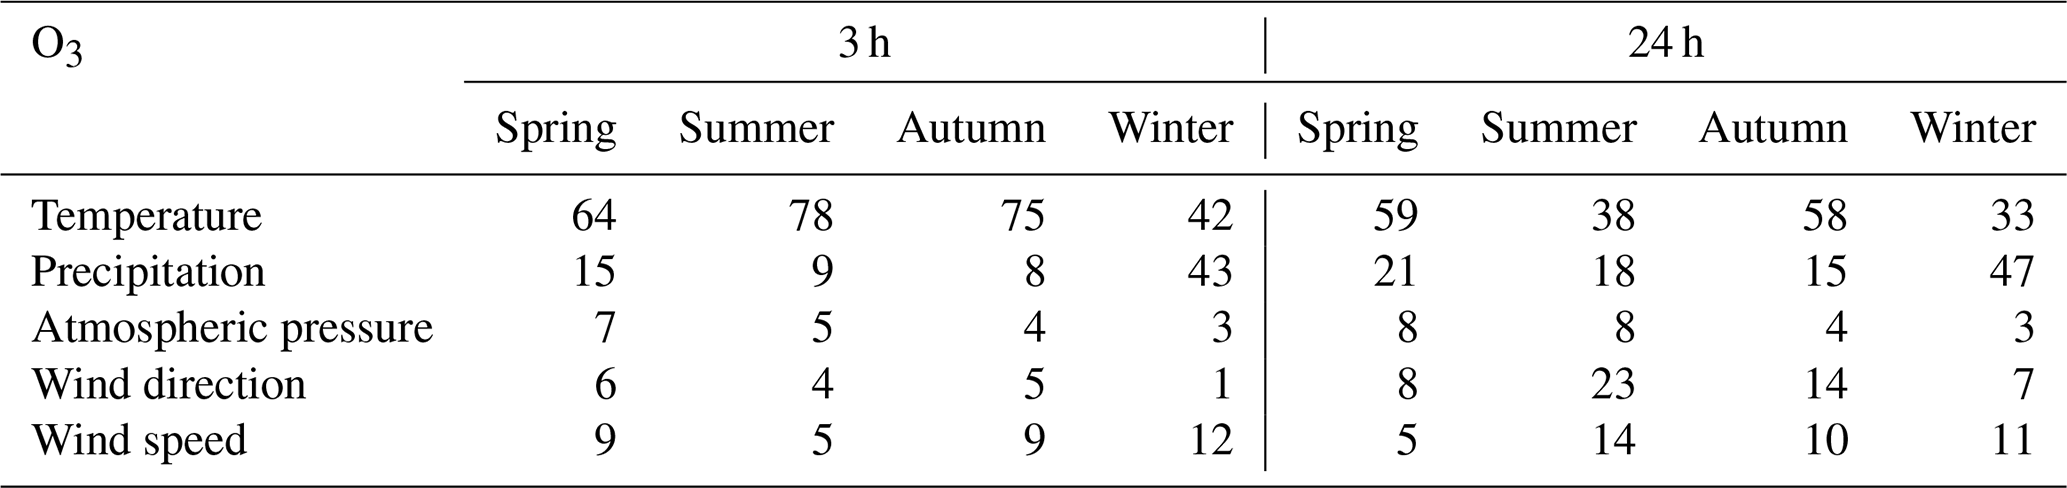
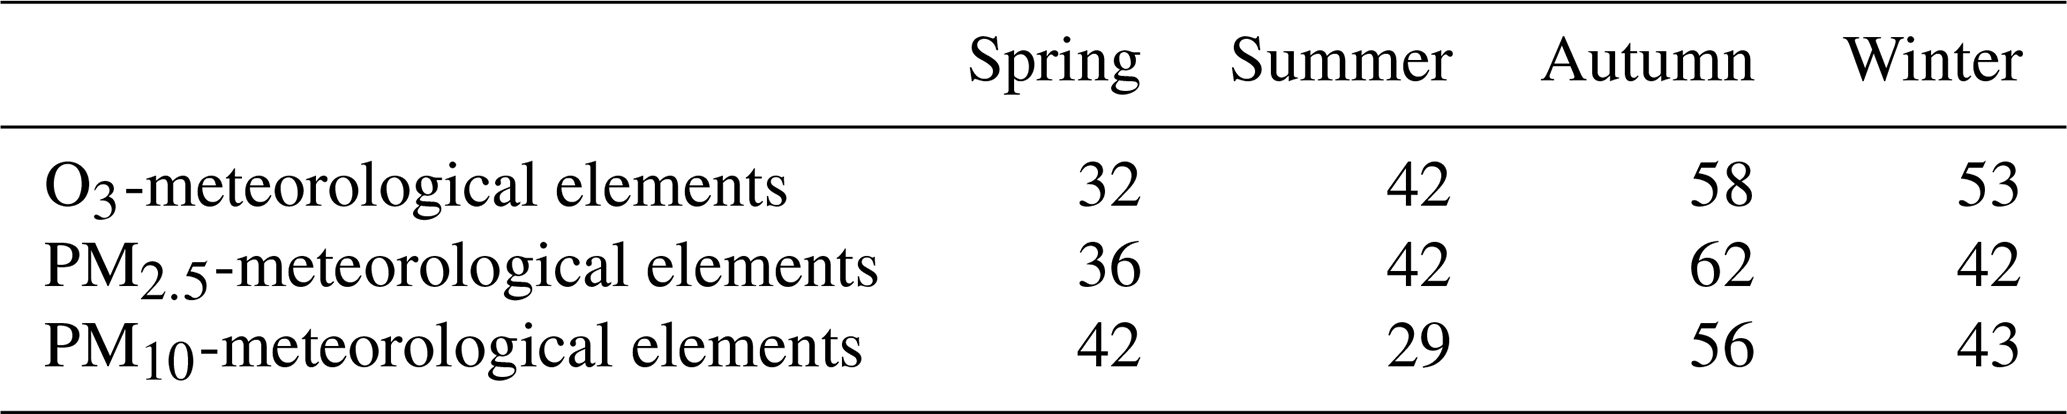
Table 1The number of cities with this meteorological factor as the dominant meteorological factor for O3.
3.1 The comparison of dominant meteorological factors for PM2.5, PM10 and O3 across China at 3 and 24 h scales
Based on CCM, we calculated the dominant meteorological factors for seasonal O3 (Table 1), PM2.5 (Table 2) and PM10 (Table 3) concentrations at the 3 and 24 h scales respectively. By comparing the extracted pollutant–meteorology association, we calculated the number of cities with the same meteorological factor at different temporal scales (Table 4). As shown in Table 4, the consistence between dominant meteorological factors for PM2.5, PM10 and O3 at two temporal scales varied significantly (ranging from 31.68 %–61.29 %), indicating the temporal scale played a large role in the analysis of pollutant–meteorology association. As can be seen from Tables 1, 2 and 3, the consistence between dominant meteorological factors extracted at 3 and 24 h in autumn and winter was higher than that in spring and summer. For example, temperature, precipitation etc. for O3, PM2.5 and PM10 were mostly more dominant in autumn and winter than in spring and summer. This phenomenon indirectly suggests that meteorological influences on airborne pollutants were stronger in autumn and winter, and thus the role of the dominant meteorological factor was highlighted.
Table 2The number of cities with this meteorological factor as the dominant meteorological factor for PM2.5.
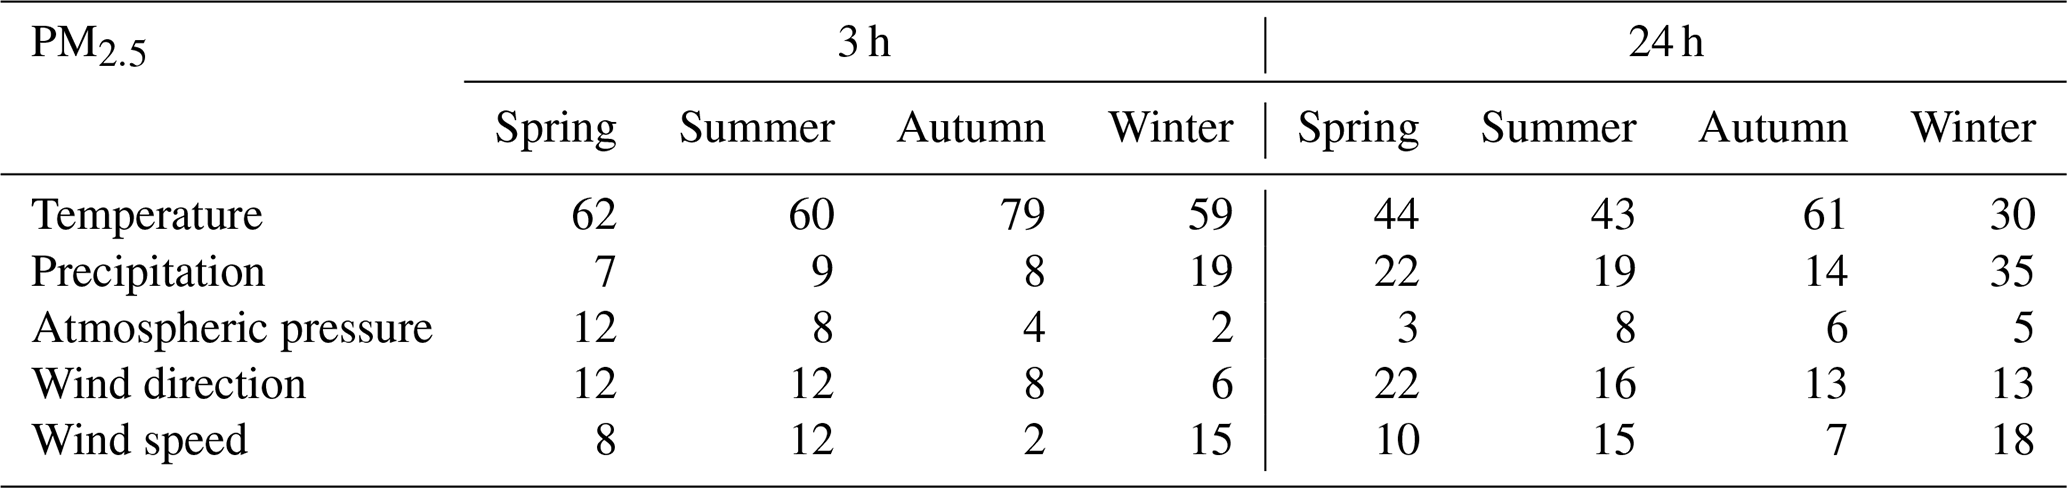
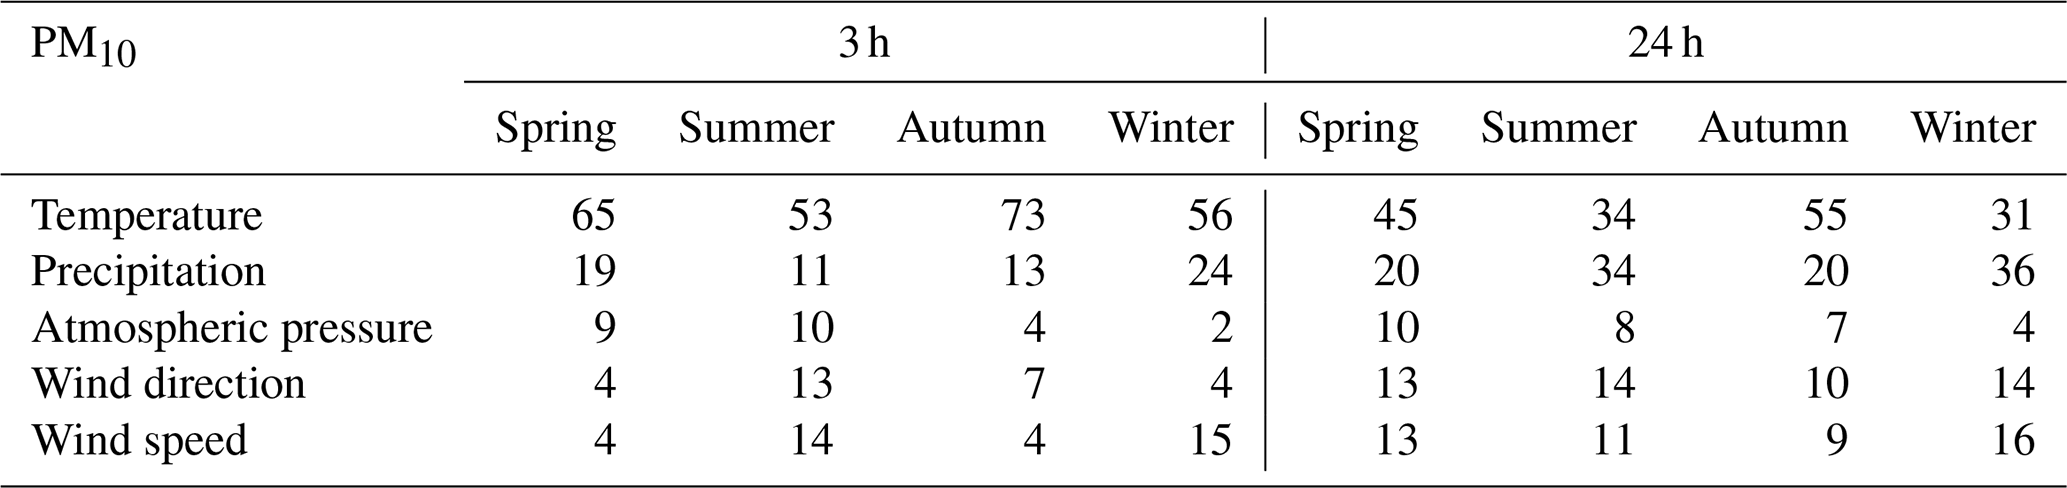
As can be seen from Table 1, at the 3 h scale for O3, the number of cities with precipitation as the dominant influencing factor was largest in winter, with 43 cities, while the number of cities with temperature was largest in spring, summer and autumn, with 64 cities, 78 cities and 75 cities respectively. As one can see from Tables 2 and 3, for PM2.5 and PM10, the number of cities with temperature as the dominant meteorological factor was largest in all seasons. As a comparison, at the 24 h scale for O3, the number of cities with temperature as the dominant influencing factor was largest in spring, with 59 cities, and for PM2.5 and PM10, the number of cities with temperature as the dominant influencing factor was largest in autumn, with 61 and 55 cities respectively, which was consistent with previous studies (Wang et al., 2018; Yang et al., 2021), while the number of cities with precipitation was largest in winter, with 47, 35 and 36 cities respectively.
However, the consistence of dominant factors between two temporal scales remained less than 50 %. The study identified the dominant meteorological factors through CCM according to the p value. While the p value of the dominant meteorological factor was largest, it may be only slightly larger than the p value of other meteorological factors at the 24 h (3 h) scale and may be smaller than the p value of another factor, which led to the change of dominant factor, at the 3 h (24 h) scale. In this case, if we simply consider the difference between the dominant meteorological factor (with the largest p) at 3 and 24 h scales, the analysis was qualitative and not sufficient, which cannot comprehensively reveal the difference of pollutant–meteorology association at different temporal scales. Therefore, we further analysed the detailed p values for all meteorological factors acting on O3, PM2.5 and PM10 at two temporal scales to present a quantitative and comprehensive comparison.
Table 3The number of cities with this meteorological factor as the dominant meteorological factor for PM10.
3.2 The comparison of quantified influence of different meteorological factors on PM2.5, PM10 and O3 across China at 3 and 24 h scales
The detailed distribution of influence of individual meteorological factors on O3, PM2.5 and PM10 concentrations is presented in Fig. 1. Generally, meteorological influences on airborne pollutants presented a consistent trend between the 3 and 24 h scales, characterised with a generally similar violin shape. According to Fig. 1, the violin shape and range of 3 h pollutant–meteorology is much sharper than the 24 h pollutant–meteorology, indicating that the 3 h temporal scale was more sensitive to revealing the variation of pollutant–meteorology interactions. As shown in Table 5, similarly to the number of dominant meteorological factors, the mean of calculated p values across China also proved that temperature exerted a much stronger influence on PM2.5, PM10 and O3 than other factors. Furthermore, according to the violin shape of different pollutants, we found that the pattern of PM2.5 between meteorology and PM10 between meteorology was generally consistent and largely different from the pattern of O3 meteorology, indicating that meteorological influences on particulate matters and gaseous pollutants were different. The major differences of pollutant–meteorology interactions at 3 and 24 h are explained in this section.
Table 4The number of cities with the same dominant factor at both 3 and 24 h scales.
For all three airborne pollutants, temperature exerted the strongest influence across China in all seasons in terms of the largest mean p. High temperature promotes photochemical reactions and produces more PM2.5, PM10 and other precursors of secondary pollutants, leading to higher concentrations of PM2.5 and PM10. High temperature may also lead to increased evaporation loss of PM2.5 and PM10, including NO3− salt and other volatile or semi-volatile components, resulting in decreased concentrations of PM2.5 and PM10. For PM2.5 and PM10, the calculated influence of temperature at the 24 h scale was consistently larger than that at the 3 h scale. This may be attributed to the fact that the secondary reactions of the precursors of PM were less intensive (Chen et al., 2016, 2020) and thus the temperature variation within 24 h exerted a stronger influence than 3 h temperature variation. Meanwhile, the influence of temperature on O3 presented a notable seasonal pattern. For the relatively cold seasons of winter and spring, when O3 concentrations were relatively low, the influence of temperature at the 24 h scale was larger than that at the 3 h scale. For summer, when O3 concentrations were the highest, the influence of temperature at 3 h scale was much larger than that at the 24 h scale. This is mainly attributed to the fact that the high temperature in summer was the major trigger for quick reactions between precursors and high O3 concentrations. Therefore, short-term variations of temperature could strongly influence O3 concentrations in summer (Cheng et al., 2018, 2019).
For precipitation, since the distribution of precipitation in a day's time is not unified, and there may be no precipitation in many 3 h slots, the mean p of precipitation across China at the 3 h scale was weaker than that at the 24 h scale. As a comparison, at the 24 h scale the occurrence of precipitation was significantly enhanced and thus the influence of precipitation on airborne pollutants was much stronger. Across China, the precipitation intensity showed obvious seasonal variations, and most regions may have the maximum value in summer and minimum value in winter. The eastern region of China is affected by monsoons in summer and autumn, and there is a lot of precipitation. In winter, China receives less precipitation due to the influence of winter winds. Accordingly, the calculated p of summer precipitation for PM2.5, PM10 and O3 at 24 h scale was remarkably larger than that at 3 h scale.
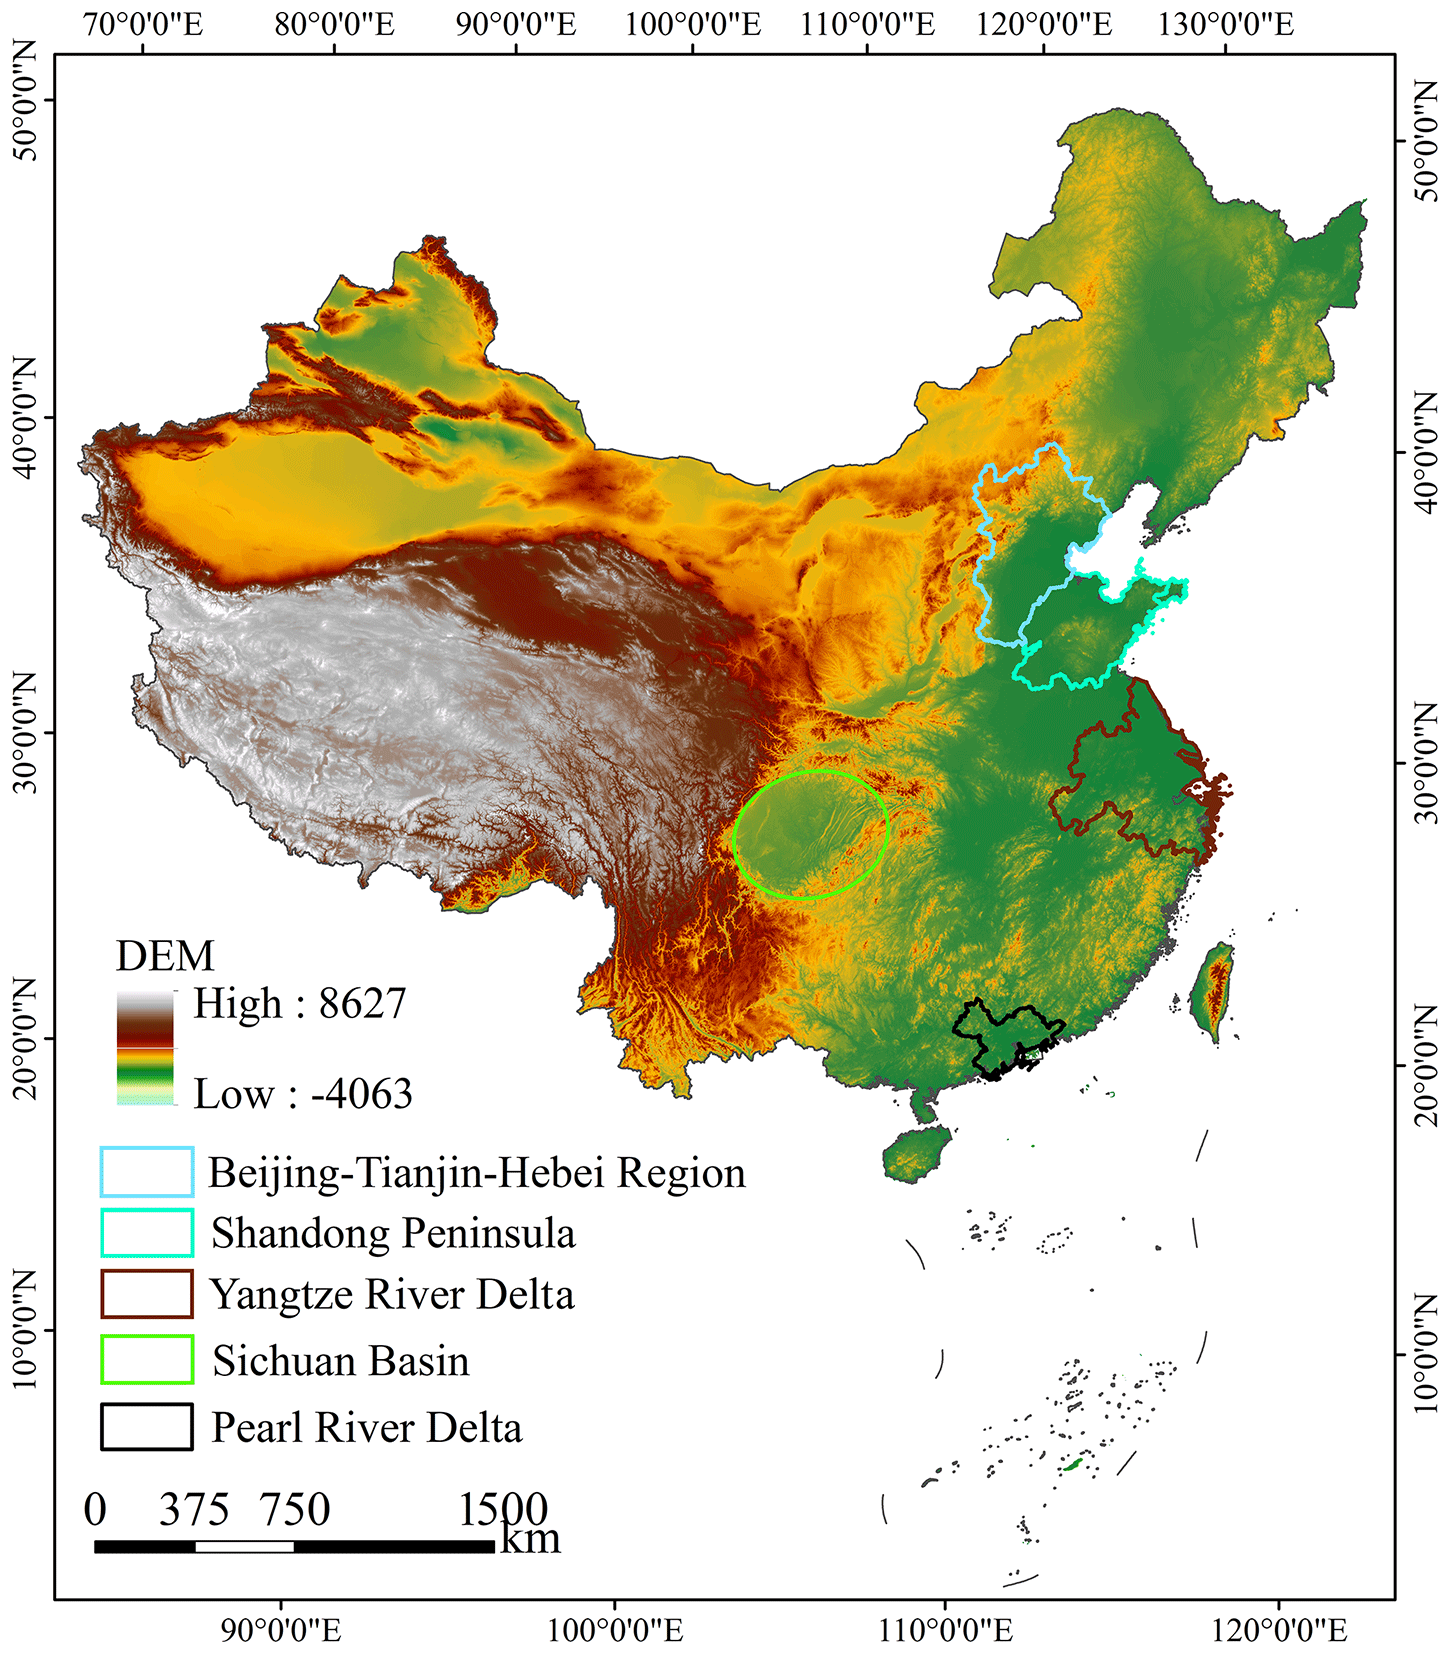
Figure 2The location of all mentioned regions. Publisher's remark: please note that the above figure contains disputed territories.
Previous studies (Chen et al., 2017, 2018, 2020) proved that wind had a notable influence on PM. Similarly to precipitation, the daily distribution of wind is not unified, and there may be calm wind conditions in many 3 h slots. Therefore, the mean p of wind direction and wind speed on PM2.5 and PM10 at the 24 h scale was notably larger than that at the 3 h scale. Wind–O3 interactions presented notable seasonal patterns. In the less polluted spring and winter, the mean p of wind direction and wind speed at the 24 h scale was larger than that at the 3 h scale. In summer, when O3 concentrations were relatively high, the mean p of wind direction and wind speed at the 3 h scale was larger.
Atmospheric pressure mainly affects the transport and accumulation of pollutants by indirectly influencing other meteorological factors (e.g. wind and precipitation). Therefore, large uncertainties existed in the extracted pressure–pollutant causation. Generally, for PM2.5, PM10 and O3, the mean p of atmospheric pressure across China at the 3 h scale was weaker than that at the 24 h scale, except for summer, when the interactions between atmospheric pressure and other meteorological factors were strong.
Table 5The mean p of individual meteorological factors for PM2.5, PM10 and O3 across China.
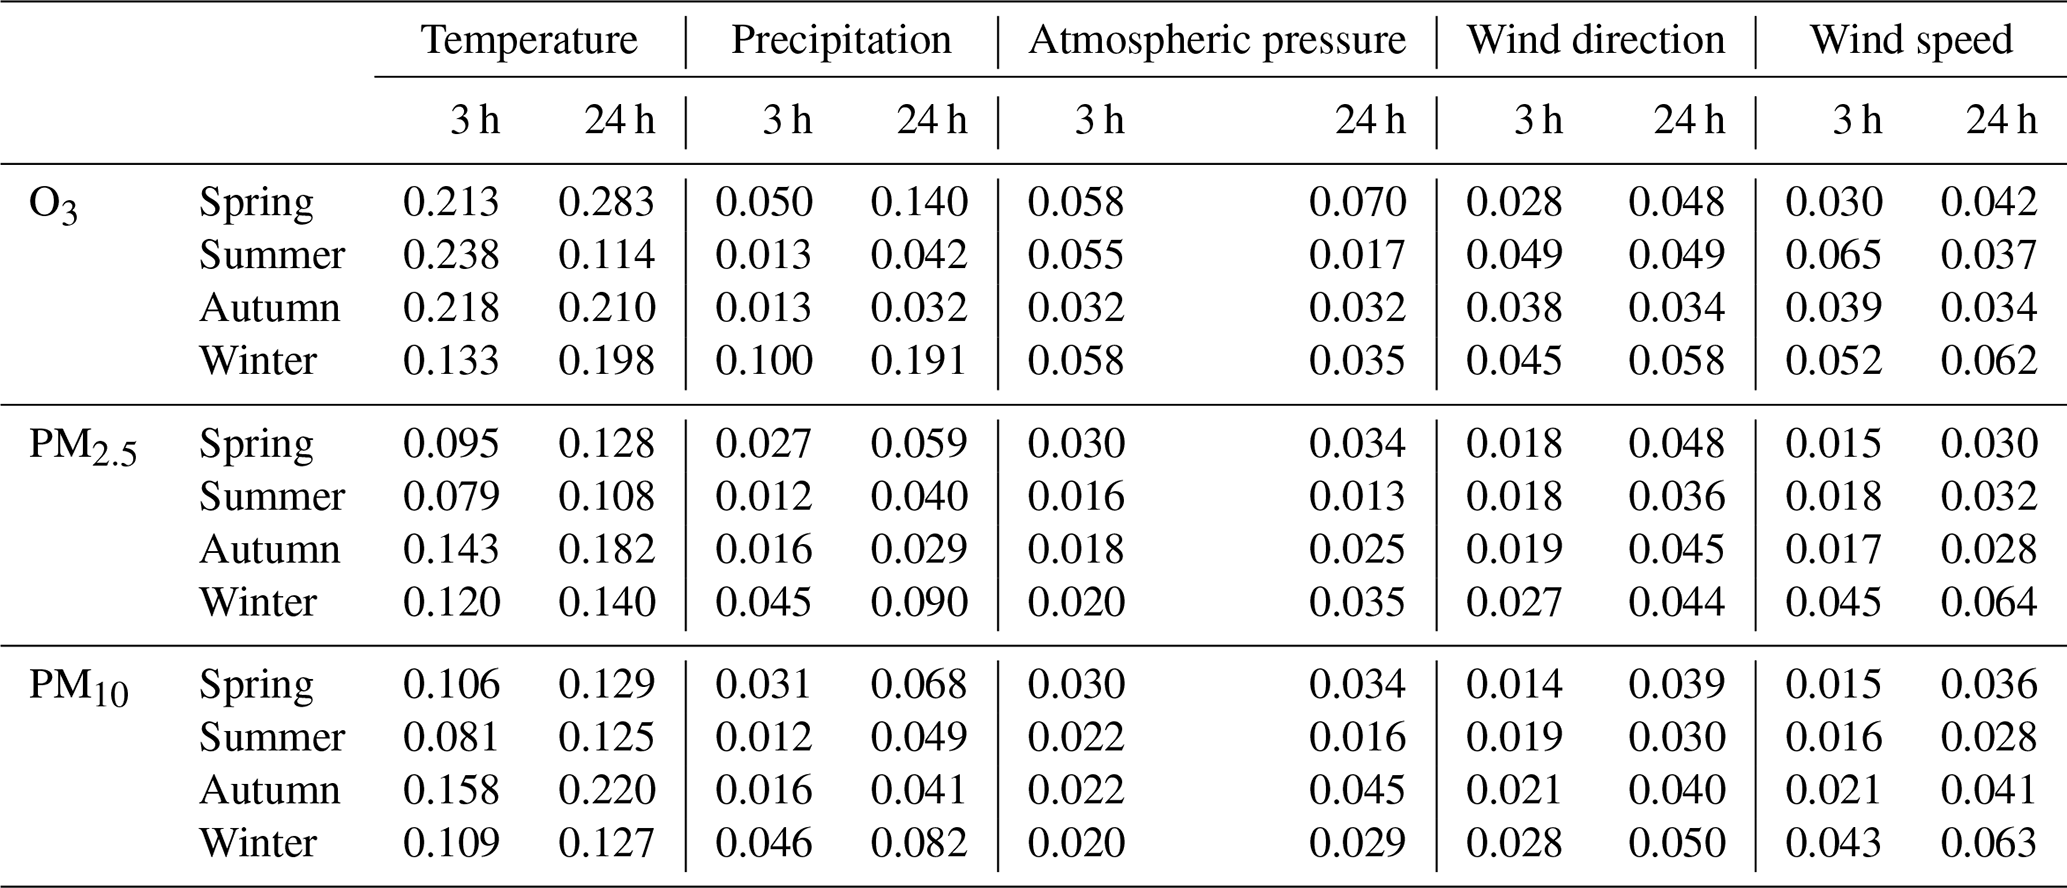
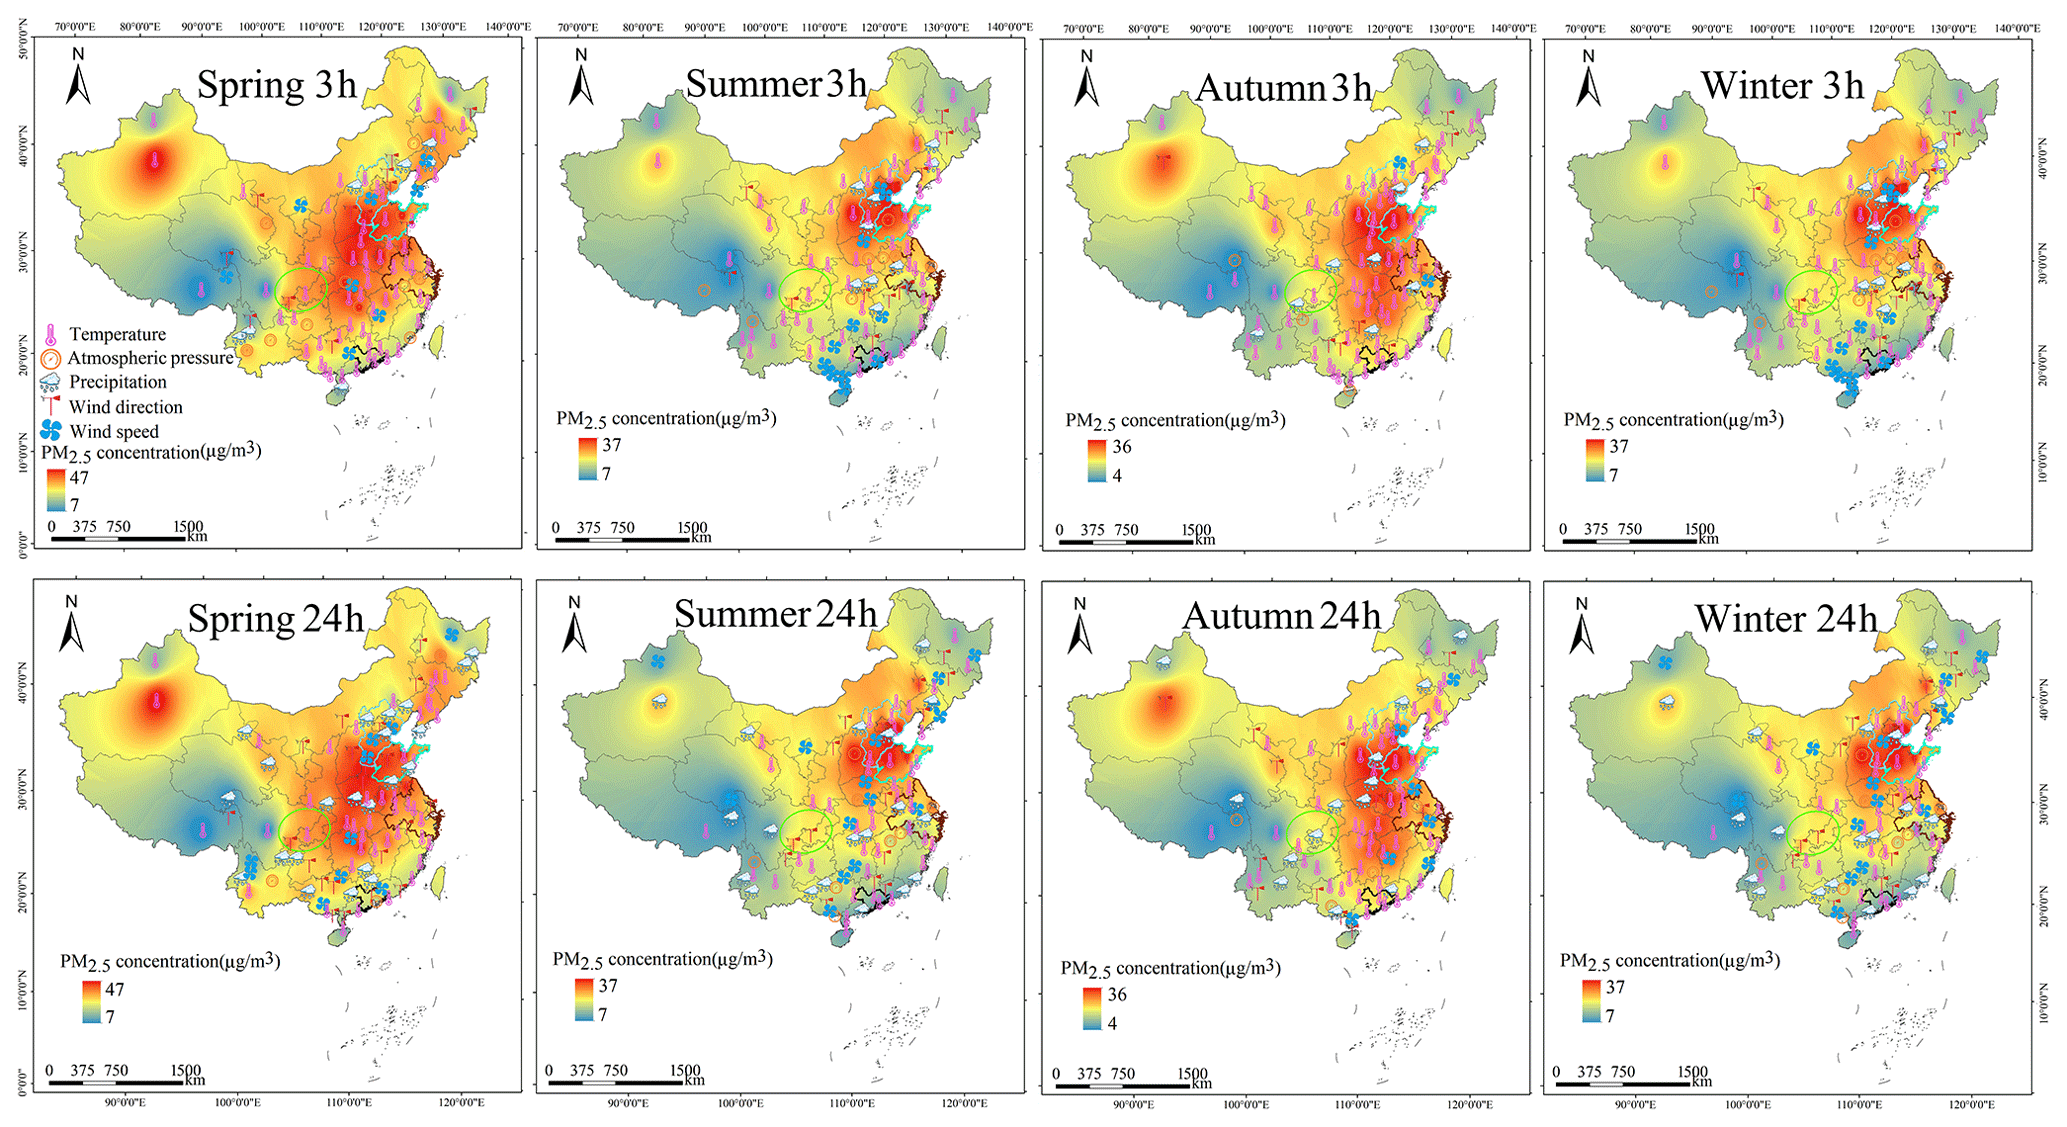
Figure 3The dominant meteorological factor for PM2.5 concentrations across China at 3 and 24 h scales. Publisher's remark: please note that the above figure contains disputed territories.
3.3 The spatial patterns of dominant meteorological factors for PM2.5, PM10 and O3 across China at 3 and 24 h scales
All the locations of the mentioned regions have been marked in Fig. 2. As shown in Figs. 3, 4 and 5, the influence of meteorological factors on airborne pollutants has obvious seasonal variations and presented some regional similarity. The seasonal concentration of air pollutant data for each city is calculated using the average of hourly concentration data measured by all available local observation stations. For PM2.5 (Fig. 3) and PM10 (Fig. 4), the dominant meteorological factor for northeast China was mainly wind, especially the heavily polluted winter, while the dominant meteorological factor for the Yangtze River Delta was mainly precipitation at both the 3 and 24 h scales. The dominant meteorological factor for Shandong Peninsula in spring and autumn, for southern China in summer, for northern and coastal areas in autumn and for northeast China in winter is also consistent at different temporal scales. For O3 (Fig. 5), especially the heavily polluted summer, temperature presented a prevailing role across the nation and was the dominant role for most cities. This output was consistent with our previous studies (Chen et al., 2018, 2019a), suggesting that the general national trend of pollutant–meteorology association varied limitedly across temporal scales of research data, especially in those heavily polluted regions. Meanwhile, for those regions where the airborne pollution was not severe and homogeneous, the temporal issues of meteorological influences on PM were notable and thus the dominant meteorological factor in these regions presented notable differences at 3 and 24 h scales.
Based on the extracted pollutant–meteorology associations at the 3 h scale, which have rarely been discussed, we found some interesting differences between 3 and 24 h in some major regions across China. For the heavily polluted Beijing–Tianjin–Hebei region, the dominant meteorological factor for O3 in spring was temperature at the 3 h scale. Meanwhile, the dominant factor was wind speed at the 24 h scale. For PM2.5, the dominant factor for PM2.5 in spring was temperature at the 3 h scale and wind speed at the 24 h scale. The dominant meteorological factor for PM10 in summer was temperature at the 3 h scale and precipitation at the 24 h scale.
For the Yangtze River Delta, the dominant meteorological factor for O3 in spring was temperature at the 3 h scale and the combination of temperature and precipitation at the 24 h scale. In summer, the dominant meteorological factor for O3 was temperature at the 3 h scale and wind speed at the 24 h scale. The dominant factor of PM2.5 in spring was temperature at the 3 h scale and the combination of temperature and precipitation at the 24 h scale. The dominant factor of PM10 in spring was mainly temperature at the 3 h scale and wind speed at the 24 h scale. For the Pearl River Delta, the dominant meteorological factor for O3 in winter was temperature at the 3 h scale and precipitation at the 24 h scale.
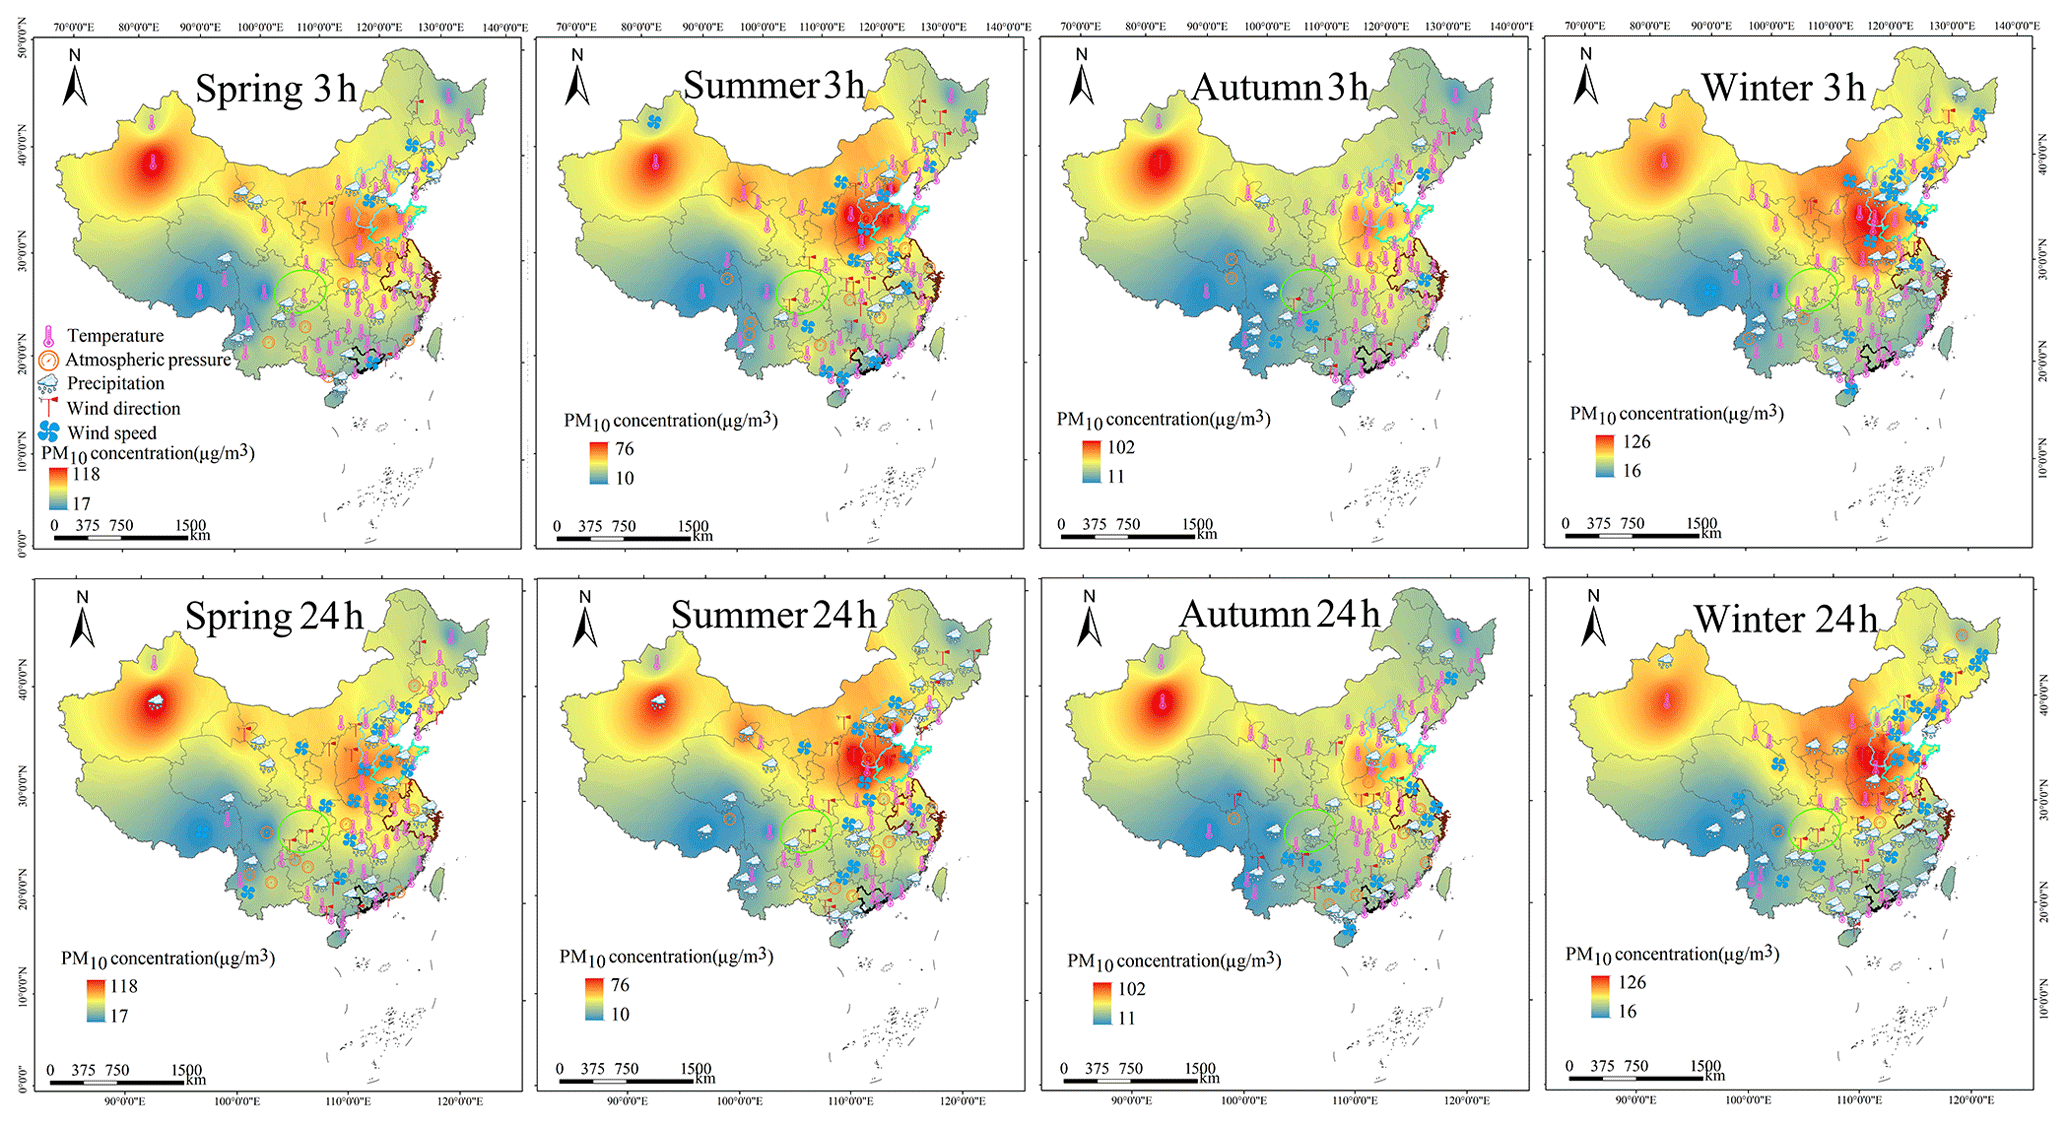
Figure 4The dominant meteorological factor for PM10 concentrations across China at 3 and 24 h scales. Publisher's remark: please note that the above figure contains disputed territories.
For the Sichuan Basin, the dominant meteorological factor for O3 in all four seasons was temperature at the 3 h scale, while it was precipitation, atmospheric pressure and wind speed in summer, autumn and winter respectively at the 24 h scale. The dominant meteorological element for PM2.5 was temperature in all four seasons at the 3 h scale, while it was precipitation in summer and winter at the 24 h scale. The dominant meteorological element for PM10 in spring and winter was temperature at the 3 h scale, while it was atmospheric pressure for spring and winter at the 24 h scale. Compared with other regions, the unique basin terrain led to stronger temporal effects on extracted pollutant–meteorology associations.
Our previous studies (Chen et al., 2018, 2020) revealed that meteorological influences exerted a stronger influence on PM pollutants when PM concentration is higher. This might be the reason that the difference of PM–meteorology associations between 3 and 24 h was relatively small in the heavily polluted winter and large in less polluted spring. Meanwhile, we found that the role of wind speed and precipitation may be largely underestimated at the 3 h scale. Compared with the generally consistent pollutant–meteorology associations in these heavily polluted regions, the dominant factor for PM and O3 demonstrated significant variations in those coastal cities, such as Shenzhen, Zhuhai and Zhanjiang.
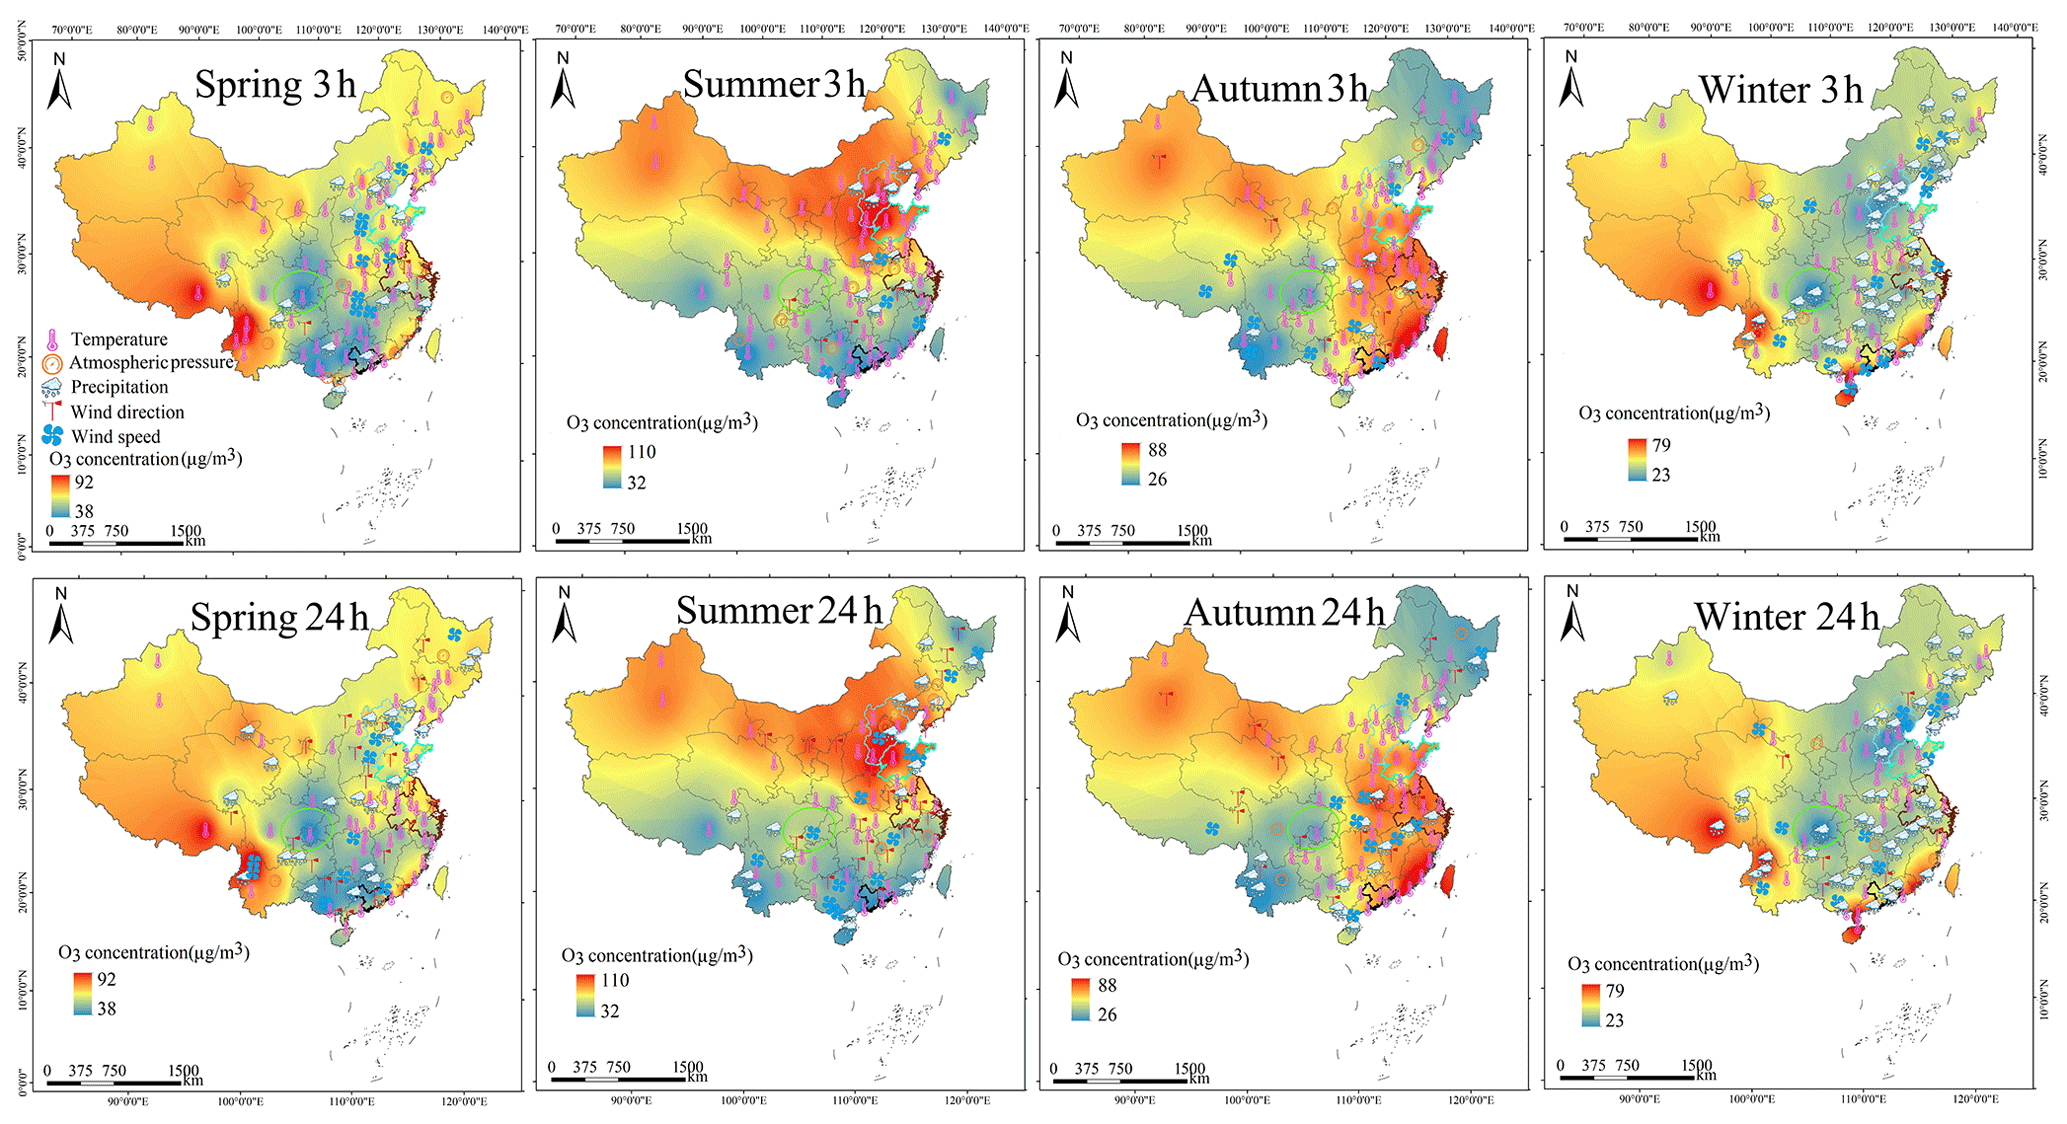
Figure 5The dominant meteorological factor for O3 concentrations across China at 3 and 24 h scales. Publisher's remark: please note that the above figure contains disputed territories.
Although previous studies (Tai et al., 2010; Hu et al., 2021b; Yousefian et al., 2021; Zhong et al., 2021) pointed out the notable differences of pollutant–meteorology associations at different temporal scales and the great importance of better understanding the temporal effects, few studies actually conducted a comparative analysis due to the lack of data, especially the high-temporal-resolution meteorological data. This research suggests that the temporal effects on pollutant–meteorology association are significantly strong. While there is an obvious quantitative difference in the influence of individual factors on PM2.5, PM10 and O3 (as shown in Fig. 1), we found a very low consistence between extracted dominant meteorological factors (the consistence was less than 50 % for all pollutants), indicating strong temporal effects even from a qualitative perspective. Based on the comparison of extracted pollutant–meteorology association at the 3 and 24 h scales, there were no fixed spatiotemporal patterns of pollutant–meteorology association across temporal scales. However, we came to some major conclusions. Firstly, we found the temporal effects of meteorological influences on different PM (e.g. PM2.5 and PM) were similar, yet notably different from that on gaseous pollutants (e.g. O3). Secondly, there were notable differences in the temporal effects between different meteorological factors. The variation of pollutant–meteorology association for those factors with a continuous observation record (e.g. temperature) was notably different from those factors with a discrete observation record (e.g. precipitation) at the 3 and 24 h scales. The role of wind speed and precipitation, which may be recognised as dominant meteorological factors at the 24 h scale, can be largely underestimated at the 3 h scale. Thirdly, the effects of temporal scales on pollutant–meteorology association varied significantly across seasons, characterised by notable differences between heavily polluted and less polluted seasons (i.e. the heavily polluted season for O3 was summer and for PM was winter). Despite a complicated pattern, we found that the heavier the pollution, the stronger the pollutant–meteorology association was. Consequently, in the heavily polluted season, the short-term (e.g. 3 h) variation of specific meteorological factors (e.g. temperature, wind speed) exerted a stronger influence on PM and O3 than the daily variation. The concentrations of PM and O3 largely depend on wind conditions. High O3 concentrations in different cities usually occur in the presence of strong wind speed but are independent of wind direction, while high PM is often accompanied by weak wind speed and poor dispersion conditions, and it sometimes occurs in strong northerly or southerly winds. The regional transport of air pollutants between cities is common (Li et al., 2019). As a comparison, in the less polluted season, the daily accumulation of specific meteorological factors exerted a stronger influence on airborne pollutants than short-term (e.g. 3 h) accumulation. While the general trend of pollutant–meteorology association was consistent with previous studies, the general p value was slightly smaller for this research. The underlying reason may be the reduced PM2.5 concentration in 2020 caused by the emission cut during COVID-19. As explained in our previous study (Chen et al., 2018), the higher the PM2.5 concentration, the stronger the meteorological influence on PM2.5 concentrations. Similarly to our previous studies (Chen et al., 2017, 2018, 2022), we conducted the CCM analysis at the seasonal scale. This is because the large seasonal variation of pollutant–meteorology association may cause an insignificant output of CCM for an entire-year analysis and cause large uncertainties.
This research suggests that the temporal scale played a complex role and higher temporal resolution did not guarantee a stronger pollutant–meteorology association. For instance, for hot seasons (e.g. summertime O3) the reaction between O3 precursors was strong and quick, and thus the 3 h resolution could better feature the influence of temperature on O3 concentrations. Meanwhile, the secondary reaction for PM2.5 was relatively slow (Chen et al., 2016), and the daily variation of temperature and PM2.5 concentrations presented a stronger association than the hourly variation of temperature and PM2.5 concentrations. Similarly, due to the discrete distribution, the daily influence of daily total precipitation on daily PM2.5 concentrations was also notably stronger than the influence of 3 h precipitation on 3 h PM2.5 concentrations. Furthermore, this type of uncertainty was not predictable across regions. Given the complex effects of temporal scales on pollutant–meteorology association, scholars should properly choose the temporal resolution of research data according to the aims, study sites, pollutant types and seasons. With the growing availability of long-term meteorological and pollutant data, multi-scale, instead of high-temporal-resolution, research is recommended to comprehensively understand the short- and long-term meteorological influences on different airborne pollutants.
For future research, the temporal effects of influence of meteorological factors (e.g. humidity, boundary layer height) on airborne pollutants should also be explored with the availability of new data sources. On the other hand, this research proved the important role of temporal scales in quantifying the influence of meteorological factors on airborne pollutants. Similarly, when inferring the association between precursors (e.g. NO2, volatile organic compounds – VOCs) and airborne pollutants, the temporal scales, which were rarely considered in previous studies, should also be comprehensively taken into account. The reaction rate between different precursors and the target pollutants in different regions and seasons could be better understood through multi-scale causation analysis. CCM is an ideal tool for quantifying the influence of individual meteorological factors on PM2.5 concentrations, as it can effectively remove the influence of other meteorological factors. Therefore, this research revealed a strong temporal effect on pollutant–meteorology association, from the perspective of the association of individual meteorological factors. However, admittedly, CCM is limited in establishing the overall effects of multiple meteorological factors on PM2.5 concentrations. Instead, other models such as GAM (generalised additive model), which are limited in extracting the association between PM2.5 and individual meteorological factors, are advantageous in extracting the overall influence of multiple meteorological factors on airborne pollutants (Gong et al., 2017; Zheng et al., 2018; Hu et al., 2021a). When such 3 h meteorological data sets become more easily available and include a complete set of meteorological factors, we could also employ GAMs or chemical transport models (CTMs) to investigate the temporal effects on the combined effects of meteorological factors on airborne pollutants.
We employed CCM to compare the influence of major meteorological factors (temperature, precipitation, wind speed, wind direction and atmospheric pressure) on PM2.5, PM10 and O3 concentrations in 101 cities across China at the 3 and 24 h scales in 2020. Results revealed a strong effect of temporal scales on the pollutant–meteorology association from different perspectives. In terms of the extracted dominant meteorological factor, the consistence between the analysis at 3 and 24 h scales was relatively low (the consistence for all pollutants was less than 50 %), suggesting a large difference even from a qualitative perspective. In terms of the mean p value, the effect of temporal scale on the influence of individual meteorological factors on particulate matter (PM2.5 and PM10) was consistent, which was largely different from the temporal-scale effect on gaseous pollutants. Temperature was the most important meteorological factor for PM2.5, PM10 and O3 across China at both the 3 and 24 h scales. For PM2.5 and PM10, the secondary reaction was less intense and the extracted PM–temperature association at the 24 h scale was stronger than that at the 3 h scale. Meanwhile, for summer O3, due to the quick and strong reactions between precursors, the extracted O3–temperature association at the 3 h scale was much stronger than that at the 24 h scale. Due to the discrete distribution, the extracted association between all pollutants and precipitation was much weaker at the 3 h scale. Similarly, the extracted PM–wind association was notably weaker at the 3 h scale. Due to the transport of precursors, summertime O3–wind association was stronger at the 3 h scale. For atmospheric pressure, the pollutant–pressure association was weaker at the 3 h scale except for summer, when the interactions between atmospheric pressure and other meteorological factors were strong. From the spatial perspective, pollutant–meteorology associations at 3 and 24 h were more consistent in those heavily polluted regions, while extracted dominant meteorological factors for pollutants demonstrated more differences at 3 and 24 h in the less polluted regions. This research provides a comprehensive understanding of the effect of temporal scales on pollutant–meteorology association and sheds useful light on better extracting the natural and anthropogenic drivers for airborne pollution.
The CCM code used for this research are available in the article (https://doi.org/10.1126/science.1227079).
The PM2.5 code used for this research are available at https://www.cma.gov.cn/en2014/ (China Meteorological Administration, 2023), while meteorological data are available at http://www.cnemc.cn/ (China National Environmental Monitoring Center, 2023).
MX and ZC designed the study,performed data analysis and wrote the manuscript. JY, ML and XC contributed to the data preprocessing and analysis and the figure production. QL. QY and BG contributed to the research design, proof reading and revision.
The contact author has declared that none of the authors has any competing interests.
Publisher’s note: Copernicus Publications remains neutral with regard to jurisdictional claims made in the text, published maps, institutional affiliations, or any other geographical representation in this paper. While Copernicus Publications makes every effort to include appropriate place names, the final responsibility lies with the authors.
This work was supported by the National Natural Science Foundation of China (grant no. 42171399)
This work was supported by the Open Research Program of the International Research Center of Big Data for Sustainable Development Goals (grant no. CBAS2022ORP02) and National Natural Science Foundation of China (grant no.42171399).
This paper was edited by Xavier Querol and reviewed by two anonymous referees.
Chen, Z., Xu, B., Cai, J., and Gao, B.: Understanding temporal patterns and characteristics of air quality in Beijing: A local and regional perspective, Atmos. Environ., 127, 303–315, 2016.
Chen, Z., Cai, J., Gao, B., Xu, B., Dai, S., and He, B.: Detecting the causality influence of individual meteorological factors on local PM2.5 concentration in the jing-jin-ji region, Sci. Rep.-UK, 7, 40735, https://doi.org/10.1038/srep40735, 2017.
Chen, Z., Xie, X., Cai, J., Chen, D., Gao, B., He, B., Cheng, N., and Xu, B.: Understanding meteorological influences on PM2.5 concentrations across China: a temporal and spatial perspective, Atmos. Chem. Phys., 18, 5343–5358, https://doi.org/10.5194/acp-18-5343-2018, 2018.
Chen, Z., Chen, D., Xie, X., Cai, J., Zhuang, Y., Cheng, N., He, B., and Gao, B.: Spatial self-aggregation effects and national division of city-level PM2.5 concentrations in china based on spatio-temporal clustering, J. Clean. Prod., 207, 875–881, https://doi.org/10.1016/j.jclepro.2018.10.080, 2019a.
Chen, Z., Zhuang, Y., Xie, X., Chen, D., Cheng, N., and Yang, L.: Understanding long-term variations of meteorological influences on ground ozone concentrations in beijing during 2006–2016, Environ. Pollut., 245, 29–37, https://doi.org/10.1016/j.envpol.2018.10.117, 2019b.
Chen, Z., Chen, D., Kwan, M.-P., Chen, B., Gao, B., Zhuang, Y., Li, R., and Xu, B.: The control of anthropogenic emissions contributed to 80 % of the decrease in PM2.5 concentrations in Beijing from 2013 to 2017, Atmos. Chem. Phys., 19, 13519–13533, https://doi.org/10.5194/acp-19-13519-2019, 2019c.
Chen, Z., Chen, D., Zhao, C., Kwan, M.P., Cai, J., Zhuang, Y., Zhao, B., Wang, X., Chen, B., Yang, J., Li, R., He, B., Gao, B., Wang, K., and Xu, B.: Influence of meteorological conditions on PM2.5 concentrations across China: A review of methodology and mechanism, Environ. Int., 139, 105558, https://doi.org/10.1016/j.envint.2020.105558, 2020a.
Chen, Z., Li, R., Chen, D., Zhuang, Y., Gao, B., Yang, L., and Li, M.: Understanding the causal influence of major meteorological factors on ground ozone concentrations across china, J. Clean. Prod., 242, 118498, https://doi.org/10.1016/j.jclepro.2019.118498, 2020b.
Chen, Z., Xu, M., Gao, B., Sugihara, G., Shen, F., Cai, Y., Li, A., Wu, Q., Yang, L., Yao, Q., Chen, X., Yang, J., Zhou, C., and Li, M.: Causation inference in complicated atmospheric environment, Environ. Pollut., 303, 119057, https://doi.org/10.1016/j.envpol.2022.119057, 2022.
Cheng, N., Zhang, D., Li, Y., Xie, X., Chen, Z., Meng, F., Gao, B., and He, B.: Spatio-temporal variations of PM2.5 concentrations and the evaluation of emission reduction measures during two red air pollution alerts in beijing, Sci. Rep.-UK, 7, 8220, https://doi.org/10.1038/s41598-017-08895-x, 2017.
Cheng, N., Chen, Z., Sun, F., Sun, R., Dong, X., Xie, X., and Xu, C.: Ground ozone concentrations over Beijing from 2004 to 2015: Variation patterns, indicative precursors and effects of emission-reduction, Environ. Pollut., 237, 262–274, https://doi.org/10.1016/j.envpol.2018.02.051, 2018.
Cheng, N., Li, R., Xu, C., Chen, Z., Chen, D., Meng, F., Cheng, B., Ma, Z., Zhuang, Y., He, B., and Gao, B.: Ground ozone variations at an urban and a rural station in Beijing from 2006 to 2017: Trend, meteorological influences and formation regimes, J. Clean. Prod., 235, 11–20, https://doi.org/10.1016/j.jclepro.2019.06.204, 2019.
China Meteorological Administration: https://www.cma.gov.cn/en2014/, [data set], last access: 25 January 2023.
China National Environmental Monitoring Center: http://www.cnemc.cn/, [data set], last access: 25 January 2023.
Fu, H., Zhang, Y., Liao, C., Mao, L., Wang, Z., and Hong, N.: Investigating PM2.5 responses to other air pollutants and meteorological factors across multiple temporal scales, Sci. Rep.-UK, 10, 1–10, https://doi.org/10.1038/s41598-020-72722-z, 2020.
Gao, B., Li, M., Wang, J., and Chen, Z.: Temporally or spatially? Causation inference in Earth System Sciences, Sci. Bull., 67, 232–235, https://doi.org/10.1016/j.scib.2021.10.002, 2022.
Gao, J., Woodward, A., Vardoulakis, S., Kovats, S., Wilkinson, P., Li, L., Xu, L., Li, J., Yang, J., Li, J., Cao, L., Liu, X., Wu, H., and Liu, Q.: Haze, public health and mitigation measures in China: A review of the current evidence for further policy response, Sci. Total Environ., 578, 148–157, https://doi.org/10.1016/j.scitotenv.2016.10.231, 2017.
Guo, J., Chen, X., Su, T., Liu, L., Zheng, Y., Chen, D., Li, J., Xu, H., Lv, Y., He, B., Li, Y., Hu, X., Ding, A., and Zhai, P.: The climatology of lower tropospheric temperature inversions in China from radiosonde measurements: roles of black carbon, local meteorology, and large-scale subsidence, J. Climate., 33, 9327–9350, https://doi.org/10.1175/JCLI-D-19-0278.1, 2020.
Gong, X., Kaulfas, A., Nair, U., and Jaffe, D. A.: Quantifying O3 impacts in urban areas due to wildfires using a generalized additive model, Environ. Sci. Technol., 51, 13216, https://doi.org/10.1021/acs.est.7b03130, 2017.
Hu, C., Kang, P., Jaffe, D. A., Li, C., Zhang, X., Wu, K., and Zhou, M.: Understanding the impact of meteorology on ozone in 334 cities of China, Atmos. Environ., 248, 118221, https://doi.org/10.1016/j.atmosenv.2021.118221, 2021a.
Hu, M., Wang, Y., Wang, S., Jiao, M., Huang, G., and Xia, B.: Spatial-temporal heterogeneity of air pollution and its relationship with meteorological factors in the Pearl River Delta, China, Atmos. Environ., 254, 118415, https://doi.org/10.1016/j.atmosenv.2021.118415, 2021b.
Kelly, F. J. and Fussell, J. C.: Air pollution and public health: emerging hazards and improved understanding of risk, Environ. Geochem. Hlth., 37, 631–649, https://doi.org/10.1007/s10653-015-9720-1, 2015.
Li, X., Hu, X., Shi, S., Shen, L., Luan, L., and Ma, Y.: Spatiotemporal variations and regional transport of air pollutants in two urban agglomerations in northeast china plain, Chin. Geogr. Sci. 29, 917–933, https://doi.org/10.1007/s11769-019-1081-8, 2019.
Nelson, M.: Biosphere 2's Lessons about Living on Earth and in Space, Space Sci. Technol., 2021, 8067539, https://doi.org/10.34133/2021/8067539, 2021.
Sugihara, G., May, R., Ye, H., Hsieh, C. H., Deyle, E., Fogarty, M., and Munch, S.: Detecting causality in complex ecosystems, Science, 338, 496–500, https://doi.org/10.1126/science.1227079, 2012.
Tai, A. P., Mickley, L. J., and Jacob, D. J.: Correlations between fine particulate matter (PM2.5) and meteorological variables in the United States: Implications for the sensitivity of PM2.5 to climate change, Atmos. Environ., 44, 3976–3984, https://doi.org/10.1016/j.atmosenv.2010.06.060, 2010.
Wang, B., Liu, S., Du, Q., and Yan, Y.: Long term causality analyses of industrial pollutants and meteorological factors on PM2.5 concentrations in Zhejiang Province, in: 2018 5th International Conference on Information Science and Control Engineering (ICISCE), IEEE, 301–305 https://doi.org/10.1109/ICISCE.2018.00070, 2018.
Wang, X., Zhang, R., Tan, Y., and Yu, W.: Dominant synoptic patterns associated with the decay process of PM2.5 pollution episodes around Beijing, Atmos. Chem. Phys., 21, 2491–2508, https://doi.org/10.5194/acp-21-2491-2021, 2021a.
Wang, N., Xu, J., Pei, C., Tang, R., Zhou, D., Chen, Y., Li, M., Deng, X., Deng, T., Huang, and Ding, A.: Air quality during COVID-19 lockdown in the Yangtze River Delta and the Pearl River Delta: Two different responsive mechanisms to emission reductions in China, Environ. Sci. Technol., 55, 5721–5730, https://doi.org/10.1021/acs.est.0c08383, 2021b.
Wang, Z., Li, R., Chen, Z., Yao, Q., Gao, B., Xu, M., Yang, L., Li, M., and Zhou, C.: The estimation of hourly PM2.5 concentrations across China based on a Spatial and Temporal Weighted Continuous Deep Neural Network (STWC-DNN), ISPRS J. Photogramm. Remote. Sens., 190, 38–55, https://doi.org/10.1016/j.isprsjprs.2022.05.011, 2021.
Xiao, Q., Geng, G., Liang, F., Wang, X., Lv, Z., Lei, Y., Huang, X., Zhang, Q., Liu, Y., and He, K.: Changes in spatial patterns of PM2.5 pollution in China 2000–2018: Impact of clean air policies, Environ. Int., 141, 105776, https://doi.org/10.1016/j.envint.2020.105776, 2020.
Xu, M., Yao, Q., Chen, D., Li, M., Li, R., Gao, B., Zhao, B., and Chen, Z.: Estimating the impact of ground ozone concentrations on crop yields across China from 2014 to 2018: A multi-model comparison, Environ. Pollut., 283, 117099, https://doi.org/10.1016/j.envpol.2021.117099, 2021.
Yang, Z., Yang, J., Li, M., Chen, J., and Ou, C. Q.: Nonlinear and lagged meteorological effects on daily levels of ambient PM2.5 and O3: Evidence from 284 Chinese cities, J. Clean. Prod., 278, 123931, https://doi.org/10.1016/j.jclepro.2020.123931, 2017.
Yin, P., Guo, J., Wang, L., Fan, W., Lu, F., Guo, M., Moreno, S. B. R., Wang, Y., Wang, H., Zhou, M., and Dong, Z.: Higher risk of cardiovascular disease associated with smaller size-fractioned particulate matter, Environ. Sci. Tech. Lett., 7, 95–101, https://doi.org/10.1021/acs.estlett.9b00735, 2020.
Yousefian, F., Faridi, S., Azimi, F., Aghaei, M., Shamsipour, M., Yaghmaeian K., and Hassanvand, M. S.: Temporal variations of ambient air pollutants and meteorological influences on their concentrations in tehran during 2012–2017, Sci. Rep.-UK, 10, 292, https://doi.org/10.1038/s41598-019-56578-6, 2021.
Zhai, S., Jacob, D. J., Wang, X., Shen, L., Li, K., Zhang, Y., Gui, K., Zhao, T., and Liao, H.: Fine particulate matter (PM2.5) trends in China, 2013–2018: separating contributions from anthropogenic emissions and meteorology, Atmos. Chem. Phys., 19, 11031–11041, https://doi.org/10.5194/acp-19-11031-2019, 2019.
Zhan, D., Kwan, M. P., Zhang, W., Wang, S., and Yu, J.: Spatiotemporal variations and driving factors of air pollution in China, Int. J. Environ. Res., 14, 1538, https://doi.org/10.3390/ijerph14121538, 2017.
Zhang, Y., Guo, J., Yang, Y., Wang, Y., and Yim, S.: Vertical wind shear modulates particulate matter pollutions: A perspective from Radar wind profiler observations in Beijing, China, Remote Sens-Basel., 12, 546, https://doi.org/10.1127/0941-2948/2001/0010-0443, 2020.
Zheng, B., Tong, D., Li, M., Liu, F., Hong, C., Geng, G., Li, H., Li, X., Peng, L., Qi, J., Yan, L., Zhang, Y., Zhao, H., Zheng, Y., He, K., and Zhang, Q.: Trends in China's anthropogenic emissions since 2010 as the consequence of clean air actions, Atmos. Chem. Phys., 18, 14095–14111, https://doi.org/10.5194/acp-18-14095-2018, 2018.
Zhong, Q., Tao, S., Ma, J., Liu, J., Shen, H., Shen, G., Guan, D., Yun, X., Meng, W., Yu, X., Cheng, H., Zhu, D., Wan, Y., and Hu, J.: PM2.5 reductions in Chinese cities from 2013 to 2019 remain significant despite the inflating effects of meteorological conditions, One Earth, 4, 448–458, https://doi.org/10.1016/j.oneear.2021.02.003, 2021.
Zhou, L., Chen, X., and Tian, X.: The impact of fine particulate matter (PM2.5) on China's agricultural production from 2001 to 2010, J. Clean. Prod., 178, 133–141, https://doi.org/10.1016/j.jclepro.2017.12.204, 2018.