the Creative Commons Attribution 4.0 License.
the Creative Commons Attribution 4.0 License.
 | 07 Nov 2023
Technical note: Gas-phase nitrate radical generation via irradiation of aerated ceric ammonium nitrate mixtures
Bin Bai
Masayuki Takeuchi
Nicole Orwat
Paul M. Zimmerman
Mitchell W. Alton
Nga L. Ng
Andrew Freedman
Megan S. Claflin
Drew R. Gentner
Douglas R. Worsnop
Pengfei Liu
We present a novel photolytic source of gas-phase NO3 suitable for use in atmospheric chemistry studies that has several advantages over traditional sources that utilize NO2 + O3 reactions and/or thermal dissociation of dinitrogen pentoxide (N2O5). The method generates NO3 via irradiation of aerated aqueous solutions of ceric ammonium nitrate (CAN, (NH4)2Ce(NO3)6) and nitric acid (HNO3) or sodium nitrate (NaNO3). We present experimental and model characterization of the NO3 formation potential of irradiated CAN HNO3 and CAN NaNO3 mixtures containing [CAN] = 10−3 to 1.0 M, [HNO3] = 1.0 to 6.0 M, [NaNO3] = 1.0 to 4.8 M, photon fluxes (I) ranging from 6.9 × 10¹⁴ to 1.0 × 10¹⁶ photons cm−2 s−1, and irradiation wavelengths ranging from 254 to 421 nm. NO3 mixing ratios ranging from parts per billion to parts per million by volume were achieved using this method. At the CAN solubility limit, maximum [NO3] was achieved using [HNO3] ≈ 3.0 to 6.0 M and UVA radiation (λmax = 369 nm) in CAN HNO3 mixtures or [NaNO3] ≥ 1.0 M and UVC radiation (λmax = 254 nm) in CAN NaNO3 mixtures. Other reactive nitrogen (NO2, N2O4, N2O5, N2O6, HNO2, HNO3, HNO4) and reactive oxygen (HO2, H2O2) species obtained from the irradiation of ceric nitrate mixtures were measured using a NOx analyzer and an iodide-adduct high-resolution time-of-flight chemical ionization mass spectrometer (HR-ToF-CIMS). To assess the applicability of the method for studies of NO3-initiated oxidative aging processes, we generated and measured the chemical composition of oxygenated volatile organic compounds (OVOCs) and secondary organic aerosol (SOA) from the β-pinene + NO3 reaction using a Filter Inlet for Gases and AEROsols (FIGAERO) coupled to the HR-ToF-CIMS.
- Article
(7535 KB) - Full-text XML
-
Supplement
(4762 KB) - BibTeX
- EndNote


The importance of NO3 as a nighttime atmospheric oxidant is well established (Wayne et al., 1991; Brown and Stutz, 2012; Ng et al., 2017; Wang et al., 2023). NO3 is generated via the reaction NO2 + O3 → NO3 + O2, followed by achievement of temperature-dependent equilibrium between NO3, NO2, and dinitrogen pentoxide (N2O5). N2O5 also hydrolyzes efficiently to HNO3 on aqueous surfaces (Brown et al., 2004). Thus, any investigation of the influence of NO3 chemistry in a specific source region necessarily must account for the local temperature, humidity, and particle surface area along with other factors. Despite these complications, for decades, laboratory studies investigating gas-phase NO3 chemistry have utilized the same NO2 + O3 reactions and/or N2O5 thermal decomposition to produce NO3 as it occurs in the atmosphere and accommodated the inherent limitations associated with N2O5, namely, that it must be stored under cold and dry conditions until use. Few viable alternative methods for the generation of gas-phase NO3 have been identified. Reactions between fluorine atoms and nitric acid (F + HNO3 → HF + NO3) or chlorine atoms and chlorine nitrate (Cl + ClNO3 → Cl2 + NO3) require handling and/or synthesizing hazardous halogen-containing compounds (Burrows et al., 1985; Bedjanian, 2019). F and Cl can also compete with NO3 for the oxidation of target analytes, as can O3 if its reaction with NO2 is used as the NO3 source.
In the 1960s and 1970s, following earlier research into the properties of ceric solutions (Meyer and Jacoby, 1901; Wylie, 1951; Hinsvark and Stone, 1956; Blaustein and Gryder, 1957), Thomas Martin and coworkers discovered that irradiating solutions containing ceric ammonium nitrate (CAN, (NH4)2Ce(NO3)6) generates aqueous NO3 (Henshall, 1963; Martin et al., 1963, 1964; Glass and Martin, 1970; Martin and Glass, 1970; Martin and Stevens, 1978). In ≳ 6 M nitric acid (HNO3), CAN is thought to dissociate primarily into cations and hexanitratocerate () anions (Henshall, 1963). The is subsequently reduced to upon irradiation by ultraviolet light, and NO3 is generated as a primary photolysis product. A similar process occurs in other solvents, although the ensuing ceric composition in solution is complex and influenced by several factors. For example, in glacial acetic acid (CH3COOH), CAN dissociates into primarily Ce(NO3)4 (Henshall, 1963). Additionally, ceric ions containing complexed hydroxyl (OH) or H2O, CH3COOH, or acetonitrile (CH3CN) molecules are formed in aqueous, acetic acid, or CH3CN media, respectively (Henshall, 1963; Glebov et al., 2021). Higher solution acidity and/or CAN concentration appears to promote the formation of (Wylie, 1951) and ceric nitrate dimers (Blaustein and Gryder, 1957; Demars et al., 2015). The following generalized mechanism was proposed by Glass and Martin (1970) to describe ceric nitrate photochemistry:
where Ce(IV) represents ceric nitrates as diverse as Ce(NO3)4, , , and (H2O)3(NO3)3CeOCe(NO3)3(H2O)3 that are potentially formed in solution (Blaustein and Gryder, 1957; Henshall, 1963; Demars et al., 2015). Similarly, Ce(III) represents cerous nitrates such as Ce(NO3)3 and . The rate of Reaction (R2) is [HNO3]-dependent (Martin and Glass, 1970), and the dinitrogen hexaoxide (N2O6) intermediate was proposed on the basis of supporting observations without direct measurements (Glass and Martin, 1970).
CAN is used routinely as an oxidizing agent in organic synthesis due to its widespread availability, low cost, high oxidative potential, and low toxicity (Nair and Deepthi, 2007). However, its usage in atmospheric chemistry to date is limited to studies of NO3-initiated oxidative aging processes in solution; e.g., Alexander (2004). Given the potential simplicity of irradiating Ce(IV) mixtures relative to synthesizing and storing N2O5 under cold and dry conditions or reacting NO2 + O3 under carefully controlled conditions, Ce(IV) irradiation could in principle enable more widespread studies of NO3 oxidation chemistry, which is understudied compared to OH chemistry (Ng et al., 2017). Here, for the first time, we investigated the use of Ce(IV) irradiation as a source of gas-phase NO3. First, we designed a photoreactor that generates gas-phase NO3 from irradiated CAN HNO3 and CAN NaNO3 mixtures. Second, we characterized NO3 concentrations achieved over a range of reactor operating conditions and mixture composition. Third, we characterized gas-phase reactive nitrogen and reactive oxygen species generated following Ce(IV) irradiation. Fourth, we demonstrated application of the method to generate and characterize oxygenated volatile organic compounds (OVOCs) and secondary organic aerosol (SOA) from the β-pinene + NO3 reaction.
2.1 Photoreactor design and operation
Figure 1 shows a schematic of the experimental setup used in this study. A zero-air carrier gas flow of 0.5 L min−1 was bubbled through a gas dispersion line consisting of 6.35 mm o.d. × 4.8 mm i.d. fluorinated ethylene propylene (FEP) tubing into approximately 10 mL of aqueous CAN HNO3 or CAN NaNO3 mixtures placed at the bottom of a 12.7 mm o.d. × 11.1 cm i.d. FEP tube. The FEP tube was surrounded by low-pressure mercury fluorescent lamps installed vertically in a custom enclosure. These lamps had a 35.6 cm illuminated length. At these operating conditions, the calculated gas transit time in the illuminated portion of the reactor was approximately 3 s. After exiting the photoreactor, the carrier gas flow was passed through a filter holder (Savillex, 401-21-47-10-21-2) containing a 47 mm PTFE membrane filter (Pall Gelman, R2PJ047) to transmit NO3 (Wagner et al., 2011) while removing stray droplets from the sample flow. At the end of each experiment, the lamps were turned off, the gas dispersion line was removed from the top of the reactor, and the FEP tubing and filter holder were flushed with distilled H2O to remove residual Ce(III) precipitate. Initial studies were conducted using a cavity-attenuated phase-shift (CAPS) NO2 monitor operating at λ = 405 nm (Kebabian et al., 2005) and a second retrofitted CAPS monitor operating at λ = 630 nm, which established that NO2 and NO3 were produced from irradiated Ce(IV). Subsequent studies described in the next section used a 2B Technologies model 405 analyzer to measure NO and NO2 (Birks et al., 2018).
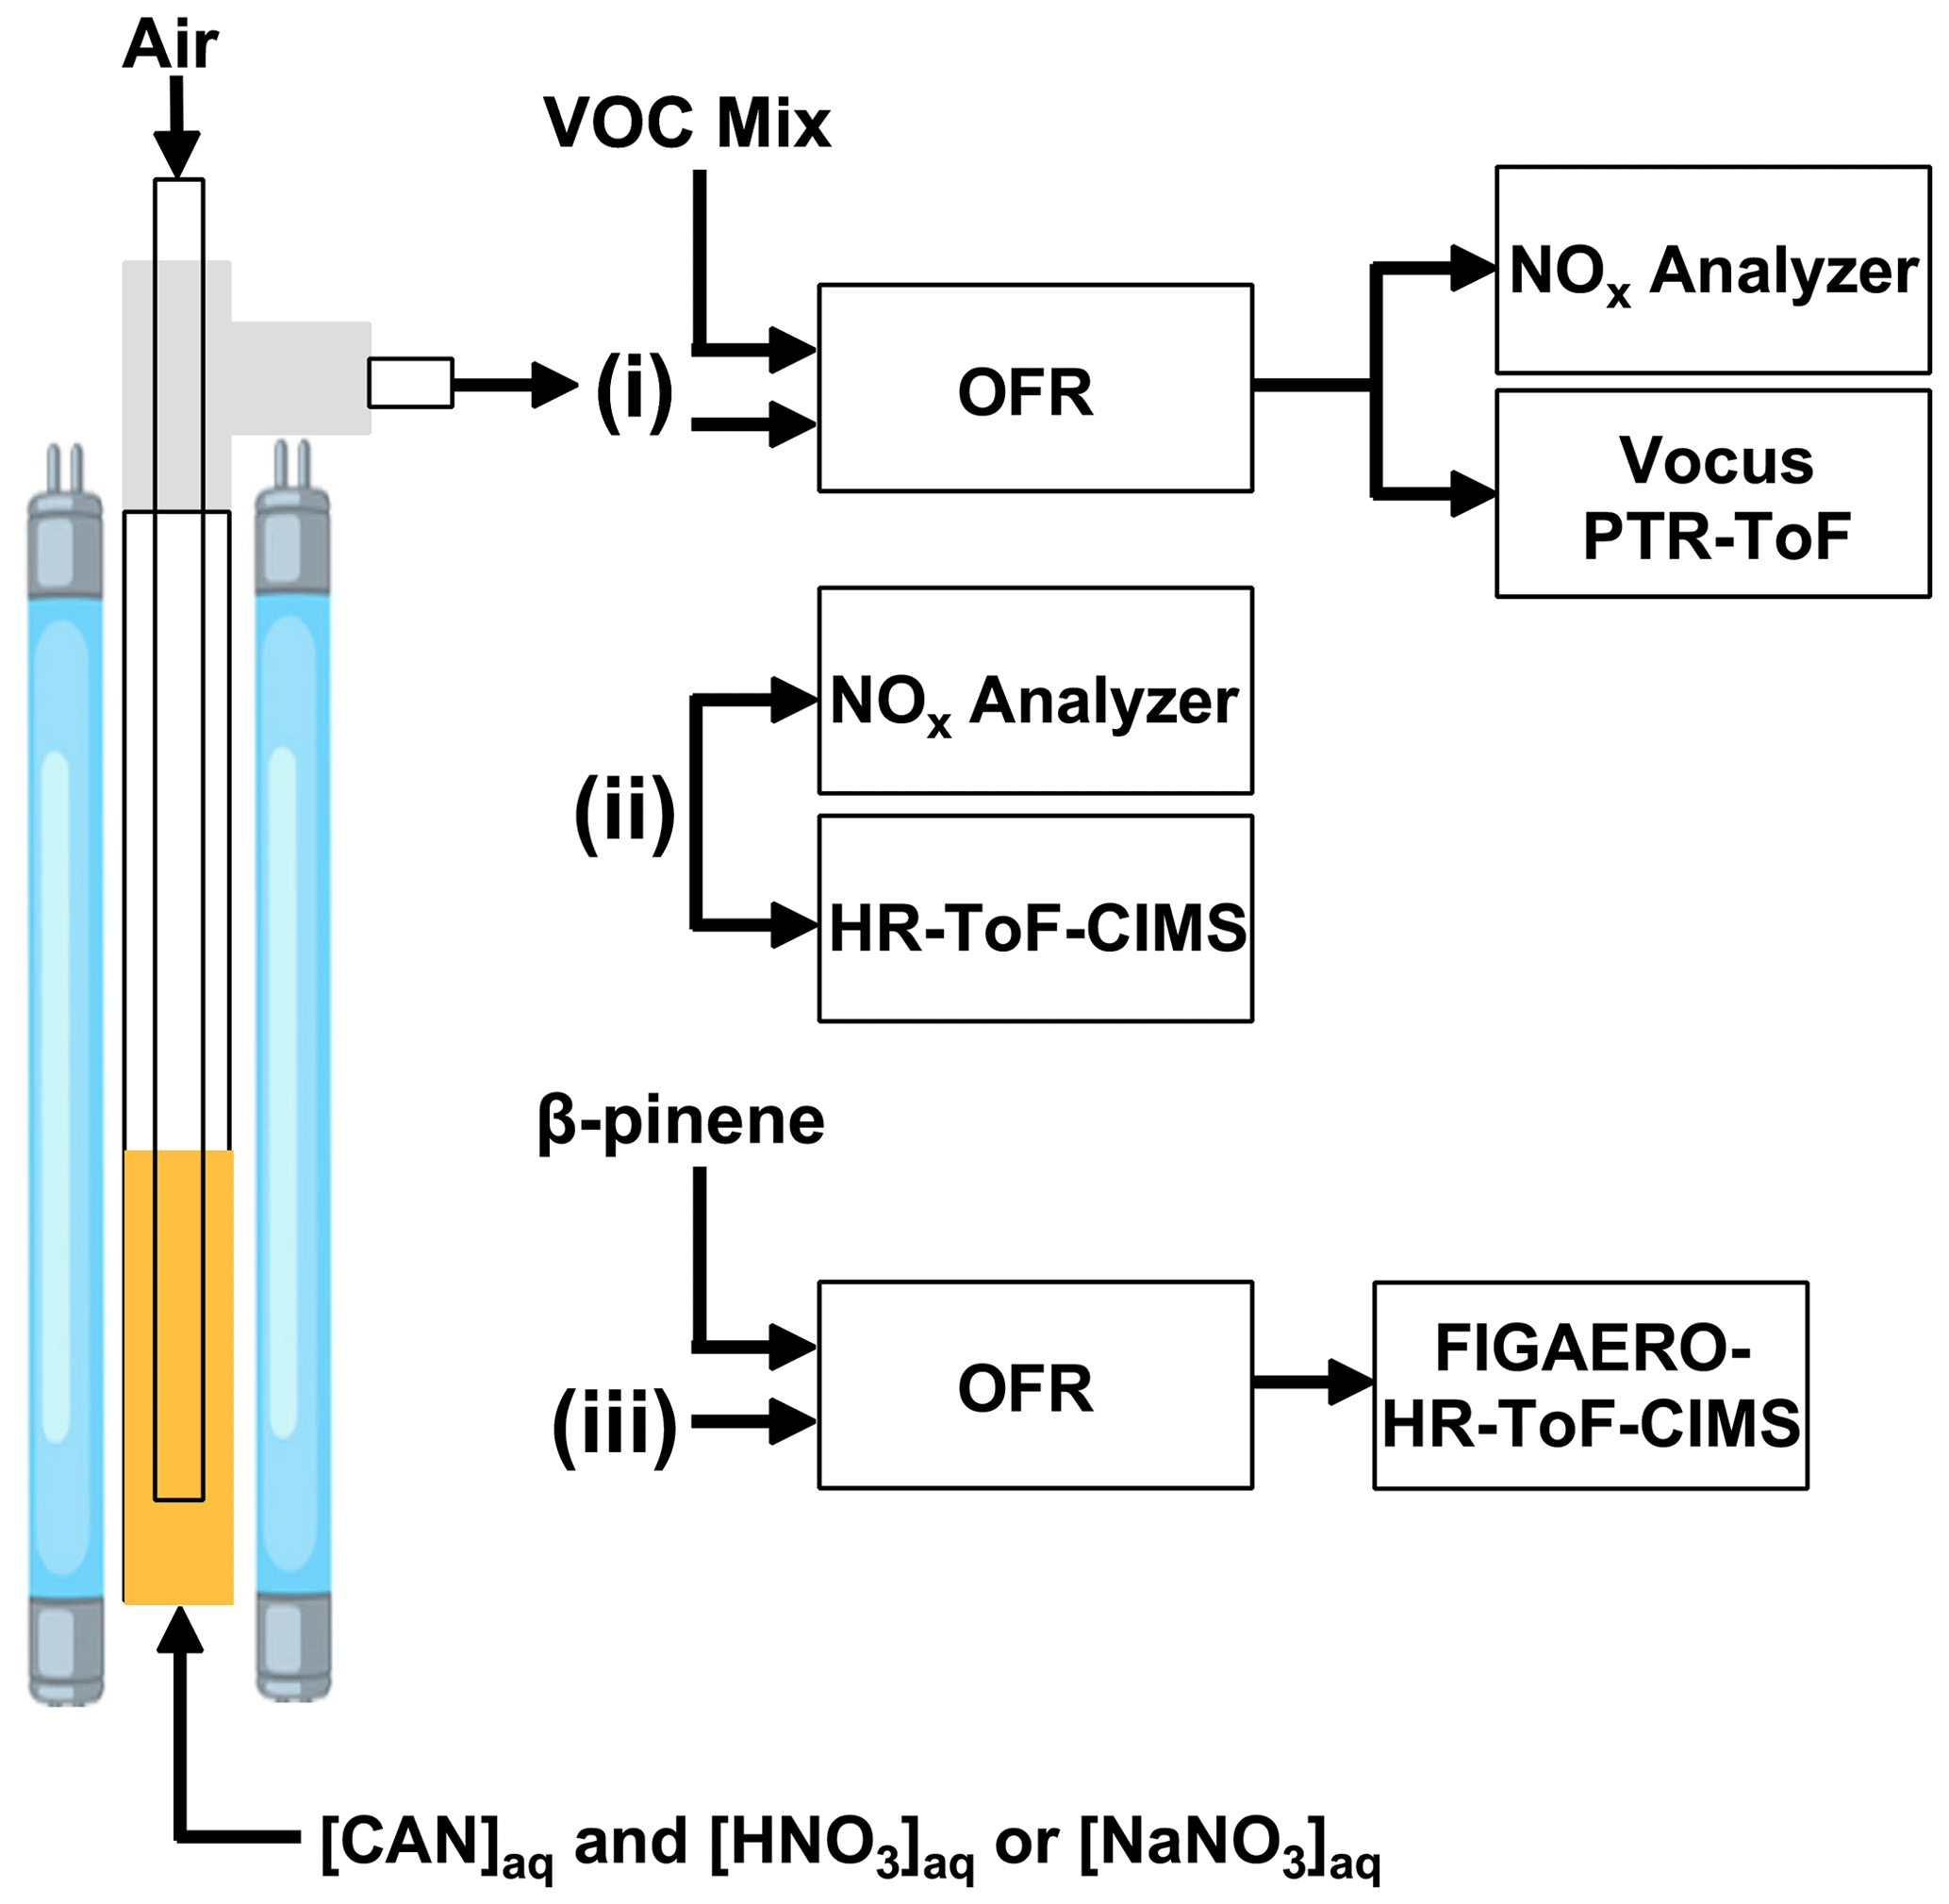
Figure 1Overview of experiments conducted in this study. Aqueous mixtures of ceric ammonium nitrate (CAN) and nitric acid (HNO3) or sodium nitrate (NaNO3) were irradiated in a photoreactor to generate nitrate radicals (NO3) in solution. Air was bubbled through the solution to evaporate NO3 and other volatile photolysis products into the gas phase. The photoreactor effluent was then (i) injected into a dark oxidation flow reactor (OFR) along with a VOC mixture to characterize [NO3] via tracer decay measurements using a Vocus proton transfer reaction time-of-flight mass spectrometer (PTR-ToF) (ii) sampled with an iodide-adduct high-resolution time-of-flight chemical ionization mass spectrometer (HR-ToF-CIMS) (iii) injected into a dark OFR to characterize β-pinene NO3 oxidation products with a Filter Inlet for Gases and AEROsols (FIGAERO) coupled to the HR-ToF-CIMS. Supporting measurements were obtained using a NOx analyzer.
Depending on the specific experiment, lamps with peak emission output centered at λ = 254, 313, 369, or 421 nm, respectively (GPH436TL/4P, Light Sources, Inc.; F436T5/NBUVB/4P-313, F436T5/BLC/4P-369, F436T5/SDI/4P-421, LCD Lighting, Inc.) were used. Emission spectra from the manufacturer are shown in Fig. S1 in the Supplement. A fluorescent dimming ballast (IZT-2S28-D, Advance Transformer Co.) was used to regulate current applied to the lamps. To quantify the photon flux Iλ in the photoreactor for studies that used λ = 254, 313, or 369 nm radiation, we measured the rate of externally added O3 (λ = 254 nm) or NO2 photolysis (λ = 313 or 369 nm) as a function of lamp voltage under dry conditions (RH < 5 %). The photon flux was not quantified in studies that used λ = 421 nm radiation. NO2 photolysis measurements were conducted in the absence of oxygen to avoid O3 formation. Photon flux values were then calculated using methods described in Lambe et al. (2019); maximum values of I254 = 1.0 × 10¹⁶ photons cm−2 s−1, I313 = 6.0 × 10¹⁵ photons cm−2 s−1, and I369 = 7.0 × 10¹⁵ photons cm−2 s−1 were obtained.
2.2 Characterization studies
In one set of experiments, the 0.5 L min−1 photoreactor effluent was mixed with a 6.5 L min−1 zero-air carrier gas and injected into a dark Potential Aerosol Mass oxidation flow reactor (OFR; Aerodyne Research, Inc.), which is a horizontal 13 L conductive Teflon-coated aluminum cylindrical chamber operated in continuous flow mode. Approximately 6.5 L min−1 of sample flow was pulled from the reactor, resulting in a calculated mean residence time in the OFR (τOFR) of approximately 120 s. To constrain NO3 mixing ratios, a mixture of 10 VOC tracers with NO3 reaction rate coefficients () ranging from 3.01 × 10⁻¹⁹ to 2.69 × 10⁻¹¹ cm3 molec.−1 s−1 at T = 298 K (Table S1) was injected through a 10.2 cm length of 0.0152 cm i.d. Teflon tubing at a liquid flow rate of 0.94 µL h−1 using a syringe pump. The tracer mixture was then evaporated into a 1 L min−1 zero-air carrier gas prior to injection into the OFR. The total external NO3 reactivity (NO3Rext), which is the summed product of each tracer mixing ratio and its , was approximately 5 s−1. VOCs with proton affinities greater than that of H2O were chosen to enable their measurement with a Tofwerk–Aerodyne Vocus proton transfer reaction time-of-flight mass spectrometer (hereafter referred to as “Vocus PTR”) operated using H3O+ reagent ion chemistry (Krechmer et al., 2018) and ∼ 8000 (Th Th) resolving power. NO3 mixing ratios were calculated from the measured decrease in VOC mixing ratios using the Vocus PTR. Here, we assumed that the total concentration of reacted VOCs was equal to the concentration of NO3 injected into the OFR. Because NO3 may additionally react with organic peroxy radicals (RO2) generated from VOC + NO3 reactions as well as OVOCs, these calculated NO3 concentrations represent lower limits. Modeling calculations suggest that the fractional consumption of NO3 by RO2 ranged from < 0.01 to 0.17 over the range of conditions that were studied (Fig. S2). A subset of OVOCs generated from VOC + NO3 reactions that had proton affinities greater than that of H2O were also detected with the Vocus PTR.
In a separate set of experiments, the photoreactor effluent was diluted into 4 L min−1 zero-air carrier gas and sampled with an Aerodyne iodide-adduct high-resolution time-of-flight chemical ionization mass spectrometer (HR-ToF-CIMS; hereafter referred to as “CIMS”; Bertram et al., 2011) and the NOx analyzer. The CIMS was operated at a ∼ 4000 (Th Th) resolving power. Iodide-adduct reagent ion chemistry was used due to its high sensitivity and selectivity towards nitrogen oxides and multifunctional organic nitrates (Lee et al., 2014). To demonstrate application of the method to study NO3-initiated oxidative aging processes, the chemical composition of β-pinene + NO3 gas- and condensed-phase oxidation products was measured with a Filter Inlet for Gases and AEROsols (FIGAERO) coupled to the CIMS (Lopez-Hilfiker et al., 2014). Gas sampling and simultaneous particle collection were performed for 1 min intervals, followed by thermal desorption of the particle sample from a PTFE filter membrane (15 min ramp from room temperature to 200 ∘C, 10 min holding time, 8 min cooldown to room temperature).
2.3 Photochemical model
To supplement our measurements, and to characterize aqueous-phase concentrations of species produced in the photoreactor that were not measured, we developed a photochemical box model that was implemented in the KinSim chemical kinetic solver (Peng and Jimenez, 2019). The KinSim mechanism shown in Table S2 contains reactions to model concentrations of Ce(IV), Ce(III), NO, NO2, NO3, N2O3, N2O4, N2O5, HNO2, HNO3, HNO4, H, O, OH, HO2, and H2O2. We assumed that HNO3 that was present in solution prior to irradiation completely dissociated into H+ and . When possible, we used condensed-phase rate coefficients in the mechanism. For reactions that we assumed occurred but did not have published condensed-phase rate coefficients (e.g., NO3 + OH → NO2 + HO2), we used published gas-phase rate coefficients instead with no modifications aside from unit conversion. Gas-phase wall loss rates of NOx, NOy, and HOx species were not explicitly considered in the mechanism. UV–Vis extinction cross sections (σext) of CAN HNO3 and CAN NaNO3 mixtures were separately obtained between λ = 200 and 600 nm using an Agilent Cary 5000 UV–Vis–NIR spectrophotometer. Because of the high absorptivity and concentrations of the mixtures, samples were prepared in a 0.01 mm short-path-length cuvette (20/C-Q-0.01, Starna) to minimize saturation of the photodetector relative to a cuvette with a standard 10 mm path length. Even with the cuvette that was used, CAN dilution was necessary in some cases in order to obtain σext without photodetector saturation at shorter wavelengths. Spectra were obtained as a function of [CAN] (0.047 to 0.526 M), [HNO3] (0 to 6.0 M), and [NaNO3] (0 to 4.0 M) to cover the approximate range of mixture compositions that were characterized in Sect. 2.2. The σext values of the mixture were then calculated using the Beer–Lambert law and applied in the KinSim mechanism. Model outputs were obtained over a total experimental time of 14400 s at 1 s intervals.
The maximum NO3 quantum yield () of UVA-irradiated CAN HNO3 mixtures is obtained at 6.0 M HNO3 (Martin and Stevens, 1978); thus, this mixture composition served as the basis from which additional characterization studies were conducted. We found that 0.5 M CAN was the approximate solubility limit in 6.0 M HNO3 at 25 ∘C. Because 1.1 M CAN is the solubility limit in H2O and CAN is nearly insoluble in HNO3 (Martin and Glass, 1970), 0.7 M CAN is the estimated solubility limit in 6.0 M HNO3 in the absence of changes in ceric nitrate composition in solution. Thus, the reduction in CAN solubility (0.7 M → 0.5 M) observed in our studies was presumably associated with significant conversion of CAN to dimeric ceric nitrates in 6.0 M HNO3 (Blaustein and Gryder, 1957; Demars et al., 2015).
3.1 NO3 characterization studies
Figure 2a shows time series of thiophene (C4H4S), 2,3-dihydrobenzofuran (C8H8O), cis-3-hexenyl acetate (C8H14O2), isoprene (C5H8), dimethyl sulfide (C2H6S), 2,5-dimethylthiophene (C6H8S), α-pinene (C10H16), and guaiacol (C7H8O2) concentrations following injection into the OFR and exposure to NO3 generated in the photoreactor from irradiation of a mixture of 0.5 M CAN and 6.0 M HNO3 at I369 = 7 × 10¹⁵ photons cm−2 s−1. Here, concentrations of each VOC were first normalized to the acetonitrile concentration to correct for changes in the syringe pump output over time and then normalized to the VOC concentration prior to NO3 exposure. Aside from C6H8S, whose relative decay was less pronounced than expected (Table S1), and butanal (C4H8O, not shown), whose signal decreased by approximately 30 % and did not recover for reasons that are unclear, the oxidative loss of each tracer increased with increasing . Maximum tracer consumption was observed at the beginning of the experiment due to maximum NO3 production from Ce(IV) irradiation. As the experiment progressed and Ce(IV) was reduced to Ce(III), the NO3 concentration and corresponding VOC oxidative loss decreased. Compared to the other VOCs, the initial increase in C10H16 and C7H8O2 concentrations over the first 2 h was delayed because of their higher values that resulted in > 95 % consumption and lower sensitivity to changes in [NO3] in the initial stage of the experiment. To confirm that VOC degradation shown in Fig. 2a was due to reaction with NO3, Fig. S3 shows the relative NO3 rate coefficients obtained from the decay of C4H4S, C8H8O, and C8H14O2 measured with the Vocus PTR. We measured relative rate coefficients of 3.59 between C8H8O and C4H4S and 6.92 between C8H14O2 and C4H4S, which are in agreement with relative rate coefficient values of 3.44 ± 1.20 and 7.68 ± 2.84 calculated from their absolute NO3 rate coefficients (Atkinson, 1991; D'Anna et al., 2001). Time series of ions corresponding to nitrothiophene (C4H3NO2S), C5H7NO4–6 and C10H15NO5,6 organic nitrates, and nitroguaiacol (C7H7NO4), which are known NO3 oxidation products of C4H4S, C5H8, C10H16, and C7H8O2 (Atkinson et al., 1990; Jenkin et al., 2003; Saunders et al., 2003; Cabañas et al., 2005), along with C8H5,7NO4–6 and C8H13NO5–6 ions that may be associated with NO3 oxidation products of C8H8O and C8H14O2, respectively, were anticorrelated with those of their respective VOC precursors (Fig. S4). Tracer decay experiments, similar to the one shown in Fig. S3, were used to obtain results that are discussed in more detail in Sect. 3.2, 3.3, and 3.4.
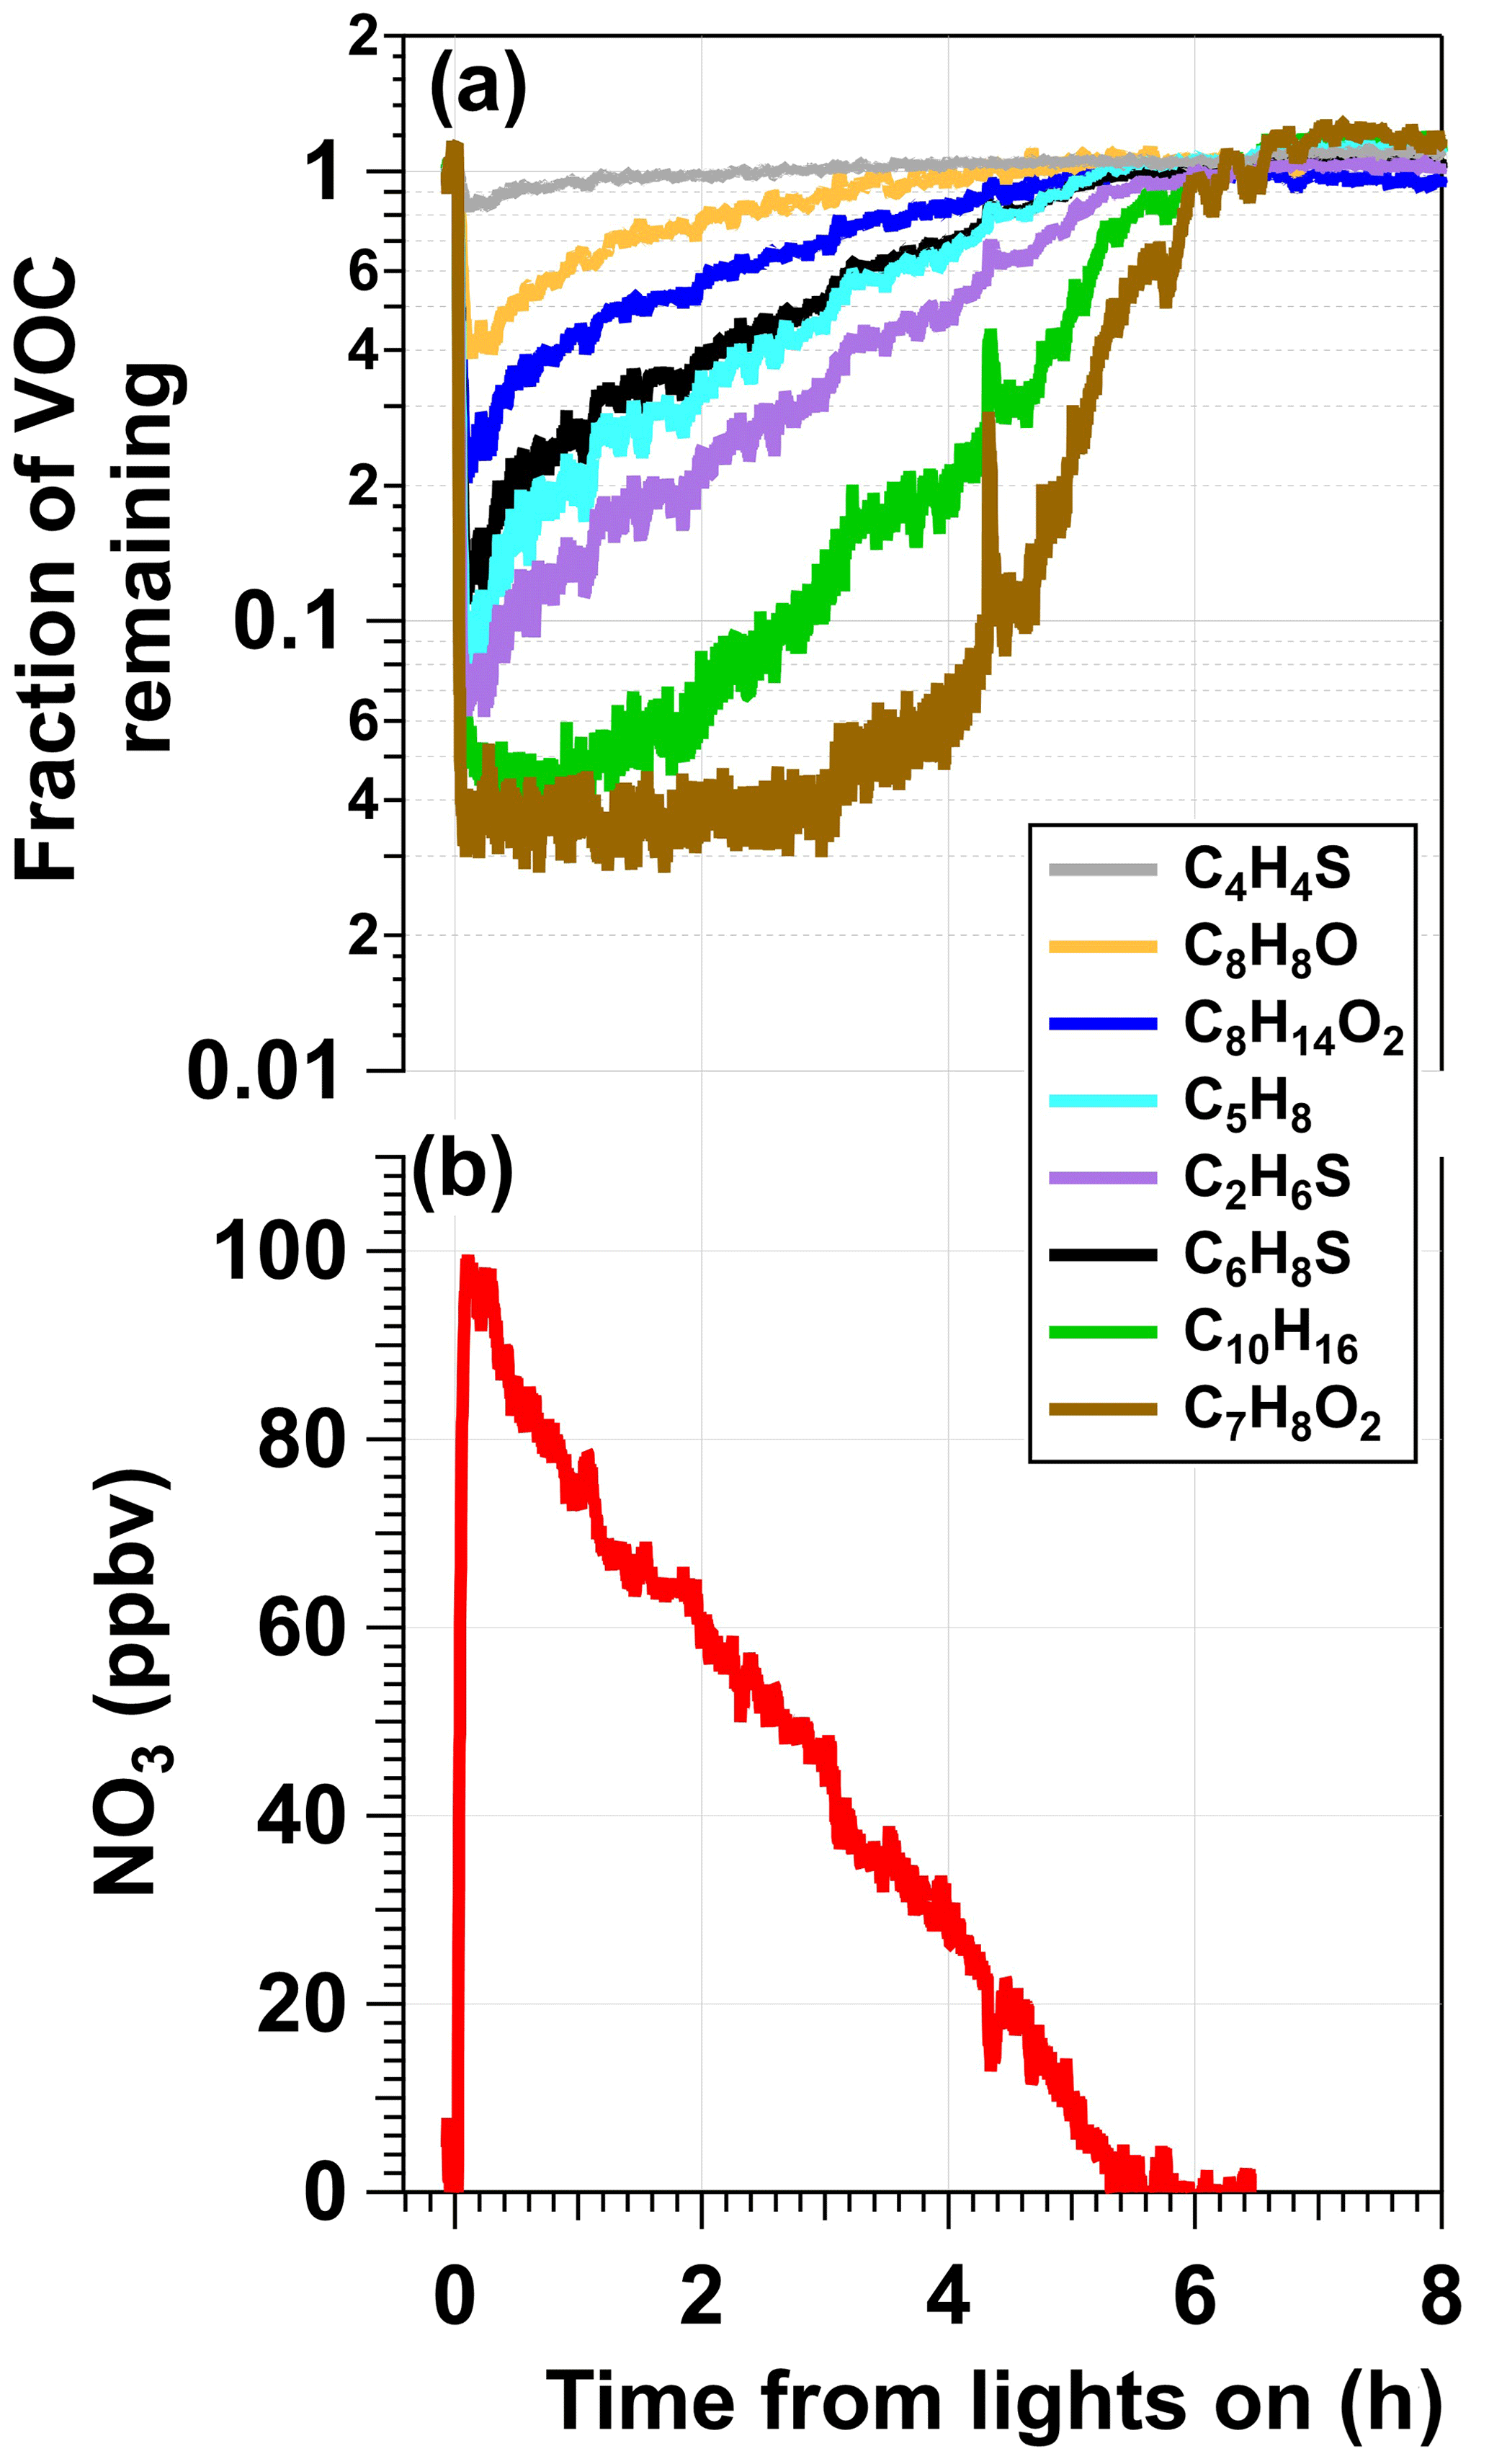
Figure 2Example results from an experiment in which a mixture of 0.5 M CAN and 6.0 M HNO3 was irradiated to generate NO3 (λmax = 369 nm, I369 = 7 × 10¹⁵ photons cm−2 s−1) that was injected into the OFR along with a reactive VOC tracer mixture. (a) Time series of the fractional consumption of VOC tracers measured with the Vocus following irradiation: thiophene (C4H4S), 2,3-dihydrobenzofuran (C8H8O), cis-3-hexenyl-1-acetate (C8H14O2), isoprene (C5H8), dimethyl sulfide (C2H6S), 2,5-dimethylthiophene (C6H8S), α-pinene (C10H16), and guaiacol (C7H8O2). Signals of each tracer were normalized to their initial concentrations prior to NO3 exposure and to acetonitrile concentrations to account for changes in the syringe pump output. (b) Time series of [NO3] calculated from (a) and Table S1.
3.2 Effect of irradiation wavelength
Figure 3a shows normalized [NO3] values obtained following irradiation of mixtures containing CAN and 6.0 M HNO3 or 4.8 M NaNO3 as a function of irradiation wavelength. In CAN HNO3 mixtures, [NO3] was a factor of 2.4–3.5 higher following irradiation at λ = 369 compared to the other wavelengths. On the other hand, [NO3] decreased with increasing irradiation wavelength following irradiation of CAN NaNO3 mixtures; at λ = 254 nm, [NO3] was 3.2–42 times higher than at the other irradiation wavelengths that were used. These differences in [NO3] were larger than the differences in calibrated photon flux values at the maximum output of each lamp type (±40 %; Sect. 2.1). Different Ce(IV) in CAN HNO3 and CAN NaNO3 mixtures may have influenced these trends, as suggested by their UV–Vis spectra (Fig. 3b). The σext curves of CAN HNO3 mixtures were generally larger, broader, and redshifted relative to those of CAN NaNO3 mixtures, with the extent of red shifting increasing with larger [HNO3], possibly due to higher yields of and/or ceric nitrate dimers (Blaustein and Gryder, 1957; Henshall, 1963; Demars et al., 2015). For λ > 250 nm, CAN HNO3 mixtures had σext,max values between λ = 306–311 nm, whereas CAN NaNO3 solutions had σext,max values at λ = 296 nm. However, if [NO3] was simply proportional to σext, irradiation of CAN HNO3 mixtures at λ = 313 nm should have produced the highest [NO3]; this was not the case. Instead, model calculations suggest that higher [NO2] obtained from significantly faster photolysis of HNO3 at λ = 254 and 313 nm relative to λ > 350 nm suppressed NO3 downstream of the photoreactor when shorter irradiation wavelengths were used (Sander et al., 2011, Table S2). At a photon flux of 1016 photons cm−2 s−1, model-calculated [NO3] values were within ±13 % of each other for irradiation wavelengths ranging from λ = 254 to 369 nm. However, higher [NO2] values obtained following Ce(IV) irradiation at λ = 254 and 313 nm suppressed NO3 by > 96 % relative to the λ = 369 nm case during 120 s of simulated NO2 + NO3 reactions in the OFR. Thus, although the measured NO3 suppression at these other irradiation wavelengths was less substantial than the model output, the measurement and model trends, along with achievement of maximum [NO3] following λ = 254 nm irradiation of CAN NaNO3 mixtures that had lower [HNO3], qualitatively support this explanation for the wavelength-dependent NO3 yields observed in CAN HNO3 mixtures.

Figure 3(a) [NO3] values obtained from irradiated CAN and 6.0 M HNO3 and CAN and 4.8 M NaNO3 mixtures as a function of irradiation wavelengths. Results were normalized to [NO3] achieved with irradiation of CAN HNO3 mixtures at λ = 369 nm or CAN NaNO3 mixtures at λ = 254 nm. Error bars represent ±1σ uncertainty in binned [NO3] values. (b) Extinction cross sections (σext) of CAN HNO3 and CAN NaNO3 mixtures (for details see Sect. 2.3). The black dot (note the superscripted 1 in the legend) corresponds to data from Wine et al. (1988).
3.3 Effect of mixture composition
To characterize the influence of individual reagents on NO3 formation, tracer decay experiments similar to the measurements shown in Fig. 2 were repeated as a function of [CAN], [HNO3], and [NaNO3]. Figure 4a shows [NO3] obtained from irradiated 6.0 M HNO3 solutions containing 0.001 to 0.5 M CAN (I369 = 7 × 10¹⁵ photons cm−2 s−1) and irradiated 1.0 M NaNO3 solutions containing 0.5 to 1.0 M CAN (I254 = 1 × 10¹⁶ photons cm−2 s−1). Results were normalized to [NO3] achieved with solutions containing 0.5 M CAN and 6.0 M HNO3. Control experiments conducted with irradiated 6.0 M HNO3 or 1.0 M NaNO3 solutions at I254 = 1 × 10¹⁶ photons cm−2 s−1 in the absence of CAN suggest that a fraction of the NO3 obtained in CAN mixtures was generated via the reactions HNO3 + hν → OH + NO2 and HNO3 + OH → NO3 + H2O. The remaining NO3 was clearly obtained from CAN irradiation because [NO3] increased with increasing [CAN], as expected from Reaction (R1). Overall, [NO3] increased by approximately a factor of 3 as [CAN] was increased from 0.001 to 0.5 M in 6.0 M HNO3.
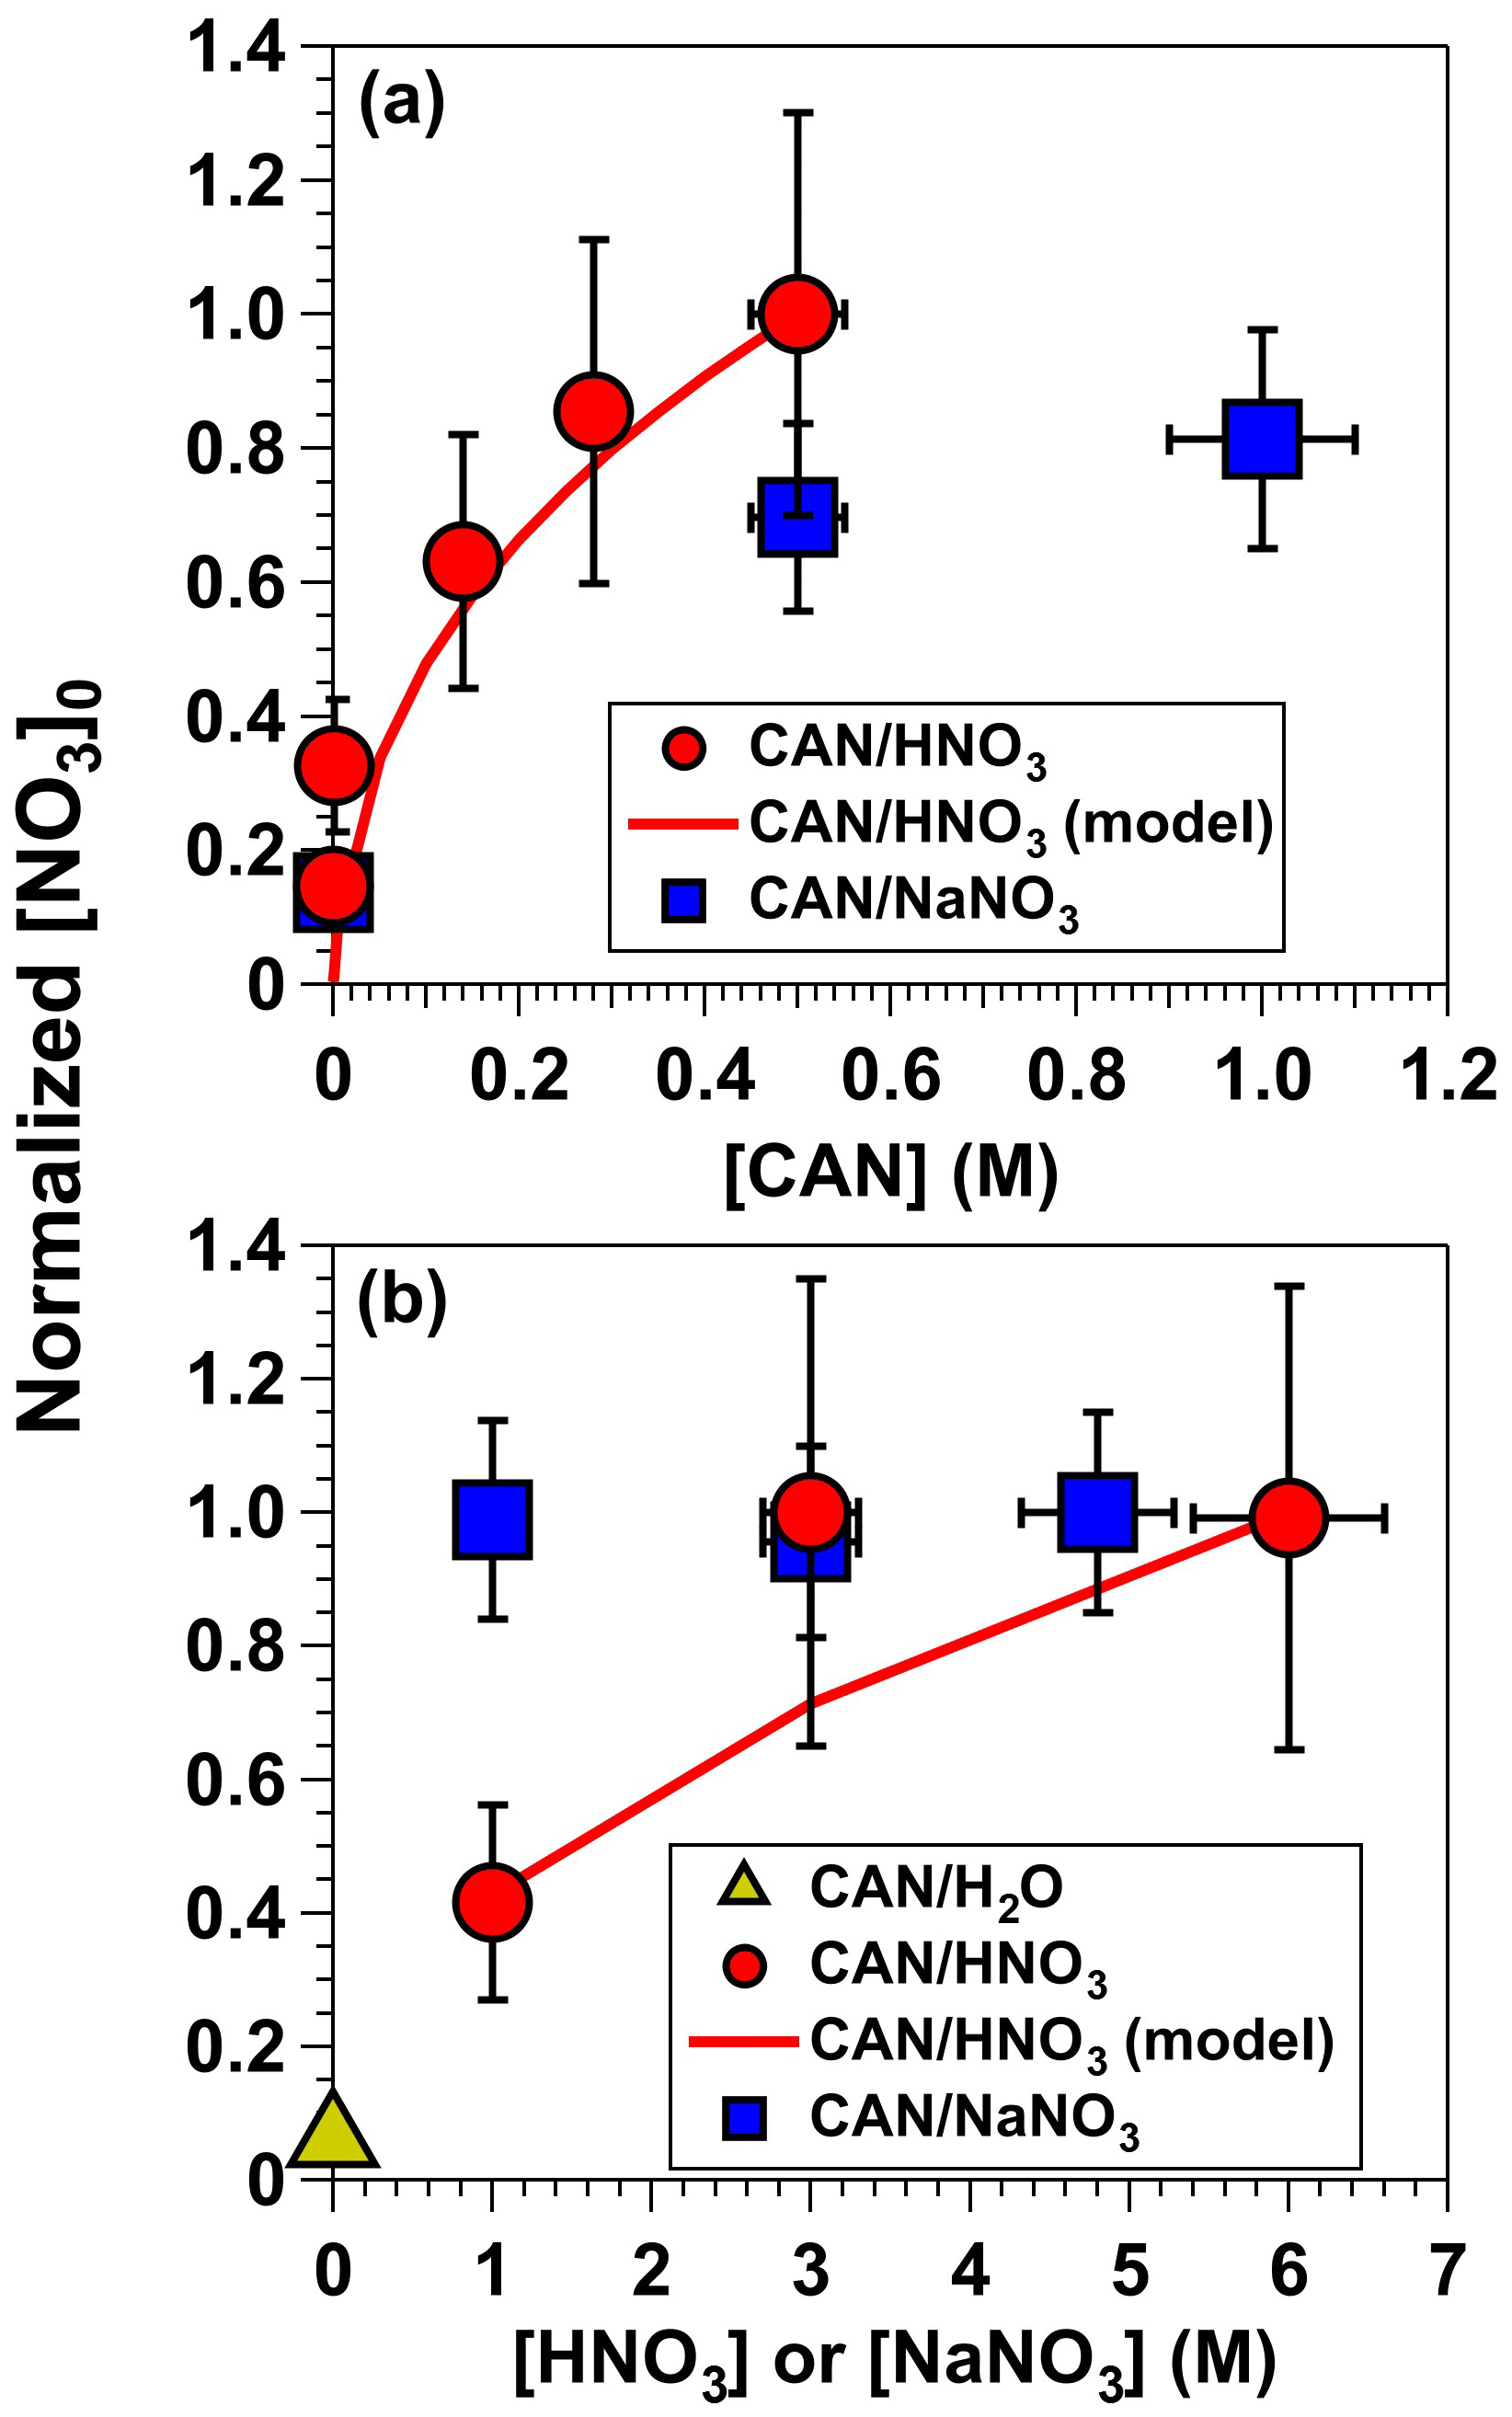
Figure 4[NO3] obtained from (a) irradiated 6.0 M HNO3 solutions containing 0.001 to 0.5 M CAN (I369 = 7 × 10¹⁵ photons cm−2 s−1), and irradiated 1.0 M NaNO3 solutions containing 0.5 to 1.0 M CAN (I254 = 1 × 10¹⁶ photons cm−2 s−1). (b) Irradiated 0.5 M CAN solutions containing 1.0 to 6.0 M [HNO3] or 1.0 to 4.8 M [NaNO3] at the same I369 and I254 values used to obtain results shown in (a). Results were normalized to [NO3] achieved with mixtures of 0.5 M CAN and 6.0 M HNO3. Error bars represent estimated ±35 % uncertainty in [NO3] values obtained from CAN HNO3 mixtures; ±15 % uncertainty in [NO3] values obtained from CAN NaNO3 mixtures; and ±10 % uncertainty in [CAN], [HNO3], and [NaNO3] values.
Figure 4b shows [NO3] obtained in irradiated solutions containing 0.5 M CAN as a function of [HNO3] ranging from 1.0 to 6.0 M or [NaNO3] ranging from 1.0 to 4.8 M at the same I369 and I254 values used to obtain results shown in Fig. 4a. Irradiated CAN solutions containing 3.0 and 6.0 M HNO3 generated the same [NO3] concentrations within measurement uncertainties, presumably because the NO3 quantum yield () ranged from 0.92–1.00 over this range of acidity (Martin and Stevens, 1978; Wine et al., 1988). [NO3] decreased by a factor of 2 as [HNO3] was decreased from 3.0 to 1.0 M, consistent with a reduction in from 0.92 to 0.46 (Martin and Stevens, 1978). On the other hand, in irradiated CAN NaNO3 mixtures with uncharacterized , [NO3] was constant within measurement uncertainties between 1.0 and 4.8 M NaNO3.
Other mixture components that were tested or considered included substitution of CH3CN in place of H2O and HNO3, ammonium nitrate (NH4NO3) instead of NaNO3, ceric potassium nitrate (K2Ce(NO3)6) instead of CAN, and addition of sodium persulfate (Na2S2O8) to generate additional NO3 via + hν → 2 followed by + → NO3 + (Gaillard de Sémainville et al., 2007). CAN CH3CN mixtures are commonly used in organic synthesis applications, perhaps even more so than CAN HNO3 (Baciocchi et al., 1988; Choidini et al., 1993; Alexander, 2004). In limited testing, CAN CH3CN appeared to generate significantly less NO3 than CAN HNO3 or CAN NaNO3, possibly due to lower of irradiated Ce(IV)–CH3CN complexes (Glebov et al., 2021) and/or suppression of NO3 due to its reaction with CH3CN in solution. K2Ce(NO3)6 is less widely available and less water soluble than CAN and therefore was not considered further. Irradiation of CAN NH4NO3 and CAN NaNO3 mixtures generated similar [NO3], but we prefer NaNO3 due to its lower volatility. Finally, ternary mixtures containing 0.5 M CAN + 2.0 M NaNO3 + 0.5 M Na2S2O8 irradiated at λ = 254 nm generated negligible additional NO3 compared to binary CAN NaNO3 mixtures.
3.4 Effect of photon flux
Figure 5 shows normalized [NO3] values obtained from irradiated mixtures of (1) 0.5 M CAN and 6.0 M HNO3 (λ = 369 nm) and (2) 0.5 M CAN and 1.0 M NaNO3 (λ = 254 nm) as a function of photon flux ranging from 6.9 × 10¹⁴ to 7.5 × 10¹⁵ photons cm−2 s−1. Results for both CAN HNO3 and CAN NaNO3 mixtures were normalized to [NO3] achieved with 0.5 M CAN, 6.0 M HNO3, and I369 = 6.8 × 10¹⁵ photons cm−2 s−1. Symbols are colored by the NO3 lifetime (), defined here as the time it took for [NO3] to experience one e-folding decay relative to the maximum [NO3] that was measured. Figure 5 shows that [NO3] increased with increasing photon flux, consistent with the fact that it is a primary photolysis product, along with a concurrent decrease in due to faster reduction of Ce(IV) to Ce(III). For the CAN HNO3 system, [NO3] increased by a factor of 1.5 as I369 was increased from 6.9 × 10¹⁴ to 6.8 × 10¹⁵ photons cm−2 s−1, in agreement with the model-calculated increase in [NO3] within measurement uncertainty. decreased from 9 to 5 h. For the CAN NaNO3 system, [NO3] increased by a factor of 1.9 as I254 was increased from 1.0 × 10¹⁵ to 7.5 × 10¹⁵ photons cm−2 s−1, and decreased from 10 to 3 h.
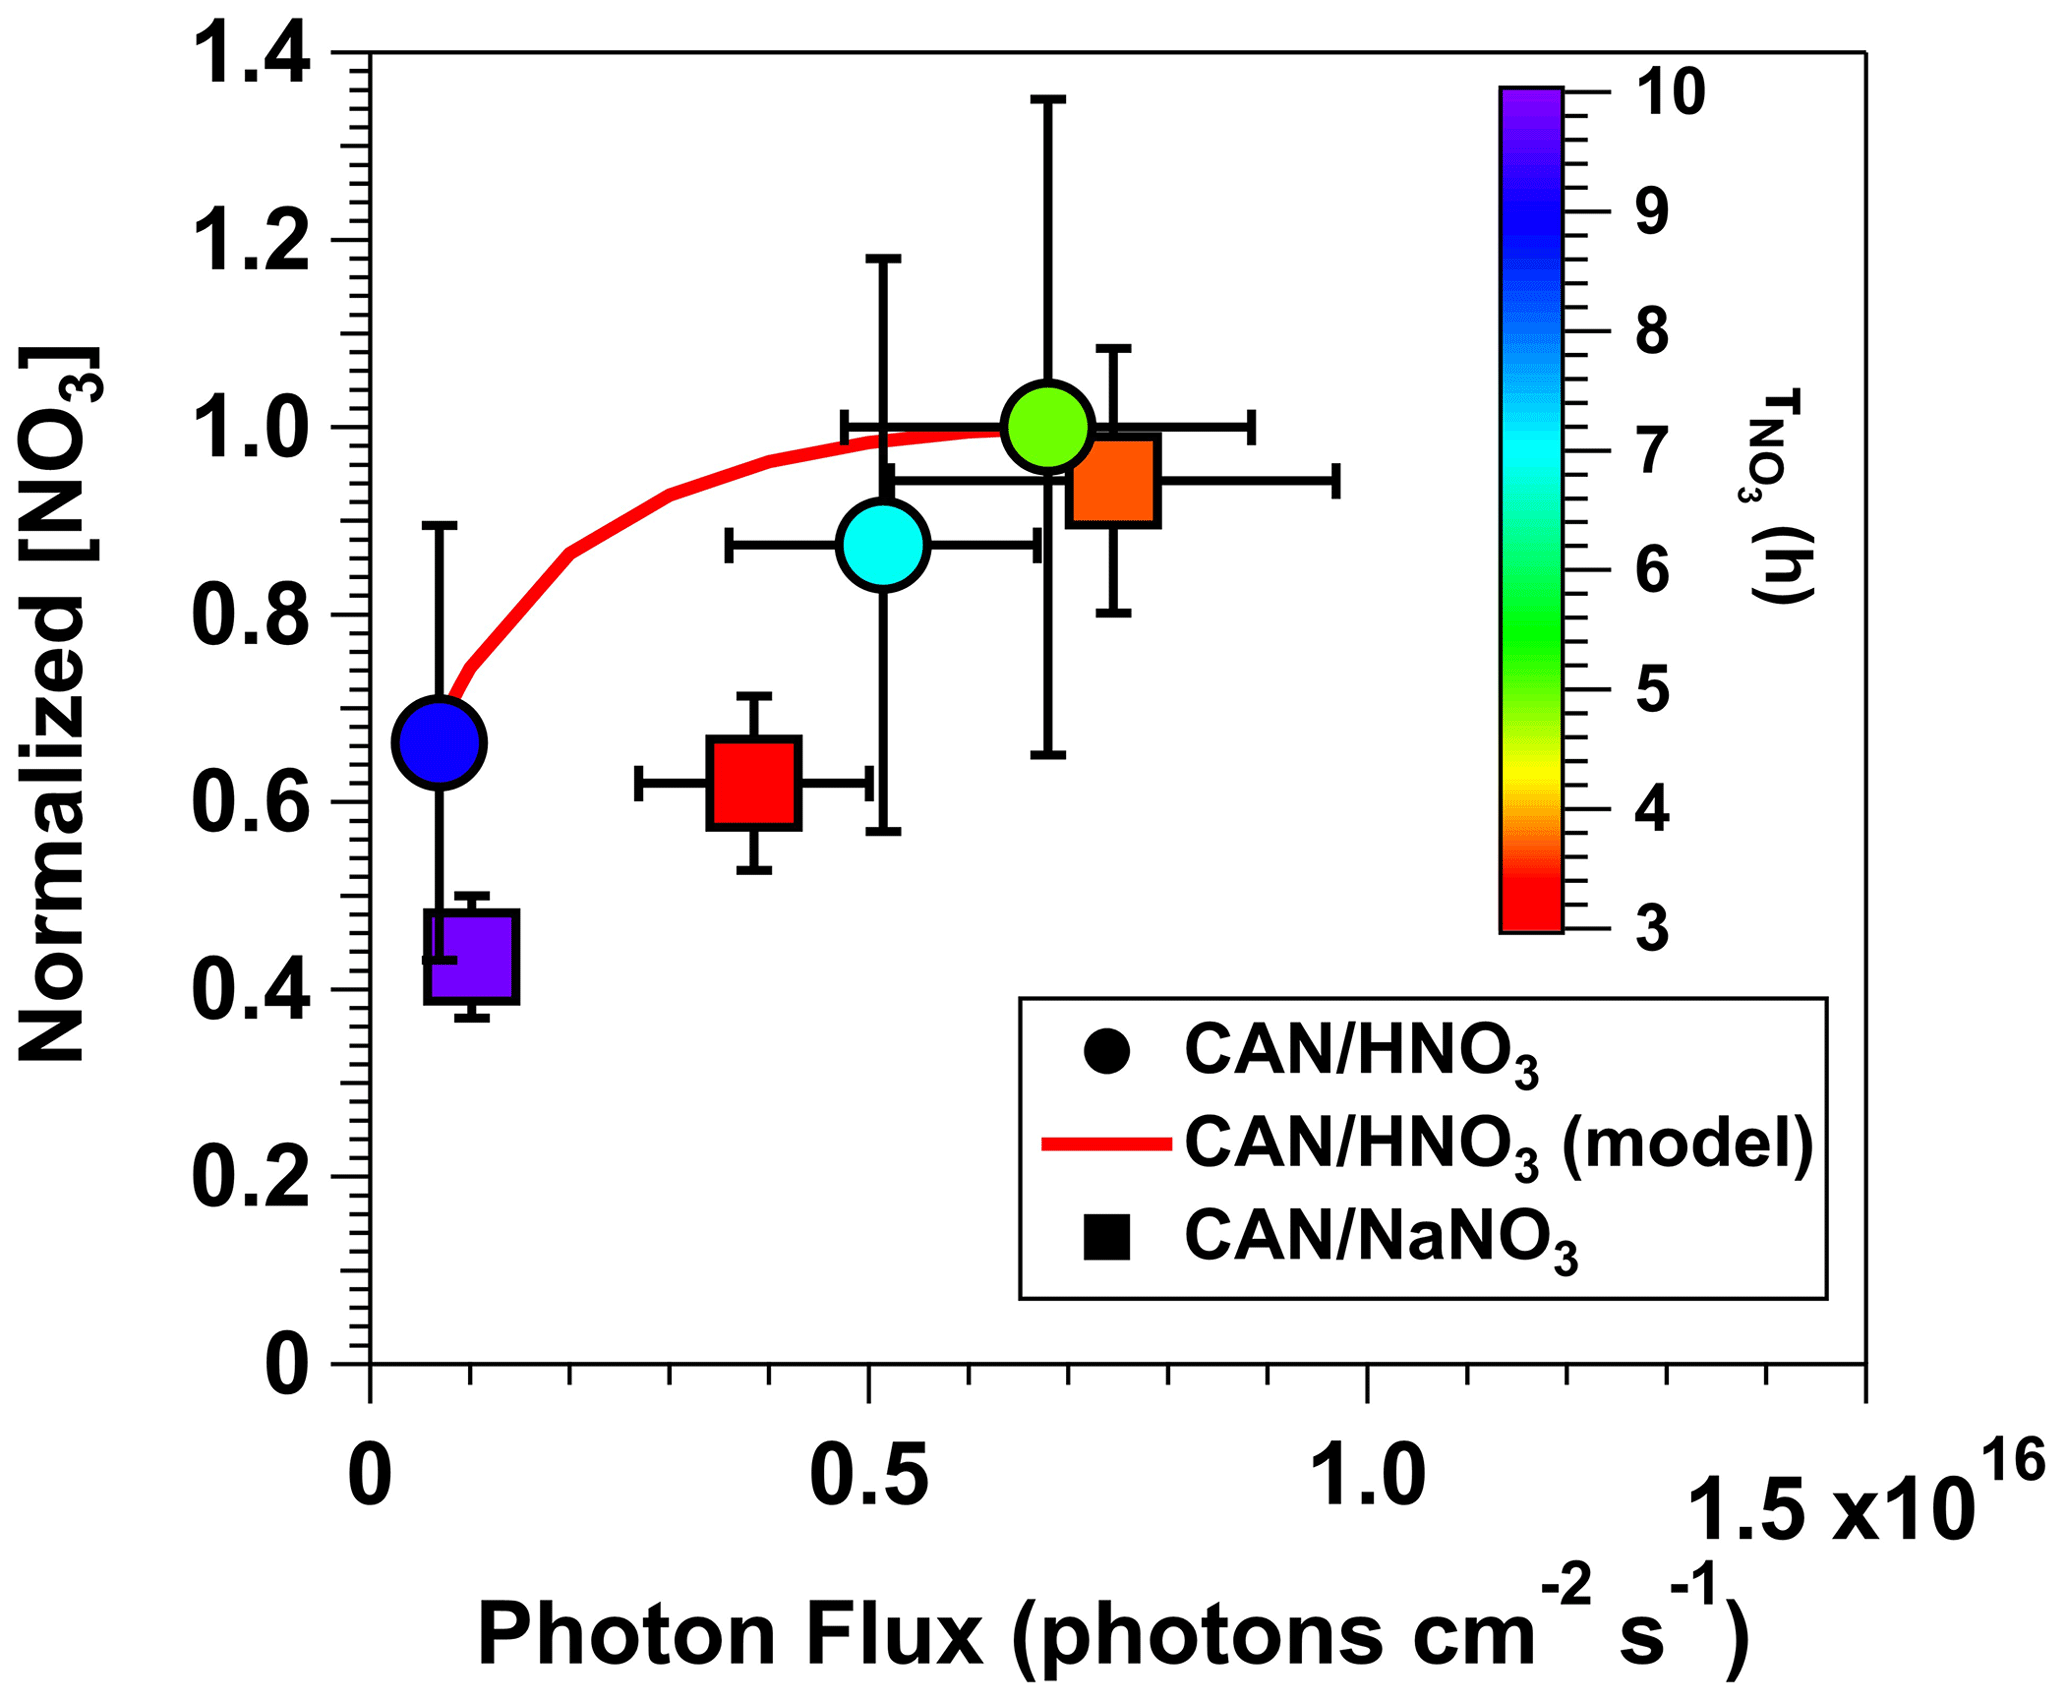
Figure 5Normalized [NO3] values obtained from irradiated mixtures of 0.5 M CAN and 6.0 M HNO3 (λ = 369 nm) or 0.5 M CAN and 1.0 M NaNO3 (λ = 254 nm) as a function of photon flux ranging from 6.9 × 10¹⁴ to 7.5 × 10¹⁵ photons cm−2 s−1. Results were normalized to [NO3] achieved with 0.5 M CAN, 6.0 M HNO3, and I369 = 6.8 × 10¹⁵ photons cm−2 s−1. Symbols are colored by the time it took for [NO3] to experience one e-folding decay relative to the maximum [NO3] that was measured (). Error bars represent estimated ±35 % uncertainty in [NO3] values obtained from CAN HNO3 mixtures, ±15 % uncertainty in [NO3] values obtained from CAN NaNO3 mixtures, and ±30 % uncertainty in photon flux values.
To examine concentrations of NO3 and a subset of additional gas-phase photolysis products obtained over a wider range of conditions, Fig. 6 plots model-calculated [NO3], NO2 : NO3, HO2 : NO3, and N2O5 : NO3 values as a function of photon flux ranging from 1 × 10¹⁴ to 1 × 10¹⁷ photons cm−2 s−1 following λ = 254, 313, 369, and 421 nm irradiation of a mixture of 0.5 M CAN and 6.0 M HNO3. Figure 6a also plots the measured [NO3] obtained from irradiation of a mixture of 0.5 M CAN and 6.0 M HNO3 at I369 = 7 × 10¹⁵ photons cm−2 s−1 (Fig. 2) after correcting for dilution between the photoreactor and the OFR (Sect. 2.2) as well as application of a NO3 wall loss rate coefficient of 0.2 s−1 within the photoreactor (Dubé et al., 2006). At this photon flux value, the model-calculated [NO3] = 1.4 ppmv agrees with [NO3] = 1.7 ± 0.6 ppmv obtained from measurements. When considering only the primary photochemical process (Reactions R1–R5), maximum [NO3] values within ±10 % of each other were achieved at photon fluxes ranging from 5 × 10¹⁵ (λ = 313 nm) to 4 × 10¹⁶ photons cm−2 s−1 (λ = 421 nm). [NO3] values decreased at higher photon flux values due to conversion of NO3 to NO2 via photolysis. As shown in Fig. 6b, significant additional NO2 production was obtained via HNO3 photolysis at shorter irradiation wavelengths above I ≈ 1015 photons cm−2 s−1, resulting in NO2 : NO3 > 10 (λ = 254 nm) and 1 (λ = 313 nm). Given additional reaction time downstream of the photoreactor, high NO2 may suppress NO3 (Sect. 3.2) and increase N2O5 : NO3 beyond the range of values shown in Fig. 6c. We also calculated OH : NO3 and HO2 : NO3 following irradiation of CAN HNO3 mixtures over the range of conditions shown in Fig. 6. Aqueous OH : NO3 ≈ 0.1 and did not change significantly as a function of photon flux or irradiation wavelength, and aqueous HO2 : NO3 values ranged from 0.05 (λ = 254 nm) to 0.25 (λ ≥ 369 nm). While OH influenced aqueous-phase chemistry inside the photoreactor via formation of reactive oxygen species (Sect. 3.5), OH probably did not influence downstream gas-phase chemistry due to significant wall losses inside the photoreactor: assuming a lower-limit OH wall loss rate coefficient of 5 s−1 (Schwab et al., 1989), the estimated OH penetration efficiency through the reactor was less than 10−6.
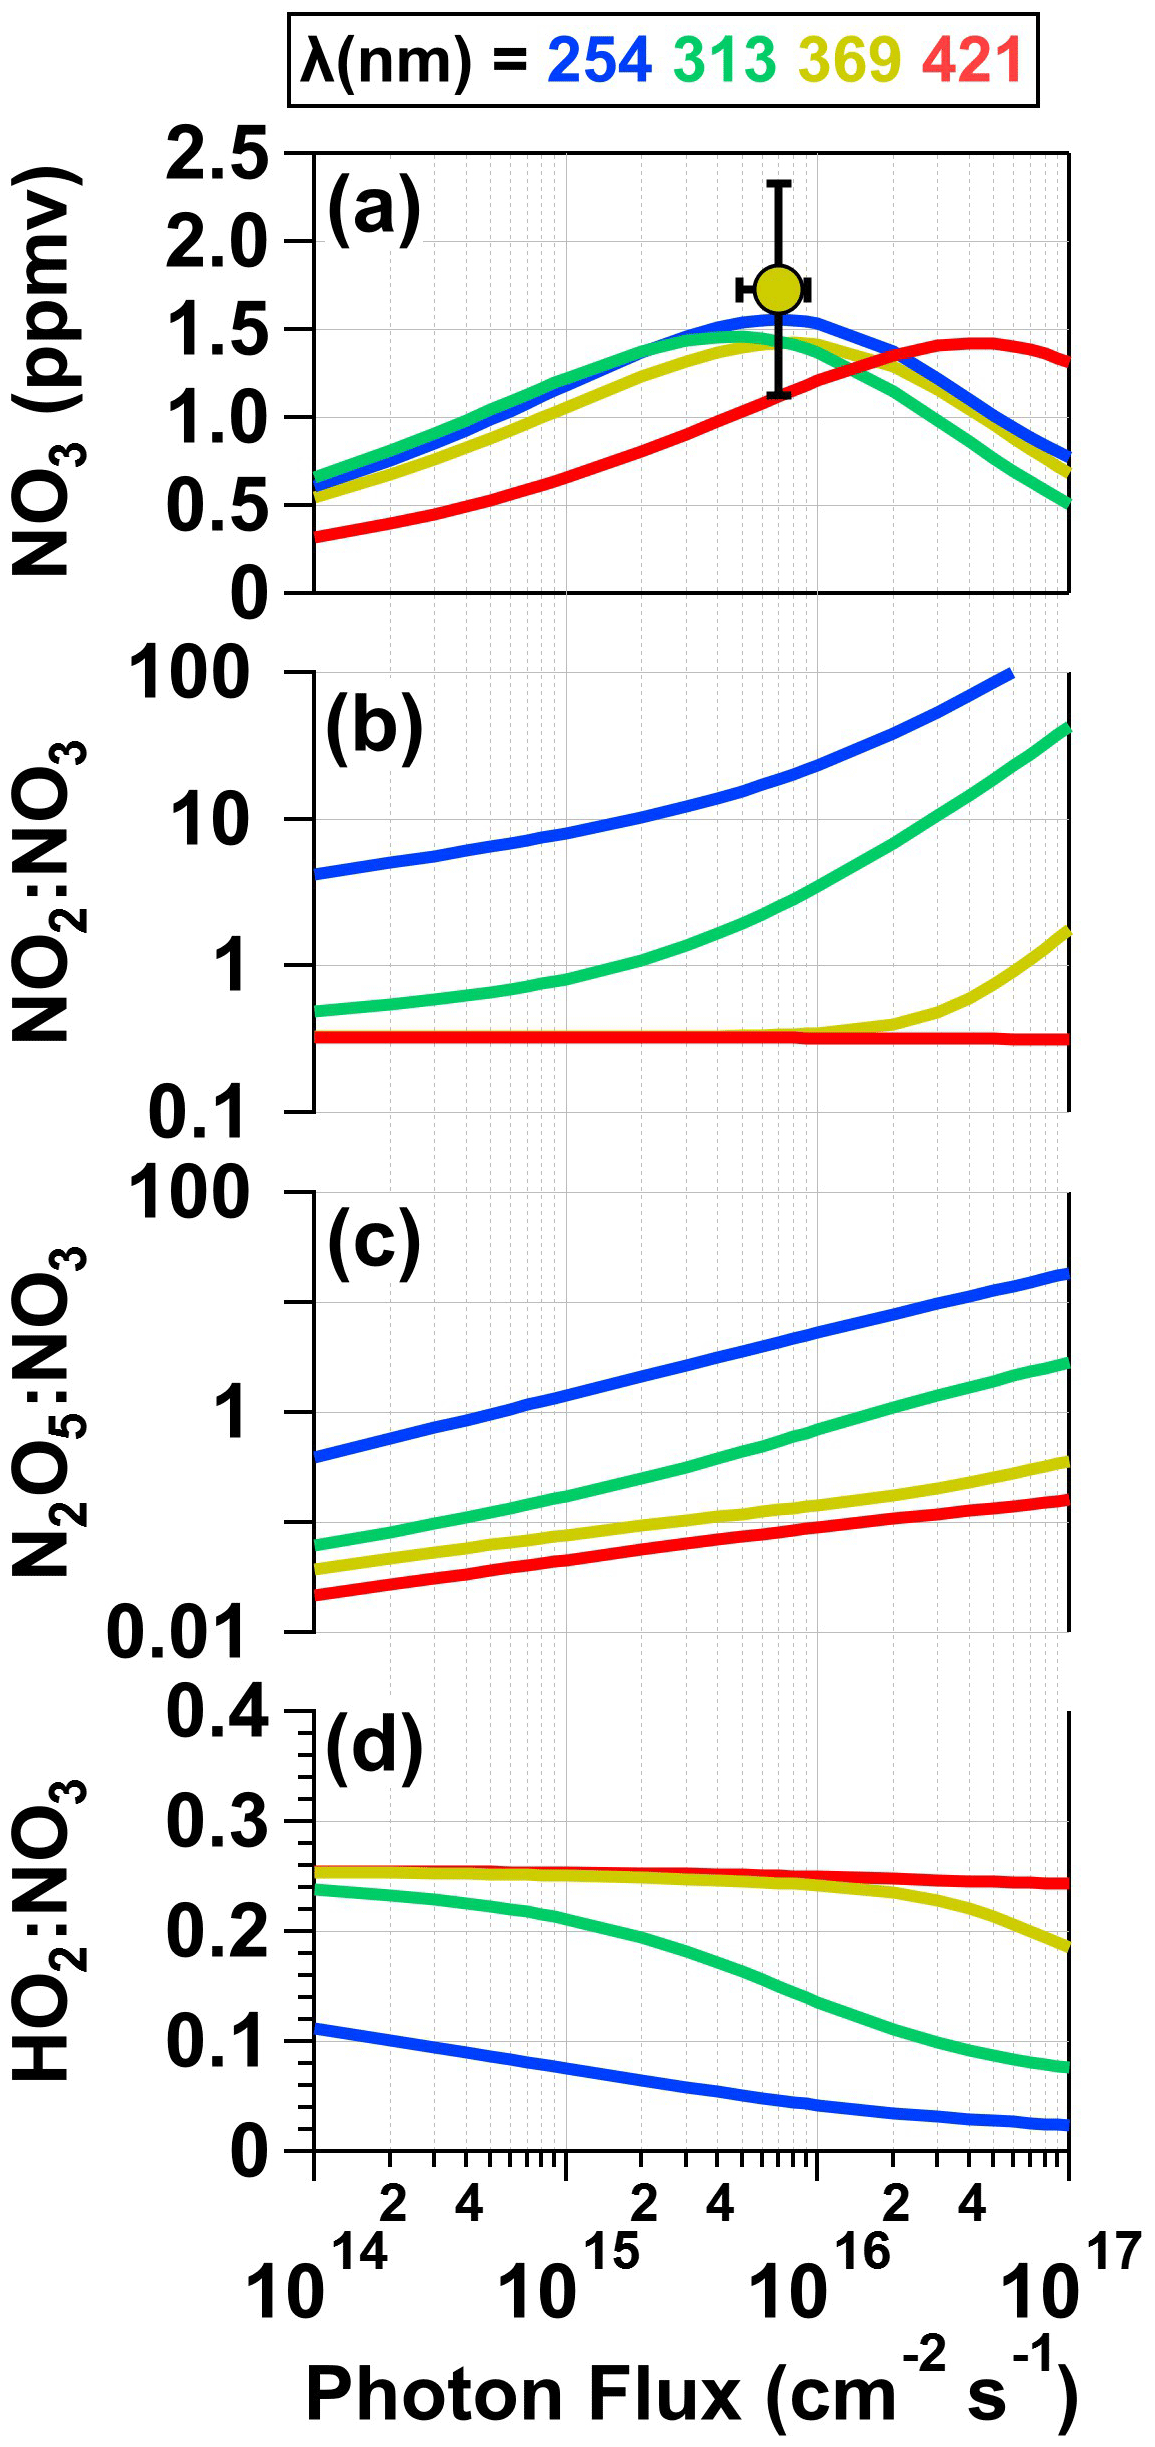
Figure 6Model-calculated (a) [NO3], (b) NO2 : NO3, (c) HO2 : NO3, and (d) N2O5 : NO3 values in solution as a function of photon flux ranging from 1 × 10¹⁴ to 1 × 10¹⁷ photons cm−2 s−1 following λ = 254, 313, 369, and 421 nm irradiation of a mixture containing 0.5 M CAN and 6.0 M HNO3. [NO3] obtained from measurements shown in Fig. 2 is plotted in (a). For details see Sect. 2.3 and Table S2.
3.5 Characterization of reactive nitrogen and reactive oxygen photolysis products
Figure 7 shows time series of reactive nitrogen and reactive oxygen species detected following irradiation of the same mixture of 0.5 M CAN and 1.0 M NaNO3 (I254 ≈ 1016 photons cm−2 s−1), shown here because the signal-to-noise ratio in CIMS measurements of irradiated CAN NaNO3 mixtures was generally better than in measurements of irradiated CAN HNO3 mixtures due to reagent ion depletion by HNO3. A time series of [NO3] obtained separately from VOC tracer decay measurements under similar irradiation conditions is also shown. The NO2 and NO3 mixing ratios reached maximum values of 26 and 58 ppbv shortly after the lights were turned on (Fig. 7a), suggesting an initial NO2 : NO3 ≈ 0.45 (Fig. 4). Multiple reactions may generate NO2, including Reaction (R3), HNO3 photolysis, and/or NO3 photolysis as well as other reactions listed in Table S2. While NO2 and/or HNO2 photolysis generated NO, its concentration was negligible in these experiments.
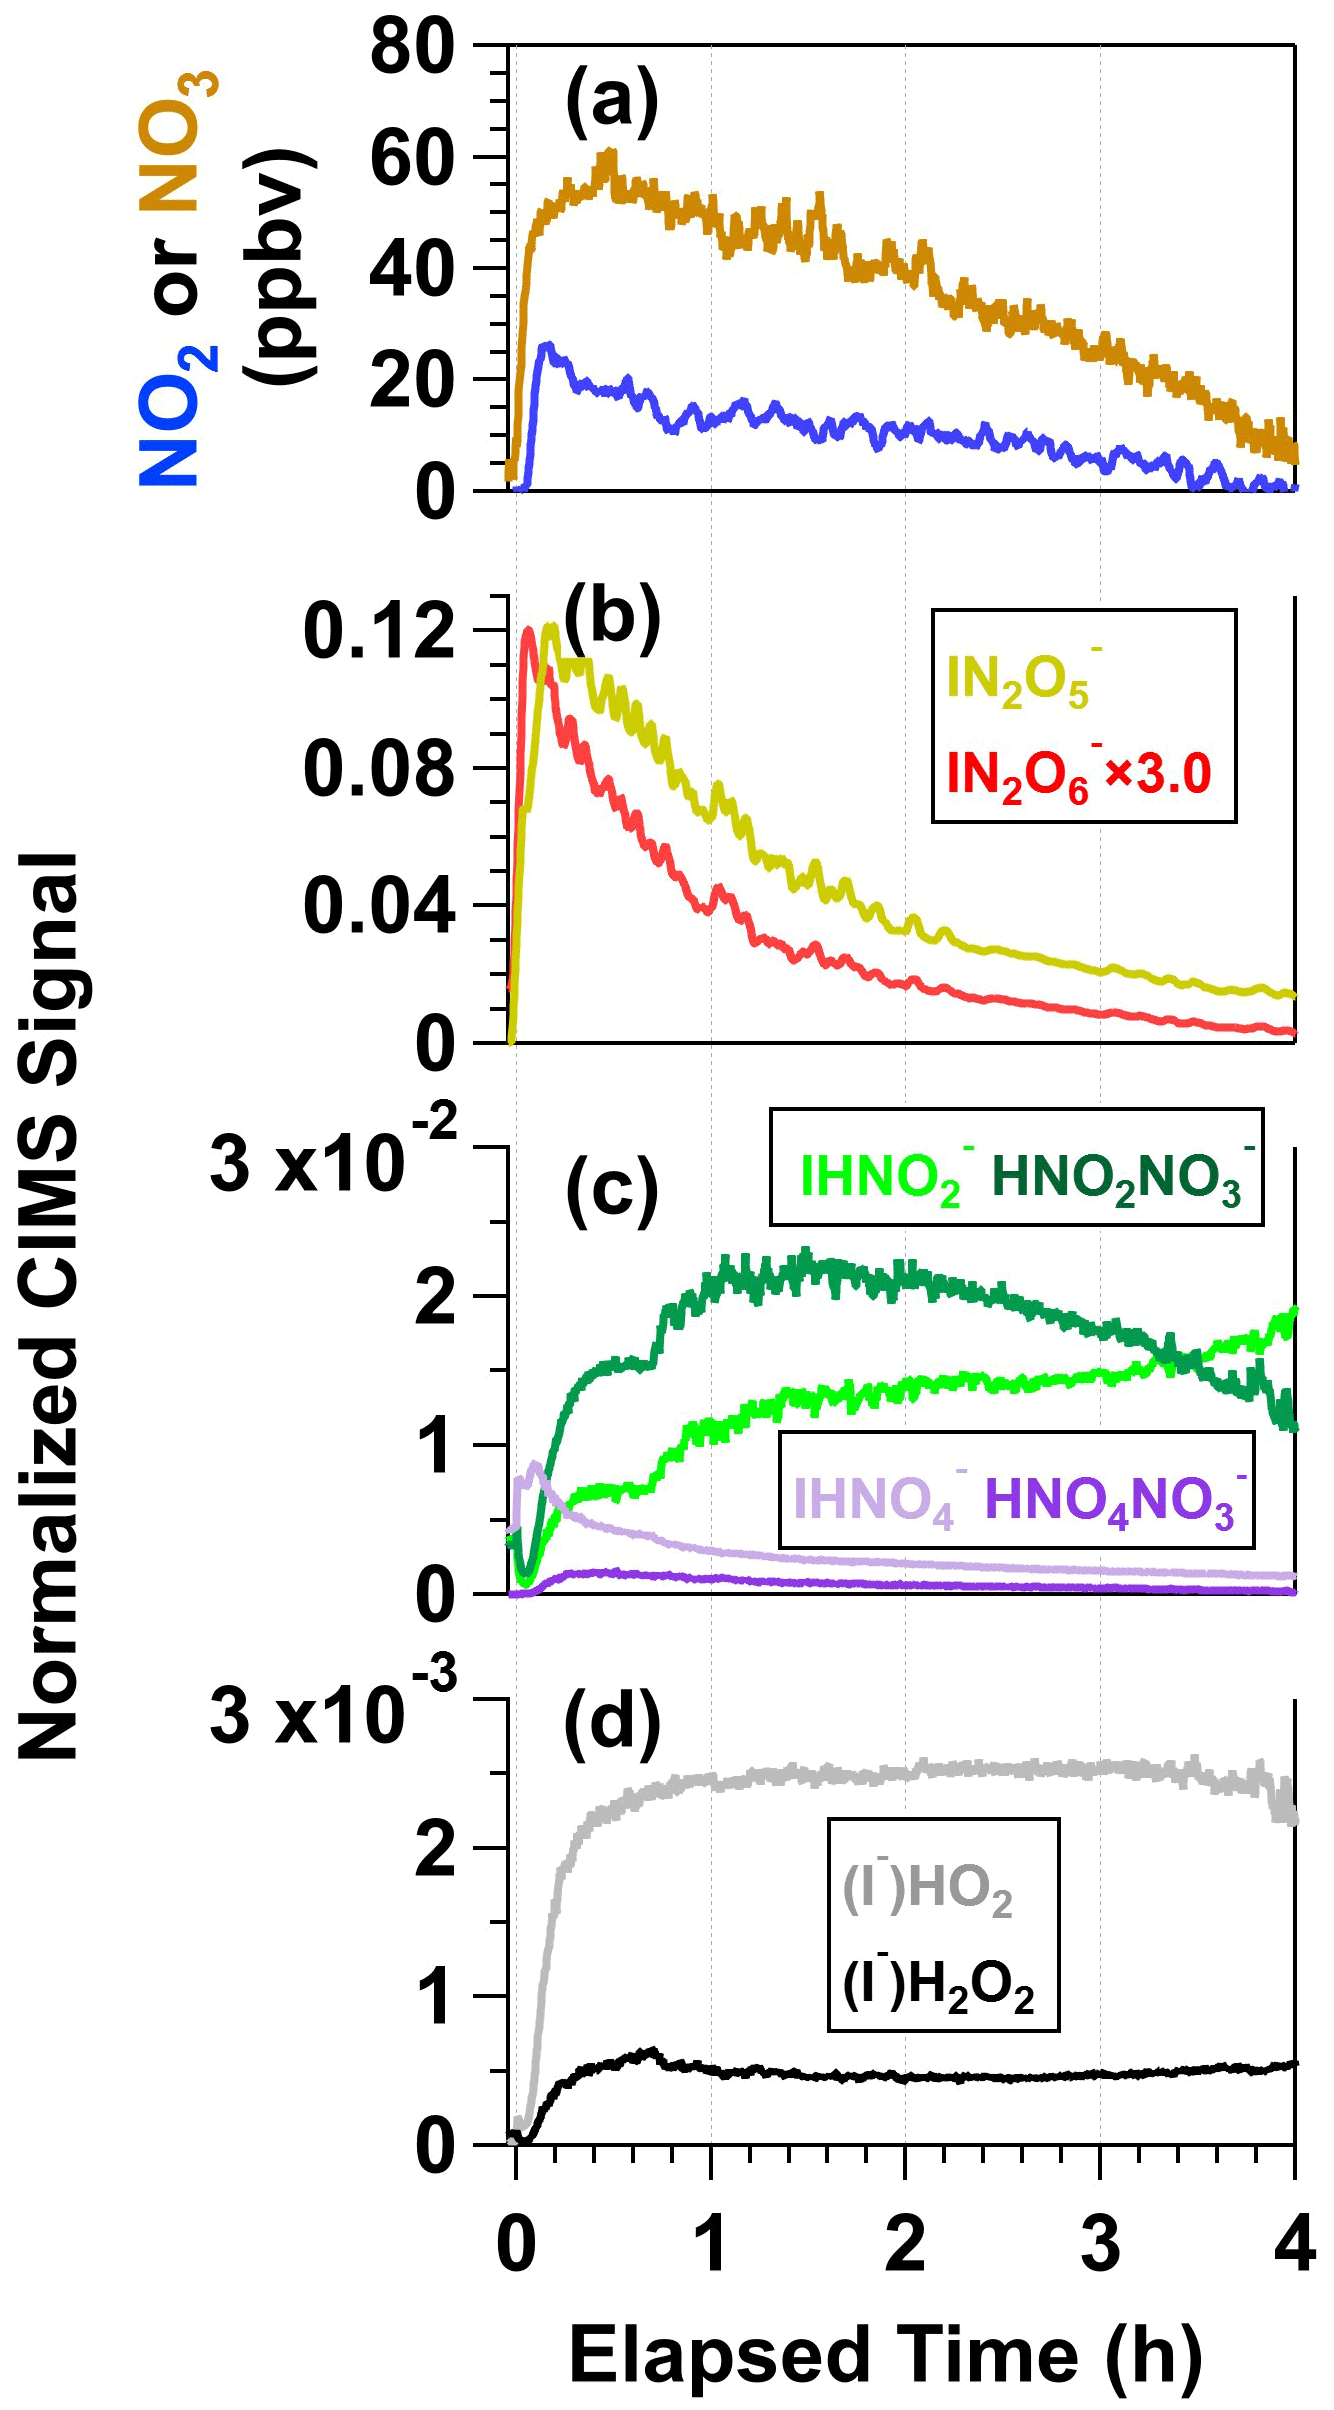
Figure 7Time series of (a) NO2 and NO3, (b) N2O5 and N2O6, (c) HNO2 and HNO4, and (d) HO2 and H2O2 detected following irradiation of a mixture containing 0.5 M CAN and 1.0 M NaNO3. N2O5, N2O6, HO2, and H2O2 were detected as I− adducts, and HNO2 and HNO4 were detected as both I− and adducts with HR-ToF-CIMS. CIMS signals detected as iodide adducts were normalized to the I− signal prior to the start of the experiment, and CIMS signals detected as nitrate adducts were normalized to the maximum obtained during the experiment (see Fig. S5).
Figure 7b shows time series of and signals measured with the CIMS. was formed from NO2 + NO3 → N2O5 reactions in the photoreactor and N2O5 + I− → reactions in the CIMS ion molecule reactor (IMR). As expected, followed a similar profile as NO2 and NO3. was either generated from NO3 + NO3 → N2O6 reactions in the photoreactor (Glass and Martin, 1970) followed by N2O6 + I− → reactions in the IMR or from the following series of reactions in the IMR: HNO3 + IO− → + HOI, HOI + → INO3 + OH−, and INO3 + → (Ganske et al., 2019). To further explore the plausibility of N2O6 formation in this system, we conducted a theoretical investigation of the gas-phase NO3 + NO3 → N2O6 reaction and found that this reaction is exothermic, even more so than NO3 + NO3 → N2O5. Additional details regarding this analysis are provided in Sect. S1.
Figure 7c shows time series of , , , and . These ions are associated with nitrous acid (HNO2) and peroxynitric acid (HNO4), respectively (Veres et al., 2015). Because rapid formation of ions was observed following Ce(IV) irradiation, and because signals were relatively low (Sect. S2.1), we hypothesize that I− + NO3 and/or I− + HNO3 reactions were the main source of (Lee et al., 2014; Dörich et al., 2021) and that subsequent competitive + HNO2−4 and I− + HNO2−4 reactions in the IMR generated both and . HNO4 was generated following the reactions HNO3 + hν → OH + NO2, OH + NO3 → HO2 + NO2, and HO2 + NO2 → HNO4. This hypothesis is supported by the similarity between NO2 and time series coupled with the relatively constant concentrations of HO2 generated via OH + OH → H2O2 and OH + H2O2 → HO2 + H2O reactions. H2O2, detected as , also behaved similarly as (Fig. 7d). HNO2 had a different temporal profile than the other nitrogen oxides: increased throughout the experiment, and increased and then decreased. We hypothesize that NO2 + NO2 → N2O4 and N2O4 + H2O → HNO2 + HNO3 reactions were the main source of HNO2 (Sect. S2.2).
Figure S13 shows time series of the same ions plotted in Fig. 7 following irradiation of a solution containing 0.5 M CAN and 3.0 M HNO3 (I369 ≈ 7 × 10¹⁵ photons cm−2 s−1). Here, 3.0 M HNO3 was used because 6.0 M HNO3 depleted the CIMS reagent ion too much ( : I− ≈ 15) to achieve signal-to-noise ratio that was sufficient for comparison to CAN NaNO3 mixtures ( : I− ≈ 3). The same gas-phase nitrogen oxides and reactive oxygen species were observed in this reaction system as with the irradiated CAN NaNO3 mixture. The relative yields of each compound plotted in Figs. 7 and S13 were within a factor of 3 of each other, although signals of nitrogen oxides and reactive oxygen species obtained from irradiated CAN HNO3 mixtures decreased at a slower rate than the same compounds obtained from irradiated CAN NaNO3 mixtures. These trends may be due to different Ce(IV) composition (Fig. 3 and Sect. 3.2) and/or an enhanced rate of Ce(III) + NO3 → Ce(IV) reactions in HNO3 relative to NaNO3 (Reaction R2).
3.6 OVOC–SOA generation from β-pinene + NO3
To demonstrate proof of principle for NO3-initiated oxidative aging studies, we generated NO3 via irradiation of a mixture of 0.5 M CAN and 3.0 M HNO3 (I369 = 7 × 10¹⁵ photons cm−2 s−1), reacted it with β-pinene in a dark OFR, and obtained FIGAERO-CIMS spectra of gas- and condensed-phase β-pinene + NO3 oxidation products (Sect. 2.2). Figure 8a shows a spectrum of gas-phase β-pinene NO3 oxidation products detected between = 320 and 420, where the majority of the signal was observed; signals shown are unmodified (M + I)− formulas. The largest ion detected was at = 356 (), which represents a major first-generation dicarbonyl nitrate oxidation product with a relative abundance of 0.31 and a calculated saturation vapor pressure of 2 × 10⁻⁷ atm (C∗ = 1900 µg m−3; Claflin, 2018). Other ions corresponding to first-generation hydroxycarbonyl nitrate (, C∗ = 95 µg m−3), tricarbonyl nitrate (, C∗ = 35 µg m−3), hydroxydicarbonyl nitrate (, C∗ = 4.7 µg m−3), and hydroxycarbonyl nitrate acid (, C∗ = 0.29 µg m−3) products were detected in addition to and a suite of additional previously characterized C8 and C9 organic nitrates (Nah et al., 2016; Takeuchi and Ng, 2019; Shen et al., 2021). The hydroxy dinitrate, which was also previously observed in FIGAERO-CIMS spectra of α-pinene NO3 SOA (Nah et al., 2016), was generated via an unknown reaction pathway. Overall, the high molar yield and vapor pressure of C10H15NO5 (Claflin, 2018) are consistent with it having the highest relative abundance in the gas phase (Fig. 8a), whereas the other C10 β-pinene oxidation products were semivolatile under our experimental conditions.
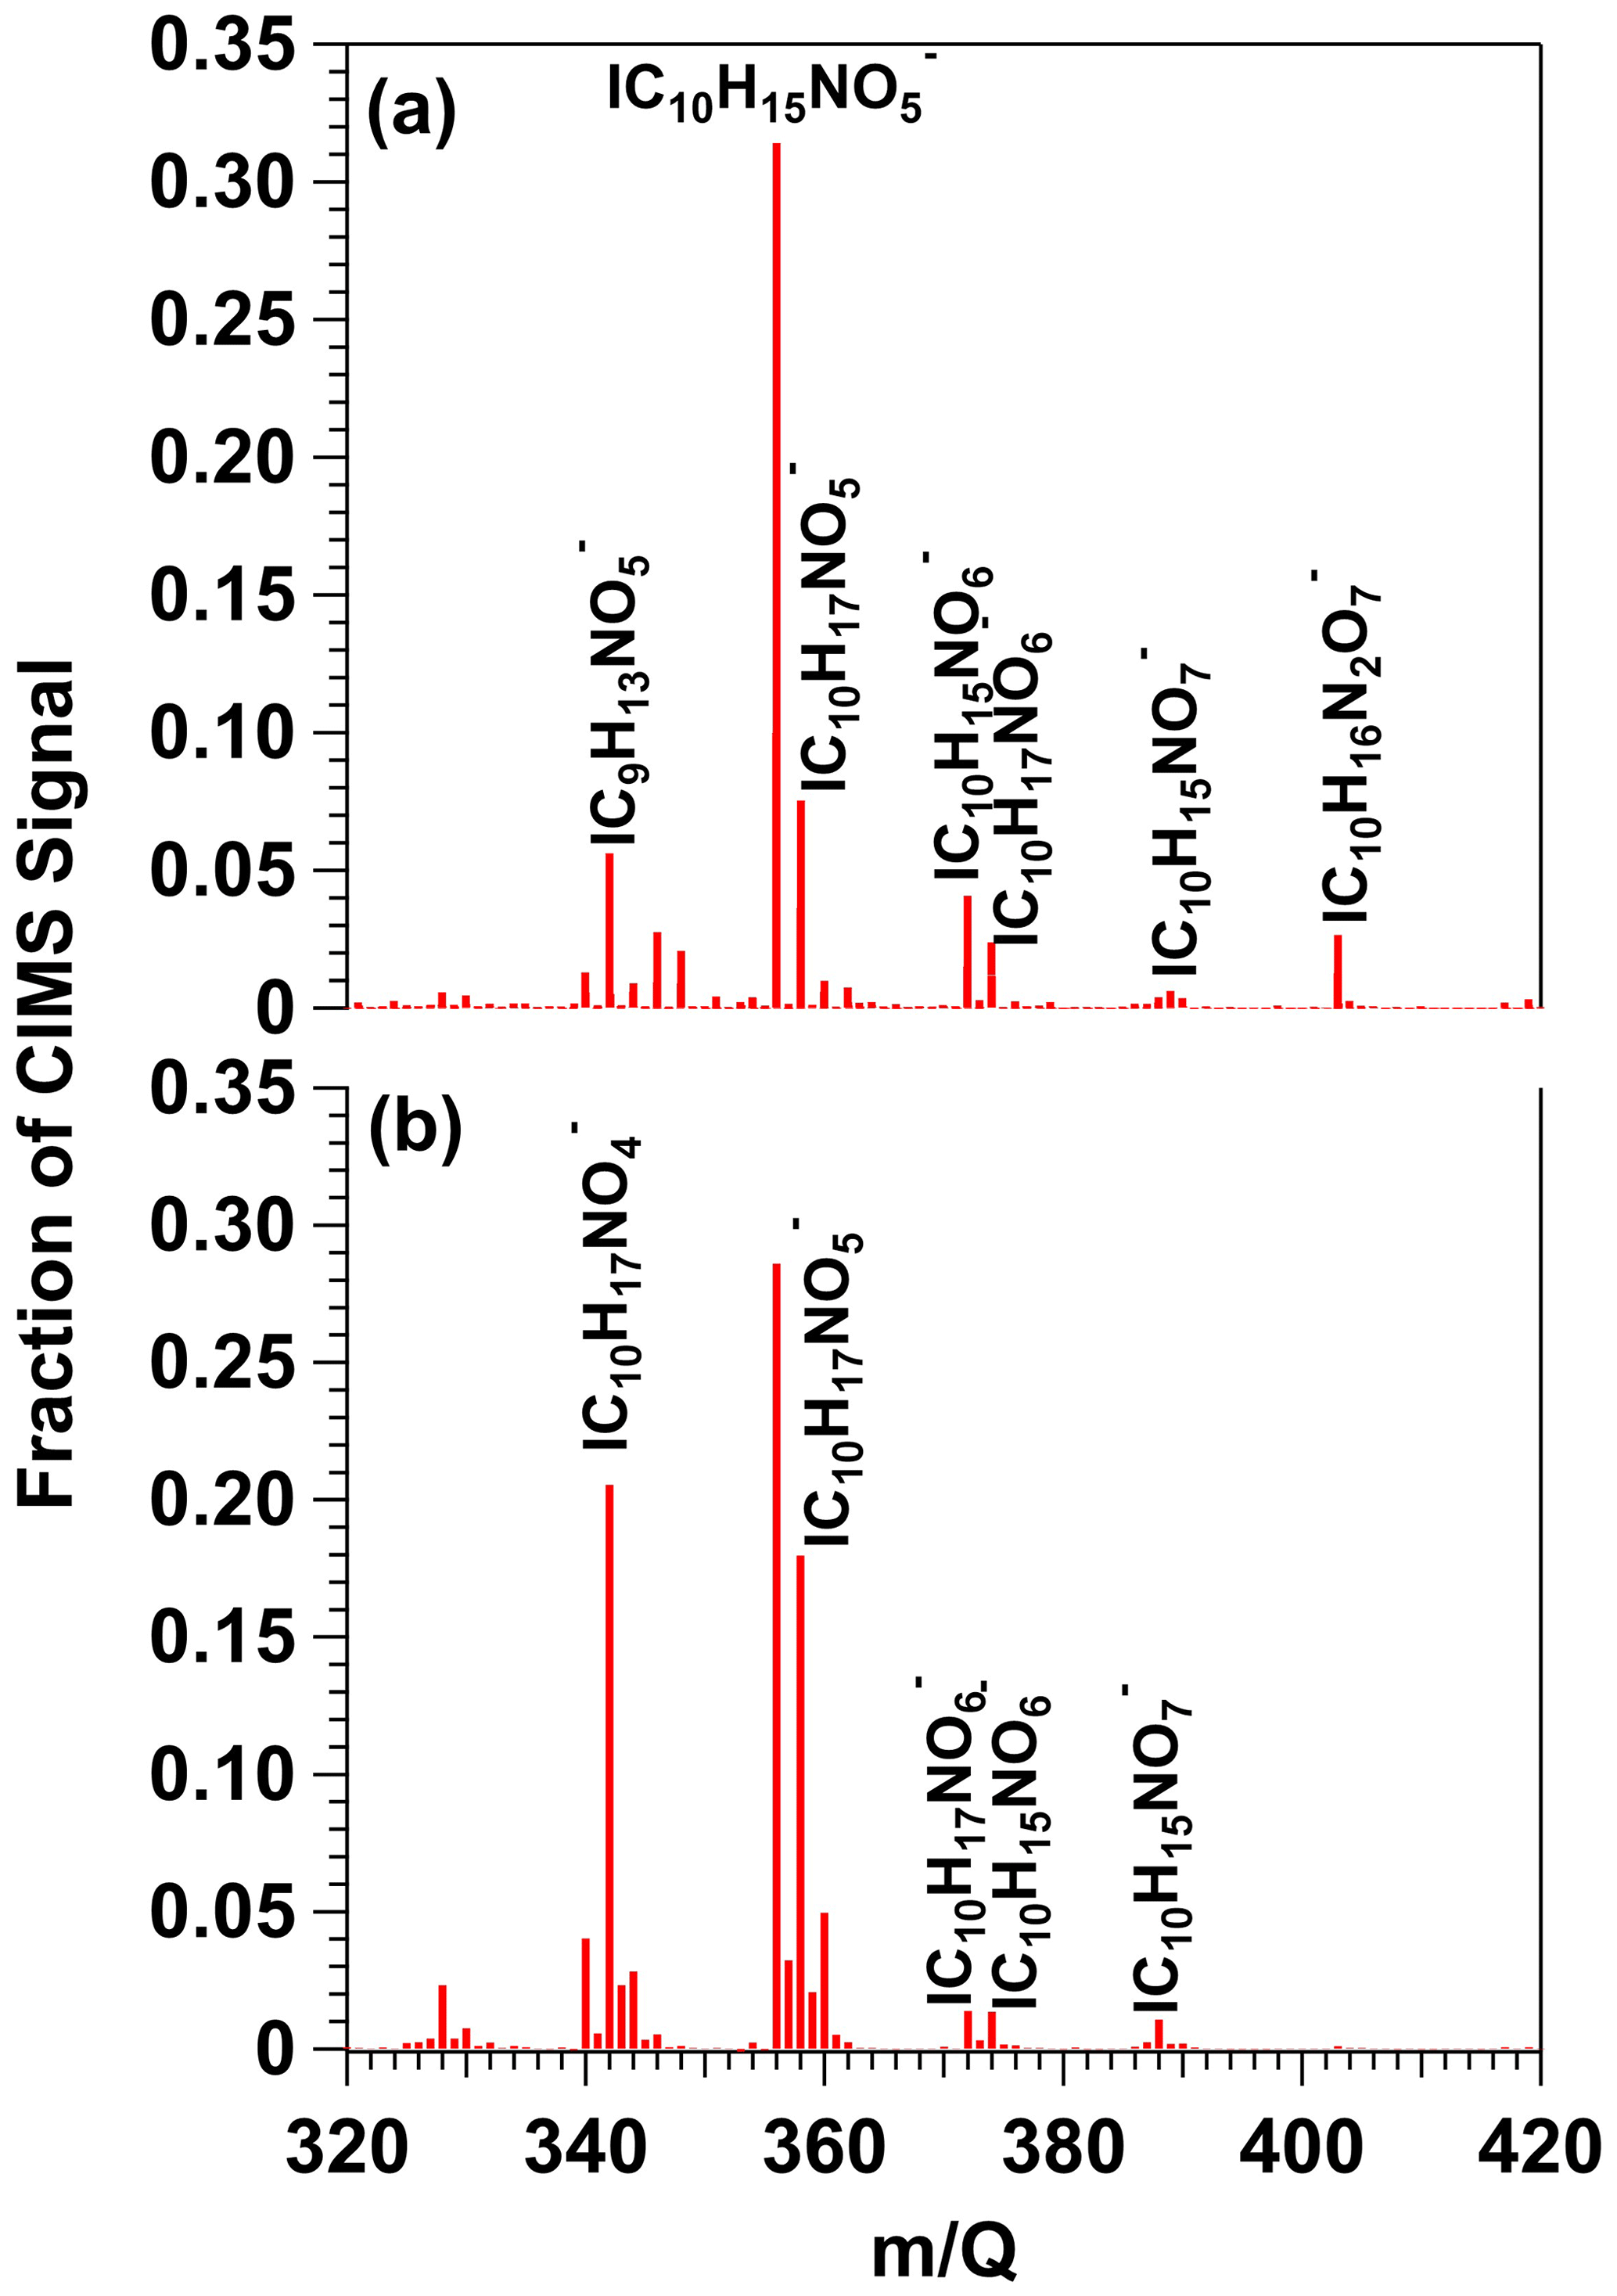
Figure 8HR-ToF-CIMS spectra of gas-phase β-pinene NO3 oxidation products obtained following β-pinene reaction with NO3 generated via (a) irradiation of a mixture of 0.5 M CAN and 3.0 M HNO3 and subsequent injection into the OFR (b) thermal decomposition of N2O5 injected into the Georgia Tech environmental chamber. Signals shown are unmodified (M + I)− formulas.
Figure 9a shows a spectrum of condensed-phase β-pinene NO3 oxidation products obtained with the FIGAERO-CIMS; signals were averaged over the entire thermal desorption cycle and are plotted on logarithmic scale and represent unmodified (M + I)− formulas. To aid interpretation of the major features of the spectrum, bands of ion signals corresponding to , , and oxidation products were highlighted and colored by the number of oxygen atoms in their chemical formulas. Here, the largest ion detected was at = 372 (), which is the condensed-phase component of the same tricarbonyl nitrate detected in the gas phase (Fig. 8a). and signals were also detected. The second-largest ion signal was measured at = 571 (), an acetal dimer obtained from the condensed-phase reaction of two C10H17NO5 monomers followed by H2O elimination (Claflin and Ziemann, 2018). Similar accretion reactions between other C10 organic nitrates yielded and signals. Likewise, reactions between C10 monomers and C20 dimers generated C30 trimers detected between = 768–864 (). The largest trimer-related ion, , was generated from C10H17NO4 + C20H32NO9 − H2O or C10H17NO5 + C20H32NO8 − H2O reactions (Claflin and Ziemann, 2018). A fourth cluster of ion signals at > 984 was also observed. Unambiguous assignment of chemical formulae to these signals was challenging due to the limited range of the CIMS calibration and lack of available information about C>30 β-pinene NO3 oxidation products. However, it seems plausible that these signals are associated with tetramers.
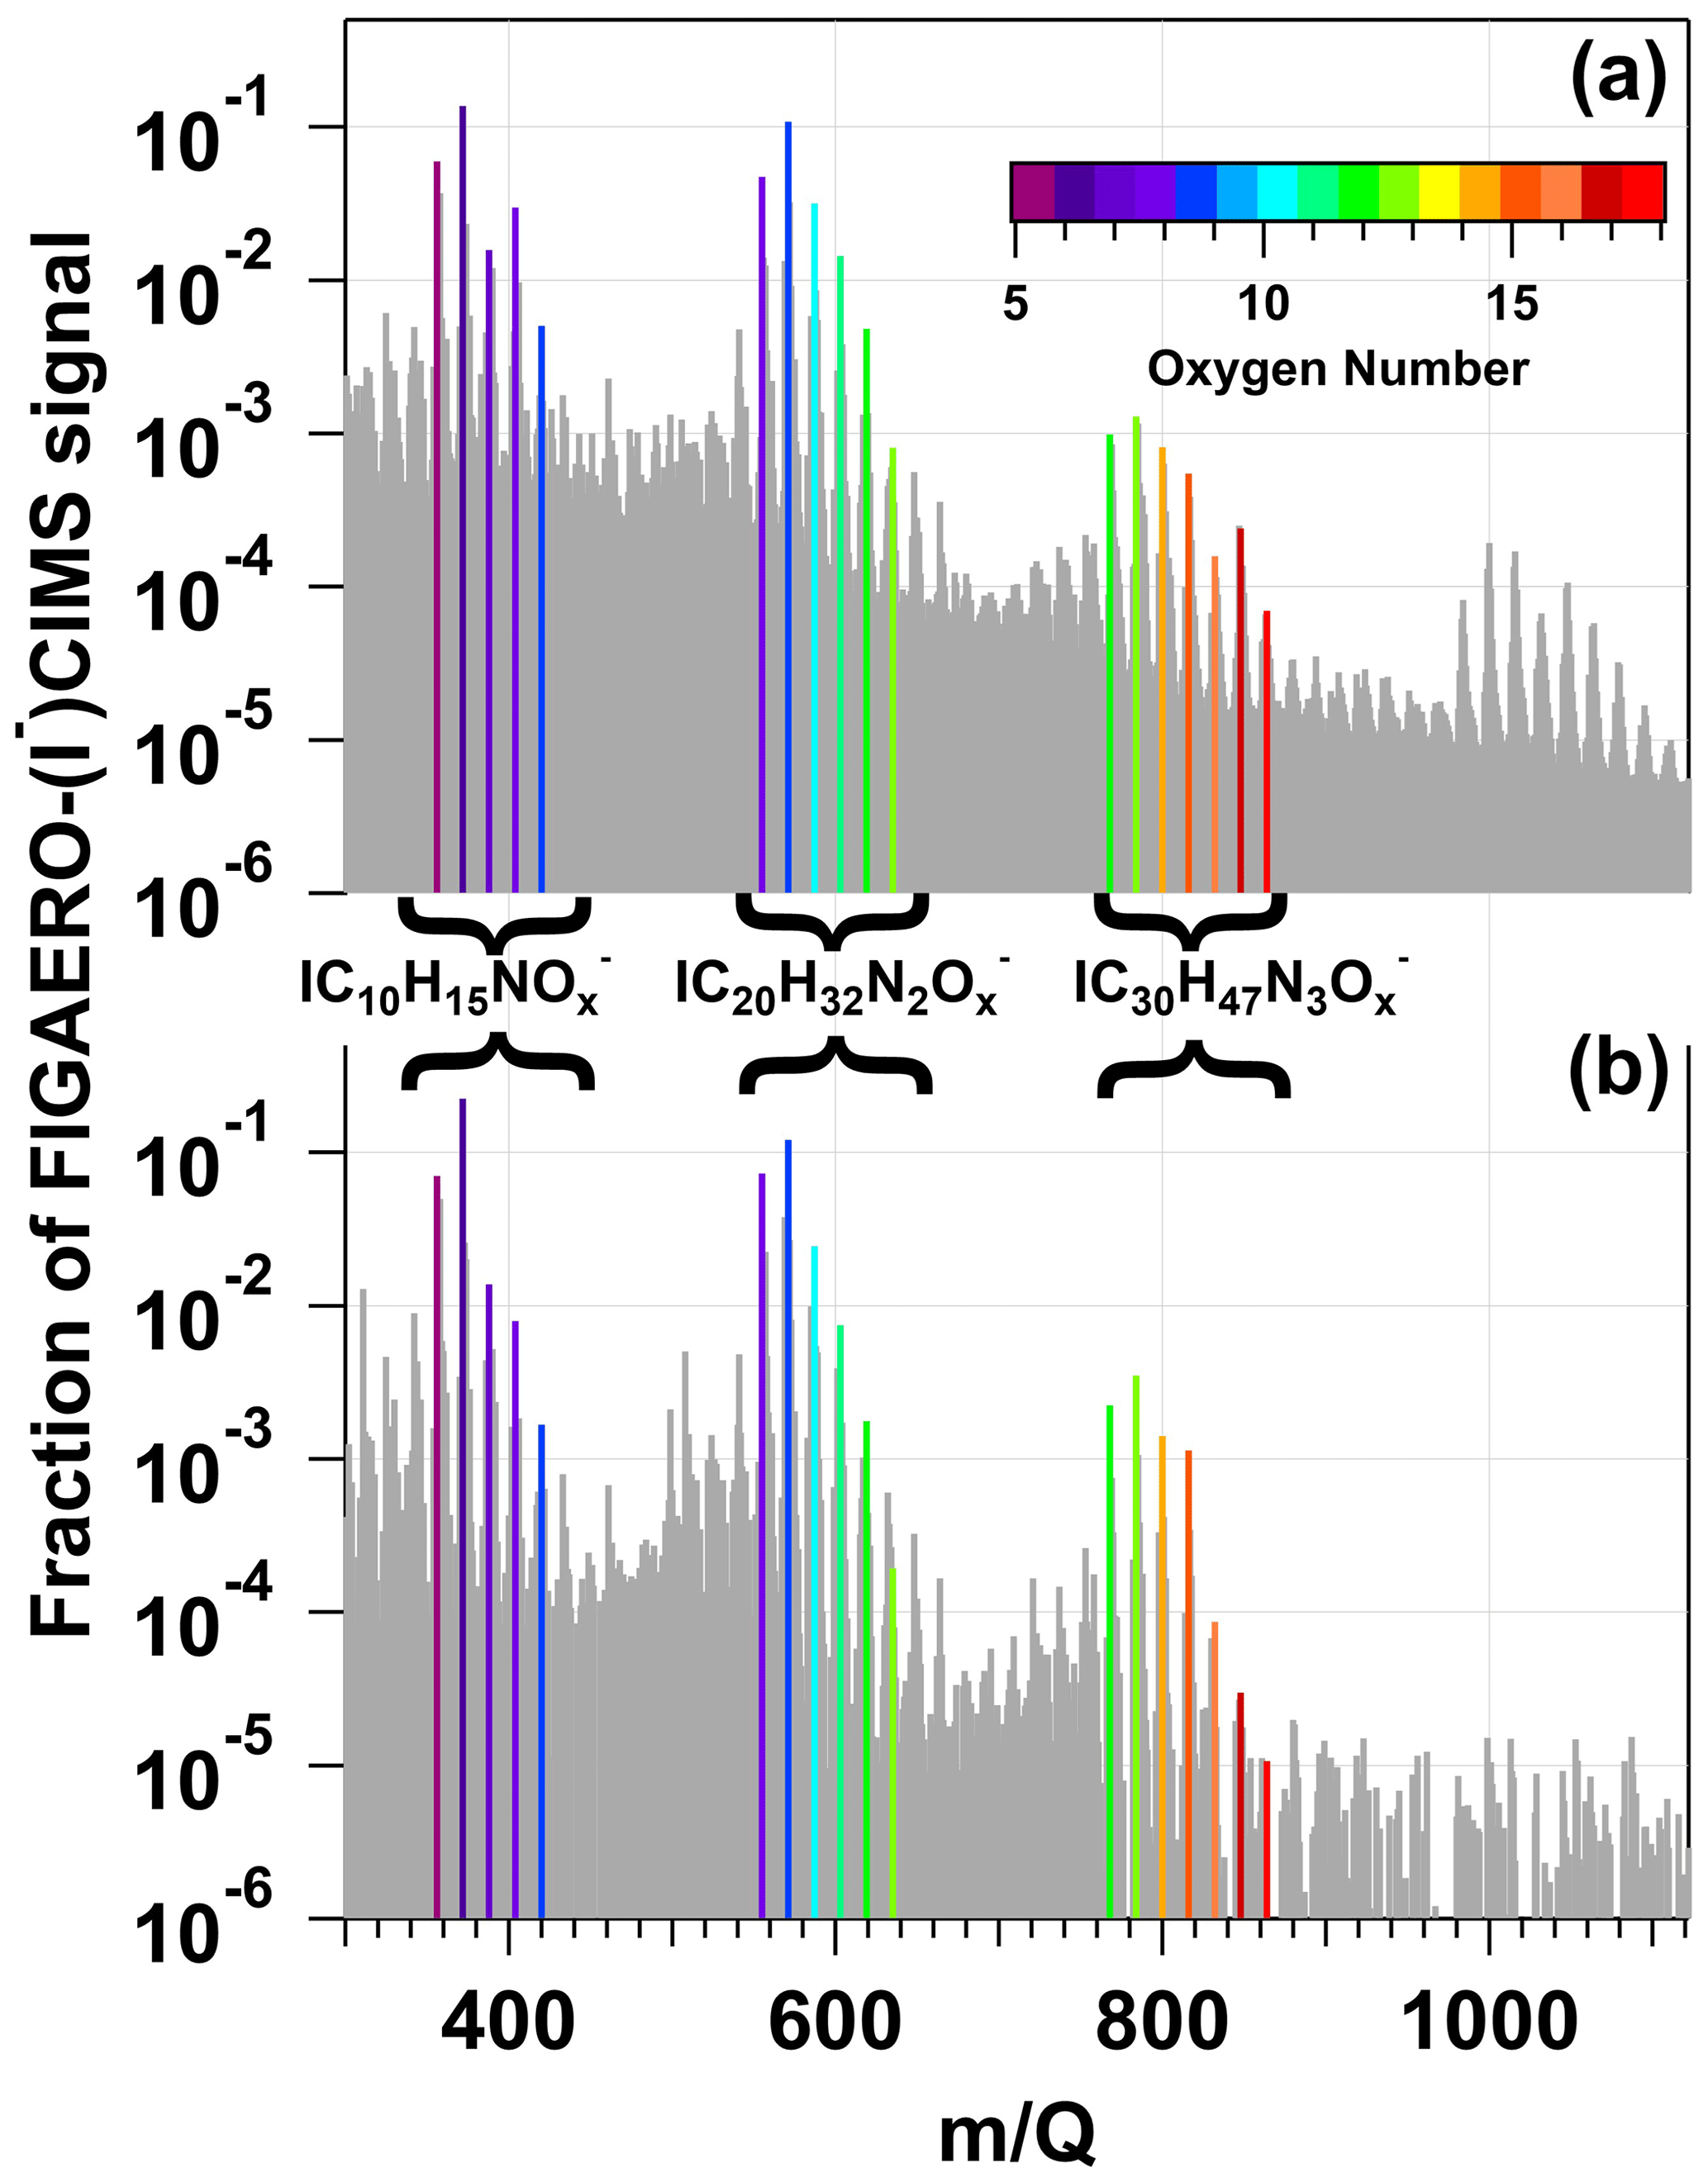
Figure 9FIGAERO–HR-ToF-CIMS spectra of condensed-phase β-pinene NO3 oxidation products obtained following β-pinene reaction with NO3 generated via (a) irradiation of a mixture of 0.5 M CAN and 3.0 M HNO3 and subsequent injection into an OFR and (b) thermal decomposition of N2O5 injected into the Georgia Tech environmental chamber. Signals shown are unmodified (M + I)− formulas. Bands of ion signals corresponding to C10H15NOx, C20H32N2Ox, and C30H47N3Ox oxidation products are highlighted and colored by the number of oxygen atoms in their chemical formulas.
To compare our results with those obtained using a conventional NO3 generation method (room-temperature N2O5 thermal decomposition) in an environmental chamber study, Figs. 8b and 9b show reference gas- and condensed-phase FIGAERO-I−-CIMS spectra of OVOCs and SOA generated from NO3 oxidation of β-pinene in the Georgia Tech environmental chamber (Takeuchi and Ng, 2019). The spectra obtained here and by Takeuchi and Ng (2019) exhibit an overall high degree of similarity, with linear correlation coefficients of 0.87 and 0.96 between the respective gas- and condensed-phase spectra. Clusters of , , and ion signals are present in both Fig. 9a and b. The main differences between the gas-phase spectra shown in Figs. 8a and 9a were the different abundances of , a first-generation hydroxynitrate product (Claflin and Ziemann, 2018), and . Because C10H17NO4 is formed from RO2 + RO2 reactions (DeVault et al., 2022) and is sufficiently volatile (C∗ = 750 µg m−3) to partition into the gas phase (Claflin, 2018), differences in gas-phase C10H17NO4 and C10H16N2O7 yields were likely related to differences in the relative importance of RO2 + RO2 versus RO2 + NO3 reaction pathways in the study by Takeuchi and Ng (2019) compared to this work.
To further investigate the fate of RO2 generated from VOC + NO3 reactions as a function of CAN irradiation conditions, we calculated the fractional oxidative loss of generic alkyl and acyl RO2 species due to reactions with HO2, NO3, and NO2 (, , ) using Eqs. (1)–(3):
Here, , , and are reaction rate coefficients for the corresponding RO2 + HO2, RO2 + NO3, and RO2 + NO2 forward reactions whose values are summarized in Table S3. Several simplifying assumptions were made. First, we assumed that RO2 + NO reactions were negligible. Second, we did not consider RO2 isomerization–autoxidation and RO2 + RO2 reactions that are influenced by external factors. Third, we set = 0 for alkyl-RO2-generated RO2NO2, which thermally decomposes on timescales of seconds or less (Orlando and Tyndall, 2012). Fourth, we assumed that vapor wall losses of acyl-RO2-generated RO2NO2 were a minor RO2 sink because the OFR residence time (τOFR ≈ 120 s, Sect. 2.2) was significantly shorter than their estimated wall loss timescale (τwall ≈ 400 s; Palm et al., 2016). Figure 10 shows calculated , , and values for alkyl-RO2 and acyl-RO2 as a function of photon flux over the range of NO3 generation conditions presented in Fig. 6. For alkyl-RO2, decreased and increased with increasing photon flux and decreasing irradiation wavelength. On the other hand, for acyl-RO2, increased, while and decreased over the same irradiation conditions. Overall, at the optimal NO3 generation conditions (e.g., λ=369 nm and I369 ≈ 1016 photons cm−2 s−1), our calculations suggest that ≈ for alkyl-RO2 (Fig. 10c) and that ≈ ≈ for acyl-RO2 (Fig. 10g).
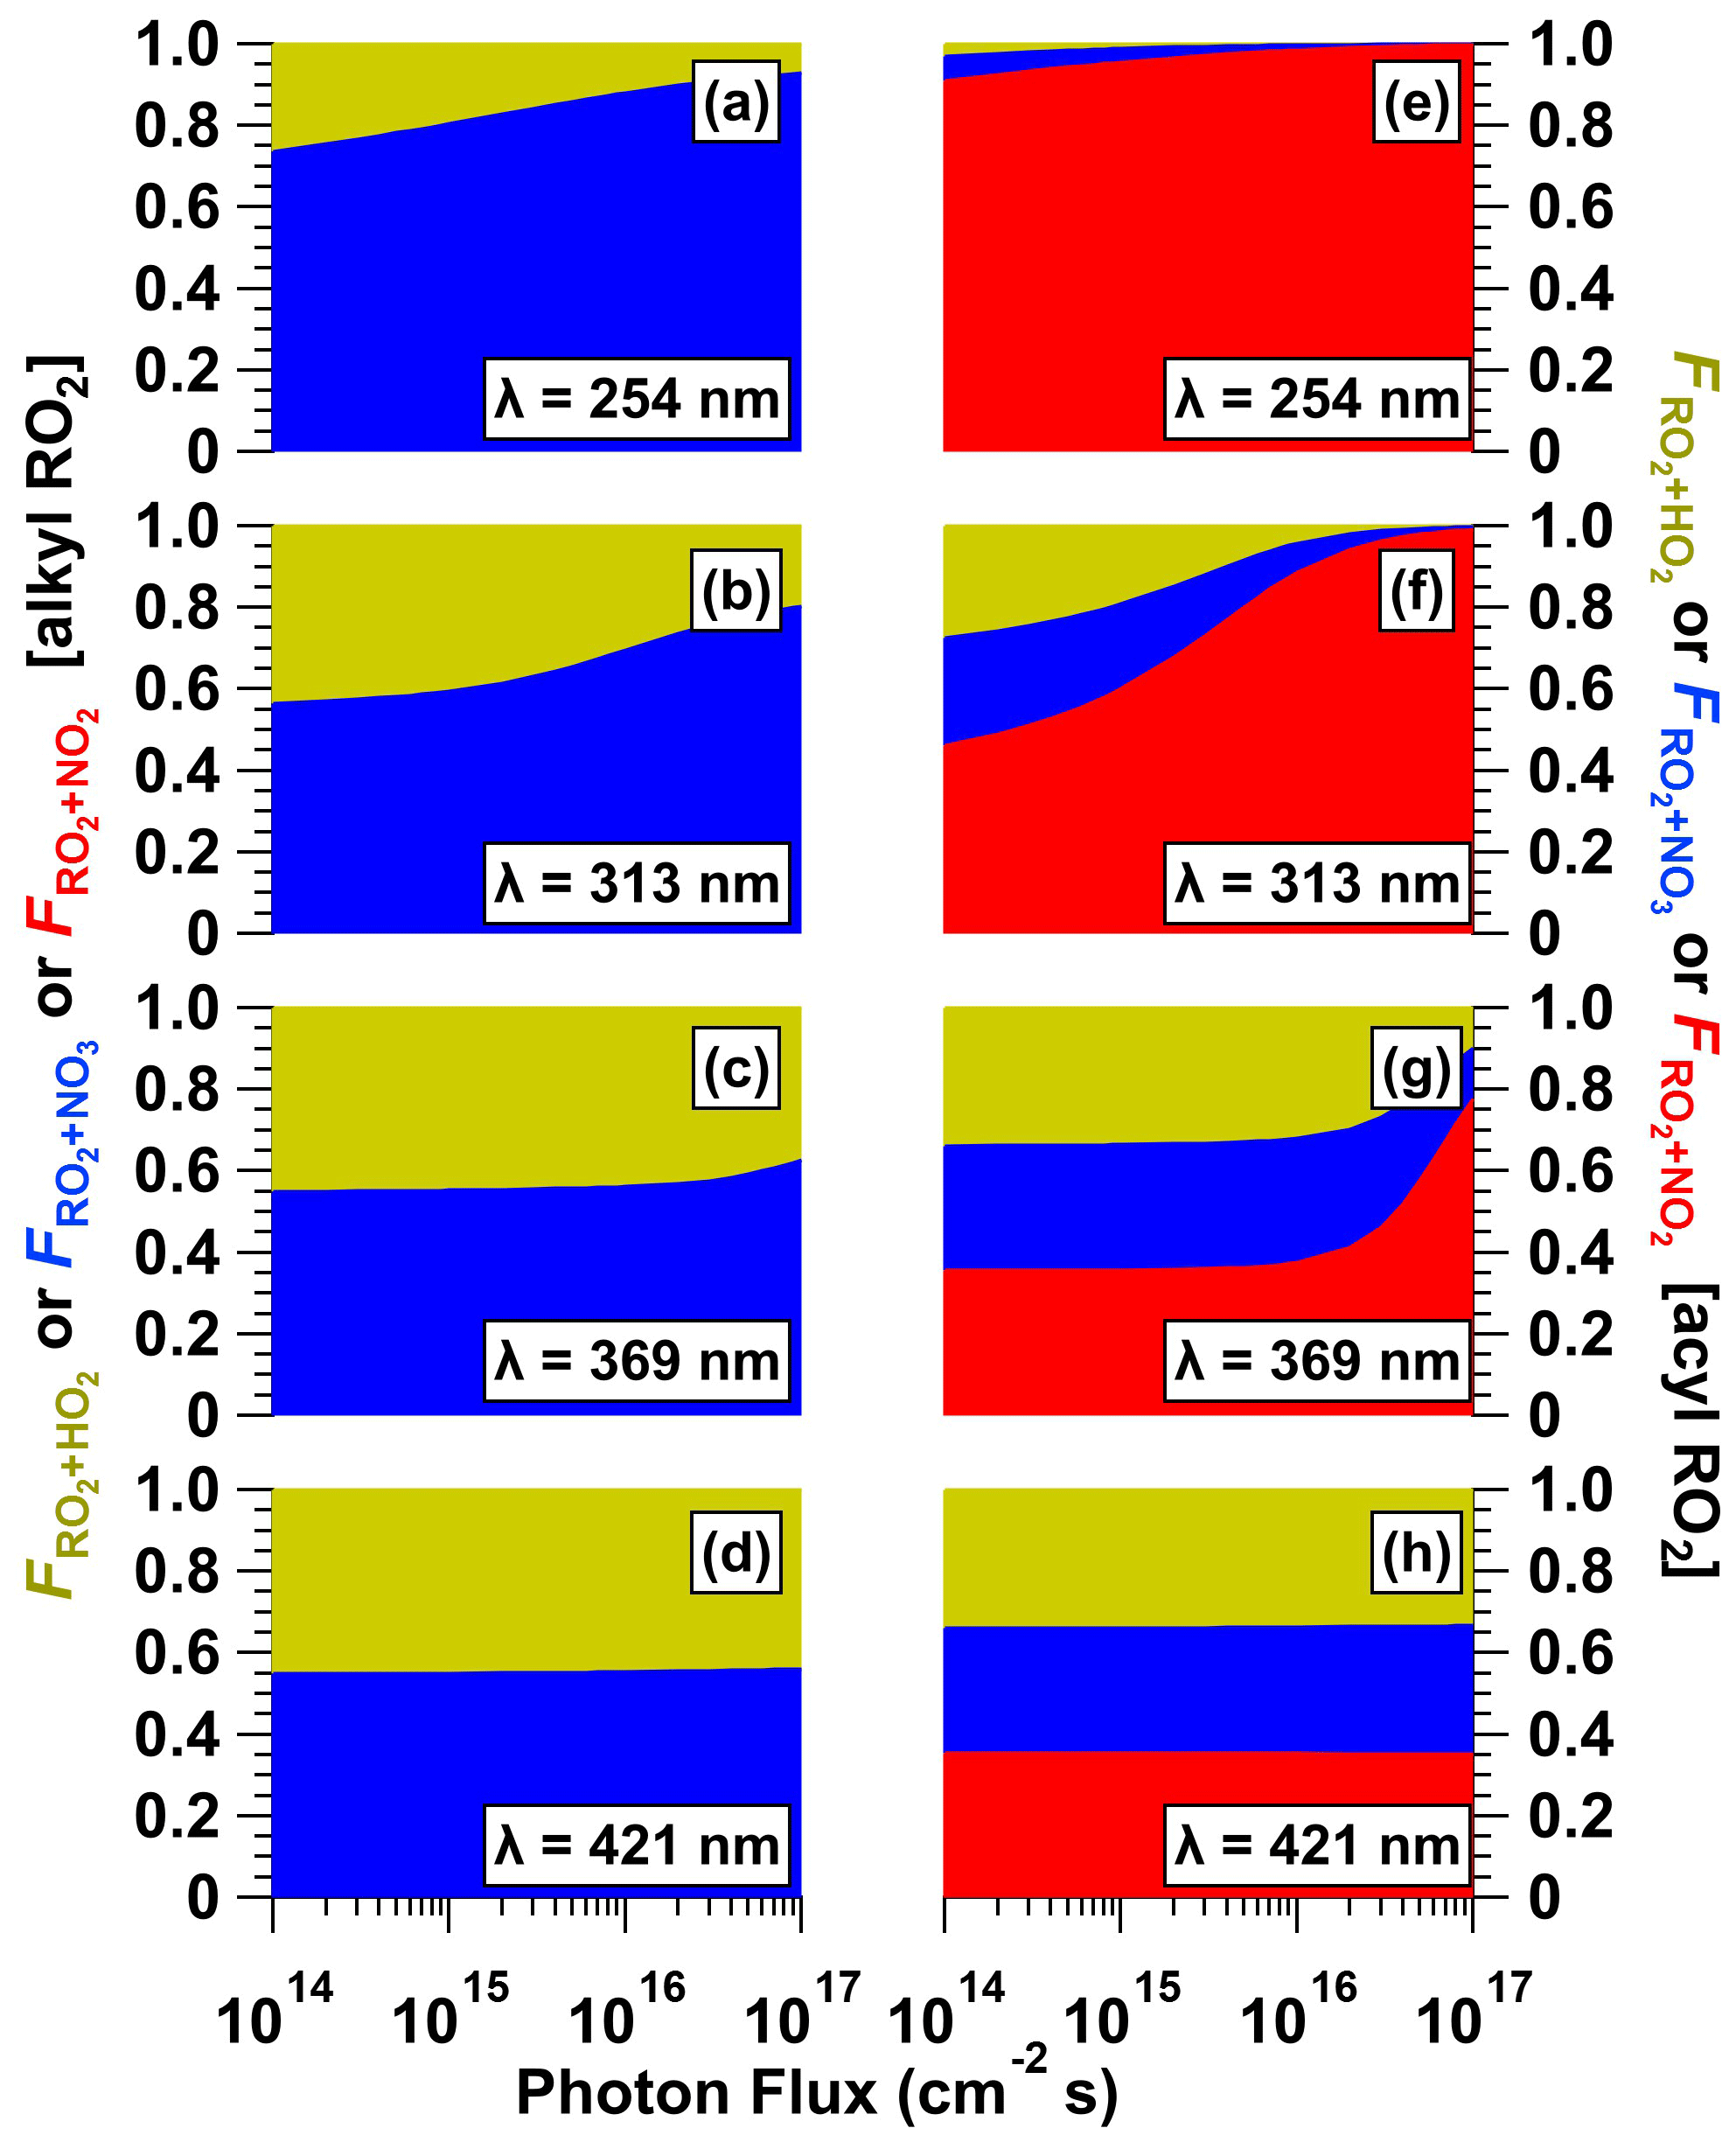
Figure 10Fractional oxidative loss of alkyl and acyl organic peroxy radicals (RO2) due to reaction with HO2, NO3, and NO2 (, , and ) generated following (a, e) λ = 254, (b, f) λ = 313, (c, g) λ = 369, and (d, h) λ = 421 nm irradiation of a mixture containing 0.5 M CAN and 6.0 M HNO3 as a function of photon flux ranging from 1 × 10¹⁴ to 1 × 10¹⁷ photons cm−2 s−1.
Ce(IV) irradiation complements NO2 + O3 reactions and N2O5 thermal dissociation as a customizable photolytic NO3 source. Important method parameters were [CAN], [HNO3], or [NaNO3]; UV intensity; and irradiation wavelength. By contrast, important parameters for NO2 + O3 and N2O5 based methods are [O3], [NO2], temperature, and humidity. Because Ce(IV) irradiation already generates NO3 in aqueous solution, its performance is not hindered by humidity to the same extent (if at all) as N2O5-based methods, where hydrolysis of N2O5 to HNO3 decreases the efficacy of the source. Additionally, the NO3 + H2O reaction rate in solution or on surfaces is slow in relation to other NO3 loss pathways (Jiang et al., 1992). Another advantage of Ce(IV) irradiation is that it does not involve the use of O3 as a reagent; therefore it eliminates the possibility of competing O3 and NO3 oxidation of compounds that are reactive towards both oxidants if NO2 + O3 reactions and/or online N2O5 synthesis are used as the NO3 source (Lambe et al., 2020). To identify optimal operating conditions for maximizing [NO3], we characterized concentrations of NO3 at [CAN] = 10−3 to 1 M, [HNO3] = 1.0 to 6.0 M, [NaNO3] = 1.0 to 4.8 M, a photon flux of 6.9 × 10¹⁴ to 1.0 × 10¹⁶ photons cm−2 s−1, and irradiation wavelengths of λ = 254, 313, 369, or 421 nm. With CAN HNO3 mixtures, maximum [NO3] was achieved with [CAN] ≈ 0.5 M, [HNO3] ≈ 3.0 to 6.0 M, and I369 = 8 × 10¹⁵ photons cm−2 s−1 (4.3 mW cm−2). With CAN NaNO3 mixtures, maximum [NO3] was achieved with [CAN] ≈ 1.0 M, [NaNO3] ≥ 1.0 M, and I254 ≈ 1 × 10¹⁶ photons cm−2 s−1 (7.8 mW cm−2). Thus, for applications such as environmental chambers or OFR studies of NO3-initiated oxidative aging processes, where significant NO3 production over relatively short time periods is beneficial, irradiation of concentrated Ce(IV) solutions at high photon flux is advantageous. Other applications that require sustained NO3 production at lower concentrations and/or over longer time periods may benefit from using lower [Ce(IV)] and photon flux. Overall, because Ce(IV) irradiation generates NO3 at room temperature using widely available, low-cost reagents and light sources (including high-power light-emitting diodes in addition to, or instead of, UV fluorescent lamps), it is easier to apply than other NO3 generation techniques – especially in field studies – and it may therefore enable more widespread studies of NO3 oxidation chemistry. Adapting a photoreactor to operate with continuous injection of fresh Ce(IV) or alternative photolytic NO3 precursors (e.g., Hering et al., 2015) rather than in batch mode, as was done here, may further enhance its performance and will be investigated in future work.
Data presented in this paper are available upon request. The KinSim mechanism used in this paper is included with the Supplement. The KinSim kinetic solver is freely available at https://gitlab.com/JimenezGroup/KinSim_Code (Peng and Jimenez, 2023).
The supplement related to this article is available online at: https://doi.org/10.5194/acp-23-13869-2023-supplement.
ATL, BB, and PL conceived and planned the experiments. ATL, BB, MWA, and PL carried out the experiments. ATL conceived, planned, and carried out the KinSim model simulations. NO and PMZ conceived, planned, and carried out the quantum chemical calculations. ATL, BB, MT, NO, PMZ, MSC, DRW, and PL contributed to the interpretation of the results. ATL took the lead in writing the paper. All authors provided feedback on the paper.
At least one of the (co-)authors is a member of the editorial board of Atmospheric Chemistry and Physics. The peer-review process was guided by an independent editor, and the authors also have no other competing interests to declare.
Publisher’s note: Copernicus Publications remains neutral with regard to jurisdictional claims made in the text, published maps, institutional affiliations, or any other geographical representation in this paper. While Copernicus Publications makes every effort to include appropriate place names, the final responsibility lies with the authors.
Andrew T. Lambe thanks Anita Avery, Jordan Krechmer, Timothy Onasch (Aerodyne), and Shreya Suri (Georgia Tech) for experimental assistance; Evgeni Glebov (Russian Academy of Sciences) for sharing published UV–Vis spectra of CAN CH3CN mixtures; and the following colleagues for helpful discussions: Harald Stark, Manjula Canagaratna (Aerodyne), Steve Brown (NOAA CSL), Hartmut Herrmann (TROPOS), William Brune (Pennsylvania State University), Tyson Berg (Colorado State University), Lasse Moormann (Max Planck Institute for Chemistry), Uta Wille (University of Melbourne), and Burkhard Koenig (University of Regensburg). The authors thank the anonymous referee and Sergey A. Nizkorodov for their constructive comments during the paper review process.
This work was supported by the Atmospheric Chemistry Program of the US National Science Foundation (grant nos. AGS-2131368, AGS2148439, AGS-2131458, AGS-2131084, and AGS-2147893).
This paper was edited by Sergey A. Nizkorodov and reviewed by Sergey A. Nizkorodov and one anonymous referee.
Alexander, A. J.: Reaction kinetics of nitrate radicals with terpenes in solution studied by cavity ring-down spectroscopy, Chem. Phys. Lett., 393, 138–142, https://doi.org/10.1016/j.cplett.2004.06.027, 2004. a, b
Atkinson, R.: Kinetics and Mechanisms of the Gas-Phase Reactions of the NO3 Radical with Organic Compounds, J. Phys. Chem. Ref. Data, 20, 459–507, https://doi.org/10.1063/1.555887, 1991. a
Atkinson, R., Arey, J., Zielinska, B., and Aschmann, S. M.: Kinetics and nitro-products of the gas-phase OH and NO3 radical-initiated reactions of naphthalene-d8, fluoranthene-d10, and pyrene, Int. J. Chem. Kinet., 22, 999–1014, https://doi.org/10.1002/kin.550220910, 1990. a
Baciocchi, E., Del Giacco, T., Murgia, S., and Sebastiani, G.: The photochemical reaction of cerium(IV) ammonium nitrate with alkenes. Rate and mechanism for the addition of the nitrate radical to alkenes, Tetrahedron, 44, 6651–6660, https://doi.org/10.1016/S0040-4020(01)90103-6, 1988. a
Bedjanian, Y.: Temperature-dependent rate constant for the reaction of F atoms with HNO3, Int. J. Chem. Kinet., 51, 753–759, https://doi.org/10.1002/kin.21306, 2019. a
Bertram, T. H., Kimmel, J. R., Crisp, T. A., Ryder, O. S., Yatavelli, R. L. N., Thornton, J. A., Cubison, M. J., Gonin, M., and Worsnop, D. R.: A field-deployable, chemical ionization time-of-flight mass spectrometer, Atmos. Meas. Tech., 4, 1471–1479, https://doi.org/10.5194/amt-4-1471-2011, 2011. a
Birks, J. W., Andersen, P. C., Williford, C. J., Turnipseed, A. A., Strunk, S. E., Ennis, C. A., and Mattson, E.: Folded tubular photometer for atmospheric measurements of NO2 and NO, Atmos. Meas. Tech., 11, 2821–2835, https://doi.org/10.5194/amt-11-2821-2018, 2018. a
Blaustein, B. D. and Gryder, J. W.: An Investigation of the Species Existing in Nitric Acid Solutions Containing Cerium(III) and Cerium(IV)1, J. Am. Chem. Soc., 79, 540–547, https://doi.org/10.1021/ja01560a012, 1957. a, b, c, d, e
Brown, S. S. and Stutz, J.: Nighttime radical observations and chemistry, Chem. Soc. Rev., 41, 6405–6447, https://doi.org/10.1039/C2CS35181A, 2012. a
Brown, S. S., Dibb, J. E., Stark, H., Aldener, M., Vozella, M., Whitlow, S., Williams, E. J., Lerner, B. M., Jakoubek, R., Middlebrook, A. M., DeGouw, J. A., Warneke, C., Goldan, P. D., Kuster, W. C., Angevine, W. M., Sueper, D. T., Quinn, P. K., Bates, T. S., Meagher, J. F., Fehsenfeld, F. C., and Ravishankara, A. R.: Nighttime removal of NOx in the summer marine boundary layer, Geophys. Res. Lett., 31, L07108, https://doi.org/10.1029/2004GL019412, 2004. a
Burrows, J. P., Tyndall, G. S., and Moortgat, G. K.: Absorption spectrum of NO3 and kinetics of the reactions of NO3 with NO2, Cl, and several stable atmospheric species at 298 K, J. Phys. Chem., 89, 4848–4856, https://doi.org/10.1021/j100268a038, 1985. a
Cabañas, B., Baeza, M. T., MartÍn, P., Salgado, S., Villanueva, F., Monedero, E., and Wirtz, K.: Products and Mechanism of the NO3 Reaction with Thiophene, J. Atmos. Chem., 51, 317–335, https://doi.org/10.1007/s10874-005-3580-5, 2005. a
Choidini, G., Rindone, B., Cariati, F., Polesello, S., Restelli, G., and Hjorth, J.: Comparison between the gas-phase and the solution reaction of the nitrate radical and methylarenes, Environ. Sci. Technol., 27, 1659–1664, https://doi.org/10.1021/es00045a024, 1993. a
Claflin, M. S.: Role of Multiphase Chemistry on the Formation of Aerosol from the Reactions of Monoterpenes with NO3 Radicals and O3, PhD thesis, University of Colorado, https://scholar.colorado.edu/concern/graduate_thesis_or_dissertations/b5644r712 (last access: 30 October 2023), 2018. a, b, c
Claflin, M. S. and Ziemann, P. J.: Identification and Quantitation of Aerosol Products of the Reaction of beta-Pinene with NO3 Radicals and Implications for Gas- and Particle-Phase Reaction Mechanisms, J. Phys. Chem. A, 122, 3640–3652, https://doi.org/10.1021/acs.jpca.8b00692, 2018. a, b, c
D'Anna, B., Andresen, Ø., Gefen, Z., and Nielsen, C. J.: Kinetic study of OH and NO3 radical reactions with 14 aliphatic aldehydes, Phys. Chem. Chem. Phys., 3, 3057–3063, https://doi.org/10.1039/B103623H, 2001. a
Demars, T. J., Bera, M. K., Seifert, S., Antonio, M. R., and Ellis, R. J.: Revisiting the Solution Structure of Ceric Ammonium Nitrate, Angew. Chem. Int. Edit., 54, 7534–7538, https://doi.org/10.1002/anie.201502336, 2015. a, b, c, d
DeVault, M. P., Ziola, A. C., and Ziemann, P. J.: Products and Mechanisms of Secondary Organic Aerosol Formation from the NO3 Radical-Initiated Oxidation of Cyclic and Acyclic Monoterpenes, ACS Earth Space Chem., 6, 2076–2092, https://doi.org/10.1021/acsearthspacechem.2c00130, 2022. a
Dörich, R., Eger, P., Lelieveld, J., and Crowley, J. N.: Iodide CIMS and 62: the detection of HNO3 as NO in the presence of PAN, peroxyacetic acid and ozone, Atmos. Meas. Tech., 14, 5319–5332, https://doi.org/10.5194/amt-14-5319-2021, 2021. a
Dubé, W. P., Brown, S. S., Osthoff, H. D., Nunley, M. R., Ciciora, S. J., Paris, M. W., McLaughlin, R. J., and Ravishankara, A. R.: Aircraft instrument for simultaneous, in situ measurement of NO3 and N2O5 via pulsed cavity ring-down spectroscopy, Rev. Sci. Instrum., 77, 34–101, https://doi.org/10.1063/1.2176058, 2006. a
Gaillard de Sémainville, P., Hoffmann, D., George, C., and Herrmann, H.: Study of nitrate radical (NO3) reactions with carbonyls and acids in aqueous solution as a function of temperature, Phys. Chem. Chem. Phys., 9, 958–968, https://doi.org/10.1039/B613956F, 2007. a
Ganske, J. A., Wingen, L. M., Perraud, V., and Finlayson-Pitts, B. J.: Role of Gas-Phase Halogen Bonding in Ambient Chemical Ionization Mass Spectrometry Utilizing Iodine, ACS Earth Space Chem., 3, 1315–1328, https://doi.org/10.1021/acsearthspacechem.9b00030, 2019. a
Glass, R. W. and Martin, T. W.: Flash generation and decay kinetics of the nitrate radical in aqueous nitric acid solutions, J. Am. Chem. Soc., 92, 5084–5093, https://doi.org/10.1021/ja00720a014, 1970. a, b, c, d
Glebov, E. M., Grivin, V. P., Plyusnin, V. F., Fedunov, R. G., Pozdnyakov, I. P., Yanshole, V. V., and Vasilchenko, D. B.: Photochemistry of cerium(IV) ammonium nitrate (CAN) in acetonitrile, J. Photoch. Photobio. A, 418, 113440, https://doi.org/10.1016/j.jphotochem.2021.113440, 2021. a, b
Henshall, A.: The Photoreduction of Ceric Ammonium Nitrate in Glacial Acetic Acid Solution, PhD thesis, Vanderbilt University, https://catalog.library.vanderbilt.edu/permalink/01VAN_INST/6ll2l/alma991025752059703276 (last access: 30 October 2023), 1963. a, b, c, d, e, f
Hering, T., Slanina, T., Hancock, A., Wille, U., and König, B.: Visible light photooxidation of nitrate: the dawn of a nocturnal radical, Chem. Commun., 51, 6568–6571, https://doi.org/10.1039/C5CC01580D, 2015. a
Hinsvark, O. N. and Stone, K. G.: Oxidation of Oxalic Acid in Glacial Acetic Acid with Cerium(IV), Anal. Chem., 28, 334–337, https://doi.org/10.1021/ac60111a014, 1956. a
Jenkin, M. E., Saunders, S. M., Wagner, V., and Pilling, M. J.: Protocol for the development of the Master Chemical Mechanism, MCM v3 (Part B): tropospheric degradation of aromatic volatile organic compounds, Atmos. Chem. Phys., 3, 181–193, https://doi.org/10.5194/acp-3-181-2003, 2003. a
Jiang, P. Y., Katsumura, Y., Ishigure, K., and Yoshida, Y.: Reduction potential of the nitrate radical in aqueous solution, Inorg. Chem., 31, 5135–5136, https://doi.org/10.1021/ic00050a038, 1992. a
Kebabian, P. L., Herndon, S. C., and Freedman, A.: Detection of Nitrogen Dioxide by Cavity Attenuated Phase Shift Spectroscopy, Anal. Chem., 77, 724–728, 2005. a
Krechmer, J., Lopez-Hilfiker, F., Koss, A., Hutterli, M., Stoermer, C., Deming, B., Kimmel, J., Warneke, C., Holzinger, R., Jayne, J., Worsnop, D., Fuhrer, K., Gonin, M., and de Gouw, J.: Evaluation of a New Reagent-Ion Source and Focusing Ion-Molecule Reactor for Use in Proton-Transfer-Reaction Mass Spectrometry, Anal. Chem., 90, 12011–12018, https://doi.org/10.1021/acs.analchem.8b02641, 2018. a
Lambe, A. T., Krechmer, J. E., Peng, Z., Casar, J. R., Carrasquillo, A. J., Raff, J. D., Jimenez, J. L., and Worsnop, D. R.: HOx and NOx production in oxidation flow reactors via photolysis of isopropyl nitrite, isopropyl nitrite-d7, and 1,3-propyl dinitrite at λ = 254, 350, and 369 nm, Atmos. Meas. Tech., 12, 299–311, https://doi.org/10.5194/amt-12-299-2019, 2019. a
Lambe, A. T., Wood, E. C., Krechmer, J. E., Majluf, F., Williams, L. R., Croteau, P. L., Cirtog, M., Féron, A., Petit, J.-E., Albinet, A., Jimenez, J. L., and Peng, Z.: Nitrate radical generation via continuous generation of dinitrogen pentoxide in a laminar flow reactor coupled to an oxidation flow reactor, Atmos. Meas. Tech., 13, 2397–2411, https://doi.org/10.5194/amt-13-2397-2020, 2020. a
Lee, B. H., Lopez-Hilfiker, F. D., Mohr, C., Kurten, T., Worsnop, D. R., and Thornton, J. A.: An Iodide-Adduct High-Resolution Time-of-Flight Chemical-Ionization Mass Spectrometer: Application to Atmospheric Inorganic and Organic Compounds, Environ. Sci. Technol., 48, 6309–6317, 2014. a, b
Lopez-Hilfiker, F. D., Mohr, C., Ehn, M., Rubach, F., Kleist, E., Wildt, J., Mentel, Th. F., Lutz, A., Hallquist, M., Worsnop, D., and Thornton, J. A.: A novel method for online analysis of gas and particle composition: description and evaluation of a Filter Inlet for Gases and AEROsols (FIGAERO), Atmos. Meas. Tech., 7, 983–1001, https://doi.org/10.5194/amt-7-983-2014, 2014. a
Martin, T. W. and Glass, R. W.: Competitive electron transfer. Activity-defined formation constants of cerium(III) nitrate complexes based on reaction with the nitrate free radical, J. Am. Chem. Soc., 92, 5075–5083, https://doi.org/10.1021/ja00720a013, 1970. a, b, c
Martin, T. W. and Stevens, M. V.: Studies Using a Combination of Flash Photolysis and Pulsed Magnetic Induction: Application to the NO3 Radical in Aqueous Acid Solution at 25 ∘C, in: 12th Informal Conference on Photochemistry, Gaithersburg, Maryland, United States of America, 28 June–1 July 1976, National Bureau of Standards Special Publication 526, https://doi.org/10.6028/NBS.SP.526, 1978. a, b, c, d
Martin, T. W., Henshall, A., and Gross, R. C.: Spectroscopic and Chemical Evidence for the NO3 Free Radical in Solution at Room Temperature, J. Am. Chem. Soc., 85, 113–114, https://doi.org/10.1021/ja00884a027, 1963. a
Martin, T. W., Rummel, R. E., and Gross, R. C.: Electron Exchange Kinetics of the NO3 Free Radical in Solution, J. Am. Chem. Soc., 86, 2595–2600, https://doi.org/10.1021/ja01067a016, 1964. a
Meyer, R. J. and Jacoby, R.: Die Doppelnitrate des vierwertigen Ceriums und des Thoriums, Z. Anorg. Chem., 27, 359–389, https://doi.org/10.1002/zaac.19010270131, 1901. a
Nah, T., Sanchez, J., Boyd, C. M., and Ng, N. L.: Photochemical Aging of α-pinene and β-pinene Secondary Organic Aerosol formed from Nitrate Radical Oxidation, Environ. Sci. Technol., 50, 222–231, https://doi.org/10.1021/acs.est.5b04594, 2016. a, b
Nair, V. and Deepthi, A.: Cerium(IV) Ammonium NitrateA Versatile Single-Electron Oxidant, Chem. Rev., 107, 1862–1891, https://doi.org/10.1021/cr068408n, 2007. a
Ng, N. L., Brown, S. S., Archibald, A. T., Atlas, E., Cohen, R. C., Crowley, J. N., Day, D. A., Donahue, N. M., Fry, J. L., Fuchs, H., Griffin, R. J., Guzman, M. I., Herrmann, H., Hodzic, A., Iinuma, Y., Jimenez, J. L., Kiendler-Scharr, A., Lee, B. H., Luecken, D. J., Mao, J., McLaren, R., Mutzel, A., Osthoff, H. D., Ouyang, B., Picquet-Varrault, B., Platt, U., Pye, H. O. T., Rudich, Y., Schwantes, R. H., Shiraiwa, M., Stutz, J., Thornton, J. A., Tilgner, A., Williams, B. J., and Zaveri, R. A.: Nitrate radicals and biogenic volatile organic compounds: oxidation, mechanisms, and organic aerosol, Atmos. Chem. Phys., 17, 2103–2162, https://doi.org/10.5194/acp-17-2103-2017, 2017. a, b
Orlando, J. J. and Tyndall, G. S.: Laboratory studies of organic peroxy radical chemistry: an overview with emphasis on recent issues of atmospheric significance, Chem. Soc. Rev., 41, 6294–6317, https://doi.org/10.1039/C2CS35166H, 2012. a
Palm, B. B., Campuzano-Jost, P., Ortega, A. M., Day, D. A., Kaser, L., Jud, W., Karl, T., Hansel, A., Hunter, J. F., Cross, E. S., Kroll, J. H., Peng, Z., Brune, W. H., and Jimenez, J. L.: In situ secondary organic aerosol formation from ambient pine forest air using an oxidation flow reactor, Atmos. Chem. Phys., 16, 2943–2970, https://doi.org/10.5194/acp-16-2943-2016, 2016. a
Peng, Z. and Jimenez, J. L.: KinSim: A Research-Grade, User-Friendly, Visual Kinetics Simulator for Chemical-Kinetics and Environmental-Chemistry Teaching, J. Chem. Educ., 96, 806–811, https://doi.org/10.1021/acs.jchemed.9b00033, 2019. a
Peng, Z. and Jimenez, J. L.: KinSim_Code, GitLab [code], https://gitlab.com/JimenezGroup/KinSim_Code, last access: 8 February 2023. a
Sander, S., Abbatt, J. P. D., Barker, J. R., Burkholder, J. B., Friedl, R. R., Golden, D. M., Huie, R. E., Kolb, C. E., Kurylo, M. J., Moortgat, G. K., Orkin, V. L., and Wine, P. H.: Chemical Kinetics and Photochemical Data for Use in Atmospheric Studies, Evaluation Number 17, JPL Publication 10-6, https://jpldataeval.jpl.nasa.gov/pdf/JPL%2010-6%20Final%2015June2011.pdf (last access: 30 October 2023), 2011. a
Saunders, S. M., Jenkin, M. E., Derwent, R. G., and Pilling, M. J.: Protocol for the development of the Master Chemical Mechanism, MCM v3 (Part A): tropospheric degradation of non-aromatic volatile organic compounds, Atmos. Chem. Phys., 3, 161–180, https://doi.org/10.5194/acp-3-161-2003, 2003. a
Schwab, J. J., Brune, W. H., and Anderson, J. G.: Kinetics and mechanism of the hydroxyl + hydroperoxyl reaction, J. Phys. Chem., 93, 1030–1035, https://doi.org/10.1021/j100340a005, 1989. a
Shen, H., Zhao, D., Pullinen, I., Kang, S., Vereecken, L., Fuchs, H., Acir, I.-H., Tillmann, R., Rohrer, F., Wildt, J., Kiendler-Scharr, A., Wahner, A., and Mentel, T. F.: Highly Oxygenated Organic Nitrates Formed from NO3 Radical-Initiated Oxidation of β-Pinene, Environ. Sci. Technol., 55, 15658–15671, https://doi.org/10.1021/acs.est.1c03978, 2021. a
Takeuchi, M. and Ng, N. L.: Chemical composition and hydrolysis of organic nitrate aerosol formed from hydroxyl and nitrate radical oxidation of α-pinene and β-pinene, Atmos. Chem. Phys., 19, 12749–12766, https://doi.org/10.5194/acp-19-12749-2019, 2019. a, b, c, d
Veres, P. R., Roberts, J. M., Wild, R. J., Edwards, P. M., Brown, S. S., Bates, T. S., Quinn, P. K., Johnson, J. E., Zamora, R. J., and de Gouw, J.: Peroxynitric acid (HO2NO2) measurements during the UBWOS 2013 and 2014 studies using iodide ion chemical ionization mass spectrometry, Atmos. Chem. Phys., 15, 8101–8114, https://doi.org/10.5194/acp-15-8101-2015, 2015. a
Wagner, N. L., Dubé, W. P., Washenfelder, R. A., Young, C. J., Pollack, I. B., Ryerson, T. B., and Brown, S. S.: Diode laser-based cavity ring-down instrument for NO3, N2O5, NO, NO2 and O3 from aircraft, Atmos. Meas. Tech., 4, 1227–1240, https://doi.org/10.5194/amt-4-1227-2011, 2011. a
Wang, H., Wang, H., Lu, X., Lu, K., Zhang, L., Tham, Y. J., Shi, Z., Aikin, K., Fan, S., Brown, S. S., and Zhang, Y.: Increased night-time oxidation over China despite widespread decrease across the globe, Nat. Geoscience, 16, 217–223, https://doi.org/10.1038/s41561-022-01122-x, 2023. a
Wayne, R., Barnes, I., Biggs, P., Burrows, J., Canosa-Mas, C., Hjorth, J., Le Bras, G., Moortgat, G., Perner, D., Poulet, G., Restelli, G., and Sidebottom, H.: The nitrate radical: Physics, chemistry, and the atmosphere, Atmos. Environ. A-Gen., 25, 1–203, https://doi.org/10.1016/0960-1686(91)90192-A, 1991. a
Wine, P. H., Mauldin, R. L., and Thorn, R. P.: Kinetics and spectroscopy of the nitrogen oxide radical (NO3) in aqueous ceric nitrate-nitric acid solutions, J. Phys. Chem., 92, 1156–1162, https://doi.org/10.1021/j100316a031, 1988. a, b
Wylie, A. W.: Extraction of ceric nitrate by solvents, J. Chem. Soc., 1474–1480, https://doi.org/10.1039/JR9510001474, 1951. a, b