the Creative Commons Attribution 4.0 License.
the Creative Commons Attribution 4.0 License.
 | 06 Nov 2023
Benefits of net-zero policies for future ozone pollution in China
Oliver Wild
Ruth M. Doherty
Fiona M. O'Connor
Steven T. Turnock
Net-zero emission policies principally target climate change but may have a profound influence on surface ozone pollution. To investigate this, we use a chemistry–climate model to simulate surface ozone changes in China under a net-zero pathway and examine the different drivers that govern these changes. We find large monthly mean surface ozone decreases of up to 16 ppb in summer and small ozone decreases of 1 ppb in winter. Local emissions are shown to have the largest influence on future ozone changes, outweighing the effects of changes in emissions outside China, changes in global methane concentrations, and a warmer climate. Impacts of local and external emissions show strong seasonality, with the largest contributions to surface ozone in summer, while changes in global methane concentrations have a more uniform effect throughout the year. We find that while a warmer climate has a minor impact on ozone change compared to the net-zero scenario, it will alter the spatial patterns of ozone in China, leading to ozone increases in the south and ozone decreases in the north. We also apply a deep learning model to correct biases in our ozone simulations and to provide a more robust assessment of ozone changes. We find that emission controls may lead to a surface ozone decrease of 5 ppb in summer. The number of days with high-ozone episodes with daily mean ozone greater than 50 ppb will be reduced by 65 % on average. This is smaller than that simulated with the chemistry–climate model, reflecting overestimated ozone formation under present-day conditions. Nevertheless, this assessment clearly shows that the strict emission policies needed to reach net zero will have a major benefit in reducing surface ozone pollution and the occurrence of high-ozone episodes, particularly in high-emission regions in China.
- Article
(6439 KB) - Full-text XML
-
Supplement
(8658 KB) - BibTeX
- EndNote


Rapid changes in air pollution have occurred in China over the last few decades because of dramatic transformations in economic development and air pollutant emissions. Following substantial increases in emissions in the 1990s and 2000s, nationwide pollutant emission controls since 2013 have led to remarkable reductions in fine particulate matter (PM2.5), with national-population-weighted annual mean concentrations decreasing from 62 to 42 µg m−3 during 2013–2017 (Zhang et al., 2019). However, surface ozone (O3) pollution is becoming increasingly prevalent in China despite these emission controls, as recent emission policies have primarily targeted fine particles (T. Wang et al., 2022). Reductions in the emissions of nitrogen oxides (NOx), a precursor of both O3 and fine particles, may lead to increased O3 concentrations due to non-linear O3 chemistry (Liu et al., 2021) and to strengthened incoming solar radiation (Hollaway et al., 2019). In addition, anthropogenic emissions of other O3 precursors that contribute to O3 formation, e.g. volatile organic compounds (VOCs) and methane (CH4), are less well regulated (Li et al., 2019). Observed summertime surface maximum 8 h average (MDA8) O3 concentrations in China showed a consistent annual increase of 1.9 ppb between 2013 and 2019 (Li et al., 2020), and this increase is greater in high-emission regions, reaching 3.3 ppb yr−1 on the North China Plain. Given that O3 production in these regions tends to be VOC-limited (W. Wang et al., 2022), reducing emissions of NOx and VOCs simultaneously has become crucial. There are also significant natural sources of O3 precursors from vegetation and soils that may increase due to a warmer climate (Doherty et al., 2013; Fiore et al., 2015). Since surface O3 is detrimental for human health, plant growth, and crop yields (WHO, 2021), robust and effective emission controls on O3 precursors are needed.
The Intergovernmental Panel on Climate Change (IPCC) calls for cutting global greenhouse emissions to close to zero to reduce the risks of climate change (IPCC, 2022). Many countries have recently adopted such net-zero policies to reduce net greenhouse gas emissions to zero by 2050, and China has also implemented emission policies that aim to achieve a carbon peak before 2030 and carbon neutrality by 2060 (Tay, 2022). These low-carbon policies alongside reductions in anthropogenic air pollutant emissions will have co-benefits for both global climate and air quality (UNEP, 2022). However, since surface O3 changes are not directly proportional to emission changes, it is challenging to quantify the benefits for O3 accurately. Future O3 is also influenced by climate change through changes in atmospheric stagnation, natural emission sources, chemical reaction rates, and deposition rates (Hong et al., 2019; Zanis et al., 2022; Brown et al., 2022). Regional surface O3 changes also depend on emission pathways in other parts of the world, which influence the long-range transport of O3 and its precursors across continents (Wild et al., 2012; Doherty, 2015). The combination of these factors shapes the changes in the future O3 but imposes large uncertainties in O3 projections (Turnock et al., 2020), which poses a challenge to assess the underlying impacts of net-zero policies on future air quality.
While the general relationships between O3, its precursor emissions, and climate change are known well (Zeng et al., 2008; Hedegaard et al., 2013; Doherty et al., 2013; Griffiths et al., 2021), the relative importance of these drivers remains very uncertain. Challenges remain in the capability of chemistry–climate models to simulate O3 changes accurately because processes occurring at small scales cannot be resolved adequately. Young et al. (2018) show that there are systematic biases in the simulation of present-day O3 concentrations in current chemistry–climate models, and this raises questions regarding their skill in representing long-term O3 changes (Parrish et al., 2021). Averaging output from a number of different models is a common way to obtain more robust results but does not eliminate the O3 biases that are shown to be systematic (Revell et al., 2018). In addition, the models tend to use different parameterisations to represent different processes (Wild et al., 2020) and may misrepresent the importance of local emission controls or the risks caused by climate change. It is hence valuable to correct model simulations to produce more robust O3 projections.
A practical way to address this is to apply deep learning models. Deep learning approaches have developed quickly in the last decade due to advances in computational speed that allow intensive training, and they have been applied widely in scientific fields (LeCun et al., 2015). Deep learning models have been shown to be a universal approximator (Hornik et al., 1989) and can thus be applied to compensate for discrepancies between physical model simulations and observations. We have demonstrated a successful application of deep learning to correct the biases in surface O3 simulations from a global chemistry–climate model (Z. Liu et al., 2022a) and found that changes in surface O3 in high-emission regions across the world may be overestimated with the process-based model. This bias correction approach allows us to provide a more robust and reliable assessment of future surface O3 projections under the effect of different emission policies and facilitates an examination of their effectiveness.
The aim of this study is to produce reliable estimates of future O3 changes associated with changing emissions and climate under a net-zero pathway in China and to determine how well strict emission controls can tackle the increasing frequency of high-O3 episodes. We introduce the chemistry–climate model used in Sect. 2 along with different emission and climate scenarios, and we describe the deep learning model that we have implemented to correct surface O3 biases. In order to highlight the value of bias correction, we show the results of version 1 of the United Kingdom Earth System Model (UKESM1) before showing the corrected results. We first investigate surface O3 changes in China from the present day to the future under a net-zero emission pathway simulated with UKESM1 in Sect. 3. The influences of emission changes outside China, changes in global CH4 concentrations, and climate change are examined in Sect. 4. We demonstrate the capability of the deep learning model in simulating the biases in surface O3 and apply this bias correction technique to estimate future O3 changes and high-O3 episodes in Sect. 5. Conclusions are presented in Sect. 6.
2.1 Description and application of the chemistry–climate model
We use version 1 of the United Kingdom Earth System Model, UKESM1 (Sellar et al., 2019), to simulate surface O3 mixing ratios in the present day (2013–2017) and the future (2060–2070) under different scenarios. UKESM1 consists of a physical climate model, the Hadley Centre Global Environment Model version 3 (HadGEM-GC3.1), configured with the Global Atmosphere 7.1 (GA7.1) and Global Land 7.0 (GL7.0) components (Walters et al., 2019), to which other Earth system processes are coupled (Sellar et al., 2019). A state-of-the-art module for modelling atmospheric composition in the troposphere and the stratosphere and the United Kingdom Chemistry and Aerosol model (UKCA; Morgenstern et al., 2009; O'Connor et al., 2014) are included. A gas-phase chemistry scheme, StratTrop (Archibald et al., 2020b), and an aerosol scheme, GLOMAP-mode (Mulcahy et al., 2020), are used in UKCA. An extended chemistry scheme based on StratTrop that incorporates more reactive VOC species including alkenes, alkanes, and aromatics is used in this study to permit a more realistic representation of the chemical environment in China (Liu et al., 2021). The model resolution is N96L85 in the atmosphere, with 1.875∘ in longitude by 1.25∘ in latitude, 85 terrain-following hybrid height layers, and a model top at 85 km.
We use the atmosphere-only configuration of UKESM1 with prescribed present-day and future sea surface temperatures (SST) and sea ice (SICE) in the form of monthly mean time-evolving fields to investigate the transient impacts of changing emissions under different climates. These fields alongside global values for greenhouse gas and methane concentrations are generated from fully coupled UKESM1 runs for historical and future simulations conducted as part of the Coupled Model Intercomparison Project Phase 6 (Eyring et al., 2016). We nudge the model with ERA-Interim meteorological reanalysis data for the present-day simulations and allow the model to run freely in the simulations of future scenarios.
2.2 Emissions and experiments
We use Coupled Model Intercomparison Project Phase 6 (CMIP6) year-2014 emissions, the latest year available, to represent present-day anthropogenic (Hoesly et al., 2018) and biomass burning emissions (Van Marle et al., 2017) for the globe but replace anthropogenic emissions in China with an up-to-date regional emission inventory over 2013–2017, the Multi-resolution Emission Inventory for China (MEIC; Li et al., 2017). Biogenic VOC emissions are calculated interactively with the iBVOC emissions scheme in the Joint UK Land Environmental Simulator (JULES) land surface scheme (Pacifico et al., 2011), which is coupled to UKCA. Other online natural emissions such as sea salt, dust, and lightning NOx are the same as in UKESM1 simulations for CMIP6 (Turnock et al., 2020). Anthropogenic emissions for five sectors (industry, power plants, transport, residences, and agriculture) are provided for the model, and independent diurnal and vertical emission profiles are applied for each sector (Bieser et al., 2011; Mailler et al., 2013).
For the future, emissions under the Shared Socioeconomic Pathways (SSPs) of CMIP6 are used to account for future social, economic, and environmental developments (O'Neill et al., 2014; Van Vuuren et al., 2014). We use the SSP1-1.9 pathway to represent the net-zero emission as net emissions of greenhouse gases drop down to zero at about 2060 in this scenario. We note that this scenario has the potential to limit global warming to 1.5 ∘C by the end of this century. Future scenarios for China are taken from the Dynamic Projection model for Emissions in China (DPEC; Tong et al., 2020), and we use the “ambitious pollution neutral goal” scenario to represent a net-zero pathway in China. For comparison, we use the SSP3-7.0 pathway from CMIP6, along with the corresponding “baseline” scenario from DPEC, to represent a low-mitigation scenario and to evaluate future O3 pollution with high emissions. In addition, to assess the impacts of CH4 on surface O3, CH4 concentrations from SSP1-1.9 and SSP3-7.0 are used to represent low and high CH4, respectively.
We perform several model experiments to investigate surface O3 changes and to quantify the contribution of emission changes inside and outside China, global CH4 concentrations, and changes in climate; see Table 1. For each of the future scenarios the model is spun up for 6 years and then run for 5 years for data analysis. Table 2 summarises the global mean total surface emissions calculated from CMIP6, MEIC, and DPEC and the global CH4 abundance.
Table 1Model configurations used for the present day (2013–2017) and six future (2060–2070) simulations. “Hist.” means that the emissions (emis.), CH4 concentrations, or SST and SICE evolve as for the historical simulations. “NZ” means that they evolve under a net-zero pathway. “High” means that they evolve under a high-emission scenario, SSP3-7.0.
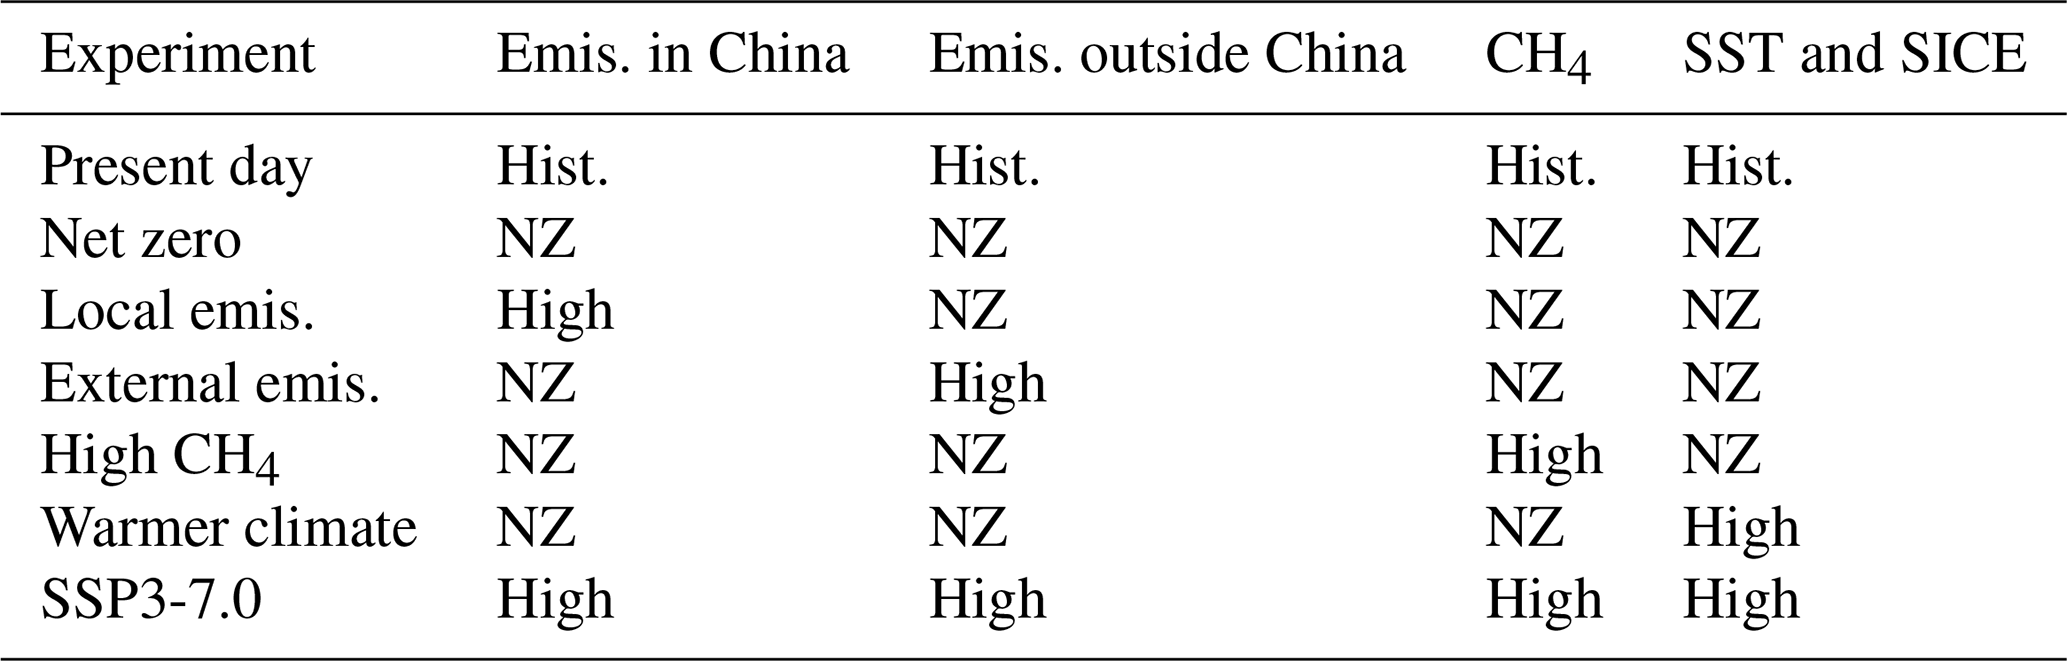
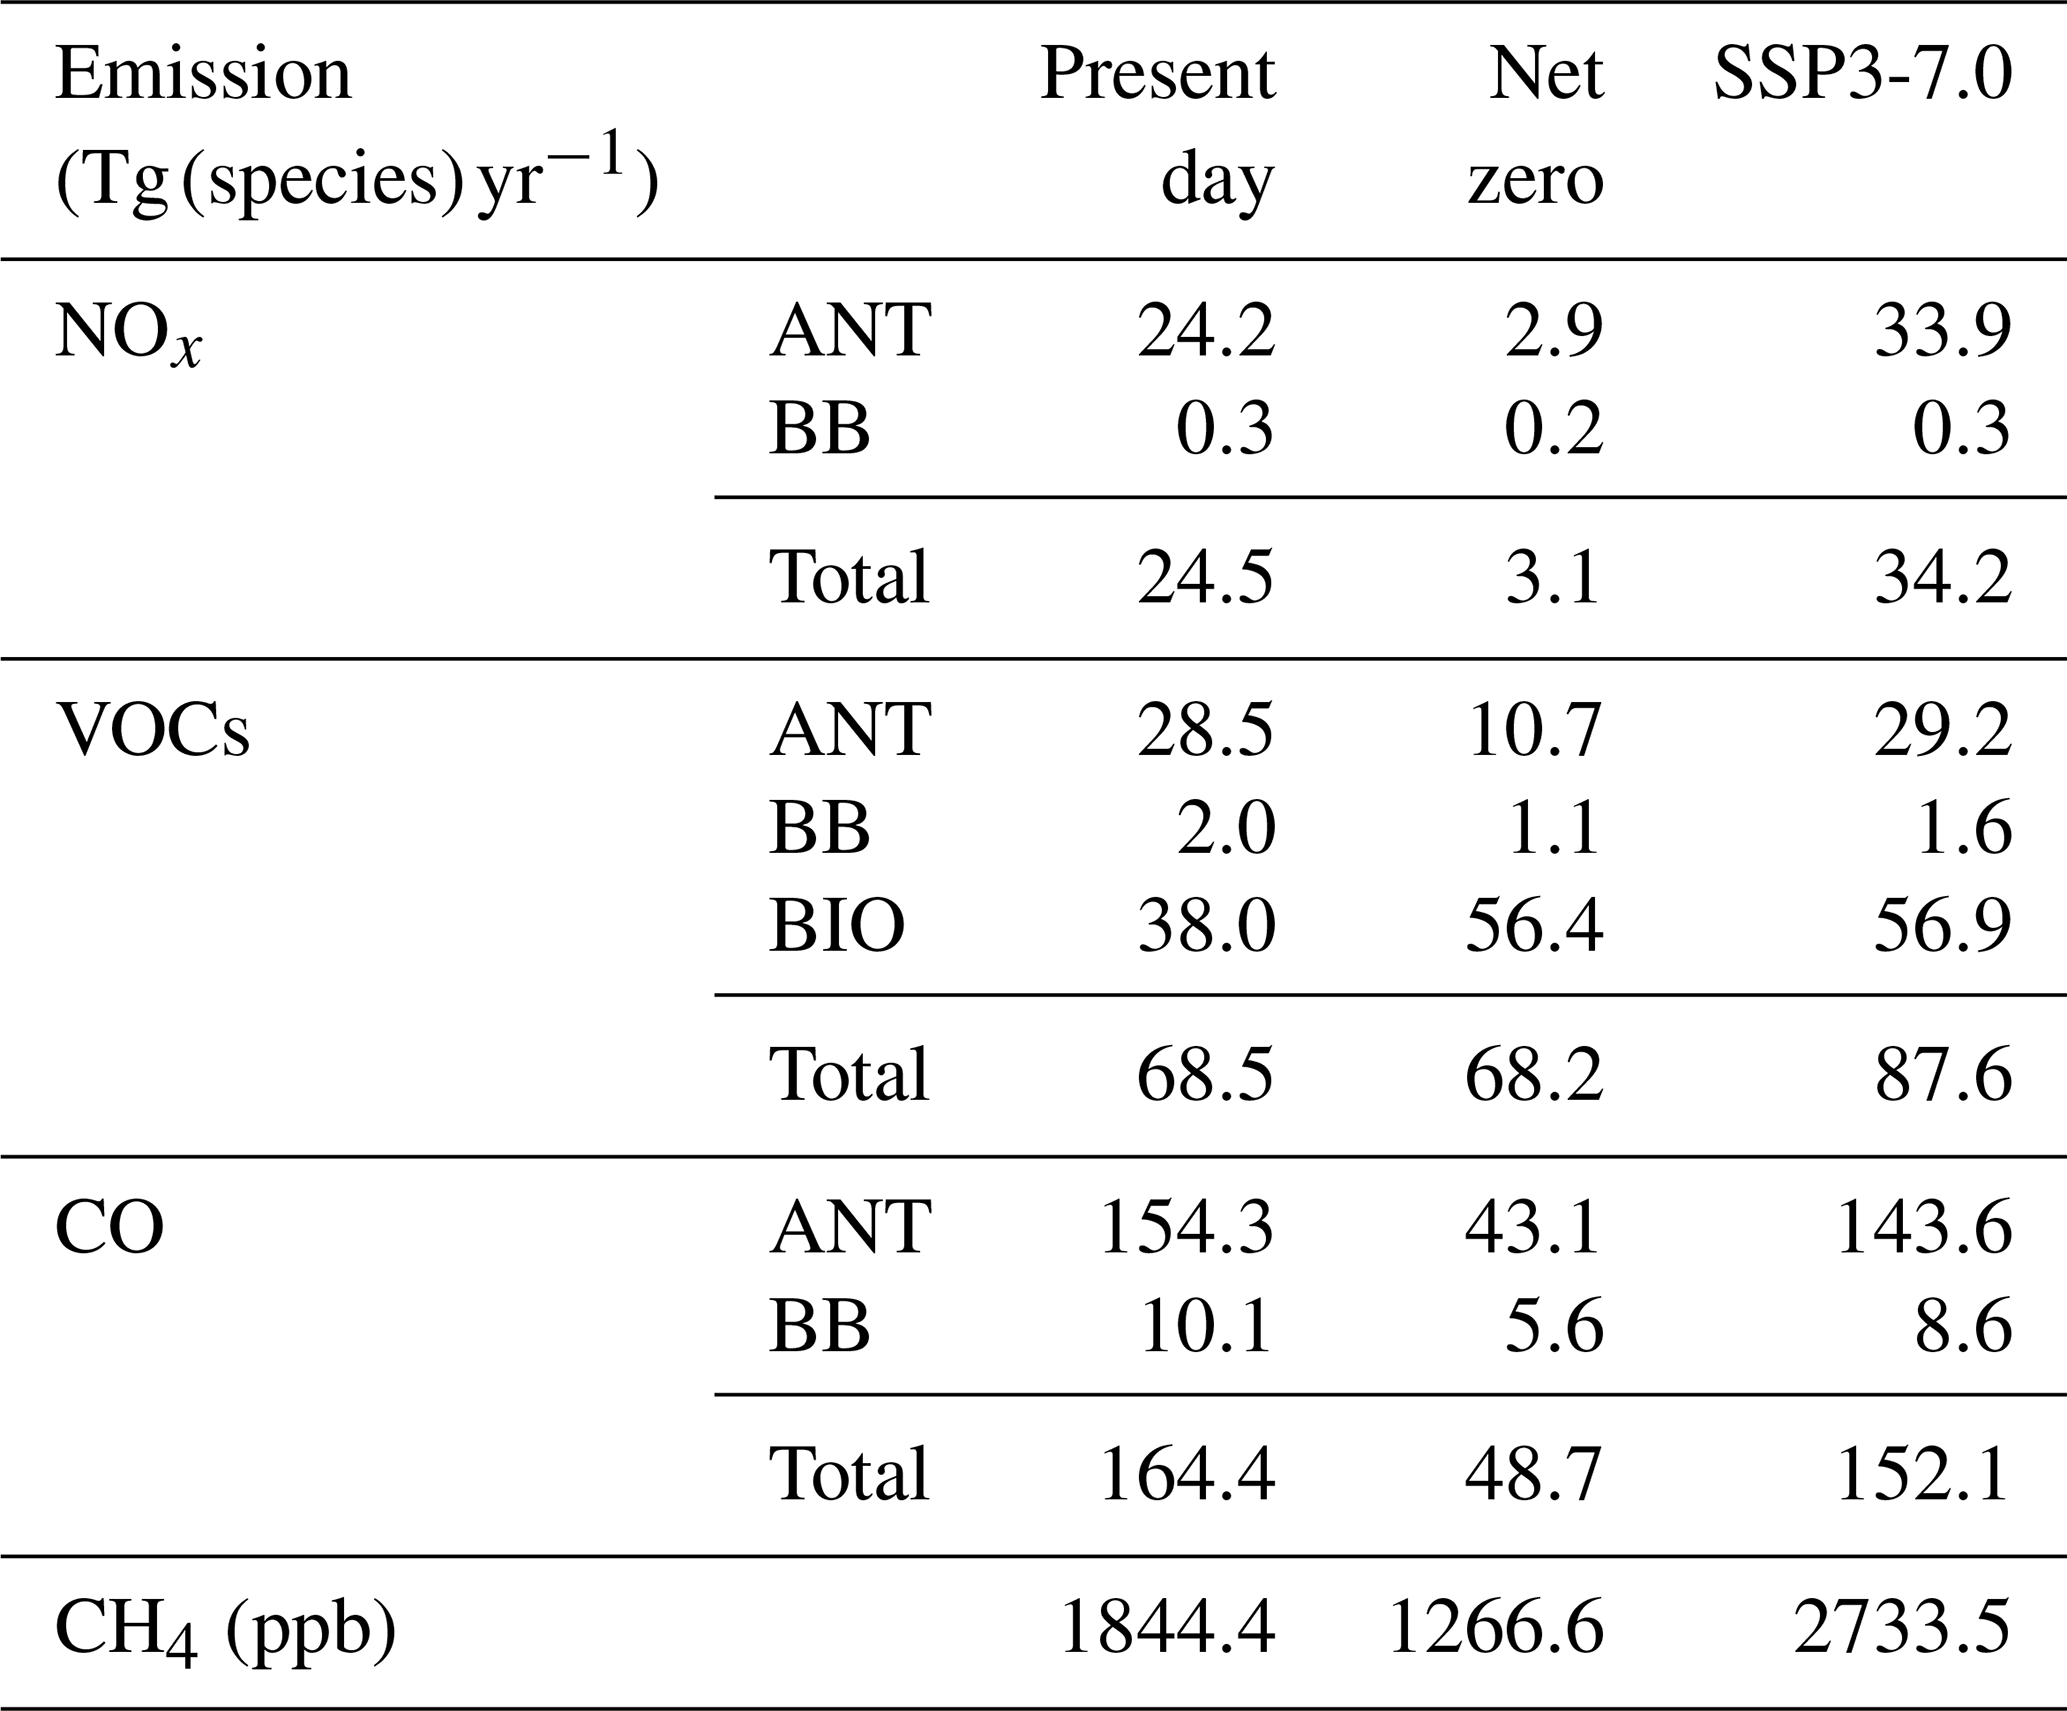
Table 2Overview of annual mean time-varying surface emissions of NOx, VOCs, and CO from anthropogenic (ANT), biomass burning (BB), and biogenic (BIO) sources for the present day (2013–2017) and the future (2060–2070) net-zero and SSP3-7.0 pathways in China. Annual mean surface CH4 mixing ratios (ppb) are also shown.
2.3 Development of the deep learning model
A deep learning model is developed here to correct the biases in surface O3 simulated with UKESM1. Like many other chemistry–climate models, UKESM1 exhibits systematic biases in surface O3 (Turnock et al., 2020; Z. Liu et al., 2022b; Archibald et al., 2020a), but it is hard to determine the origin of these biases. While some of these biases may be attributed to simplified chemistry, improvement in the chemical scheme in UKESM1 has been shown to increase biases in some locations (Archer-Nicholls et al., 2021). However, this problem can be addressed through deep learning to simulate the differences between the chemistry–climate model simulations and real-world observations. The model is trained on present-day conditions to establish a relationship between O3 biases and key outputs of the chemistry–climate model, referred to as features. Future O3 biases can then be predicted using features that are generated from simulations of the future with the chemistry–climate model. We adopt the approach applied by Z. Liu et al. (2022a) to use 20 physical, meteorological, and chemical variables as features, and these include variables associated with location, season, temperature, humidity, wind speed, photolysis and deposition rates, and concentrations of key precursors; see Z. Liu et al. (2022a). We do not use O3 concentration as a variable, as this is highly correlated with O3 biases and thus masks the contribution of other factors. This approach has shown good performance in reproducing monthly mean surface O3 biases over the globe, with a mean bias error of 0.1 ppb. In this study, we further develop and extend this deep learning model to predict the biases in daily mean O3, which enables the examination of the occurrence of high-O3 episodes. We note that the CH4 concentration is not included as an input feature because its variation under present-day conditions is much smaller than the changes expected in the future. We therefore adopt the non-linear parameterisation developed by Wild et al. (2012) to quantify the response of surface O3 to changing CH4 concentrations in the future and consider this feature independently of the others.
The Chinese air quality reanalysis dataset (CAQRA; Kong et al., 2021) assimilates hourly mean surface O3 observations during 2013–2017 from the China National Environmental Monitoring Centre (CNEMC), and we use this as a reference to derive surface O3 biases in UKESM1 simulations. The surface O3 reanalyses are shown to match observations well, with small mean errors of −2.3 µg m−3 (Kong et al., 2021). We account for these errors and uncertainties and represent them as noise which we add to the original dataset in model training. We assume that this noise follows a normal distribution with a mean of 2.3 µg m−3 and 1 standard deviation of 2.3 µg m−3 and generates three datasets with random noise to reduce overfitting in training. The CAQRA data at 15 km × 15 km resolution are regridded to the coarser resolution of UKESM1. A key advantage of the CAQRA data is that they provide complete spatial and temporal coverage for comparison with UKESM1, thus avoiding issues with the poor coverage of observations in some areas. However, we only examine data in areas below 2000 m altitude that have relatively high populations and where there are more measurement sites. For training, we pre-process the data to distribute them randomly across time and location and then split them into a training set (80 %), a validation set (10 %), and a testing set (10 %). The validation data are used to evaluate the model performance at each iteration of the training process, and the test data provide an independent evaluation when the model training is completed.
Seasonal mean surface O3 mixing ratios in China simulated with UKESM1 are shown in Fig. 1 for the present day and the net-zero pathway, without bias correction. There is a clear seasonal variation in surface O3, with high summertime O3 and low wintertime O3 (Fig. 1a and d). However, this variation is reduced under net zero (Fig. 1b and e) due to O3 decreases in summer (Fig. 1c) and O3 increases in parts of eastern China in winter (Fig. 1f) in the future. Surface O3 mixing ratios decrease by about 16 ppb in summer, demonstrating the great benefits of emission controls in mitigating summertime O3 pollution. Other studies show similar results, with 18 ppb decreases in MDA8 O3 mixing ratios achieved from net-zero policies (Shi et al., 2021; Xu et al., 2022). However, smaller changes are seen in the most polluted industrial areas of China, namely the North China Plain, the Yangtze River Delta, and the Pearl River Delta, even though reductions in anthropogenic emissions in these areas are substantially larger than other regions (Fig. S1a and b in the Supplement). This is principally due to VOC-limited O3 formation regimes in which decreased NOx emissions increase O3 mixing ratios (Liu et al., 2021). Much greater reductions in NOx emissions or further reductions in VOC emissions are needed to reduce surface O3 mixing ratios in these high-emission regions. In contrast, higher emissions following SSP3-7.0 will greatly increase summertime O3 (Fig. S2a–c), and the transport sector is shown to have the largest impact with 10 ppb O3 increases.
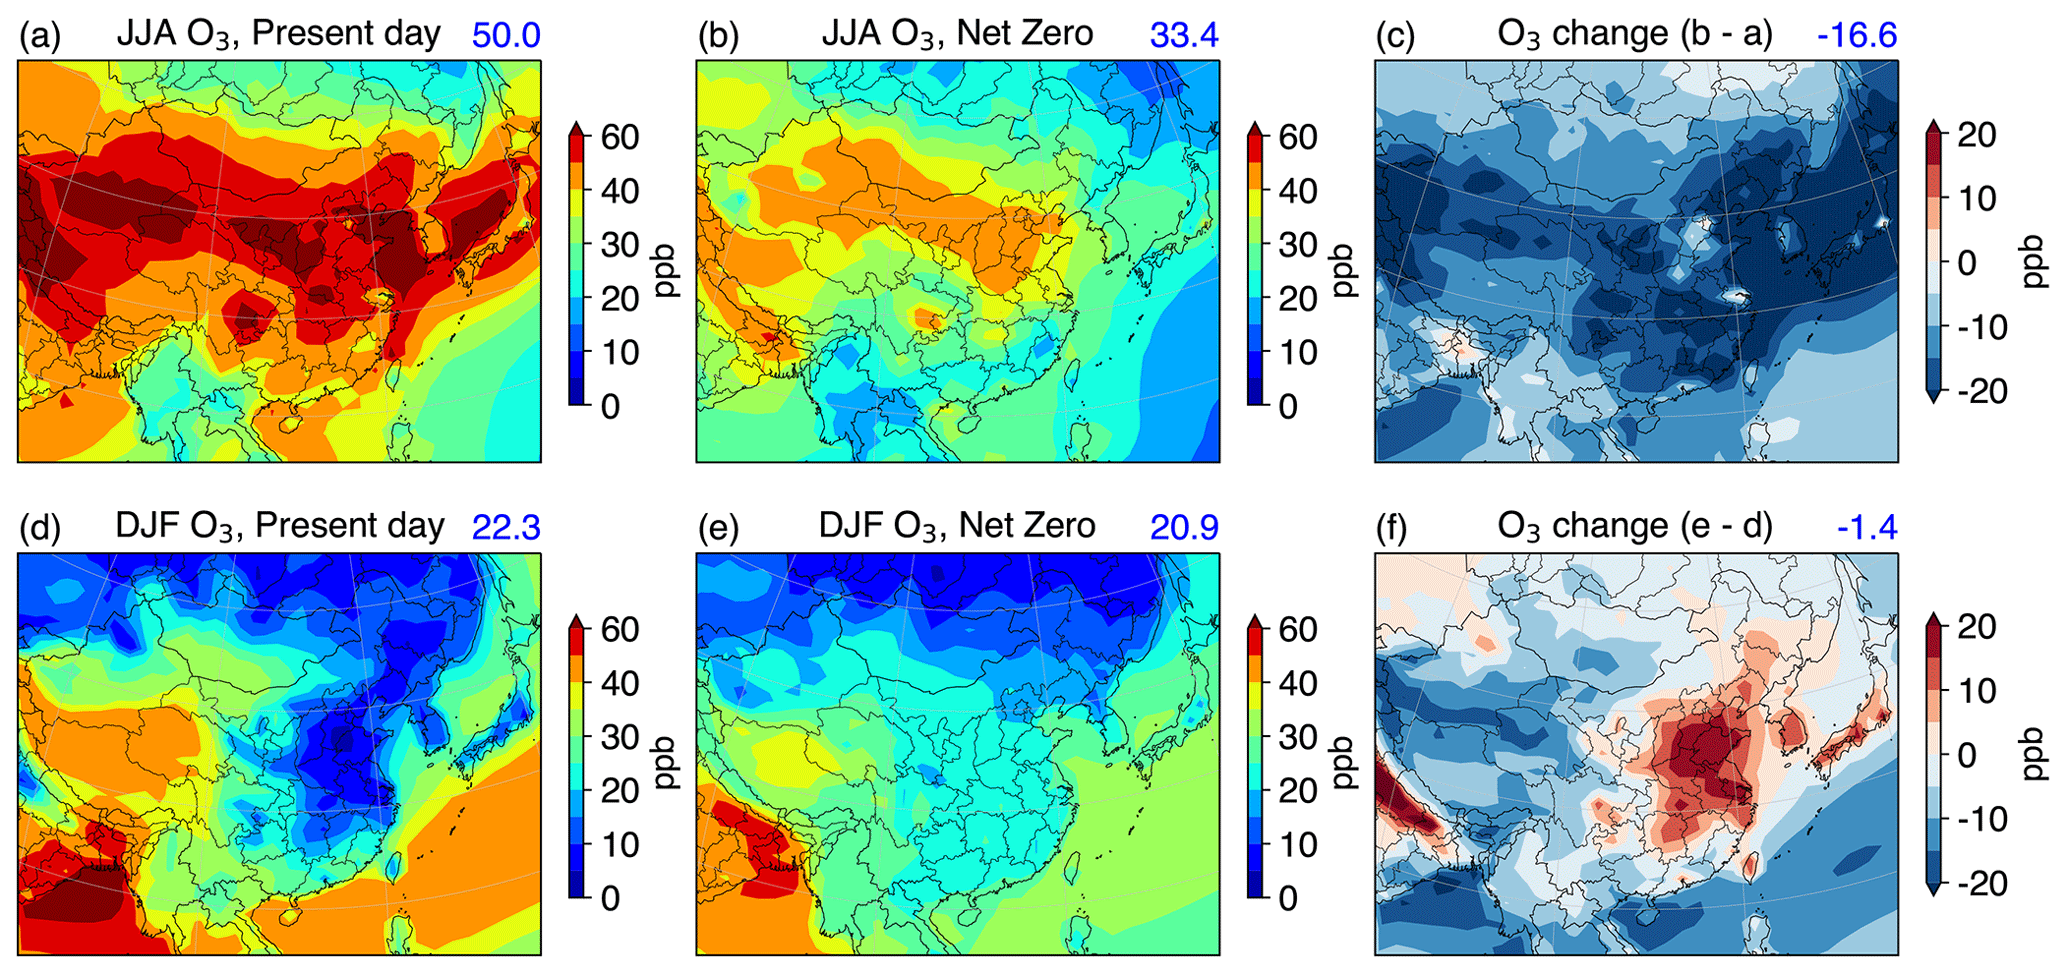
Figure 1Seasonal surface O3 mixing ratios in East Asia simulated with UKESM1 from present day to the future following a net-zero pathway. Mean O3 mixing ratios are shown for (a, b) June–July–August (JJA) and (d, e) December–January–February (DJF), along with (c, f) the corresponding seasonal changes, with values of O3 changes in mainland China shown in parts per billion in the top right corner.
In wintertime, surface O3 mixing ratios generally decrease by 1 ppb in mainland China but increase in eastern China by up to 20 ppb in heavily populated industrial regions. This results in a reduced latitudinal gradient of O3 mixing ratios in China in wintertime under the net-zero scenario. These contrasting responses further demonstrate regional differences in the chemical environment for O3 production. Polluted urban environments are dominated by VOC-limited O3 formation, particularly in winter when weak boundary layer mixing permits greater NOx accumulation at the surface and rapid local O3 destruction. Therefore, increased NOx emissions from the main emission sectors such as power plants, industry, and transport under SSP3-7.0 cause notable decreases in O3 mixing ratios of up to 3 ppb in winter (Fig. S2e–g), although the effect of the residential sector is relatively small (Fig. S2h) as small changes in NOx emissions are accompanied by substantial changes in VOC emissions (Cheng et al., 2021).
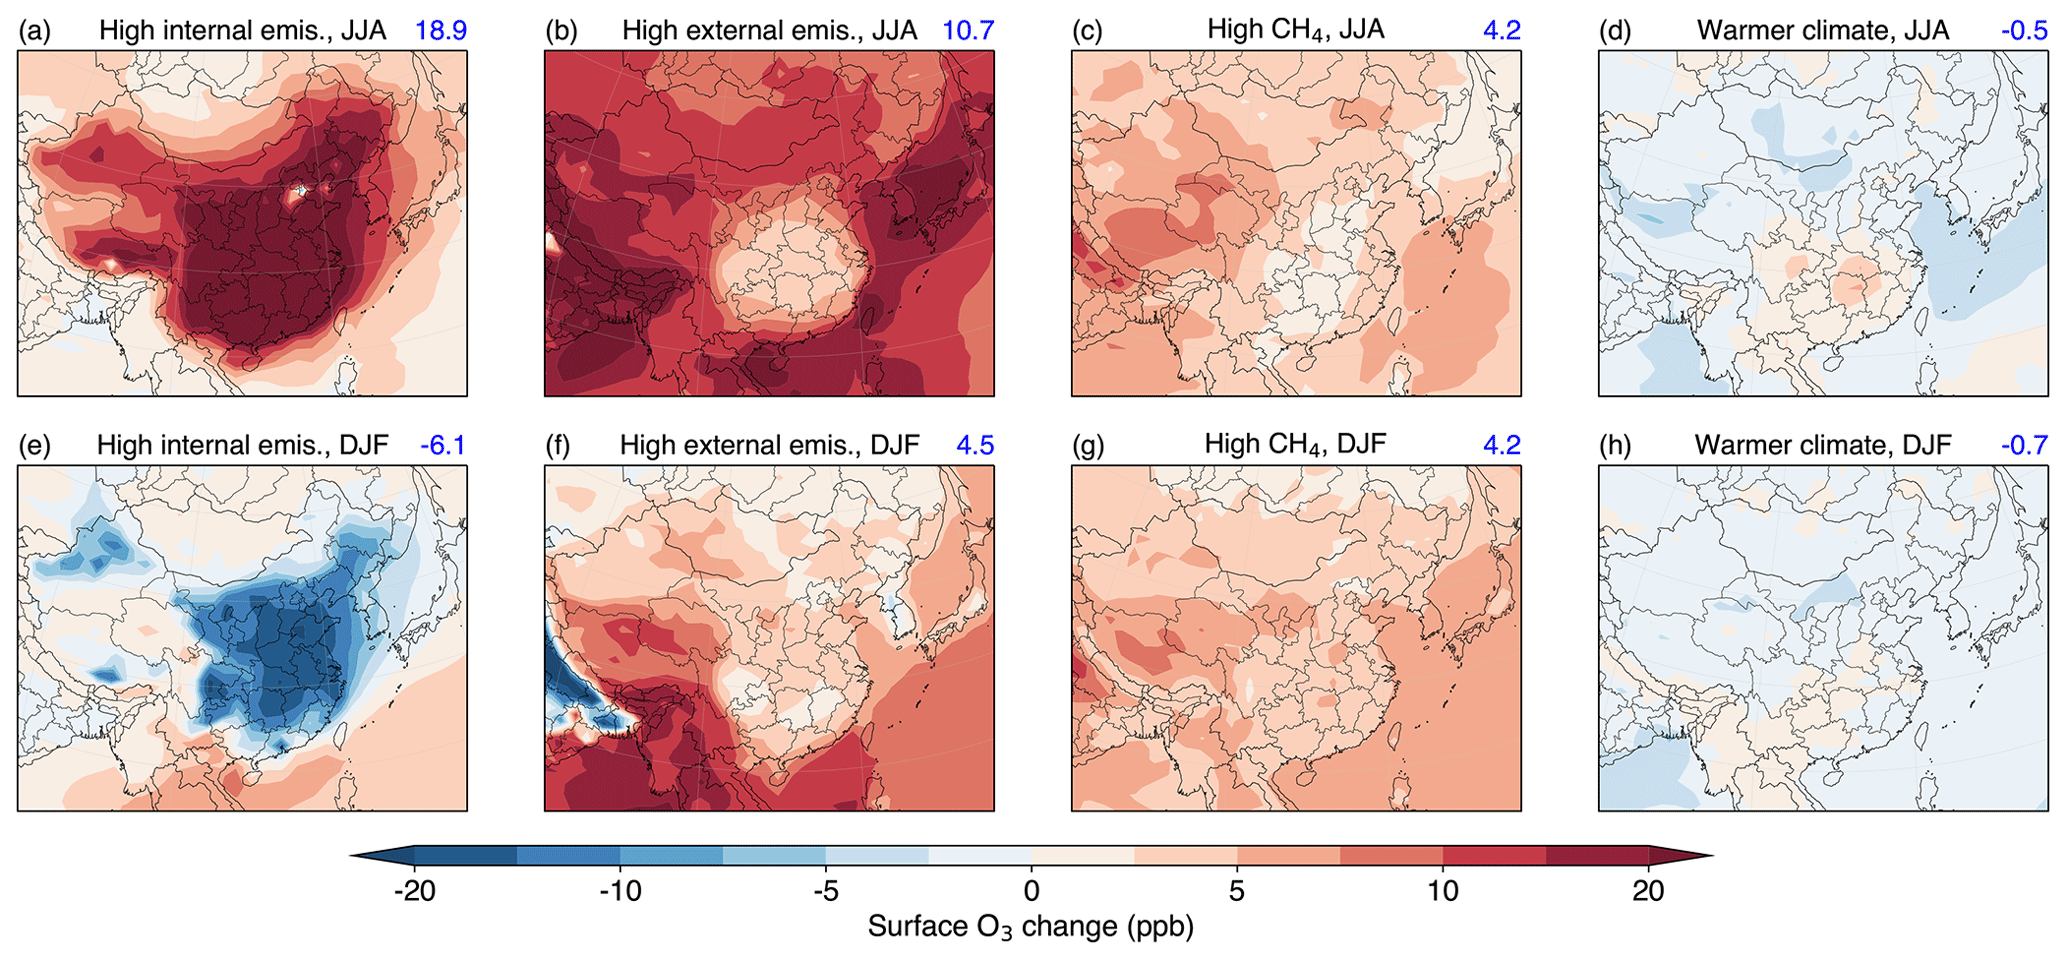
Figure 2Contribution of changes in (a) internal emissions in East Asia, (b) external emissions outside China, (c) global CH4 concentrations, and (d) a warmer climate following the SSP3-7.0 pathway to seasonal surface O3 changes relative to the net-zero pathway. Mean O3 changes over mainland China in parts per billion are shown in the top right corner.
While local emission changes directly influence surface O3 changes in the future, there are a number of other important drivers that govern surface O3. We investigate four independent drivers: changes in emissions inside China (local emissions) and outside China (external emissions), changes in atmospheric CH4 concentrations (high CH4), and a warmer climate (warmer climate) relative to the net-zero pathway; see Fig. 2. Local anthropogenic emission changes in China are shown to have the largest impact in both seasons (Fig. 2a and e), but other drivers also contribute to surface O3 changes and show substantial regional and seasonal differences.
The effect of changes in emissions outside China reflects the importance of transport of O3 from other countries and higher background O3 concentrations. If the rest of the world did not follow a net-zero emission pathway, surface O3 mixing ratios would be more than 10 ppb higher in summer (Fig. 2b). The contribution to O3 in winter is generally smaller, estimated here as 4 ppb (Fig. 2f). The contribution of external emissions is much larger near the country's borders than in central China. Changes in atmospheric CH4 abundance have a relatively uniform influence on surface O3 in eastern China, with slightly greater effects in western China where altitudes are higher. A 4 ppb O3 increase due to higher CH4 is seen for both seasons (Fig. 2c and g). The O3 changes due to CH4 are comparable to those across central China due to higher emissions outside China. In contrast, a warmer climate under the SSP3-7.0 scenario compared to the net-zero pathway has minor impacts on surface O3 changes (<1 ppb). In general, surface O3 mixing ratios decrease likely due to increased humidity under a warm climate but may increase locally due to higher temperatures, natural emissions, and reduced O3 deposition rates (Zanis et al., 2022). There are increased natural BVOC emissions in China under both net-zero and SSP3-7.0 scenarios (Fig. S1c and f), particularly in southern China where vegetation is more abundant than in the north. Regional surface O3 responds differently to different future climates (Fig. 2d and h), with O3 increases in the south and O3 decreases in the north under a warmer climate. The regional differences are consistent with those found under the effects of changing BVOC emissions in the future (S. Liu et al., 2022). These O3 increases occur in both seasons, but although they are more pronounced in summer, they remain much smaller than the changes due to anthropogenic emissions. The relative impacts of climate change on O3 may become larger in the future as anthropogenic emissions reduce towards net-zero targets. Overall, we show that while local emissions are critical to O3 pollution, emissions outside China and global CH4 concentrations are also important drivers of concern.
The seasonality of surface O3 changes in China and globally is shown in Fig. 3. In summer, local emissions dominate surface O3 increases, while in winter and spring, O3 transport from other countries and O3 increases due to elevated CH4 concentrations are more important. Strong NO titration of O3 leads to substantial O3 decreases in winter, but its effects are suppressed by more efficient O3 production over summer (Fig. 3a). Emissions outside China increase O3 mixing ratios throughout the year, with the greatest impact in late spring and early summer when intercontinental transport is strongest. The seasonal variation in the influence of local and external emissions is relatively small on a global scale, reflecting a limited sensitivity of global O3 changes to emissions (Fig. 3b). The uniform influence of changes in CH4 concentration is comparable both in China and globally. The warmer climate under SSP3-7.0 leads to slightly larger O3 decreases on a global scale relative to the net-zero scenario. We emphasise that seasonal O3 responses to emission changes are more pronounced at a regional scale and become weaker in winter and that O3 continental transport and background O3 concentrations may still contribute to O3 pollution.
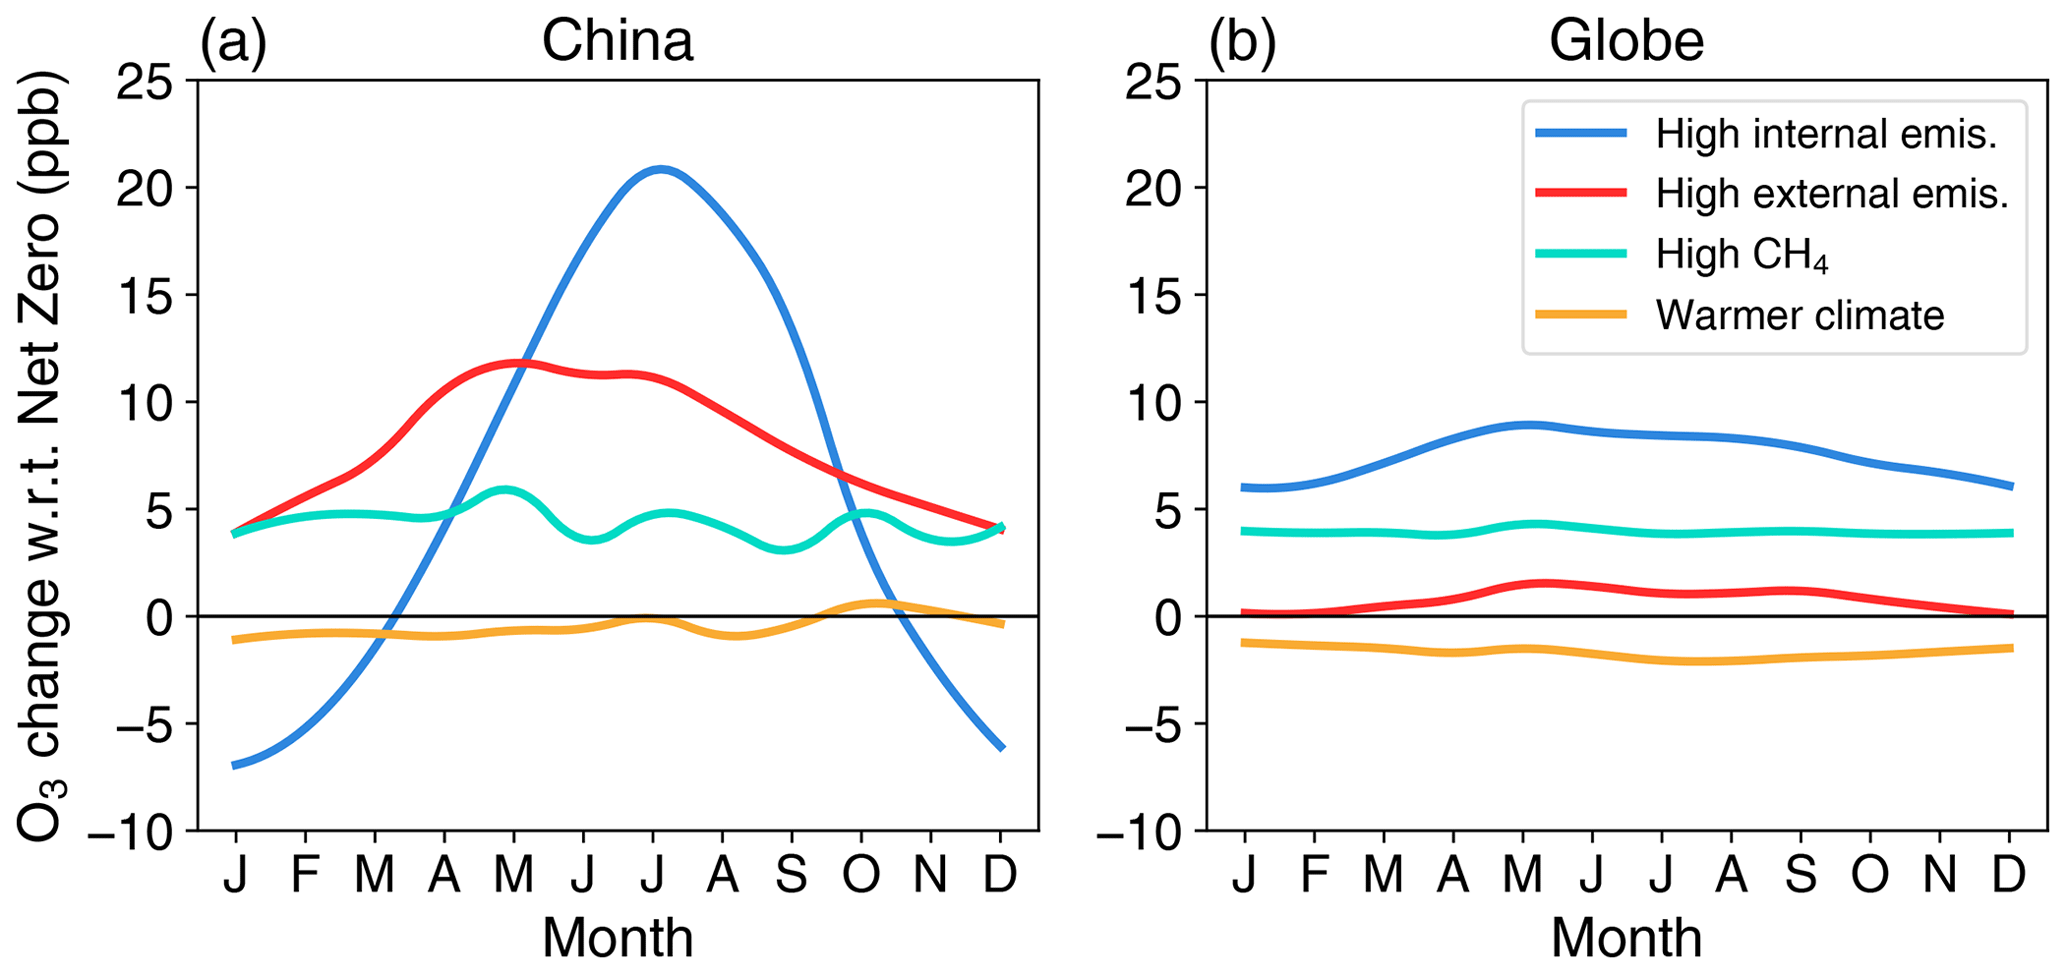
Figure 3Seasonal surface O3 changes relative to net zero due to changes in emissions in and outside China, global CH4 concentrations, and differences in 2060 climate under SSP3-7.0 in (a) China and (b) the globe.
To examine how the occurrence of high-O3 episodes may change in the future, we show the frequency distributions of daily mean surface O3 mixing ratios for all grid cells over China under different scenarios in Fig. 4. We find that surface O3 mixing ratios under the net-zero pathway follow an approximate normal distribution, with a mean O3 of about 20 ppb (Fig. 4a). The frequency of high O3 greater than 40 ppb can be greatly reduced under net zero. This is substantially different from the present-day and SSP3-7.0 scenarios. SSP3-7.0 assumes that there are no emission controls in China, leading to a higher frequency of high O3 mixing ratios (>50 ppb). However, the faster NO titration on O3 with higher NOx emissions also increases the frequency of low O3 mixing ratios (<10 ppb). In Fig. 4b, we show that the O3 distribution shifts to higher values of O3 under the high-internal-emission scenario and is substantially different from the other scenarios shown here, indicating that there is a large change in local O3 production due to local emission changes. The frequency of O3 mixing ratios between 30 and 50 ppb is highest in the scenarios of high external emissions and high CH4 concentrations, demonstrating that these factors can lead to an overall increase in daily mean O3. In addition, we do not find significant changes in O3 mixing ratios due to a warmer climate under SSP3-7.0.
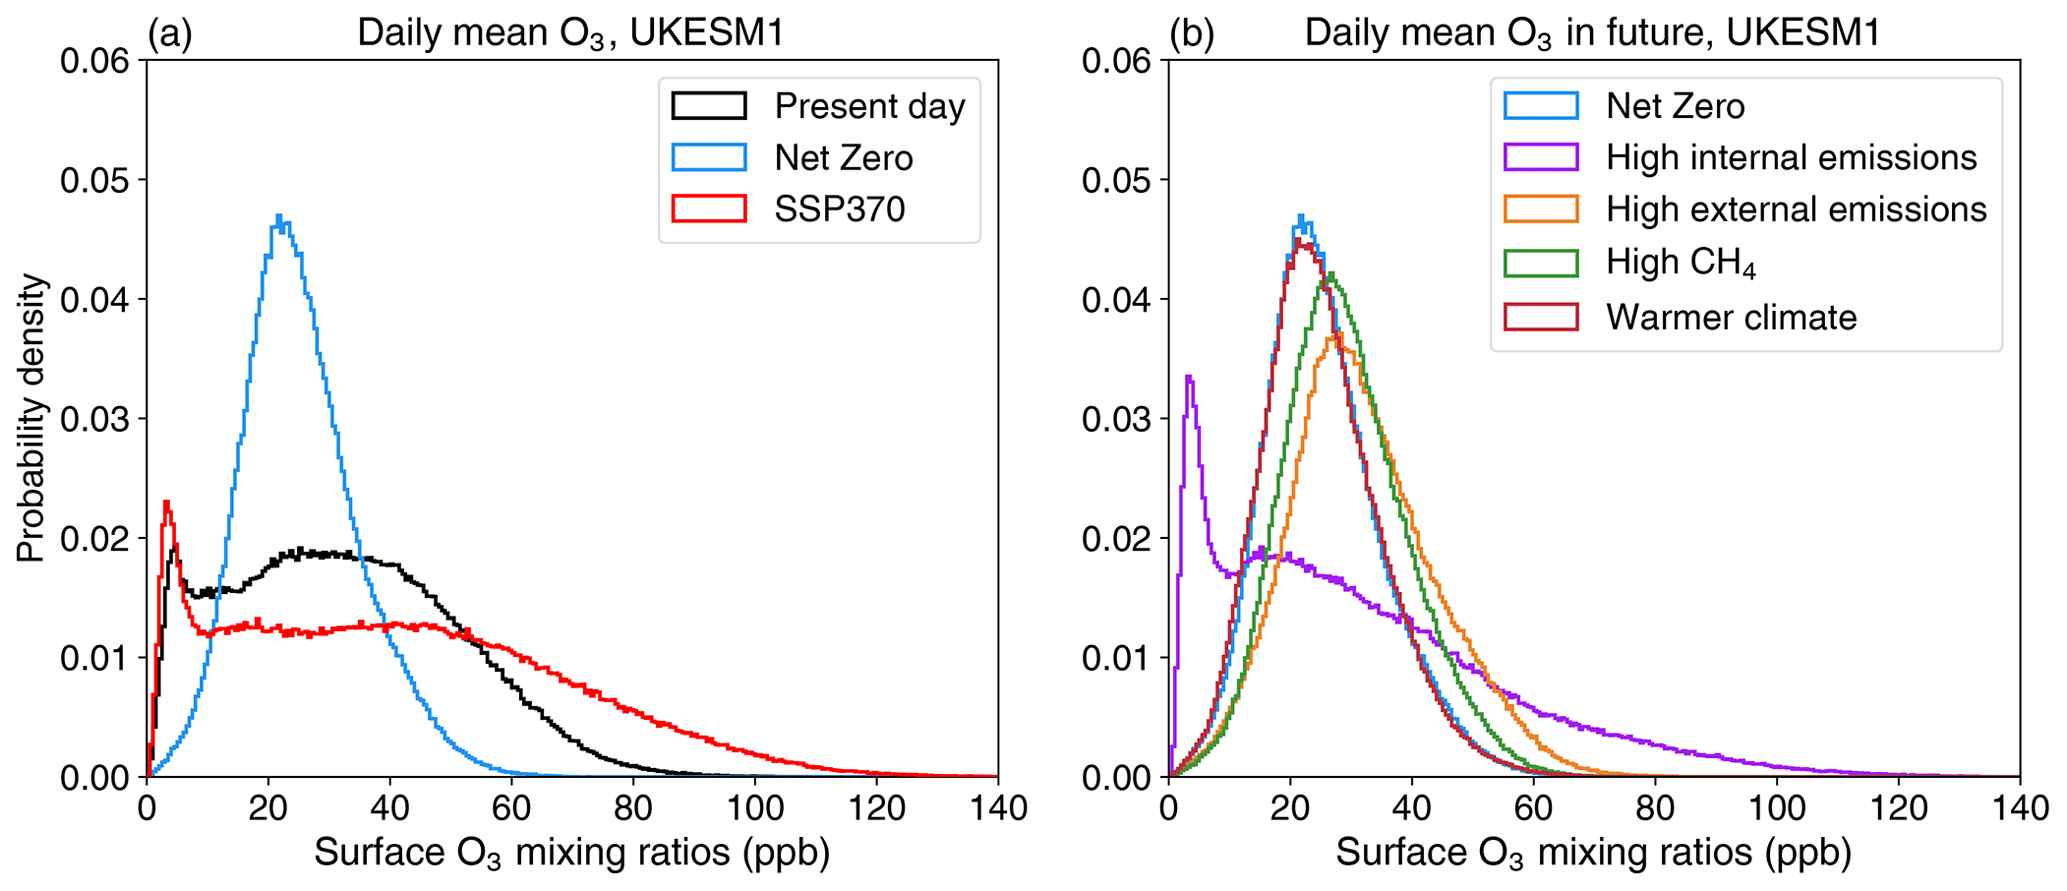
Figure 4Whole year distributions of daily mean surface O3 mixing ratios (a) in the present-day, the net-zero, and the SSP3-7.0 scenarios in China and (b) in the scenarios with higher internal emissions, external emissions, CH4 concentrations, and a warmer climate relative to net zero.
Since there are systematic biases in surface O3 simulations with UKESM1 (Fig. S3a and b), the reliability of future O3 projections remains uncertain. We estimate the biases in surface O3 through the deep learning model and apply this to generate a more robust assessment of O3 changes under the net-zero pathway. A fully independent evaluation for the deep learning model is conducted using a testing dataset; see Fig. 5. We show that the magnitudes and distributions of biases in the UKESM1 simulations are reproduced well by the deep learning model, with a correlation coefficient of 0.96, a mean bias error of 0.1 ppb, and a root mean square error (RMSE) of 4.0 ppb, which demonstrates the robustness of this approach. We also subtract the biases from UKESM1 and examine the spatial and temporal distribution of O3 mixing ratios in China in Fig. 6. Spatial distributions of surface O3 in China over 2013–2017 can also be captured well (Fig. 6a, b, d, and e), with the highest summertime O3 and the lowest wintertime O3 in the North China Plain. The magnitudes of surface O3 mixing ratios with bias correction are in close agreement with the observations. The time series of daily mean O3 can also be simulated well in Beijing and Guangzhou (Fig. 6c and f), which represent two different locations in northern and southern China with rather different chemical and meteorological environments. The evaluation demonstrates the capability of the deep learning model in correcting the seasonal and daily UKESM1 simulation of surface O3. This approach shows great promise in reducing current model errors and hence has the potential to improve simulations of surface O3 under future scenarios.
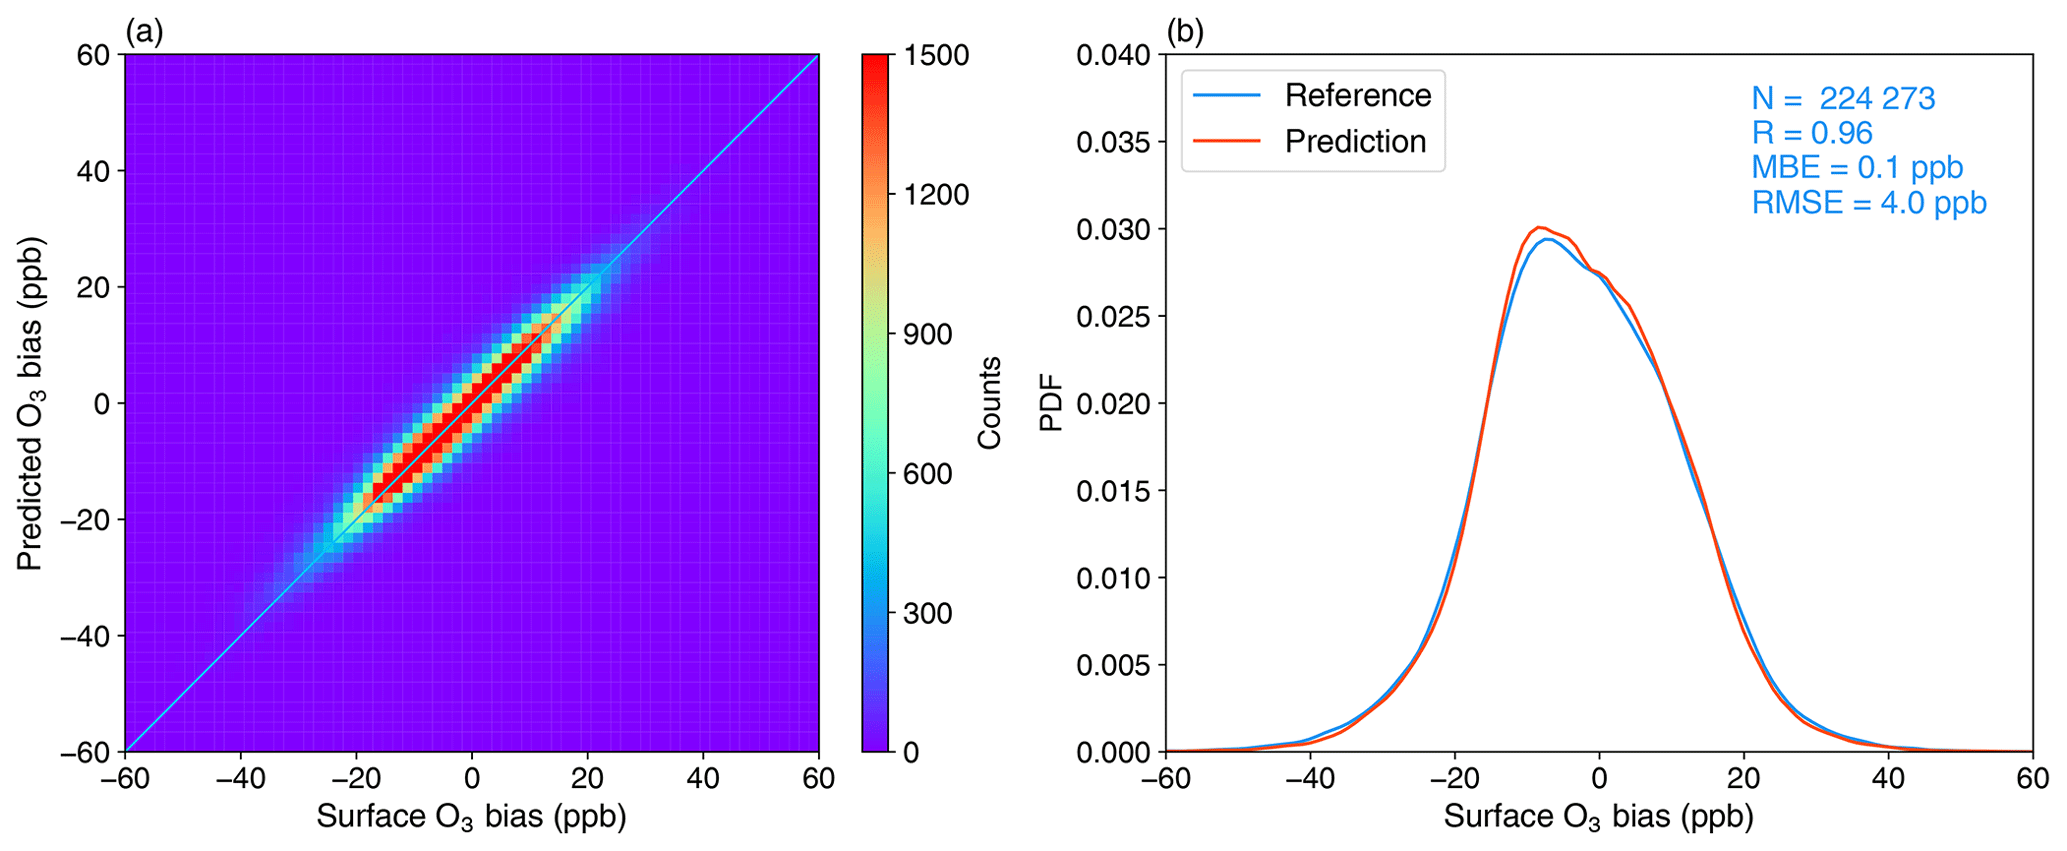
Figure 5Independent evaluation of the deep learning model in simulating daily mean surface O3 biases at each UKESM1 grid point over China. (a) Surface O3 biases (UKESM1 minus CAQRA) and biases predicted by the deep learning model. (b) Probability density function (PDF) of O3 biases (labelled here as reference) and predicted O3 biases. Statistics are shown in the top right corner.
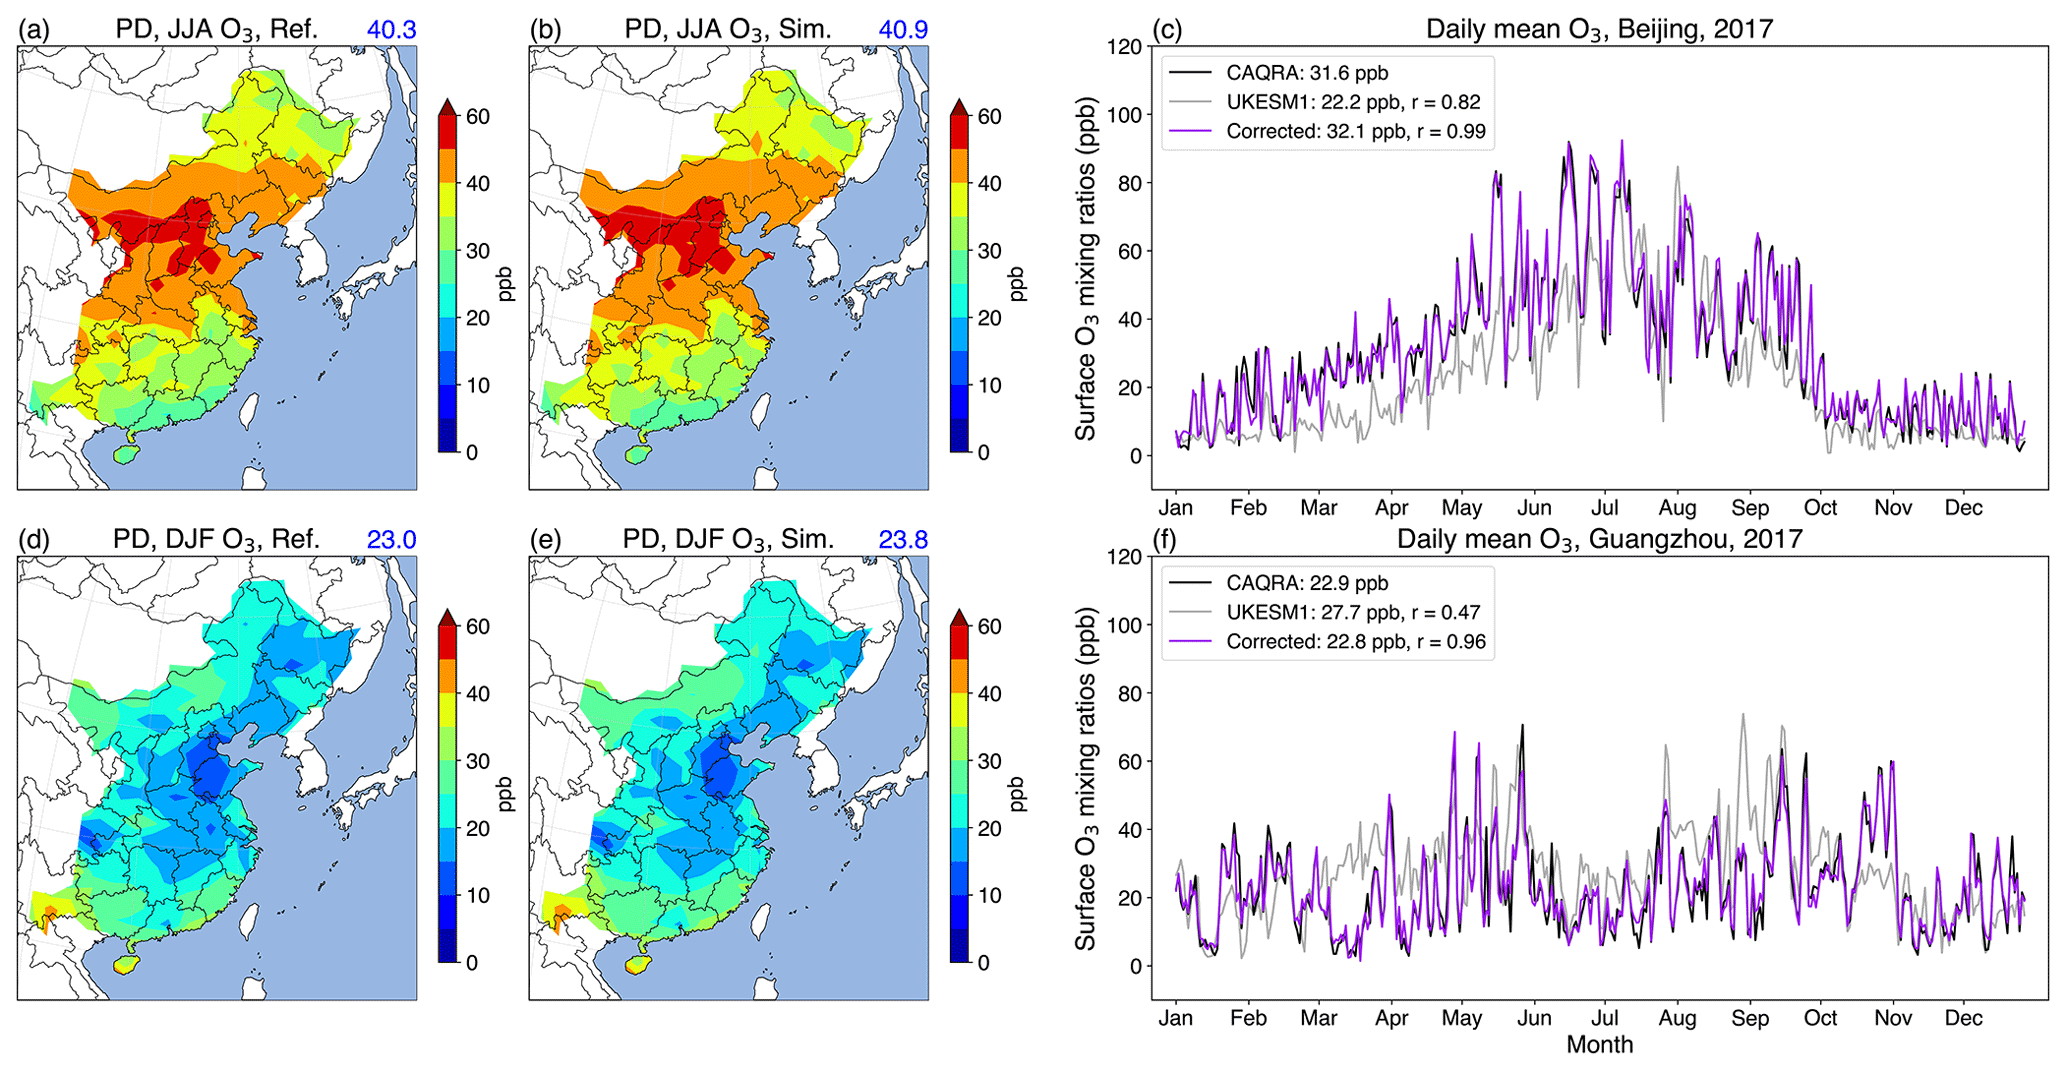
Figure 6(a, d) Surface mean O3 mixing ratios derived from CAQRA (Ref.), compared with (b, e) bias-corrected O3 using deep learning in December–January–February (DJF) and June–July–August (JJA) over 2013–2017. Mean surface O3 mixing ratios (ppb) over the eastern part of mainland China are shown in the top right corner. Time series of daily mean O3 mixing ratios in Beijing and Guangzhou in 2017 are shown in panels (c) and (f), with mean O3 values and correlation coefficients between CAQRA and the UKESM1 simulations and deep learning results shown in the legend.
Spatial distributions of future bias-corrected surface O3 under the net-zero pathways are shown in Fig. 7 to compare and contrast with UKESM1 outputs (Fig. 1) and to assess the effectiveness of emission controls. With bias correction, summertime O3 mixing ratios generally decrease under net zero (Fig. 7a and b), which is consistent with UKESM1 results (Fig. 1c). We find that there are larger O3 decreases in summer in the North China Plain and the Yangtze River Delta (Fig. 7c) than in other less-polluted regions. However, the overall magnitudes of surface O3 decreases are not as large as simulated with UKESM1. There are noticeable differences in the latitudinal mean surface O3 decreases, with the maximum changes estimated as 10 ppb in the bias-corrected simulation, smaller than 20 ppb predicted with UKESM1 (Fig. 7d). This indicates that the underlying impacts of emission controls on O3 may not be as large as the model suggests and that the O3 responses to changing emissions may be overestimated. This is also reflected in the overestimation of O3 changes in southern China in the SSP3-7.0 scenario (Fig. S4a–c).
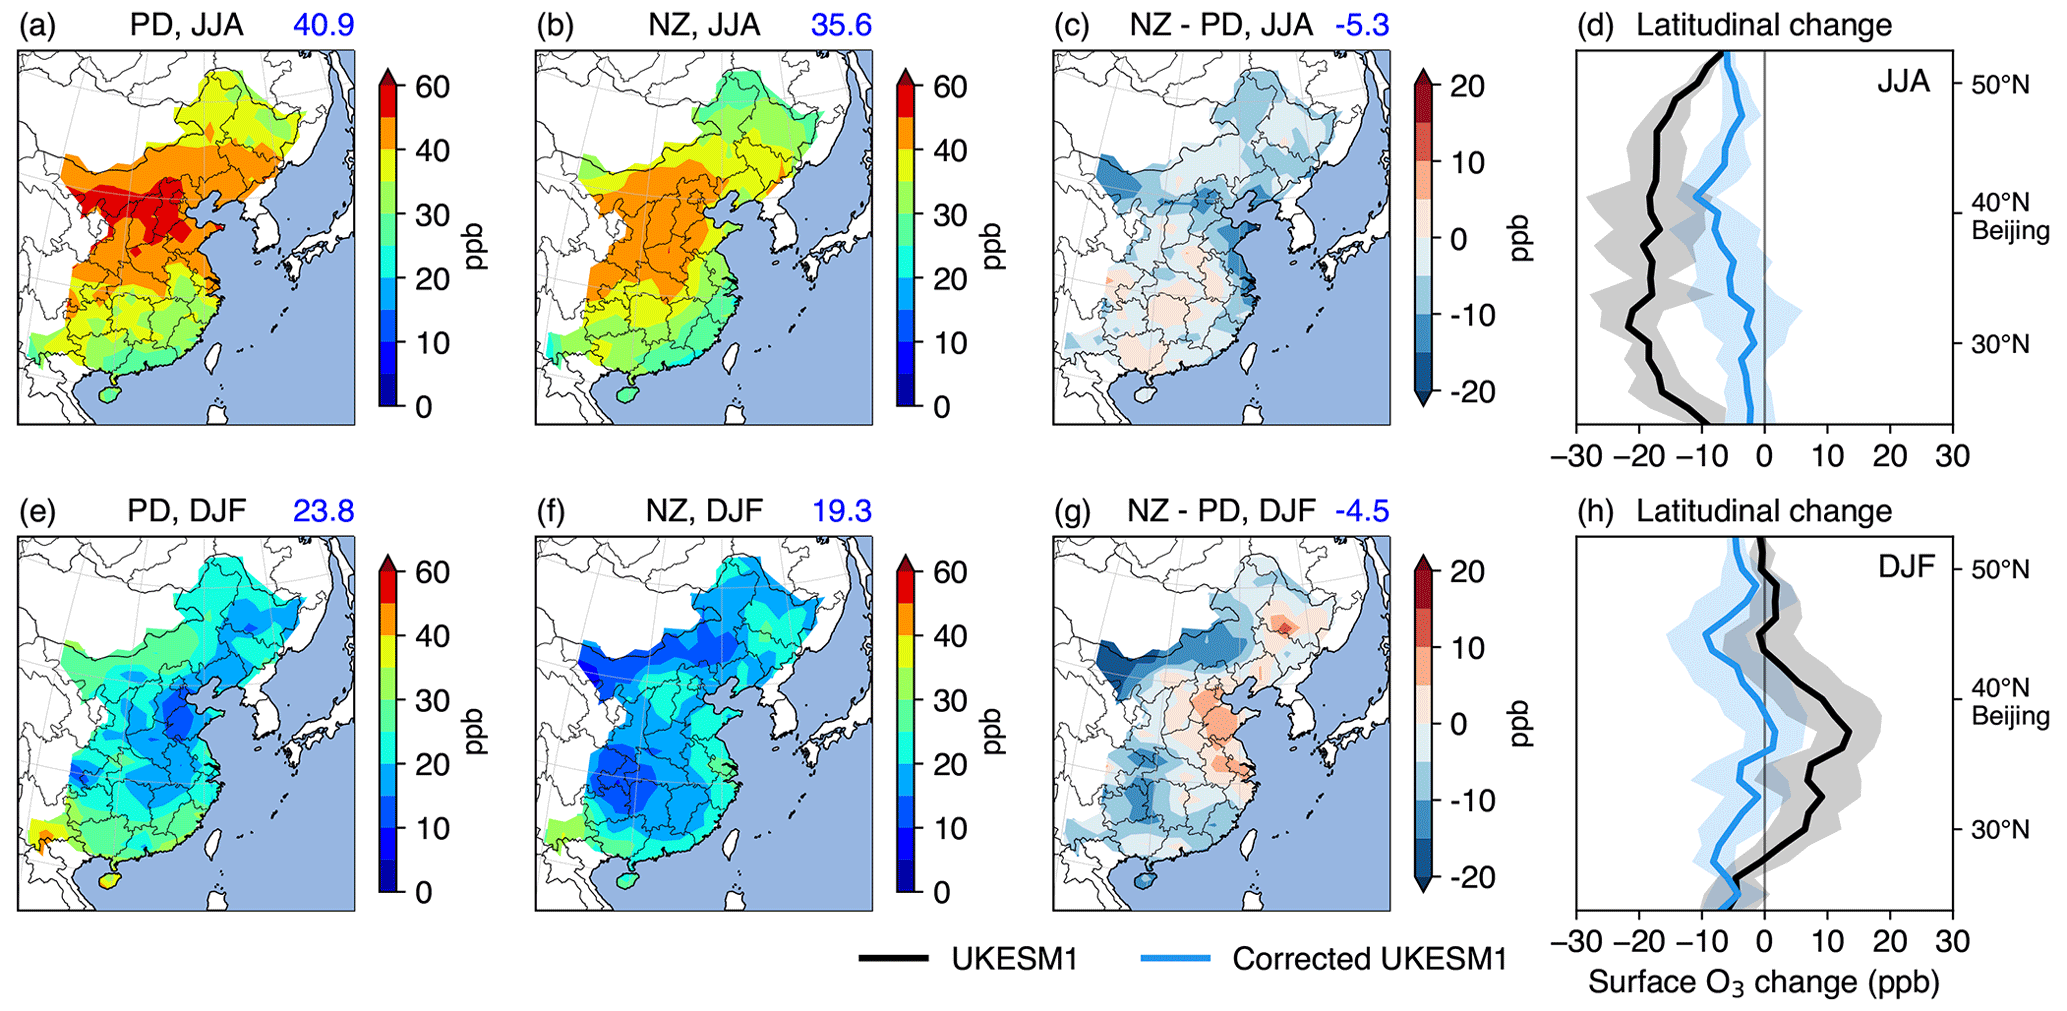
Figure 7Seasonal mean surface O3 mixing ratios corrected with the deep learning model in the present-day (a, b) and the net-zero scenario (e, f) in the eastern part of mainland China, as well as the expected O3 changes in summertime and wintertime (c, g). Latitudinal mean O3 changes in UKESM1 and bias-corrected UKESM1 are shown in panels (d) and (h), where shading indicates 1 standard deviation of the changes in latitudinal O3 mixing ratios.
In wintertime, while surface O3 mixing ratios increase in high-emission regions under net zero, as seen in both UKESM1 and the bias-corrected results, areas with O3 increases are smaller than those predicted by UKESM1 (Fig. 7). This again suggests that the magnitude and spatial extent of O3 titration by NO may be overestimated in UKESM1. The same effect is seen in the bias-corrected wintertime O3 under SSP3-7.0 (Fig. S4). In general, biases in O3 simulations from UKESM1 are smaller in the net-zero scenario but still remain large in the SSP3-7.0 scenario (Fig. S3b–d). These two scenarios correspond to low- and high-emission pathways, respectively, which indicates that the accuracy of O3 simulations in UKESM1 may decrease when emission changes become larger. The bias-corrected results show that only industrial regions with high NOx emissions in China show substantial O3 increases under net zero, while surface O3 mixing ratios decrease in less-polluted regions in winter. This leads to a general decrease in latitudinal surface O3 mixing ratios in wintertime (Fig. 7h).
With bias correction, the average surface O3 mixing ratios are estimated to decrease in both seasons in the eastern part of China in the future under the net-zero pathway. O3 decreases of 5 ppb are predicted to occur in summer, which are slightly larger than the 4 ppb decreases predicted in winter. This demonstrates the overall advantages of net-zero policies in achieving a surface ozone air quality co-benefit. Furthermore, in high-emission regions, the directions of surface O3 changes are different in summer and winter, as shown in both UKESM1 and the corrected UKESM1, indicating that VOC-limited O3 formation still dominates there in winter.
We also calculate the annual average number of days with daily mean O3 over 50 ppb as a measure to quantify high-O3 pollution episodes; see Fig. 8. The number of days per year with high-O3 episodes under present-day conditions can be reproduced well following bias correction (Fig. 8a and b, Table 3), with intensive areas of high O3 pollution in the North China Plain (60 d), particularly in summertime, and relatively low occurrence in the Pearl River Delta (31 d). There is an average of 33 d yr−1 with high O3 pollution over China. We find that the net-zero policies will succeed in reducing the number of high O3 pollution days markedly by 65 % in the future. In contrast, following higher emission control policies will increase high-O3 episodes by almost a factor of 4 (Table 3).
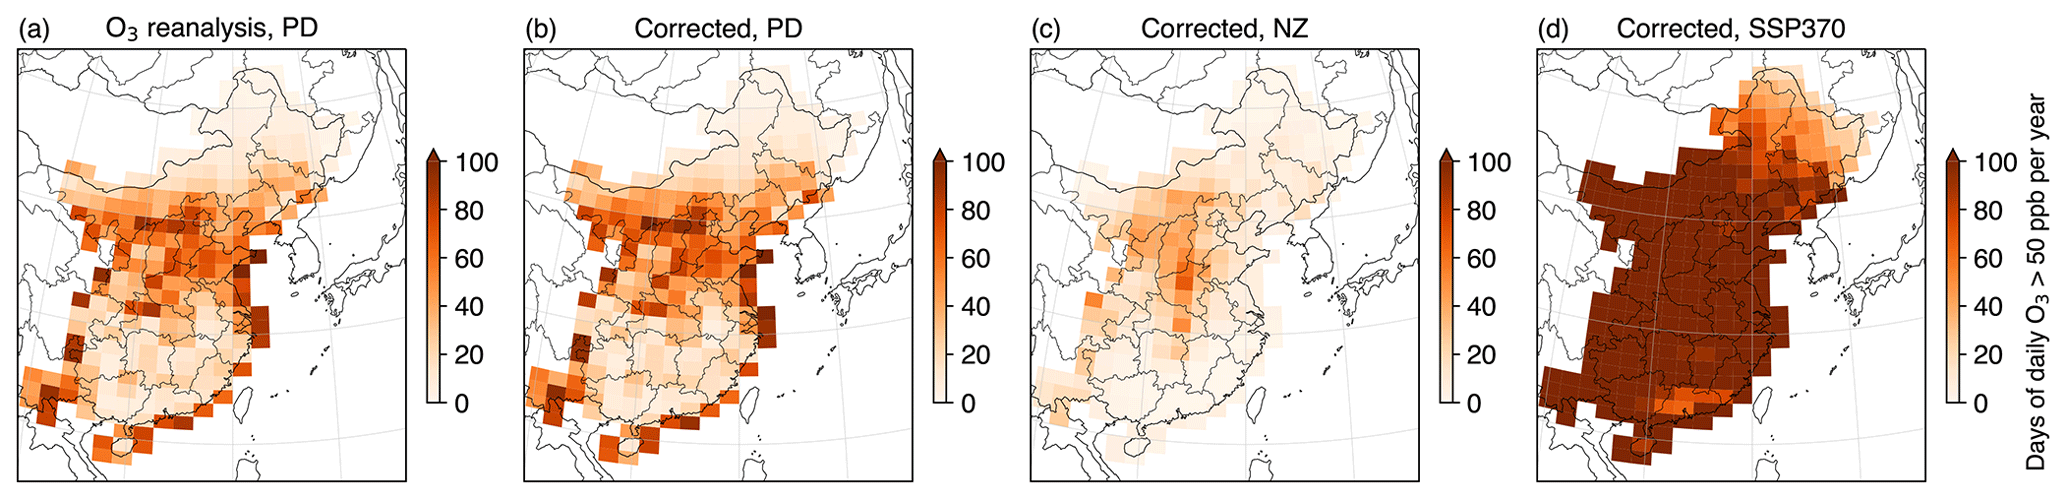
Figure 8Annual average number of days with daily mean surface O3 mixing ratios higher than 50 ppb in the present day calculated from (a) the surface O3 reanalysis and (b) bias-corrected UKESM1. Future high-O3 episodes under (c) net-zero and (d) SSP3-7.0 pathways are shown from bias-corrected UKESM1.
Table 3Annual average number of days with daily mean surface O3 mixing ratios higher than 50 ppb in China, the North China Plain (NCP), the Yangtze River Delta (YRD), the Pearl River Delta (PRD), and the Sichuan Basin (SCB). Conditions in the present day and under the net zero and SSP3-7.0 pathways are presented, calculated from the bias-corrected UKESM1 simulations. The percentage change in the number of days in the future relative to the present day are shown.
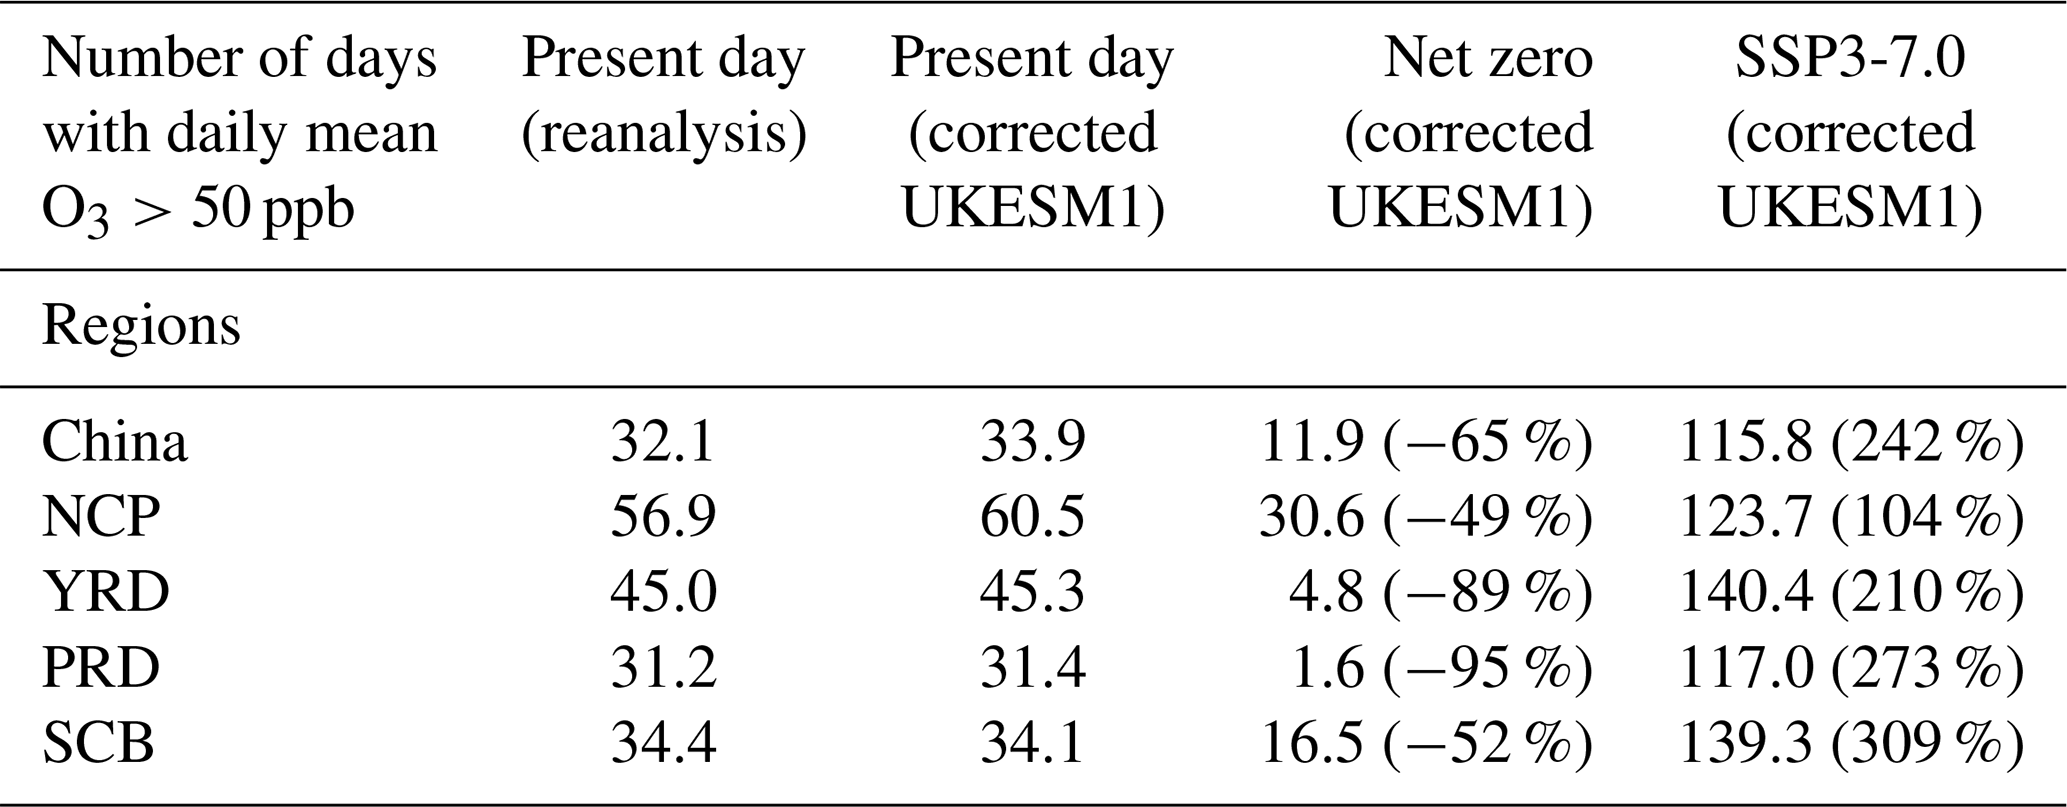
Following net-zero emission controls, the Yangtze River Delta and the Pearl River Delta only have high-O3 episodes for a few days each year. However, high-O3 episodes still occur for almost 1 month (30 d) on the North China Plain and parts of central China in the future, demonstrating that O3 pollution cannot be fully eliminated in this region. The Sichuan Basin is also a region where high O3 pollution cannot be fully addressed, likely due to the favourable meteorological conditions leading to O3 formation associated with the complex topography. Nevertheless, net-zero policies are expected to deliver great benefits in mitigating O3 pollution in China. Indeed, O3 pollution is likely to become much worse if emissions continue to rise (Fig. 8d; Table 3). Even stricter controls on anthropogenic emissions than proposed to meet net zero may be required to avoid high O3 pollution in the North China Plain.
Net-zero emission polices are important for reducing regional surface O3 pollution as well as for mitigating climate change. We use a chemistry–climate model to quantify the O3 changes in China under a net-zero pathway and investigate the relative importance of different drivers of these changes. We also place our results in context by comparing to a scenario, SSP3-7.0, in which weak climate mitigation leads to continued increases in precursor emissions. Surface O3 responses to net-zero emission control policies in China are distinctly different in different seasons, with substantial O3 decreases in summer and O3 increases in winter in high-emission regions due to decreased O3 titration by NO. This demonstrates the large benefits of emission controls in reducing summertime average O3 pollution in China by as much as 16 ppb.
Local emission changes are shown to be the most important driver influencing regional O3 changes, which generally outweighs other drivers such as transport of O3 from other countries, increased background O3 formation through rising CH4 abundance, and a warmer climate. We do not find substantial changes in surface O3 in China between net-zero and SSP3-7.0 scenarios due to a warmer climate, but there are surface O3 increases in southern China. Impacts of future local and external emissions on surface O3 show strong seasonal variation, while increasing future CH4 concentrations have a relatively uniform effect on O3 throughout the year. In winter and spring, future external emissions outside China and higher CH4 concentrations are more important than local emissions at a regional average scale.
We further demonstrate the capability of deep learning approaches to correct the biases in simulated daily mean O3. UKESM1 shows systematic biases in simulated O3 like many other chemistry–climate models; these are expected to influence their projections of future O3. Deep learning can provide improved assessment of the impacts of net-zero policies on surface O3. We find that surface O3 changes are overestimated by UKESM1 in summertime, and therefore the benefits of emission controls may be overestimated by chemistry–climate models. UKESM1 estimates that the mean latitudinal surface O3 decreases due to emission controls could be up to 20 ppb in summer, but bias correction shows that these may only be up to 10 ppb.
We acknowledge that there are uncertainties associated with the choice of the deep learning model used and with the variables and parameters it is trained on, but the biases are sufficiently well predicted here that we are confident in the robustness of our results. The prediction might be further improved by employing more advanced deep learning architectures and considering a wider range of variables. The prediction of future surface O3 biases may be slightly different under these conditions, but we believe that our principal results are likely to remain robust. The driving variables under the net-zero scenario typically lie in the ranges associated with the present-day conditions that were used to train the model, suggesting that the relationships between inputs and outputs derived from the deep learning model are suitable for predicting future situations.
However, net-zero emission policies succeed in reducing the number of days of high O3 pollution by 65 % in China per year, with the number dropping from 33 d under present-day conditions to 11 d each year under net zero. The North China Plain will still be affected by high O3 pollution in the future, meaning that stricter emission policies are needed in this region. In the Yangtze River Delta and the Pearl River Delta, O3 pollution is likely to be less of a concern in the future as there are only a few days with high O3 pollution under net zero. It is also clear that if emissions continue to rise, air quality in China will be substantially worse than at present, and therefore emission controls are essential. However, it is clear from these studies that emission controls can be very effective in reducing surface O3 pollution and that net-zero emission policies can substantially mitigate O3 pollution in China.
The data generated in this study are available upon request.
The supplement related to this article is available online at: https://doi.org/10.5194/acp-23-13755-2023-supplement.
All authors participated in designing the study. ZL conducted UKESM1 simulations, built the deep learning model, and performed the analysis with input and discussions from OW, RMD, FMO, and STT. ZL, OW, and RMD prepared the paper, with contributions from all co-authors.
The contact author has declared that none of the authors has any competing interests.
Publisher's note: Copernicus Publications remains neutral with regard to jurisdictional claims made in the text, published maps, institutional affiliations, or any other geographical representation in this paper. While Copernicus Publications makes every effort to include appropriate place names, the final responsibility lies with the authors.
Zhenze Liu, Oliver Wild, and Ruth M. Doherty thank the project of the UK–China collaboration to optimise net-zero-policy options for air quality and health (COP-AQ) under grant 2021GRIP02COP-AQ. Oliver Wild and Ruth M. Doherty thank the Natural Environment Research Council (NERC) for funding under grants NE/N006925/1, NE/N006976/1, and NE/N006941/1. Fiona M. O'Connor was supported by the Met Office Hadley Centre Climate Programme funded by BEIS and also acknowledges support from the EU Horizon 2020 Research Programme CRESCENDO (grant agreement no. 641816). Steven T. Turnock would like to acknowledge support from the UK–China Research and Innovation Partnership Fund through the Met Office Climate Science for Service Partnership (CSSP) China as part of the Newton Fund.
This research has been supported by the Natural Environment Research Council (grant nos. 2021GRIP02COP-AQ, NE/N006925/1, NE/N006976/1, and NE/N006941/1), the Met Office Hadley Centre Climate Programme funded by BEIS, the EU Horizon 2020 Research Programme CRESCENDO (grant agreement no. 641816), and the UK–China Research and Innovation Partnership Fund through the Met Office Climate Science for Service Partnership (CSSP) China as part of the Newton Fund.
This paper was edited by Qiang Zhang and reviewed by Dan Tong and one anonymous referee.
Archer-Nicholls, S., Abraham, N. L., Shin, Y. M., Weber, J., Russo, M. R., Lowe, D., Utembe, S. R., O'Connor, F. M., Kerridge, B., Latter, B., Siddans, R., Jenkin, M., Wild, O., and Archibald, A. T.: The Common Representative Intermediates Mechanism version 2 in the United Kingdom Chemistry and Aerosols Model, J. Adv. Model. Earth Sy., 13, e2020MS002420. https://doi.org/10.1029/2020MS002420, 2021. a
Archibald, A. T., Neu, J. L., Elshorbany, Y. F., Cooper, O. R., Young, P. J., Akiyoshi, H., Cox, R. A., Coyle, M., Derwent, R. G., Deushi, M., Finco, A., Frost, G. J., Galbally, I. E., Gerosa, G., Granier, C., Griffiths, P. T., Hossaini, R., Hu, L., Jöckel, P., Josse, B., Lin, M. Y., Mertens, M., Morgenstern, O., Naja, M., Naik, V., Oltmans, S., Plummer, D. A., Revell, L. E., Saiz-Lopez, A., Saxena, P., Shin, Y. M., Shahid, I., Shallcross, D., Tilmes, S., Trickl, T., Wallington, T. J., Wang, T., Worden, H. M., and Zeng, G.: Tropospheric Ozone Assessment ReportA critical review of changes in the tropospheric ozone burden and budget from 1850 to 2100, Elementa: Science of the Anthropocene, 8, 34, https://doi.org/10.1525/elementa.2020.034, 2020a. a
Archibald, A. T., O'Connor, F. M., Abraham, N. L., Archer-Nicholls, S., Chipperfield, M. P., Dalvi, M., Folberth, G. A., Dennison, F., Dhomse, S. S., Griffiths, P. T., Hardacre, C., Hewitt, A. J., Hill, R. S., Johnson, C. E., Keeble, J., Köhler, M. O., Morgenstern, O., Mulcahy, J. P., Ordóñez, C., Pope, R. J., Rumbold, S. T., Russo, M. R., Savage, N. H., Sellar, A., Stringer, M., Turnock, S. T., Wild, O., and Zeng, G.: Description and evaluation of the UKCA stratosphere–troposphere chemistry scheme (StratTrop vn 1.0) implemented in UKESM1, Geosci. Model Dev., 13, 1223–1266, https://doi.org/10.5194/gmd-13-1223-2020, 2020b. a
Bieser, J., Aulinger, A., Matthias, V., Quante, M., and Van Der Gon, H. D.: Vertical emission profiles for Europe based on plume rise calculations, Environ. Pollut., 159, 2935–2946, 2011. a
Brown, F., Folberth, G. A., Sitch, S., Bauer, S., Bauters, M., Boeckx, P., Cheesman, A. W., Deushi, M., Dos Santos Vieira, I., Galy-Lacaux, C., Haywood, J., Keeble, J., Mercado, L. M., O'Connor, F. M., Oshima, N., Tsigaridis, K., and Verbeeck, H.: The ozone–climate penalty over South America and Africa by 2100, Atmos. Chem. Phys., 22, 12331–12352, https://doi.org/10.5194/acp-22-12331-2022, 2022. a
Cheng, J., Tong, D., Zhang, Q., Liu, Y., Lei, Y., Yan, G., Yan, L., Yu, S., Cui, R. Y., Clarke, L., Geng, G., Zheng, B., Zhang, X., Davis, S. J., and He, K.: Pathways of China's PM2.5 air quality 2015–2060 in the context of carbon neutrality, Natl. Sci. Rev., 8, nwab078, https://doi.org/10.1093/nsr/nwab078, 2021. a
Doherty, R., Wild, O., Shindell, D., Zeng, G., MacKenzie, I., Collins, W., Fiore, A. M., Stevenson, D., Dentener, F., Schultz, M., Hess, P., Derwent, R. G., and Keating, T. J.: Impacts of climate change on surface ozone and intercontinental ozone pollution: A multi-model study, J. Geophys. Res.-Atmos., 118, 3744–3763, 2013. a, b
Doherty, R. M.: Ozone pollution from near and far, Nat. Geosci., 8, 664–665, 2015. a
Eyring, V., Bony, S., Meehl, G. A., Senior, C. A., Stevens, B., Stouffer, R. J., and Taylor, K. E.: Overview of the Coupled Model Intercomparison Project Phase 6 (CMIP6) experimental design and organization, Geosci. Model Dev., 9, 1937–1958, https://doi.org/10.5194/gmd-9-1937-2016, 2016. a
Fiore, A. M., Naik, V., and Leibensperger, E. M.: Air quality and climate connections, J. Air Waste Manage., 65, 645–685, 2015. a
Griffiths, P. T., Murray, L. T., Zeng, G., Shin, Y. M., Abraham, N. L., Archibald, A. T., Deushi, M., Emmons, L. K., Galbally, I. E., Hassler, B., Horowitz, L. W., Keeble, J., Liu, J., Moeini, O., Naik, V., O'Connor, F. M., Oshima, N., Tarasick, D., Tilmes, S., Turnock, S. T., Wild, O., Young, P. J., and Zanis, P.: Tropospheric ozone in CMIP6 simulations, Atmos. Chem. Phys., 21, 4187–4218, https://doi.org/10.5194/acp-21-4187-2021, 2021. a
Hedegaard, G. B., Christensen, J. H., and Brandt, J.: The relative importance of impacts from climate change vs. emissions change on air pollution levels in the 21st century, Atmos. Chem. Phys., 13, 3569–3585, https://doi.org/10.5194/acp-13-3569-2013, 2013. a
Hoesly, R. M., Smith, S. J., Feng, L., Klimont, Z., Janssens-Maenhout, G., Pitkanen, T., Seibert, J. J., Vu, L., Andres, R. J., Bolt, R. M., Bond, T. C., Dawidowski, L., Kholod, N., Kurokawa, J.-I., Li, M., Liu, L., Lu, Z., Moura, M. C. P., O'Rourke, P. R., and Zhang, Q.: Historical (1750–2014) anthropogenic emissions of reactive gases and aerosols from the Community Emissions Data System (CEDS), Geosci. Model Dev., 11, 369–408, https://doi.org/10.5194/gmd-11-369-2018, 2018. a
Hollaway, M., Wild, O., Yang, T., Sun, Y., Xu, W., Xie, C., Whalley, L., Slater, E., Heard, D., and Liu, D.: Photochemical impacts of haze pollution in an urban environment, Atmos. Chem. Phys., 19, 9699–9714, https://doi.org/10.5194/acp-19-9699-2019, 2019. a
Hong, C., Zhang, Q., Zhang, Y., Davis, S. J., Tong, D., Zheng, Y., Liu, Z., Guan, D., He, K., and Schellnhuber, H. J.: Impacts of climate change on future air quality and human health in China, P. Natl. Acad. Sci. USA, 116, 17193–17200, 2019. a
Hornik, K., Stinchcombe, M., and White, H.: Multilayer feedforward networks are universal approximators, Neural Networks, 2, 359–366, 1989. a
IPCC: Climate Change 2022: Mitigation of Climate Change. Contribution of Working Group III to the Sixth Assessment Report of the Intergovernmental Panel on Climate Change, edited by: Jäger-Waldau, A. and Sapkota, T., IPCC, https://doi.org/10.1017/9781009157926.002, 2022. a
Kong, L., Tang, X., Zhu, J., Wang, Z., Li, J., Wu, H., Wu, Q., Chen, H., Zhu, L., Wang, W., Liu, B., Wang, Q., Chen, D., Pan, Y., Song, T., Li, F., Zheng, H., Jia, G., Lu, M., Wu, L., and Carmichael, G. R.: A 6 year-long (2013–2018) high-resolution air quality reanalysis dataset in China based on the assimilation of surface observations from CNEMC, Earth Syst. Sci. Data, 13, 529–570, https://doi.org/10.5194/essd-13-529-2021, 2021. a, b
LeCun, Y., Bengio, Y., and Hinton, G.: Deep learning, Nature, 521, 436–444, 2015. a
Li, K., Jacob, D. J., Shen, L., Lu, X., De Smedt, I., and Liao, H.: Increases in surface ozone pollution in China from 2013 to 2019: anthropogenic and meteorological influences, Atmos. Chem. Phys., 20, 11423–11433, https://doi.org/10.5194/acp-20-11423-2020, 2020. a
Li, M., Liu, H., Geng, G., Hong, C., Liu, F., Song, Y., Tong, D., Zheng, B., Cui, H., Man, H., Zhang, Q., and He, K.: Anthropogenic emission inventories in China: a review, Natl. Sci. Rev., 4, 834–866, 2017. a
Li, M., Zhang, Q., Zheng, B., Tong, D., Lei, Y., Liu, F., Hong, C., Kang, S., Yan, L., Zhang, Y., Bo, Y., Su, H., Cheng, Y., and He, K.: Persistent growth of anthropogenic non-methane volatile organic compound (NMVOC) emissions in China during 1990–2017: drivers, speciation and ozone formation potential, Atmos. Chem. Phys., 19, 8897–8913, https://doi.org/10.5194/acp-19-8897-2019, 2019. a
Liu, S., Sahu, S. K., Zhang, S., Liu, S., Sun, Y., Liu, X., Xing, J., Zhao, B., Zhang, H., and Wang, S.: Impact of Climate-Driven Land-Use Change on O3 and PM Pollution by Driving BVOC Emissions in China in 2050, Atmosphere-Basel, 13, 1086, https://doi.org/10.3390/atmos13071086, 2022a. a
Liu, Z., Doherty, R. M., Wild, O., Hollaway, M., and O'Connor, F. M.: Contrasting chemical environments in summertime for atmospheric ozone across major Chinese industrial regions: the effectiveness of emission control strategies, Atmos. Chem. Phys., 21, 10689–10706, https://doi.org/10.5194/acp-21-10689-2021, 2021. a, b, c
Liu, Z., Doherty, R. M., Wild, O., O'Connor, F. M., and Turnock, S. T.: Correcting ozone biases in a global chemistry–climate model: implications for future ozone, Atmos. Chem. Phys., 22, 12543–12557, https://doi.org/10.5194/acp-22-12543-2022, 2022a. a, b, c
Liu, Z., Doherty, R. M., Wild, O., O'Connor, F. M., and Turnock, S. T.: Tropospheric ozone changes and ozone sensitivity from the present day to the future under shared socio-economic pathways, Atmos. Chem. Phys., 22, 1209–1227, https://doi.org/10.5194/acp-22-1209-2022, 2022b. a
Mailler, S., Khvorostyanov, D., and Menut, L.: Impact of the vertical emission profiles on background gas-phase pollution simulated from the EMEP emissions over Europe, Atmos. Chem. Phys., 13, 5987–5998, https://doi.org/10.5194/acp-13-5987-2013, 2013. a
Morgenstern, O., Braesicke, P., O'Connor, F. M., Bushell, A. C., Johnson, C. E., Osprey, S. M., and Pyle, J. A.: Evaluation of the new UKCA climate-composition model – Part 1: The stratosphere, Geosci. Model Dev., 2, 43–57, https://doi.org/10.5194/gmd-2-43-2009, 2009. a
Mulcahy, J. P., Johnson, C., Jones, C. G., Povey, A. C., Scott, C. E., Sellar, A., Turnock, S. T., Woodhouse, M. T., Abraham, N. L., Andrews, M. B., Bellouin, N., Browse, J., Carslaw, K. S., Dalvi, M., Folberth, G. A., Glover, M., Grosvenor, D. P., Hardacre, C., Hill, R., Johnson, B., Jones, A., Kipling, Z., Mann, G., Mollard, J., O'Connor, F. M., Palmiéri, J., Reddington, C., Rumbold, S. T., Richardson, M., Schutgens, N. A. J., Stier, P., Stringer, M., Tang, Y., Walton, J., Woodward, S., and Yool, A.: Description and evaluation of aerosol in UKESM1 and HadGEM3-GC3.1 CMIP6 historical simulations, Geosci. Model Dev., 13, 6383–6423, https://doi.org/10.5194/gmd-13-6383-2020, 2020. a
O'Connor, F. M., Johnson, C. E., Morgenstern, O., Abraham, N. L., Braesicke, P., Dalvi, M., Folberth, G. A., Sanderson, M. G., Telford, P. J., Voulgarakis, A., Young, P. J., Zeng, G., Collins, W. J., and Pyle, J. A.: Evaluation of the new UKCA climate-composition model – Part 2: The Troposphere, Geosci. Model Dev., 7, 41–91, https://doi.org/10.5194/gmd-7-41-2014, 2014. a
O'Neill, B. C., Kriegler, E., Riahi, K., Ebi, K. L., Hallegatte, S., Carter, T. R., Mathur, R., and Van Vuuren, D. P.: A new scenario framework for climate change research: the concept of shared socioeconomic pathways, Climatic Change, 122, 387–400, 2014. a
Pacifico, F., Harrison, S. P., Jones, C. D., Arneth, A., Sitch, S., Weedon, G. P., Barkley, M. P., Palmer, P. I., Serça, D., Potosnak, M., Fu, T.-M., Goldstein, A., Bai, J., and Schurgers, G.: Evaluation of a photosynthesis-based biogenic isoprene emission scheme in JULES and simulation of isoprene emissions under present-day climate conditions, Atmos. Chem. Phys., 11, 4371–4389, https://doi.org/10.5194/acp-11-4371-2011, 2011. a
Parrish, D. D., Derwent, R. G., Turnock, S. T., O'Connor, F. M., Staehelin, J., Bauer, S. E., Deushi, M., Oshima, N., Tsigaridis, K., Wu, T., and Zhang, J.: Investigations on the anthropogenic reversal of the natural ozone gradient between northern and southern midlatitudes, Atmos. Chem. Phys., 21, 9669–9679, https://doi.org/10.5194/acp-21-9669-2021, 2021. a
Revell, L. E., Stenke, A., Tummon, F., Feinberg, A., Rozanov, E., Peter, T., Abraham, N. L., Akiyoshi, H., Archibald, A. T., Butchart, N., Deushi, M., Jöckel, P., Kinnison, D., Michou, M., Morgenstern, O., O'Connor, F. M., Oman, L. D., Pitari, G., Plummer, D. A., Schofield, R., Stone, K., Tilmes, S., Visioni, D., Yamashita, Y., and Zeng, G.: Tropospheric ozone in CCMI models and Gaussian process emulation to understand biases in the SOCOLv3 chemistry–climate model, Atmos. Chem. Phys., 18, 16155–16172, https://doi.org/10.5194/acp-18-16155-2018, 2018. a
Sellar, A. A., Jones, C. G., Mulcahy, J. P., Tang, Y., Yool, A., Wiltshire, A., O'Connor, F. M., Stringer, M., Hill, R., Palmieri, J., Woodward, S., de Mora, L., Kuhlbrodt, T., Rumbold, S. T., Kelley, D. I., Ellis, R., Johnson, C. E., Walton, J., Abraham, N. L., Andrews, M. B., Andrews, T., Archibald, A. T., Berthou, S., Burke, E., Blockley, E., Carslaw, K., Dalvi, M., Edwards, J., Folberth, G. A., Gedney, N., Griffiths, P. T., Harper, A. B., Hendry, M. A., Hewitt, A. J., Johnson, B., Jones, A., Jones, C. D., Keeble, J., Liddicoat, S., Morgenstern, O., Parker, R. J., Predoi, V., Robertson, E., Siahaan, A., Smith, R. S., Swaminathan, R., Woodhouse, M. T., Zeng, G., and Zerroukat, M.: UKESM1: Description and evaluation of the UK Earth System Model, J. Adv. Model. Earth Sy., 11, 4513–4558, 2019. a, b
Shi, X., Zheng, Y., Lei, Y., Xue, W., Yan, G., Liu, X., Cai, B., Tong, D., and Wang, J.: Air quality benefits of achieving carbon neutrality in China, Sci. Total Environ., 795, 148784, https://doi.org/10.1016/j.scitotenv.2021.148784, 2021. a
Tay, A.: By the numbers: China's net-zero ambitions, Nature, https://doi.org/10.1038/d41586-022-00802-3, online first, 2022. a
Tong, D., Cheng, J., Liu, Y., Yu, S., Yan, L., Hong, C., Qin, Y., Zhao, H., Zheng, Y., Geng, G., Li, M., Liu, F., Zhang, Y., Zheng, B., Clarke, L., and Zhang, Q.: Dynamic projection of anthropogenic emissions in China: methodology and 2015–2050 emission pathways under a range of socio-economic, climate policy, and pollution control scenarios, Atmos. Chem. Phys., 20, 5729–5757, https://doi.org/10.5194/acp-20-5729-2020, 2020. a
Turnock, S. T., Allen, R. J., Andrews, M., Bauer, S. E., Deushi, M., Emmons, L., Good, P., Horowitz, L., John, J. G., Michou, M., Nabat, P., Naik, V., Neubauer, D., O'Connor, F. M., Olivié, D., Oshima, N., Schulz, M., Sellar, A., Shim, S., Takemura, T., Tilmes, S., Tsigaridis, K., Wu, T., and Zhang, J.: Historical and future changes in air pollutants from CMIP6 models, Atmos. Chem. Phys., 20, 14547–14579, https://doi.org/10.5194/acp-20-14547-2020, 2020. a, b, c
UNEP: Emissions Gap Report 2022: The Closing Window – Climate crisis calls for rapid transformation of societies, https://doi.org/10.18356/9789210023993, 2022. a
van Marle, M. J. E., Kloster, S., Magi, B. I., Marlon, J. R., Daniau, A.-L., Field, R. D., Arneth, A., Forrest, M., Hantson, S., Kehrwald, N. M., Knorr, W., Lasslop, G., Li, F., Mangeon, S., Yue, C., Kaiser, J. W., and van der Werf, G. R.: Historic global biomass burning emissions for CMIP6 (BB4CMIP) based on merging satellite observations with proxies and fire models (1750–2015), Geosci. Model Dev., 10, 3329–3357, https://doi.org/10.5194/gmd-10-3329-2017, 2017. a
Van Vuuren, D. P., Kriegler, E., O'Neill, B. C., Ebi, K. L., Riahi, K., Carter, T. R., Edmonds, J., Hallegatte, S., Kram, T., Mathur, R., and Winkler, H.: A new scenario framework for climate change research: scenario matrix architecture, Climatic Change, 122, 373–386, 2014. a
Walters, D., Baran, A. J., Boutle, I., Brooks, M., Earnshaw, P., Edwards, J., Furtado, K., Hill, P., Lock, A., Manners, J., Morcrette, C., Mulcahy, J., Sanchez, C., Smith, C., Stratton, R., Tennant, W., Tomassini, L., Van Weverberg, K., Vosper, S., Willett, M., Browse, J., Bushell, A., Carslaw, K., Dalvi, M., Essery, R., Gedney, N., Hardiman, S., Johnson, B., Johnson, C., Jones, A., Jones, C., Mann, G., Milton, S., Rumbold, H., Sellar, A., Ujiie, M., Whitall, M., Williams, K., and Zerroukat, M.: The Met Office Unified Model Global Atmosphere 7.0/7.1 and JULES Global Land 7.0 configurations, Geosci. Model Dev., 12, 1909–1963, https://doi.org/10.5194/gmd-12-1909-2019, 2019. a
Wang, T., Xue, L., Feng, Z., Dai, J., Zhang, Y., and Tan, Y.: Ground-level ozone pollution in China: a synthesis of recent findings on influencing factors and impacts, Environ. Res. Lett., 17, 063003, https://doi.org/10.1088/1748-9326/ac69fe, 2022. a
Wang, W., Parrish, D. D., Wang, S., Bao, F., Ni, R., Li, X., Yang, S., Wang, H., Cheng, Y., and Su, H.: Long-term trend of ozone pollution in China during 2014–2020: distinct seasonal and spatial characteristics and ozone sensitivity, Atmos. Chem. Phys., 22, 8935–8949, https://doi.org/10.5194/acp-22-8935-2022, 2022. a
WHO: Global air quality guidelines: particulate matter (PM2.5 and PM10), ozone, nitrogen dioxide, sulfur dioxide and carbon monoxide: executive summary, 2021. a
Wild, O., Fiore, A. M., Shindell, D. T., Doherty, R. M., Collins, W. J., Dentener, F. J., Schultz, M. G., Gong, S., MacKenzie, I. A., Zeng, G., Hess, P., Duncan, B. N., Bergmann, D. J., Szopa, S., Jonson, J. E., Keating, T. J., and Zuber, A.: Modelling future changes in surface ozone: a parameterized approach, Atmos. Chem. Phys., 12, 2037–2054, https://doi.org/10.5194/acp-12-2037-2012, 2012. a, b
Wild, O., Voulgarakis, A., O'Connor, F., Lamarque, J.-F., Ryan, E. M., and Lee, L.: Global sensitivity analysis of chemistry–climate model budgets of tropospheric ozone and OH: exploring model diversity, Atmos. Chem. Phys., 20, 4047–4058, https://doi.org/10.5194/acp-20-4047-2020, 2020. a
Xu, B., Wang, T., Ma, D., Song, R., Zhang, M., Gao, L., Li, S., Zhuang, B., Li, M., and Xie, M.: Impacts of regional emission reduction and global climate change on air quality and temperature to attain carbon neutrality in China, Atmos. Res., 279, 106384, https://doi.org/10.1016/j.atmosres.2022.106384, 2022. a
Young, P. J., Naik, V., Fiore, A. M., Gaudel, A., Guo, J., Lin, M., Neu, J., Parrish, D., Rieder, H., Schnell, J., Tilmes, S., Wild, O., Zhang, L., Ziemke, J., Brandt, J., Delcloo, A., Doherty, R. M., Geels, C., Hegglin, M. I., Hu, L., Im, U., Kumar, R., Luhar, A., Murray, L., Plummer, D., Rodriguez, J., Saiz-Lopez, A., Schultz, M. G., Woodhouse, M. T., and Zeng, G.: Tropospheric Ozone Assessment Report: Assessment of global-scale model performance for global and regional ozone distributions, variability, and trends, Elementa: Science of the Anthropocene, 6, 10, https://doi.org/10.1525/elementa.265, 2018. a
Zanis, P., Akritidis, D., Turnock, S., Naik, V., Szopa, S., Georgoulias, A. K., Bauer, S. E., Deushi, M., Horowitz, L. W., Keeble, J., Sager, P. L., O'Connor, F. M., Oshima, N., Tsigaridis, K., and van Noije, T.: Climate change penalty and benefit on surface ozone: a global perspective based on CMIP6 earth system models, Environ. Res. Lett., 17, 024014, https://doi.org/10.1088/1748-9326/ac4a34, 2022. a, b
Zeng, G., Pyle, J. A., and Young, P. J.: Impact of climate change on tropospheric ozone and its global budgets, Atmos. Chem. Phys., 8, 369–387, https://doi.org/10.5194/acp-8-369-2008, 2008. a
Zhang, Q., Zheng, Y., Tong, D., Shao, M., Wang, S., Zhang, Y., Xu, X., Wang, J., He, H., Liu, W., Ding, Y., Lei, Y., Li, J., Wang, Z., Zhang, X., Wang, Y., Cheng, J., Liu, Y., Shi, Q., Yan, L., Geng, G., Hong, C., Li, M., Liu, F., Zheng, B., Cao, J., Ding, A., Gao, J., Fu, Q., Huo, J., Liu, B., Liu, Z., Yang, F., He, K., and Hao, J.: Drivers of improved PM2.5 air quality in China from 2013 to 2017, P. Natl. Acad. Sci. USA, 116, 24463–24469, 2019. a
- Abstract
- Introduction
- Approach
- Future surface O3 changes in China under net-zero policies
- Drivers of future surface O3 changes in China
- Bias-corrected surface O3 under the net-zero pathway
- Conclusions
- Data availability
- Author contributions
- Competing interests
- Disclaimer
- Acknowledgements
- Financial support
- Review statement
- References
- Supplement