the Creative Commons Attribution 4.0 License.
the Creative Commons Attribution 4.0 License.
Simulating impacts on UK air quality from net-zero forest planting scenarios
Mathew R. Heal
Edward J. Carnell
Stephen Bathgate
Julia Drewer
James I. L. Morison
Massimo Vieno
The UK proposes additional bioenergy plantations and afforestation as part of measures to meet net-zero greenhouse gas emissions, but species and locations are not yet decided. Different tree species emit varying amounts of isoprene and monoterpene volatile organic compounds that are precursors to ozone and secondary organic aerosol (SOA) formation, the latter of which is a component of PM2.5. The forest canopy also acts as a depositional sink for air pollutants. All these processes are meteorologically influenced. We present here a first step in coupling information on tree species planting suitability and other planting constraints with data on UK-specific BVOC emission rates and tree canopy data to simulate, via the WRF-EMEP4UK high spatial-resolution atmospheric chemistry transport model, the impact on UK air quality of four potential scenarios. Our “maximum planting” scenarios are based on planting areas where yields are predicted to be ≥ 50 % of the maximum from the Ecological Site Classification decision support system (ESC DSS) for Eucalyptus gunnii, hybrid aspen (Populus tremula), Italian alder (Alnus cordata) and Sitka spruce (Picea sitchensis). The additional areas of forest in our scenarios are 2.0 to 2.7 times the current suggestions for new bioenergy and afforestation land cover in the UK. Our planting scenarios increase UK annual mean surface ozone concentrations by 1.0 ppb or 3 % relative to the baseline land cover for the highest BVOC-emitting species (e.g. E. gunnii). Increases in ozone reach 2 ppb in summer when BVOC emissions are greatest. In contrast, all the additional planting scenarios lead to reductions in UK annual mean PM2.5 – ranging from −0.2 µg m−3 (−3 %) for Sitka spruce to −0.5 µg m−3 (−7 %) for aspen – revealing that PM2.5 deposition to the additional forest canopy area more than offsets additional SOA formation. Relative decreases in annual mean PM2.5 are greater than the relative increases in annual mean ozone. Reductions in PM2.5 are least in summer, coinciding with the period of maximum monoterpene emissions. Although only a first step in evaluating the impact of increased forest plantation on UK air quality, our study demonstrates the need for locally relevant data on land cover suitability, emissions and meteorology in model simulations.
- Article
(5046 KB) - Full-text XML
-
Supplement
(5003 KB) - BibTeX
- EndNote
Forest areas currently comprise around 3.21 Mha (13 %) of UK land cover. Under suggested measures to meet UK net-zero greenhouse gas emissions by 2050, forested areas could increase by 1.2 to 4.4 Mha (18 %) (Climate Change Committee, 2020). An additional 0.7 Mha of land could also be used to grow bioenergy crops. These could be perennial energy crops (Miscanthus), short-rotation coppice (willow) or short-rotation forest. The latter would likely comprise single-species plantations of fast-growing broadleaf tree species such as aspen, alder and eucalyptus (McKay, 2011). This increased afforestation and bioenergy crop planting has the potential to sequester an additional 14 MtCO2 every year from 2024 (based on planting 30 000 trees annually) (Climate Change Committee, 2020).
In addition to being a sink for CO2, terrestrial vegetation has long been known to emit biogenic volatile organic compounds (BVOCs) (Went, 1960). Explanations for BVOC emissions include being by-products of metabolism, relief from heat stress, defence against herbivory and disease, and communication (Dudareva et al., 2006; Laothawornkitkul et al., 2009). A very important class of BVOCs comprises isoprene (2-methyl-1,3-butadiene) (a hemiterpene) and monoterpenes. These are secondary metabolic products of photosynthesis whose emissions vary predominately in response to changes in light and temperature (Sharkey et al., 1996). Reactions of volatile organic compounds (VOCs) in the atmosphere impact on air quality. In areas with high nitrogen oxide (NOx) concentrations, usually as a result of anthropogenic sources, emissions of additional VOCs lead to increased concentrations of ozone (O3). Ground-level ozone is detrimental to agriculture and natural ecosystems because its toxicity to foliage reduces plant growth and crop yields (Fares et al., 2013; Felzer et al., 2007; Emberson, 2020). It is also a human respiratory pollutant (COMEAP, 2015) and a greenhouse gas (UNEP/WMO, 2011). Other reactions of VOC in the atmosphere, and particularly those of isoprene and monoterpenes, lead to the formation of secondary organic aerosols (SOAs) (Wyche et al., 2014; Carlton et al., 2009). These particles contribute to the substantial negative impact of airborne particulate matter (PM) on human health (WHO, 2013).
Research in the UK on domestic tree planting for carbon sequestration and biomass has previously focused on carbon uptake capacity, land availability, land suitability and biomass yield (Aylott et al., 2008; Tallis et al., 2013; Hastings et al., 2014; Wang et al., 2014). More recent studies have also sought to align locations for bioenergy crops with end-use facilities such as electricity and heat generating stations, particularly those that could be linked with carbon capture and storage capabilities (Albanito et al., 2019; Donnison et al., 2020). However, exactly where in the UK trees will be planted to provide a domestic source of biomass, or as part of afforestation schemes, is still largely undefined. In addition, very few studies have focused on the impacts of forest planting on UK air quality using individual tree species data. Those that have can be divided into three categories: firstly, those that use simple empirical calculations to estimate the increase in UK emissions of a particular atmospheric BVOC (Eller et al., 2012; Graus et al., 2013; Morrison et al., 2016; Purser et al., 2021a, b); secondly, those that extract lower spatial-resolution data on changes to UK air quality from European-scale atmospheric chemistry transport models (ACTMs) (Ashworth et al., 2012, 2015; Porter et al., 2015; Zenone et al., 2016); thirdly, those that use higher spatial-resolution ACTM simulations but simulate arbitrary or only local variations in tree cover (Nemitz et al., 2020; Donovan et al., 2005). An important additional issue is that the magnitude of isoprene and monoterpene emissions varies by orders of magnitude between different tree species and with geographical location due to meteorology, so it is imperative that models use relevant emission data (Bäck et al., 2012; Staudt et al., 2004; Purser et al., 2021b).
Here we improve on what has been undertaken before for the UK by presenting high spatial-resolution (5 km) air quality simulations which use (a) UK-wide afforestation planting scenarios that take account of tree species' ecological suitability data and (b) BVOC emission variables measured in UK bioenergy plantations. The former uses the Ecological Site Classification decision support system (ESC-DSS) to define locations where planting is potentially possible for a given tree species, and the latter uses data for the four tree species of interest – Eucalyptus gunnii, hybrid aspen (Populus tremula L. × P. tremuloides Michx.), Italian alder (Alnus cordata) and Sitka spruce (Picea sitchensis) – from Purser et al. (2021a, b). We use the EMEP4UK ACTM (Simpson et al., 1999a, 2012; Vieno et al., 2010, 2014, 2016). The advantage of an ACTM is that it tracks the full process of emissions, reaction and deposition of chemical components in space and in time, allowing the changes in atmospheric composition to reflect how increases in afforestation change all relevant processes. For example, not only do forests affect BVOC emissions, and hence ozone and SOA formation chemistry, but trees also affect ozone and PM removal via deposition (Nemitz et al., 2020). Trees also enhance the removal of other gaseous components such as NOx and ammonia (NH3), which reduces their contribution to the formation of secondary inorganic aerosol components of PM. Our study is a first step in evaluating the potential impact on UK air quality of large-scale single-species tree planting under potential maximum planting scenarios using relevant measured field data.
2.1 Estimating suitable areas for planting
To determine locations in the UK suitable for afforestation for a given tree species we used the Ecological Site Classification decision support system (ESC-DSS) (Pyatt and Suarez, 1997; Pyatt et al., 2001). In its normal operational mode, ESC-DSS outputs a suitability score as yield potential (%) or as a fraction of yield, for a range of possible tree species at a given location using local variables based on climate (wind, temperature, rainfall), soil moisture regime and soil nutrient regime (Pyatt et al., 2001). However, in this work we used the four pre-selected species of interest to generate planting suitability maps for the whole of the UK based on present climate (Fig. 1). The aspen (Populus tremula L. × P. tremuloides Michx.), eucalyptus (E. gunnii) and alder (Alnus cordata) species used in the scenarios are examples of the successful tree species in UK trials of monoculture forest plantations for bioenergy (Purser et al., 2021b, a). A Sitka spruce (Picea sitchensis) scenario is also included because this species is highly productive and already accounts for 25 % of the forest areas in Great Britain (Forest Research, 2022). ESC-DSS does not cover Northern Ireland, so the tree planting scenarios formulated here are strictly for Great Britain only, but as Northern Ireland comprises < 6 % of the area of the UK, the use of “UK” is retained.
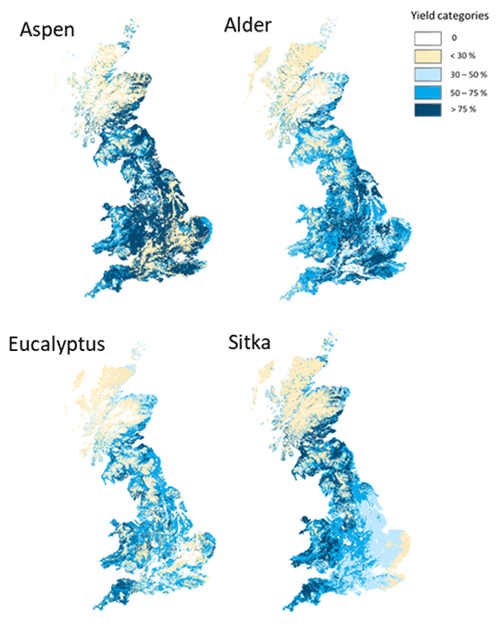
Figure 1Yield maps for aspen, common alder, Eucalyptus gunnii and Sitka spruce, derived from the Ecological Site Classification decision support system for UK meteorology and soils. Locations where yields are ≥ 50 % are shown in dark- and medium-blue colours. Based on data from Forest Research.
The suitability of each 250 m × 250 m grid in ESC-DSS is categorised according to the fraction of the potential for growth or yield for each species into very suitable (≥ 75 %), suitable (50 %–74 %), marginal (30 %–49 %) or unsuitable (< 30 %). Since there was not a complete dataset for Italian alder in ESC-DSS, common alder (Alnus glutinosa) was used as a substitute to generate the alder planting scenario. This is anticipated to have a negligible impact on the planting map since Italian alder has no significant climatic limitations in the UK and can tolerate as broad a range of soil types as common alder (Wilson et al., 2018).
2.2 Application of other planting constraints
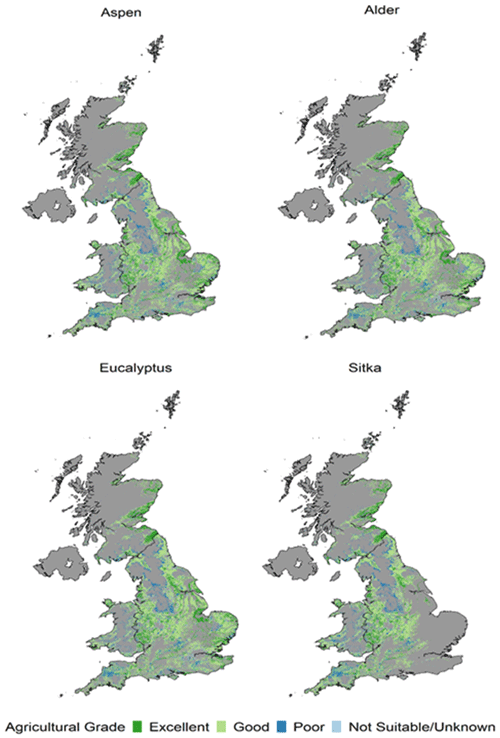
Locations for the expansion of bioenergy crops or afforestation in the UK have been discussed but not yet formalised (House of Commons, 2021) although schemes that encourage tree planting exist (Woodland grants and incentives overview table – GOV.UK, https://www.gov.uk/guidance/woodland-creation-planning-grant, last access: 26 June 2023). The use of low-grade and marginal agricultural land, in particular, has been suggested as most favourable for developing both bioenergy planting and afforestation (Lovett et al., 2014; Thomson et al., 2020). In addition, Lovett et al. (2014) listed the following nine constraints on where bioenergy crops (including short-rotation forests) should not be planted: slopes greater than 15 %; high organic carbon soils; urban areas, roads, rivers, or lakes; existing woodland; cultural heritage sites; designated areas (national parks, areas of outstanding natural beauty); natural and semi-natural habitats; and those areas, which were given high value based on their habitat being similar to areas of outstanding natural beauty and national parks. We layered the constraint map by Lovett et al. (2014) over the species suitability maps (Sect. 2.1) to produce the land cover planting scenarios for each species shown in Fig. 2. Only areas where ESC-DSS predicted tree yields ≥ 50 % of potential for a given species were included in these new planting scenarios. The figure shows that suitability varies spatially, for example, with drier areas in the east being more suitable for aspen than for Sitka.
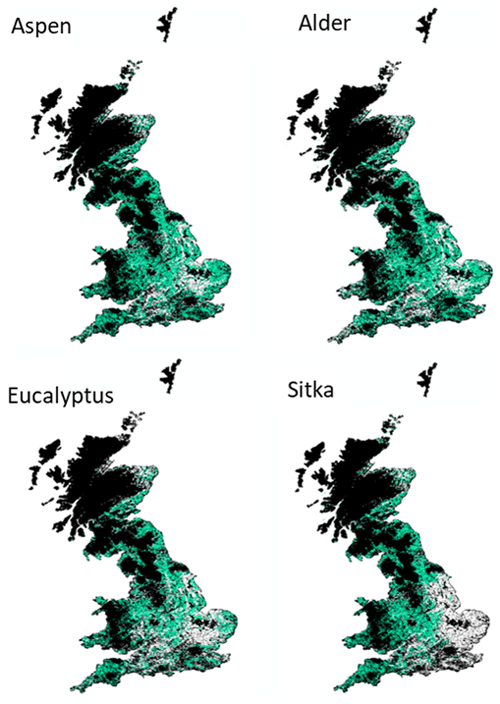
Figure 2Additional SRF planting scenarios developed in this study for aspen, common alder, Eucalyptus gunnii and Sitka spruce, shown in green. These are areas classified as very suitable or suitable (tree yields ≥ 50 %) for that species, whilst also avoiding areas identified by Lovett et al. (2014) where no bioenergy crops could or should be planted, shown in black. White shows areas classified as unsuitable for planting the species (yield < 50 %).
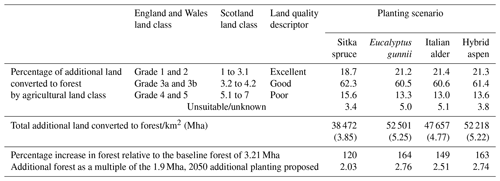
Data in Table 1 show that the increases in forest cover under these potential maximum planting scenarios range between 3.85 Mha for Sitka spruce to 5.35 Mha for E. gunnii. These additional areas correspond to increases of 120 % and 164 %, respectively, on the 2018 baseline forest cover of 3.21 Mha (the latter being 13 % of UK land area). Table 1 also illustrates how the additional forest covers are distributed across the different categories of agricultural land that each scenario replaces. These distributions are very similar: ∼ 20 % of each scenario has replaced excellent-quality agriculture land, ∼ 60 % has replaced good-quality agriculture land, and the remainder has replaced poor, unsuitable or unknown land. However, as noted above, the absolute amounts of each land category converted to forest differ; the distributions of the underlying agricultural land classes replaced in each additional short rotation forest (SRF) planting scenario are shown in Fig. 3. Forest planting on the highest-quality agriculture land is unlikely but is included here to simulate the impacts on air quality from the maximum possible forest cover for these four species in the UK.
Table 1Total additional land cover converted to forest in the four planting scenarios and the proportions of different categories of agricultural land that each scenario replaces. Agricultural land classification systems differ between England and Wales on the one hand and Scotland on the other, so land quality was assigned to one of the three descriptors as excellent, good and poor as specified in the table.
2.3 EMEP4UK model simulations
2.3.1 Baseline model set-up
Simulations were undertaken at 5 km × 6 km horizontal resolution (and hourly temporal resolution) with EMEP4UK ACTM version rv4.34 (Nemitz et al., 2020; Vieno et al., 2010, 2014, 2016). This is a nested version of the EMEP MSC-W model described in Simpson et al. (2012, 2020) in which the higher-resolution UK domain is nested within an extended Europe domain that is simulated at ∼ 50 km × 50 km horizontal resolution. The auxiliary files for this version can be downloaded from GitHub (https://github.com/metno/emep-ctm/releases/tag/rv4_34, last access: 26 June 2023). The EMEP modelling suite is routinely validated against measurements and is widely used for air quality scenario simulations (see, for example, online tools and annual reports at https://www.emep.int/mscw/, last access: 26 June 2023 and Vieno et al., 2014, 2010, 2016). The EMEP4UK model was driven by meteorology from WRF version 4.1.5 (Skamarock et al., 2019), which includes data assimilation (Newtonian nudging) of the numerical weather prediction model meteorological reanalysis from the US National Center for Environmental Prediction (NCEP)/National Center for Atmospheric Research (NCAR) Global Forecast System (GFS) at 1∘ resolution every 6 h (NCEP, 2000). The meteorology used in the baseline and planting scenarios is for 2018.
Anthropogenic emissions of NOx, NH3, SO2, CO, NMVOC (non-methane VOC), PM2.5 and PMCO (coarse particulate matter) for the UK were taken from the 2018 National Atmospheric Emissions Inventory (NAEI, 2020). For the rest of the extended European domain in which the UK domain is nested the official EMEP emissions fields were applied (https://www.ceip.at, last access: 26 June 2023). Emissions of dimethyl sulfide (DMS), lightning and soil NOx, and wind-derived dust and sea salt were set as reported in Simpson et al. (2012, 2020). Vegetation fire emissions were also included (Wiedinmyer et al., 2011), although these very rarely impact atmospheric composition over the UK. Isoprene and other biogenic emissions for the baseline model runs were set as described in Simpson et al. (2012). Dry deposition of gas and aerosol species is simulated utilising deposition velocity as described in Simpson et al. (2012). For wet deposition, all PM2.5 particle components have the same in-cloud wet scavenging ratio and below-cloud size-dependent collection efficiency by raindrops, whilst coarse particles are divided into two groups (coarse sea salt and other coarse particles) with their own sets of parameters (Simpson et al., 2012).
The baseline land cover for the UK was derived by remapping the UKCEH Landcover Map 2007 (LCM2007) (Morton et al., 2011) to the seven existing land cover classes of the EMEP model (deciduous forest, coniferous forest, crops, semi-natural land, water, desert and urban). Elsewhere, the EMEP land cover dataset was used.
2.3.2 Additional planting scenarios model set-up
Since the desert land cover type in the ACTM is redundant for the UK, it was adopted to create a new land cover class to represent the new forest planting areas shown in Fig. 3. The land cover data used by EMEP4UK is at a grid resolution of 0.01 × 0.01∘ (∼ 1 km) resolution with values representing percent cover of each land cover type. The ESC-DSS yield data were converted to the same spatial resolution (0.01∘) and projection system as the land cover data (as percentage per grid cell). These datasets were then combined to estimate a new land cover values. If the yield map for a given model grid is favourable for a given tree species, then it replaces the existing land cover. New forest created is additional forest. Minor variations in percentage coverage of land covers exist between the planting scenarios and the baseline due to projecting the land cover scenarios from the British National Grid to the WGS84 coordinate reference system.
The tree variables used in the model for the new planting scenarios are summarised in Table 2. The leaf area index (LAI) values are those measured in 9-year-old trial SRF stands at East Grange, UK (Purser et al., 2021b) and 8-year-old stands of a regrown short-rotation coppice at Daneshill, UK (Purser et al., 2021a), the same forests in which the BVOC emissions were measured. The biomass density (g m) data are derived from measurements of LAI and leaf mass area as discussed in Purser et al. (2021b). BVOC emissions in the ACTM are driven by the algorithms of Guenther et al. (1993) and Simpson et al. (2012). The standardised mean emission rates for isoprene (Eiso) and total monoterpenes (Emtp) (µg g h−1) given in Table 2 for the four tree species investigated in this work derive from field measurements of the emissions under “real-world” UK conditions as reported in Purser et al. (2021a, b). No appropriate above-canopy flux measurements were available for the tree species in this study. The emissions were therefore based on chamber studies conducted on single-species branches. Further information on the methodology used to derive emission potentials, and a comprehensive comparison with other literature values, is given in Purser et al. (2021). The values for the same model variables and the standardised mean emission rates for different woodland types, grassland and cropland used in the baseline scenario are also given in Table 2 for comparison. In the monoterpene emission algorithm, a different fraction of the emission of an individual monoterpene compound (e.g. α-pinene, d-limonene) may be attributed to a de novo source or a storage pool source. However, in this study the monoterpene emissions from the four tree species investigated were assigned to pool emissions (Emtp) only as no separate light-driven fractions (Emtl) were reported. (The latter are available for existing land cover vegetation.) The EMEP4UK simulations of monoterpene chemistry utilise a “lumped” reaction mechanism in which “total monoterpene” is represented by a single monoterpene (Simpson et al., 2012).
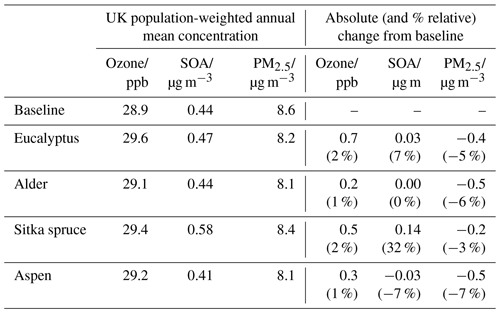
Table 3 presents, for each planting scenario, the changes relative to the baseline in UK total isoprene and monoterpene emissions, together with the simulated changes in UK annual mean surface concentrations of ozone, SOA and PM2.5. (The SOA presented here is SOA produced from UK emissions of VOC and does not include SOA transported from outside the inner model domain.) Each of these changes are discussed in further detail in Sect. 3.1–3.5. Population-weighted annual mean surface concentrations, and their changes, for each planting scenario are given in Table 4. The table shows that the relative changes in UK mean surface concentrations induced by each planting scenario differed little whether expressed as an area mean or as a population-weighted mean.
Table 3Annual UK emissions of isoprene and total monoterpenes and UK annual mean surface concentrations of O3, SOA and PM2.5 for the 2018 baseline and the four additional forest planting scenarios.
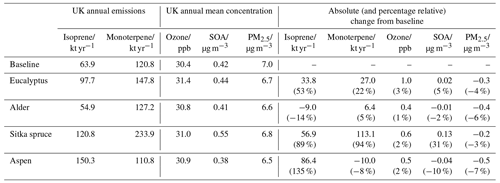
Table 4Population-weighted UK annual mean surface concentrations of O3, SOA and PM2.5 for the 2018 baseline and the four additional forest planting scenarios.
3.1 Changes in isoprene emissions
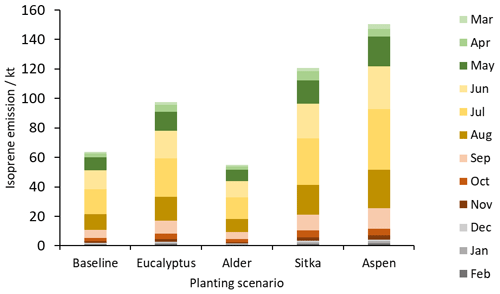
The baseline (2018) annual UK emissions of isoprene are 63.9 kt yr−1 (Table 3), of the same order as the 44 kt yr−1 reported from the JULES land surface model (Hayman et al., 2017). Figure 4 illustrates the magnitude and spatial distributions of UK isoprene emissions for the baseline and the four planting scenarios and the differences between the latter and the former. The baseline emissions are those from the current UK land cover. The highest emissions (in red), which exceed 1800 mg m−2 yr−1, are in the south, where there are existing forests that are dominated by mixed broadleaf species. The broadleaf forest land cover type that is used to represent these forests in the model is assigned an emission potential of 26 µg C g h−1 (Table 2). This value is derived from a weighted sum of emission potentials of species that contribute to this land cover type in the UK, such as oak (Quercus spp.), beech (Fagus spp.), birch (Betula spp.) and ash (Fraxinus spp.), and from aggregated land cover class maps (Köble and Seufert, 2001) because the EMEP land cover scheme cannot currently handle large numbers of tree species (Simpson et al., 1999b, 2012). These broadleaf species represent the range of broadleaf woodlands that can be found in this region of England. In the rest of the UK, isoprene emissions are in the range 800 to 1400 mg m−2 yr−1 (green to orange colours in Fig. 4). The emissions of isoprene in northern England, north Wales, and south and west Scotland are predominately driven by the conifer forests in these parts of the UK. The coniferous woodland land cover type used to represent these areas in the model is assigned an emission potential of 1.7 µg C g h−1, which again represents a weighted sum of individual species emission potentials.
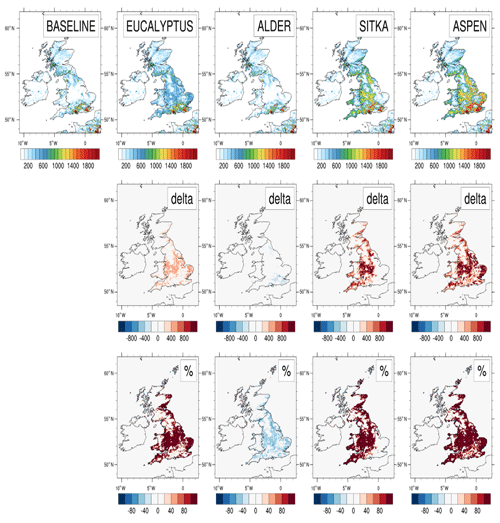
Figure 4Modelled isoprene emissions for current UK land cover (baseline) and for the additional planting scenarios for Eucalyptus gunnii, Italian alder, Sitka spruce and hybrid aspen. Row 1 shows the annual isoprene emissions (mg m−2) for each scenario. Rows 2 and 3, respectively, show the absolute and relative differences between each planting scenario and the baseline, with blue colours representing decreases and red colours representing increases.
Table 3 shows that annual UK isoprene emissions are simulated to increase by 86.4 kt (135 %), 56.9 kt (89 %) and 33.8 kt (53 %) for the aspen, Sitka spruce and eucalyptus planting scenarios, respectively, relative to the baseline isoprene emissions of 63.9 kt yr−1. However, for the alder planting scenario, annual UK isoprene emissions decrease by 9.0 kt to 56.9 kt yr−1 because the isoprene emission potential for alder (0.03 µg m2 h−1) is lower than that of the grassland and agricultural land (both 0.2 µg m2 h−1) that the new planting replaces (Table 2).
For the aspen and Sitka spruce scenarios, isoprene emissions of up to 800–1000 mg m−2 yr−1 are evident in Fig. 4 from the additional forests, particularly in the Midlands and north of England, where conditions to grow these moderately isoprene-emitting species are favourable based on ESC-DSS information. The eucalyptus planting scenario produces only about half the additional isoprene emissions annually compared to the aspen and Sitka spruce scenarios, with emissions of around 400–600 mg m−2 yr−1 in areas where forests are added. There is a decrease in isoprene emissions of up to 200–400 mg m−2 yr−1 relative to the baseline in the alder planting scenario (Fig. 4).
For all tree species, the emissions of isoprene are predominately driven by solar radiation and temperature and the presence of foliage (Monson and Fall, 1989). Consequently, isoprene emissions were highest in July and lowest in December (Fig. 5). (By way of example data, sunshine hours in the UK for summer (June–August) 2018 averaged 625 h compared to 191 h in winter (December–February; Met Office, 2018). Emissions of isoprene in summer account for the majority (63 %) of the annual isoprene emissions in each tree planting scenario. Spring (March–May), autumn (September–November) and winter isoprene emissions account for 20 %, 15 % and 3 % of the annual isoprene emissions, respectively. Maps showing the spatial emissions of isoprene each month and monthly emission data tables are presented in Fig. S1 and Table S1, respectively.
3.2 Changes in total monoterpene emissions
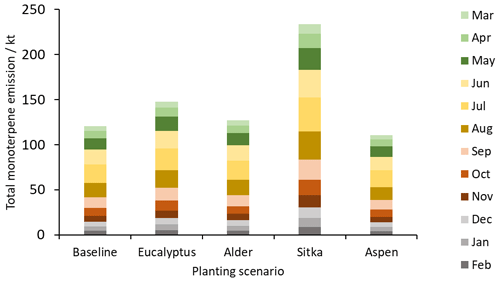
The baseline annual UK total monoterpene emissions are 120.8 kt yr−1(Table 3), comparable with the 125 kt yr−1 reported using the JULES land surface model (Hayman et al., 2017). Annual UK emissions of total monoterpenes are simulated to increase by 113.1 kt (94 %), 27.0 kt (22 %) and 6.4 kt (5 %) relative to the baseline emissions of 120.8 kt yr−1 for the Sitka spruce, eucalyptus and alder planting scenarios, respectively (Table 3). In contrast, total monoterpene emissions for the aspen scenario are simulated to decrease by 10.0 kt yr−1 (8 %) relative to the baseline. The highest monoterpene emissions for the baseline land cover are in Scotland, Wales and a small patch in eastern England. Emissions exceed 1800 mg m−2 in these areas and derive from the presence of conifer plantations.
Figure 6 shows the spatial heterogeneity of the monoterpene emissions across the UK associated with the four planting scenarios. Sitka spruce is a high monoterpene emitter, with monoterpene emissions increasing substantially (1000–1200 mg m−2) in those areas where this scenario replaces existing land cover. The increases in monoterpene emissions in the new planting areas in the eucalyptus scenario are much lower than for the Sitka spruce planting scenario, with increases in the new planting areas of 200–400 mg m−2 relative to the baseline. Changes in absolute monoterpene emissions for the alder scenario are negligible.
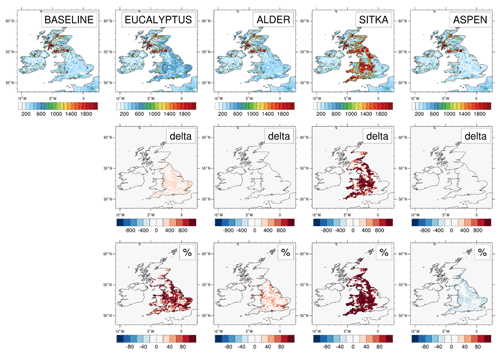
Figure 6Modelled total monoterpene emissions for current UK land cover (baseline) and for the additional planting scenarios for Eucalyptus gunnii, Italian alder, Sitka spruce and hybrid aspen. Row 1 shows the annual total monoterpene emissions (mg m−2) for each scenario. Rows 2 and 3, respectively, show the absolute and relative differences between each planting scenario and the baseline, with blue colours representing decreases and red colours representing increases.
However, even though increases in monoterpene emissions nationally are relatively modest for the eucalyptus and alder planting scenarios (22 % and 5 %, respectively), even for the alder planting scenario local emissions of monoterpene could still increase by more than 20 % in many areas (Fig. 6). For the eucalyptus scenario, local monoterpene emissions would more than double in some areas.
The decrease in monoterpene emissions under the aspen planting scenario arises because aspen has a monoterpene emission potential (0.17 µg m2 h−1) that is lower than those from the grassland (0.2 µg m2 h−1) and agricultural land (0.2 µg m2 h−1) that the tree planting replaces (Table 2). Reductions in monoterpene emissions of up to 40 % occur in areas with new aspen planting (Fig. 6). This is a similar effect to that observed for changes in isoprene emissions in the alder scenario (Fig. 4), when a low BVOC-emitting species replaces higher BVOC-emitting vegetation cover.
Total monoterpene emissions are highest in July and lowest in January for all scenarios (Fig. 7). There is relatively small difference in emissions between the summer months (June–August) because total monoterpene emissions are driven by temperature and average temperatures in the UK for these months are similar. For example, the average UK temperatures in June, July and August 2018 were 14.8, 17.3 and 15.3 ∘C, respectively (Met Office, 2018). Summer contributes most to annual total monoterpene emissions (43 %, seasonal mean temperature 15.8 ∘C), followed by spring and autumn (22 % each, mean temperatures of 8.1 and 9.8 ∘C, respectively) and winter (13 %, 3.6 ∘C). Maps showing the spatial emissions of total monoterpenes each month and monthly emission data tables are presented in Fig. S2 and Table S2, respectively.
3.3 Changes in surface ozone concentrations
Annual mean surface ozone concentrations are simulated to increase slightly in all scenarios of additional afforestation (Fig. 8). The UK-averaged annual mean ozone concentrations increase by 1.0 ppb (3 %), 0.4 ppb (1 %), 0.6 ppb (2 %) and 0.5 ppb (2 %) relative to the baseline UK-averaged concentration of 30.4 ppb for the eucalyptus, alder, Sitka spruce and aspen planting scenarios, respectively (Table 3). Increases in annual mean surface ozone are much larger in some areas than the corresponding UK average (Fig. 8). In the eucalyptus scenario, annual mean ozone is simulated to increase by more than 1 ppb (6 %) over most of England (except in upland areas where eucalyptus cannot be planted) and in small areas in Wales and Scotland (again not in upland areas which are not suitable for eucalyptus) (Fig. 2). The alder and aspen planting scenarios lead to smaller increases in local annual mean ozone, although still reaching 0.6 ppb or more across much of England. The increased ozone in these areas is driven not only by the enhanced BVOC emissions from the additional forest plantings but by the greater anthropogenic NOx emissions (required for ozone production) that are also associated with these higher population density areas of the UK.
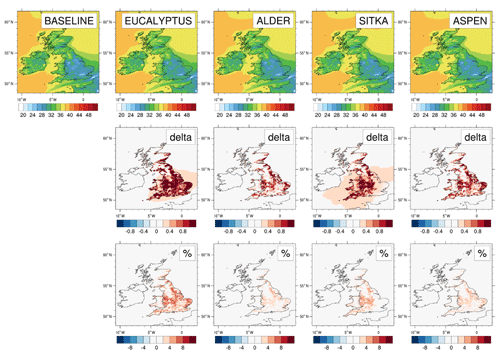
Figure 8Modelled annual mean surface ozone concentrations for current UK land cover and for the additional planting scenarios for Eucalyptus gunnii, Italian alder, Sitka spruce and hybrid aspen. Row 1 shows the ozone concentrations (ppb) for each scenario. Rows 2 and 3, respectively, show the absolute and relative differences between each planting scenario and the baseline, with blue colours representing decreases and red colours representing increases.
Monthly mean ozone concentrations peak in April and May in the UK and then decrease during the summer months and into autumn and winter (Fig. 9). (Monthly versions of the ozone maps shown in Fig. 8 are presented in Table S3.) This annual cycle is driven by many factors including seasonal changes in vegetation (which affects both ozone formation via BVOC emissions and ozone loss via deposition), hemispheric background ozone and ozone transport (AQEG, 2021). The additional tree planting leads to the greatest enhancement of ozone during summer (June–August), reflecting the dominant contribution of isoprene and monoterpene emissions in these months in the planting scenarios (Figs. 5 and 7). The simulations indicate that the impact of additional BVOC emissions on ozone concentrations in summer are larger than the additional canopy depositional sink for ozone. The eucalyptus planting scenario yields the largest changes in ozone concentrations, peaking at 2 ppb in July), presumably a consequence of eucalyptus being both a moderate isoprene and moderate monoterpene emitter.
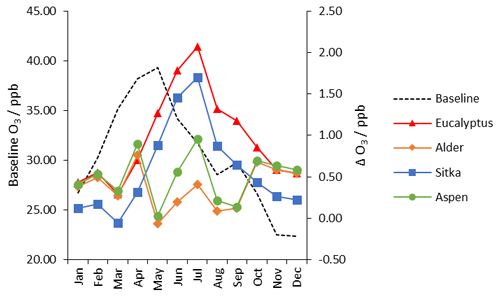
Figure 9Monthly mean UK-averaged concentrations of surface ozone (ppb) for baseline UK land cover (left-hand scale) and the monthly changes in ozone (right-hand scale) under the additional planting scenarios for Eucalyptus gunnii (red line), Italian alder (orange line), Sitka spruce (blue line) and hybrid aspen (green line).
Interestingly, the aspen planting scenario has a lower impact on ozone concentration changes in the summer (only 1 ppb) despite being a higher emitter of isoprene than eucalyptus and Sitka spruce (Table 3 and Fig. 4). Both isoprene and monoterpenes are precursors for the formation of tropospheric ozone, and aspen does not emit monoterpenes, whereas eucalyptus and Sitka spruce are significant emitters of monoterpenes (Table 3 and Fig. 6). Comparison of the aspen and alder scenarios reveals an interesting phenomenon. Although the alder scenario leads to a decrease in isoprene emissions compared with the baseline (Fig. 4), the increased monoterpene emissions from alder (Fig. 6) offset the decreased isoprene emissions to yield similar increases in ozone concentrations overall (Table 3). The reverse is true for the aspen scenario: the effect on ozone of a decrease in monoterpene emissions is more than offset by the increase in isoprene emissions from this species. The comparison of the effect on ozone across these three species (Figs. 8 and 9) therefore indicates the importance of monoterpene emissions as well as isoprene emissions.
These net impacts on ozone concentration are driven not only by the different ozone formation propensities of isoprene and monoterpenes (which in turn are influenced by local NO and NO2 concentrations) but also by the different rates of ozone dry deposition across the different tree species. Our model simulations explicitly include these changes in ozone dry deposition. The relevant variables in the model are the biomass density, leaf area index and tree height. For all four planting scenarios the enhanced chemical production of ozone due to increased BVOC emissions is larger than the loss through increases in ozone dry deposition to the additional forest land cover (Table 3 and Figs. 8 and 9). Aspen has the largest LAI of the four tree species and a wider geographical range for planting; both these factors contribute to a greater depositional sink for ozone to aspen than for the other species and additionally explain why the aspen scenario yields smaller increases in ozone compared with the Sitka spruce and eucalyptus scenarios despite giving rise to large increases in BVOC emissions.
3.4 Changes in surface SOA concentrations
UK-averaged annual mean surface SOA decreases by 0.04 µg m−3 (10 %) and by 0.01 µg m−3 (2 %) relative to the baseline SOA concentration of 0.42 µg m−3 for the planting scenarios involving the two broadleaf species, aspen and alder, respectively (Table 3). In contrast, UK-averaged SOA increases by 0.13 µg m−3 (31 %) and 0.02 µg m−3 (5 %) for the Sitka spruce and eucalyptus scenarios, respectively. Note that the SOA data presented here are SOA derived from UK VOC emissions and do not include SOA derived from outside the UK. Most UK SOA derives from biogenic rather than anthropogenic VOC (Redington and Derwent, 2013), and the main biogenic precursors for SOA formation are monoterpenes. Aspen and alder are relatively low monoterpene emitters (Table 2), whilst eucalyptus and Sitka spruce are medium and high emitters of monoterpenes that contribute more substantially to the formation of SOA. However, the exact impact of a particular species on SOA concentration is the net effect of its roles in SOA formation and deposition.
The spatial distribution of these increases or decreases in SOA are heterogeneous and therefore larger than the annual UK mean for SOA in some cases (Fig. 10). For the eucalyptus scenario there are up to 10 % (0.08 µg m−3) increases in SOA in some locations, whilst for the aspen scenario there are reductions in SOA of up to 10 % (0.08 µg m−3), related to the distribution of new planting (Fig. 3). The Sitka spruce scenario yields the greatest increases in SOA, reaching up to 50 % in central England. As already noted, Sitka spruce is a high emitter of monoterpenes.
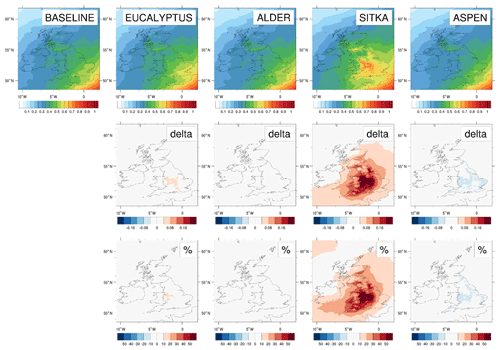
Figure 10Modelled annual mean surface SOA concentrations for current UK land cover and for the additional planting scenarios for Eucalyptus gunnii, Italian alder, Sitka spruce and hybrid aspen. Row 1 shows the SOA concentrations (µg m−3) for each scenario. Rows 2 and 3, respectively, show the absolute and relative differences between each planting scenario and the baseline, with blue colours representing decreases and red colours representing increases.
Monthly mean concentrations of SOA for the baseline (Fig. 11) confirm that, as expected, SOA is greatest during spring and summer, peaking in May (0.32 µg m−3), and negligible in autumn and winter. (Monthly concentration data for the SOA shown in Fig. 11 are presented in Table S5.) For the Sitka spruce planting scenario, additional SOA concentrations relative to the baseline peak in July when the monoterpene emissions are greatest (Fig. 7). This suggests that the planting of high monoterpene emitters could extend the period over which SOA concentrations are at their highest. The eucalyptus scenario follows a similar seasonal trend to the Sitka spruce scenario but the contribution to additional SOA concentration overall is lower. The most benefit of a reduction in SOA concentration is observed in the aspen and alder scenarios when foliage is present in May but when temperatures and monoterpene emissions are relatively low.
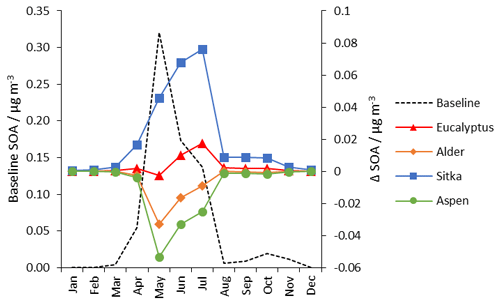
Figure 11Monthly mean UK-averaged concentrations of surface SOA (µg m−3) for baseline UK land cover (left-hand scale) and the monthly changes in SOA (right-hand scale) under the additional planting scenarios for Eucalyptus gunnii (red line), Italian alder (orange line), Sitka spruce (blue line) and hybrid aspen (green line).
3.5 Changes in surface PM2.5 concentrations
In contrast to the situation for ozone, reductions in annual mean surface PM2.5 concentrations relative to the baseline are simulated for all four additional afforestation scenarios (Fig. 12). The UK-averaged annual mean PM2.5 concentrations decrease by 0.3 µg m−3 (4 %), 0.4 µg m−3 (6 %), 0.2 µg m−3 (3 %) and 0.5 µg m−3 (7 %), relative to the baseline concentration of 7.0 µg m−3 for the eucalyptus, alder, Sitka and aspen planting scenarios, respectively (Table 3).
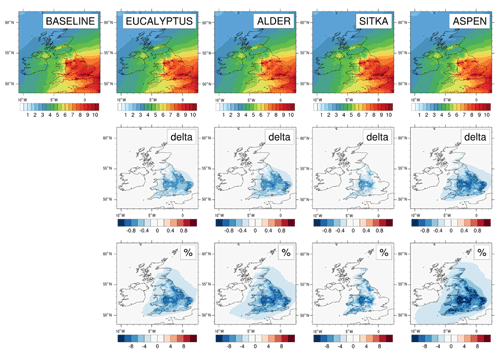
Figure 12Modelled annual mean surface PM2.5 concentrations for current UK land cover and for the additional planting scenarios for Eucalyptus gunnii, Italian alder, Sitka spruce and hybrid aspen. Row 1 shows the PM2.5 concentrations (µg m−3) for each scenario. Rows 2 and 3, respectively, show the absolute and relative differences between each planting scenario and the baseline, with blue colours representing decreases and red colours representing increases.
The decreases in annual mean PM2.5 under the planting scenarios are geographically heterogeneous. Reductions exceeding 0.6 µg m−3 (6 %) are simulated across central and eastern England, particularly under the aspen planting scenario. The spatial distribution of PM2.5 decreases corresponds to the locations of additional afforestation shown in the planting maps (Fig. 2) and is driven by the enhanced dry deposition of particles to the trees relative to the baseline land cover type that the trees have replaced (predominantly agricultural land, Fig. 3). Although the new planting areas for aspen and eucalyptus are of similar magnitude (approx. 52 000 km2) (Table 1) and distributed similarly over the UK (Fig. 2), the differences in PM2.5 deposition are larger for the aspen scenario (Fig. 12) because the modelled aspen area has a LAI double that of eucalyptus, even though the biomass density of eucalyptus is higher than aspen (Table 2). The impact of additional tree cover on PM2.5 via enhanced deposition outweighs new SOA formation from enhanced BVOC emissions (Sect. 3.4).
Baseline monthly PM2.5 concentrations (Fig. 13) display an increase in spring (April–May), which is often observed in the UK and which is related to ammonia emissions from agricultural fertilisation enhancing secondary inorganic aerosol formation and to meteorological conditions promoting long-range transport of PM2.5 from continental Europe (Vieno et al., 2014; Tang et al., 2018). (Monthly concentration data for the PM2.5 map shown in Fig. 12 are presented in Table S4.) In summer, PM2.5 concentrations are lower because combustion-related emissions are lower, higher temperatures promote ammonium nitrate volatilisation, the boundary layer is on average deeper and there is greater dry deposition to tree foliage (AQEG, 2012).
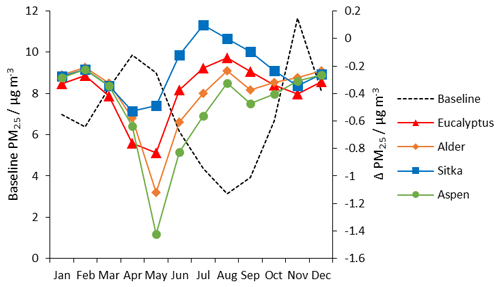
Figure 13Monthly mean UK-averaged concentrations of surface PM2.5 (µg m−3) for baseline UK land cover (left-hand scale) and the monthly changes in PM2.5 (right-hand scale) under the additional planting scenarios for Eucalyptus gunnii (red line), Italian alder (orange line), Sitka spruce (blue line) and hybrid aspen (green line).
The greatest reductions in surface PM2.5 arising from the additional foliage due to tree planting occurs in April and May in all four scenarios (Fig. 13), suggesting afforestation may help to reduce the burden of agricultural contributions to PM2.5. The aspen planting scenario showed the greatest reductions, which is likely due to this tree species having the largest LAI in the model (Table 2). All planting scenarios show reductions in monthly PM2.5 in all months, but reductions in PM2.5 are smallest in July and August. The Sitka spruce scenario shows a slight increase in PM2.5 in July. The trend arises because monoterpene emissions, the precursor to biogenic SOA, are greatest in the summer and Sitka spruce is a particularly large emitter of monoterpene; the greatest monoterpene emissions from Sitka spruce occur in July (Fig. 7), in turn leading to the greatest additional SOA concentrations in July (Fig. 11).
The model scenarios presented suggest the scale of changes in atmospheric composition that may occur across the UK in response to planting substantial areas of land with different tree species as part of measures to meet net-zero greenhouse gas emissions. Proposals for possible pathways to achieve net zero published to date have suggested additional planting of 1.9 Mha through both afforestation and bioenergy schemes (Climate Change Committee, 2020). For this study, however, we deliberately investigated the maximum planting scenarios possible for our four target tree species using only areas that had = > 50 % of potential yield, taking local climate and soil suitability and other land-use constraints into account using an ecological decision model. These scenarios result in additional areas of forest cover (Fig. 2) that are 2 to 2.7 times greater than the 1.9 Mha currently being considered (Table 1). Less extensive planting schemes will lead to smaller changes in atmospheric composition than simulated here but, given that where the planting will occur in the UK is still undecided, our study highlights the spatial relationships between land suitable for new forest and the resultant impacts (via natural and anthropogenic emissions and deposition) on atmospheric composition.
Importantly, we also quantified the amounts of different categories of agricultural land that each planting scenario would replace. We show that in order to provide good productivity only 13 %–16 % (or 0.6–0.8 Mha) of our maximum planting scenarios could take place on land classed as agriculturally “poor” (Table 1). Although this area is comparable to that suggested so far for bioenergy crops, our analysis shows that any additional afforestation would have to displace agricultural land of higher quality. In our species suitability scenarios, the majority (∼ 60 %) of new planting would occur on “good”-quality agricultural land. Our dataset therefore provides important information for decision-making on the locations of land-use change resulting from different extents of new planting (Fig. 3).
In all four of our individual tree species planting scenarios surface ozone concentrations were simulated to increase and surface PM2.5 concentrations to decrease (Table 3). The changes in SOA concentration were dependent upon tree species, with those that were high monoterpene emitters, Sitka spruce in particular, yielding increased SOA (Figs. 10 and 11).
The increases in UK-averaged annual mean ozone were small, ranging between 0.4 and 1.0 ppb (1 % and 3 %), even under these maximum possible tree planting scenarios which contribute large increases in emissions of isoprene and/or monoterpenes (Figs. 4 and 6). In some localities, however, particularly in central and eastern England, where large areas of land were assumed planted in these scenarios and where there are high emissions of anthropogenic NOx, increases in annual mean ozone concentrations of 6 % are simulated. For comparison, previous modelling work by Ashworth et al. (2015) investigating the impact on ozone levels in Europe of a range of poplar hybrids (Populus spp.), and focusing specifically on isoprene emissions, found similar increases in annual mean ozone concentration, although much higher increases in the Mediterranean (12 %–36 %, up to 18 ppb), where higher temperatures drive much higher BVOC emissions. Our simulations also show strong seasonality in the increases in ozone under the planting scenarios (Fig. 9). Under the eucalyptus and Sitka spruce scenarios, UK-averaged monthly mean ozone increases exceed 1.5 ppb in summer (June–August) when BVOC emissions are at their maximum (Figs. 5 and 7). Ozone also dry deposits efficiently to vegetation, but our simulations show that the chemical impact of the enhanced BVOC emissions on ozone formation exceeds the enhanced ozone sink for each species investigated.
Our simulated reductions in UK-averaged annual mean PM2.5 concentrations ranged between 0.2 and 0.5 µg m−3 (3 % and 7 %) (Table 3). However, reductions across much of central and eastern England are larger and exceed 0.6 µg m−3 (6 %). It is clear from our simulations that the increase in PM2.5 due to SOA formed from the additional isoprene and monoterpenes is more than offset by the enhanced deposition of PM2.5 to the additional forest vegetation. Biogenic SOA formation as a result of the simulated large expansion of high monoterpene-emitting tree species such as Sitka spruce could lead to an increase of 0.13 µg m−3 (31 %) in annual mean SOA relative to the baseline UK annual mean SOA concentration of 0.42 µg m−3 (Table 3). However, SOA formation from BVOC sources within the UK remains a relatively minor component of UK PM2.5. For the two species investigated that promote SOA formation, Sitka spruce and eucalyptus, the increase in SOA concentration occurs solely in summer (Fig. 11), coincident with the timing of the monoterpene emissions. In other parts of the year, and for species that are low or zero emitters of monoterpenes, the additional particle deposition sink provided by the additional forest cover leads to net decreases in SOA and PM2.5 overall compared to the baseline land cover. Vegetation differences, such as those driven by biomass density (by leaf area index in particular), are the important determinants in the magnitudes of both isoprene and monoterpene emissions and ozone and PM2.5 depositions.
Localised environmental conditions may result in differences in specific leaf area for a given tree species which then impacts on the leaf mass area that the model uses to calculate the biomass density. In this study, UK-specific field data are used to derive these terms (Purser et al., 2021b). The biomass density numbers we used are comparable to other modelling studies (Keenan et al., 2009). As LAI is dependent on forest structure (which is effected by plantation, density and management, for example) and age, we use values measured in UK bioenergy plantation trials (Purser et al., 2021a, b). The EMEP4UK model does not yet incorporate the differences in small-scale leaf deposition processes for individual tree species beyond differentiating between different land cover types. This should be a consideration for future model developments as different leaf surfaces have different particle capture efficiencies, with coniferous species being the most efficient (Räsänen et al., 2013).
Although we apply a set of constraints on where each of our four species may be planted, we recognise that our planting scenarios, although feasible, are large scale. In reality, land assigned to new forest cover will be smaller and be a mixture of monospecific plantations, as simulated here, and mixed-species woodlands. Other factors such as landowner preference, timber yields, biodiversity considerations, aesthetics and tree species availability will all play a role in what tree species are planted and where in the UK.
Our scenarios are based on UK field data for four tree species already performing well in short-rotation bioenergy trials or, in the case of Sitka spruce, already widely planted; but other species may be planted also. However, the species we use in our simulations are representative of the range of possible impacts that tree species have on atmospheric composition. Thus, our four species span the forest functional types of deciduous broadleaf (aspen and alder), evergreen broadleaf (eucalyptus) and evergreen coniferous (Sitka spruce), which have different impacts on gas and particle deposition. These species also include both low and high emitters of isoprene and monoterpenes. In order to mitigate uncertainties in the emission potentials of isoprene Eiso and monoterpenes Emtp, as well as the temperature, light and humidity dependence of the BVOC emissions, we use data from UK-specific measurements to underpin the model simulations. The default emission potentials for land cover types in the model are not assigned an uncertainty as they are derived from a weighted sum of emission potentials of species based on literature values. All measurements of emission potentials are subject to uncertainties and potentially more so when using plants grown and measured under field conditions. The uncertainties in emission potentials used in this study are given in Table S6. Detailed discussions of these individual uncertainties are given in Purser et al. (2021a and b). Both monoterpene and isoprene emission factors may also be impacted by a range of other variables in the field such as biotic factors, e.g. herbivory or plant disease (Rieksta et al., 2020; Blande et al., 2007); the effect of precipitation; genetic differences within each tree species (van Meeningen et al., 2017; Duncan et al., 2001; Bäck et al., 2012); and flooding, drought and heat stress (Copolovici and Niinemets, 2010; Seco et al., 2015; Bonn et al., 2019). The full range of variables found in the field currently cannot be replicated in the necessarily simplified model environment. It is also possible that the collection of such emission data using the enclosure technique could have an influence on the measured emissions. The ranges in isoprene and monoterpene emissions from our four species also indicate the sensitivity of surface atmospheric composition to uncertainties in BVOC emissions.
A huge diversity of monoterpenes and other BVOCs are emitted from trees in nature, the emissions and subsequent reactions of which can affect atmospheric composition but are not included in atmospheric models (Faiola et al., 2018). Model chemistry schemes are usually simplified to lump monoterpene emissions and chemistry into a total monoterpene function with emissions representing the sum of the most frequently measured monoterpenes in the field such as α-pinene, β-pinene, limonene, myrcene and δ-3-carene. This is the approach used in the EMEP4UK model we used in this study but is also the case in other widely used ACTMs (Monks et al., 2017; Emmons et al., 2020; Arneth et al., 2008). Some chemistry schemes are becoming more advanced (Schwantes et al., 2020) and may produce further insights.
We are interested in the changes in atmospheric composition associated with new forest planting rather than the absolute atmospheric concentrations, so we use the same meteorological year (2018) in our simulations. Interannual differences in temperature, cloudiness and weather patterns will influence the magnitude of BVOC emissions and will also influence other variables affecting UK ozone and PM2.5 each year, such as photolysis rates, wet and dry deposition, boundary-layer height, and long-range transport. However, as an example, although changing, variances in UK annual climate conditions assessed through changes in total rainfall, mean temperature and total sunshine hours over the past 11 years (2011–2021) have been small (relative stand deviation of 9 %, 4 % and 4 %, respectively). Therefore, given that small changes to surface ozone occur in our simulations for 2018 based on large additional forest planting, it may suggest that relative changes to ozone under other meteorological years may be similar (Met Office, 2022). The impact of the planting scenarios on surface PM2.5 has been shown to be dominated by the enhanced deposition to the additional forest canopy, which will be much less influenced by interannual variations in meteorology than the BVOC emissions. Perhaps more relevant to the impacts of forest planting on future atmospheric composition in the UK is the trajectory of UK anthropogenic NOx emissions, which may reduce further under net-zero pathways that include widespread adoption of green electricity. On the one hand, lower NOx emissions can reduce photochemical production of ozone, but on the other they will reduce the chemical loss of ozone. Future climate change itself will also change air quality through many different pathways (Doherty et al., 2017) including that increased surface temperature will increase BVOC emissions and reduce stomatal deposition of ozone (Vieno et al., 2010). For example, Stewart et al. (2003) suggested a 1 ∘C temperature rise would increase summer isoprene emissions in the UK by 14 %. Most of these effects are difficult to quantify and, even where known, are currently beyond incorporation at the high spatial resolution required in regional ACTMs. Hence the simulations presented here are based on current meteorology and emissions in order to concentrate directly on the impact of the forest planting scenarios.
In addition, a substantial proportion of both ozone and PM2.5 in the UK is transboundary in origin (AQEG, 2021, 2013). If continental Europe and elsewhere adopt similar large-scale afforestation, it might be anticipated that the perturbations to UK ozone and PM2.5 simulated here would be magnified.
Increases in ozone are detrimental to crops and vegetation (AQEG, 2021, 2013; Emberson, 2020). Therefore, any increase in ozone, however small, leads to increased adverse human health and ecosystem impacts. Conversely, any decrease in PM2.5 will lead to a decrease in health impact. Table 4 shows that the relative decreases in UK population-weighted annual mean PM2.5 concentrations are greater than the relative increases in UK population-weighted annual mean ozone concentrations across the four scenarios, and Figs. 8 and 12 show that the changes in both predominantly occur in the areas of the UK with greater population density. Given the consensus that health burdens from PM2.5 are greater than from ozone (Cohen et al., 2017), our simulations suggest there could be a net decrease in health burden overall in the UK from these scenarios. However, net health burden is very sensitive to the details of the concentration changes in annual and daily means in locations where people live and on assumed concentration response functions for the full range of adverse health outcomes to both pollutants. This is similar for the quantification of ecosystem impacts from air quality. This detail is well beyond the purpose of this study, whose aim is to present a first simulation of the scale of changes in UK air quality associated with potential planting scenarios of certain tree species being considered for afforestation. Nevertheless, our study shows it is essential that the assessment of additional forest planting in relation to air quality uses atmospheric chemistry transport models that account for the multiple ways forests can impact on atmospheric composition.
The extent, geographical distribution, and species of bioenergy plantations and afforestation that the UK will implement as part of measures to achieve net-zero greenhouse emissions has yet to be resolved. Our study presents a first step in coupling information on tree species planting suitability and other planting constraints with data on UK-specific BVOC emissions and tree canopy data to simulate, via the WRF-EMEP4UK high spatial-resolution atmospheric chemistry transport model, the impact on UK air quality of four potential planting scenarios. We deliberately investigate maximum possible planting scenarios: the additional areas of forest in our scenarios exceed current suggestions for new bioenergy and afforestation land cover in the UK by a factor of 2.0 to 2.7.
Our simulations show that the changes in isoprene and total monoterpene emissions from such widespread new planting of trees slightly increase UK-averaged annual mean surface ozone concentrations by 1.0 ppb or 3 % relative to the baseline for the highest BVOC-emitting tree species such as eucalyptus. Increases in ozone reach 2 ppb in summer when BVOC emissions are greatest. Even planting of minor BVOC-emitting species such as alder results in small increases in ozone. In contrast, the additional planting scenarios lead to reductions in UK-averaged annual mean PM2.5 regardless of the tree species planted, ranging from −0.2 µg m−3 (−3 %) for Sitka spruce to −0.5 µg m−3 (−7 %) for aspen. The decreases in annual mean PM2.5 are of greater relative magnitude than the relative increases in annual mean ozone. Reductions in PM2.5 were greatest in late spring, coinciding with the seasonal maximum in UK PM2.5 concentrations, and least in summer, coinciding with the period of maximum monoterpene emissions. The simulations show that the additional depositional sink for PM2.5 from the additional forest canopy more than offsets additional secondary organic aerosol (SOA) formation. We show how locally relevant tree species data, BVOC emissions potentials and meteorology should, in principle, improve the simulations by atmospheric chemistry transport models of the complex interactions between additional forest planting and impacts on surface atmospheric composition.
This study used two open-source global models: the European Monitoring and Evaluation Programme Meteorological Synthesizing Centre – West atmospheric chemistry transport model (EMEP MSC-W, 2020, source code available at https://doi.org/10.5281/zenodo.3647990) and the Weather Research and Forecasting meteorological model (WRF, version 4, https://doi.org/10.5065/D6MK6B4K, Skamarock et al., 2021). The ESC-DSS model is available at http://www.forestdss.org.uk/geoforestdss/ (last access: 17 October 2023).
The annual and monthly emissions and concentration data are in the Supplement.
The supplement related to this article is available online at: https://doi.org/10.5194/acp-23-13713-2023-supplement.
GP designed the study. SB provided tree species suitability data from ESC-DSS. EJC provided spatial data conversions for model runs and spatial data calculations. MV provided model data using EMEP4UK. GP, MRH and MV contributed to the data interpretation. GP prepared the initial manuscript with input from MRH. GP, MRH, MV, EJC, JD, SB and JILM contributed to the discussion, writing and editing of the article.
The contact author has declared that none of the authors has any competing interests.
Publisher’s note: Copernicus Publications remains neutral with regard to jurisdictional claims made in the text, published maps, institutional affiliations, or any other geographical representation in this paper. While Copernicus Publications makes every effort to include appropriate place names, the final responsibility lies with the authors.
We thank Andrew Lovett for the supply of the land cover constraints raster file.
This research has been supported by the Natural Environment Research Council (grant no. NE/L002558/1). The Forestry Commission contributed to a CASE award through the climate change research programmes of Forest Research. The ongoing development of the WRF-EMEP model used in this work was part of the NERC UK-SCAPE programme delivering National Capability (grant no. NE/R016429/1).
This paper was edited by Drew Gentner and reviewed by two anonymous referees.
Albanito, F., Hastings, A., Fitton, N., Richards, M., Martin, M., Mac Dowell, N., Bell, D., Taylor, S. C., Butnar, I., Li, P. H., Slade, R., and Smith, P.: Mitigation potential and environmental impact of centralized versus distributed BECCS with domestic biomass production in Great Britain, GCB Bioenergy, 11, 1234–1252, https://doi.org/10.1111/gcbb.12630, 2019.
AQEG: Fine Particulate Matter (PM2.5) in the United Kingdom, edited by: Air Quality Expert Group, UK Dartment for Environment, Food and Rural Affairs, London, 191 pp., https://uk-air.defra.gov.uk/assets/documents/reports/cat11/1212141150_AQEG_Fine_Particulate_Matter_in_the_UK.pdf (last access: 17 October 2023), 2012.
AQEG: Mitigation of United Kingdom PM2.5 Concentrations, edited by: Air Quality Expert Group, UK Department for Environment, Food and Rural Affairs, London, https://uk-air.defra.gov.uk/assets/documents/reports/cat11/1508060903_DEF-PB14161_Mitigation_of_UK_PM25.pdf (last access: 17 October 2023), 2013.
AQEG: Report: Ozone in the UK – Recent Trends and Future Projections, edited by: Group, A. Q. E., UK Department for Environment, Food and Rural Affairs, London, 143 pp., https://uk-air.defra.gov.uk/assets/documents/reports/cat09/2112200932_Ozone_in_the_UK_Recent_Trends_and_Future_Projections.pdf (last access: 17 October 2023), 2021.
Arneth, A., Monson, R. K., Schurgers, G., Niinemets, Ü., and Palmer, P. I.: Why are estimates of global terrestrial isoprene emissions so similar (and why is this not so for monoterpenes)?, Atmos. Chem. Phys., 8, 4605–4620, https://doi.org/10.5194/acp-8-4605-2008, 2008.
Ashworth, K., Folberth, G., Hewitt, C. N., and Wild, O.: Impacts of near-future cultivation of biofuel feedstocks on atmospheric composition and local air quality, Atmos. Chem. Phys., 12, 919–939, https://doi.org/10.5194/acp-12-919-2012, 2012.
Ashworth, K., Wild, O., Eller, A. S. D. D., and Hewitt, C. N.: Impact of Biofuel Poplar Cultivation on Ground-Level Ozone and Premature Human Mortality Depends on Cultivar Selection and Planting Location, Environ. Sci. Technol., 49, 8566–8575, https://doi.org/10.1021/acs.est.5b00266, 2015.
Aylott, M. J., Casella, E., Tubby, I., Street, N. R., Smith, P., and Taylor, G.: Yield and spatial supply of bioenergy poplar and willow short-rotation coppice in the UK, New Phytol., 178, 358–370, https://doi.org/10.1111/j.1469-8137.2008.02469.x, 2008.
Bäck, J., Aalto, J., Henriksson, M., Hakola, H., He, Q., and Boy, M.: Chemodiversity of a Scots pine stand and implications for terpene air concentrations, Biogeosciences, 9, 689–702, https://doi.org/10.5194/bg-9-689-2012, 2012.
Blande, J. D., Tiiva, P., Oksanen, E., and Holopainen, J. K.: Emission of herbivore-induced volatile terpenoids from two hybrid aspen (Populus tremula × tremuloides) clones under ambient and elevated ozone concentrations in the field, Glob. Change Biol., 13, 2538–2550, https://doi.org/10.1111/j.1365-2486.2007.01453.x, 2007.
Bonn, B., Magh, R.-K., Rombach, J., and Kreuzwieser, J.: Biogenic isoprenoid emissions under drought stress: different responses for isoprene and terpenes, Biogeosciences, 16, 4627–4645, https://doi.org/10.5194/bg-16-4627-2019, 2019.
Carlton, A. G., Wiedinmyer, C., and Kroll, J. H.: A review of Secondary Organic Aerosol (SOA) formation from isoprene, Atmos. Chem. Phys., 9, 4987–5005, https://doi.org/10.5194/acp-9-4987-2009, 2009.
Climate Change Committee: Land use: Policies for a Net Zero UK, 121 pp., https://www.theccc.org.uk/publication/land-use-policies-for-a-net-zero-uk/ (last access: 21 October 2023), 2020.
Cohen, A. J., Brauer, M., Burnett, R., Anderson, H. R., Frostad, J., Estep, K., Balakrishnan, K., Brunekreef, B., Dandona, L., Dandona, R., Feigin, V., Freedman, G., Hubbell, B., Jobling, A., Kan, H., Knibbs, L., Liu, Y., Martin, R., Morawska, L., Pope, C. A., Shin, H., Straif, K., Shaddick, G., Thomas, M., van Dingenen, R., van Donkelaar, A., Vos, T., Murray, C. J. L., and Forouzanfar, M. H.: Estimates and 25-year trends of the global burden of disease attributable to ambient air pollution: an analysis of data from the Global Burden of Diseases Study 2015, Lancet, 389, 1907–1918, https://doi.org/10.1016/S0140-6736(17)30505-6, 2017.
COMEAP: Quantification of mortality and hospital admissions associated with ground-level ozone, edited by: Committee on the medical effects of air pollutatns, Public Health England, https://www.gov.uk/government/publications/comeap-quantification-of-mortality-and-hospital-admissions-associated-with-ground-level-ozone (last access: 17 October 2023), 2015.
Copolovici, L. and Niinemets, Ü.: Flooding induced emissions of volatile signalling compounds in three tree species with differing waterlogging tolerance, Plant Cell Environ., 33, 1582–1594, https://doi.org/10.1111/j.1365-3040.2010.02166.x, 2010.
Doherty, R. M., Heal, M. R., and O'Connor, F. M.: Climate change impacts on human health over Europe through its effect on air quality, Environ. Health, 16, 118, https://doi.org/10.1186/s12940-017-0325-2, 2017.
Donnison, C., Holland, R. A., Hastings, A., Armstrong, L. M., Eigenbrod, F., and Taylor, G.: Bioenergy with Carbon Capture and Storage (BECCS): Finding the win–wins for energy, negative emissions and ecosystem services – size matters, GCB Bioenergy, 12, 586–604, https://doi.org/10.1111/gcbb.12695, 2020.
Donovan, R. G., Stewart, H. E., Owen, S. M., Mackenzie, A. R., and Hewitt, C. N.: Development and application of an urban tree air quality score for photochemical pollution episodes using the Birmingham, United Kingdom, area as a case study, Environ. Sci. Technol., 39, 6730–6738, https://doi.org/10.1021/es050581y, 2005.
Dudareva, N., Negre, F., Nagegowda, D. A., and Orlova, I.: Plant Volatiles: Recent Advances and Future Perspectives, CRC Cr. Rev. Plant Sci., 25, 417–440, https://doi.org/10.1080/07352680600899973, 2006.
Duncan, A. J., Hartley, S. E., Thurlow, M., Young, S., and Staines, B. W.: Clonal variation in monoterpene concentrations in Sitka spruce (Picea sitchensis) saplings and its effect on their susceptibility to browsing damage by red deer (Cervus elaphus), For Ecol. Manag., 148, 259–269, https://doi.org/10.1016/S0378-1127(00)00540-5, 2001.
Eller, A. S. D., De Gouw, J., Graus, M., and Monson, R. K.: Variation among different genotypes of hybrid poplar with regard to leaf volatile organic compound emissions, Ecol. Appl., 22, 1865–1875, https://doi.org/10.1890/11-2273.1, 2012.
Emberson, L.: Effects of ozone on agriculture, forests and grasslands, Philos. T. R. Soc. A, 378, 20190327, https://doi.org/10.1098/rsta.2019.0327, 2020.
EMEP MSC-W: metno/emep-ctm: OpenSource rv4.34 (202001), Zenodo [code], https://doi.org/10.5281/zenodo.3647990, 2020.
Emmons, L. K., Schwantes, R. H., Orlando, J. J., Tyndall, G., Kinnison, D., Lamarque, J. F., Marsh, D., Mills, M. J., Tilmes, S., Bardeen, C., Buchholz, R. R., Conley, A., Gettelman, A., Garcia, R., Simpson, I., Blake, D. R., Meinardi, S., and Pétron, G.: The Chemistry Mechanism in the Community Earth System Model Version 2 (CESM2), J. Adv. Model. Earth Sy., 12, 1–21, https://doi.org/10.1029/2019MS001882, 2020.
Faiola, C. L., Buchholz, A., Kari, E., Yli-Pirilä, P., Holopainen, J. K., Kivimäenpää, M., Miettinen, P., Worsnop, D. R., Lehtinen, K. E. J., Guenther, A. B., and Virtanen, A.: Terpene Composition Complexity Controls Secondary Organic Aerosol Yields from Scots Pine Volatile Emissions, Sci. Rep., 8, 1–13, https://doi.org/10.1038/s41598-018-21045-1, 2018.
Fares, S., Vargas, R., Detto, M., Goldstein, A. H., Karlik, J., Paoletti, E., and Vitale, M.: Tropospheric ozone reduces carbon assimilation in trees: Estimates from analysis of continuous flux measurements, Glob. Change Biol., 19, 2427–2443, https://doi.org/10.1111/gcb.12222, 2013.
Felzer, B. S., Cronin, T., Reilly, J. M., Melillo, J. M., and Wang, X.: Impacts of ozone on trees and crops, C. R. Geosci., 339, 784–798, https://doi.org/10.1016/j.crte.2007.08.008, 2007.
Forest Research: Forestry Statistics 2022: Chapter 1: Woodland Area & Planting, 60 pp., https://www.forestresearch.gov.uk/tools-and-resources/statistics/forestry-statistics/forestry-statistics-2022/1-woodland-area-planting/ (last access: 17 October 2023), 2022.
Graus, M., Eller, A. S. D., Fall, R., Yuan, B., Qian, Y., Westra, P., de Gouw, J., and Warneke, C.: Biosphere-atmosphere exchange of volatile organic compounds over C4 biofuel crops, Atmos. Environ., 66, 161–168, https://doi.org/10.1016/j.atmosenv.2011.12.042, 2013.
Guenther, A. B., Zimmerman, P. R., Harley, P. C., Monson, R. K., and Fall, R.: Isoprene and monoterpene emission rate variability: model evaluations and sensitivity analyses, J. Geophys. Res., 98, 12609–12617, https://doi.org/10.1029/93jd00527, 1993.
Hastings, A., Tallis, M. J., Casella, E., Matthews, R. W., Henshall, P. A., Milner, S., Smith, P., and Taylor, G.: The technical potential of Great Britain to produce ligno-cellulosic biomass for bioenergy in current and future climates, GCB Bioenergy, 6, 108–122, https://doi.org/10.1111/gcbb.12103, 2014.
Hayman, G., Comyn-Platt, E., Langford, B., and Vieno, M.: Performance of the JULES land surface model for UK biogenic VOC emissions, JULES Annu. Sci. Meet., June, Met Office, Exeter, UK, https://jules.jchmr.org/meetings#2017-06 (last access: 17 October 2023), 2017.
House of Commons: House of Commons Environment, Food and Rural Affairs Committee Tree planting Third Report of Session 2021–22 Report, together with formal minutes relating to the report The Environment, Food and Rural Affairs Committee, 1–48 pp., https://committees.parliament.uk/publications/9364/documents/160849/default/ (last access: 17 October 2023), 2021.
Keenan, T., Niinemets, Ü., Sabate, S., Gracia, C., and Peñuelas, J.: Process based inventory of isoprenoid emissions from European forests: model comparisons, current knowledge and uncertainties, Atmos. Chem. Phys., 9, 4053–4076, https://doi.org/10.5194/acp-9-4053-2009, 2009.
Köble, R. and Seufert, G.: Novel Maps for Forest Tree Species in Europe, Proc. 8th Eur. Symp. Physico-Chemical Behav. Air Pollut. A Chang. Atmos., Torino, Italy, 1–6, https://www.researchgate.net/publication/237596758_Novel_Maps_for_Forest_Tree_Species_in_Europe (last access: 17 October 2023), 2001.
Laothawornkitkul, J., Taylor, J. E., Paul, N. D., and Hewitt, C. N.: Biogenic volatile organic compounds in the Earth system, New Phytol., 183, 27–51, https://doi.org/10.1111/j.1469-8137.2009.02859.x, 2009.
Lovett, A., Sünnenberg, G., and Dockerty, T.: The availability of land for perennial energy crops in Great Britain, GCB Bioenergy, 6, 99–107, https://doi.org/10.1111/gcbb.12147, 2014.
McKay, H.: Short Rotation Forestry: Review of growth and environmental impacts, Forest Research Monograph, 2, Forest Research, Surrey, 212 pp., https://www.forestresearch.gov.uk/publications/short-rotation-forestry-review-of-growth-and-environmental-impacts/ (last access: 17 October 2023), 2011.
Met Office: UK monthly climate summaries, https://digital.nmla.metoffice.gov.uk/SO_f27a7633-70b0-40b0-85ae-6fa9860b292a/ (last access: 17 October 2023), 2018.
Met Office: UK and regional climate series, https://www.metoffice.gov.uk/research/climate/maps-and-data/uk-and-regional-series (last access: 17 October 2023), 2022.
Monks, S. A., Arnold, S. R., Hollaway, M. J., Pope, R. J., Wilson, C., Feng, W., Emmerson, K. M., Kerridge, B. J., Latter, B. L., Miles, G. M., Siddans, R., and Chipperfield, M. P.: The TOMCAT global chemical transport model v1.6: description of chemical mechanism and model evaluation, Geosci. Model Dev., 10, 3025–3057, https://doi.org/10.5194/gmd-10-3025-2017, 2017.
Monson, R. K. and Fall, R.: Isoprene emission from aspen leaves: influence of environment and relation to photosynthesis and photorespiration, Plant Physiol., 90, 267–74, https://doi.org/10.1104/pp.90.1.267, 1989.
Morrison, E. C., Drewer, J., and Heal, M. R.: A comparison of isoprene and monoterpene emission rates from the perennial bioenergy crops short-rotation coppice willow and Miscanthus and the annual arable crops wheat and oilseed rape, GCB Bioenergy, 8, 211–225, https://doi.org/10.1111/gcbb.12257, 2016.
Morton, R. D., Rowland, C., Wood, C., Meek, L., Marston, G., Smith, G., Wadsworth, R., and Simpson, I.: Land Cover Map 2007 (1 km percentage target class, GB), NERC Environ. Inf. Data Cent., https://doi.org/10.5285/fdf8c8d3-5998-45a5-8431-7f5e6302fc32, 2011.
NAEI: UK NAEI – National Atmospheric Emissions Inventory [Online], National Atmospheric Emissions Inventory for 2018, Crown 2022 Copyr. Defra BEIS via https://naei.beis.gov.uk/data/ (last access: 17 October 2023), Licenc. under Open Gov. Licence, 2020.
NCEP: NCEP FNL Operational Model Global Tropospheric Analyses, continuing from July 1999, https://doi.org/10.5065/D6M043C6, 2000.
Nemitz, E., Vieno, M., Carnell, E., Fitch, A., Steadman, C., Cryle, P., Holland, M., Morton, R. D., Hall, J., Mills, G., Hayes, F., Dickie, I., Carruthers, D., Fowler, D., Reis, S., and Jones, L.: Potential and limitation of air pollution mitigation by vegetation and uncertainties of deposition-based evaluations: Air pollution mitigation by vegetation, Philos. T. R. Soc. A, 378, 2183, https://doi.org/10.1098/rsta.2019.0320, 2020.
Porter, W. C., Rosenstiel, T. N., Guenther, A., Lamarque, J. F., and Barsanti, K.: Reducing the negative human-health impacts of bioenergy crop emissions through region-specific crop selection, Environ. Res. Lett., 10, 054004, https://doi.org/10.1088/1748-9326/10/5/054004, 2015.
Purser, G., Drewer, J., Morison, J. I. L., and Heal, M. R.: A first assessment of the sources of isoprene and monoterpene emissions from a short-rotation coppice Eucalyptus gunnii bioenergy plantation in the UK, Atmos. Environ., 262, 118617, https://doi.org/10.1016/j.atmosenv.2021.118617, 2021a.
Purser, G., Drewer, J., Heal, M. R., Sircus, R. A. S., Dunn, L. K., and Morison, J. I. L.: Isoprene and monoterpene emissions from alder, aspen and spruce short-rotation forest plantations in the United Kingdom, Biogeosciences, 18, 2487–2510, https://doi.org/10.5194/bg-18-2487-2021, 2021b.
Pyatt, D. G. and Suarez, J. C.: An ecological site classification for forestry in Great Britain with special reference to Grampian, Scotland, Technical paper 20, Forestry Commission Edinburgh, https://www.forestresearch.gov.uk/publications/archive-an-ecological-site-classification-for-forestry-in-great-britain-with-special-reference-to-grampian-scotland/ (last access: 17 October 2023), 1997.
Pyatt, G., Ray, D., and Fletcher, J.: Forestry Commission Bulletin: An ecological site classification for forestry in Great Britain, Bulletin 124. Forestry Commission, Edinburgh, https://cdn.forestresearch.gov.uk/2001/03/fcbu124.pdf (last access: 17 October 2023), 2001.
Räsänen, J. V, Holopainen, T., Joutsensaari, J., Ndam, C., Pasanen, P., Rinnan, Å., and Kivimäenpää, M.: Effects of species-specific leaf characteristics and reduced water availability on fine particle capture efficiency of trees, Environ. Pollut., 183, 64–70, https://doi.org/10.1016/j.envpol.2013.05.015, 2013.
Rieksta, J., Li, T., Junker, R. R., Jepsen, J. U., Ryde, I., and Rinnan, R.: Insect Herbivory Strongly Modifies Mountain Birch Volatile Emissions. Front. Plant Sci., 11, https://doi.org/10.3389/fpls.2020.558979, 2020.
Redington, A. L. and Derwent, R. G.: Modelling secondary organic aerosol in the United Kingdom, Atmos. Environ., 64, 349–357, https://doi.org/10.1016/j.atmosenv.2012.09.074, 2013.
Schwantes, R. H., Emmons, L. K., Orlando, J. J., Barth, M. C., Tyndall, G. S., Hall, S. R., Ullmann, K., St. Clair, J. M., Blake, D. R., Wisthaler, A., and Bui, T. P. V.: Comprehensive isoprene and terpene gas-phase chemistry improves simulated surface ozone in the southeastern US, Atmos. Chem. Phys., 20, 3739–3776, https://doi.org/10.5194/acp-20-3739-2020, 2020.
Seco, R., Karl, T., Guenther, A., Hosman, K. P., Pallardy, S. G., Gu, L., Geron, C., Harley, P., and Kim, S.: Ecosystem-scale volatile organic compound fluxes during an extreme drought in a broadleaf temperate forest of the Missouri Ozarks (central USA), Glob. Change Biol., 21, 3657–3674, https://doi.org/10.1111/gcb.12980, 2015.
Sharkey, T. D., Singsaas, E. L., Vanderveer, P. J., and Geron, C.: Field measurements of isoprene emission from trees in response to temperature and light, Tree Physiol., 16, 649–654, https://doi.org/10.1093/treephys/16.7.649, 1996.
Simpson, D., Winiwarter, W., Börjesson, G., Cinderby, S., Ferreiro, A., Guenther, A., Hewitt, C. N., Janson, R., Khalil, M. A. K., Owen, S., Pierce, T. E., Puxbaum, H., Shearer, M., Skiba, U., Steinbrecher, R., Tarrasón, L., and Öquist, M. G.: Inventorying emissions from nature in Europe, J. Geophys. Res.-Atmos., 104, 8113–8152, https://doi.org/10.1029/98JD02747, 1999a.
Simpson, D., Winiwarter, W., Börjesson, G., Cinderby, S., Ferreiro, A., Guenther, A., Hewitt, C. N., Janson, R., Khalil, M. A. K., Owen, S., Pierce, T. E., Puxbaum, H., Shearer, M., Skiba, U., Steinbrecher, R., Tarrasón, L., and Öquist, M. G.: Inventorying emissions from nature in Europe, J. Geophys. Res.-Atmos., 104, 8113–8152, https://doi.org/10.1029/98JD02747, 1999b.
Simpson, D., Benedictow, A., Berge, H., Bergström, R., Emberson, L. D., Fagerli, H., Flechard, C. R., Hayman, G. D., Gauss, M., Jonson, J. E., Jenkin, M. E., Nyíri, A., Richter, C., Semeena, V. S., Tsyro, S., Tuovinen, J.-P., Valdebenito, Á., and Wind, P.: The EMEP MSC-W chemical transport model – technical description, Atmos. Chem. Phys., 12, 7825–7865, https://doi.org/10.5194/acp-12-7825-2012, 2012.
Simpson, D., Bergström, R., Briolat, A., Imhof, H., Johansson, J., Priestley, M., and Valdebenito, A.: GenChem v1.0 – a chemical pre-processing and testing system for atmospheric modelling, Geosci. Model Dev., 13, 6447–6465, https://doi.org/10.5194/gmd-13-6447-2020, 2020.
Skamarock, W. C., Klemp, J. B., Dudhia, J., Gill, D. O., Liu, Z., Berner, J., Wang, W., Powers, J. G., Duda, M. G., Barker, D. M., and Huang, X.-Y.: A Description of the Advanced Research WRF Version 4, NCAR Tech. Note NCAR/TN-556+STR, 145 pp., https://doi.org/10.5065/1dfh-6p97, 2019.
Skamarock, W. C., Klemp, J. B., Dudhia, J. B., Gill, D. O., Barker, D. M., Duda, M. G., Huang, X.-Y., Wang, W., and Powers, J. G.: A Description of the Advanced Research WRF Model Version 4.3 (No. NCAR/TN-556+STR), 148 pp., https://doi.org/10.5065/1dfh-6p97, 2021 (code available at: https://doi.org/10.5065/D6MK6B4K).
Staudt, M., Mir, C., Joffre, R., Rambal, S., Bonin, A., Landais, D., and Lumaret, R.: Stands and Mixed Contrasting Interspecific Genetic Introgression, New Phytol., 163, 573–584, 2004.
Stewart, H. E., Hewitt, C. N., Bunce, R. G. H., Steinbrecher, R., Smiatek, G., and Schoenemeyer, T.: A highly spatially and temporally resolved inventory for biogenic isoprene and monoterpene emissions: Model description and application to Great Britain, J. Geophys. Res.-Atmos., 108, 4644, https://doi.org/10.1029/2002JD002694, 2003.
Tallis, M. J., Casella, E., Henshall, P. A., Aylott, M. J., Randle, T. J., Morison, J. I. L., and Taylor, G.: Development and evaluation of ForestGrowth-SRC a process-based model for short rotation coppice yield and spatial supply reveals poplar uses water more efficiently than willow, GCB Bioenergy, 5, 53–66, https://doi.org/10.1111/j.1757-1707.2012.01191.x, 2013.
Tang, Y. S., Braban, C. F., Dragosits, U., Simmons, I., Leaver, D., van Dijk, N., Poskitt, J., Thacker, S., Patel, M., Carter, H., Pereira, M. G., Keenan, P. O., Lawlor, A., Conolly, C., Vincent, K., Heal, M. R., and Sutton, M. A.: Acid gases and aerosol measurements in the UK (1999–2015): regional distributions and trends, Atmos. Chem. Phys., 18, 16293–16324, https://doi.org/10.5194/acp-18-16293-2018, 2018.
Thomson, A., Evans, C., Buys, G., and Clilverd, H.: Updated quanification of the impact of future land use scenarios to 2050 and beyond – Final report, Edinburgh, 1–75 pp., https://www.theccc.org.uk/publication/updated-quantification-of-the-impact-of-future-land-use-scenarios-to-2050-and-beyond-uk-centre-for-ecology-and-hydrology/ (last access: 17 October 2023), 2020.
UNEP/WMO: Integrated Assessment of Black Carbon and Tropospheric Ozone, United Nations Environment Programme and World Meteorological Organisation, https://www.ccacoalition.org/en/resources/integrated-assessment-black-carbon-and-tropospheric-ozone (last access: 17 October 2023), ISBN 92-807-3141-6, 2011.
van Meeningen, Y., Wang, M., Karlsson, T., Seifert, A., Schurgers, G., Rinnan, R., and Holst, T.: Isoprenoid emission variation of Norway spruce across a European latitudinal transect, Atmos. Environ., 170, 45–57, https://doi.org/10.1016/j.atmosenv.2017.09.045, 2017.
Vieno, M., Dore, A. J., Stevenson, D. S., Doherty, R., Heal, M. R., Reis, S., Hallsworth, S., Tarrason, L., Wind, P., Fowler, D., Simpson, D., and Sutton, M. A.: Modelling surface ozone during the 2003 heat-wave in the UK, Atmos. Chem. Phys., 10, 7963–7978, https://doi.org/10.5194/acp-10-7963-2010, 2010.
Vieno, M., Heal, M. R., Hallsworth, S., Famulari, D., Doherty, R. M., Dore, A. J., Tang, Y. S., Braban, C. F., Leaver, D., Sutton, M. A., and Reis, S.: The role of long-range transport and domestic emissions in determining atmospheric secondary inorganic particle concentrations across the UK, Atmos. Chem. Phys., 14, 8435–8447, https://doi.org/10.5194/acp-14-8435-2014, 2014.
Vieno, M., Heal, M. R., Williams, M. L., Carnell, E. J., Nemitz, E., Stedman, J. R., and Reis, S.: The sensitivities of emissions reductions for the mitigation of UK PM2.5, Atmos. Chem. Phys., 16, 265–276, https://doi.org/10.5194/acp-16-265-2016, 2016.
Wang, S., Hastings, A., Wang, S., Sunnenberg, G., Tallis, M. J., Casella, E., Taylor, S., Alexander, P., Cisowska, I., Lovett, A., Taylor, G., Firth, S., Moran, D., Morison, J., and Smith, P.: The potential for bioenergy crops to contribute to meeting GB heat and electricity demands, GCB Bioenergy, 6, 136–141, https://doi.org/10.1111/gcbb.12123, 2014.
Went, F. W.: Blue Hazes in the Atmosphere, Nature, 187, 641–643, https://doi.org/10.1038/187641a0, 1960.
WHO: Review of evidence on health aspects of air pollution – REVIHAAP Project, Technical Report, World Health Organization Regional Office for Europe 2013, Pollut. Atmos., https://www.ncbi.nlm.nih.gov/books/NBK361805/ (last access: 17 October 2023), 2013.
Wiedinmyer, C., Akagi, S. K., Yokelson, R. J., Emmons, L. K., Al-Saadi, J. A., Orlando, J. J., and Soja, A. J.: The Fire INventory from NCAR (FINN): a high resolution global model to estimate the emissions from open burning, Geosci. Model Dev., 4, 625–641, https://doi.org/10.5194/gmd-4-625-2011, 2011.
Wilson, S. M., Mason, B., Savill, P., and Jinks, R.: Non-native alder species (Alnus spp.), Q. J. Forest., 112, 163–174, 2018.
Wyche, K. P., Ryan, A. C., Hewitt, C. N., Alfarra, M. R., McFiggans, G., Carr, T., Monks, P. S., Smallbone, K. L., Capes, G., Hamilton, J. F., Pugh, T. A. M., and MacKenzie, A. R.: Emissions of biogenic volatile organic compounds and subsequent photochemical production of secondary organic aerosol in mesocosm studies of temperate and tropical plant species, Atmos. Chem. Phys., 14, 12781–12801, https://doi.org/10.5194/acp-14-12781-2014, 2014.
Zenone, T., Hendriks, C., Brilli, F., Fransen, E., Gioli, B., Portillo-Estrada, M., Schaap, M., and Ceulemans, R.: Interaction between isoprene and ozone fluxes in a poplar plantation and its impact on air quality at the European level, Sci. Rep., 6, 1–9, https://doi.org/10.1038/srep32676, 2016.


