the Creative Commons Attribution 4.0 License.
the Creative Commons Attribution 4.0 License.
 | 23 Oct 2023
Stratospheric ozone depletion inside the volcanic plume shortly after the 2022 Hunga Tonga eruption
Robert W. Portmann
Douglas Kinnison
Owen Brian Toon
Luis Millán
Jun Zhang
Holger Vömel
Simone Tilmes
Charles G. Bardeen
Xinyue Wang
Stephanie Evan
William J. Randel
Karen H. Rosenlof
Near-term in-plume ozone depletion was observed for about 10 d by the Aura Microwave Limb Sounder (MLS) right after the January 2022 Hunga Tonga–Hunga Ha'apai (HTHH) eruption. This work analyzes the dynamic and chemical causes of this ozone depletion. The results show that the large water injection (∼ 150 Tg) from the HTHH eruption, with ∼ 0.0013 Tg injection of ClO (or ∼ 0.0009 Tg of HCl), causes ozone loss due to strongly enhanced HOx and ClOx cycles and their interactions. Aside from the gas-phase chemistry, the heterogeneous reaction rate for HOCl + HCl → Cl2 + H2O increases to 104 cm−3 s−1 and is a major cause of chlorine activation, making this event unique compared with the springtime polar ozone depletion where HCl + ClONO2 is more important. The large water injection causes relative humidity over ice to increase to 70 %–100 %, decreases the H2SO4 H2O binary solution weight percent to 35 % compared with the 70 % ambient value, and decreases the plume temperature by 2–6 K. These changes lead to high heterogeneous reaction rates. Plume lofting of ozone-poor air is evident during the first 2 d after the eruption, but ozone concentrations quickly recover because its chemical lifetime is short at 20 hPa. With such a large seawater injection, we expect that ∼ 5 Tg Cl was lifted into the stratosphere by the HTHH eruption in the form of NaCl, but only ∼ 0.02 % of that remained as active chlorine in the stratosphere. Lightning NOx changes are probably not the reason for the HTHH initial in-plume O3 loss.
- Article
(8695 KB) - Full-text XML
- BibTeX
- EndNote


Stratospheric ozone concentrations change after volcanic eruptions for a variety of reasons. Enhanced polar ozone depletion occurs after large or medium volcanic eruptions (Hofmann and Oltmans, 1993; Portmann et al., 1996; Solomon et al., 2016) because heterogeneous reactions on volcanically enhanced sulfate aerosols result in amplified anthropogenic ClOx- and BrOx-induced ozone loss. Tie and Brasseur (1995) demonstrated that mid- and high-latitude O3 changes after a volcanic eruption largely depend on chlorine loading. For the preindustrial era and in the absence of anthropogenic halogens in the stratosphere, O3 would slightly increase in the middle atmosphere after a large volcanic eruption due to the suppression of NOx-catalyzed destruction by the heterogenous creation of HNO3 on volcanic aerosols. After the 1991 Pinatubo eruption, the radiative heating caused by volcanic aerosols perturbed the local temperature and circulation, which lifted the ozone layer and caused equatorial ozone depletion (Kinnison et al., 1994). Wang et al. (2022) reported that, in the case of the Hunga-Tonga eruption, mid-latitude ozone reduction was primarily caused by anomalous upwelling. Enhanced water can also change O3. In the lowermost stratosphere, H2O injection through deep convection or tropopause cirrus clouds could change the catalytic chlorine and/or bromine free-radical chemistry and shift the total available inorganic chlorine towards the catalytically active free-radical form, ClO (Solomon et al., 1997; Anderson et al., 2012).
Evan et al. (2023) report observations of decreased O3 and HCl and increased ClO in the first week following the Hunga Tonga–Hunga Ha'apai (HTHH) eruption at 20 hPa; these observations are related to the injected H2O exceeding the normal range of the stratospheric variability. Here, we use the Whole Atmosphere Community Climate Model version 6 (WACCM6; Zhu et al., 2022) to analyze the dynamic and chemical contributors to this initial in-plume ozone depletion and to understand the climate model performance. A lofting plume can bring ozone-poor tropospheric air into the stratosphere and cause in-plume low ozone values compared with the surrounding stratospheric air (Yu et al., 2019). For a submarine volcanic eruption, the in-plume air composition is not only impacted by tropospheric air but also by the seawater and volcanic gases (including H2O, CO2, SO2, HCl, HF, H2S, S2, H2, CO, and SiF4.) and volcanic minerals. For the HTHH initial plume, besides high H2O and high SO2, Microwave Limb Sounder (MLS) observations indicate that the in-plume air carried high CO (Fig. A1), relatively low ozone, and high ClO compared with the surrounding air. We constrain the initial plume chemical compounds based on observational data from the MLS and then analyze how stratospheric chemistry changes the plume composition. We will answer the following scientific questions:
-
What are the initial conditions in the volcanic plume?
-
What are the main causes of in-plume ozone depletion?
-
How do volcanic injections impact heterogeneous reactions that cause chlorine activation in the plume?
The MLS instrument aboard the Earth Observing System (EOS) Aura satellite was launched into a near-polar Sun-synchronous orbit in 2004. This work uses the MLS version 4 product for O3, ClO, temperature, and CO data during the first 10 d after the eruption, as recommended by Millán et al. (2022). The vertical resolution of these MLS products is typically around 3–5 km in the stratosphere. All data used here were screened using the methodology indicated in Livesey et al. (2022). We use the MLS H2O data to identify the plume location and define it as regions with water vapor concentrations higher than 10 ppmv.
Vömel et al. (2022a) provide water vapor radiosonde measurements during the first three global circumnavigations of the plume. Here, we calculate the relative humidity with respect to ice (RHi) and compare the observed values with the simulated values.
We use the 70-layer WACCM model as described in Zhu et al. (2022), injecting SO2 (0.42 Tg) and H2O (150 Tg). The model has a horizontal resolution of 0.9∘ × 1.25∘ (latitude × longitude. The injection plume in the model includes about 40 grid points. The model's vertical resolution is about 1 km in the stratosphere. The model atmosphere is nudged to the Goddard Earth Observing System version 5 (GEOS-5) Modern-Era Retrospective analysis for Research and Applications (MERRA) meteorological analysis (Rienecker et al., 2008) until 14 January, 1 d before the eruption day. After 15 January, we run the model freely with a fully interactive atmosphere and ocean for 10 d.
We constrain the simulated volcanic aerosol, H2O, and chlorine via comparison to observations during the first 10 d after the eruption. Zhu et al. (2022) show that the simulated aerosol backscatter coefficient agrees with observations from the Cloud-Aerosol Lidar and Infrared Pathfinder Satellite Observations (CALIPSO) satellite on 17 January. The simulated H2O agrees with the MLS (Millán et al., 2022; Zhu et al., 2022) from 1 February to 1 April 2022. Here, we compare the simulated H2O with the radiosonde observations of humidity (Vömel et al., 2022a) during the first week. Figure 1 shows the RHi on 18 and 19 January observed by the radiosonde and from nearby simulated model output. Both the observations and simulations show a relative humidity of between 70 % and 100 %. The radiosonde observations have a much higher vertical resolution than the model. Therefore, they show multiple layers of water enhancement, whereas the model only shows one.
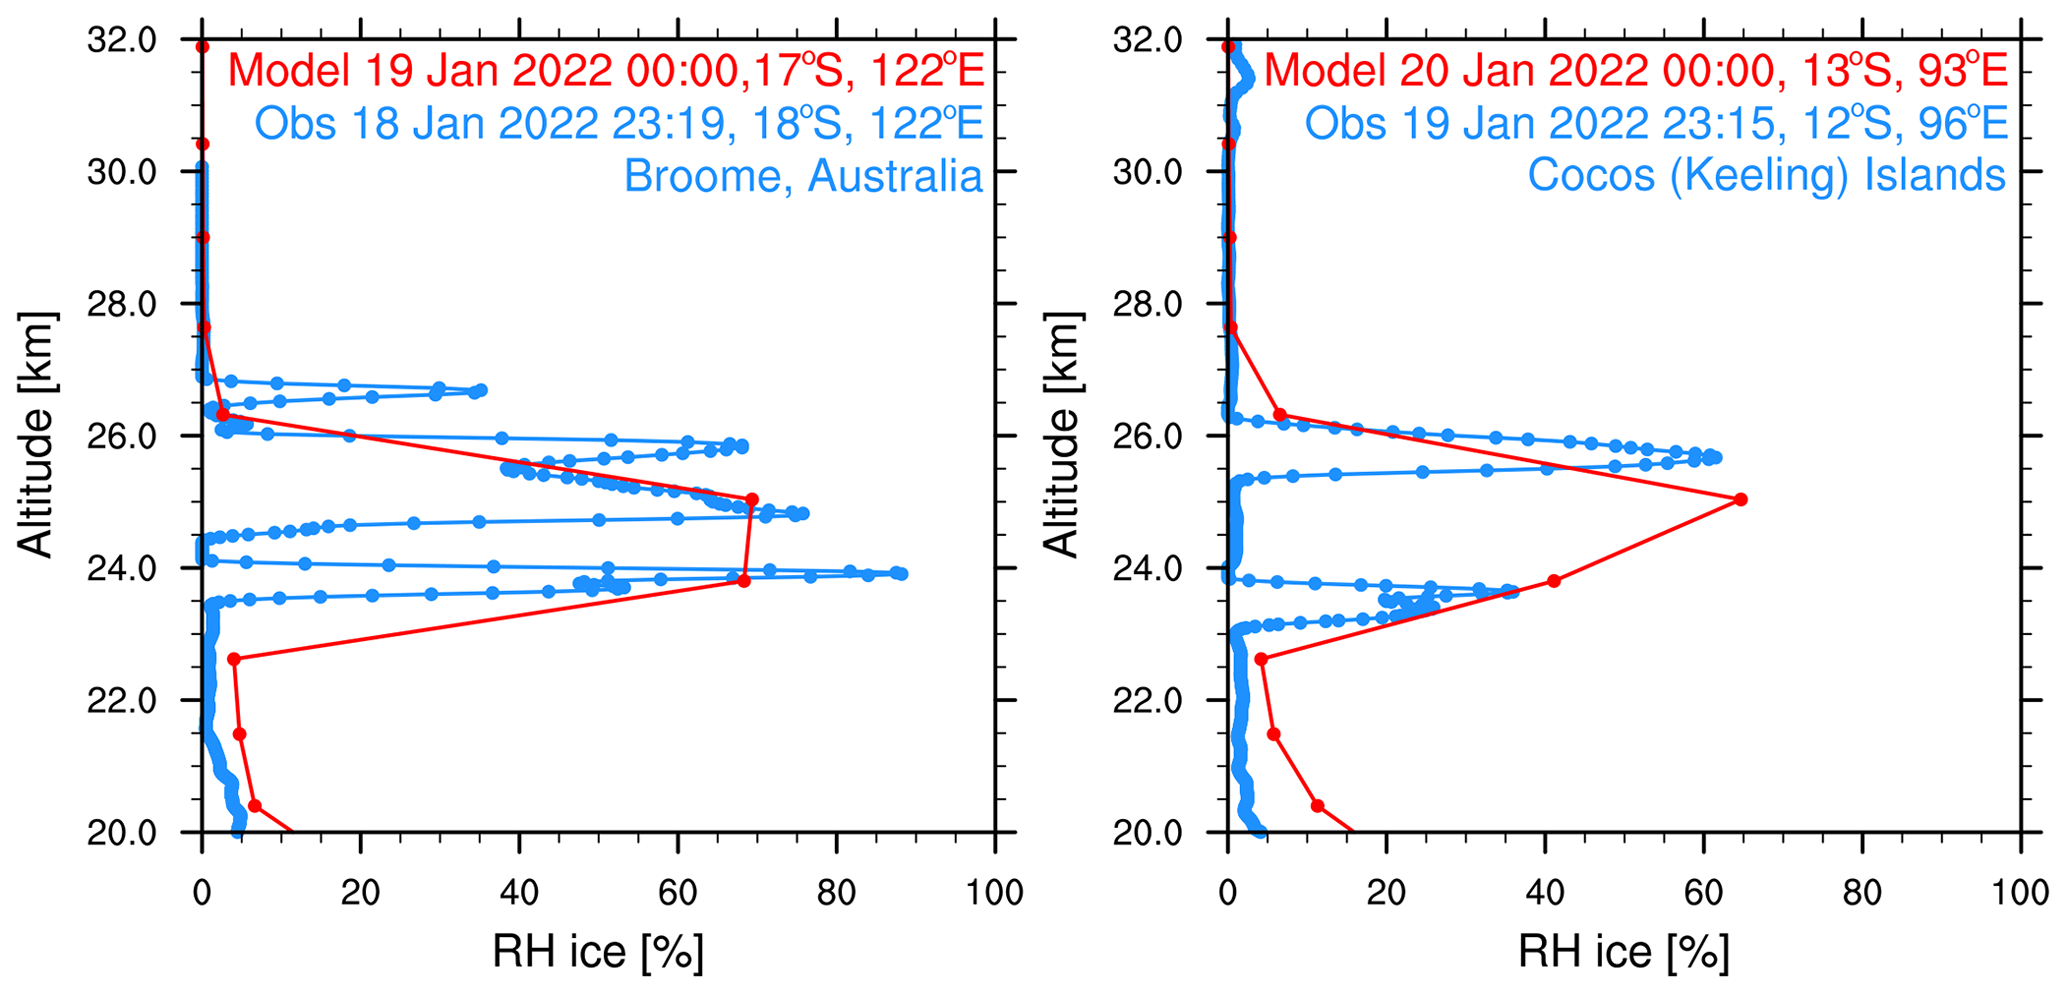
Figure 1Relative humidity with respect to ice saturation vapor pressure from radiosondes (blue) (Vömel et al., 2022) and simulation (red). The profiles are picked at nearby locations. Note that the observations are about 45 min earlier in time than the simulations, which places them on a different day.
We constrain the chlorine injection using MLS ClO observations at 20 hPa. Figure 2a shows ClO from the MLS observations and the model simulations at 20 hPa from 18 to 24 January. The MLS values are selected from locations where the water vapor mixing ratio is higher than 10 ppmv, indicating that these values are inside the volcanic plume. Figure 2b and c show the simulated daytime ClO for one plume location for each day. The dates are marked next to each plume. MLS observations show elevated ClO, about 5 to 10 times higher than the ambient values (Fig. 2a). If we only inject SO2 and H2O (the H2O_SO2 case defined in Table 1), we get a ClO amount about twice as large as the background (Fig. 2b), which is much lower than observed. The change in ClO indicates that H2O alters the Cly partitioning. To match the observed values, we need to inject 0.0013 Tg of ClO (Fig. 2c). This is equivalent to injecting ∼ 0.0009 Tg of HCl (Fig. A2). In our simulations, injecting ClO and HCl does not lead to different HOCl (Fig. A3), ClO, or O3 levels after 15 January, indicating that the balancing of ClO and HCl inside the HTHH plume happens very quickly. Unfortunately, the HOCl retrieval from the MLS is not suitable for scientific use at this pressure level, so we cannot validate it. We choose the ClO injection case in our following analysis. Note that the MLS ClO vertical resolution is ∼ 2 km near 20 hPa, which is coarser than the model vertical resolution (∼ 1 km at 20 hPa).
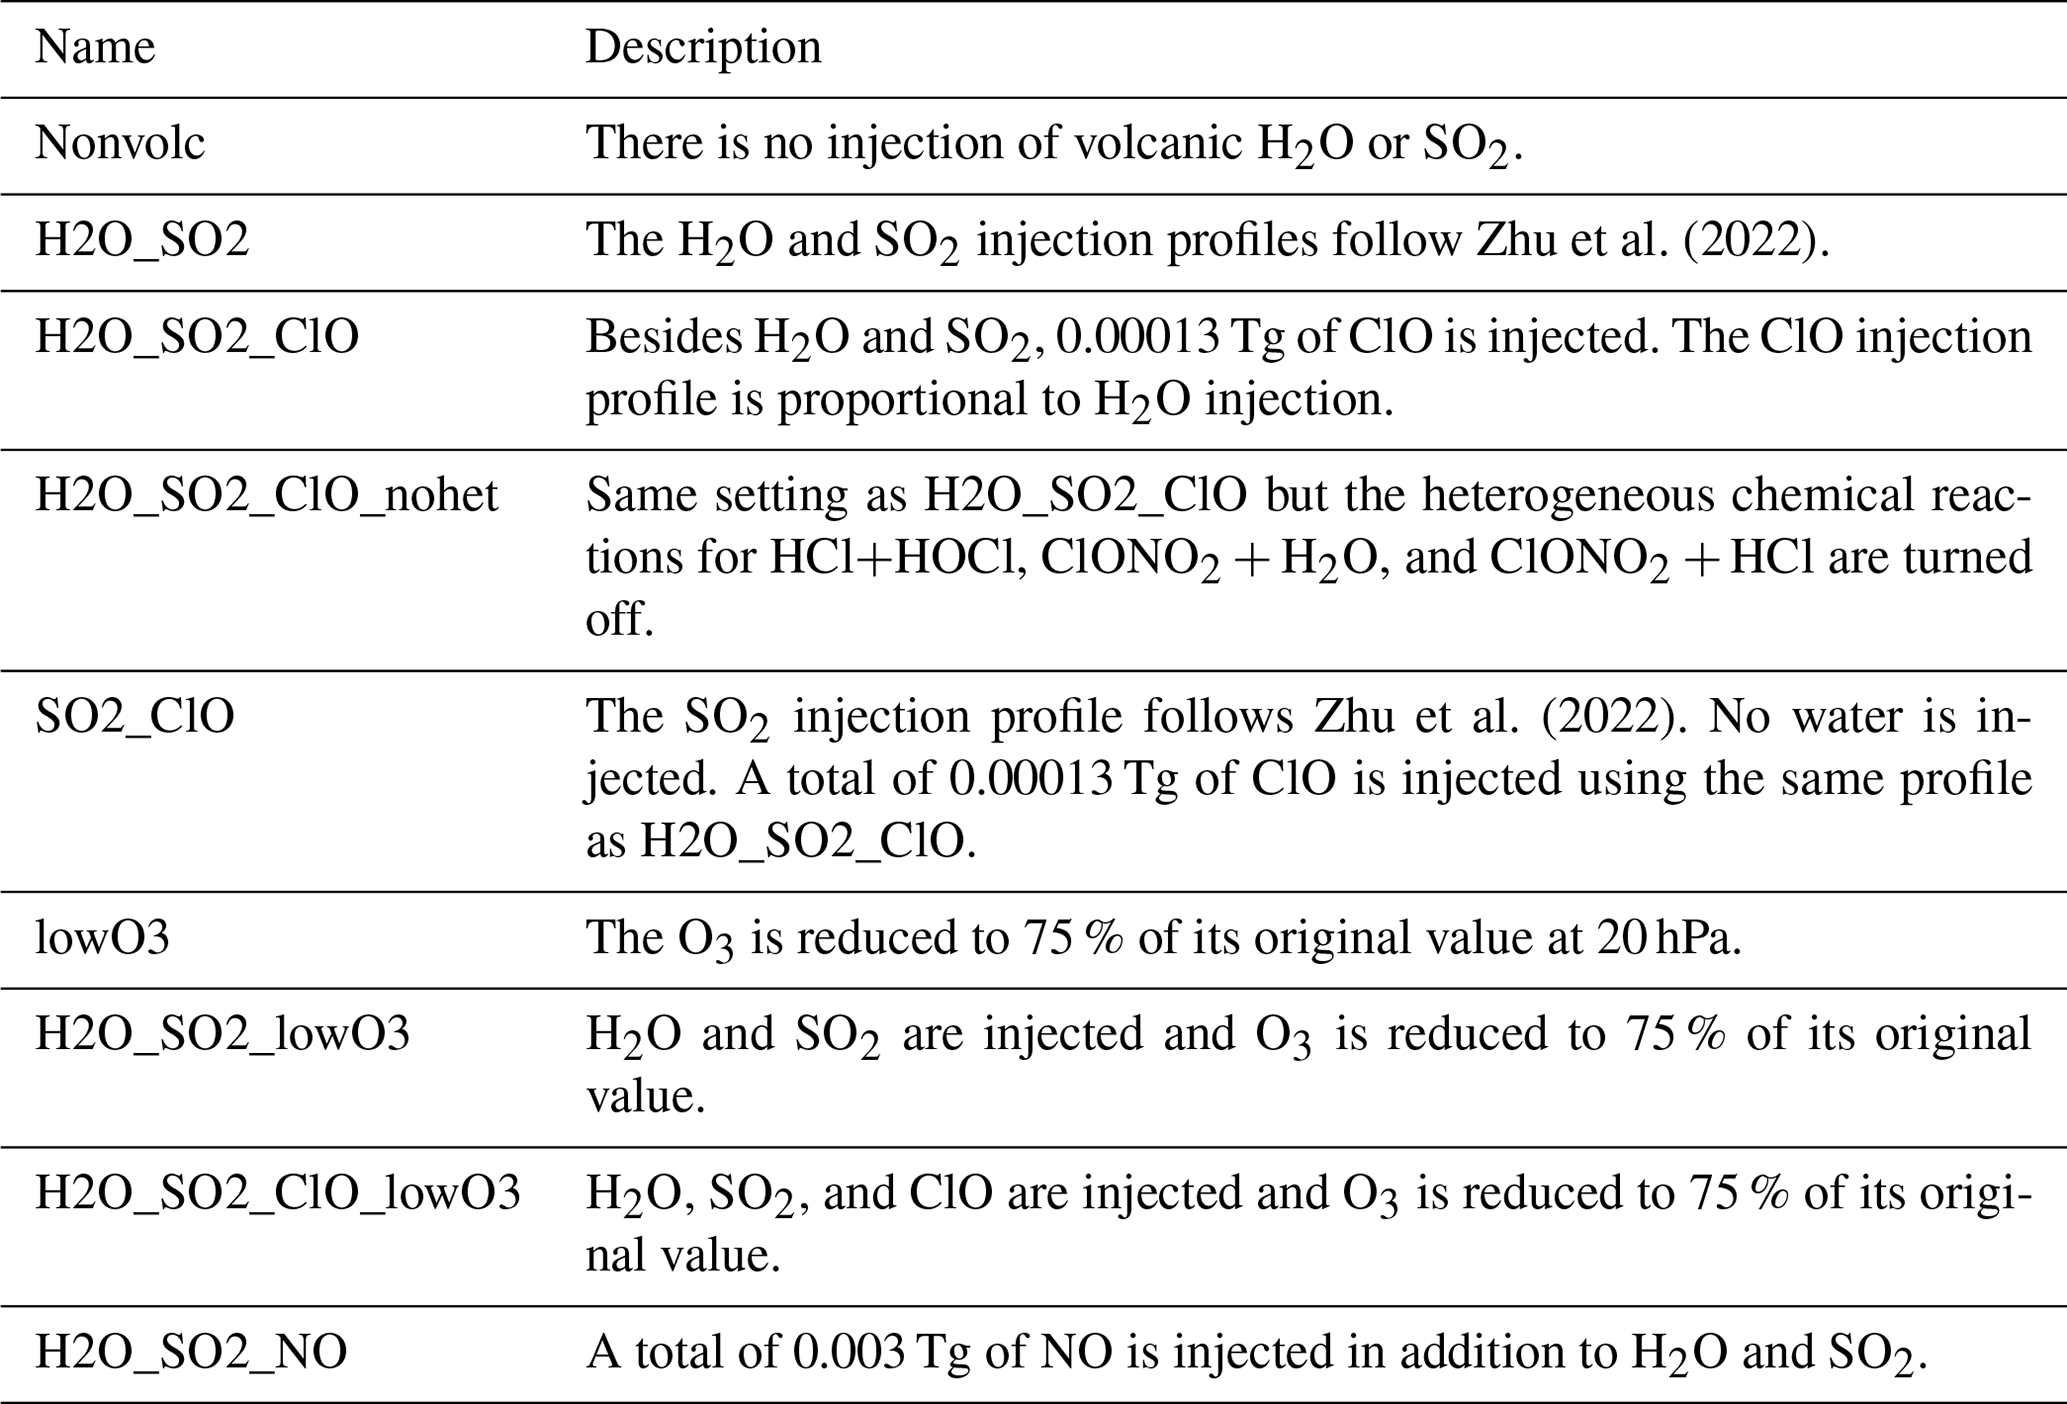
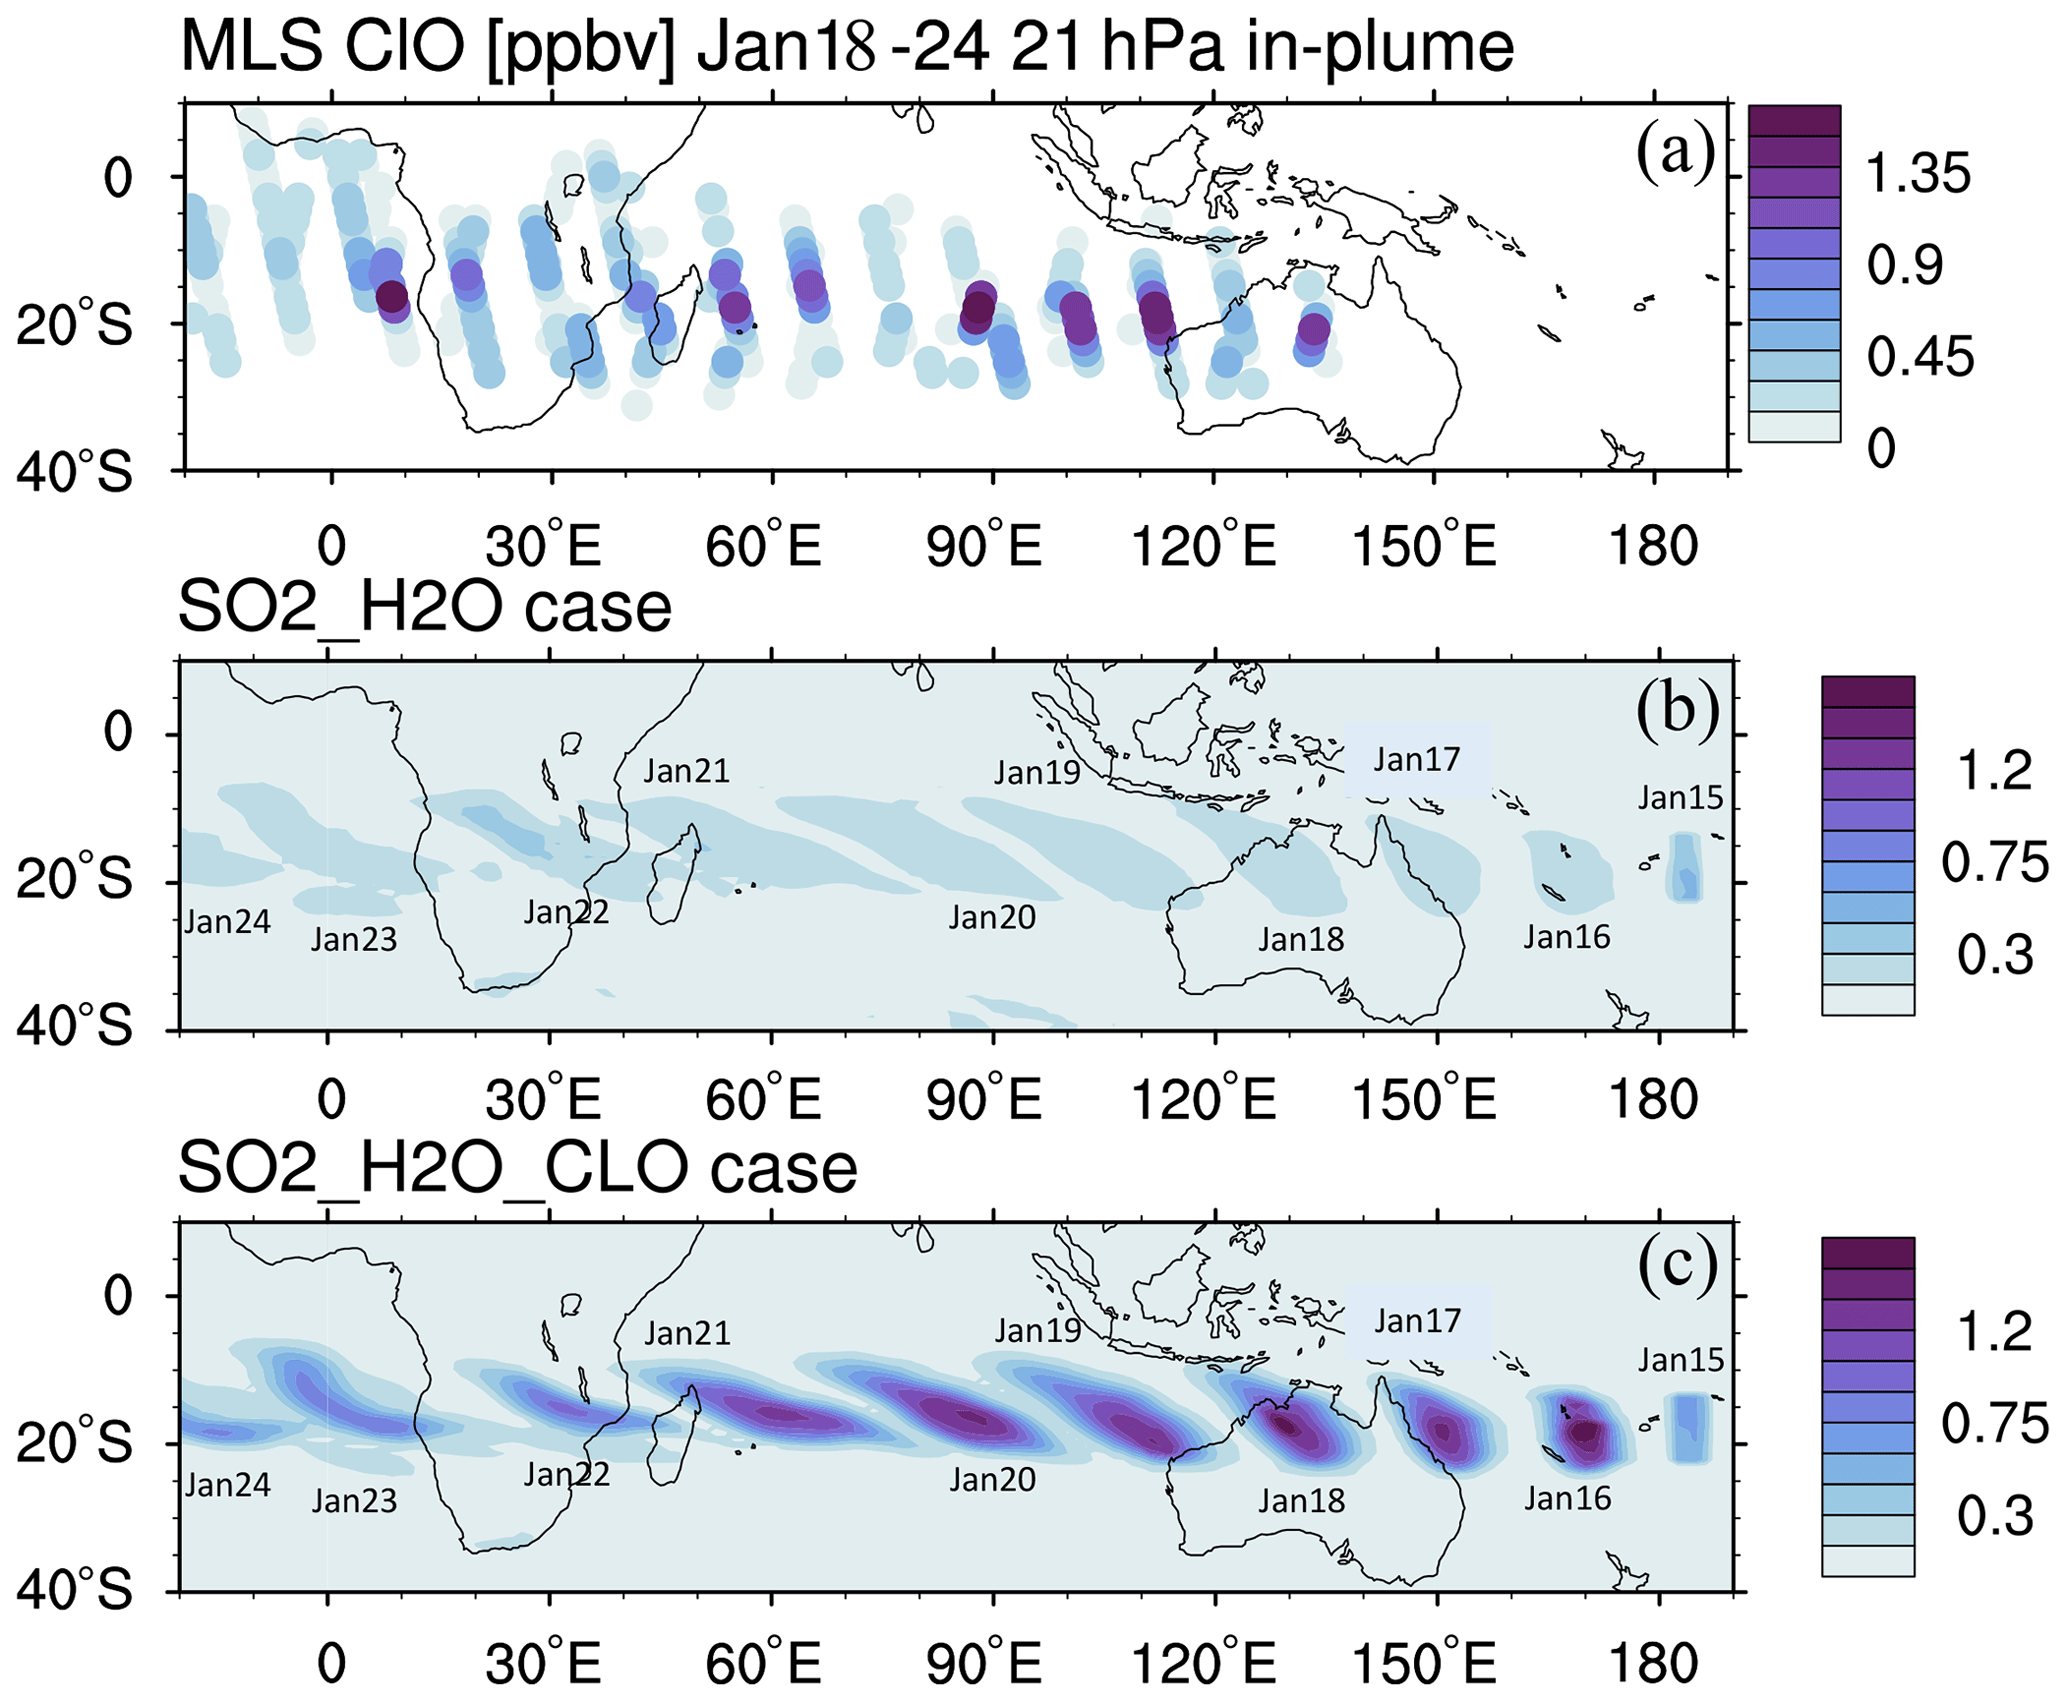
Figure 2(a) MLS in-plume ClO observations from 18 to 24 January. “In-plume” is defined as the area in which the water vapor mixing ratio is larger than 10 ppmv. MLS in-plume ClO data are not recommended for scientific use until 18 January 2022. The simulated 10 d evolution of in-plume ClO in the SO2_H2O (b) and SO2_H2O_ClO (c) cases is also shown. The modeled ClO concentrations are only taken during daytime each day (at either 06:00 or 12:00 UTC).
To investigate the O3 decrease and its related chemical evolution during the first 10 d, we conduct several simulations, as described in Table 1.
Evan et al. (2023) show that the HTHH in-plume ozone depletion at 20 hPa lasts at least 10 d after the HTHH eruption, which they attribute to the heterogeneous chlorine activation on humidified volcanic aerosols. Here, we analyze the contributions to this initial in-plume O3 depletion considering three processes: (1) increasing H2O injection may enhance the HOx catalytic cycle and HOx–ClOx interactions; (2) increasing ClO during the injection phase may deplete ozone due to both heterogeneous reactions and gas-phase reactions; (3) the rising plume from the troposphere may carry ozone-poor tropospheric air into the stratosphere.
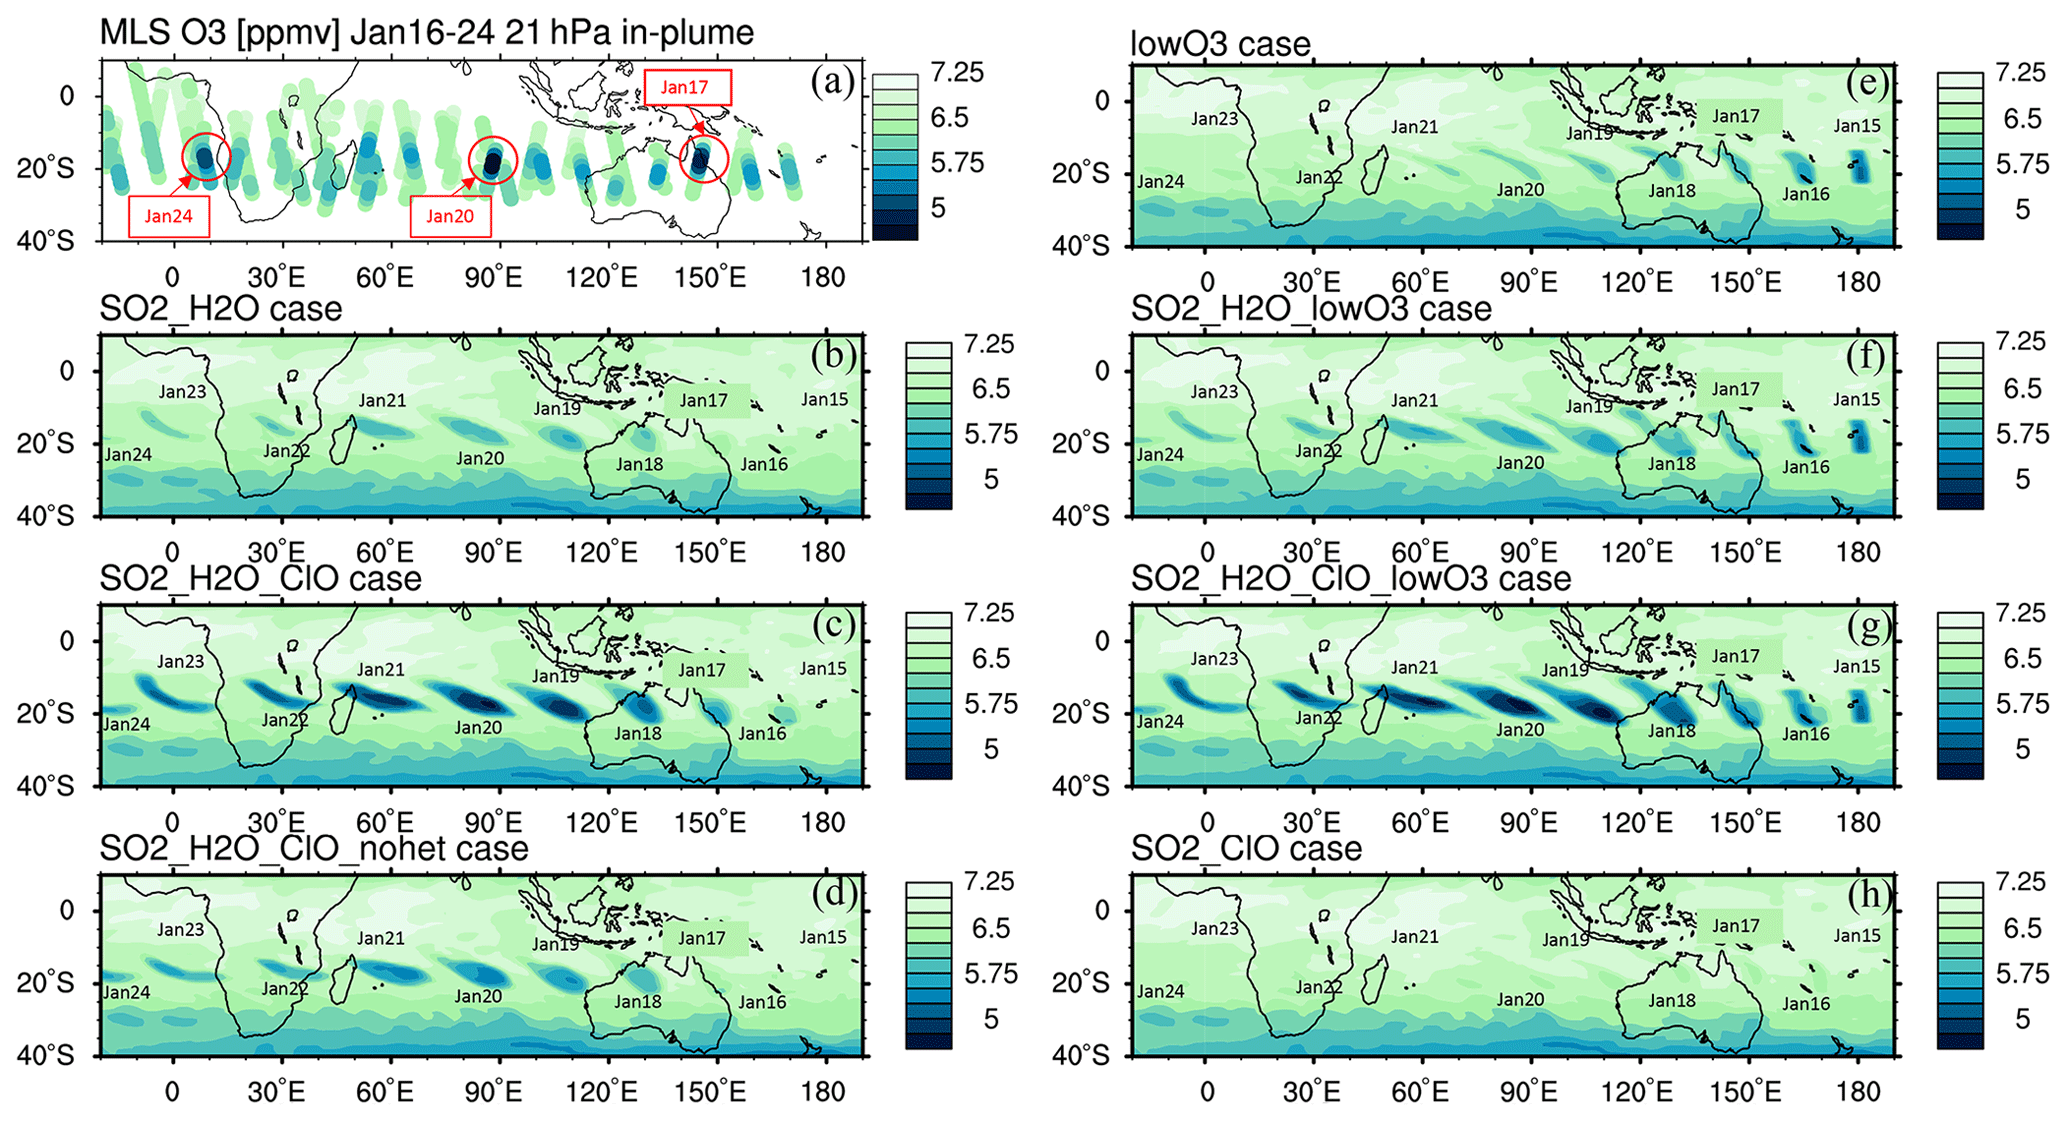
Figure 3(a) The MLS in-plume O3 observation from 16 to 24 January. “In-plume” is defined as in Fig. 2. Note that MLS ozone retrievals were unaffected by the plume, leading to the addition of 2 extra days of data for this figure. The locations and days with low O3 values used in Fig. 6 are marked with circles. (b–h) The simulated 10 d evolution of in-plume O3 in seven model cases with various injections of SO2, H2O, ClO, and low initial O3 is also shown. Panel (d) uses the same injection as panel (c) but with heterogeneous reactions (i.e., HCl + HOCl, ClONO2 + H2O, and ClONO2 + HCl) turned off. The simulated O3 in the H2O_SO2 case uses one model time step each day that occurs near local noon.
The MLS observed in-plume low ozone concentrations at 20 hPa (Fig. 3a), especially during the following 3 d: ozone concentrations of 4.8 ppmv on 17 January, 4.6 ppmv on 20 January, and 5.1 ppmv on 24 January. These are ozone anomalies of about 1.7, 1.9, and 1.4 ppmv, respectively. The anomalies are calculated using the background average values in this area (6.5 ppmv) subtracting the low ozone values. Note that any interpretation of these O3 anomalies needs to consider the coarse MLS vertical resolution (∼ 3 km). Because the plume is spatially small during the initial days, the MLS tracks do not capture the maximum plume perturbation every day. The simulation with water injection (Fig. 3b) accelerates the HOx catalytic cycle and shows evident O3 reduction, although less than observed. Once we inject ClO on top of the massive water injection (Fig. 3c), O3 loss is significantly enhanced and is close to the observations after 18 January. The difference between Fig. 3d and c is caused by heterogeneous reactions, which usually only happen in the stratospheric polar springtime where they cause the Antarctic ozone hole and Arctic ozone depletion. Heterogeneous reactions become important, despite the high non-polar temperatures, because of the massive quantity of water injected. The heterogeneous reaction rate is strongly related to the relative humidity (Shi et al., 2001). Usually, during the polar night, the relative humidity is higher (RHi 60 %–100 %) than in the non-polar stratosphere because of the low temperature (< 195 K). Here, the water injection increases the relative humidity (Fig. 4c). Enhanced water causes the weight percent of H2SO4 of the sulfuric acid aerosol to decrease from 70 % to 35 % (Fig. 4b). The massive water injection also causes the in-plume temperature to drop by about 2–6 K (Fig. 4f) (Solomon et al., 2016). All of these factors (temperature decrease, relative humidity increase, and particle H2SO4 dilution) can increase the three heterogeneous reaction probabilities (HCl + HOCl, ClONO2 + H2O, and ClONO2 + HCl). As shown in Fig. 5, when the water vapor amount is near the climatological value of 6 ppmv, the heterogeneous reaction probability reaches 10−2 to 10−1 when the temperature is ∼ 190 K. Meanwhile, the reaction probability is similar for temperatures of 215 K when the water vapor is ∼ 600 ppmv in the simulations, as was the case for the HTHH plume during the week following the eruption. Constellation Observing System for Meteorology, Ionosphere, and Climate-2 (COSMIC-2) radio occultation observations showed even higher water vapor mixing ratio during the first week: the maximum values over 20–22 January are ∼ 1000–2000 ppmv (Randel et al., 2023). Also, because the in-plume and out-of-plume chemical concentrations are different, we apply both conditions (solid and dashed lines) to show how the different HCl, HOCl, and ClONO2 conditions alter the HCl + HOCl and ClONO2 + HCl reaction probabilities by 1 order of magnitude. Volcanic sulfur injection also increases the sulfate surface area density (Fig. 4a) that provides extra surfaces for heterogeneous reactions.
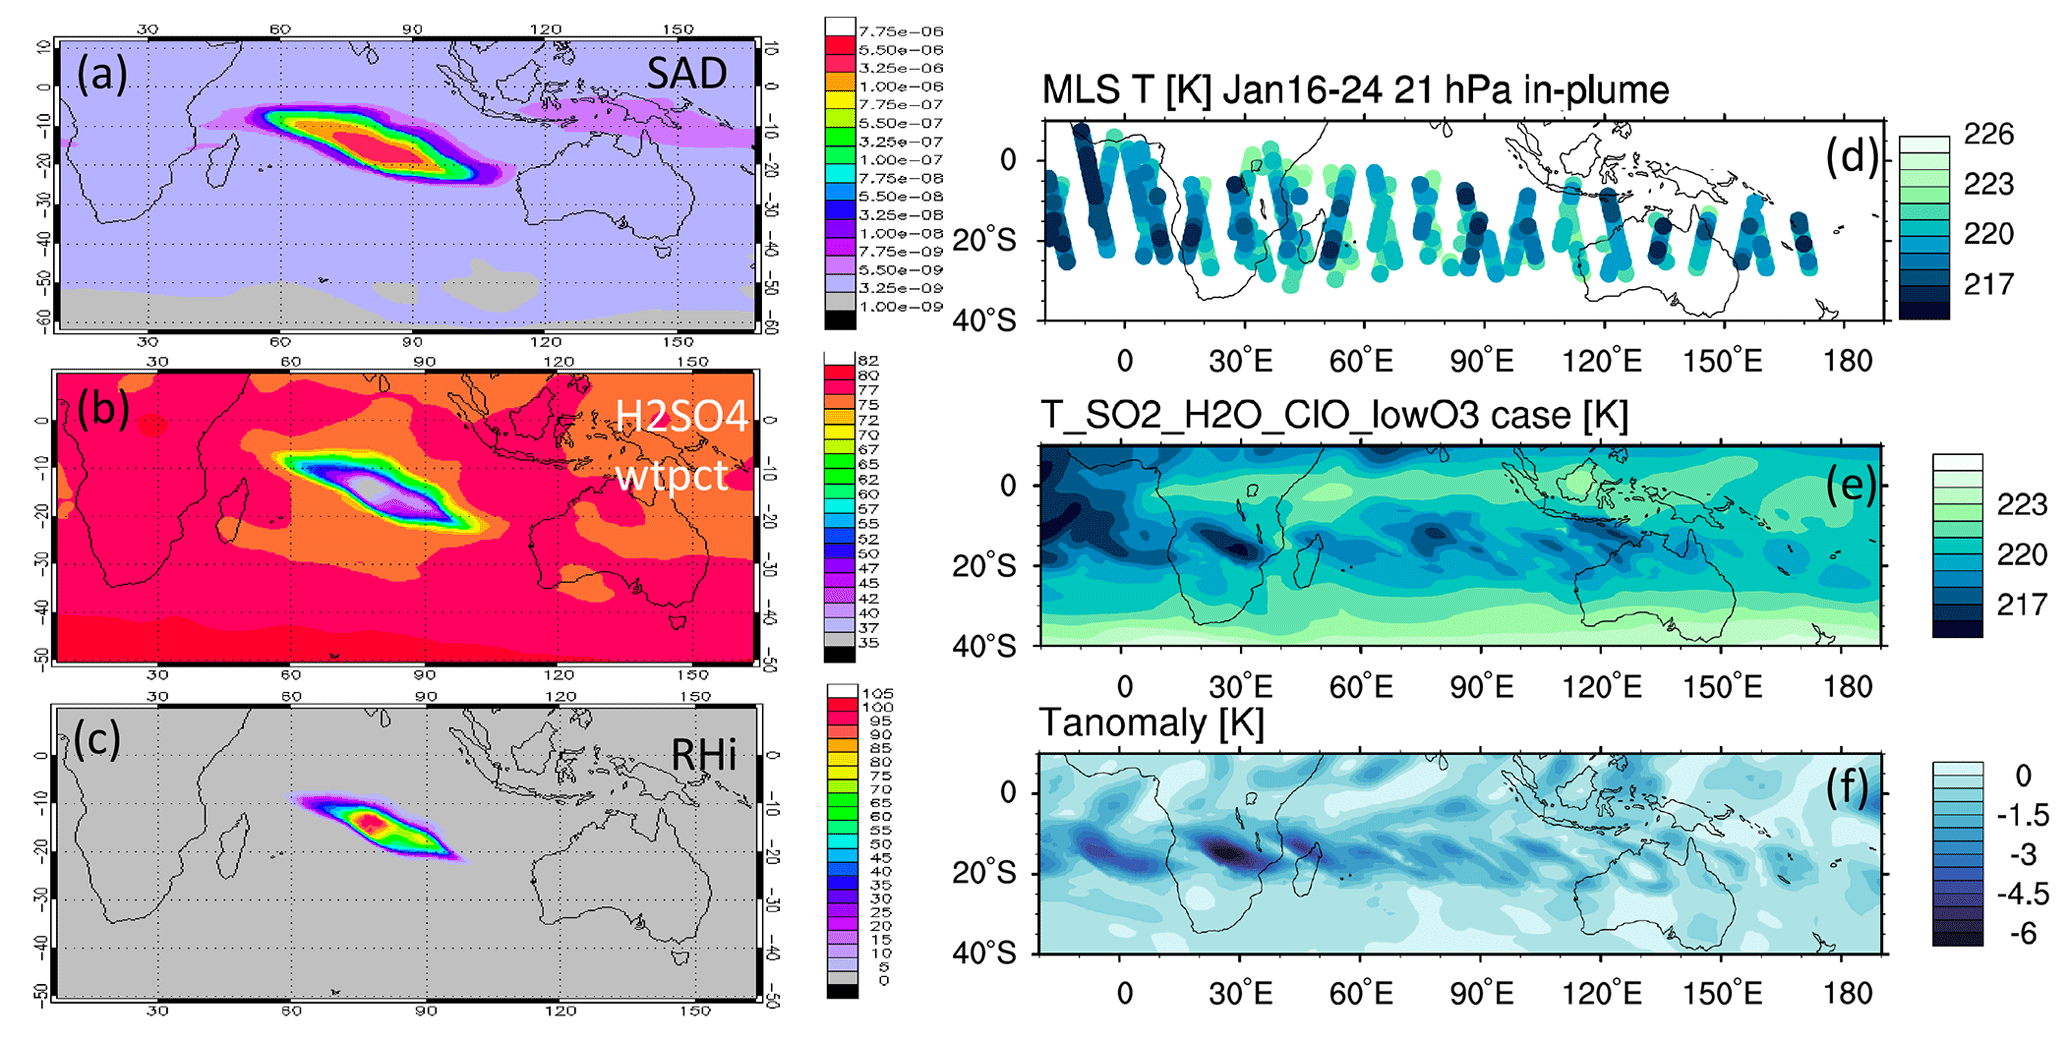
Figure 4Panels (a), (b), and (c) present the simulated surface area density, simulated H2SO4 H2O weight percent, and relative humidity on 20 January at 20 hPa, respectively. (d) The temperature evolution during the first 10 d at 20 hPa from the MLS, (e) simulated temperature evolution in the SO2_H2O_ClO_lowO3 case, and (f) temperature difference between the SO2_H2O_ClO_lowO3 case and the Nonvolc case are also shown.
Comparing Fig. 3b and c with MLS observations, we can see that the chemical reactions do not explain the O3 loss during the first 3 d of the eruption (15–17 January, low O3 near 160∘ E in the MLS observation). This discrepancy suggests that the plume contains some ozone-poor tropospheric air after the injection into the stratosphere. We ran three cases with initial low ozone. For the low-O3 case (Fig. 3e), we inject only ozone-poor air without volcanic H2O or SO2. It shows low O3 as observed during the first couple of days, but ozone recovers quickly because the O3 chemical lifetime is short at 20 hPa inside the plume (Fig. A4). The H2O_SO2_lowO3 case (Fig. 3f) shows ozone loss similar to the observations in the first 6 or 7 d. By adding the ClO and initial ozone-poor air (Fig. 3g), we obtain persistent low O3 values that agree with the lowest observed values better than the other cases (Fig. 6a). Compared with Fig. 3b, Fig. 3d has slightly more ozone depletion, indicating that the extra chlorine injection impacts O3 even without heterogeneous chemistry. However, without including the high amounts of injected water, the additional ClO alone cannot deplete ozone much (Fig. 3h).
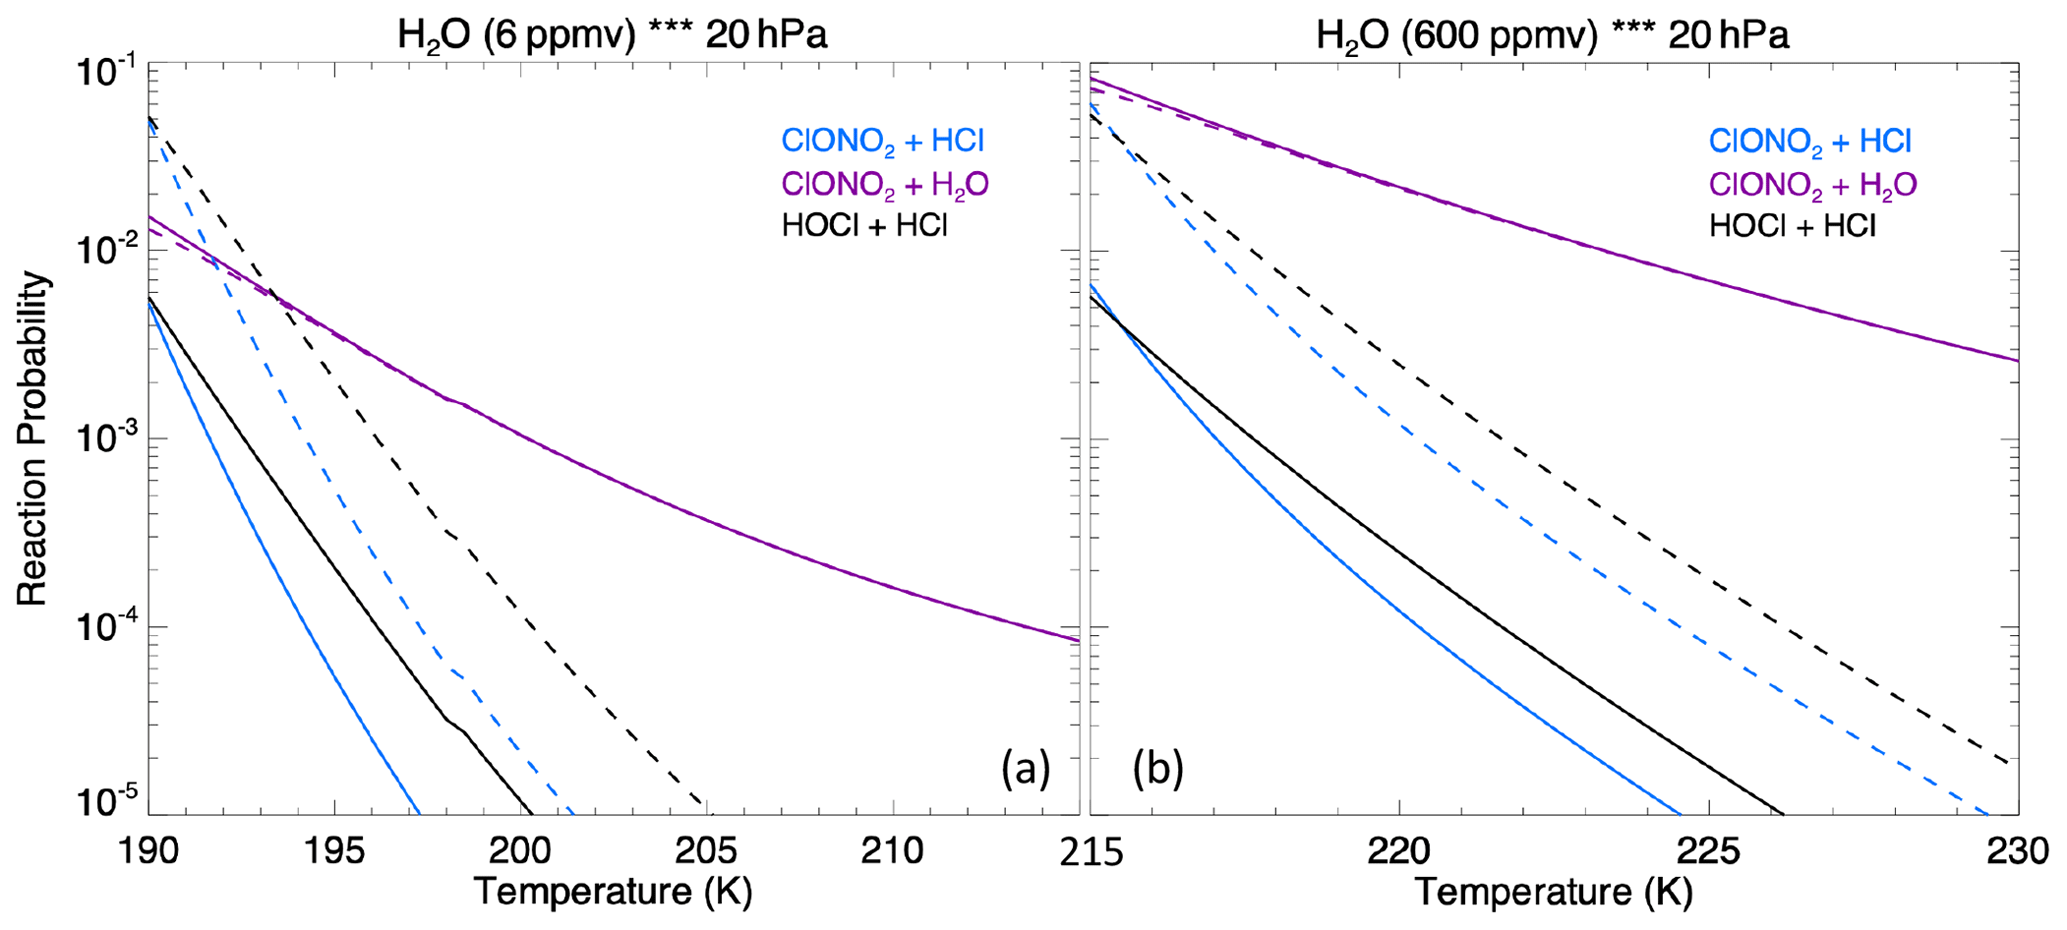
Figure 5The heterogeneous reaction probability for three reactions on sulfate surfaces (ClONO2 + HCl, ClONO2 + H2O, and HOCl + HCl) as a function of water vapor assuming a 0.4 µm particle size at 20 hPa. Panel (a) assumes 6 ppmv of ambient water vapor and panel (b) assumes 600 ppmv of ambient water vapor. The solid lines use the out-of-plume chemical concentration on 20 January: 1.0 ppbv of HCl, 0.03 ppbv of HOCl, and 0.5 ppbv of ClONO2; the dashed lines use the in-plume chemical concentration: 0.1 ppbv of HCl, 1.0 ppbv of HOCl, and 0.05 ppbv of ClONO2. These values are based on the simulation output.
Figure 6 shows the O3 anomaly evolution from several model cases (panel a) and the percentage contributions to the total ozone loss (panels b and c). The model case with all injections (initial low O3, high H2O, and high ClO) agrees well with the MLS observations on the 3 d with the lowest O3 values (Fig. 6a). In Fig. 6b and c, the black bars represent the contribution from the low-O3 injection, which is significant during the first couple of days but diminishes quickly. From these percentage values, we conclude that the lofting of low O3 carried in the plume cannot be the reason for the low O3 values after 3 d. Chemistry is the main reason that this O3 depletion lasts so long.
There are two ways to look at the chemical contributors to ozone loss based on our model runs. The first is to separate the contributors due to various injections (Fig. 6c): H2O injection accounts for about 30 %–40 % of the ozone loss most of the time (blue) and ClO injection accounts for 50 % of the ozone loss most of the time (red). However, we cannot simply attribute the largest contribution to the ClO injection, because if we only inject ClO, it does not produce much ozone depletion (Fig. 6a, magenta). It is the ClOx–HOx interactions that accelerate O3 depletion.
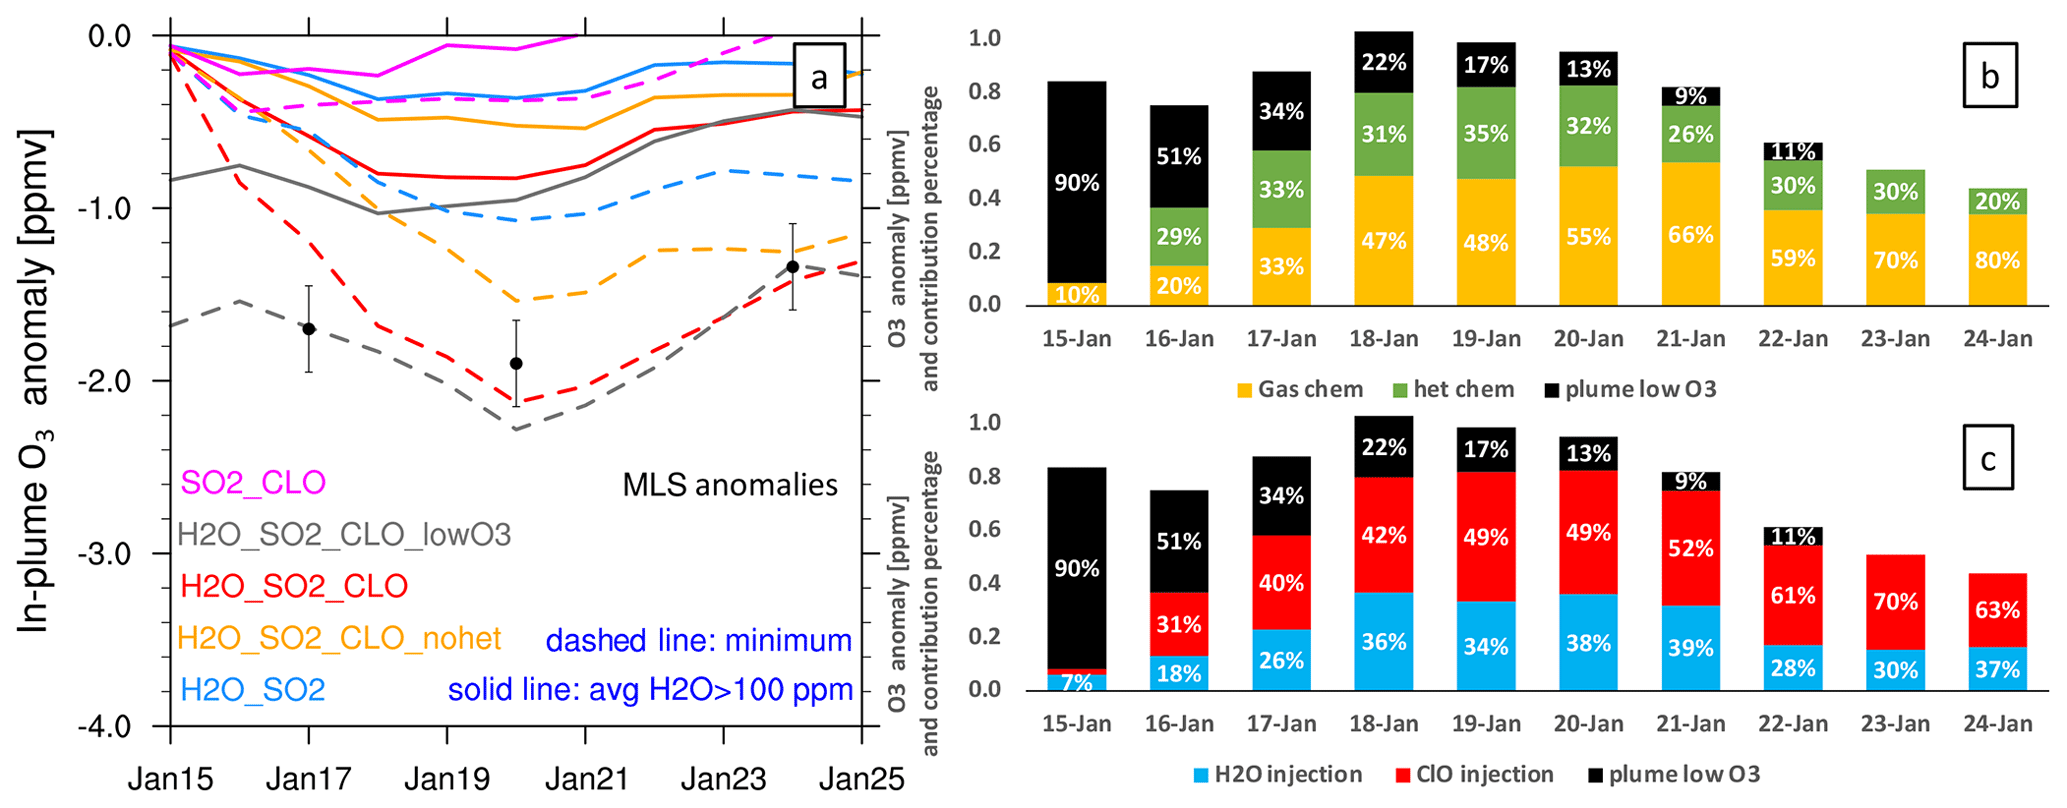
Figure 6Panel (a) presents the O3 anomaly in different model cases. The solid lines are the average O3 anomaly at 20 hPa on each day near local noon where water vapor is larger than 100 ppmv. Here, 100 ppmv is suggested by Evan et al. (2023), who found that O3 anomalies are not significant for a 10 ppmv threshold but are significant for a 100 ppmv threshold. The dashed lines are the simulated maximum O3 anomaly on each day at 20 hPa. The black dots show the 3 d during which the MLS measures the lowest O3 values (explained in Fig. 3a). Panel (b) presents the percentage contributions to ozone loss from gas-phase chemistry (orange, H2O_SO2_CLO_nohet), heterogeneous chemistry (green, H2O_SO2_CLO minus H2O_SO2_CLO_nohet), and low-O3 air carried into the stratosphere (black, H2O_SO2_CLO_lowO3 minus H2O_SO2_CLO). Panel (c) shows the percentage contributions to ozone loss from H2O injection (blue, H2O_SO2 minus Nonvolc), ClO injection (red, H2O_SO2_CLO minus H2O_SO2), and low-O3 air carried into the stratosphere (black, H2O_SO2_CLO_lowO3 minus H2O_SO2_CLO).
A second way to look at the causes for ozone loss is to separate the contributions from the gas-phase chemistry and the heterogeneous chemistry (Fig. 6b). The model run with the H2O and ClO injections but without the heterogeneous chemistry shows that the gas-phase chemistry (yellow bars) account for more than 47 % of the ozone loss from 18 to 24 January. Heterogeneous chemistry (green bars) destroys about 30 % of the ozone. Hence, both heterogeneous chemistry and gas-phase chemistry are important for O3 depletion. Once we turn off the heterogeneous chemistry, the partitioning between active chlorine and chlorine in the reservoirs is changed. The order in which the processes are accounted for can affect the resulting breakdown. Thus, we cannot simply say that gas-phase chemistry contributions are larger than heterogeneous chemistry. Both are clearly significant.
To better understand which reactions are critical in the HTHH plume, we investigate the simulated reaction rates related to HOx and chlorine compounds (Fig. 7). These reactions reflect how the water and ClO injections strengthen the in-plume HOx–ClOx interactions, chlorine activation, and the relative importance of each heterogeneous reaction rate. The WACCM model uses the methods developed by Shi et al. (2001) for heterogeneous reaction rate calculations. Figure 7a shows the HOx cycle inside and outside the water plume during daytime on 20 January at 20 hPa. The HO2 + O3 reaction rate increases by a factor of 4 (from 5×10⁴ to 2×105 cm−3 s−1), OH + O increases by a factor of ∼ four (from 2×10⁴ to 7.5×104 cm−3 s−1), and HO2 + O increases by a factor of 4 (from 2×10⁴ to 8×104 cm−3 s−1). In addition, the extra HOx plays a large role in chlorine activation. Figure 7b shows the chlorine compound reactions inside the HTHH initial plume. The HOCl photolysis rate increases by a factor of ∼ 30 inside the plume (from 6×103 cm−3 s−1 outside the plume to 2×105 cm−3 s−1) due to the high HOCl mixing ratio, which is the dominant process causing the increase in chlorine activation to Cl. The HOCl concentration remains high due to the enhanced ClOx–HOx interaction (i.e., ClO + HO2 → HOCl + O2 reaction) as well as the increase in the heterogeneous reaction rate of ClONO2 + H2O by 5 orders of magnitude (from 0.3 to 1×104 cm−3 s−1). The large amounts of HOCl also make the heterogeneous reaction of HOCl + HCl faster than the ClONO2 + HCl reaction; the latter reaction is known as the major reaction contributing to the chlorine activation that has a hand in polar ozone depletion. Figure A5 shows the uptake coefficient for the three heterogeneous reactions HCl + HOCl, ClONO2 + H2O, and ClONO2 + HCl on 20 January. The reaction probability of ClONO2 + HCl is increased by 8 orders of magnitude (from the background value of 10−10 to 10−2). This value is even higher than that suggested by Evan et al. (2023), who estimate that enhanced water vapor increases the uptake coefficient of ClONO2 + HCl to 10−4 cm−3 s−1. The reaction probability of HCl+HOCl and ClONO2 + H2O increases to 10−2. Furthermore, inside the plume, the reactions that convert Cl back to HCl are slower than their activation rate.
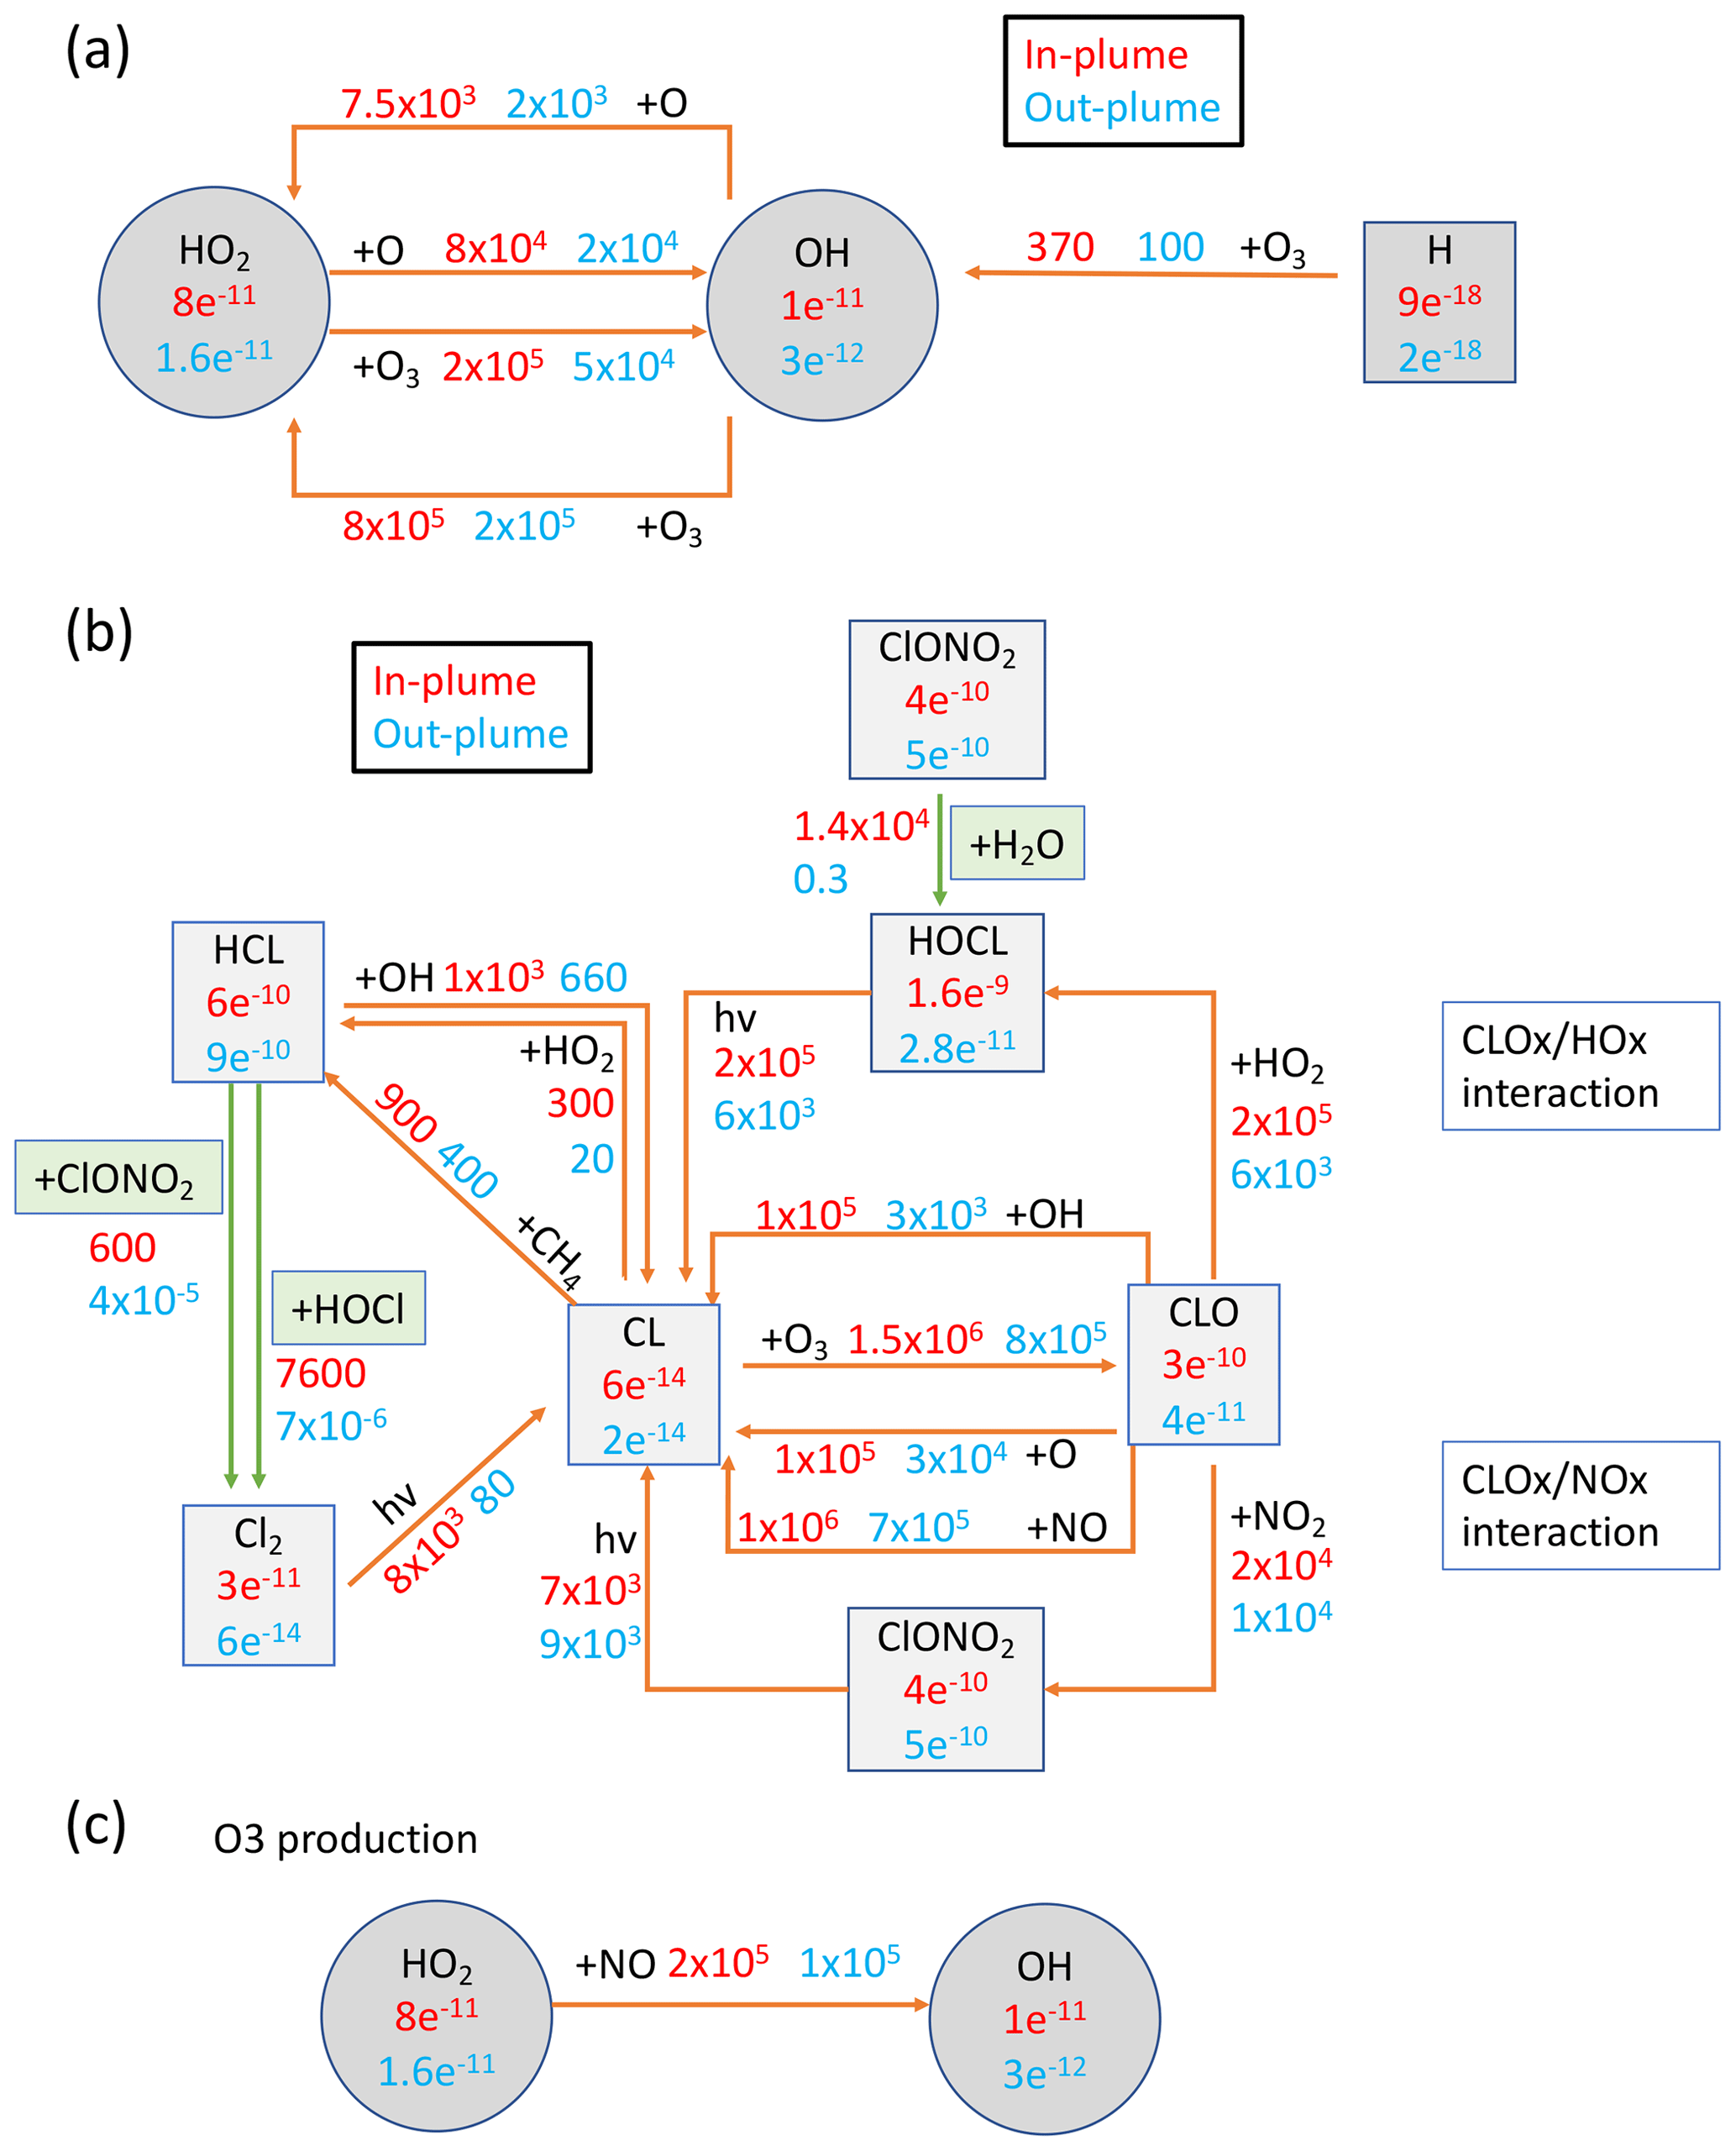
Figure 7Reactions inside and outside the plume (in cm−3 s−1) and compound concentrations (in mol mol−1). Red numbers represent values inside the plume and blue numbers represent values outside the plume. Panel (a) presents the HOx balance and its interaction with Ox during daytime at 20 hPa on 20 January 2022. Panel (b) shows chlorine compound reactions in the H2O_SO2_ClO case. Panel (c) gives the HOx cycle impact on O3 production. Green arrows represent the heterogeneous reactions for chlorine activation. H2O is ∼ 600 ppm inside the plume and ∼ 5.5 ppm outside the plume. Cly is ∼ 4.2 ppbv inside the plume and 1.5 ppbv outside the plume.
Besides the ozone loss reactions, ozone production reactions are also significantly altered by the water plume (Fig. 7c). HO2 + NO is usually not an important process for O3 production in the stratosphere (more important in the troposphere). The reaction rate doubles inside the plume (from 1×10⁵ to 2×105 cm−3 s−1). Note that we do not inject lightning NOx in this case, a possible scenario during the eruption phase, that can also further increase the O3 production (detailed in Sect. 4).
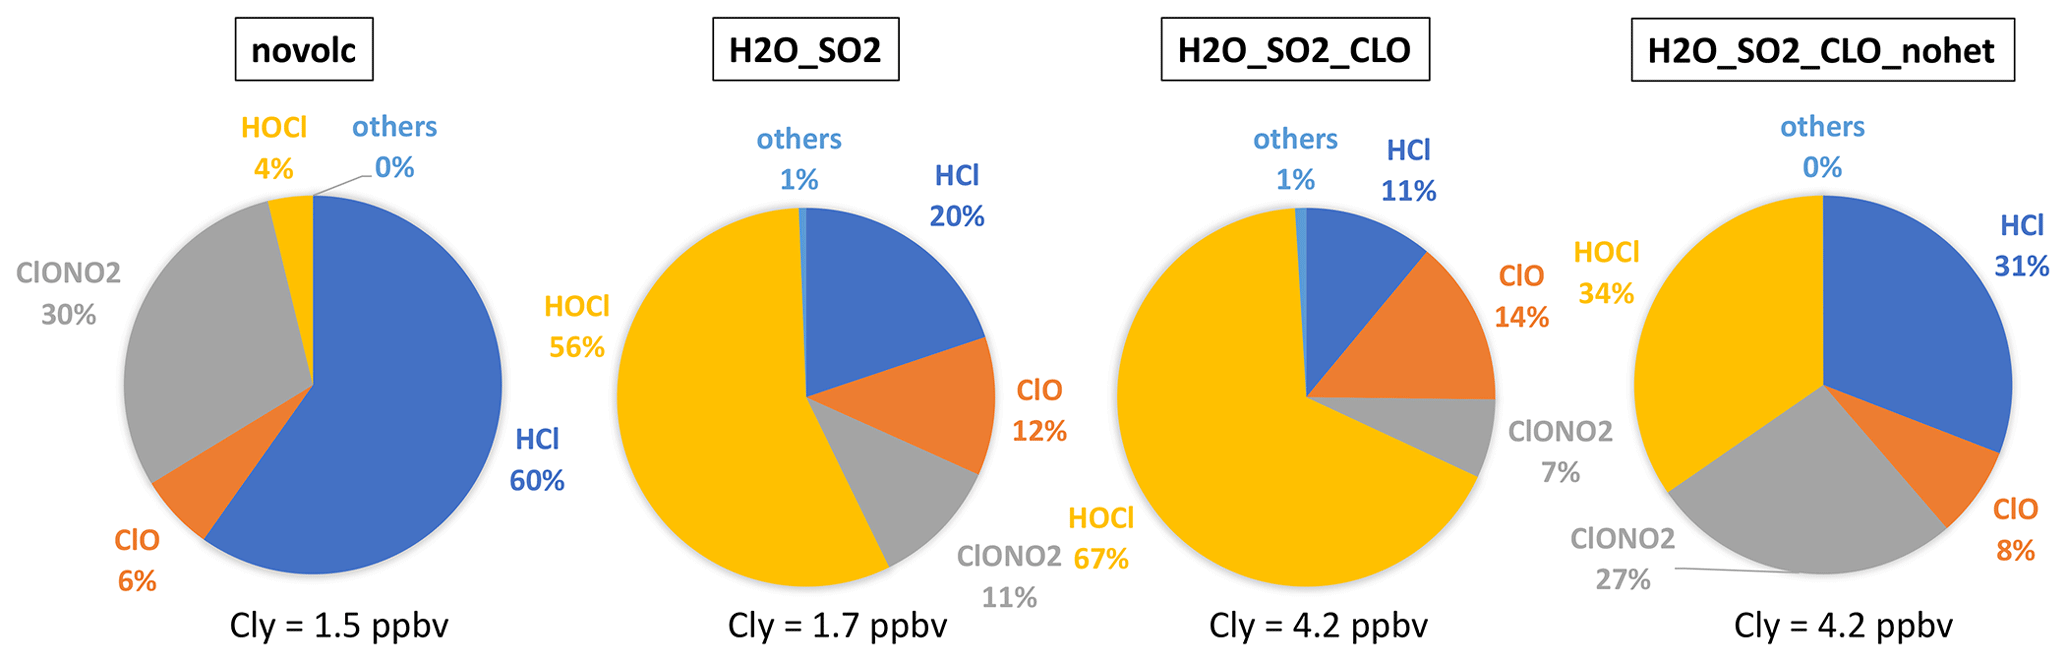
Figure 8The percentage of each inorganic chlorine compound (Cly = Cl + ClO + 2Cl2 + 2Cl2O2 + OClO + HOCl + ClONO2 + HCl + BrCl) inside and outside the plume. The slight difference between Nonvolc Cly and H2O_SO2 Cly is because H2O injection changes the plume dynamics in the free-running simulations.
Comparing the partitioning of Cly (Cl + ClO + 2Cl2 + 2Cl2O2 + OClO + HOCl + ClONO2 + HCl + BrCl) reveals the in-plume chlorine activation processes (Fig. 8). Outside the plume, HCl and ClONO2 are dominant, indicating that most of the Cl is in reservoirs. While inside the water plume, both the H2O_SO2 and H2O_SO2_ClO cases show strong depletion of the reservoirs HCl and ClONO2, and most of the Cly is either in the form of HOCl (a short-lived reservoir) or is activated in the form of ClO. Unlike the chlorine activation process in the polar winter, HOCl is the highest in the HTHH plume because heterogeneous chemistry is not fast enough to destroy HOCl to produce ClO. In the case without heterogeneous chemistry, HCl and ClONO2 are dominant in the plume, indicating that heterogeneous chemistry is the main process of converting HCl to active chlorine. Comparing total Cly and ClO in all panels, ClO does not exceed a quarter of the Cly, indicating that adding 0.00013 Tg of ClO through injection is one way to produce the observed ClO. There is a possibility that ClO is converted from other Cly species through chemical reactions that we are not aware of, as this was a very unusual eruption.
The ozone loss inside the HTHH plume during the first 10 d provides a unique opportunity to study stratospheric chemistry and to understand the performance of the state-of-the-art WACCM climate model, because the HTHH-injected ClO and H2O exceed the normal range of stratospheric variability. These volcanic injections strongly altered the ClOx–HOx interactions and heterogeneous reaction rates, producing different chemical pathways for chlorine activation and ozone depletion compared with what occurs in the Antarctic ozone hole or Arctic ozone depletion in the polar stratospheric winter and spring. HOCl is identified as playing a large role in the in-plume chlorine balance and heterogeneous processes. The high HOCl concentrations are a result of the very high in-plume water vapor content, which makes this event different from chemistry in the Antarctic ozone hole, where ClONO2 is more important.
This study also raises an interesting question regarding where the Cl comes from in the volcanic injection. Seawater contains 3.5 % sea salt, which implies that about 5 Tg of NaCl could have been injected, assuming that the injected 150 Tg of H2O came from seawater. However, we only need to inject 0.00013 Tg of ClO to match the MLS ClO observations during the first few days after the eruption. We also conducted a test injecting an equivalent amount of HCl (0.0009 Tg), which resulted in a similar HOCl, ClO, and O3 pattern (Figs. A2, A3). If we inject more HCl or ClO, ClO would exceed the observed concentration, causing the depletion of OH and slowing down SO2 oxidation. Evidently, if the water came from seawater, most NaCl was not converted to HCl but stayed in the stratosphere as particles. Vernier et al. (2023) sampled NaCl particles 8 months after the eruption near Brazil. Based on their sampled NaCl concentration, we estimate that 0.5–1 Tg of NaCl may have been injected and stayed in the atmosphere. There are several possibilities as to why this event did not inject 5 Tg of NaCl into the stratosphere: remote-sensing particle size estimations (Khaykin et al., 2022) and in situ measurements (Asher et al., 2023) indicate that the particles were submicron sized. However, sea salt particles injected into the lower troposphere by wind are mainly particles larger than 10 µm. Hence, if the volcanic injection had similar sized NaCl particles, most of them may have quickly fallen out of the stratosphere. In addition, the majority of NaCl might have been washed out during the first couple of hours of plume injection by acting as nuclei for ice particles. It is also possible that the reactions that might release Cl from NaCl may not efficiently lead to reactive Cl. For example, HNO3 can heterogeneously react on sea salt very quickly in the troposphere to release HCl (De Haan and Finlayson-Pitts, 1997; Guimbaud et al., 2002; Murphy et al., 2019). This reaction may be accelerated by HTHH high humidity, even if the temperature is low in the stratosphere. HCl could be removed by condensing in supercooled water, which would reduce HCl vapor concentrations by up to 4 orders of magnitude, preventing substantial stratospheric chlorine injection (Tabazadeh and Turco, 1993). Finally, it may be that the water injected came from magmatic water or from seawater that percolated into the volcano and was released as steam. Such water would not be rich in NaCl. In that case, Cl observed by Vernier et al. (2023) may have been bound up in minerals of the volcanic ash. Other halogen species, such as bromine and iodine, are often observed after volcanic eruptions (large amounts of BrO were observed after HTHH in the troposphere; Li et al., 2023). However, they can lead to much stronger ozone depletion if they persist in the stratosphere. As the elevated Cl in the model can explain the O3 depletion well, the impact of bromine and iodine on stratospheric O3 is minimal for this eruption.
In addition, NOx can be produced by lighting inside or around the volcanic plume. Observations show that there was a record number of lightning events in this volcanic plume. Almost 400 000 flashes were observed by the Global Lightning Detection Network (GLD360) network over the 6 h of the most active eruption period (∼ 590 000 total flashes were observed) (Global Volcanism Program, 2022). Considering that tropospheric global models use a lightning source of 5 Tg(N) yr−1 and an average flash the Optical Transient Detector and Lightning Imaging Sensor (OTD/LIS) satellite sensors produced an average global flash rate of 44±5 flashes per second, an injection of ∼ 0.001–0.003 Tg N (0.002–0.006 Tg NO) would be expected for the HTHH eruption. We conducted a model run with H2O, SO2, and an injection of 0.003 Tg NO (the H2O_SO2_NO case), showing that this additional NO has little impact on the O3 loss and ClO levels during the first 10 d (Fig. A6). Compared with the H2O_SO2 case, the simulated O3 loss in the H2O_SO2_NO case increased by ∼ 5×10⁵ molecules cm−3 s−1; however, at the same time, the O3 production rate increased by ∼ 5×10⁵ molecules cm−3 s−1. The NO+HO2 reaction rate in the H2O_SO2_NO case increased by 5 times compared with the H2O_SO2 case. Therefore, lighting NOx probably does not contribute to the HTHH initial in-plume O3 loss. Because of the high water vapor concentration, NO would convert to HNO3 in the first couple of days. Unfortunately, we lack observations of HNO3, NO, or NO2 right after the eruption. The MLS observations in February (Fig. A7) and the model simulations with H2O injection or H2O+NO injections show elevated HNO3 compared with the background.
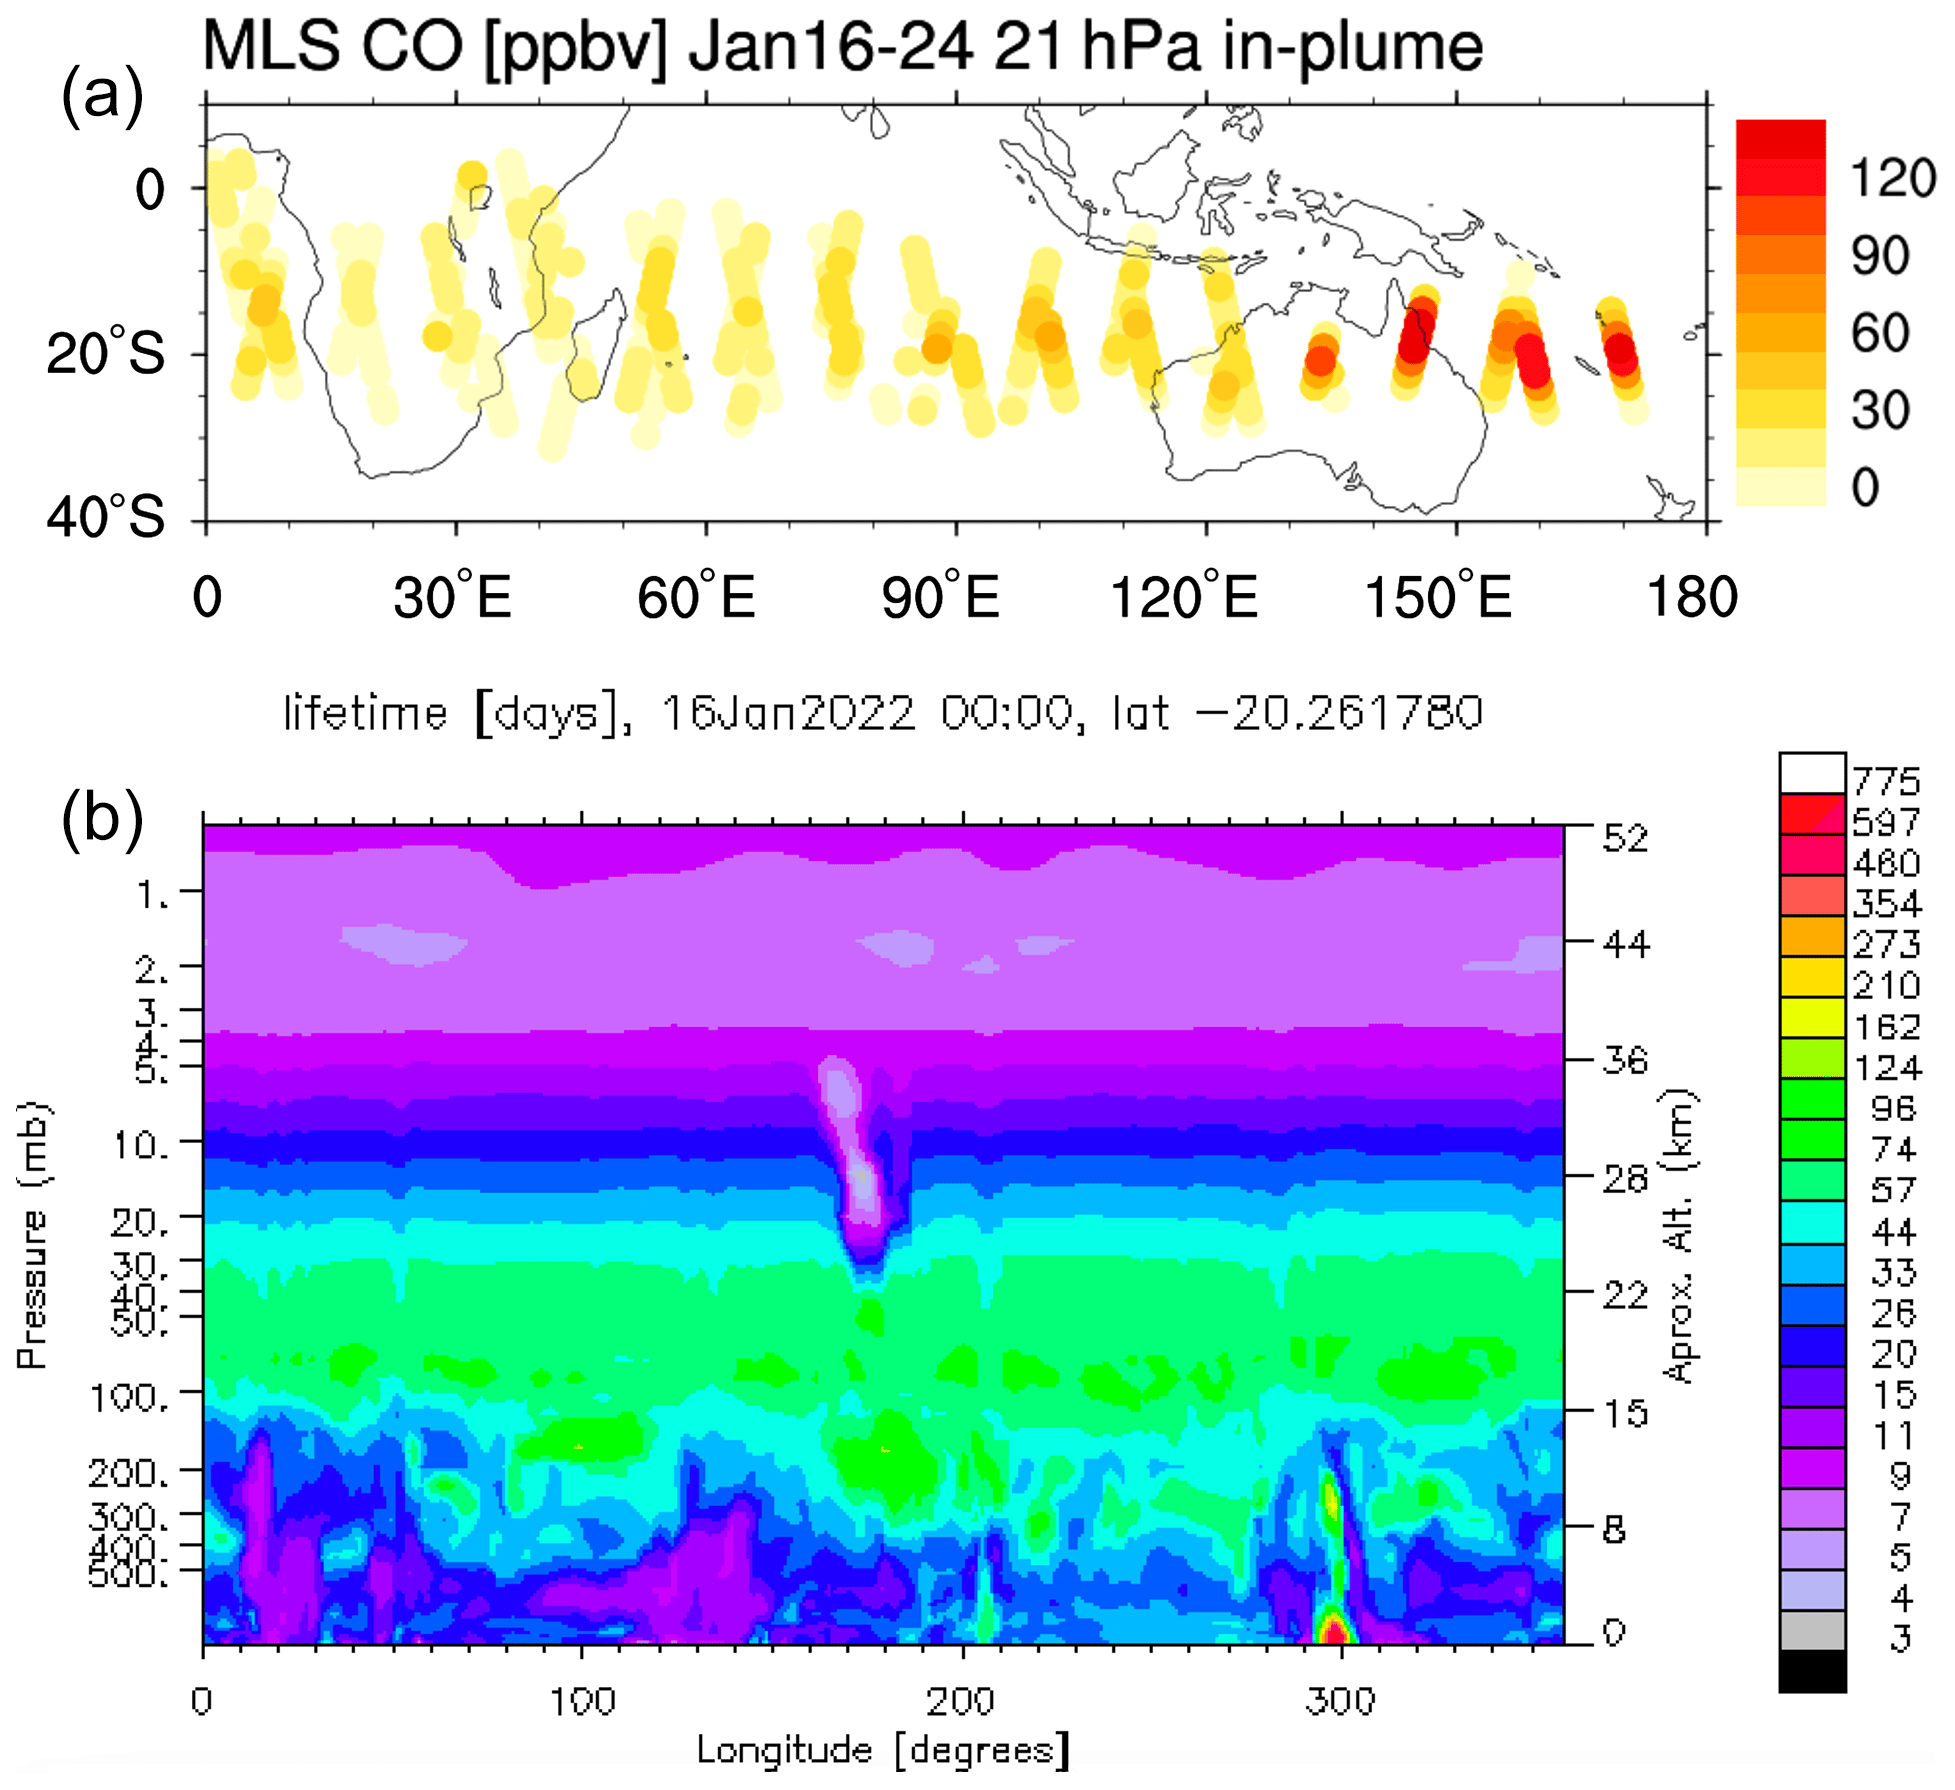
Figure A1Panel (a) shows the MLS in-plume CO observation during the first 10 d after the eruption. Panel (b) shows that the CO lifetime on 16 January at 20∘ S is shortened from a month to a few days because of the volcanic water plume. The observed CO mixing ratios of around 120 ppmv seem incompatible with typical CO levels over oceanic regions, indicating the production of CO within the magma chamber or in the hot plume itself.
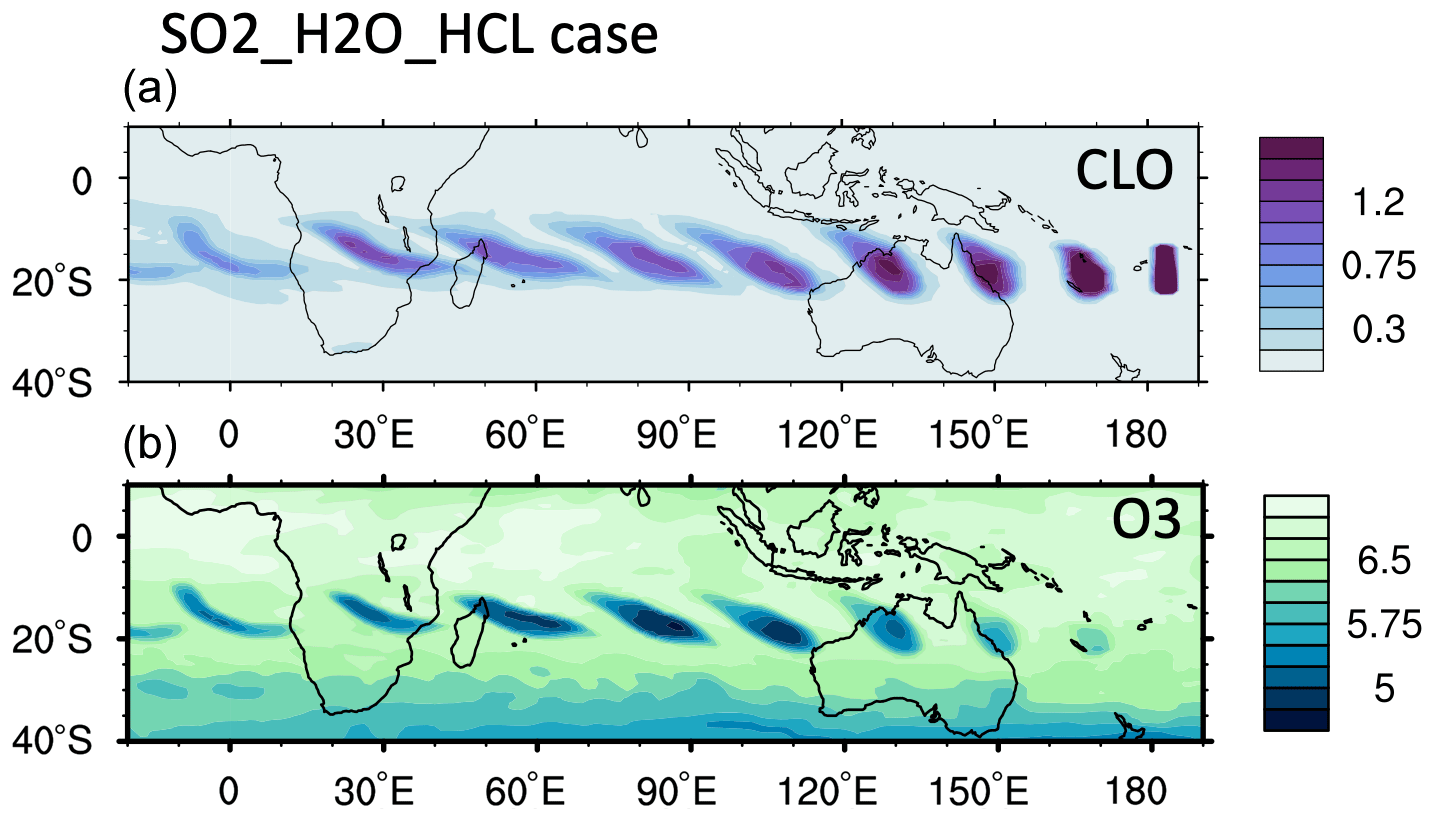
Figure A2The (a) ClO and (b) O3 evolution from the model case with an HCl injection of 0.000092 Tg (equivalent to 0.00013 Tg of ClO injection).
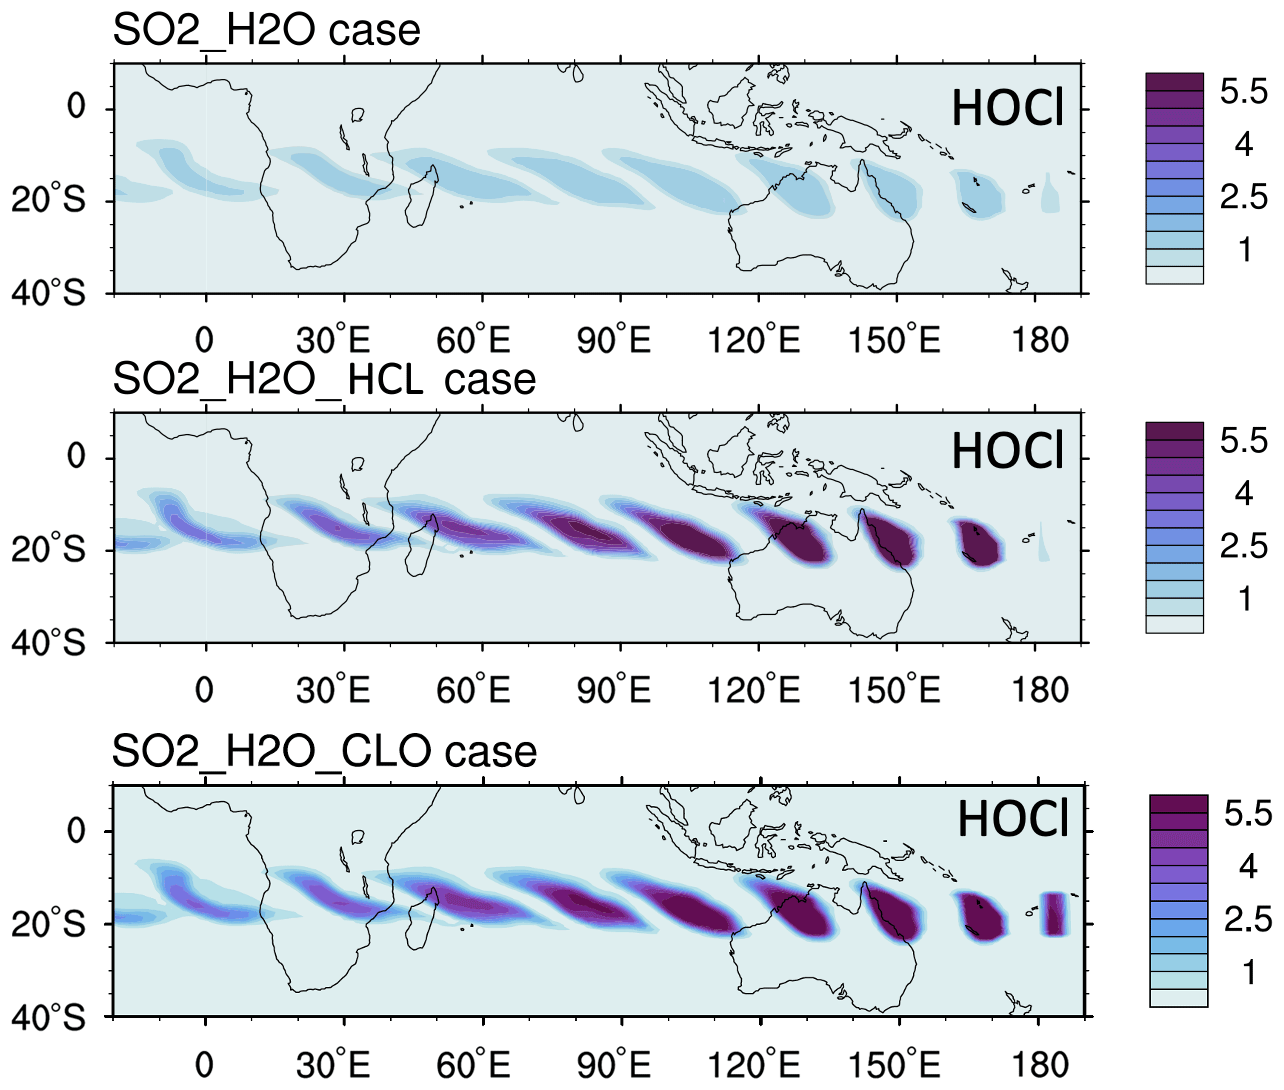
Figure A3The HOCl evolution from the three model cases.
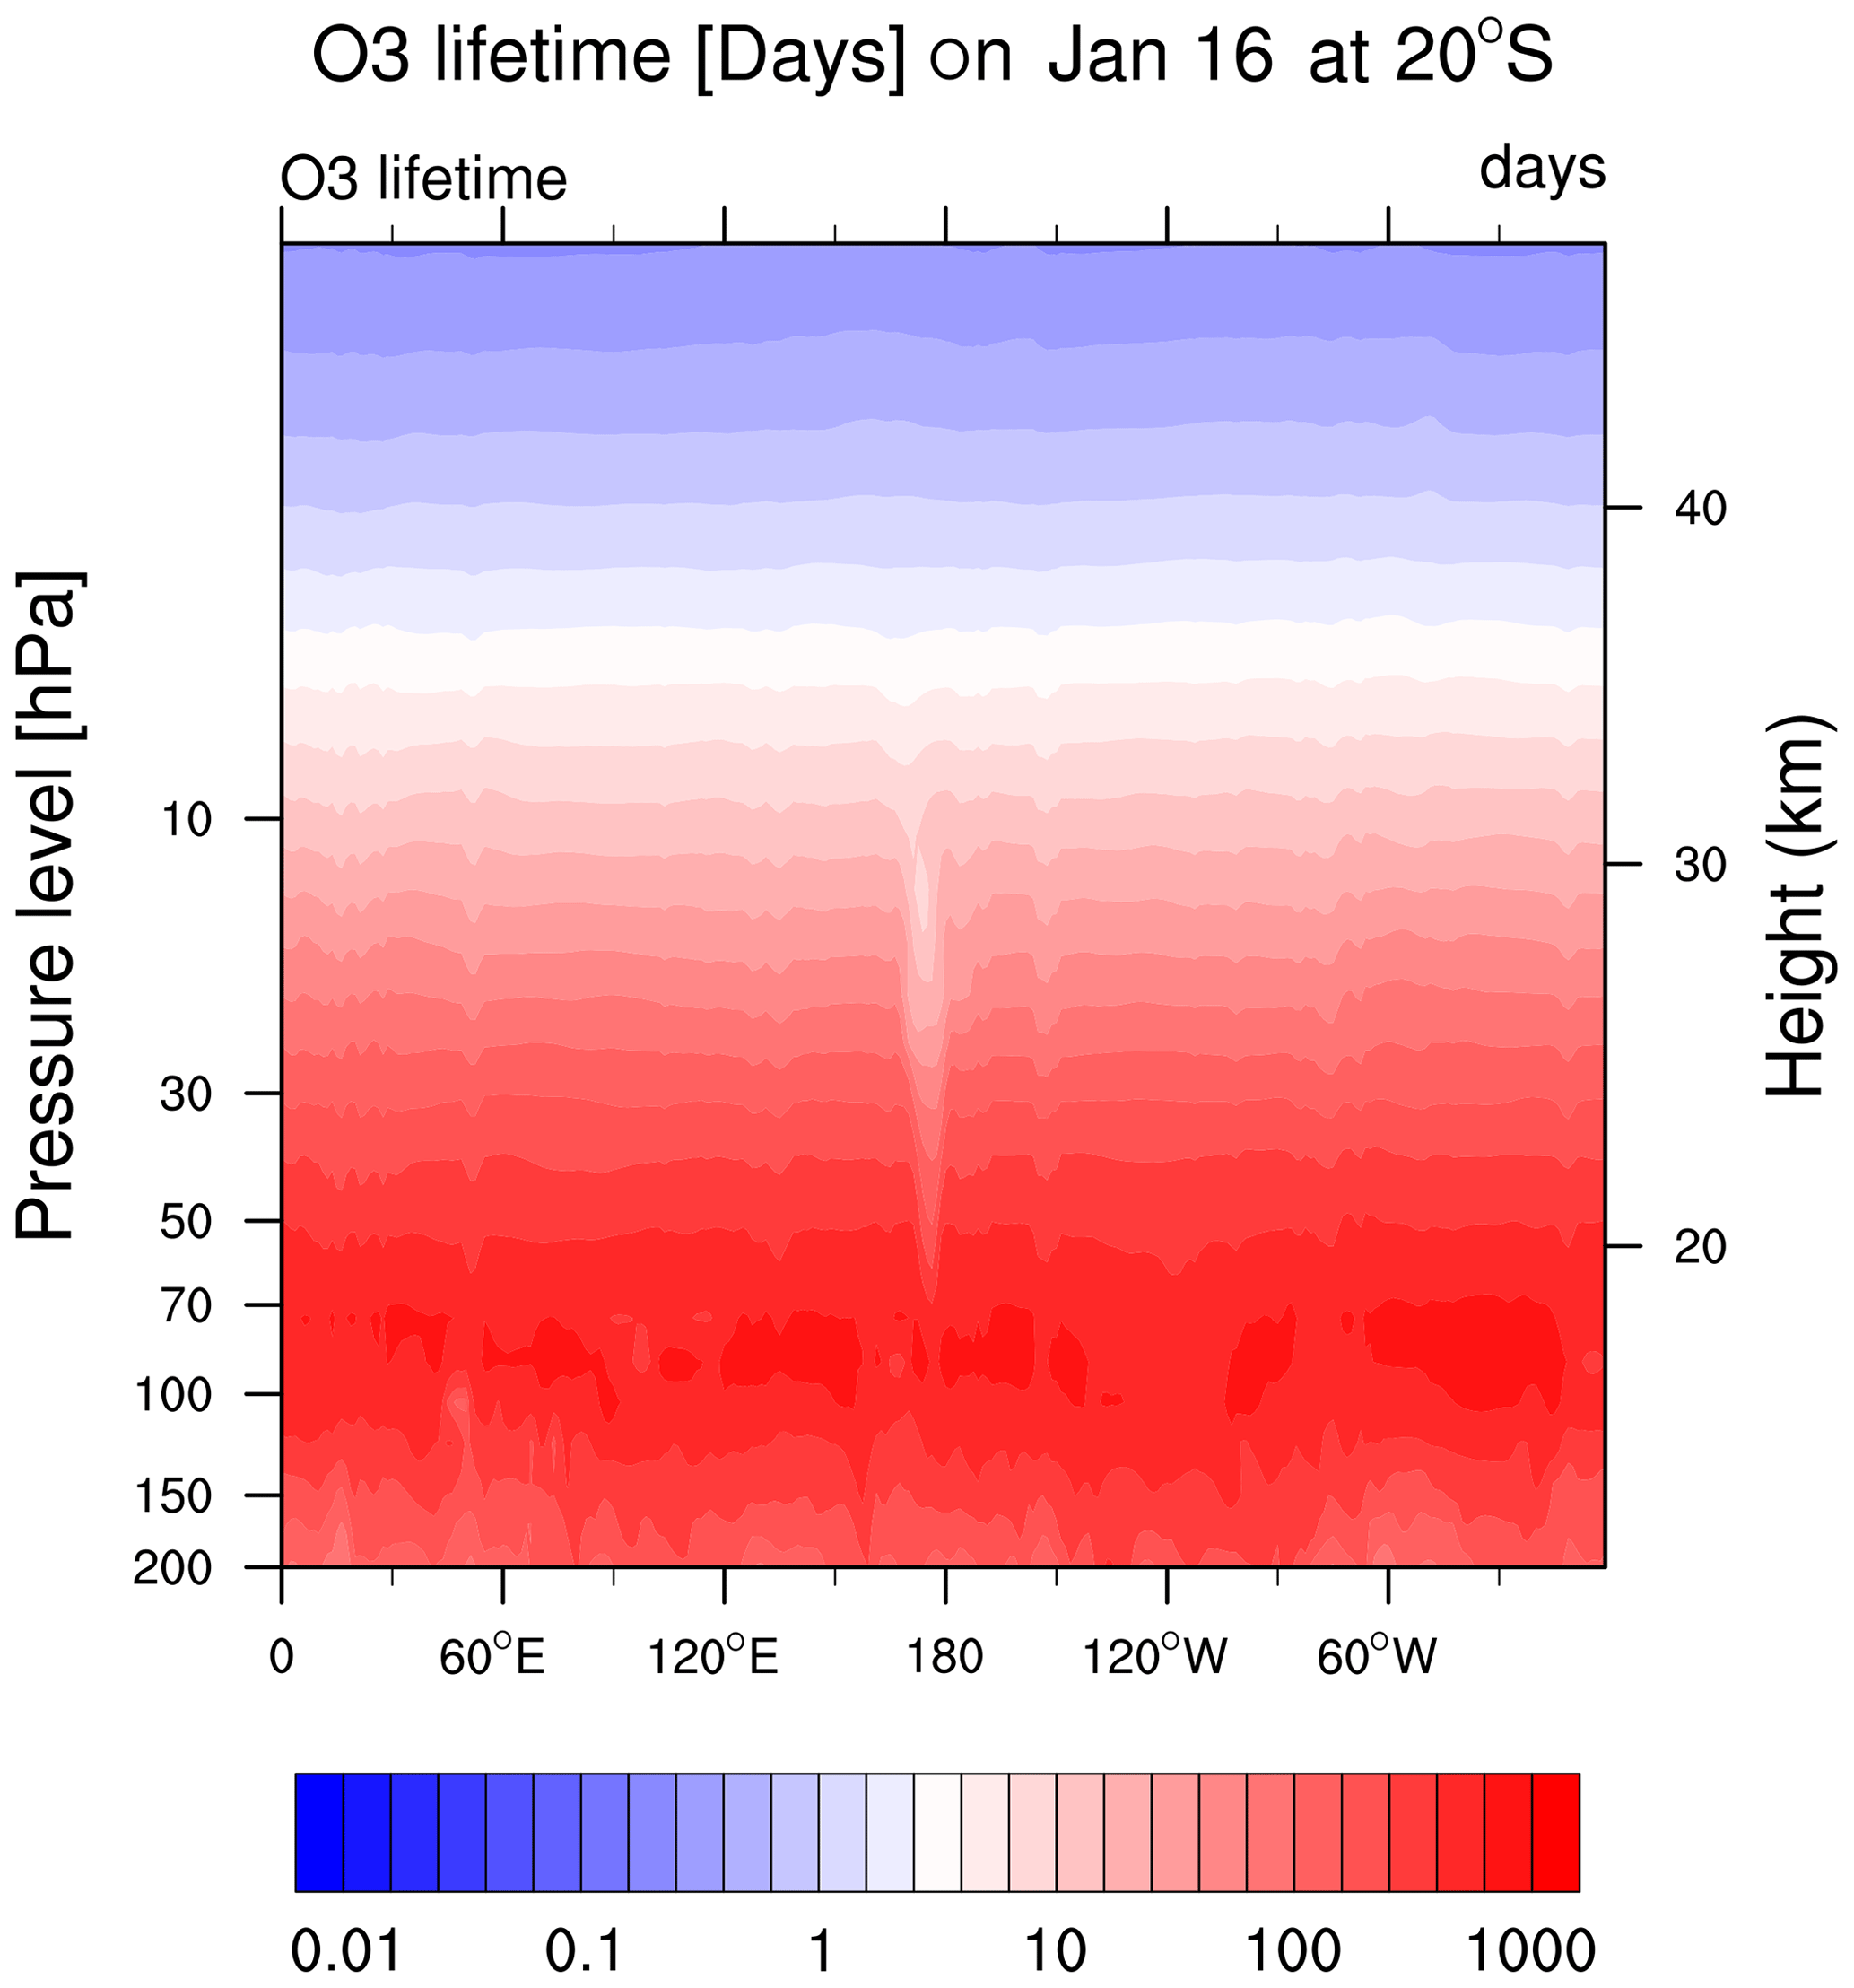
Figure A4The O3 chemical lifetime is about 1–2 months at 20 hPa and is reduced to 10 d at the HTHH location.
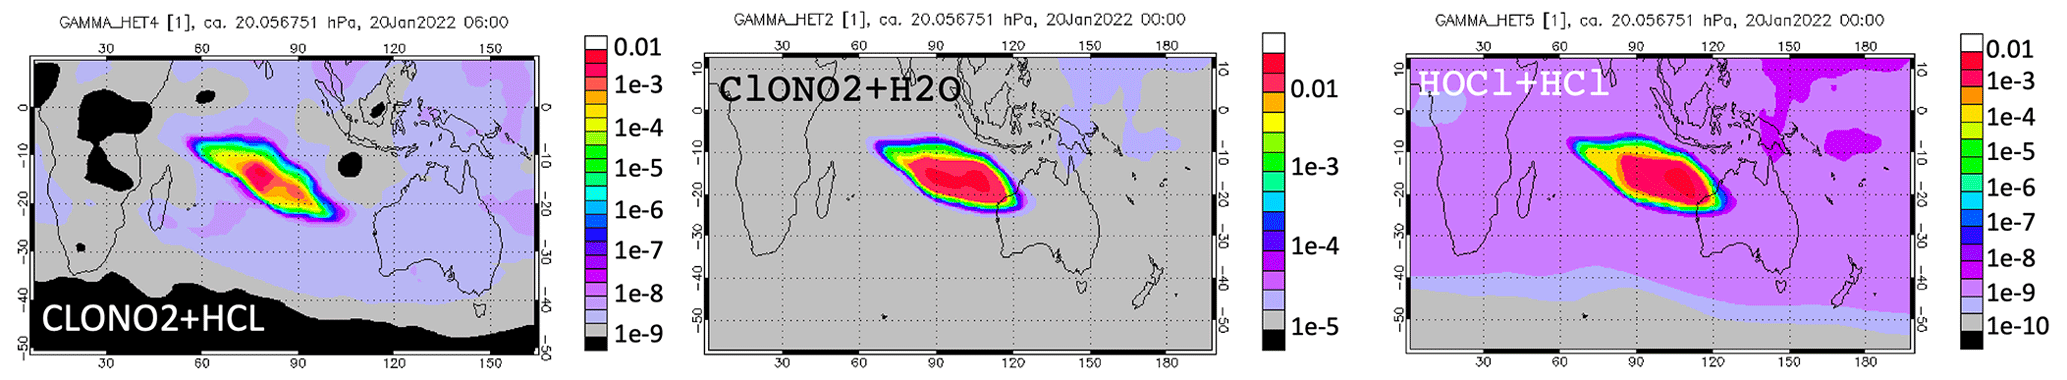
Figure A5Heterogeneous reaction probabilities for the three heterogeneous reactions on 20 January at 20 hPa.
Figure A6The (a) ClO and (b) O3 evolution from the model case with an NO injection of 0.003 Tg, which is identical to the SO2_H2O case. The ClO and O3 enhancements are due to the H2O injection.
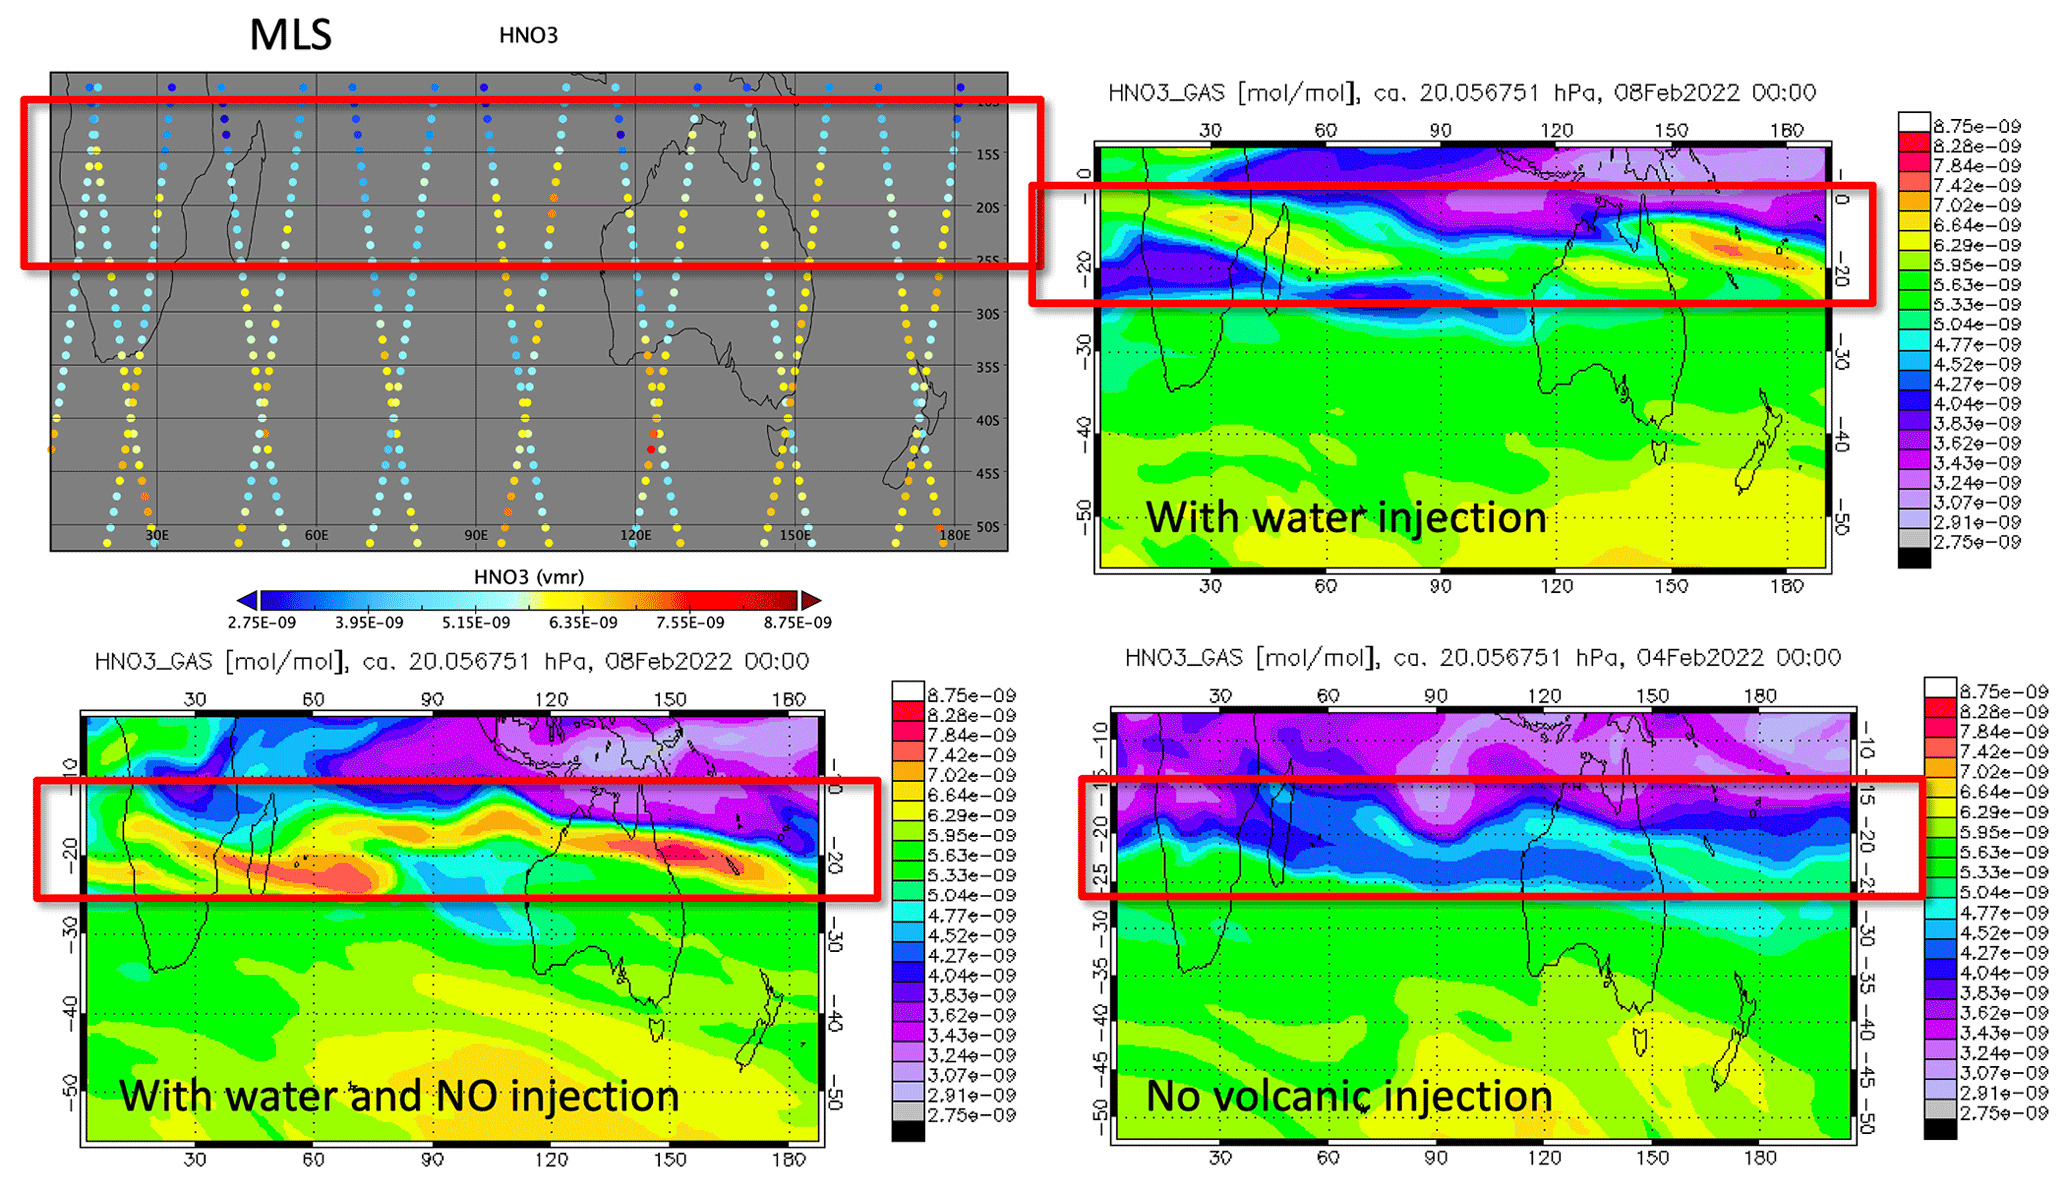
Figure A7HNO3 observed by the MLS on 8 February 2022 compared to the model simulation with water and NO injection as well as the no volcanic injection case. The MLS shows similar elevated HNO3 to the simulation case with H2O injection or with H2O NO injection.
The Community Earth System Model 2 (CESM2) is available on the CESM trunk to any registered user: https://www.cesm.ucar.edu/models/cesm2/download (NCAR, 2023).
The main simulation data generated during this study are available at https://doi.org/10.17605/OSF.IO/F69NS (Zhu, 2023). Aura MLS v4 data are available at https://doi.org/10.5067/Aura/MLS/DATA2009 (Lambert et al., 2015). Water vapor radiosonde data are available at https://doi.org/10.5065/p328-z959 (Vömel et al., 2022b).
YZ, RWP, DK, and KHR designed the experiments. YZ performed the simulations and prepared the manuscript with contributions from all co-authors. DK examined the sensitivity of the stratospheric H2O abundance to the reaction probability (Fig. 5). LM, HV, and SE provided observational data and analysis. RWP, DK, OBT, JZ, ST, CGB, XW, WJR, and KHR participated in the modeling data analysis.
At least one of the (co-)authors is a member of the editorial board of Atmospheric Chemistry and Physics. The peer-review process was guided by an independent editor, and the authors also have no other competing interests to declare.
Publisher’s note: Copernicus Publications remains neutral with regard to jurisdictional claims made in the text, published maps, institutional affiliations, or any other geographical representation in this paper. While Copernicus Publications makes every effort to include appropriate place names, the final responsibility lies with the authors.
We thank Hazel Vernier, Kimberlee Dube, Pengfei Yu, Fracis Vitt, Ru-shan Gao, Margaret Tolbert, Micheal Mills, Daniel Murphy, and Brian Ridley for their valuable input. NCAR's Community Earth System Model project is supported primarily by the National Science Foundation (NSF). This material is based upon work supported by the National Center for Atmospheric Research, which is a major facility sponsored by the NSF under Cooperative Agreement No. 1852977. Computing and data storage resources, including the Cheyenne supercomputer (https://doi.org/10.5065/D6RX99HX), were provided by the Computational and Information Systems Laboratory (CISL) at NCAR.
This research has been supported by the National Oceanic and Atmospheric Administration (grant nos. 03-01-07-001, NA17OAR4320101, and NA22OAR4320151) and the National Aeronautics and Space Administration (grant no. 80NM0018D0004).
This paper was edited by Holger Tost and reviewed by two anonymous referees.
Anderson, J. G., Wilmouth, D. M., Smith, J. B., and Sayres D. S.: UV Dosage Levels in Summer: Increased Risk of Ozone Loss from Convectively Injected Water Vapor, Science, 337, 835–839, https://doi.org/10.1126/science.1222978, 2012.
Asher, E. C., Todt, M. A., Rosenlof, K., Thornberry, T., Gao, R.-S., Taha, G., Walter, P., Alvarez, S.L., Flynn, J., Davis S. M., Evan, S., Brioude, J., Metzger, J.-M., Hurst, D. F., Hall, E., and Xiong, K.: Unexpectedly rapid aerosol formation in the Hunga Tonga plume, P. Natl. Acad. Sci. USA, 120, https://doi.org/10.1073/pnas.2219547120, 2023.
De Haan, D. O. and Finlayson-Pitts, B. J.: Knudsen cell studies of the reaction of gaseous nitric acid with synthetic sea salt at 298 K, J. Phys. Chem. A, 101, 9993–9999, https://doi.org/10.1021/jp972450s, 1997.
Evan, S., Brioude, J., Rosenlof, K. H., Gao, R.-S., Portmann, R. W., Zhu, Y., Volkamer, R., Lee, C. F., Metzger, J.-M., Lamy, K., Walter, P., Alvarez, S. L., Flynn, J. H., Asher, E., Todt, M., Davis, 70 S. M., Thornberry, T., Vömel, H., Wienhold, F. G., Stauffer, R. M., Millán, L., Santee, M. L., Froidevaux, L., and Read, W. G.: Rapid ozone depletion after humidification of the stratosphere by the Hunga Tonga Eruption, Science, 382, eadg2551 https://doi.org/10.1126/science.adg2551, 2023.
Global Volcanism Program: Report on Hunga Tonga-Hunga Ha'apai (Tonga), in: Weekly Volcanic Activity Report, edited by: Sennert, S. K., 12–18 January 2022, Smithsonian Institution and US Geological Survey, https://volcano.si.edu/showreport.cfm?wvar=GVP.WVAR20220112-243040 (last access: 18 October 2023), 2022.
Guimbaud, C., Arens, F., Gutzwiller, L., Gäggeler, H. W., and Ammann, M.: Uptake of HNO3 to deliquescent sea-salt particles: a study using the short-lived radioactive isotope tracer 13N, Atmos. Chem. Phys., 2, 249–257, https://doi.org/10.5194/acp-2-249-2002, 2002.
Hofmann, D. J. and Oltmans, S. J.: Anomalous Antarctic ozone during 1992: Evidence for Pinatubo volcanic aerosol effects, J. Geophys. Res.-Atmos., 98, 18555–18561, https://doi.org/10.1029/93JD02092, 1993.
Khaykin, S., Podglajen, A., Ploeger, F., Grooß, J.-U., Tence, F., Bekki, S., Khlopenkov, K., Bedka, K., Rieger, L., Baron, A., Godin-Beekmann, S., Legras, B., Sellitto, P., Sakai, T., Barnes, J., Uchino, O., Morino, I., Nagai, T., Wing, R., Baumgarten, G., Gerding, M., Duflot, V., Payen, G., Jumelet, J., Querel, R., Liley, B., Bourassa, A., Clouser, B., Feofilov, A., Hauchecorne, A., and Ravetta, F.: Global perturbation of stratospheric water and aerosol burden by Hunga eruption, Commun. Earth Environ., 3, 316, https://doi.org/10.1038/s43247-022-00652-x, 2022.
Kinnison, D. E., Grant, K. E., Connell, P. S., Rotman, D. A., and Wuebbles D. J.: The chemical and radiative effects of the Mount Pinatubo eruption, J. Geophys. Res.-Atmos., 99, 25705–25731, https://doi.org/10.1029/94JD02318, 1994.
Lambert, A., Read, W., and Livesey, N.: MLS/Aura Level 2 Water Vapor (H2O) Mixing Ratio V004, Greenbelt, MD, USA, Goddard Earth Sciences Data and Information Services Center (GES DISC) [data set], https://doi.org/10.5067/Aura/MLS/DATA2009, 2015.
Li, Q., Qian, Y., Luo, Y., Cao, L., Zhou, H., Yang, T., Si, F., and Liu, W.: Diffusion Height and Order of Sulfur Dioxide and Bromine Monoxide Plumes from the Hunga Tonga–Hunga Ha'apai Volcanic Eruption, Remote Sensing, 15, 1534, https://doi.org/10.3390/rs15061534, 2023.
Livesey, N., Read, W., Wagner, P., Froidevaux, L., Santee, M., Schwartz, M., Lambert, A., Millán Valle, L., Pumphrey, H., and Manney, G.: Earth Observing System (EOS) Aura Microwave Limb Sounder (MLS) Version 5.0 × Level 2 and 3 data quality and description document, JPL D-105336 Rev, https://mls.jpl.nasa.gov/data/v5-0_data_quality_document.pdf (last access: 18 October 2023), 2022.
Millán, L., Santee, M. L., Lambert, A., Livesey, N. J., Werner, F., Schwartz, M. J., Pumphrey, H. C., Manney, G. L., Wang, Y., Su, H., Wu, L., Read, W. G., and Froidevaux, L.: The Hunga Tonga-Hunga Ha'apai Hydration of the Stratosphere, Geophys. Res. Lett., 49, e2022GL099381, https://doi.org/10.1029/2022GL099381, 2022.
Murphy, D. M., Froyd, K. D., Bian, H., Brock, C. A., Dibb, J. E., DiGangi, J. P., Diskin, G., Dollner, M., Kupc, A., Scheuer, E. M., Schill, G. P., Weinzierl, B., Williamson, C. J., and Yu, P.: The distribution of sea-salt aerosol in the global troposphere, Atmos. Chem. Phys., 19, 4093–4104, https://doi.org/10.5194/acp-19-4093-2019, 2019.
NCAR: Community Earth System Model 2 (CESM2), https://www.cesm.ucar.edu/models/cesm2/download, last access: 18 October 2023.
Portmann, R. W., Solomon, S., Garcia, R. R., Thomason, L. W., Poole, L. R., and McCormick, M. P.: Role of aerosol variations in anthropogenic ozone depletion in the polar regions, J. Geophys. Res.-Atmos., 101, 22991–23006, https://doi.org/10.1029/96JD02608, 1996.
Randel, W. J., Johnston, B. R., Braun, J. J., Sokolovskiy, S., Vömel, H., Podglajen, A., and Legras, B.: Stratospheric Water Vapor from the Hunga Tonga–Hunga Ha'apai Volcanic Eruption Deduced from COSMIC-2 Radio Occultation, Remote Sensing, 15, 2167, https://doi.org/10.3390/rs15082167, 2023.
Rienecker, M. M., Suarez, M., Todling, R., Bacmeister, J., Takacs, L., Liu, H.-C., Gu, W., Sienkiewicz, M., Koster, R., and Gelaro, R.: The GEOS-5 Data Assimilation System-Documentation of Versions 5.0. 1, 5.1.0, and 5.2.0, https://ntrs.nasa.gov/api/citations/20120011955/downloads/20120011955.pdf (last access: 18 October 2023), 2008.
Shi, Q., Jayne, J. T., Kolb, C. E., Worsnop, D. R., and Davidovits, P.: Kinetic model for reaction of ClONO2 with H2O and HCl and HOCl with HCl in sulfuric acid solutions, J. Geophys. Res.-Atmos., 106, 24259–24274, https://doi.org/10.1029/2000JD000181, 2001.
Solomon, S., Borrmann, S., Garcia, R. R., Portmann, R., Thomason, L., Poole, L. R., Winker, D., and McCormick, M. P.: Heterogeneous chlorine chemistry in the tropopause region, J. Geophys. Res.-Atmos., 102, 21411–21429, https://doi.org/10.1029/97JD01525, 1997.
Solomon, S., Ivy, D. J., Kinnison, D., Mills, M. J., Neely, R. R., and Schmidt, A.: Emergence of healing in the Antarctic ozone layer, Science, 353, 269–274, https://doi.org/10.1126/science.aae0061, 2016.
Tabazadeh, A. and Turco, R. P.: Stratospheric Chlorine Injection by Volcanic Eruptions: HCl Scavenging and Implications for Ozone, Science, 260, 1082–1086, https://doi.org/10.1126/science.260.5111.1082, 1993.
Tie, X. and Brasseur, G.: The response of stratospheric ozone to volcanic eruptions: Sensitivity to atmospheric chlorine loading, Geophys. Res. Lett., 22, 3035–3038, https://doi.org/10.1029/95GL03057, 1995.
Vernier, H., Quintão, D., Biazon, B., Landulfo, E., Souza, G., J. S. Lopes, F., Rastogi, N., Meena, R., Liu, H., Fadnavis, S., Mau, J., K. Pandit, A., Berthet, G., and Vernier, J.-P.: Understanding the impact of Hunga-Tonga undersea eruption on the stratospheric aerosol population using Balloon measurements, Satellite data, and model simulations, EGU General Assembly 2023, Vienna, Austria, 24–28 Apr 2023, EGU23-6882, https://doi.org/10.5194/egusphere-egu23-6882, 2023.
Vömel, H., Evan, S., and Tully, M.: Water vapor injection into the stratosphere by Hunga Tonga-Hunga Ha'apai, Science, 377, 1444–1447, https://doi.org/10.1126/science.abq2299, 2022a.
Vömel, H., Evan, S., and Tully, M.: Hunga Tonga-Hunga Ha'apai stratospheric water vapor from Vaisala RS41 radiosondes, Version 1.0, UCAR/NCAR – GDEX [data set], https://doi.org/10.5065/p328-z959, 2022b.
Wang, X., Randel, W., Zhu, Y., Tilmes, S., Starr, J., Yu, W., Garcia, R., Toon, B., Park, M., and Kinnison, D.: Stratospheric climate anomalies and ozone loss caused by the Hunga Tonga volcanic eruption, ESS Open Archive, https://doi.org/10.1002/essoar.10512922.1, 2022.
Yu, P., Toon, O. B., Bardeen, C. G., Zhu, Y., Rosenlof, K. H., Portmann, R. W., Thornberry, T. D., Gao, R.-S., Davis, S. M., Wolf, E. T., de Gouw, J., Peterson, D. A., Fromm, M. D., and Robock, A.: Black carbon lofts wildfire smoke high into the stratosphere to form a persistent plume, Science, 365, 587–590, https://doi.org/10.1126/science.aax1748, 2019.
Zhu, Y.: Tonga initial chemistry, Open Science Framework [data set], https://doi.org/10.17605/OSF.IO/F69NS, 2023.
Zhu, Y., Bardeen, C. G., Tilmes, S., Mills, M. J., Wang, X., Harvey, V. L., Taha, G., Kinnison, D., Portmann, R. W., Yu, P., Rosenlof, K. H., Avery, M., Kloss, C., Li, C., Glanville, A. S., Millán, L., Deshler, T., Krotkov, N., and Toon, O. B.: Perturbations in stratospheric aerosol evolution due to the water-rich plume of the 2022 Hunga-Tonga eruption, Commun. Earth Environ., 3, 248, https://doi.org/10.1038/s43247-022-00580-w, 2022.